simulating societies in isobenefit cities
TRANSCRIPT

Munich Personal RePEc Archive
Simulating future societies in Isobenefit
Cities: social isobenefit scenarios
D’Acci, Luca
9 August 2013
Online at https://mpra.ub.uni-muenchen.de/48994/
MPRA Paper No. 48994, posted 10 Aug 2013 07:55 UTC

Luca D’Acci - 9 August 2013 - Simulating future societies in Isobenefit Cities
1
Simulating future societies in Isobenefit Cities:
social isobenefit scenarios
Luca D’Acci
Abstract
Environment, history and chance, shape people and cultures, which shape cities, which shape people and cultures, and so on, in a Systemic Retroactive Game. The quintessential essence of Isotropic (or Isobenefit) Urbanism is to solve Systemic Retroactive Game problems downstream rather than upstream and, also, to give a beautiful city to everyone, rather than just to the richer. Spatial Equilibrium assumptions, Underground Hedonic Theory and Isobenefit Lines, are shortly reminded in order to have a better vision of the Isotropic approach. The Isotropic City is the habitat of a virtual future society that aspires to live in a city where each individual can enjoy an equal level of wellbeing and advantage from the urban quality, services and job location. It is shown by a few visionary examples of virtual future societies habitats such as the Ring City (a city without the ‘city centre’, where the ‘city centre’ is all around the peripherical ring, or in a serial of rings), the Homogeneous City (a city where the ‘city centre’ is everywhere), the Annulus City (a city without any geometrical centre in the city) and the Punctiform City (an interconnected net of urban hyperdense ‘points’ throughout nature, parks and lands). Finally I will show some simulations on more realistic cases which could be of interest as support to urban and public policies in respect to a social well-being point of view as well as to urban theory such as urban economy (i.e., by the relation between an Isobenefit scenario and Property value), urban morphology (influence of different urban forms), urban sociology (how different location of centralities and amenities give advantage for social life and wellbeing of citizens). Keywords
Spatial Equilibrium, Urban Quality of Life, Urban Amenities and Centralities, Ideal City, Systemic Retroactive Game, Psycho-Economical Distance. 1. Introduction Classical urban economics theory is based upon a Central Business District (CBD) in which urban amenities and land values fall with distance from the CBD. The aim of this paper is to demonstrate that multicentre cities would produce a richer spatial distribution of amenities and therefore a higher and especially more equal quality of life. As this aim will be achieved by proposing a set of cities extensively planned from the top-down, being apparently against the current bottom-up vision, the paper will be opened by a section explaining how top-down and bottom-up should be mixed. In the same way another introductive section explains the spatial equilibrium meaning on which the concept of isotropic urban theory turns. In the 20s the system theory approach was dominant and suggested, during all the 50s, that systems were regarded as being centrally ordered, as a hierarchical sum of subsystems dominated by negative feedback, which implied a predominant controlled equilibrium status. Examples of these systems were also cities and regions. But, cities are never in equilibrium, they are constantly changing and dominated by positive feedback, not by negative’s [1]. A standard theory of cities was developed until the middle of the 20th century as an economic and transportation model based mostly on the monocentric city. Ideas and models were built on statistical aggregations of units, as for example models based on macro economics (econometric models, population models, Keynesian models).

Luca D’Acci - 9 August 2013 - Simulating future societies in Isobenefit Cities
2
In the 1970s the idea changed: city was observed as controlled by positive feedback and not anymore from the top-down but from the bottom-up. A single agent may be able to reconfigure a complex system (systems that have the potential to reconfigure themselves in ways that may be surprising [1]), but the potential still exists for the system to change without us knowing the actions of any particular agent [1]. Models were specified in more detail as, for example, by disaggregating into several types of populations, types of personal habits, etcetera. Fundamental elements themselves are to be represented: the agents. Cities are mirrors of societies which are mirrors of cities. Cultures, religions, politics and moral values, habits, and lifestyles design cities throughout history, and vice versa. Societies and cities – their physical skeletons – are created by the constant game (as cooperative as antagonistic), between private and public interests, personal and aggregate preferences/needs; and private and public interests depend on cultures, religions, politics, etc. We can call Systemic Retroactive game (SyR) this braided causal relations across different scales and feedbacks: individual behaviours generate an emergent phenomenon which becomes ‘independent’ from them even if maintained (and changeable) from them, and whose behaviour influences (top-down feedback) the individual behaviours, which influence it, which influences them, which influence it… It is like if the emergent phenomenon, after emerging, becomes a ‘single agent’, which we can call Autonomous Post-Emergence (APE), inside the retroactive game with the other ‘single agent’ which is the ‘people behaviour’, where ‘people behaviour’ can differ among individuals and depends from the personal interaction with the emergent phenomenon; the sum of each individual behaviour generates the emergent phenomenon itself. Therefore, an APE is intrinsically a Complex System, as emergence from the non-linear interactions among agents who do not imagine (and often they also do not know and do not realize that they made it, and what), but it is also something ‘more’, as, once it emerged, it gets, in a certain way, independent. Examples of complex systems which are also APE(s) are intelligence, life, market-economy, globalization, religions, cities, political-moral-economics systems, and so forth. Citizens behaviours-needs influence urban planning (i.e. dwellers love using bikes and walking rather than wasting money, time, physical and mental health by using cars, therefore the town council decide to plan parks, pedestrian areas and cycle paths rather than transform squares into parking and boulevards in motorways), and citizens actions themselves (private investment, preferences about where to live, where to walk, how to commute, where to open shops, business, etcetera), which, together with the geographical conditions and historical events, are the ingredients shaping cities. In turn, cities, once made, influence citizens, their habits, even their way to see and think, and, again, citizens influence cities, and so on. For instance, the hub of Greek and Roman cultures was the public life, therefore their cities were full of public spaces. In turn their cities, so built, amplified and/or encouraged public life. Or: citizens could not use bikes because cycle paths are missing, and cycle paths could be missing because no one is willing, or pushing, to use bikes, and the less people who use bikes the less they even think they could be used; or, the more they use cars, the more no one feels to use bikes (not just because of cultural habit, but because streets are too dangerous). When these influences are objectively negative (pollutions, stress, daily wasting of time for commuting, crime, low quality of life, segregations, urban sprawl or over density, obesity, etc.) and predictable, why not try to avoid them at their origin rather than wait decades and change them just after having continuously suffered their negative effects rather than before? From this point of view, Agents-Based-Modelling (Bottom-Up/citizens behaviour) offers future scenarios which, depending from the negativity or positivity of them, we (Top-Down/urban planning) can decide to facilitate or to avoid. Reminding the Systemic Retroactive game (SyR) between an APE and its agents, and quoting the Negative Transitory Cycles/Net Positive Development [2] it would be better to anticipate (Top-Down/Planning and Bottom-Up/personal behaviour) the negative consequences of the SyR for directly jumping the Negative Transitory Cycles. Example of Negative Transitory Cycle is the life cycle of many squares and streets, and almost each historical centre in our cities: they were born, often centuries ago, in a pedestrian status (not for forward-looking merit but more simply because there were no cars), then they evolved in expanses of smoke and sheet steel (because of the ‘fault’ of both: individual behaviour – using the car rather than public transport, biking, walking – and planning – encourage the use of cars rather than facilitate biking, walking or improving the efficiency and economy of public transport), then they are now starting to return pedestrian. This re-transition in some case is in a forced way, by planning and laws even with strong opposition from the

Luca D’Acci - 9 August 2013 - Simulating future societies in Isobenefit Cities
3
populations which still want to go, parking and passing through the city centre by car; in some opposite cases it is the population who force planning and laws because they want pedestrian areas; in some other cases there is a mutual influence. In this context, and in this paper, Isobenefit Cities are shown as a utopian futuristic urban and societal plan which aims to jump Negative Transitory Cycles we are observing in most of our cities in part because of the SyR game between planning and citizens individual behaviours. For a discussion about SyR games see [3]. 3. Isobenefit Cities The Isotropic City (or Isobenefit City), is a utopian, visionary habitat (urbs) of a futuristic society (civitas) willing to live in a city where each point can reach with a similar effort job locations, amenities, centralities, and enjoy an equal level of urban pleasantness. Most of the problems (such as traffic, parking, pollution, stress, no pedestrian and green areas, etc.) in our present cities came from commuting needs in order to reach places of work, shops, amenities (recreational, medical, cultural….), and centralities from our habitations. The Isobenefit urbanism approach aims to create cities in which each dweller can do her/his usual main daily activities by walking or at maximum biking. Another main Isobenefit Urbanism aim is to offer a beautiful city not only to the rich, but to everyone. In this direction, we are more and more assisting efforts and investments in peripheries’ requalification and in multi centralization. For a full presentation of the Isobenefit Urbanism principles see [32].
However, many of our cities still show strong non-uniformities in amenities and qualities and, therefore the best areas can usually be dwelled only by the richest and the worst by the poorest (apart from some cases). As a consequence of this, also problems as crime and segregations could be helped. In an Isotropic City, the poor and the rich will enjoy an equal urban quality of the area, services and infrastructures; the only differences will be in the dimension and the furniture of the flats, and in the finishes and accessories of the buildings, which, in order to not create an aggregative effect (positional value), will uniformly be distributed and mixed among themselves: the poor may have less accessories/dimension of the building and the flat, but she/he will enjoy the same area’s quality of the rich. From now on, we will consider uniformly distributed job locations, services and urban quality and we will focus on the Centralities distribution. From the point of view of centralities, imagining a monocetric city (therefore a city with just one centrality), the simplistic concept of Isobenefit Urbanism is the following: as one moves away from the centre, another centrality compensates it. The historical centre, its artistic and historical value, its genius loci can never be replaced by something else, but what we could still try to do is to offer a sort of compensation (as i.e., la Défense in Paris), without meaning substitutions, which will not allow the quality, liveability, palatability decadence of the periphery. 4. City Centralities and Fuzzy Urban Quality As Urban Quality it is shortly proposed and defined two components: Pleasantness given from city Centralities, and from Fuzzy Urban Quality. We will consider a city centrality (Fig. 1) as a part of the city with a certain concentration of amenities such as public cultural assets, libraries, museums, art galleries, public buildings, higher-order commercial and retail functions, notable and memorable historic buildings and spaces, etc. [33, 34]. Apart from a ‘concentration of several attractions’, we will also refer as city centralities, single amenities important at a city level (i.e. Central Park in New York). We define the Pleasantness given from city Centralities (PC) the quality of urban life that citizens receive from centralities, ‘amenities at a city level’. We also define Fuzzy Urban Quality the Pleasantness given from the Background ‘daily local urban quality’ (PB). It derives from the city’s beauties present in the daily lives at local level such as a local little garden or square, the average quality of the streets, a tree in front of the house, and so forth, is a fuzzy, soft urban quality (Fig. 2).

Luca D’Acci - 9 August 2013 - Simulating future societies in Isobenefit Cities
4
Fig. 1. Example of City Centralities in (from the top): Catania, Sydney, London, Turin and Glasgow. Source: author’s photos.
Fig. 2. Example of Fuzzy Urban Quality in Rotterdam (top-left) and Glasgow. Source: author’s photos.
5. Tools on the basis: Underground Hedonic Theory, Isotropic Urbanism On the basis of the following maths and simulations there are: the Underground Hedonic Theory [35] and the Isobenefit Lines [36].

Luca D’Acci - 9 August 2013 - Simulating future societies in Isobenefit Cities
5
5.1. Underground Hedonic Theory
The Underground Hedonic Theory is a formalization of the socio-psychological process involved in the formation of the daily subjective wellbeing. It passes through two concepts: Hedonic Inertia and Underground Happiness. The Hedonic Inertia is the “residual happiness”, the “substratum of feeling” given by our experiences lived in each moment of the day; in fact, one event in our day, can influence our humour throughout the entire day. For example, knowing that in the evening we will have a pleasant activity (or if we have already had it), will give a positive influence on our mood all day long. In the same way, one or two very happy days (i.e. a nice week-end) make us feel happier all week long. The overall subjective wellbeing in a particular moment depends on the pleasantness of the activities done, on their Hedonic Inertia effects and on the Underground Happiness too. The Underground Happiness is due to our general condition such us money, health, love, political-social conditions, etc., and to the underground scenario in which the activities take place (company, aesthetics of the place, etc.).
Fig. 3
For example, in Fig. 3, the subjective wellbeing of the people is connected to the pleasantness they receive from the activity “walking”; the one connected to the underground scenario (in this case a nice park, and the company of the partner); the one connected to the other activities of the day, done or still to do, (hedonic inertia); and the one connected to the global underground situation (career satisfaction, economic situation, health, family…). From an “urban point of view” the Underground Scenario factor plays an important part in the formation of the quality of life of the citizens by influencing their pleasantness of living thanks to the City Centralities and the Fuzzy Urban Quality. The following maths and simulations are shown as means of operationalizing the Isobenefit Urbanism. 5.2. Isobenefit Lines for Isobenefit Urbanism
The Isotropic City is an utopian futuristic habitat of a society willing to live in a city where each point can enjoy an equal level of pleasantness: PC and PB uniformly high. Assuring an equal level of PB throughout the city it can be easily displayed by covering all the city with nice little “things” everywhere: trees along streets, little squares, elegant sidewalks, pleasant general design of lights, bus stops, signals, corners, etcetera. Assuring an equal level of PC can be displayed and simulated by passing throughout the Isobenefit Lines [36]. They are lines joining points with equal level of benefit received (in this case) from urban amenities such as parks, pedestrian streets, nice views, nice shop areas, etc. Under isotropic condition, they can be described by the following simplified equation:
n
i
kiik E
dAB1
1
kikikikikiki BiWCPEEE ; (1)

Luca D’Acci - 9 August 2013 - Simulating future societies in Isobenefit Cities
6
Bk is the benefit of the urban point k due to the attractiveness (A) offered by the attraction i, distant di-k.
kiE reflects the objective status of possibilities that the city offers for moving from i to k, and how the
citizens move throughout the city (if mostly by car, C, or public transport, P, bike, Bi, walking, W); while says how much they are willing to move around (a kind of subjective comfort of moving). In a certain way, 'weighs' the 'variety' advantage to enjoy numerous amenities (Variety Value), rather than the advantage of the proximity of one amenity (Proximity Value). If is major than 1, the model emphasizes the Variety Value; if minus, the Proximity Value. The objective status of movement offered by the city is described by the variables P, C, W and Bi. The parameters ,,, describe how the citizen moves, what method she/he uses and in which relative percentage (each parameter is equal or major to zero, and their sum must be 1). Under a certain distance around iA , just and counts; after a certain distance they will count less and less. These variables are quantified for each urban point k of the urban matrix, in relation to each amenity i, and are all translated into a same scale.
kiP values the Public Transport system between i and k, and it is a weighted sum taking into account factors such as number of lines and their frequency, speed, traffic, cost, objective comfort (number of seating areas, noise, design). kiC values the Car Transport system and it is a weighted sum of variables such as
traffic and costs (oil, parking, car taxes, insurance, etc.). kiW quantifies the facility for the pedestrians and includes the objective condition and availability of sidewalks and the quality of the streets from the pedestrian point of view (noise, aesthetics, pollution, physical obstacles, etcetera). kiBi quantifies the same but from the point of view of biking. Each of these under-variables are weighted by other parameters. Therefore E transforms the Euclidean distance (d) into a Psycho-Economical Distance. When we formulate A and E on the basis of the aggregate statistics and habits and by observing the majority of the citizens – rather than each of them – we talk of Isobenefit Lines. When A and the full set of parameters of E ( ,,,, and the under-parameters of each under-variable forming the variables P, C, W and Bi) are formulated on the basis of personal habits and preferences, we pass from Isobenefit Lines to Personal Isobenefit Lines. Personal preferences can change among people and for a same person in her/his different times (age, mood, personal events and memories). For example, for one person the most important things could be libraries, parks and pedestrian areas, for another, shopping malls and parking, for another, hospitals and public transport, etcetera. In the same way, one person could give more value to aesthetics and silence, another about speed and time, another about the costs, etcetera. In an isobenefit city there will be a uniform distribution of public transport, streets, and attractiveness, and the typology (parks, pedestrian areas, libraries, shops, etc.) and amount of the attractiveness (both Urban Centralities and Urban Fuzzy Quality) will (ideally) meet the preferences of citizens. Therefore Psycho-Economical Distances will ideally tend to match Euclidean distances; that means that we can consider a constant E throughout the city. To quantify the Uniformity of the spatial distribution of the attractions effects (Bk) on the city, we will use the following indicator [37]:
m
kk
m
k
m
kkk
Bmm
Bm
B
U1
1
2
1 1
1
1
(2) U is 1 minus the Coefficient of Variation of Bk of all the m urban points. Therefore it is a number less or equal to 1 (maximum uniform distribution). Its numerical result is not absolute but relative, therefore, with wisdom, could also be used to compare different cities among each other or a same city before and after transformations in its scenario [37]. For more details refer to [38].

Luca D’Acci - 9 August 2013 - Simulating future societies in Isobenefit Cities
7
5.2.1. Isobenefit Lines and Spatial Equilibrium The Isobenefit Lines approach offers lines of equilibrium in terms of the benefit that each point receives from the amenities/disamenities present in the city. Calling the positional value the property value given by extrinsic characteristics (not related to the property itself, but to the urban area in which it is located, that means to its amenities/disamenities), its relationship with the Isobenefit Lines is obvious [37]. Steps among isobenefit lines corresponds to steps among urban amenities, that means steps among positional values, that means (ceteris paribus, namely keeping the intrinsic characteristics constant: a same typology, surface, levels, furniture, etc. of the apartment) steps among property values (Fig. 4).
Fig. 4. Isobenefit lines and spatial equilibrium within cities
6. Simulating some visionary Isotropic Cities: Ring City, Homogeneous City, Annulus City and
Punctiform City We will see some simulations based on equations 1, of hypothetical societies habitats from where we can notice both: evidence following the common sense, and results that could diverge from a first thought guided by common sense. We start with the simulation of a city whose ‘centre’ is in its geometrical centre, then a city having its centralities located in its geometric centre (Fig. 5). In Fig. 5, the top left image shows the position of the centrality in the x, y urban coordinate of the planimetry, and its high (axis z) represent its attractiveness (A). The top right image shows the implementation of equation 2. The two images on the bottom of Fig. 5, show the same with another view: on the left from the top (x, y view), on the right from the front (x, z view). The bottom line in Fig. 5 indicates the coefficients which allow us to numerically read the simulation: U is given by equation 3

Luca D’Acci - 9 August 2013 - Simulating future societies in Isobenefit Cities
8
Fig. 5. One centrality located in the geometrical centre 6.1 The Ring Cities
Now we simulate the extreme opposite: a city without a ‘city centre’, but with a ‘city centre’ all around the peripherical ring. That means with its centrality not in the geometrical centre but all spread around the external ring. We can call it the Ring City. It has several centralities all uniformly spread on the periphery (Fig. 6). It can also be thought of as a constant centrality around the external ring, namely a ring with just amenities. The next simulation shows a society designing its city with two ‘centralities’: one spread in the external ring, and one in an internal ring located in the middle between the periphery and the centre. We can call it the Double Ring City (Fig. 7).
Fig. 6. Ring City

Luca D’Acci - 9 August 2013 - Simulating future societies in Isobenefit Cities
9
Fig. 7. Double Ring City 6.2 The Homogenous City
The next simulation implements equation 2 for a city where the ‘city centre’ is all uniformly spread throughout the entire planimetry. That means a city with centralities uniformly located in order to equally cover all the area (Fig. 8).
Fig. 8. Homogenous City

Luca D’Acci - 9 August 2013 - Simulating future societies in Isobenefit Cities
10
6.3 The Annulus City
A virtual Annulus City (see [32]), will not have any geometrical centre. It is an annulus with around 2 km of width. Its centralities will be regularly located along the annulus, i.e. every 2 km along its circumference, covering all the width. All the ‘central’ part, surrounded by the city, will be used for a continuous urban park (i.e. 0.5 km of width) all around its external ring (namely in the boundary of the internal circle of the Annulus City), and, the part inside this uninterrupted park, will be used for modern systems of agriculture and clean sources of energy (eolic, solar, etc.) that will help aliment the city needs from the underground. Each band between the 2 km from each centrality, will be self-sufficient regarding the ratio between residences, shops, work and recreational places, and, as for all the isotropic cities, with a homogeneous urban fuzzy quality. Therefore, most of the commuting will be by walking or biking. Commuting to get to other bands will occur by public transport via one underground annulus (along the ‘central’ circumference in the middle between the external and the internal circumferences defining the Annulus City, so that maximum 1 km is required to reach it), and, in correspondence to each centrality (that means each 2 km), in radial linear connections to the symmetrical opposite side of the Annulus City, in correspondence to a centrality. The external boundary of the Annulus City will have a continuous park too. After this external park, just wild nature, and linear fast underground connections among Annulus Cities. We call Bands, the parts of the city between one centrality and the next. They are urban Independent Units (Iu) and each Band (Iu) is surrounded by amenities: the centrality on the right side and that on the left, the continuous park along the internal boundary, and the continuous park along the external. Therefore each Iu, approximated to a square of 2 km per 2 km, can be traced back to a Ring City scenario (Fig. 6). The Annulus City can be seen as a sum of Ring Cities continuously located along an annulus geometric figure. Each citizen of this virtual society habitat, will be able to enjoy a city centrality by walking for maximum 1 km. In fact, an Annulus City citizen located in the most distance point from any centrality (namely the geometrical centre of each Iu), will be able to reach four different centralities, by walking around 1 km: the continuous park on the internal circle, that on the external, the centrality on the right – watching the external circle –, and that on the left. 6.4. The Punctiform City
The Punctiform City (see [32]), is an interconnected net of urban hyperdense ‘points’ (Unit Points) throughout nature, parks and lands. A Unit Point is a sum of a few huge, tall, well designed and energetically ecologically (solar-wind) self-sufficient ‘light’ buildings, each of them containing thousands of residences, offices and services. Each of these buildings is so big which is more properly called ‘habitat’ rather than just ‘building’, and they are close to each other within a walking-biking distance. In fact each Unit Point can have at maximum a radial distance of 2 km. Therefore amenities and services, as well as job locations, are necessary homogenous throughout the space because they are vertically distributed inside a circular area of maximum 2km of radius. In addition, those few habitats, representing a Unit Point inside the Punctiform cities, are in the middle of nature and parks, that means homogenously surrounded by a big uniform amenity. Each Unit Point is connected with its neighbours Unit Points just by fast, ecological, automatic, free lines: an underground futuristic fast ‘cab – tapis roulant’ (or, if we like, a ‘cab-roulant’) , and/or transparent, silent, futuristic overhead ropeway. Those connection lines ensure and stimulate trades of physical communication, that means ideas and cultures, that, as history teaches us, may mean progress. The Unit Points are 4-8 km distant from each other. The more and denser Points there are, the greater the Punctiform City is. Each Unit Point is surrounded by continuous parks and pedestrian paths, even if in a Punctiform City there is no sense in talking about ‘pedestrian’ because all is pedestrian as no cars or mechanical horizontal transport is required to move within Unit Points, and in order to move across Unit Points one just needs to use the underground cab-roulant or the ropeway. Outside this continuous ring park there are clean energy sources and lands for agriculture which send their products and receive their tools and workers, by underground cab-roulants. In these futuristic societies, industrial activities (concentrated in points outside the all Punctiform City), are reduced at minimum, as these societies will be mostly based on a services and cultural economy

Luca D’Acci - 9 August 2013 - Simulating future societies in Isobenefit Cities
11
rather than an objects-hyper-consumerism’s. In this way, apart from improving our mental-cultural-wellbeing (that often means also physical thanks to a better knowledge which could probably guide us to healthier daily life styles), we save incalculable land surfaces, we may reduce pollution and we will be able to use in a cleverer way our time, energy and mind. The economy will shift from materialistic type to cultural. Therefore the industrial activity will mostly be connected to research (which, in these utopian futuristic societies, represents the main economy and their cultural and structural referent point), constructions and maintenance of the Punctiform City elements (habitats, energy technology, etc.), agriculture, medicine and the object required in the dwellers lives. Each industrial point is connected underground, by fast lines, with the central (geometrically, bureaucratically, administratively) Unit Point of each Punctiform City (which we call Central Unit Point) under a certain distance. Each Punctiform City is connected with their neighbouring Punctiform Cities by underground connection lines among their Central Unit Points. 7. Simulating Variety and Proximity advantage The reader noticed that U from the Homogenous City (Fig. 8), is lower (even if just a bit) than the U of the Double Ring City (Fig. 7). This is due to the geometrical advantage of the central area of a city whose planimetry has its geometrical centre inside it self, such as a circle, rectangle, square, linear shape, etcetera, apart from, i. e., a city built along an annulus. The central area has the best position to reach every point. It has an advantage of variety. Ring Cities compensate the geometrical advantage of the central area, by positioning the centralities along concentric rings and not in the centre. The coefficient E influences the variety advantage. The higher E the more the equation ‘weighs’ the ‘variety’ advantage to enjoy numerous amenities, rather than the advantage of the proximity of one amenity. I define the first advantage as Variety Value (Vv), the second as Proximity Value (Pv) ([37]. We can amplify the effect of Vv against Pv, and vice versa, by varying E in the simulation.
Fig. 9. One centrality located in the geometrical centre, with E = 10

Luca D’Acci - 9 August 2013 - Simulating future societies in Isobenefit Cities
12
Fig. 10. Ring City, with E = 10.
Fig. 11. Double Ring City, with E = 10.

Luca D’Acci - 9 August 2013 - Simulating future societies in Isobenefit Cities
13
Fig. 12. Homogenous City, with E = 10.
Considering a circular city with a spatial uniform density of residents, the Ring City will pledge a centrality very close (Proximity Value) for around ¾ of citizens, while a city with one centrality, and located in its central part, pledge a high Proximity Value for around ¼ of citizens. Thanks to the simulations, we can now better understand, and visualize, the effect of the Variety Value and the Proximity Value. I.e., when one gives much more importance to Vv, or when the moving throughout the city is excellent, extremely fast1, practically cheap, and fully comfortable, we could refer to the simulations of Fig. 9, 10, 11 and 12 from where we can notice that the Ring City results even with a greater U than the Homogenous City. For this it is important to read all the indicators resulting from the simulations. By using common sense, and reading the other indicators, we can understand that the benefit of the Ring City is more ‘uniform’ not because the state of the most disadvantaged areas are worst than the Homogenous City, but because the geometrical position of the central part is more advantaged when we put more importance to the variety advantage rather than to the proximity one. All the citizens of the Homogenous City are in a better state: even if those living in the geometrical centre are more advantaged, the minimum value of B is higher (Fig. 20). 8. Simulating different allocations for a fixed amount of centralities Till now we added more centralities to each different simulation. Therefore, independently from U, the scenarios get better and better (the minimum value of social benefit is higher and higher) by adding new centralities, independently from where we add them and from how uniformly they are spatially located. Now we will see some simulations by keeping constant the amount of centralities available. This could be thought of as a fixed amount of money available from the city council which allow to create/ ameliorate only a certain amount of urban amenities (nice parks, pedestrian areas, pleasant recreational-shopping areas, elegant squares, etc.). In this new hypothetical situation under ‘amount constriction’ we will see some
1 Extremely fast, but not yet snapshot. In fact, in a future virtual society with teleportation, there will be no questioning and no simulations required to understand the spatial distribution of benefit from centralities because each citizen can reach with the same effort any centrality independently from their locations. However, also in this virtual case, we should still estimate the view value: the advantage to be able to see (and ‘feel’) from your window a nice amenity, as well as consider the question of ‘load capacity’ of centrality in case all the citizens at the same time will decide to use the only centrality available (the ‘only’ because, thanks to teleporting, no other centralities are necessary to be spread throughout the city to make the citizen living, i.e., in the periphery, happy).
Luca D’Acci - 9 August 2013 - Simulating future societies in Isobenefit Cities
14
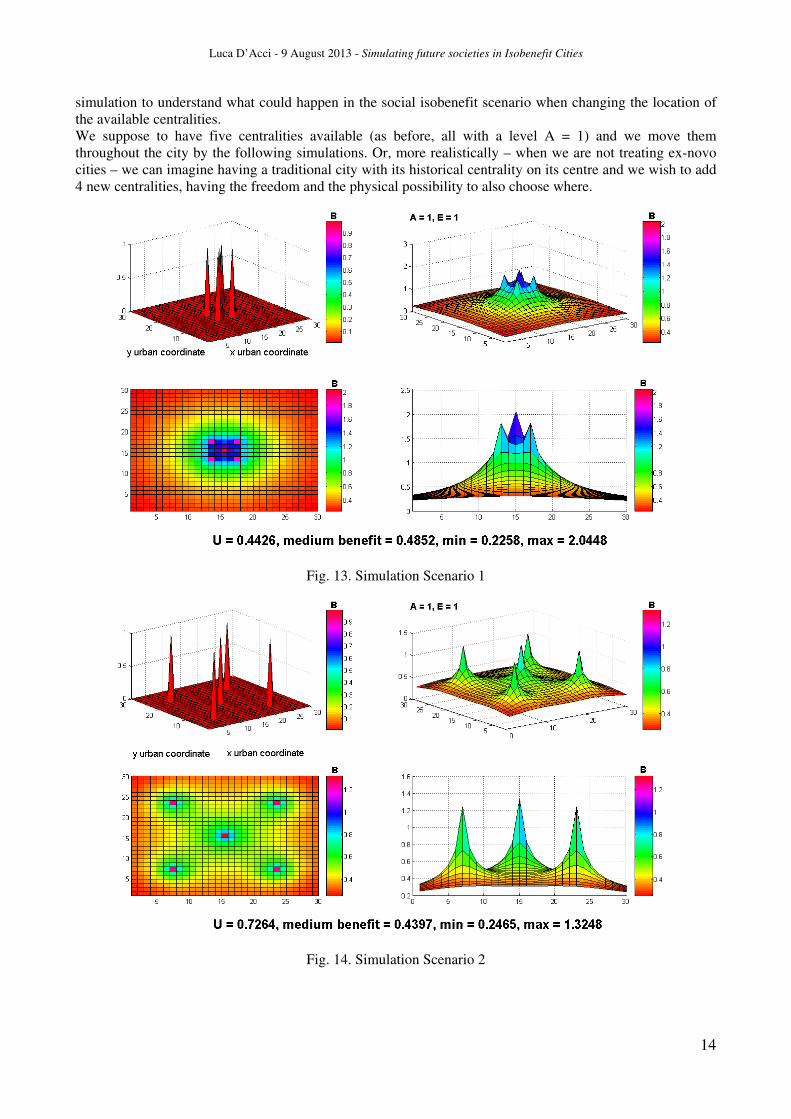
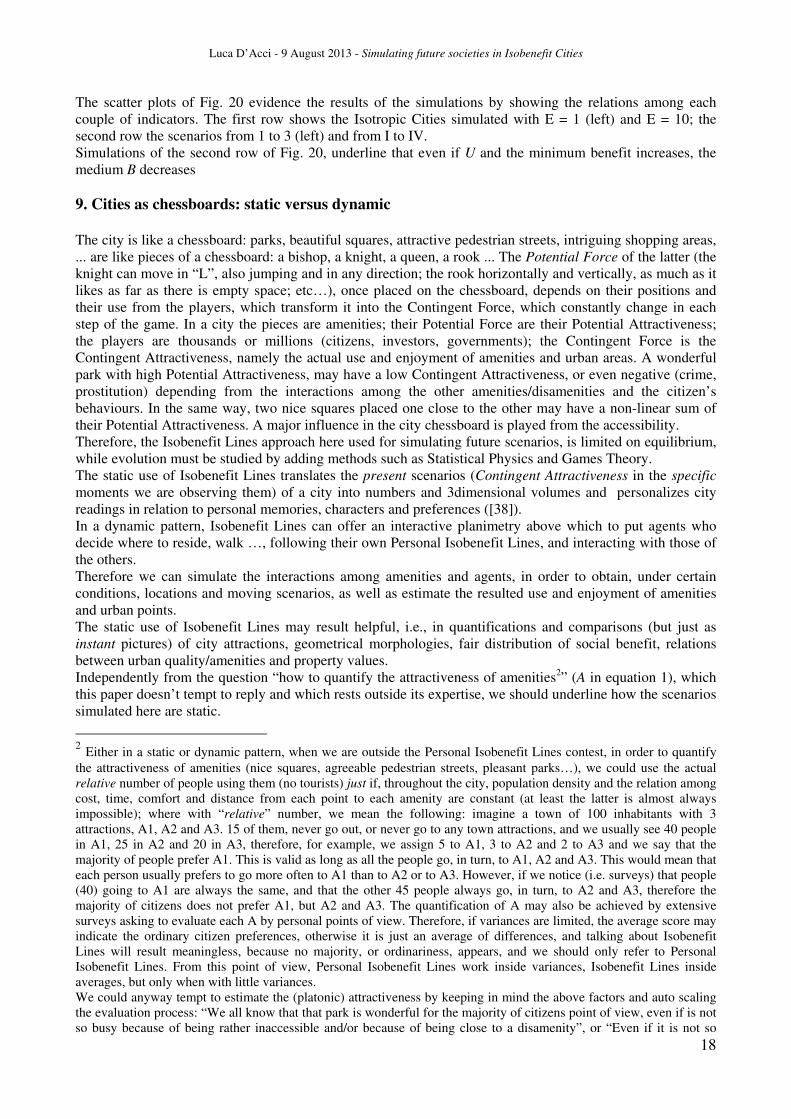
simulation to understand what could happen in the social isobenefit scenario when changing the location of the available centralities. We suppose to have five centralities available (as before, all with a level A = 1) and we move them throughout the city by the following simulations. Or, more realistically – when we are not treating ex-novo cities – we can imagine having a traditional city with its historical centrality on its centre and we wish to add 4 new centralities, having the freedom and the physical possibility to also choose where.
Fig. 13. Simulation Scenario 1
Fig. 14. Simulation Scenario 2

Luca D’Acci - 9 August 2013 - Simulating future societies in Isobenefit Cities
15
Fig. 15. Simulation Scenario 3
Finally we simulate a last hypothetical series of scenarios: we will simulate the possibility to choose between great and small centralities (not necessarily in dimension unit, but in attractiveness level unit). By keeping constant the total amount (connected i.e. to the economic budget), and without considering the economies of scale effects when estimating the costs to create urban centralities (a few great centralities rather than a lot but small), we can roughly (wrongly) imagine that the costs to create ten centralities with a level of A = 1 each, it is similar to create one centrality with a level of A = 10. Independently from the ‘budget constriction’ hypothesis (which could involve a wrong reasoning because it will require a process of estimation of the costs between creating a great amenity and several small ones), we imagine the wish to simulate the social isobenefit scenarios when choosing a few great centralities or much more but smaller and more spread.
Fig. 16. Simulation Scenario I

Luca D’Acci - 9 August 2013 - Simulating future societies in Isobenefit Cities
16
Fig. 17. Simulation Scenario II
Fig. 18. Simulation Scenario III

Luca D’Acci - 9 August 2013 - Simulating future societies in Isobenefit Cities
17
Fig. 19. Simulation Scenario IV
Fig. 20..Scatter Plots of the simulations results
Luca D’Acci - 9 August 2013 - Simulating future societies in Isobenefit Cities
18
The scatter plots of Fig. 20 evidence the results of the simulations by showing the relations among each couple of indicators. The first row shows the Isotropic Cities simulated with E = 1 (left) and E = 10; the second row the scenarios from 1 to 3 (left) and from I to IV. Simulations of the second row of Fig. 20, underline that even if U and the minimum benefit increases, the medium B decreases 9. Cities as chessboards: static versus dynamic
The city is like a chessboard: parks, beautiful squares, attractive pedestrian streets, intriguing shopping areas, ... are like pieces of a chessboard: a bishop, a knight, a queen, a rook ... The Potential Force of the latter (the knight can move in “L”, also jumping and in any direction; the rook horizontally and vertically, as much as it likes as far as there is empty space; etc…), once placed on the chessboard, depends on their positions and their use from the players, which transform it into the Contingent Force, which constantly change in each step of the game. In a city the pieces are amenities; their Potential Force are their Potential Attractiveness; the players are thousands or millions (citizens, investors, governments); the Contingent Force is the Contingent Attractiveness, namely the actual use and enjoyment of amenities and urban areas. A wonderful park with high Potential Attractiveness, may have a low Contingent Attractiveness, or even negative (crime, prostitution) depending from the interactions among the other amenities/disamenities and the citizen’s behaviours. In the same way, two nice squares placed one close to the other may have a non-linear sum of their Potential Attractiveness. A major influence in the city chessboard is played from the accessibility. Therefore, the Isobenefit Lines approach here used for simulating future scenarios, is limited on equilibrium, while evolution must be studied by adding methods such as Statistical Physics and Games Theory. The static use of Isobenefit Lines translates the present scenarios (Contingent Attractiveness in the specific moments we are observing them) of a city into numbers and 3dimensional volumes and personalizes city readings in relation to personal memories, characters and preferences ([38]). In a dynamic pattern, Isobenefit Lines can offer an interactive planimetry above which to put agents who decide where to reside, walk …, following their own Personal Isobenefit Lines, and interacting with those of the others. Therefore we can simulate the interactions among amenities and agents, in order to obtain, under certain conditions, locations and moving scenarios, as well as estimate the resulted use and enjoyment of amenities and urban points. The static use of Isobenefit Lines may result helpful, i.e., in quantifications and comparisons (but just as instant pictures) of city attractions, geometrical morphologies, fair distribution of social benefit, relations between urban quality/amenities and property values. Independently from the question “how to quantify the attractiveness of amenities2” (A in equation 1), which this paper doesn’t tempt to reply and which rests outside its expertise, we should underline how the scenarios simulated here are static.
2 Either in a static or dynamic pattern, when we are outside the Personal Isobenefit Lines contest, in order to quantify the attractiveness of amenities (nice squares, agreeable pedestrian streets, pleasant parks…), we could use the actual relative number of people using them (no tourists) just if, throughout the city, population density and the relation among cost, time, comfort and distance from each point to each amenity are constant (at least the latter is almost always impossible); where with “relative” number, we mean the following: imagine a town of 100 inhabitants with 3 attractions, A1, A2 and A3. 15 of them, never go out, or never go to any town attractions, and we usually see 40 people in A1, 25 in A2 and 20 in A3, therefore, for example, we assign 5 to A1, 3 to A2 and 2 to A3 and we say that the majority of people prefer A1. This is valid as long as all the people go, in turn, to A1, A2 and A3. This would mean that each person usually prefers to go more often to A1 than to A2 or to A3. However, if we notice (i.e. surveys) that people (40) going to A1 are always the same, and that the other 45 people always go, in turn, to A2 and A3, therefore the majority of citizens does not prefer A1, but A2 and A3. The quantification of A may also be achieved by extensive surveys asking to evaluate each A by personal points of view. Therefore, if variances are limited, the average score may indicate the ordinary citizen preferences, otherwise it is just an average of differences, and talking about Isobenefit Lines will result meaningless, because no majority, or ordinariness, appears, and we should only refer to Personal Isobenefit Lines. From this point of view, Personal Isobenefit Lines work inside variances, Isobenefit Lines inside averages, but only when with little variances. We could anyway tempt to estimate the (platonic) attractiveness by keeping in mind the above factors and auto scaling the evaluation process: “We all know that that park is wonderful for the majority of citizens point of view, even if is not so busy because of being rather inaccessible and/or because of being close to a disamenity”, or “Even if it is not so

Luca D’Acci - 9 August 2013 - Simulating future societies in Isobenefit Cities
19
In short, it is certainly not enough to rely on the Platonic Attractiveness and on blind Top-Down actions putting amenities on the city-chessboard without considering the fact that Contingent Attractiveness which may emerge from the game, may differ from Platonic Attractiveness. An Isobenefit Lines scenario which refers to a present scenario, already includes the result of the game, because it values the present attractiveness by directly watching (or surveying) the Contingent Attractiveness of a specific moment. However, when we want to use them for simulating future scenarios, we cannot pretend to be sure about the coincidence between Platonic and Contingent Attractiveness, therefore we should include dynamic elements. The latter may be done by using the Personal Isobenefit Lines of “each” citizen (as well as dynamic actions of investors and governments) and simulating their reciprocal influences. For a discussion about the meaning of “Equilibrium” in Spatial Equilibrium, refer to [31]. 10. Conclusion Theoretically, the isobenefit urbanism approach can be used at its best to create ex-novo urbs. Quoting Hawking’s opinion, “If this race manages to redesign itself, to reduce or eliminate the risk of self-destruction, it will probably spread out, and colonise other planets and stars” [39]; if this is really going to happen, isobenefit urbanism could be a rational basis to design our future Space’s habitats. Less futuristically, can be applied in deep urban plans by simulations, whose efficacy was shown in this study by using the isobenefit lines approach: a tool, as easy as powerful, which transform cities into 3dimensional benefit volumes, by which they can be analyzed and compared passing through elementary geometry and multivariable calculus. In this regard we could encourage rational and useful numerical translation as long as we keep in mind that each city has to be evaluated on its merits as its uniqueness. They may show behavioural similarity which follow simple identical mathematical rules [40], but each of them are still unique and wonderful, fascinating results of unrepeatable personal history. “When one is studying the present and the past, to turn a blind eye to the future would be impossible, and, if it were possible, it would be perverse” ([41] p. 12). The past is “a laboratory for the future” ([42] p. 695); from this point of view, the Isobenefit approach does not tempt to solve future problems, but to delete them from their appearance by jumping the Negative Transitory Cycles often produced through our progress path by the Systemic Retroactive Game between our behaviours and their own emergent products as cultures, cities and social-economical systems. Everything is connected with everything through space and time; as “the spirit of nationality is a sour ferment of the new wine of democracy in the old bottles of tribalism” ([41] p.34), as our urbs are the reflex of our past civitas through the mirror of our present one. Reflex, because cities morphology, architecture and, more inclusively, their genius loci, are mostly built from the past; mirror, because we shape our cities, by changing them, more or less deeply/suddenly, in relation to our current culture; our current culture will be reflected by the mirror of our future civitas, and so on. Inside this temporal retroactive game, the isotropic approach shapes our urbs, which shape our civitas, which shape our urbs. References
[1] M. Batty, Nine lectures on Urban simulation: http://www.casa.ucl.ac.uk/rits/, 2012. [2] L. D’Acci, Measuring Well-Being and Progress”, Social Indicators Research, Vol 104, n.1,
2011, pp. 47-65. [3] L. D’Acci, A Modern Postmodern Urbanism, The Systemic Retroactive game (SyR) between
Bottom-up and Top-down, 2013. [4] E. Glaeser, Cities, Agglomeration, and Spatial Equilibrium. Oxford University Press, 2008. [5] A. Smith, An Inquiry intoo the Nature and Causes of the Wealth of Nations. Chicago
University of Chicago press, Chicago, 1776.
easily reachable, it still has visitors in the weekends”, or “That park is always full of people, but also because it is very accessible and/or close to several attractive amenities too”. Another possibility is surveying as many citizens as possible asking of the urban points they like and how much they like them. Idem for estimating the elements inside E of equation 1 ([38]).

Luca D’Acci - 9 August 2013 - Simulating future societies in Isobenefit Cities
20
[6] J. Von Thunen, The Isolated State. 1826, M. Carla Waternberg (trans.). Pegamon Press, Oxford, 1976.
[7] A. Marshall, Principles of Economics, London, 1890. [8] Ricardo, On the Principles of Political Economy and Taxation, John Murray, London, 1817. [9] W. Launhardt, “Die Bestimmung des zweckmaÈûigsten Standorts einer gewerblichen Anlage”,
(“Determining the optimal location of an industrial site”), Zeitschrift des Vereins Deutscher Ingenieure, 26: 105-116, 1882. In A. Marshall, Principles of Economics. Macmillian, London, 1890.
[10] A. Weber, Über den Standort der Industrien (On the Location of Industries), Mohr Verlag, Tübingen, Germany, 1929.
[11] B. Ohlin, Interregional and International Trade, Harvard University Press, Cambridge, 1933. [12] W. Christaller, Die zentralen Orte in Suddeutschland (The Central REgions of Southern
Germany). Jena, 1933. [13] T. Palander, Beitrage zur Standortstheorie (Contributions to Localtion Theory), Uppsala,
1935. [14] F.L. Hitchcock, Distribution of a Product from Several Sources to Numerous Localities,
Journal of Mathematics and Physics, Vol.21, 224-230, 1941. [15] L.V. Kantorovich, On the Translocation of Masses, Doklady Adad, Nauk SSR, Vol. 37, 1942,
translated in Management Science, Vol. 5, No.1 1958. [16] T.C. Koopmans, Optimum Utilization of the Transportation System, Econometrica, Vol.71,
136-146, 1949. [17] W. Isard, Location and Space-Economy. Wiley, New York, 1956. [18] L. Lefeber, Allocation in Space: Production, Transport and Industrial Location. North-
Holland, Amsterdam, 1958. [19] P.A. Samuelson, Spatial Price Equilibrium and Linear Programming, American Economic
Review, Vol.42, 283-303, 1952. [20] S. Enke, Equilibrium Among Spatially Separated Markets: Solution by Ecectric Analogue,
Econometrica, Vol.19, 40-47, 1951. [21] A. Lösch, Die räumliche Ordnung der Wirtschaft, 3rded, Gustav Fischer, Stuttgart, 1962. [22] E. Von Boventer, Theorie des raumlichen Gleichgewichts (Theory of Spatial Equilibrium).
Tubingen, 1962. [23] R.E. Kuenne, The Theory of General Economic Equilibrium, University Press, Princeton,
1963. [24] W. Alonso, Location and land use: toward a general theory of land rent, Harvard University
Press, 1964. [25] R. Muth, Cities and Housing. University of Chicago Press. Chicago, 1969. [26] E.S. Mills, An Aggregative Model of Resource Allocation in a Metropolitan Area”. American
Economic Review Papers and Proceedings of the Seventy-ninth Annual Meeting of the American Economic Association, 57(2): 197-210, 1967.
[27] E.S. Mills, Studies in the Structure of the Urban Economy. Johns Hopinks Press, Baltimore, 1972.
[28] J.V. Henderson, The Sizes and Types of Cities, American Economic Review, 64(4):640-656, 1974.
[29] P. Krugman, Increasing Returns and Economic Geography, Journal of Political Economy, 99(3):483-499, 1991.
[30] M. Fujita, P. Krugman, A. Venables, The Spatial Economy, Cambridge MIT Press, 2001. [31] L. D’Acci, Macro and Micro Spatial Equilibrium, 2013. Online at http://mpra.ub.uni-
muenchen.de/48984/ MPRA Paper No. 48984, posted 9. August 2013 13:16 UTC. [32] L. D’Acci, Isobenefit Urbanism and Isotropic Societies for visionary futures. Equations
against unideal cities, 2013. [33] F. Bianchini, The crisis of urban social life in Britain: origins of the problems and possible
responses. Planning Practice and Research, 5 (3), 1990, p. 4. [34] R. Evans, Regenerating town centres, Manchester University Press, Manchester, 1997. [35] L. D’Acci, Hedonic Inertia and Underground Happiness, Social Indicators Research,
September 2013, Volume 113, Issue 3, pp 1237-1259.

Luca D’Acci - 9 August 2013 - Simulating future societies in Isobenefit Cities
21
[36] MIT Technology Review, Isobenefit Lines Rewrite Rules for Understanding City Life (18 october 2012). www.technologyreview.com/view/429679/isobenefit-lines-rewrite-rules-for-understanding-city-life/
[37] L. D’Acci, “Monetary, Subjective and Quantitative Approaches to Assess Urban Quality of Life and Pleasantness in Cities, Social Indicators Research, 2013.
[38] L. D’Acci, Mathematize urbes by humanizing them. arXiv, Physics and Society, arXiv:1307.3923 [physics.soc-ph], 2013.
[39] S. Hawking, Life in the Universe, 1996 http://www.hawking.org.uk/life-in-the-universe.html [40] G. West, Science of cities, 2011. http://www.weforum.org/videos/ideas-davos-science-cities;
http://www.ted.com/talks/geoffrey_west_the_surprising_math_of_cities_and_corporations.html
[41] A. Toynbee, A Study of History, Oxford University Press and Thames & Hudson Ltd, London, 1972.
[42] F. Fernandez-Armesto, Millenium. A history of our last thousand years. BCA, 1995.