simulating permeability reduction by clay mineral
TRANSCRIPT
1
Simulating permeability reduction by clay mineral nanopores in a
tight sandstone by combining µXCT and FIB-SEM imaging Arne Jacob1, Markus Peltz2, Sina Hale3, Frieder Enzmann1, Olga Moravcova1, Laurence N. Warr2,
Georg Grathoff2, Philipp Blum3 and Michael Kersten1
5
1Geosciences Institute, Johannes Gutenberg-University, J.-J. Becherweg 21, 55099 Mainz, Germany 2Institute of Geography and Geology, University Greifswald, Friedrich‑Ludwig‑Jahn‑Str. 17a, 17487 Greifswald, Germany 3Institute of Applied Geosciences (AGW), Karlsruhe Institute of Technology (KIT), Kaiserstraße 12, 76131 Karlsruhe,
Germany
Correspondence to: Arne Jacob ([email protected]) 10
Abstract
Computer microtomography (µXCT) represents a powerful tool for investigating the physical properties of porous rocks.
While calculated porosities determined by this method typically match experimental measurements, computed permeabilities
are often overestimated by more than one order of magnitude. This effect increases towards smaller pore sizes, as shown in
this study, in which nanostructural features related to clay minerals reduce the permeability of tight reservoir sandstone 15
samples. FIB-SEM tomography was applied to determine the permeability effects of illites at the nanometre scale and
Navier-Stokes-equations were applied to calculate the permeability of these domains. With this data, microporous domains
(porous voxels) were defined using microtomography images of a tight reservoir sample. The distribution of these domains
could be extrapolated by calibration against size distributions measured in FIB-SEM images. For this, we assumed a mean
permeability for the dominant clay mineral (illite) in the rock and assigned it to the microporous domains within the 20
structure. The results prove the applicability of our novel approach by combining FIB-SEM with X-ray tomographic rock
core scans to achieve a good correspondence between measured and simulated permeabilities. This methodology results in a
more accurate representation of reservoir rock permeability in comparison to that estimated purely based on µXCT images.
1 Introduction
Depositional environment and subsequent diagenetic alterations are two key factors that influence the bulk mineralogical 25
composition and the authigenic clay mineral inventory of a reservoir (Wilson and Pittman, 1977; Worden and Morad, 1999),
and therefore the fluid flow properties of the porous rock. A well-established technique to image and analyse rapidly the 3D
https://doi.org/10.5194/se-2020-151Preprint. Discussion started: 30 September 2020c© Author(s) 2020. CC BY 4.0 License.
2
physical properties of porous rocks is computer X-ray microtomography (µXCT) combined with the concept of Digital Rock
Physics (Andrä et al. 2013a, 2013b; Okabe and Blunt, 2004). By applying monochromatic synchrotron radiation, it is
possible to overcome conventional µXCT artefacts like beam hardening and problems that arise due to limited phase 30
contrast, lack in resolution and edge preservation, as well as low signal-to-noise ratios (Brunke et al. 2008; Kling et al. 2018;
Lindquist et al. 2000; Mayo et al. 2015; Spanne et al. 1994). Synchrotron based µXCT images with voxel resolutions in the
order of 1 µm can provide a sound basis for flow and transport modelling of tight sandstones as suggested by Peng et al.
(2014). They found that synchrotron µXCT imaging is necessary for tight sandstones when the connectivity of the pore
space is low and pore throats cannot be resolved using a conventional µXCT scanner. They further concluded that a high 35
abundance of the smallest resolvable pores falsifies modelled permeabilities due to an overestimation of actual pore sizes.
Several studies have shown sub-micrometre pore structures to be a frequent feature of tight reservoir rocks (Jiang, 2012;
Shah et al. 2016; Soulaine et al. 2016). Most of these nanostructures are related to different types of clay minerals; most
commonly illite, kaolinite, chlorite and smectite (e.g. Wilson and Pittman, 1977, Worden and Morad, 1999, Desbois et al.
2016). Although known for decades, considering such structural features below µXCT resolution in pore-scale models 40
remains challenging (Alyafei et al. 2015; Guan et al. 2019; Menke et al. 2019; Peng et al. 2012). Soulaine et al. (2016)
systematically analysed the effect of sub-resolution domains with varying permeabilities on the simulated permeabilities of
Berea sandstone (20 vol.-% porosity, 2 vol.-% sub-resolution domains) and found that calculated permeabilities can be
reduced by up to 50 %, if microporous domain permeabilities converge towards zero. Thus, it is evident that neglecting sub-
resolution information can lead to a significant overestimation of rock permeability in such simulations (e.g. Saxena et al. 45
2018, 2017). Menke et al. (2019) utilized a multi-scale Brinkman area approach applying different permeabilities for each
microporous domain to simulate flow in mono-mineralic carbonate rock. They showed that Stokes-Brinkman models are in
good agreement with experimental data whereas Stokes and/or Navier-Stokes models alone were not able to predict
permeability in a conventional flow scenario. They also demonstrated that for pure carbonates, a direct correlation can be
established between observed density contrasts and specific physical properties, such as porosity and permeability. However, 50
this approach is not applicable in a system with more than one rock forming mineral, such as a tight sandstone, where
density contrasts relate to different mineral phases as well as sub-resolution porosities.
https://doi.org/10.5194/se-2020-151Preprint. Discussion started: 30 September 2020c© Author(s) 2020. CC BY 4.0 License.

3
The lack of distinct material information for a voxel is often ascribed to as the partial volume effect (e.g. Kessler et al. 1984;
Ketcham and Carlson, 2001). To overcome this issue, imaging techniques that can resolve the pore structure at different
length scales have to be applied. For estimating the permeability of reservoir rocks, the resolution achieved by synchrotron 55
radiation imaging lies within an acceptable range (Saxena et al. 2018). Several studies have demonstrated that, by combining
X-ray and scanning electron imaging, the pore space of tight clay-bearing rocks can be spatially resolved from the mm-
down to the nm-scale (e.g. Desbois et al. 2016; Hemes et al. 2015; Markussen et al. 2019).
In this study, we aim to demonstrate a new approach by combining synchrotron-based µXCT imaging with focussed-ion-
beam scanning electron microscopy (FIB-SEM) to improve flow simulations in a tight sandstone formation with high clay 60
mineral content. First, we used machine learning-based image segmentation to enhance pore space segmentations of artefact
rich FIB-SEM topologies. Then, we conducted Navier-Stokes simulations on FIB-SEM topologies. Finally, we subsequently
used these simulations as input data for sub-resolution domains in µXCT based Stokes-Brinkman models (Brinkman, 1949;
Neale and Nader, 1974). This novel morphology-based approach for sub-resolution-rich materials results in simulated
permeabilities that fit experimental results significantly better than using Navier-Stokes simulations alone. 65
https://doi.org/10.5194/se-2020-151Preprint. Discussion started: 30 September 2020c© Author(s) 2020. CC BY 4.0 License.

4
2 Sample preparation and characterization
In this study, a well-characterized illite-bearing Upper Rotliegend sandstone from Germany was used, which was sampled
from the quarry Schwentesius near the Bebertal village (Heidsiek et al. 2020). This well-known location exposes an
analogue of the Permian gas reservoir sandstone of the Flechtingen High, which formed part of the North German Basin.
Thin section analyses of this reservoir rock have shown that illite is the main clay mineral, which primarily occurs as a 70
coating along detrital grains, as illite meshworks grown on coatings, as diagenetically altered K-feldspar and as illitized
lithoclasts (Fischer et al. 2012).
Figure 1 (A) Upper Rotliegend sandstone block showing four main deposition facies. (B) Sampling locations and sizes
of the extracted plugs (green) and the mini plugs (red) extracted. 75
Samples were taken from a large sandstone block displaying a variety of different aeolian and fluvial depositional facies
(Fig. 1A). We identified several facies denoted A to J from four different types of sedimentary depositional layers. The
samples of the different facies were numbered from left to right. Samples were drilled out and extracted from marked
locations in the form of plugs with a diameter of 2.5 cm. The plugs were cut into three segments which were used for X-ray
diffraction analyses, helium porosimetry measurements and FIB-SEM imaging. Mini plugs were drilled directly beside the 80
plugs with a diameter of 3 mm and a length between 10 and 20 mm. The larger plugs were used for
mineralogical/geochemical analysis, and to measure permeabilities experimentally. The mini plugs were used for the
https://doi.org/10.5194/se-2020-151Preprint. Discussion started: 30 September 2020c© Author(s) 2020. CC BY 4.0 License.

5
synchrotron radiation-based µXCT imaging at the PETRA beamline P05 of DESY Hamburg (Germany). After the
synchrotron measuring campaign, the mini plugs were additionally examined by FIB-SEM and Energy Dispersive X-ray
Spectroscopy (EDX) imaging to obtain qualitative and quantitative information about the clay mineral particles found within 85
the rock pore space. Microporous structures in the Rotliegend sandstone sample could be resolved by comparing µXCT and
FIB-SEM images. The term “microporous” refers to the definition of sub micrometre porosity by Soulaine et al. (2016), who
differentiated between void, solid, and microporous voxels in µXCT images. “Nanoporous” is used to describe structures
with predominant pore sizes in the nanometre range (0.2 – 1000 nm).
3 Analytical procedures 90
3.1 Mineralogical characterization
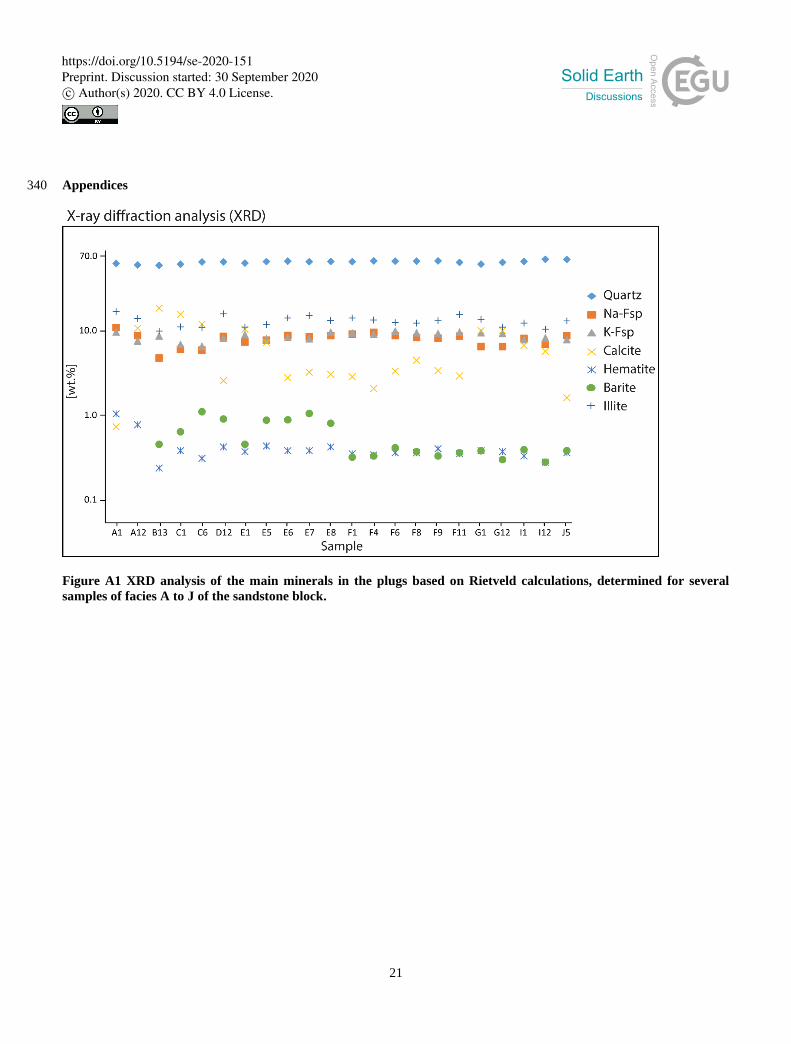
X-ray diffraction analyses using the Rietveld analysis program Profex 4.0 (Doebelin and Kleeberg, 2015; Ufer et al. 2012)
have shown a homogenous mineralogical composition along the layers of the sample block with only slight variations in
content (Figure A1). The main components are quartz (58-69 wt.-%), authigenic and diagenetic feldspars (12-20 wt.-%),
calcite (1-18 wt.-%), and illite (10-17 wt.-%). In the <0.2 µm size fraction, we observed traces of swelling smectite 95
interpreted as contaminants from surface weathering. Accessory hematite and barite particles also occur with abundances of
<1 wt.-%. In the Bebertal tight sandstone, illite is by far the most abundant clay mineral and makes up ~95 wt.-% of the <2
m fraction. Commonly, the nanometre-scale microstructural features of reservoir rocks containing significant amounts of
clay minerals are usually not detectable at XCT resolution due to a low absorption contrast (Ahmad et al. 2018).
3.2 Permeability measurements and pore size distribution 100
A helium gas-driven permeameter under steady-state conditions was used to experimentally obtain permeability values for
the individual plugs (e.g. Filomena et al. 2014). Compressed air was used to apply a pressure of 10 bar to the core samples
that were coated by a latex membrane. For permeability measurements, the inflow and outflow pressures of the helium flux
were sequentially increased in up to six pressure steps. The differential pressure was kept constant at 200 – 500 mbar
depending on the sample properties. The intrinsic sample permeability was derived from the apparent gas permeability, 𝐾𝑔, 105
determined for each pressure step using Darcy´s law (Liu et al. 2017):
https://doi.org/10.5194/se-2020-151Preprint. Discussion started: 30 September 2020c© Author(s) 2020. CC BY 4.0 License.

6
𝐾𝑔 =2𝑄𝑝2𝜂𝐿
𝐴(𝑝12−𝑝2
2) (1)
where 𝑄 is the measured gas flow rate, 𝜂 is the dynamic viscosity of the permeant, 𝐿 is the sample length, A is the sample
cross-section, and 𝑝1 and 𝑝2 are the inflow and outflow pressures. By plotting 𝐾𝑔 against 1
(𝑝1+𝑝2)/2 , the data can be fitted by
a straight line. The intercept of the best-fit line at the 𝐾𝑔 axis corresponds to the intrinsic sample permeability, Kint (Gao and 110
Li, 2016; Klinkenberg, 1941). Also, MIP measurements were conducted with an Autopore IV Series (Micromeritic
Instrument Corp.) to determine the pore size distribution of a dried sub-sample with a weight of ~2.5 g, which was taken
from a cross-bedded aeolian layer of the sandstone block. Based on the capillary law, MIP enables the analysis of a wide
spectrum of pore sizes (3 nm to > 900 µm), corresponding to a pressure range of 0 - 414 MPa. As a non-wetting liquid with a
high contact angle (130 - 140°), mercury only penetrates a pore when pressure is applied. Under the assumption of 115
cylindrical pores, the applied pressure is directly proportional to the pore throat diameter as described by the Washburn
equation (Washburn, 1921):
𝐷 = −4𝛾 ∙cos𝜃
𝑃 (2)
where 𝐷 is pore throat diameter, 𝛾 the surface tension, 𝜃 the contact angle, and 𝑃 the applied pressure.
3.3 Synchrotron-based µXCT 120
For synchrotron tomography, a beam energy of 29.87 KeV was used. The effective image resolution of the detector equipped
with a CCD camera was 1.22 µm per pixel, while the image size was 3056 × 3056 pixels. We used an advanced
reconstruction script with the MATLAB® software and binned the images by a factor of 2 before reconstruction to increase
the signal-to-noise ratio (Moosmann et al. 2014). This decreased the resolution to 2.43 µm and changed the image size to
1528 × 1528 pixels. The number of projections was 1200, with the information of five subsequent images used to calculate 125
an average for every projection image. After reconstruction of the 3D image stacks, the scans were denoised using the non-
local means filter of the GeoDict 2020 software package (Buades et al. 2011). Image segmentation of the mini plugs was
realized by conventional greyscale thresholding. A comparison with machine learning segmentation methods revealed a
better pore-to-solid segmentation and resolving of small pore throats by thresholding (Fig. 2). Since the main goal was to
https://doi.org/10.5194/se-2020-151Preprint. Discussion started: 30 September 2020c© Author(s) 2020. CC BY 4.0 License.

7
achieve the best possible permeability estimation, the differentiation between pore and solid is more important for 130
permeability estimation than the accurate segmentation into different phases (Khan et al. 2016). Leu et al. (2014) point out
that even a small variation in pore throat morphology can have a large impact on the estimation of permeability.
Figure 2 (A) Greyscale 2D µXCT image of a mini plug. (B) Segmented phases using multi thresholding. (C)
Segmented phases using the machine learning image classification module of the software ilastik (Version 1.3.3) by 135
Berg et al. (2019)
For permeability simulations, we either used the Fast Fourier Transformation (SIMPLE-FFT) or the Left-Identity-Right
(LIR) solvers, both implemented in the FlowDict module of the GeoDict software package (Linden et al. 2015; Moulinec
and Suquet, 1995). While the SIMPLE-FFT solver is fast for calculating low porosity domains, the LIR solver is better
suited for high porosity domains and requires less memory. Both iterative finite volume solvers can apply Navier-Stokes and 140
Navier-Stokes-Brinkman equations. The equations are derived from Darcy’s law (Eq. 1) to calculate the permeability of a
material (Darcy, 1856):
�⃗� = −𝐾
𝜂(𝛻𝑝 − 𝑓 ) (3)
In Eq. 3, �⃗� is the 3-dimensional average fluid-flow velocity, 𝐾 the permeability, the fluid viscosity, 𝑝 the intrinsic average
pressure tensor, and 𝑓 the force density field, which was defined using the Navier–Stokes conservation of momentum 145
equation for all three dimensions (Eq. 4):
−𝜂∆�⃗� + (⍴�⃗� ∙ 𝛻)�⃗� + 𝛻𝑝 = 𝑓 (4)
https://doi.org/10.5194/se-2020-151Preprint. Discussion started: 30 September 2020c© Author(s) 2020. CC BY 4.0 License.

8
The Brinkman term can be added to the Navier-Stokes equation where porous voxels are required. These voxels include the
nanoporous flow resistivity:
−𝜂∆�⃗� + (⍴�⃗� ∙ 𝛻)�⃗� + 𝜂𝐾−1�⃗� + 𝛻𝑝 = 𝑓 (5) 150
where 𝐾−1 is the inverse of the permeability tensor and 𝜂𝐾−1 the flow resistiveity. The applicability and robustness of
combining Navier-Stokes equations with the Brinkman term has been validated by Iliev and Laptev (2004).
We calculated the permeability with symmetric boundary conditions in tangential and flow direction with a pressure drop of
20370 Pa. The symmetric boundary conditions are valid for low porous structures with non-periodic pore throat geometries.
The differential pressure value was set to be able to compare the results with helium permeation flux measurements where 155
similar values have been used. As a convergence stopping criterion, an error bound was used. This stops the iteration when
the relative difference to a predicted permeability within the last 100 iterations is smaller than 5 %.
https://doi.org/10.5194/se-2020-151Preprint. Discussion started: 30 September 2020c© Author(s) 2020. CC BY 4.0 License.

9
3.4 FIB-SEM Measurements
In this study, a Zeiss Auriga crossbeam electron microscope equipped with a Gemini electron column and an Orsay Physics
ion beam was used. SEM images were taken at 1 kV with an in-lens secondary electron (SE2) detector, and FIB slicing was 160
executed with a beam current between 0.5 and 2 nA and a voltage of 30 kV. This resulted in a slice thickness of 25 nm. A
large FOV of ~20 µm could be reached. To derive structural information from the FIB-SEM images, extensive post-
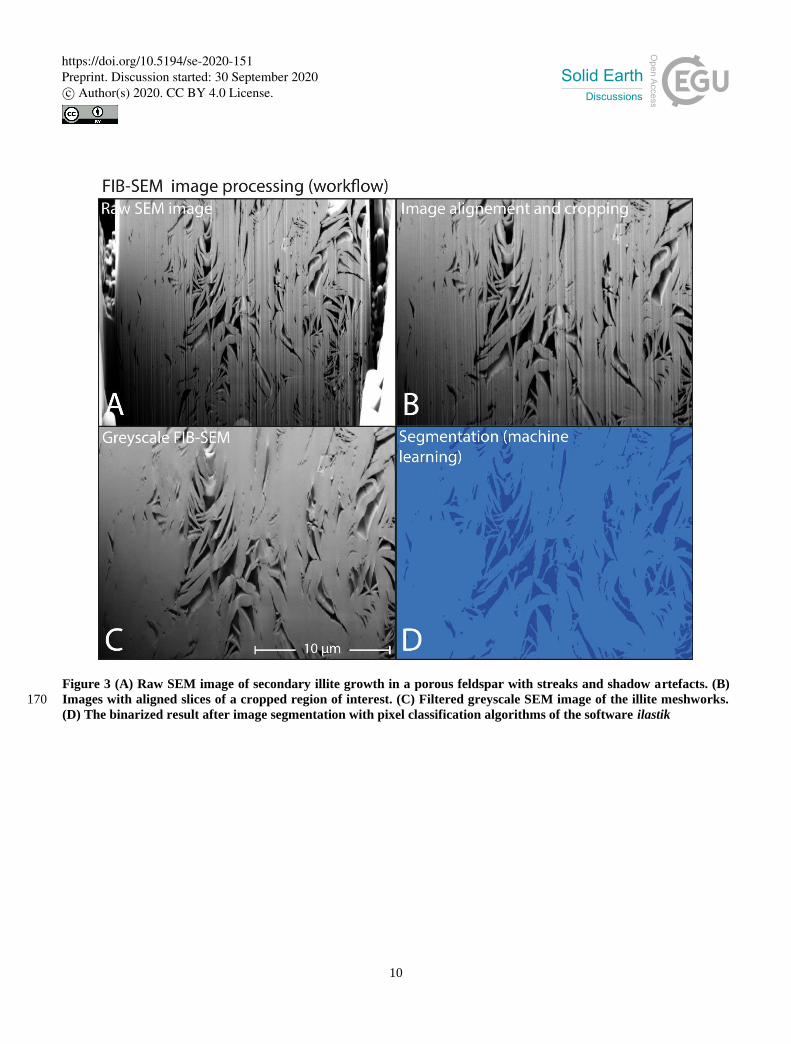
processing of the data was required. Following image alignment and cropping, stripes and shadow artefacts were filtered out
before image segmentation. The Slice Alignment operation of the module ImportGeo of the GeoDict 2020 software package
was used to align the images, while the Curtaining Filter was used for stripes correction (Fig. 3). In general, the 165
segmentation of pores in FIB-SEM images was not straight forward since scans of porous polished sections are pseudo-2D
and contain information from behind the actual imaging plane (De Boever et al. 2015).
https://doi.org/10.5194/se-2020-151Preprint. Discussion started: 30 September 2020c© Author(s) 2020. CC BY 4.0 License.
10
Figure 3 (A) Raw SEM image of secondary illite growth in a porous feldspar with streaks and shadow artefacts. (B)
Images with aligned slices of a cropped region of interest. (C) Filtered greyscale SEM image of the illite meshworks. 170
(D) The binarized result after image segmentation with pixel classification algorithms of the software ilastik
https://doi.org/10.5194/se-2020-151Preprint. Discussion started: 30 September 2020c© Author(s) 2020. CC BY 4.0 License.

11
As multi-thresholding and watershed segmentation algorithms have problems with shine through artefacts (Prill et al. 2013),
capturing the correct 3D pore space geometry is of crucial importance for the determination of a realistic permeability.
Recent advances have shown that machine learning image segmentation software can successfully be utilized to segment
pore space in CT scans (Berg et al. 2018). The software ilastik, an interactive learning and segmentation toolkit by Berg et 175
al. (2019), was used for the segmentation of the phases in our FIB-SEM images (Fig. 3). The built-in pixel classification
module groups probabilities according to their different imaged features. In a manually controlled workflow, it was possible
to reach high segmentation accuracies with only minor over- or under-estimations of the pore space (Fig. 3C, D).
3.5 Defining microporous domains
The need to define microporous domains results from the mismatch of permeability between XCT simulations and gas-180
driven permeameter tests. While the simulation of permeability in structures with high permeability and porosity obtained by
µXCT scans is precise, the effect of nanoporosity below resolution on permeability increases with decreasing permeability
(Pittman and Thomas, 1979; Saxena et al. 2018). When comparing backscattered electron (BSE) images with XCT images
of the same slice, it becomes apparent that the smallest pores in µXCT images simplify the real pore structure (Figure A2).
Furthermore, SEM and EDX images revealed that most of the pores are filled with clay minerals. Since both void and 185
microporous regions share similar greyscale values, it is impossible to correctly differentiate upon segmentation. In this
approach, the segmentation of the pores includes clay minerals with a low absorption contrast. To determine the distribution
of illite in µXCT scans, we used correlative µXCT, SEM and EDX measurements. For this, a 3 mm plug was embedded into
epoxy resin and then ground and polished until the region of interest was reached. Two sites were chosen for EDX mappings
(Figure A2). Comparing EDX Mappings with CT images shows that the distribution of illite agrees with the textural findings 190
of Fischer et al. (2012). Furthermore, it becomes apparent that illite enrichments coincide with regions that are usually
referred to as void pore space in µXCT images. The mismatch between real pore structure and segmented pore space is
highest in small pores and throats. To refine flow and reduce the influence of overestimated pore sizes in these specific
regions, we define all pores with a diameter ≤ 2 voxels as microporous domains. The Brinkman term accounts small pores,
where grains are porous themselves (Brinkman, 1949). To extract these regions from the initial pore space segmentation 𝐹𝑝∗ 195
we calculated Euclidian distance maps as used by Maurer et al. (2003):
https://doi.org/10.5194/se-2020-151Preprint. Discussion started: 30 September 2020c© Author(s) 2020. CC BY 4.0 License.
12
𝑑 = √(𝑥2 − 𝑥1) + (𝑦2 − 𝑦1) + (𝑧2 − 𝑧1) (6)
where 𝑑 is the distance between two points, 𝑥1, 𝑦1 and 𝑧1 the coordinates of the first point, and 𝑥2, 𝑦2 and 𝑧2 the coordinates
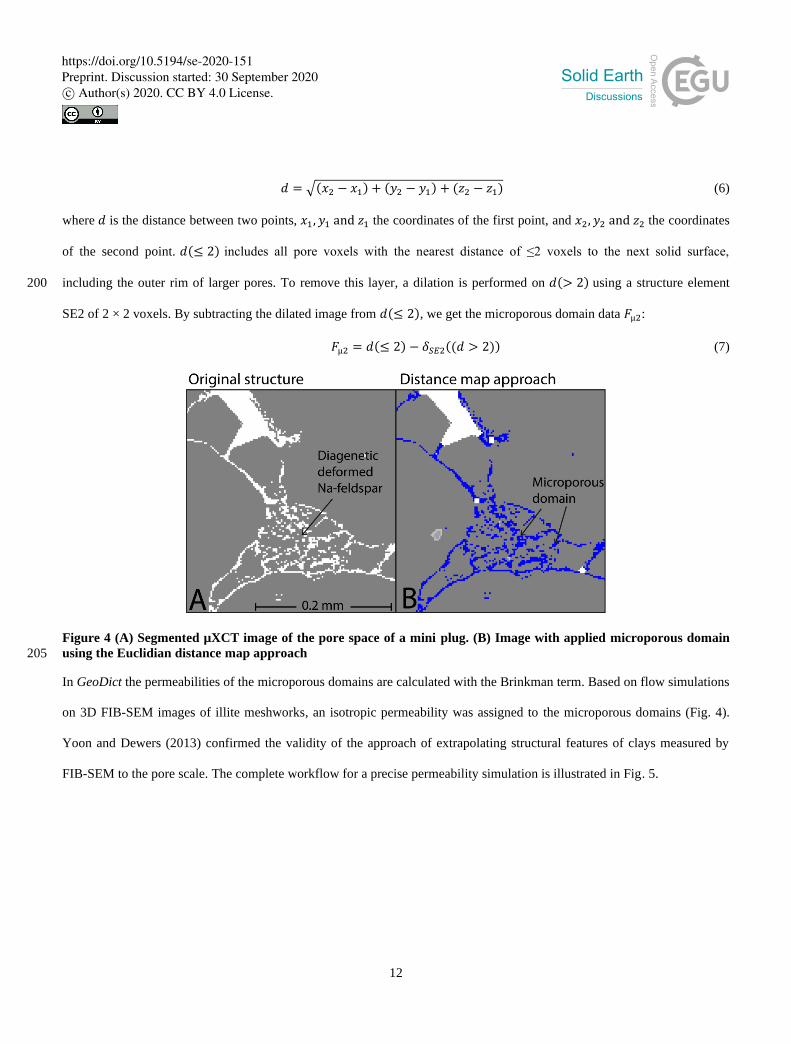
of the second point. 𝑑(≤ 2) includes all pore voxels with the nearest distance of ≤2 voxels to the next solid surface,
including the outer rim of larger pores. To remove this layer, a dilation is performed on 𝑑(> 2) using a structure element 200
SE2 of 2 × 2 voxels. By subtracting the dilated image from 𝑑(≤ 2), we get the microporous domain data 𝐹µ2:
𝐹µ2 = 𝑑(≤ 2) − 𝛿𝑆𝐸2((𝑑 > 2)) (7)
Figure 4 (A) Segmented µXCT image of the pore space of a mini plug. (B) Image with applied microporous domain
using the Euclidian distance map approach 205
In GeoDict the permeabilities of the microporous domains are calculated with the Brinkman term. Based on flow simulations
on 3D FIB-SEM images of illite meshworks, an isotropic permeability was assigned to the microporous domains (Fig. 4).
Yoon and Dewers (2013) confirmed the validity of the approach of extrapolating structural features of clays measured by
FIB-SEM to the pore scale. The complete workflow for a precise permeability simulation is illustrated in Fig. 5.
https://doi.org/10.5194/se-2020-151Preprint. Discussion started: 30 September 2020c© Author(s) 2020. CC BY 4.0 License.
13
210
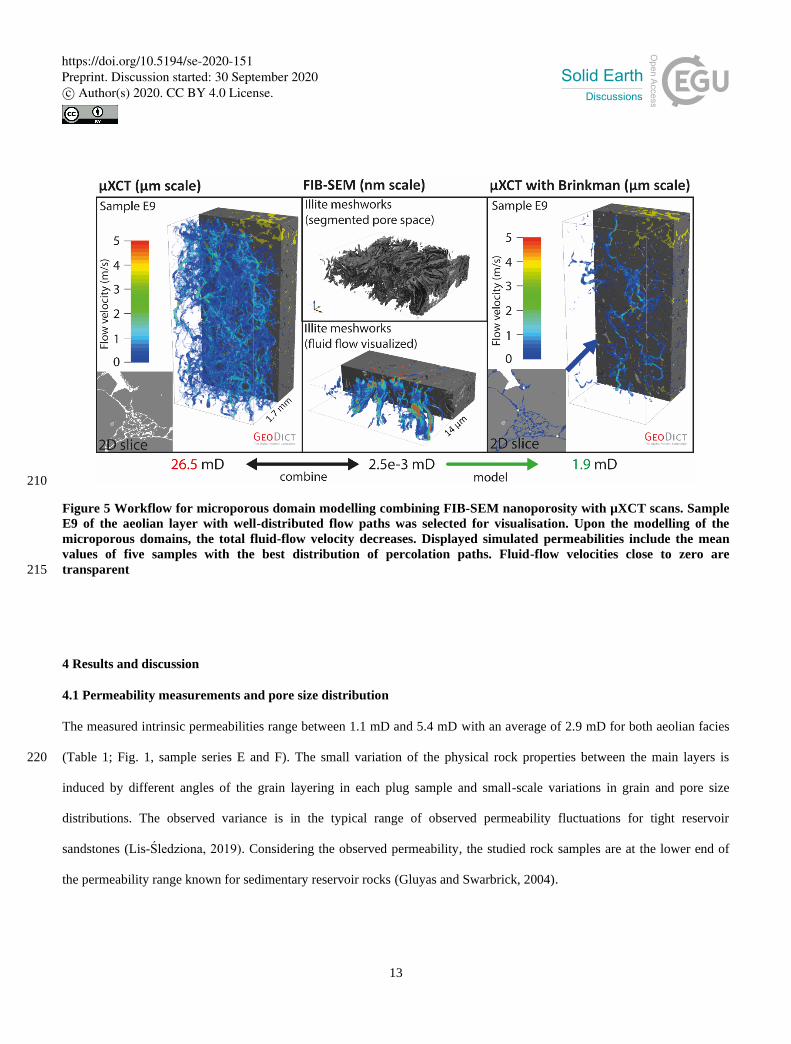
Figure 5 Workflow for microporous domain modelling combining FIB-SEM nanoporosity with µXCT scans. Sample
E9 of the aeolian layer with well-distributed flow paths was selected for visualisation. Upon the modelling of the
microporous domains, the total fluid-flow velocity decreases. Displayed simulated permeabilities include the mean
values of five samples with the best distribution of percolation paths. Fluid-flow velocities close to zero are
transparent 215
4 Results and discussion
4.1 Permeability measurements and pore size distribution
The measured intrinsic permeabilities range between 1.1 mD and 5.4 mD with an average of 2.9 mD for both aeolian facies
(Table 1; Fig. 1, sample series E and F). The small variation of the physical rock properties between the main layers is 220
induced by different angles of the grain layering in each plug sample and small-scale variations in grain and pore size
distributions. The observed variance is in the typical range of observed permeability fluctuations for tight reservoir
sandstones (Lis-Śledziona, 2019). Considering the observed permeability, the studied rock samples are at the lower end of
the permeability range known for sedimentary reservoir rocks (Gluyas and Swarbrick, 2004).
https://doi.org/10.5194/se-2020-151Preprint. Discussion started: 30 September 2020c© Author(s) 2020. CC BY 4.0 License.
14
Table 1: Intrinsic permeabilities and porosities of the measured sandstone plug samples. 225
E5 E6 E7 E8 E13 F4 F6 F8 F9 Mean
Standard
deviation
(±1σ)
Permeability
(mD) 1.1 5.1 5.4 2.2 4.2 2.3 2.3 1.9 1.4 2.9 1.5
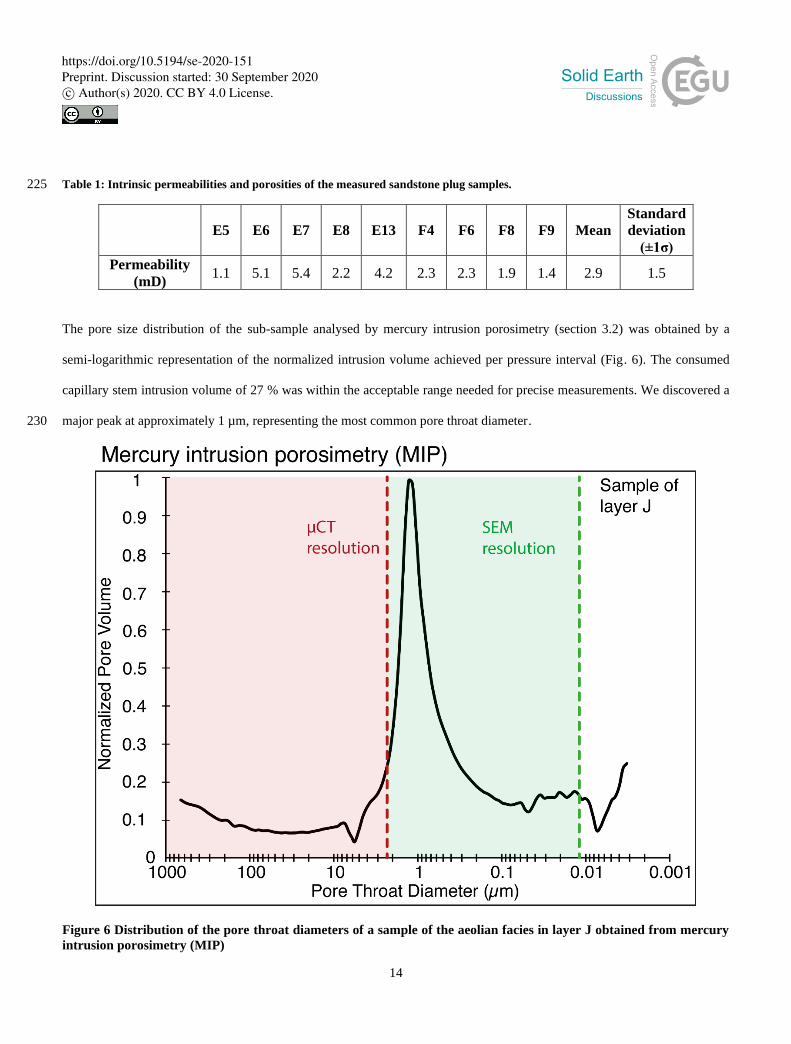
The pore size distribution of the sub-sample analysed by mercury intrusion porosimetry (section 3.2) was obtained by a
semi-logarithmic representation of the normalized intrusion volume achieved per pressure interval (Fig. 6). The consumed
capillary stem intrusion volume of 27 % was within the acceptable range needed for precise measurements. We discovered a
major peak at approximately 1 µm, representing the most common pore throat diameter. 230
Figure 6 Distribution of the pore throat diameters of a sample of the aeolian facies in layer J obtained from mercury
intrusion porosimetry (MIP)
https://doi.org/10.5194/se-2020-151Preprint. Discussion started: 30 September 2020c© Author(s) 2020. CC BY 4.0 License.
15
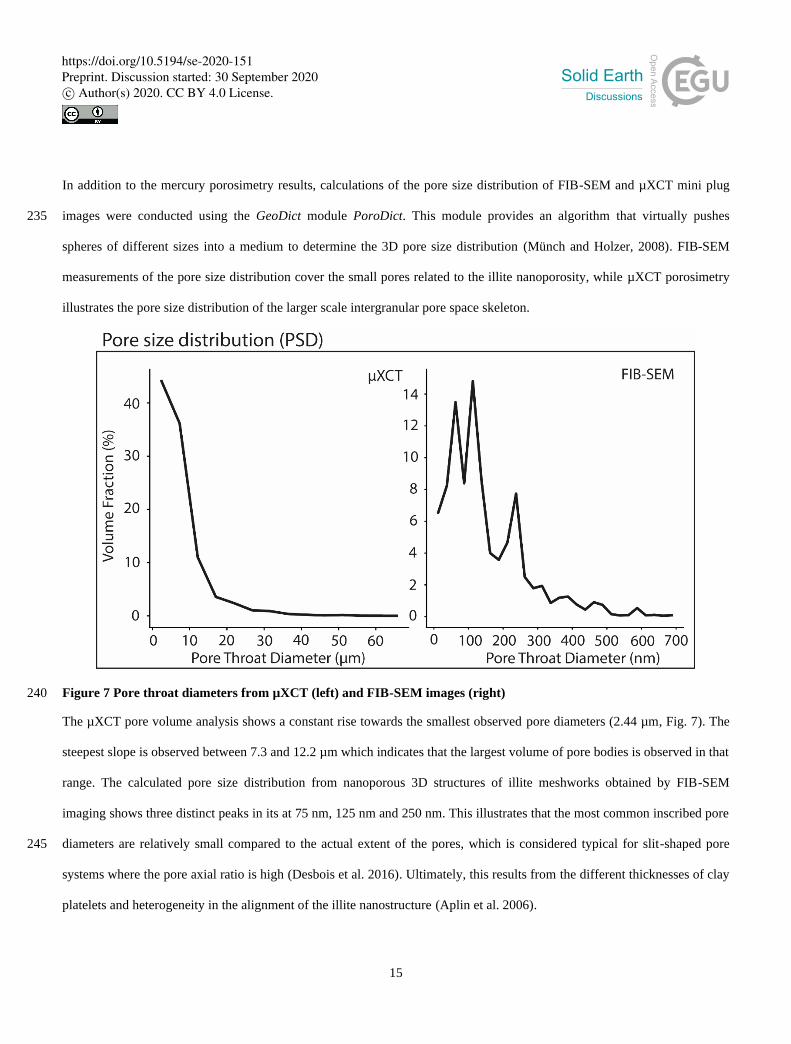
In addition to the mercury porosimetry results, calculations of the pore size distribution of FIB-SEM and µXCT mini plug
images were conducted using the GeoDict module PoroDict. This module provides an algorithm that virtually pushes 235
spheres of different sizes into a medium to determine the 3D pore size distribution (Münch and Holzer, 2008). FIB-SEM
measurements of the pore size distribution cover the small pores related to the illite nanoporosity, while µXCT porosimetry
illustrates the pore size distribution of the larger scale intergranular pore space skeleton.
Figure 7 Pore throat diameters from µXCT (left) and FIB-SEM images (right) 240
The µXCT pore volume analysis shows a constant rise towards the smallest observed pore diameters (2.44 µm, Fig. 7). The
steepest slope is observed between 7.3 and 12.2 µm which indicates that the largest volume of pore bodies is observed in that
range. The calculated pore size distribution from nanoporous 3D structures of illite meshworks obtained by FIB-SEM
imaging shows three distinct peaks in its at 75 nm, 125 nm and 250 nm. This illustrates that the most common inscribed pore
diameters are relatively small compared to the actual extent of the pores, which is considered typical for slit-shaped pore 245
systems where the pore axial ratio is high (Desbois et al. 2016). Ultimately, this results from the different thicknesses of clay
platelets and heterogeneity in the alignment of the illite nanostructure (Aplin et al. 2006).
https://doi.org/10.5194/se-2020-151Preprint. Discussion started: 30 September 2020c© Author(s) 2020. CC BY 4.0 License.
16
An apparent gap exists between diameters observed by MIP and 3D imaging with FIB-SEM and µXCT. While MIP peaks at
around 1 µm, diameters observed by µXCT start at 2.4 µm and the largest inscribed diameters observed by FIB-SEM are
below 700 nm. However, it must be noted that pressure-controlled MIP generally gives information about the number of 250
pore throats whereas pore size distributions provided by imaging techniques give information about pore body volumes
(Zhao et al. 2015). Furthermore, pore shielding may cause an underestimation of larger pores for MIP (Abell et al. 1999;
Gane et al. 2004). The occurrence of authigenic illites is the likely cause of this effect as they are commonly found in pore
throat areas. Since the Washburn equation assumes ideal pore throats of cylindrical shape, the underestimation of larger
pores becomes more evident with the increasing complexity of the pore throat system at both the mm and nm scale 255
(Washburn, 1921). Therefore, a direct comparison between the used methods is unlikely to result in compatible results.
4.2 Permeability simulation
A calculated isotropic permeability of 2.5 ∙ 10−18 𝑚2 was used for the microporous domains based on the Navier-Stokes
fluid-flow simulations of permeability of FIB-SEM scans of the illite meshworks. The number of porous voxels resulting
from clay mineral modelling ranges between 3.3 vol.-% and 7.1 vol.-% of the total structure volume for all considered µXCT 260
scans. A comparison of the modelled clay minerals in µXCT scans with XRD mass balancing highlights a large difference
between the measured mineral abundances (Table 2, EDX analysis).
Table 2: Modelled clay mineral content within the microporous domains in µXCT scans
C3 D2 D9 E9 F7 G2 G8 H9 I3 I9 J3 J7 Mean
Standard
deviation
(±1σ)
Clay mineral
content (vol.-
%)
4.7 3.3 5.0 5.4 7.1 5.0 6.0 6.3 4.1 6.2 6.2 6.1 5.4 1.0
While the mean amount of clay minerals based on XRD measurements was 12.7 wt.-% (about 11.3 vol.-% within a structure 265
with 8 % porosity), an average amount of 5.4 vol.-% was modelled by the distance map algorithm. This is expected since the
illite content inside grains was not modelled since it has no effect on permeability. We simulated permeability of 12 mini
plug samples that were scanned by µXCT and compared them with measurements from gas permeameter experiments. As a
https://doi.org/10.5194/se-2020-151Preprint. Discussion started: 30 September 2020c© Author(s) 2020. CC BY 4.0 License.

17
first step, we extracted and illustrated the ten and hundred largest open flow paths through the pore space of all mini plug
cores before the modelling of the microporous domains (Fig. 8). This yields information concerning the heterogeneity of the 270
flow fields and allows to check the validity of the Navier-Stokes simulations. Structures with flow impignement often cause
numerical problems which results in an artificial underestimation of the permeability simulations. Significant
underestimations of permeability after clay mineral modelling were also found in areas where the percolation paths in the
samples were limited to a few voxels in the structure before modelling. This effect leads to an artificial permeability drop,
which renders calculations to be less precise. Since evenly distributed flow paths are necessary to determine the true 275
permeability of a volume of a rock, we considered only permeability calculations of samples which show no flow
impingement for modelling (Bear, 1972; Leu et al. 2014; Zhang et al. 2000).
Figure 8 Comparison of percolation paths in two µXCT reconstructions of the 3D imaging data without microporous
domain modelling (A) Well distributed percolation paths in a µXCT reconstruction of mini plug sample E9 without 280
microporous domain modelling. (B) Constricted percolation paths with flow impingement limited to a small region of
the structure in mini plug sample I3 without microporous domain modelling. The ten largest percolation paths are
coloured in purple, the hundred largest percolation paths are coloured in cyan.
285
https://doi.org/10.5194/se-2020-151Preprint. Discussion started: 30 September 2020c© Author(s) 2020. CC BY 4.0 License.
18
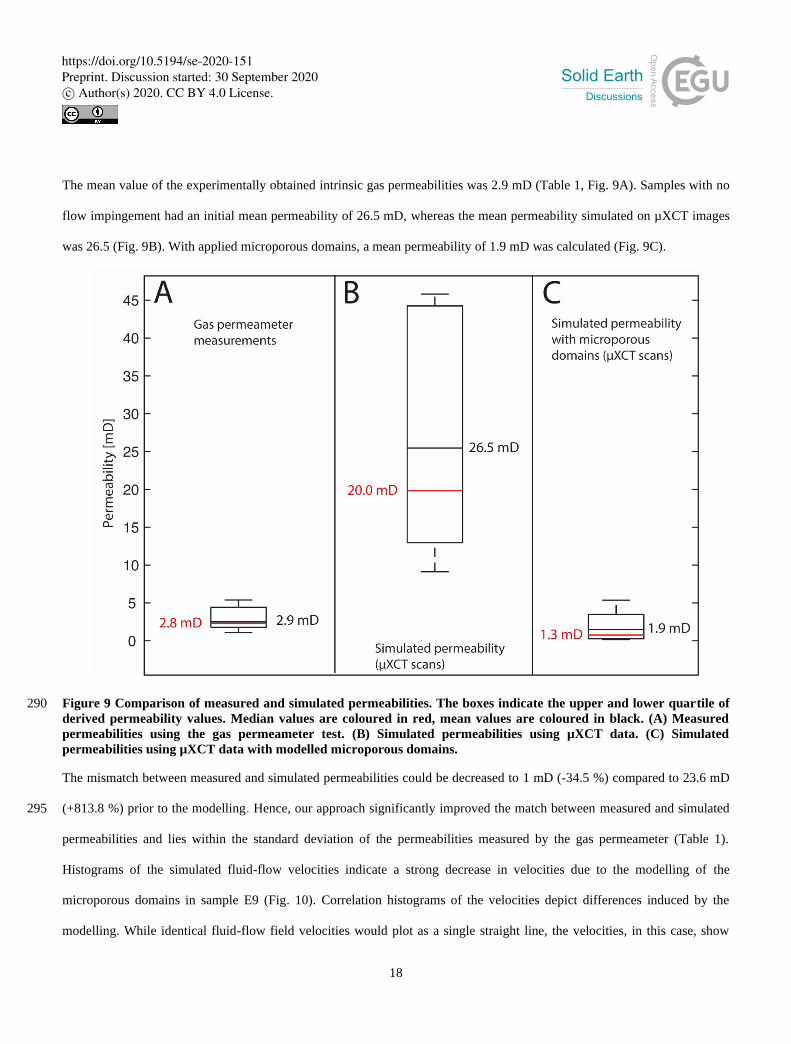
The mean value of the experimentally obtained intrinsic gas permeabilities was 2.9 mD (Table 1, Fig. 9A). Samples with no
flow impingement had an initial mean permeability of 26.5 mD, whereas the mean permeability simulated on µXCT images
was 26.5 (Fig. 9B). With applied microporous domains, a mean permeability of 1.9 mD was calculated (Fig. 9C).
Figure 9 Comparison of measured and simulated permeabilities. The boxes indicate the upper and lower quartile of 290
derived permeability values. Median values are coloured in red, mean values are coloured in black. (A) Measured
permeabilities using the gas permeameter test. (B) Simulated permeabilities using µXCT data. (C) Simulated
permeabilities using µXCT data with modelled microporous domains.
The mismatch between measured and simulated permeabilities could be decreased to 1 mD (-34.5 %) compared to 23.6 mD
(+813.8 %) prior to the modelling. Hence, our approach significantly improved the match between measured and simulated 295
permeabilities and lies within the standard deviation of the permeabilities measured by the gas permeameter (Table 1).
Histograms of the simulated fluid-flow velocities indicate a strong decrease in velocities due to the modelling of the
microporous domains in sample E9 (Fig. 10). Correlation histograms of the velocities depict differences induced by the
modelling. While identical fluid-flow field velocities would plot as a single straight line, the velocities, in this case, show
https://doi.org/10.5194/se-2020-151Preprint. Discussion started: 30 September 2020c© Author(s) 2020. CC BY 4.0 License.

19
straight lines with varying slopes. This indicates a general decrease of the fluid-flow velocities with a splitting of different 300
flow path velocities. Points which plot as a line represent a main fluid-flow path with a direct correlation of the velocities
between the original and the modelled structures flow field. Furthermore, a wider spread of the distribution of high velocities
results from microporous domain modelling. This indicates narrow pore throats where fluid-flow velocities are locally
enhanced compared to the structure before the modelling.
305
Figure 10 Comparison of unmodelled µXCT images and modelled microporous domain images (A). Correlation
histogram prior to and after the modelling that shows a decrease of the main fluid-flow velocities, while few velocities
after the modelling were increased with a wide spread of distribution (B).
Based on our combined analytical and numerical study, further research may help to increase the accuracy of simulated
permeabilities even further. Since isotropic permeabilities of the microporous domains were applied to µXCT images, the 310
accuracy can be improved by taking the anisotropy of clay mineral fabrics and surface topology into account. This can be
done by applying anisotropic permeabilities in the calculation of the microporous domains. While this study showed a good
match between the experimental and simulated permeability, the need to include heterogeneities of clay mineral layering to
improve the simulations was depict in Villiéras et al. (1997).
https://doi.org/10.5194/se-2020-151Preprint. Discussion started: 30 September 2020c© Author(s) 2020. CC BY 4.0 License.
20
5 Conclusions 315
Overall, the outcome of this study shows that combining µXCT and FIB-SEM imaging with numerical models constitutes a
valuable and novel approach for determining physical properties of clay-bearing tight reservoir rocks. Considering the high
number of accessible pores in the scans, the phenomenon of flow impingement was mainly attributed to the unresolvable
nanoporosity. While permeability, which is one of the most important reservoir properties, is often determined by
simulations based on µXCT scans of small samples taken from a field-scale reservoir, we could demonstrate that an accurate 320
estimation for clay-rich and low permeable rocks is only possible if nanoscale porosity is also included. Thus, our
simulations using the Euclidian distance map approach resulted in an improved match with stationary gas permeameter
measurements in contrast to permeability simulations merely based on unmodified µXCT images. Adopting this multi-
method approach, we increased the accuracy of simulated permeabilities of samples measured by µXCT. These results have
important implications for improved modelling of reservoirs relevant to gas and water applications. A realistic simulated 325
permeability of a tight reservoir sandstone could only be achieved by appropriate modelling of the nanoporosity related to
matrix clay minerals (illite) that occur below the µXCT resolution. The simulated permeability based on combined µXCT
and FIB-SEM images and modelled microporous domains showed good agreement with the experimental results. Obtaining
an even distribution of the simulated fluid-flow paths through the sample without flow impingement was necessary to obtain
an accurate permeability estimation from 3D imaging. Resolving the nanopore structure and distribution of clay mineral-330
related features by the combined analytical and numerical modelling approach represents a tool for achieving a more
accurate understanding of the fluid flow behaviour within tight sandstones, with direct relevance to predicting the injection,
storage or extraction of gas or water in a reservoir rock. Our multi-method approach can be applied to determine more
accurate permeability values and flow paths for reservoir rocks with high clay mineral contents if direct experimental
measurements are not successful. Hence, future studies should focus on distinguishing the different morphologies of clay 335
minerals and their related anisotropic effect on rock permeability. While the permeability of the nanoporous structures
depends highly on the layering of the clays and their spatial orientation on the grain surfaces and within feldspars. This
approach should include a variety of various sedimentological facies also with high porosity and permeability investigating
whether clay mineral modelling is also a valid tool for such sedimentary rocks.
https://doi.org/10.5194/se-2020-151Preprint. Discussion started: 30 September 2020c© Author(s) 2020. CC BY 4.0 License.
21
Appendices 340
Figure A1 XRD analysis of the main minerals in the plugs based on Rietveld calculations, determined for several
samples of facies A to J of the sandstone block.
https://doi.org/10.5194/se-2020-151Preprint. Discussion started: 30 September 2020c© Author(s) 2020. CC BY 4.0 License.
22
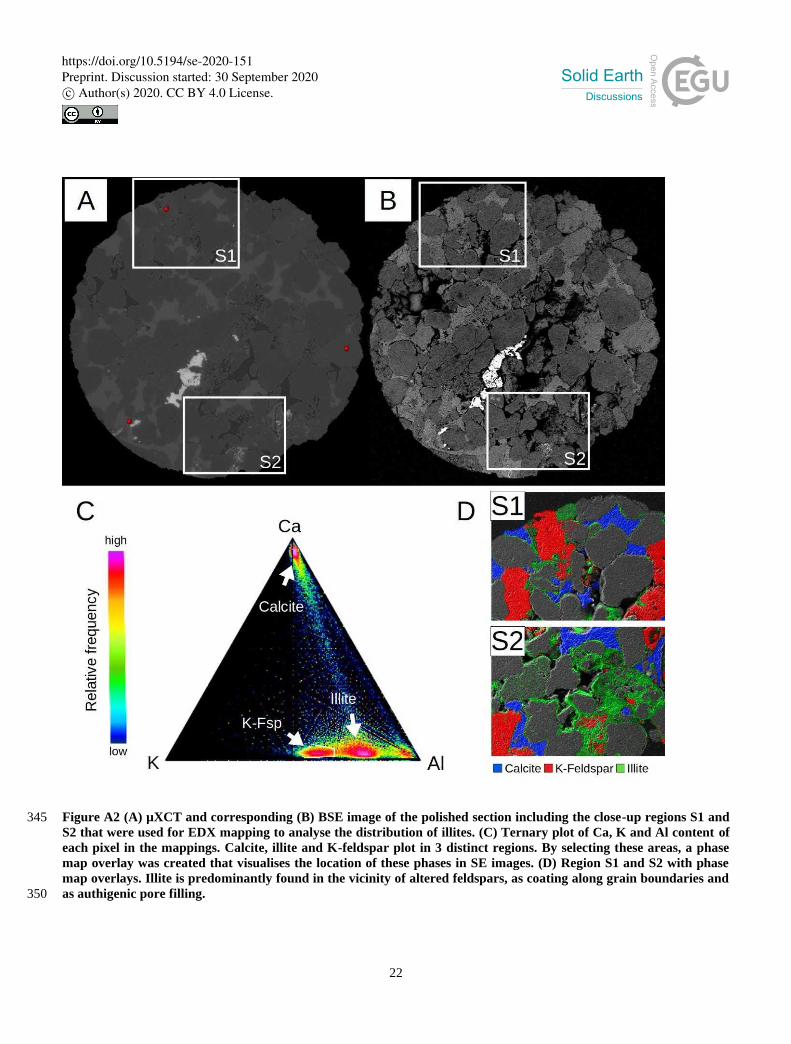
Figure A2 (A) µXCT and corresponding (B) BSE image of the polished section including the close-up regions S1 and 345
S2 that were used for EDX mapping to analyse the distribution of illites. (C) Ternary plot of Ca, K and Al content of
each pixel in the mappings. Calcite, illite and K-feldspar plot in 3 distinct regions. By selecting these areas, a phase
map overlay was created that visualises the location of these phases in SE images. (D) Region S1 and S2 with phase
map overlays. Illite is predominantly found in the vicinity of altered feldspars, as coating along grain boundaries and
as authigenic pore filling. 350
https://doi.org/10.5194/se-2020-151Preprint. Discussion started: 30 September 2020c© Author(s) 2020. CC BY 4.0 License.
23
Author contribution
Conceptualization, A.J., M.P., S.H., F.E., L.N.W., G.G., P.B. and M.K., Methodology, A.J. and M.P., Software, A.J., M.P.,
F.E., Validation, A.J., M.P., S.H., F.E., L.N.W., G.G., P.B. and M.K., Formal analysis, A.J. and M.P., Investigation, A.J., 355
M.P., S.H., and O.M., Resources, F.E., L.N.W., G.G., P.B. and M.K., Data curation, A.J., M.P., S.H., F.E., O.M., L.N.W.,
G.G., P.B., M.K., Writing – Original Draft, A.J., Writing – Review & Editing, A.J., M.P., S.H., F.E., O.M., L.N.W., G.G.,
P.B., M.K., Visualization, A.J. and M.P., Supervision, F.E., L.N.W., G.G., P.B. and M.K., Project Administration, F.E.,
L.N.W., G.G., P.B. and M.K., Funding Acquisition, F.E., L.N.W., G.G., P.B. and M.K.
360
Competing interests
The authors declare that they have no conflict of interest.
Acknowledgements
This work was supported by the German Federal Ministry of Education and Research (BMBF) “Geological Research for
Sustainability (GEO:N)” program, which is part of the BMBF “Research for Sustainable Development (FONA3)” 365
framework program. It is part of the project ResKin (Reaction kinetics in reservoir rocks, 03G0871E). We would like to
thank Fabian Wilde and the staff of PETRA synchrotron facility at DESY Hamburg for their assistance at the imaging
beamline P05. Jens Hornung and Meike Hintze from the TU Darmstadt are also acknowledged for enabling us gas
permeability measurements of the studied samples.
370
References
Abell, A. B., Willis, K. L. and Lange, D. A.: Mercury Intrusion Porosimetry and Image Analysis of Cement-Based
Materials, Journal of Colloid and Interface Science, 211(1), 39–44, doi:10.1006/jcis.1998.5986, 1999.
Ahmad, K. M., Kristaly, F. and Docs, R.: Effects of clay mineral and physico-chemical variables on sandstone rock
permeability, edited by Z. Turzo, jogps, 1(1), 18–26, doi:10.30881/jogps.00006, 2018. 375
Alyafei, N., Raeini, A. Q., Paluszny, A. and Blunt, M. J.: A Sensitivity Study of the Effect of Image Resolution on Predicted
Petrophysical Properties, Transp Porous Med, 110(1), 157–169, doi:10.1007/s11242-015-0563-0, 2015.
Andrä, H., Combaret, N., Dvorkin, J., Glatt, E., Han, J., Kabel, M., Keehm, Y., Krzikalla, F., Lee, M., Madonna, C., Marsh,
M., Mukerji, T., Saenger, E. H., Sain, R., Saxena, N., Ricker, S., Wiegmann, A. and Zhan, X.: Digital rock physics
benchmarks—Part I: Imaging and segmentation, Computers & Geosciences, 50, 25–32, doi:10.1016/j.cageo.2012.09.005, 380
2013a.
https://doi.org/10.5194/se-2020-151Preprint. Discussion started: 30 September 2020c© Author(s) 2020. CC BY 4.0 License.

24
Andrä, H., Combaret, N., Dvorkin, J., Glatt, E., Han, J., Kabel, M., Keehm, Y., Krzikalla, F., Lee, M., Madonna, C., Marsh,
M., Mukerji, T., Saenger, E. H., Sain, R., Saxena, N., Ricker, S., Wiegmann, A. and Zhan, X.: Digital rock physics
benchmarks—part II: Computing effective properties, Computers & Geosciences, 50, 33–43,
doi:10.1016/j.cageo.2012.09.008, 2013b. 385
Aplin, A. C., Matenaar, I. F., McCarty, D. K. and van der Pluijm, B. A.: Influence of mechanical compaction and clay
mineral diagenesis on the microfabric and pore-scale properties of deep-water Gulf of Mexico mudstones, Clays Clay
Miner., 54(4), 500–514, doi:10.1346/CCMN.2006.0540411, 2006.
Bear, J.: Dynamics of fluids in porous media, American Elsevier Pub. Co, New York., 1972.
Berg, S., Saxena, N., Shaik, M. and Pradhan, C.: Generation of ground truth images to validate micro-CT image-processing 390
pipelines, The Leading Edge, 37(6), 412–420, doi:10.1190/tle37060412.1, 2018.
Berg, S., Kutra, D., Kroeger, T., Straehle, C. N., Kausler, B. X., Haubold, C., Schiegg, M., Ales, J., Beier, T., Rudy, M.,
Eren, K., Cervantes, J. I., Xu, B., Beuttenmueller, F., Wolny, A., Zhang, C., Koethe, U., Hamprecht, F. A. and Kreshuk, A.:
ilastik: interactive machine learning for (bio)image analysis, Nat Methods, doi:10.1038/s41592-019-0582-9, 2019.
Brinkman, H. C.: Calculations on the flow of heterogeneous mixtures through porous media, Appl. Sci. Res., 1(1), 333, 395
doi:10.1007/BF02120339, 1949.
Brunke, O., Brockdorf, K., Drews, S., Müller, B., Donath, T., Herzen, J. and Beckmann, F.: Comparison between x-ray tube-
based and synchrotron radiation-based μCT, edited by S. R. Stock, p. 70780U, San Diego, California, USA., 2008.
Buades, A., Coll, B. and Morel, J.-M.: Non-Local Means Denoising, Image Processing On Line, 1,
doi:10.5201/ipol.2011.bcm_nlm, 2011. 400
Darcy, H.: Les Fontaines Publiques de la Ville de Dijon, Dalmont, 1856.
De Boever, W., Derluyn, H., Van Loo, D., Van Hoorebeke, L. and Cnudde, V.: Data-fusion of high resolution X-ray CT,
SEM and EDS for 3D and pseudo-3D chemical and structural characterization of sandstone, Micron, 74, 15–21,
doi:10.1016/j.micron.2015.04.003, 2015.
Desbois, G., Urai, J. L., Hemes, S., Schröppel, B., Schwarz, J.-O., Mac, M. and Weiel, D.: Multi-scale analysis of porosity in 405
diagenetically altered reservoir sandstone from the Permian Rotliegend (Germany), Journal of Petroleum Science and
Engineering, 140, 128–148, doi:10.1016/j.petrol.2016.01.019, 2016.
Doebelin, N. and Kleeberg, R.: Profex : a graphical user interface for the Rietveld refinement program BGMN, J Appl
Crystallogr, 48(5), 1573–1580, doi:10.1107/S1600576715014685, 2015.
Filomena, C. M., Hornung, J. and Stollhofen, H.: Assessing accuracy of gas-driven permeability measurements: a 410
comparative study of diverse Hassler-cell and probe permeameter devices, Solid Earth, 5(1), 1–11, doi:10.5194/se-5-1-2014,
2014.
Fischer, C., Dunkl, I., Von Eynatten, H., Wijbrans, J. R. and Gaupp, R.: Products and timing of diagenetic processes in
Upper Rotliegend sandstones from Bebertal (North German Basin, Parchim Formation, Flechtingen High, Germany), Geol.
Mag., 149(5), 827–840, doi:10.1017/S0016756811001087, 2012. 415
https://doi.org/10.5194/se-2020-151Preprint. Discussion started: 30 September 2020c© Author(s) 2020. CC BY 4.0 License.

25
Gane, P. A. C., Ridgway, C. J., Lehtinen, E., Valiullin, R., Furó, I., Schoelkopf, J., Paulapuro, H. and Daicic, J.: Comparison
of NMR Cryoporometry, Mercury Intrusion Porosimetry, and DSC Thermoporosimetry in Characterizing Pore Size
Distributions of Compressed Finely Ground Calcium Carbonate Structures, Ind. Eng. Chem. Res., 43(24), 7920–7927,
doi:10.1021/ie049448p, 2004.
Gao, H. and Li, H. A.: Pore structure characterization, permeability evaluation and enhanced gas recovery techniques of tight 420
gas sandstones, Journal of Natural Gas Science and Engineering, 28, 536–547, doi:10.1016/j.jngse.2015.12.018, 2016.
Gluyas, J. G. and Swarbrick, R. E.: Petroleum geoscience, Blackwell Pub, Malden, MA., 2004.
Guan, K. M., Nazarova, M., Guo, B., Tchelepi, H., Kovscek, A. R. and Creux, P.: Effects of Image Resolution on Sandstone
Porosity and Permeability as Obtained from X-Ray Microscopy, Transp Porous Med, 127(1), 233–245, doi:10.1007/s11242-
018-1189-9, 2019. 425
Heidsiek, M., Butscher, C., Blum, P. and Fischer, C.: Small-scale diagenetic facies heterogeneity controls porosity and
permeability pattern in reservoir sandstones., Environmental Earth Sciences, doi:10.1007/s12665-020-09168-z, 2020.
Hemes, S., Desbois, G., Urai, J. L., Schröppel, B. and Schwarz, J.-O.: Multi-scale characterization of porosity in Boom Clay
(HADES-level, Mol, Belgium) using a combination of X-ray μ-CT, 2D BIB-SEM and FIB-SEM tomography, Microporous
and Mesoporous Materials, 208, 1–20, doi:10.1016/j.micromeso.2015.01.022, 2015. 430
Iliev, O. and Laptev, V.: On numerical simulation of flow through oil filters, Comput Visual Sci, 6(2–3), 139–146,
doi:10.1007/s00791-003-0118-8, 2004.
Jiang, S.: Clay Minerals from the Perspective of Oil and Gas Exploration, in Clay Minerals in Nature - Their
Characterization, Modification and Application, edited by M. Valaskova, InTech., 2012.
Kessler, R. M., Ellis, J. R. and Eden, M.: Analysis of Emission Tomographic Scan Data: Limitations Imposed by Resolution 435
and Background:, Journal of Computer Assisted Tomography, 8(3), 514–522, doi:10.1097/00004728-198406000-00028,
1984.
Ketcham, R. A. and Carlson, W. D.: Acquisition, optimization and interpretation of X-ray computed tomographic imagery:
applications to the geosciences, Computers & Geosciences, 27(4), 381–400, doi:10.1016/S0098-3004(00)00116-3, 2001.
Khan, F., Enzmann, F. and Kersten, M.: Multi-phase classification by a least-squares support vector machine approach in 440
tomography images of geological samples, Solid Earth, 7(2), 481–492, doi:10.5194/se-7-481-2016, 2016.
Kling, T., Vogler, D., Pastewka, L., Amann, F. and Blum, P.: Numerical Simulations and Validation of Contact Mechanics
in a Granodiorite Fracture, Rock Mech Rock Eng, 51(9), 2805–2824, doi:10.1007/s00603-018-1498-x, 2018.
Klinkenberg, L. J.: The permeability of porous Media to liquids and gases, 1941.
Leu, L., Berg, S., Enzmann, F., Armstrong, R. T. and Kersten, M.: Fast X-ray Micro-Tomography of Multiphase Flow in 445
Berea Sandstone: A Sensitivity Study on Image Processing, Transp Porous Med, 105(2), 451–469, doi:10.1007/s11242-014-
0378-4, 2014.
https://doi.org/10.5194/se-2020-151Preprint. Discussion started: 30 September 2020c© Author(s) 2020. CC BY 4.0 License.

26
Linden, S., Wiegmann, A. and Hagen, H.: The LIR space partitioning system applied to the Stokes equations, Graphical
Models, 82, 58–66, doi:10.1016/j.gmod.2015.06.003, 2015.
Lindquist, W. B., Venkatarangan, A., Dunsmuir, J. and Wong, T.: Pore and throat size distributions measured from 450
synchrotron X-ray tomographic images of Fontainebleau sandstones, J. Geophys. Res., 105(B9), 21509–21527,
doi:10.1029/2000JB900208, 2000.
Lis-Śledziona, A.: Petrophysical rock typing and permeability prediction in tight sandstone reservoir, Acta Geophys., 67(6),
1895–1911, doi:10.1007/s11600-019-00348-5, 2019.
Liu, G., Bai, Y., Fan, Z. and Gu, D.: Determination of Klinkenberg Permeability Conditioned to Pore-Throat Structures in 455
Tight Formations, Energies, 10(10), 1575, doi:10.3390/en10101575, 2017.
Markussen, Ø., Dypvik, H., Hammer, E., Long, H. and Hammer, Ø.: 3D characterization of porosity and authigenic
cementation in Triassic conglomerates/arenites in the Edvard Grieg field using 3D micro-CT imaging, Marine and Petroleum
Geology, 99, 265–281, doi:10.1016/j.marpetgeo.2018.10.015, 2019.
Maurer, C. R., Rensheng Qi and Raghavan, V.: A linear time algorithm for computing exact Euclidean distance transforms 460
of binary images in arbitrary dimensions, IEEE Trans. Pattern Anal. Machine Intell., 25(2), 265–270,
doi:10.1109/TPAMI.2003.1177156, 2003.
Mayo, S., Josh, M., Nesterets, Y., Esteban, L., Pervukhina, M., Clennell, M. B., Maksimenko, A. and Hall, C.: Quantitative
micro-porosity characterization using synchrotron micro-CT and xenon K-edge subtraction in sandstones, carbonates, shales
and coal, Fuel, 154, 167–173, doi:10.1016/j.fuel.2015.03.046, 2015. 465
Menke, H., Gao, Y., Linden, S. and Andrew, M.: Using nano-XRM and high-contrast imaging to inform micro-porosity
permeability during Stokes-Brinkman single and two-phase flow simulations on micro-CT images, preprint, EarthArXiv.,
2019.
Moosmann, J., Ershov, A., Weinhardt, V., Baumbach, T., Prasad, M. S., LaBonne, C., Xiao, X., Kashef, J. and Hofmann, R.:
Time-lapse X-ray phase-contrast microtomography for in vivo imaging and analysis of morphogenesis, Nat Protoc, 9(2), 470
294–304, doi:10.1038/nprot.2014.033, 2014.
Moulinec, H. and Suquet, P.: A FFT-Based Numerical Method for Computing the Mechanical Properties of Composites
from Images of their Microstructures, in IUTAM Symposium on Microstructure-Property Interactions in Composite
Materials, vol. 37, edited by R. Pyrz, pp. 235–246, Springer Netherlands, Dordrecht., 1995.
Münch, B. and Holzer, L.: Contradicting Geometrical Concepts in Pore Size Analysis Attained with Electron Microscopy 475
and Mercury Intrusion, Journal of the American Ceramic Society, 91(12), 4059–4067, doi:10.1111/j.1551-
2916.2008.02736.x, 2008.
Neale, G. and Nader, W.: Practical significance of brinkman’s extension of darcy’s law: Coupled parallel flows within a
channel and a bounding porous medium, Can. J. Chem. Eng., 52(4), 475–478, doi:10.1002/cjce.5450520407, 1974.
Okabe, H. and Blunt, M. J.: Prediction of permeability for porous media reconstructed using multiple-point statistics, Phys. 480
Rev. E, 70(6), 066135, doi:10.1103/PhysRevE.70.066135, 2004.
https://doi.org/10.5194/se-2020-151Preprint. Discussion started: 30 September 2020c© Author(s) 2020. CC BY 4.0 License.

27
Peng, S., Hu, Q., Dultz, S. and Zhang, M.: Using X-ray computed tomography in pore structure characterization for a Berea
sandstone: Resolution effect, Journal of Hydrology, 472–473, 254–261, doi:10.1016/j.jhydrol.2012.09.034, 2012.
Peng, S., Marone, F. and Dultz, S.: Resolution effect in X-ray microcomputed tomography imaging and small pore’s
contribution to permeability for a Berea sandstone, Journal of Hydrology, 510, 403–411, doi:10.1016/j.jhydrol.2013.12.028, 485
2014.
Pittman, E. D. and Thomas, J. B.: Some Applications of Scanning Electron Microscopy to the Study of Reservoir Rock,
Journal of Petroleum Technology, 31(11), 1375–1380, doi:10.2118/7550-PA, 1979.
Prill, T., Schladitz, K., Jeulin, D., Faessel, M. and Wieser, C.: Morphological segmentation of FIB-SEM data of highly
porous media: MORPHOLOGICAL SEGMENTATION OF FIB-SEM DATA OF HIGHLY POROUS MEDIA, Journal of 490
Microscopy, 250(2), 77–87, doi:10.1111/jmi.12021, 2013.
Saxena, N., Hofmann, R., Alpak, F. O., Berg, S., Dietderich, J., Agarwal, U., Tandon, K., Hunter, S., Freeman, J. and
Wilson, O. B.: References and benchmarks for pore-scale flow simulated using micro-CT images of porous media and
digital rocks, Advances in Water Resources, 109, 211–235, doi:10.1016/j.advwatres.2017.09.007, 2017.
Saxena, N., Hows, A., Hofmann, R., O. Alpak, F., Freeman, J., Hunter, S. and Appel, M.: Imaging and computational 495
considerations for image computed permeability: Operating envelope of Digital Rock Physics, Advances in Water
Resources, 116, 127–144, doi:10.1016/j.advwatres.2018.04.001, 2018.
Shah, S. M., Gray, F., Crawshaw, J. P. and Boek, E. S.: Micro-computed tomography pore-scale study of flow in porous
media: Effect of voxel resolution, Advances in Water Resources, 95, 276–287, doi:10.1016/j.advwatres.2015.07.012, 2016.
Soulaine, C., Gjetvaj, F., Garing, C., Roman, S., Russian, A., Gouze, P. and Tchelepi, H. A.: The Impact of Sub-Resolution 500
Porosity of X-ray Microtomography Images on the Permeability, Transp Porous Med, 113(1), 227–243, doi:10.1007/s11242-
016-0690-2, 2016.
Spanne, P., Thovert, J. F., Jacquin, C. J., Lindquist, W. B., Jones, K. W. and Adler, P. M.: Synchrotron Computed
Microtomography of Porous Media: Topology and Transports, Phys. Rev. Lett., 73(14), 2001–2004,
doi:10.1103/PhysRevLett.73.2001, 1994. 505
Ufer, K., Kleeberg, R., Bergmann, J. and Dohrmann, R.: Rietveld Refinement of Disordered Illite-Smectite Mixed-Layer
Structures by a Recursive Algorithm. II: Powder-Pattern Refinement and Quantitative Phase Analysis, Clays Clay Miner.,
60(5), 535–552, doi:10.1346/CCMN.2012.0600508, 2012.
Villiéras, F., Michot, L. J., Bardot, F., Cases, J. M., François, M. and Rudziński, W.: An Improved Derivative Isotherm
Summation Method To Study Surface Heterogeneity of Clay Minerals †, Langmuir, 13(5), 1104–1117, 510
doi:10.1021/la9510083, 1997.
Washburn, E. W.: The Dynamics of Capillary Flow, Phys. Rev., 17(3), 273–283, doi:10.1103/PhysRev.17.273, 1921.
Wilson, M. D. and Pittman, E. D.: Authigenic Clays in Sandstones: Recognition and Influence on Reservoir Properties and
Paleoenvironmental Analysis, SEPM JSR, Vol. 47, doi:10.1306/212F70E5-2B24-11D7-8648000102C1865D, 1977.
https://doi.org/10.5194/se-2020-151Preprint. Discussion started: 30 September 2020c© Author(s) 2020. CC BY 4.0 License.
28
Worden, R. H. and Morad, S.: Clay Minerals in Sandstones: Controls on Formation, Distribution and Evolution, in Clay 515
Mineral Cements in Sandstones, edited by R. H. Worden and S. Morad, pp. 1–41, Blackwell Publishing Ltd., Oxford, UK.,
1999.
Yoon, H. and Dewers, T. A.: Nanopore structures, statistically representative elementary volumes, and transport properties
of chalk: NANOPORE STRUCTURES, SREV, AND FIB-SEM, Geophys. Res. Lett., 40(16), 4294–4298,
doi:10.1002/grl.50803, 2013. 520
Zhang, D., Zhang, R., Chen, S. and Soll, W. E.: Pore scale study of flow in porous media: Scale dependency, REV, and
statistical REV, Geophys. Res. Lett., 27(8), 1195–1198, doi:10.1029/1999GL011101, 2000.
Zhao, H., Ning, Z., Wang, Q., Zhang, R., Zhao, T., Niu, T. and Zeng, Y.: Petrophysical characterization of tight oil
reservoirs using pressure-controlled porosimetry combined with rate-controlled porosimetry, Fuel, 154, 233–242,
doi:10.1016/j.fuel.2015.03.085, 2015. 525
https://doi.org/10.5194/se-2020-151Preprint. Discussion started: 30 September 2020c© Author(s) 2020. CC BY 4.0 License.