simply clever - skoda auto
TRANSCRIPT

Simply clever
ŠKODA Annual Report 2011
ŠKODA AUTO a.s.

ŠKODA AUTO Group – Deliveries to customers year-on-year
2011
2010
879,184
762,600
+ 15.3%
252,562
219,454
ŠKODA AUTO Group – Sales revenues year-on-year (CZK million)
2011
2010
252,562
219,454
+ 15.1%
18,257
11,316
ŠKODA AUTO Group – Operating result year-on-year (CZK million)
2011
2010
18,257
11,316
+ 61.3%
ŠKODA AUTO Group – Number of employees year-on-year*
2011
2010
* Number of employees as at 31 December excl. temporary staff, incl. apprentices.
+ 7,5 % 26,565
24,714
+ 7.5%

Company Overview
ŠKODA AUTO, based in Mladá Boleslav in the Czech Republic, is
one of the world’s longest-standing automobile manufacturers.
The tradition of the Company dates back to 1895, when Václav
Laurin and Václav Klement formed a partnership that laid the
foundation for over 100 years of Czech expertise in automotive
engineering.
The ŠKODA brand has been a Volkswagen Group brand for 20
years. During this time, the ŠKODA AUTO Group’s sales have more
than tripled and its product portfolio has expanded significantly.
Today, ŠKODA AUTO employs more than 26,500 people world-
wide.
The ŠKODA AUTO Group has production facilities in the Czech Re-
public and India. Furthermore, ŠKODA cars are produced in China,
Russia, Slovakia, the Ukraine and Kazakhstan.
This international presence will form the basis for the Group’s
planned growth over the next few years. The conditions for this
are already in place: impressive automobiles, a strong brand, a
motivated and capable team and the ability to turn innovations
into Simply clever customer benefits.

2 Annual Report 2011
Contents
10
18
20
22
When head meets heart MissionL – the tale behind the birth of a new car
4Foreword by the Chairman of the Board of Management
8 Board of Management
Partnership with prospects Volkswagen and ŠKODA celebrate the 20th anniversary of their alliance
Sending a clear messageZurich opens the first showroom in the new corporate design
Seeking the best Human resources planning in times of international growth
2011 – a year of records, of special anniversaries, but above all, a year of success for ŠKODA AUTO. The Company’s success took many dif-ferent forms, but always came from its quest for smart solutions defined by the brand’s signature “Human Touch”. That is ŠKODA – Simply clever.
57 Management Report
103 Financial Section
How to use QR Codes: To fully utilise QR codes, you will need a mobile phone with a camera, QR code-reading software and access to the internet.
Point your mobile phone at the QR code and take a picture. The QR code will decode instantly and you will be directed to the respective webpage.

3
25 40
30 42
34 46
38 48
The year in review Highlights of a very successful year
Awards 2011 ŠKODA automobiles earn international recognition
Pure energy The ŠKODA Octavia Green E line test fleet – the next step towards emission-free mobility
Product portfolio All model lines at a glance
Faster than ever ŠKODA Motorsport – now and then
Go, Citigo!The smallest ŠKODA makes its debut
Chasing records Sponsorship puts ŠKODA in the Guinness Book of Records
Embarking on a new era The biggest dealer conference ever

4 Annual Report 2011
Prof. Dr. h.c. Winfried VahlandChairman of the Board of Management
5Annual Report 2011
Foreword
ŠKODA AUTO once again demonstrated its high level of performance in 2011. We rigor-ously implemented the first year of our growth strategy and were able to pick up the pace significantly. We met and, in many cases, even exceeded, the ambitious goals we had set ourselves for this year.
Our cars are in demand worldwide: In 2011, we delivered 879,184 vehicles to our cus-tomers around the world – the highest number of deliveries ever in the history of our Company. We outperformed the overall market in all regions, especially Asia and Eastern Europe. Our market share is increasing. We also achieved new revenue and earnings highs in 2011. With our extensive investment in the expansion of our production capa-cities, we are setting the right course for the future. All of this proves that ŠKODA AUTO is on track for success!
We are therefore well on our way to realising our major goal for 2018: By then, we are aiming for annual sales of more than 1.5 million vehicles. We are vigorously implementing our successful growth strategy to achieve this. At the same time, we are also constantly working to enhance our efficiency. Becoming even more efficient will enable us to com-pete at a global level and, above all, exploit opportunities in growth markets.
We will do this in typical ŠKODA fashion: Our “Simply clever” brand claim defines the whole Company. Our automobiles have always stood for clever solutions with our signa-ture “Human Touch” – in the future, the same will apply to all our processes and activities.
Our customers can experience the “Human Touch” approach in many different ways. The automobiles we produce embody the classic virtues of the ŠKODA brand: spacious-ness, top-quality workmanship, maximum driveability and outstanding value for money. In other words, they are cars built for people!

6 Annual Report 2011
Over the next few years, we aim to expand our product offering to target new seg-ments, new markets and new customers. We already have a concrete example of this today – the ŠKODA Citigo, the car that launched our model offensive. In the coming years, we will present a new model on average every six months.
We also introduced the ŠKODA Rapid in India in late 2011. This car was specially designed for the Indian market and is manufactured locally in Pune. This marks an important step in our growth strategy, since ŠKODA is now represented in one of the largest vehicle segments in the Indian market.
The ŠKODA model offensive will continue in 2012 with our new compact sedan. We pre-sented a production-ready concept of this vehicle, the MissionL, at the 2011 IAA Frank-furt Motor Show. The series-production vehicle will be introduced onto major interna-tional markets in 2012 and will fill out the ŠKODA product range between the existing ŠKODA Fabia and ŠKODA Octavia models.
In response to growing demand for the ŠKODA Yeti, we are expanding production of this model to Russia and China. In the future, the ŠKODA Yeti will be built at the plant of our Russian partner GAZ in Nizhny Novgorod. In 2013, we will also begin manufacturing this highly-successful model in China, further stepping up the pace in our largest market.
We aim to continue strengthening our position in our core European markets. Our new corporate design will help us to achieve this. It brings a breath of fresh air into our showrooms and defines our entire visual presentation. I am sure our customers will like it, too. The reason why I am so confident is the overwhelmingly positive response of the 5,000 dealers we presented the new design to at our largest-ever dealer conference in Prague in the first half of 2011.
Companies who want to succeed in global competition must be an attractive employer on an international scale. We achieved a great deal in this area in 2011. One example is our employer branding film “Curriculum Vitae”, which won the German advertising in-dustry’s Deutsche Werbefilmpreis award in 2011. ŠKODA already attracts plenty of can-didates today – in fact, we received more applications in 2011 than ever before. But we are also pursuing extensive employer branding activities to attract more potential employees to our Company going forward, and in this way secure our long-term growth.
This means working specifically on the future of mobility. We presented the ŠKODA brand’s first pure electric vehicle, the ŠKODA Octavia Green E Line, back in 2010. In late 2011, we took the next step with the launch of a test fleet of ten cars in the Czech

7Annual Report 2011
Republic. This will provide us with key insights into the further development of electric drive trains. We are actively shaping the future of individual mobility – and, therefore, also the future of ŠKODA AUTO.
All of these examples illustrate that 2011 was a special year for ŠKODA AUTO in every respect. It was a year in which we celebrated two important anniversaries.
The first was our 20 years of partnership with the Volkswagen Group: To celebrate this anniversary we threw open our gates and invited people to join us for an “Open House”. More than 75,000 people came to visit the Mladá Boleslav plant and to see for them-selves how our Company has evolved. When ŠKODA first joined Volkswagen, people referred to ŠKODA as “the pearl of the East”. Over the past 20 years, this Company’s employees have really made that pearl shine! The partnership that has grown over the years not only has a strong tradition, but, even more importantly, a promising future. And our future is sustainable growth! We sent a clear message on the very day of our anni-versary celebrations with a ground-breaking ceremony for the expansion of production capacity for the ŠKODA Octavia at our main Mladá Boleslav plant.
The second anniversary we celebrated in 2011 looked back even further: It marked 110 years of ŠKODA’s involvement in motorsports. The ŠKODA team brought home the best anniversary present of all, with impressive victories in the IRC and SWRC world cham-pionship. The connection between motorsports and ŠKODA goes back almost as far as our Company itself. And, rest assured, we will continue to pursue this commitment in the future with the same passion and, I hope, considerable success. You could say that in many ways ŠKODA’s heart belongs to motorsports. Our successes in this field also represent the energy and optimism that characterises our Company at this time.
Once again, we have ambitious plans for 2012, and are focusing our efforts on expand-ing our model line-up. We will leverage our global presence, and our extensive invest-ments will create the conditions necessary for further growth. We will do everything we can to be an attractive employer and recruit the best talents for our Company – because, ultimately, people are what make the decisive difference!
Yours
Prof. Dr. h.c. Winfried Vahland

8 Annual Report 2011
Dipl.-Betrw. Jürgen StackmannMember of the Board ofManagement for Salesand Marketing
Dipl.-Ing. Karlheinz HellMember of the Board of Managementfor Purchasing
Ing. Bohdan WojnarMember of the Board ofManagement for Human Resources Management
ŠKODA AUTO Board of Management

9Annual Report 2011
Dipl.-Ing. Michael OeljeklausMember of the Boardof Management forProduction and Logistics
Prof. Dr. h.c. Winfried VahlandChairman of the Board ofManagement
Dr.-Ing. Eckhard ScholzMember of the Board ofManagement for TechnicalDevelopment
Dipl.-Kfm. Winfried KrauseMember of the Boardof Management forCommercial Affairs

10 Annual Report 2011

11Annual Report 2011
It all began with a vision of creating a totally new design language
– of defining the key elements of the ŠKODA brand’s future visual
identity. This complex task became a top priority for ŠKODA.
The new design was to forge a link between the past and the fu-
ture of ŠKODA, to interpret the brand’s traditional values in a new
way. At the same time, it must meet the needs of the Company’s
global growth strategy, ensuring that ŠKODA projects a modern,
precise and self-assured image at all times.
When head meets heartMissionL – a new car is born

12 Annual Report 2011
The first step was the presentation of the revolutio nary VisionD concept at the Geneva Motor Show in March 2011. ŠKODA chief designer Jozef Kabaň explains: “The VisionD gives the ŠKODA brand’s ambitious goals a face. It re presents growth with an exciting design that upholds our established virtues, such as high functionality, clarity and precision.” Karl Neuhold, head of exterior design at ŠKODA, refers to the VisionD as “the prototype for a new ŠKODA design”. The public response to the VisionD was encouragingly positive. With its impressively clear and precise lines, the new style concept appeared both powerful and modern. It benefitted from exceptional attention to the not-so-ordinary details, as well as embodying tradi tional ŠKODA values: The long wheel-base with short overhangs ensured generous interior space,
while the dynamic roofline gave the concept a sleek and so-phisticated silhouette. Just six months later, in September 2011 – to the surprise of many auto-industry experts – the production-ready MissionL concept car made its world debut at the IAA International Motor Show in Frankfurt. To develop the MissionL from the VisionD style concept in less than half a year was an amaz-ing achievement. It reflected the strength of the ŠKODA brand and the extraordinary commitment of its employees – many of whom were still working on the MissionL right up to the start of the IAA. Exterior design head Karl Neuhold remembers: “The drive for perfection kept us going until we finally reached the point where the whole team was satisfied with what we had achieved. That was an unforgettable moment for all of us.”
From VisionD to MissionL

13Annual Report 2011
“The MissionL is a prototype for the unique creativity and efficiency of the ŠKODA brand.” Jozef Kabaň, head of Design, ŠKODA AUTO

14 Annual Report 2011
The Company’s growth and internationalisation strategy also places new demands on the design of future ŠKODA vehicles. In February 2011, while the finishing touches were still being added to the VisionD for its premiere in Geneva, work was al-ready getting started on the series-production version, which would become the MissionL. An initial concept for a “show car” in the entry-level A-segment for the IAA in Frankfurt was discussed, and a team of exterior and interior design experts, headed by chief designer Jozef Kabaň, was formed. Interfaces with the technical departments were de-fined and a clay model built. Work began in parallel on a digital model. Even colours and materials were discussed at this stage.
Specifications were drawn up for the new five-door concept sedan: It had to be sporty and elegant in appearance, but, above all, it must embody the key strengths of ŠKODA automo-biles – which meant that high functionality and roominess were a must. However, the biggest challenge lay elsewhere: Despite the constraints imposed by series production, the designers needed to give the MissionL the same emotional appeal that had been so impressive in the VisionD. They had to keep the joy of reduction alive in its purist, minimalist form, clean surfaces and precise lines – in other words: in a contemporary design suitable for today’s world. Chief designer Jozef Kabaň decided to take things a step fur-ther: He wanted the MissionL to showcase not only the more cosmopolitan side of the ŠKODA brand, but also its Czech roots. As a result, the MissionL pays tribute to the Czech Republic’s fine glass-making tradition: The body features three sharply-chiselled lines on each side of the car, close to the rear lights,
which create a smooth triangle evocative of cut-glass – while the headlights use actual lead crystal. Another extra, exclusive to the concept car, is its stained-glass panoramic roof – a one-of-a-kind piece manufactured and assembled with extreme care in collaboration with one of the most celebrated glass manufacturers in Venice. In June 2011, ŠKODA built a prototype of the MissionL. At the same time, a mock-up of the show car was put together for film and photo purposes to avoid unnecessary wear to the costly prototype.The team continued to grow as design experts from Italdesign Giugiaro (IDG) were brought in. The first papers and data were
sent to Turin, where the famous design manufacturer built a show car based on the prototype. With less than two months to go to the IAA in Frankfurt in September, time was running out. But the ŠKODA team and their partners in Italy were used to being creative under pressure. The teams from Mladá Boleslav and Turin worked exceptionally well together, but, despite their meticulous planning, occasional surprises were inevitable and the teams had to think on their feet. Karl Neuhold recalls: “Working together on the MissionL, Czechs and Italians discov-ered that both sides had really good improvisational skills. That was a positive experience that helped us all a lot.” Much of the work required time-consuming manual assembly: For instance, almost 1,000 LEDs were built into the car and body panels cre-ated based on the clay model. At times, double shifts were needed to meet deadlines, with the last shift of the day ending at two o’clock in the morning. The team certainly did a fine job. Thanks to their outstanding efforts, they achieved their goal:
Clear objective – little time

15Annual Report 2011
The MissionL was ready on schedule within six months – in time for its big day at the IAA in Frankfurt.The second phase of the MissionL project soon got under-way. Extensive safety precautions were necessary to bring the costly show car safely to Frankfurt. The presentation of the MissionL on 12 September 2011 went down well with the press and general public. The concept was praised for its clear design, balanced proportions and ample space. It also gave rise to avid speculation about the final name for the model and its likely price. Chairman of the Board of Management Prof Dr. h.c. Winfried Vahland announced the premiere of the series-production vehicle for the Paris Motor Show in Sep-tember 2012. With twelve months to go at that point, crea-tivity and efficiency were called for once again, and ŠKODA employees given another opportunity to show what they can do. One thing is already clear: The outcome will be something to be proud of.
“The MissionL was designed with a clear link to ŠKODA’s history, as well as its relationship with Czech glass craftsmanship and modern architecture.”Jiří Hadaščok, Exterior Design, ŠKODA AUTO
This one-of-a-kind car shows the way for future ŠKODA design: Much of the work on the MissionL was painstakingly performed by hand under considerable time pressure. Nevertheless, the highest level of precision and the greatest attention to every detail were still assured.

16 Annual Report 2011
“The MissionL is an example of how to transfer design visions into a compact-class sedan.”Miroslav Jaskmanicki, Interior Design, ŠKODA AUTO

17Annual Report 2011

18 Annual Report 2011
The Autowelt Zürich showrooms are spacious, modern and customer-friendly in their new ŠKODA design: Jürgen Stackmann, member of the Board of Management for Sales and Marketing (right) and Morten Hannesbo, CEO of AMAG Automobil- und Motoren AG, are delighted with the positive feedback from employees, customers and colleagues.

19Annual Report 2011
ŠKODA’s revamped corporate design sets a new tone at dealerships – and the first new-look ŠKODA showroom opens in Zurich.
Premiere at AMAG RETAIL Autowelt in Zurich, Switzerland on 7 April 2011: The very first ŠKODA showroom in the new corporate design opened at AMAG Automobil- und Motoren AG’s new building in the Zurich suburb of Dübendorf. This special moment was also an important test – because this is where it really counts: Here, at the point-of-sale, the new design must deliver its maximum impact and provide cus-tomers with a clear impression of the ŠKODA brand. The guests all agree: Autowelt Zürich’s generously dimen sio ned, open-plan sales area fits the ultra modern new corporate design perfectly, creating an ideal setting for the presenta-tion of ŠKODA cars. Jürgen Stackmann, member of the Board of Management for Sales and Marketing at ŠKODA AUTO, is pleased with the outcome: “Congratulations to AMAG. I am confident that the new look will be reflected in steadily in-creasing sales figures.” The new design also plays a key role in ŠKODA’s global growth strategy: The new corporate identity symbolises the strength of the brand for dealers and customers, in a way that is youthful, fresh and dynamic. The use of chrome and the fresh new “ŠKODA green” represents the Company’s modern approach and focus on the future. Today, almost a year after opening his new ŠKODA sales-rooms, Roberto Battistini, member of the AMAG Automo-bil- und Motoren AG executive team, can confirm: “Customer and employee response to the new ŠKODA design has been overwhelmingly positive.” From their discussions with cus-tomers, AMAG employees know that the new branding has definitely given ŠKODA a sharper profile. All of the sales as-sociates have experienced for themselves how this creates new opportunities for closer customer contact: “Customers are spending a lot more time in our salesrooms – and that leads to more in-depth discussions,” according to Roberto Battistini. He also points out how well the new visual pre-sentation fits the brand promise: “The high-end facilities and
generous dimensions of our new ŠKODA salesrooms empha-sise two of the main sales arguments for all of its models: outstanding features and exceptional spaciousness.” However, the new ŠKODA design is not just for large-scale presentation and sales areas. The layout and colour scheme also reflect the needs of medium-sized and smaller dealer-ships. Bright, cheerful colours and a fresh new look make any salesroom appear more spacious and inviting. This also gives the new ŠKODA branding the necessary versatility for use throughout the global retail network. A wide range of different ŠKODA dealers are interested in the new style of presentation. Many want to see for themselves how the new approach works in Zurich. Roberto Battistini is happy for his salesrooms to be “prototypes” and welcomes the constant stream of visitors from other dealerships, mostly abroad: “We all agree that the people at ŠKODA responsible for the new branding have done a great job – it will be good for all of us.” There can be no doubt that ŠKODA’s new corporate design creates the ideal conditions for continued growth at its deal-erships. The signals are clear – let the future begin.
Sending a clear message

20 Annual Report 2011
Seeking the bestGrowth and internationalisation will determine how ŠKODA AUTO develops over the coming years. How will the Company meet the challenges this creates in the field of human resources?
> An interview with Bohdan Wojnar, member of the Board of Management of ŠKODA AUTO for Human Resources Management.

21Annual Report 2011
Mr Wojnar, internationalisation is central to the ŠKODA AUTO growth strategy. What does that mean for Human Resources?> In the future, more than ever before, a company’s competi-tiveness will be decided by the capabilities, motivation and loy-alty of its employees. Those that recruit the best talents will have a competitive edge over the long term. You can see that quite clearly in the automotive industry. Our goal must be to become one of the most attractive employers – not just in the Czech Republic, not just in Europe, but worldwide.
How do you recognise an attractive employer?> There are many different criteria – but you can mostly tell from the number of people applying for a job on a specula-tive basis. More than 21,000 people applied to our Company last year. That means that ŠKODA AUTO is already an attractive company for many people today. That‘s good, but it is just the beginning for us. We have ambitious plans – which is why we must continue to work on becoming more attractive as an employer. It is not just a matter of winning over potential applicants. Employer brand-ing is built on the reputation of the Company. We are part of so-ciety, and so we have always assumed responsibility at a local level. The quality of life at our locations, maintaining good rela-tions with our neighbours – and, naturally, good cooperation between management and labour, based on trust – all of those are key aspects that make a company attractive. And, of course, we also benefit from being part of the Volkswagen Group: Any-one who works for ŠKODA AUTO can pursue a career within one of the world’s largest automotive groups. That benefits both the Company and its employees equally.
You mentioned a substantial increase in job applicants. What led to this positive development?
> In recent years, we have deliberate ly invested in improving our recruitment qua lity
and have expanded our personal marketing activities significantly. We are exploiting the opportunities offered by the internet in particular – from special recruiting websites to YouTube, where our recruiting campaign, for which we received two awards, is also online.But, most importantly, we have stepped up our activities out-side the Czech Republic. Although ŠKODA AUTO has an excel-lent reputation at home, the Czech labour market alone is un-
able to meet our complex personnel requirements.For that reason, we are also specifically targeting university graduates in other countries. In Eastern Europe, in particular, there are many experts we would like to recruit for ŠKODA AUTO. And, of course, working closely with prominent universi-ties and colleges worldwide will continue to be a priority. The most recent example is our cooperation with Tongji University in Shanghai – which is set to benefit both parties enormously.
Won’t this development be detrimental to employees in the Czech Republic? Will jobs be transferred to the growth markets?> No, quite the opposite: It is global growth that secures jobs at our Czech facilities. The Czech Republic is, and will always remain, our domestic market – it is, after all, where our Com-pany has its roots. 1,850 new jobs were created here in 2011, but our future will depend upon opening up more to the rest of the world. National borders should not prevent us from par-ticipating in global competition. We all need to be open to new ideas and solutions. All of our employees are required to sys-tematically enhance their skills, which also – at an individual level – improves their prospects within the Company. That also includes being prepared to work for our Company abroad for a period of time. We currently have more than 150 employees doing just that – and that number will continue to grow over the coming years. At the same time, the internationalisation of ŠKODA AUTO is also evident at our Czech locations, where we employ people from 37 different countries. So you see, there are always two sides to internationalisation.
The right people in the right place at the right time. How do you intend to achieve that? Especially in a company that is growing rapidly worldwide. > You are quite right – that will be the main challenge for Hu-man Resources over the next few years. We intend to plan our personnel requirements even better – with regard to quantity, and quality, in particular. We cannot allow a lack of key qualifi-cations within the organisation to hinder our Company’s devel-opment further down the line. On the contrary: We must work closely with our divisions right now to plan future requirements. That is currently a priority for us. And then, we have to do every - thing it takes to meet those requirements: in consultation with educational institutions, in collaboration with the universities – and, of course, through our own efforts, such as appropri-ate programmes at the ŠKODA University Na Karmeli and at the ŠKODA AUTO training college of engineering. I am quite sure that we will come up with plenty of good, “Simply clever” ideas to reach our goal.
Turn your CV into the opportunity of a lifetime – visit ŠKODA AUTO´s career website http://go.skoda.eu/career

22 Annual Report 2011
On 15 April 2011, celebrations got underway in Mladá Boleslav to mark the anniversary of a unique success story: For 20 years, ŠKODA AUTO has been a part of Volkswagen. The Chair-man of the Board of Management of ŠKODA AUTO, Prof. Dr. h.c. Winfried Vahland, summed it up nicely in his speech to high-ranking guests from politics and business: “Since 1991 we have seen the definite resurgence of a legendary automobile brand from the heart of Europe.” He also outlined the strategic course for the future: “Our past and present successes … create an
obligation for us to keep on going.” Twenty years on, the re-lationship between Volkswagen and ŠKODA AUTO is not only a partnership founded in tradition, but also a partnership with prospects for the future. The solid foundation built over the past two decades serves as the basis for the further dynamic development of the ŠKODA brand.16 April 1991: This day marked the beginning of a new era for ŠKODA AUTO: After long and intensive negotiations. ŠKODA be-came the Volkswagen Group’s oldest brand, alongside VW, Audi
Partnership with prospects 20 years of partnership
with Volkswagen provide the occasion for an anniversary celebration and an “Open House” in Mladá Boleslav.

23Annual Report 2011
“Since 1991 we have seen the definite resurgence of a legendary automobile brand from the heart of Europe.” Prof. Dr. h.c. Winfried Vahland, Chairman of the Board of Management of ŠKODA AUTO
Picture left: Building for the future: Ground-breaking ceremony for the expansion of production capacity at the Mladá Boleslav plant marks the twentieth anniversary of the partnership between ŠKODA AUTO and Volkswagen.
Below: About 75,000 people attended the “Open House” at the Mladá Boleslav plant.
Above: Strong interest among politicians and the generalpublic (from left): Volkswagen Chairman of the Board of Management, Prof. Dr. Martin Winterkorn, and ŠKODA AUTO Chairman of the Board of Management, Prof. Dr. h.c. Winfried Vahland, welcome Czech President Prof. Ing. Václav Klaus, CSc.
and SEAT. Even back then, the importance of the ŠKODA acqui-sition was clear to all those involved: Volkswagen had secured itself “the pearl of the East”.Volkswagen’s involvement with ŠKODA was also seen as a vote of confidence in the newly-formed Czech and Slovak Federal Republic (ČSFR). Through Volkswagen’s involvement, ŠKODA AUTO now accounts for 7.3 per cent of Czech exports. The Company is repeatedly confirmed as the country’s most attrac-tive employer and most important and most admired industrial
company, and therefore serves as a high-profile role model.ŠKODA’s success today is largely due to the course set back in 1991. In particular, the decision not to downgrade Mladá Boleslav to an assembly plant, but to keep all research and development activities at the site, testifies to the farsight-edness of those involved. Most importantly, this allowed the ŠKODA brand to maintain its identity. From the very beginning, Volks wagen showed considerable respect for the Company’s Czech car-building tradition and the pride of the ŠKODA work-

24 Annual Report 2011
force. This is certainly one of the main reasons why Winfried Vahland was able to congratulate all ŠKODA employees on their extraordinary sense of identification with the Company and the brand in his 2011 anniversary speech: “Thanks to your attention to detail, your passion and your Czech engineering expertise, you always manage to put outstanding cars on the roads around the world.” This lasting appreciation of the Company’s employees and their families was very much in evidence at the “Open House”, held on 16 April 2011 at the main plant in Mladá Boleslav: Exactly 20 years after ŠKODA AUTO joined Volkswagen, around 75,000 people visited the plant, confirming their strong attachment and keen interest in ŠKODA. Even in these days of increasing internationalisation, the main plant retains its central importance to the Company: This was seen at the symbolic ground-breaking ceremony, where the ex-pansion of body shop capacity, paint shop and assembly facili-ties in Mladá Boleslav got officially underway.The evolution of ŠKODA AUTO from 1991 up until today is note-worthy in many respects: The former one–product company has transformed itself into an automobile brand with a clear profile and a broad model line-up. The company that used to be focused on Eastern Europe is now a global player that sells cars in more than 100 markets worldwide. Deliveries of 172,000 ve-hicles to costumers in 1991 grew to 879,000 cars by 2011. What is more, thanks to the Volkswagen Group’s massive investments in development and production, ŠKODA automobiles now stand for exemplary quality, reliability, practicality and exceptional value for money. There can be no doubt that ŠKODA has found its rightful place as a key brand in the Volkswagen portfolio.All future planning centres on the “ŠKODA growth strategy”. Its main focus is on continued internationalisation, which will allow the Company to play a decisive role in the highly- attractive growth markets of China, India and Russia. The Volks wagen Group’s global presence forms an excellent foun-dation for this. At the same time, these growth plans will strengthen the standing of ŠKODA AUTO within the Group. Winfried Vahland: “We want our clever cars … to contribute to the Volkswagen Group becoming the world’s largest automo-bile manufacturer by 2018.” ŠKODA has concrete plans to in-crease its vehicle sales to at least 1.5 million units by 2018. This
growth will largely come from a unique model offensive: Over the next three years, a new model will be presented every six months on average. Regardless of the Company’s strong commitment to interna-tionalisation, the European markets – and its domestic market of the Czech Republic, in particular – will retain their pivotal im-portance to ŠKODA. Investment is not limited to sites abroad, and expansion of production capacity in the core markets con-tinues – not least at the main plant in Mladá Boleslav and at the Vrchlabí plant, which is set to become one of the most cutting-edge production facilities in the Volkswagen transmission pro-duction network.It would be impossible to achieve any of this, or even imag-ine the future, without the strong backing of the Volkswagen Group in Wolfsburg – a fact that anyone who has followed the history of the alliance between Volkswagen and ŠKODA AUTO cannot fail to be aware of. The 20-year partnership is, in every respect, an impressive success story – one that is based on mutual respect, trust and shared goals. It forms an excellent foundation for the challenges of the years ahead. There can be no doubt for Winfried Vahland: “These will be good years for Volkswagen and for ŠKODA.”
“With Volkswagen’s commitment, the development of ŠKODA has been unique in the auto-mobile industry.” Prof. Dr. h.c. Winfried Vahland, Chairman of the Board of Management of ŠKODA AUTO
ŠKODA2011
For ŠKODA AUTO, 2011 was a year of reflecting on
its historic roots and conquering new horizons:
An official celebration marked its 20-year partnership
with the Volkswagen Group; during the same year,
new and revolutionary style concepts and a new
corporate design were unveiled, new alliances formed,
the greatest rally victories in its history won and
new sales records achieved. By the end of eventful
twelve months, it was clear that 2011 had been
ŠKODA’s most successful year ever.
.01 .02 .03 .04 .05 .06 .07 .08 .09 .10 .11 .12
Highlights
The year in review
25Annual Report 2011

26 Annual Report 2011
January 19 - 22 > Monte Carlo The Intercontinental Rally Challenge (IRC) season opens with the 100 years anniversary race of the world’s tough-est rally, the Rally Monte Carlo. The ŠKODA Motorsport team fields no fewer than ten ŠKODA Fabia Super 2000 cars in the starting line-up. At this point, no one knows that the 2011 season will prove to be the most suc-cessful so far in the history of ŠKODA Motorsport. Even customers have reason to ce le brate: ŠKODA releases a super-sporty special edition ŠKODA Fabia Monte Carlo to coincide with the “centenary Monte”.
February 12 - 19 > LiberecThe Czech city of Liberec hosts the 10th European Youth Olympic Win-ter Festival, the largest European multisport event for young athletes. Up-and-coming athletes between the ages of 15 and 18 from 45 European countries compete in eight disciplines: ice hockey, figure skating, cross-country skiing, ski jumping, Nordic combined, downhill skiing, snowboard-ing and biathlon. ŠKODA provides a fleet of 50 vehicles for the festival, which also hosts the 4x4 ŠKODA Park, an entertainment event for the entire family, showcasing the ŠKODA brand‘s four-wheel drive vehicles.
March 3 - 13 > GenevaŠKODA unveils its new Corporate De-sign at the International Motor Show in Geneva. All future communications will be characterised by this fresh new approach, signifying precision and conciseness. To project a sharper, professional image, ŠKODA completely revitalised its visual presentation. In Geneva, the Company also demon-strates what this means for upcoming ŠKODA automobiles with the “VisionD” concept car. This vehicle provides a first glimpse of forthcoming design elements and the brand’s enhanced design architecture.
.02 .03.01
More information on the 10th European Youth Olympic Winter Festival to be found here:http://go.skoda.eu/eyowf
27Annual Report 2011
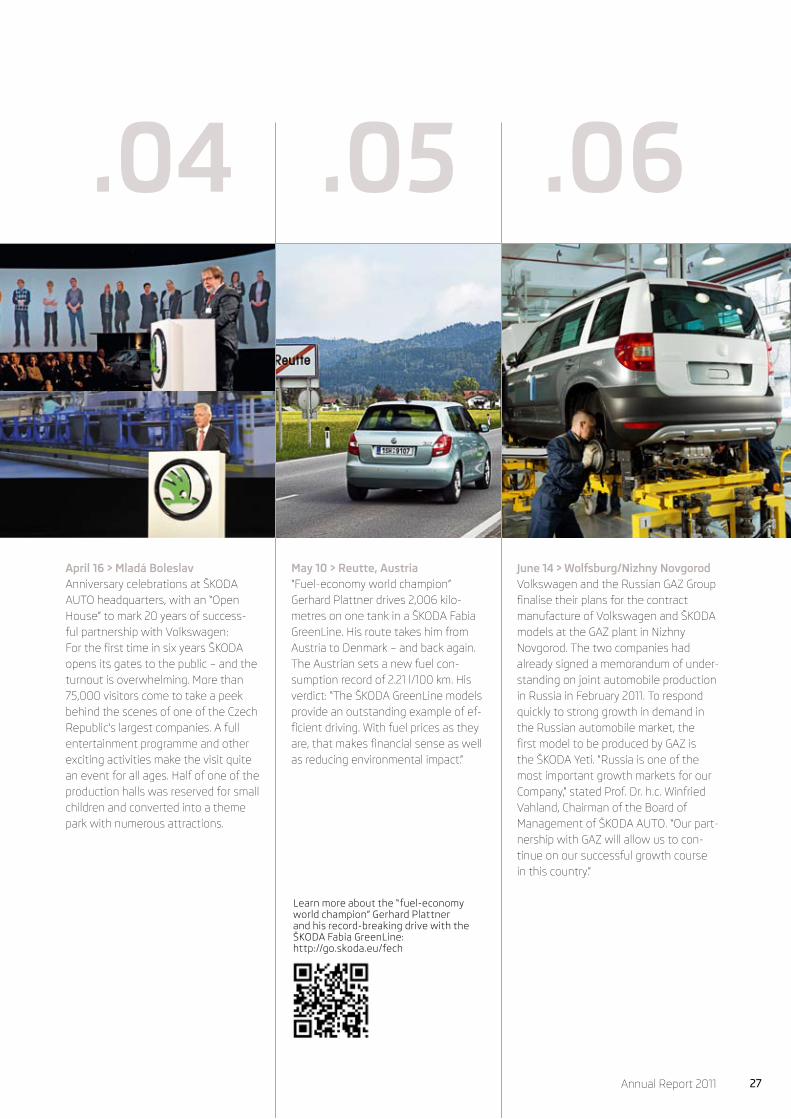
May 10 > Reutte, Austria “Fuel-economy world champion” Gerhard Plattner drives 2,006 kilo-metres on one tank in a ŠKODA Fabia GreenLine. His route takes him from Austria to Denmark – and back again. The Austrian sets a new fuel con-sumption record of 2.21 l/100 km. His verdict: “The ŠKODA GreenLine models provide an outstanding example of ef-ficient driving. With fuel prices as they are, that makes financial sense as well as reducing environmental impact.”
April 16 > Mladá Boleslav Anniversary celebrations at ŠKODA AUTO headquarters, with an “Open House” to mark 20 years of success-ful partnership with Volkswagen: For the first time in six years ŠKODA opens its gates to the public – and the turnout is overwhelming. More than 75,000 visitors come to take a peek behind the scenes of one of the Czech Republic’s largest companies. A full entertainment programme and other exciting activities make the visit quite an event for all ages. Half of one of the production halls was reserved for small children and converted into a theme park with numerous attractions.
June 14 > Wolfsburg/Nizhny Novgorod Volkswagen and the Russian GAZ Group finalise their plans for the contract manufacture of Volkswagen and ŠKODA models at the GAZ plant in Nizhny Novgorod. The two companies had already signed a memorandum of under-standing on joint automobile production in Russia in February 2011. To respond quickly to strong growth in demand in the Russian automobile market, the first model to be produced by GAZ is the ŠKODA Yeti. “Russia is one of the most important growth markets for our Company,” stated Prof. Dr. h.c. Winfried Vahland, Chairman of the Board of Management of ŠKODA AUTO. “Our part-nership with GAZ will allow us to con-tinue on our successful growth course in this country.”
.04 .05 .06
Learn more about the “fuel-economy world champion” Gerhard Plattner and his record-breaking drive with the ŠKODA Fabia GreenLine:http://go.skoda.eu/fech

28 Annual Report 2011
July 16 > Ponta DelgadaHalfway through the IRC season, ŠKODA Motorsport already dominates the competition, taking the top three spots in the Sata Rallye Açores in ex-treme weather conditions. Juho Hän-ninen and co-driver Mikko Markkula lead the field for the third time this season, followed by Andreas Mikkelsen and Ola Fløene in second, and Jan Kopecký and Petr Starý in third. This is the fifth time in IRC history that ŠKODA has achieved a one-two-three finish.
August 23 > Shanghai ŠKODA agrees on extensive coopera-tion with Tongji University. The Com-pany will support research and talent promotion at the Chinese university. Students of both ŠKODA University Na Karmeli and Tongji University will also benefit from an exchange pro-gramme between the two universities. Professor Li Zhenyu, head of the local International Exchange and Coop-eration Office, is delighted with the agreement: “It is a great honour for us to be the first university in China to enter into a cooperation of this kind with ŠKODA. This collaboration will help us on our way to becoming a top international university.”
September 15 - 25 > Frankfurt ŠKODA presents the production-ready MissionL concept car at the IAA Mo-tor Show. The new compact sedan will come onto the market in Europe, Russia and China by autumn 2012. The ŠKODA MissionL also marks the beginning of a comprehensive model offensive. Over the coming years, ŠKODA will present a new model every six months.
.08 .09.07
Further information on the presentation of the MissionL concept car at the IAA in Frankfurt:http://go.skoda.eu/iaa
29Annual Report 2011
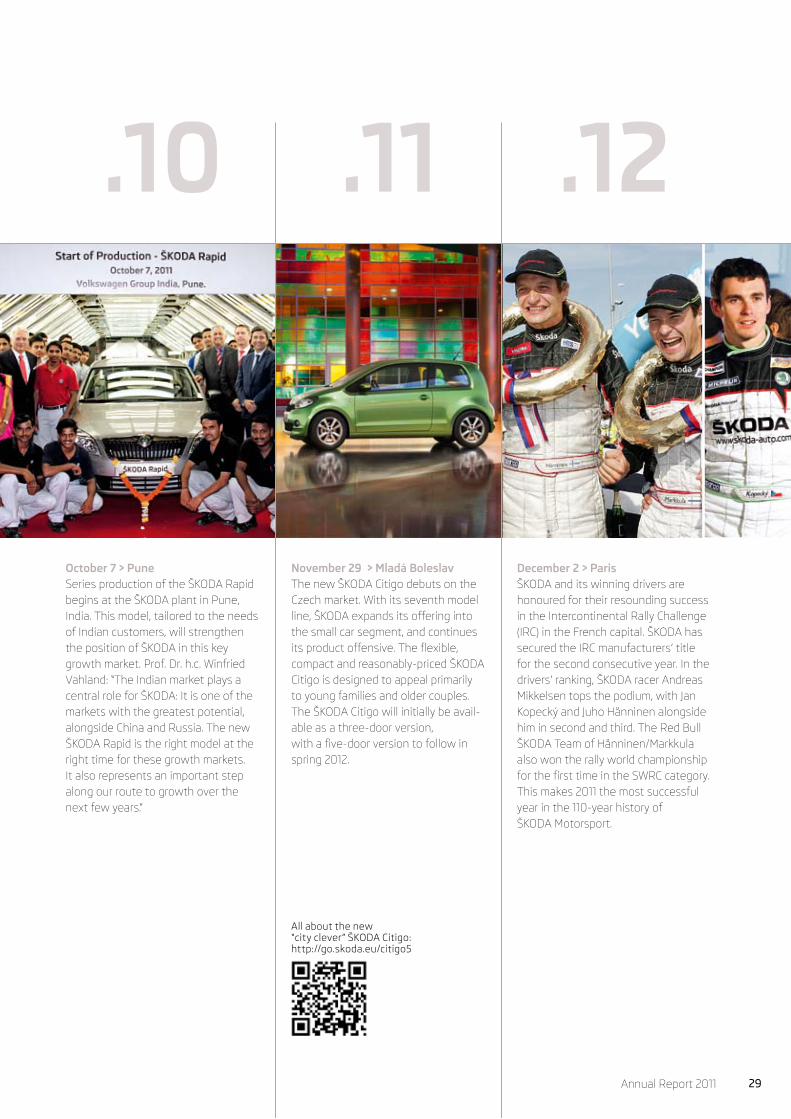
November 29 > Mladá Boleslav The new ŠKODA Citigo debuts on the Czech market. With its seventh model line, ŠKODA expands its offering into the small car segment, and continues its product offensive. The flexible, compact and reasonably-priced ŠKODA Citigo is designed to appeal primarily to young families and older couples. The ŠKODA Citigo will initially be avail-able as a three-door version, with a five-door version to follow in spring 2012.
October 7 > PuneSeries production of the ŠKODA Rapid begins at the ŠKODA plant in Pune, India. This model, tailored to the needs of Indian customers, will strengthen the position of ŠKODA in this key growth market. Prof. Dr. h.c. Winfried Vahland: “The Indian market plays a central role for ŠKODA: It is one of the markets with the greatest potential, alongside China and Russia. The new ŠKODA Rapid is the right model at the right time for these growth markets. It also represents an important step along our route to growth over the next few years.”
December 2 > ParisŠKODA and its winning drivers are honoured for their resounding success in the Intercontinental Rally Challenge (IRC) in the French capital. ŠKODA has secured the IRC manufacturers’ title for the second consecutive year. In the drivers’ ranking, ŠKODA racer Andreas Mikkelsen tops the podium, with Jan Kopecký and Juho Hänninen alongside him in second and third. The Red Bull ŠKODA Team of Hänninen/Markkula also won the rally world championship for the first time in the SWRC category. This makes 2011 the most successful year in the 110-year history of ŠKODA Motorsport.
.10 .11 .12
All about the new “city clever” ŠKODA Citigo:http://go.skoda.eu/citigo5

30 Annual Report 2011
Faster than ever
2011 turned out to be the most successful year so far in the history of ŠKODA Motorsport. Exactly 110 years after ŠKODA first became involved in the sport, a dream came true: ŠKODA not only repeated its previous year’s victo-ries in both the manufacturer and driver rankings of the renowned Intercontinental Rally Challenge (IRC) – in 2011, ŠKODA also brought the SWRC (Super 2000 World Rally Cham pionship) title home to Mladá Boleslav for the first time in motorsports history. Experienced teams and the technical maturity of the ŠKODA Fabia Super 2000 played a crucial role in these
successes. By the end of the season, ŠKODA had notched up eight wins in individual races to take the prestigious IRC manufacturers’ and drivers’ titles, as well as three first places in the SWRC – in addition to four national titles. All in all, ŠKODA certainly left its mark on rally sports in 2011. ŠKODA started the 2011 season in a confident mood – and, sure enough, the talents of the previous year’s winning team of Juho Hänninen and Mikko Markkula soon shone through. The Finnish pair was competing not only in the IRC, but also in the SWRC races. With a total of three wins and two second places in the SWRC, they pulled away

31Annual Report 2011
With a one-two-three in the IRC and victory in the SWRC, ŠKODA celebrated 110 years in motorsports with its most successful year ever.
from the rest of the pack and secured ŠKODA its first world championship title. In the IRC they finished third overall, but were overtaken in the final race by Andreas Mikkelsen with Ola Fløene, and Jan Kopecký and Petr Starý – both of these teams also driving ŠKODA Fabia Super 2000 cars. ŠKODA driver Andreas Mikkelsen was the surprise season-winner: By finishing first in the last two races of the IRC season, the 22-year-old Norwegian became the youngest IRC winner in history. ŠKODA’s Czech factory team of Ko-pecký and Starý also delivered another solid performance in 2011. Their two IRC wins earned them second place – the
same as the previous year. Belgian driver Freddy Loix also contributed to ŠKODA’s successful scorecard with several good placings and a first in Ypres.ŠKODA’s commitment to motorsports dates back to 1901, when racing pioneer Narcis Podsedníček successfully com-pleted the Paris-Berlin race on a motorcycle built by L&K, which later merged with ŠKODA. Unlike today’s drivers, who can rely on the support of a highly-professional ser-vice team, Podsedníček mostly had to fend for himself on his racing adventure 110 years ago. Fortunately, an obliging Parisian woman with a sewing machine helped him rein-

32 Annual Report 2011
force the treads and sidewalls of his tyres with linen – oth-erwise poor road conditions would almost certainly have forced Podsedníček to turn around, and he would never have made it to Berlin. Today, his success is regarded as ŠKODA’s racing debut.Even in the early days, racing was never just an end in it-self. Racing successes were the ideal way to convince the public of the reliability of the brand’s products. Between 1904 and 1906 L&K even employed its own factory driver, Václav Vondřich, an enthusiast who was totally committed to racing and would go to any lengths for the sport.
By the early twentieth century, racing competitors had to be ahead of their time. They had to be fighters, driven by a strong desire to be the best. That was precisely the kind of fighting spirit shared by L&K founders, Václav Laurin and Václav Klement, who had started out building bicycles, and soon progressed to producing motorcycles. Their first au-tomobile, the “Voiturette A” came onto the market in 1905. Over the next few years, the Company also built the le-gendary FCS and FCR race cars alongside series-produced automobiles. These cars were renowned for their speed and durability. The FCS clocked speeds of around 115 km/h – which was quite remarkable for the time; while the 1909 FCR, with its enormous 5,672 cm3 four-cylinder engine, achieved a total output of almost 100 hp (73 Kw).
In the years after 1925, when L&K merged with ŠKODA, several attractive vehicles were built, including the stream-lined ŠKODA Rapid Six with a water-cooled six-cylinder four-stroke 1961 cm³ engine. With 50 hp (37 kW), it was able to reach a maximum speed of 130 km/h. However, during difficult economic times and world wars, reliability and sturdiness mattered more than top speed. For ŠKODA, participating in “marathons” and high-profile endurance tests became more important than chasing racing trophies. Instead, ŠKODA automobiles were seen crossing the United States and Mexico and photographed
navigating unpaved roads in Africa. Adventurers like Jiří Hanuš and František Alexander Elstner and his wife Eva Růžena Elstnerová captured the public attention. On ex-peditions that tested both the drivers and their cars, they delivered impressive proof of ŠKODA vehicles’ exceptional reliability.Volkswagen’s involvement with ŠKODA from 1991 on marked the end of the long period of compromise and improvisation that followed the Second World War. With a modern car and Volkswagen’s clear commitment to motorsports, the Company was able to make a fresh start. The ŠKODA Felicia Kit Car was on the racetrack by 1995, and delivered a series of good performances.The next chapter in ŠKODA’s racing history began in 1997,
A passion inspired by tradition: The Company’s commitment to motorsports goes back almost as far as ŠKODA itself – more than 110 years. Today, motorsports can be considered an integral part of the brand‘s identity.

33Annual Report 2011
when the FIA created a new WRC racing category. It was the ŠKODA Octavia WRC, launched in 1999, that earned ŠKODA a place among the rally elite. By then, Mladá Boleslav had its eyes firmly on the future: Work was al-ready fully underway on the ŠKODA Fabia WRC, which de-buted in 2003. The breakthrough finally came in 2009, when the newly-developed ŠKODA Fabia Super 2000 transformed ŠKODA into one of the top players. In its very first racing season, ŠKODA Motorsport took second place in the IRC driver and manufacturer competitions with this car. This was
followed in 2010 by a comfortable victory in both rank-ings and crowned, in 2011, with an impressive repeat performance. This second IRC win, combined with the Red Bull ŠKODA Team’s triumph in the SWRC, marked the high -point so far in the fascinating history of ŠKODA Motorsport. The brand’s on-going commitment to racing is strengthened by an awareness of its long and impres-sive tradition. Rally racing will continue to define the ŠKODA brand in the future and remain an integral part of its identity. In many ways, ŠKODA’s heart belongs to motorsports.
“2011 was a great year for ŠKODA. Defending our IRC title and winning the SWRC, as well as four national titles, was a fantastic achievement for everyone. The drivers, the teams and all of the people involved did a terrific job. We are extremely happy.”Michal Hrabánek, head of ŠKODA Motorsport

34 Annual Report 2011
Chasing records

35Annual Report 2011
The ice hockey world championships and the Tour de France are just two of the highlights of ŠKODA AUTO’s sports sponsorship in 2011.
> All professional sportsmen and women like to break records. Sponsors, too, expect top performance. But for sponsors to set a record themselves is something of an exception. ŠKODA AUTO holds just such a record for its on-going support of the Ice Hockey World Championships – the Company even scored an entry in the Guinness Book of Records as “the longest-standing main sponsor in the history of sporting world championships”.“Our commitment to ice hockey is one of the central pillars of our sponsorship strategy. It contributes significantly to the recognition and image of the ŠKODA brand on the international markets,” explains Jürgen Stackmann, member of the Board of Management for Sales and Marketing at ŠKODA AUTO.What that means in concrete terms was seen at the men’s ice hockey world championships in Slovakia in May 2011. The ŠKODA brand was visible almost everywhere during the competition. Banner advertising around the stadiums and the ŠKODA logo in the centre of the rink assured the necessary presence. The winged arrow was also seen on many teams’ jerseys and helmets. Teams from Slovakia, Norway, Slovenia, Russia and, of course, the Czech Republic all competed wearing the ŠKODA logo.A fleet of 40 ŠKODA Superb Combi and ŠKODA Yeti cars shuttled officials and guests to and from the stadiums – where ŠKODA automobiles were also on display inside. In addition, ŠKODA allowed fans who could not be there in person to follow the excitement of the world championships online. The www.skoda-auto.com website was linked to a special page with the latest re-sults and scoreboards. There was even a championship app for smartphones.The event ended with Finland winning the world championship, Sweden in second and the Czech Republic in third place. ŠKODA reached more than 700 million fans all over the world through this sponsorship. And although the world championship title could be anyone’s next year, one thing is already cer-tain: There is no risk of ŠKODA losing its world record any time soon – shortly after the 2011 world championships, the Company renewed its contract with the International Ice Hockey Federation for another four years.
Prof. Dr. h.c. Winfried Vahland, Chairman of the Board of Manage-ment of ŠKODA AUTO, hands over the trophy for the best goalkeeper of the IIHF World Championship 2011 to the Swedish Team’s Viktor Fasth after the final on 15 May 2011.
Get important details and all highlights of the
2011 IIHF World Championships in Slovakia.
http://www.iihf.com/channels-11/iihf-world-
championship-wc11/home.html

36 Annual Report 2011
The driving force behind the Tour de France
ŠKODA has been similarly successful – if “only” for the past eight years – in competitive cycling, and primarily the Tour de France, the world’s best-known cycling race. No fewer than nine professional teams and the Mavic technical support service rely on ŠKODA as their partner. The sponsorship reached a new highpoint this year with a fleet of 300 vehicles and many other race-related activities. ŠKODA kept the Tour managers, VIPs and media from around the world mobile, with all models from the ŠKODA Fabia to the ŠKODA Superb in action. The winged arrow logo also featured prominently in the Tour de France publicity caravan. The finishing touch was the presentation of the Tour de France trophy to winner Cadel Evans by Jürgen Stackmann, member of the Board of Management for Sales and Marketing. ŠKODA chief designer Jozef Kabaň also helped design the trophy, which was handmade by glass craftsmen from Bohemia.“We are proud to partner with this fantastic sporting event for the eighth con-secutive year,” said Jürgen Stackmann. “It has been a tremendous three weeks all round – and what a perfect opportunity for ŠKODA to present the brand and its cars to millions of viewers worldwide!”Cycling represents the second major pillar of ŠKODA AUTO’s sports sponsor-ship, alongside ice hockey. Besides the Tour de France, ŠKODA is also involved with other classic races, such as the Giro d´Italia and the World Road Cycling Championship. ŠKODA also performs well on two wheels in amateur sports. The Company sponsors the event “Bike for Life” in the Czech Republic as well as the Berlin “Velothon”.Both on ice and on two wheels, ŠKODA will remain a reliable partner for sports over the coming years. Jürgen Stackmann hit the nail on the head: “Sport brings people together and represents emotion – what could be more power-ful when it comes to strengthening a brand?”
Ph
oto
: AS
O –
P.P
err
eve

37Annual Report 2011
Learn all about the 98th Tour de
France (July 2 - July 24, 2011)
http://www.letour.fr/us/homepage_
courseTDF.html
Ph
oto
: AS
O –
B.B
ade

38 Annual Report 2011
ŠKODA launches a fleet of ten Octavia Green E Line cars – and takes the next step towards emission-free mobility.
The presentation of the first ŠKODA Octavia Green E Line con-cept at the Paris Motor Show in 2010 heralded the beginning of a new era for the Company. Within a year, the concept car had evolved into a whole fleet of vehicles ready to hit the roads, seeking valuable insights for the future of electro-mobility at ŠKODA.A total of 15 ŠKODA Octavia Green E Line models were built in Mladá Boleslav in June 2011. A few of these vehicles became prototypes for technical development and quality assurance purposes, but most were launched on the roads as a small fleet: Ten ŠKODA Octavia Green E Line models were given the chance to prove themselves in everyday driving situations. Viewed from the outside, the only difference between these mid-sized cars and the series-produced ŠKODA Octavia Combi they are based on is their special label. A closer look inside the vehicle reveals other differences. First, the battery: A total of 180 lithium-ion battery cells with a weight of 315 kilograms and a capacity of 26.5 kWh are located to the rear of the car under the floor panels. This gives the vehicle a range of about 150 kilometres. The electric motor delivers a power output of 85 kW and 270 Nm of torque, available from a standing start. The ŠKODA Octavia Green E Line accelerates
from 0 to 100 km/h in twelve seconds, with an electronically-limited top speed of 135 km/h. This kind of performance makes the ŠKODA Octavia Green E Line a top choice for city driving, as does another of this electric car’s special features: All ŠKODA Octavia Green E Line models are fitted with a sound generator that simulates driving and engine sounds at speeds up to 30 km/h for maximum safety. “The ŠKODA Octavia Combi’s modular solutions make it easy to fit with battery, electric motor and performance electronics. In developing this car, we were also able to use modules from the Volkswagen Group,” explains Petr Kristl, head of e-mobility at ŠKODA. He leads a team of nine people, responsible for promo t -ing the development of electro-mobility at ŠKODA AUTO. “Once we had built the vehicles for the test fleet here in Mladá Boleslav, we registered them through the normal channels – without any kind of special permits or exemptions,” adds Kristl. “Because, at the end of the day, we want our test drivers to be able to use the cars without any restrictions – and you can’t expect special treatment in everyday situations.”By October 2011, everything was in place: Once the fleet had been approved, the road tests could begin. The cars will be tested on Czech roads for at least twelve months by com-
Pure energy

39Annual Report 2011
pletely different drivers, in all weathers, always mindful of the relevance for the customer. Kristl: “Everyone uses a car in dif-ferent ways – so, for an electric vehicle to be successful on the market, it needs to meet all those demands.” For this reason, the test will focus not just on vehicle technology but also on driving behaviour and customer needs, as well as future sales channels and business models.ŠKODA is adopting its own unique approach to testing. Select-ed managers – led by members of the Board of Management – and employees from the divisions involved in the project will initially test the cars before they are released to external part-ners from April 2012 on. Each of the cars will clock up around 15,000 kilometres over the duration of the test period. Kristl and his team are pre-pared for the occasional technical problem: “Every vehicle is connected online to our server and we record all relevant data, so we always know whether everything is okay with the cars.” In the initial phase, the vehicles will be driven only within the Czech Republic – primarily so that any problems can be solved quickly locally. If necessary, a team of service technicians will be on hand to respond immediately. All drivers will be surveyed on their impressions and expe rien ces during the test. Kristl is
looking forward to their feedback: “We are especially interested in hearing their criticisms, so that we can learn and refine our technologies. The best way to do that is by analysing our weak-nesses.”So, where do they go from here? Kristl explains: “Electro-mo-bility is a complex, multifaceted topic. It is not just about hav-ing the right vehicles. There are questions surrounding energy generation and distribution, auxiliary services, totally new busi-ness models ... No automobile manufacturer in the world can solve these problems alone. And that is where the cooperation within the Group really helps us.
“The Octavia Green E Line brings us another step closer to reaching our goals for future mobility. It will provide us with valuable insights and represents an important milestone in the on-going development of electric propulsion at ŠKODA.” Dr.-Ing. Eckhard Scholz, member of the Board of Management for Technical Development at ŠKODA AUTO.
Plugged in: A fleet of ten ŠKODA Octavia Green E Line models will demonstrate their everyday driveability in all conditions in year-long road trials.

40 Annual Report 2011
Awards 2011
Both the ŠKODA AUTO Company and ŠKODA brand automobiles received numerous awards once again in 2011. The awards recognise ŠKODA’s special commitment and at the same time set new standards for the future. A selection of the most important awards can be found here.
The renowned Czech Top 100 Association honoured ŠKODA as the most attractive Czech company in 2011: Miroslava Němcová, Speaker of the Chamber of Deputies of the Parliament of the Czech Republic, and Bohdan Wojnar, member of the Board of Management of ŠKODA AUTO for Human Resources Management, proudly present the award.

41Annual Report 2011
Best Cars Auto motor a sport ŠKODA Yeti
Best Cars Auto motor a sport ŠKODA Superb
Best Cars Auto motor a sport ŠKODA Octavia
Best Cars Auto motor a sport ŠKODA Roomster
4x4 2011 4x4 Car ŠKODA Superb
Most important company of the Czech Republic Czech TOP 100 ŠKODA AUTO
Employer without barriers Konto Bariéry ŠKODA AUTO
Socially worthwhile project of the year/The best full responsibility enterprises CSR Europe ŠKODA AUTO
CZECH REPUBLIC
Best Car Auto Express Driver Power ŠKODA Yeti (2nd place)
Best Car Auto Express Driver Power ŠKODA Superb
Best Car Auto Express Driver Power ŠKODA Octavia (4th place)
Best Manufacturer Auto Express Driver Power ŠKODA AUTO
Best Crossover Auto Express ŠKODA Yeti
Best Family Car Auto Express ŠKODA Superb
Best Estate Auto Express ŠKODA Superb
Driver Power Award Auto Express ŠKODA AUTO
UK
Best Cars Auto Motor und Sport ŠKODA Superb (1st place)
Best Cars Auto Motor und Sport ŠKODA Roomster (Cat.: van/import, 3rd place)
Best Cars Auto Motor und Sport ŠKODA Fabia (Cat.: imported small cars, 2nd place)
Best Cars Auto Motor und Sport ŠKODA Octavia (Cat.: compact class/import, 2nd place)
Fleet Award Autoflotte ŠKODA Fabia (Cat.: import, small cars)
Fleet Award Autoflotte ŠKODA Octavia (Cat.: import, compact class)
Fleet Award Autoflotte ŠKODA Superb (Cat.: import, upper compact class)
Best Family Car AUTO Straßenverkehr ŠKODA Octavia Combi, ŠKODA Superb Combi, ŠKODA Roomster
All - Wheel - Drive Car of the Year Auto Bild ŠKODA Superb 4x4 (Cat.: 25’ – 40’ EUR)
Taxi of the Year Taxi heute ŠKODA Superb
Company Car of the Year Firmenauto ŠKODA Octavia Combi (Cat.: import compact class)
Company Car of the Year Firmenauto ŠKODA Superb Combi (Cat.: import/export class)
Three gold medals 10th Automotive Film and Multimedia Festival, Frankfurt Motor Show (IAA) ŠKODA AUTO (Cat.: TV/Cinema, Website, Corporate Video)
Deutscher Werbefilmpreis 2011 Assoc. of German Advertising Spot Producers ŠKODA AUTO (Cat.: Animation and Cartoons)
GERMANY
Best Cars Auto Illustrierte ŠKODA AUTO Cat.: price/performance (11th consecutive year)SWITZERLAND
People’s Choice Award Sedan of the Year ŠKODA Rapid
Family Car of the Year Top Gear Awards ŠKODA Rapid
SUV of the Year ET Zigwheels ŠKODA Yeti
SUV of the Year CNBC Overdrive ŠKODA Yeti
INDIA
Most Reliable A-class Model of the Year Auto.163.com ŠKODA Octavia Mingrui
Best Sports Model of the Year Youth Daily ŠKODA Octavia RS
China Auto Market Media Award West China Metropolis Daily ŠKODA Octavia Mingrui (Cat.: Well-selling Intermediate Model)
China Auto Market Media Award West China Metropolis Daily ŠKODA Superb Hoarui (Cat.: Model of the Year)
Best Branding Award 2011 China Times and Automotive Business ŠKODA AUTO
CHINA

42 Annual Report 2011
Go, Citigo!
Small car, big plans: For the very
first time, ŠKODA AUTO is venturing
into the small car segment with the
ŠKODA Citigo – starting out in the
Czech Republic, with other markets
to follow later. The seventh model
line’s future role within the ŠKODA
product family is clearly defined: gain
a foothold in the fast-growing small
car market and so play a key role
in the Company’s growth strategy.

Annual Report 2011 43
44 Annual Report 2011
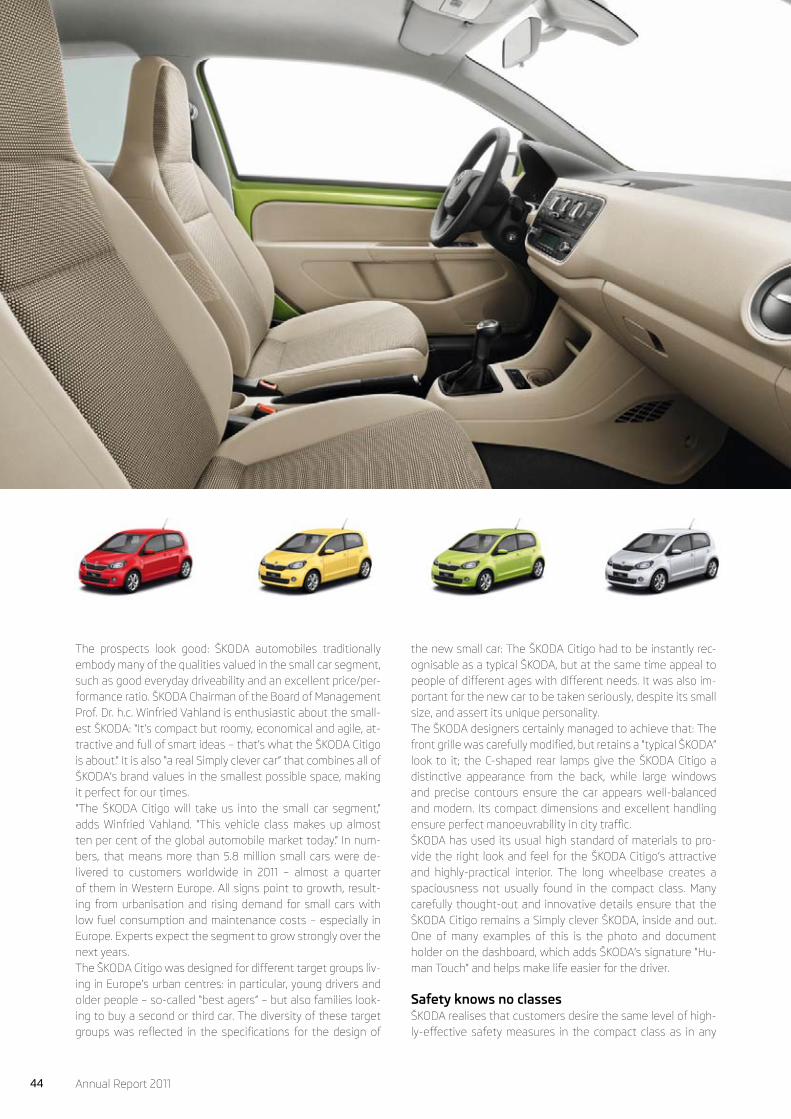
The prospects look good: ŠKODA automobiles traditionally embody many of the qualities valued in the small car segment, such as good everyday driveability and an excellent price/per-formance ratio. ŠKODA Chairman of the Board of Management Prof. Dr. h.c. Winfried Vahland is enthusiastic about the small-est ŠKODA: “It’s compact but roomy, economical and agile, at-tractive and full of smart ideas – that’s what the ŠKODA Citigo is about.” It is also “a real Simply clever car” that combines all of ŠKODA’s brand values in the smallest possible space, making it perfect for our times.“The ŠKODA Citigo will take us into the small car segment,” adds Winfried Vahland. “This vehicle class makes up almost ten per cent of the global automobile market today.” In num-bers, that means more than 5.8 million small cars were de-livered to customers worldwide in 2011 – almost a quarter of them in Western Europe. All signs point to growth, result-ing from urbanisation and rising demand for small cars with low fuel consumption and maintenance costs – especially in Europe. Experts expect the segment to grow strongly over the next years. The ŠKODA Citigo was designed for different target groups liv-ing in Europe’s urban centres: in particular, young drivers and older people – so-called “best agers” – but also families look-ing to buy a second or third car. The diversity of these target groups was reflected in the specifications for the design of
the new small car: The ŠKODA Citigo had to be instantly rec-ognisable as a typical ŠKODA, but at the same time appeal to people of different ages with different needs. It was also im-portant for the new car to be taken seriously, despite its small size, and assert its unique personality. The ŠKODA designers certainly managed to achieve that: The front grille was carefully modified, but retains a “typical ŠKODA” look to it; the C-shaped rear lamps give the ŠKODA Citigo a distinctive appearance from the back, while large windows and precise contours ensure the car appears well-balanced and modern. Its compact dimensions and excellent handling ensure perfect manoeuvrability in city traffic.ŠKODA has used its usual high standard of materials to pro-vide the right look and feel for the ŠKODA Citigo’s attractive and highly-practical interior. The long wheelbase creates a spaciousness not usually found in the compact class. Many carefully thought-out and innovative details ensure that the ŠKODA Citigo remains a Simply clever ŠKODA, inside and out. One of many examples of this is the photo and document holder on the dashboard, which adds ŠKODA’s signature “Hu-man Touch” and helps make life easier for the driver.
Safety knows no classesŠKODA realises that customers desire the same level of high-ly-effective safety measures in the compact class as in any

45Annual Report 2011
other and has therefore incorporated a whole range of innovations into the ŠKODA Citigo: Active safety is sig-nificantly enhanced by the new “City Safe Drive” brake as-sistant. This optional emergency braking function is au-tomatically activated at speeds of below 30 km/h with a laser sensor that identifies any danger of collision. In this way, “City Safe Drive” significantly reduces the risk and se-verity of rear-end collisions - particularly in cities.ŠKODA has implemented the head-thorax side airbag for driver and passengers in the ŠKODA Citigo, thereby pro-tecting the occupants’ head and upper body in the event of a lateral impact. ABS naturally comes as standard. The effectiveness of these active and passive safety meas-ures has been confirmed by top marks in the Euro NCAP crash test – a five-star rating for the ŠKODA Citigo speaks for itself. It goes without saying that all ŠKODA Citigo engines are especially environment-friendly. Two new three-cylinder 1.0-litre petrol engines, one with an output of 60 hp, and the other 75 hp, have been available since market launch. In the most economical Green tec version, average con-sumption is 4.1 l/100 km and 4.2 l/100 km respectively, with CO2 emissions of 96 g and 98 g/km respectively. The ŠKODA Citigo engines and transmissions are specially de-signed for city driving and therefore reach the tempera-
ture they need to operate efficiently extremely quickly, even on short trips. These engines produce a high torque with little noise despite their limited capacity. A natural-gas engine will be offered in addition to the petrol en-gines at a later date. This will generate C02 emissions of only 79 g/km. The ŠKODA Citigo was launched in the Czech Republic in November 2011, initially as a three-door version. The re-maining European markets will follow in 2012, with an ad-ditional five-door model that is likely to prove particularly popular in Central Europe. The ŠKODA Citigo may be small in size, but it is hugely important to the ŠKODA growth strategy. Together with the ŠKODA Rapid for the Indian market, it marks the be-ginning of the largest model offensive in the Company’s history: A new ŠKODA model is set to be presented to the public on average every six months. “The Citigo launches our model offensive. This car has an excellent chance of gaining a permanent foothold in the small car segment,” says Dr. Eckhard Scholz, member of the Board of Manage-ment for Technical Development at ŠKODA AUTO. The Company was already able to establish itself quickly in a new market segment back in 2009 with the ŠKODA Yeti. Now, the ŠKODA Citigo is well on its way to repeating that impressive feat.
Simply clever – lots of smart details in the new ŠKODA Citigo make the smallest ŠKODA a truly “city-clever” vehicle for urban target groups. ŠKODA’s seventh model line also boasts top-quality workmanship, state-of-the-art safety features and an exceptionally spacious interior. ŠKODA definitely sets the standard in the small car segment with the ŠKODA Citigo.

46 Annual Report 2011

47Annual Report 2011
The biggest ŠKODA World Dealers’ Conference ever, under the motto “New Power of ŠKODA”, sent a strong signal to the roughly 5,000 ŠKODA partners from all over the world who came together in Prague on 10 February 2011 to discuss the future development of the Company.
The message was clear: ŠKODA will not rest on its laurels, but will set itself ambitious goals for the near future, focusing on growth, further internationalisation and a one-of-a-kind model offensive. “We are ready to take ŠKODA to a new dimension,” asserted Chairman of the Board of Management Prof. Dr. h.c. Winfried Vahland in his opening speech. Plans call for con-tinued expansion of the product range and the brand’s global market presence to double sales by the year 2018 to at least 1.5 million cars.Conditions are right: ŠKODA has established itself on its tradi-tional European markets as a strong brand with the best pros-pects for future growth. ŠKODA cars are locally manufactured in Russia, India and China – where the Company aims to partici-pate in the highly-dynamic growth forecast for these markets: “We will considerably expand our current position,” emphasised Winfried Vahland, as he laid down the strategic approach for these markets. It is not just its close partnership with Volkswagen that makes ŠKODA such an effective global player. Its vehicles’ core proper-ties – their excellent value for money, their tremendous every-day driveability and reliability – all make ŠKODA cars especially attractive for a large segment of buyers in growth markets. Winfried Vahland explains: “ŠKODA is not going for bells and whistles. We focus on the things that really matter ... all at a fair price. We build good cars people can afford.”
Conference participants greeted the presentation of a ŠKODA City Car concept with resounding applause. By late 2011, that car was already on the market as the ŠKODA Citigo in the Czech Republic. The concept version of a compact sedan scheduled for release in 2012 and revealed for the first time at the ŠKODA World Dealers Conference, also received a rousing reception. The new global strategy is evident in both models: The ŠKODA Citigo was designed not least in response to increasing global urbanisation. The so-called “Global Compact” sedan, destined in particular for growth markets, even signals its globe-spanning approach in its name. The new corporate design, which will support ŠKODA’s global growth and was presented in Prague for the first time, also points the way. It appears fresh, youthful, dynamic and open to the world. It will define future visual presentation at all ŠKODA dealerships. And not just for dealers: All newly-developed ŠKODA automobiles will display the attractive new chrome-effect ŠKODA arrow in the future.New strategy, new models, new corporate design: ŠKODA is approaching the tasks ahead full of confidence and optimism – that much was clear from this highly-significant conference for ŠKODA. The response of the dealers who were there showed that the Company has every reason to believe in the “New Power of ŠKODA”.
Approximately 5,000 ŠKODA partners from all over the world gathered in Prague for the largest ŠKODA World Dealer’s Conference ever. They wanted to get the latest news on the Company’s recent performance and learn more about the future growth and internationalisation strategy of ŠKODA AUTO from Chairman of the Board of Management, Prof. Dr. h.c. Winfried Vahland.
Embarking on a new era

Product portfolio
48 Annual Report 2011

A new record of 879,184 deliveries to
customers in 2011 confirms the appeal
of the entire range of ŠKODA models
on markets around the world. With the
launch of the ŠKODA Citigo in the small
car segment, ŠKODA now has attractive
models in virtually all market segments.
With its GreenLine models and Green tec
versions, ŠKODA also offers low-con-
sumption vehicles with especially low
emissions throughout its model line-up.
Annual Report 2011 49

50 Annual Report 2011
ŠKODA Superb ŠKODA Superb Combi
Product portfolio
An uncompromising approach to quality and unbeatable value for money – that is the simple but effective formula behind the success of the ŠKODA Superb and the ŠKODA Superb Combi. The ŠKODA Superb combines high utility value with timeless, elegant design and state-of-the-art technology. Top-quality materials, in conjunc-tion with practical high-end solutions, such as ventilated front seats, define the character of these cars. The spaciousness of the ŠKODA Superb is nothing short of remarkable. In addition to an im-pressive luggage space of up to 1,835 litres, the legroom for backseat passengers is unusually generous, even for an upper mid-sized car. These vehicles are powered by a wide range of high-performance, highly-efficient and environmentally-friendly diesel and combus-tion engines. The consumption-optimised Green tec package is also available for buyers who place particular emphasis on efficiency and resource conservation. The ŠKODA Superb boasts several completely new features. For the first time in ŠKODA vehicles there are a driver’s knee and rear side airbags (up to nine airbags), parking assistant and bi-xenon headlights with AFS (Adaptive Frontlight System).A selection of attractive exterior colours ensure that the ŠKODA Superb appears elegant or sporty, but always striking. Elegance and common sense are rarely found in such perfect harmony in a car. That is why the success of ŠKODA’s top-of-the-range model should come as no surprise. Steadily rising sales – in markets including China – are the reward. The ŠKODA Superb is, and will remain, one of the most attractive alternatives in the upper mid-sized segment.

51Annual Report 2011
ŠKODA Octavia ŠKODA Octavia Combi
The most successful model in the history of the ŠKODA brand un-derlined its pivotal importance to the Company once again in 2011 by setting new global sales records. The ŠKODA Octavia, which was first introduced in 1996, followed by a second generation in 2004, is still setting standards today – for workmanship, everyday drive-ability, utilisation of space and, not least, value for money. The ŠKODA Octavia Combi is extremely popular and, with a 1,620-litre luggage compartment, it is also remarkably spacious. Environmentally-com-patible mobility is a focal point for all series-produced ŠKODA Octavia cars: The new Green tec technology, with automatic start/stop function, brake energy regeneration and tyres with optimised rolling resistance, enables the ŠKODA Octavia and ŠKODA Octavia Combi to achieve the highest possible emission reductions and fuel savings. The ŠKODA Octavia also plays a part in exploring the future of driving: A ŠKODA Octavia Combi forms the basis of the brand’s first electric vehicle, the ŠKODA Octavia Green E Line. A test fleet of ten of these cars has been on the roads since autumn 2011 with the aim of gaining detailed insights into driving behaviour and safety aspects. The four-wheel-drive ŠKODA Octavia Scout and ŠKODA Octavia 4x4 versions round off the ŠKODA Octavia line-up and have a strong appeal to new target groups, particularly in growth markets around the world. In other words, the ŠKODA Octavia success story has only just begun.

52 Annual Report 2011
ŠKODA Yeti ŠKODA Roomster
As the name suggests, the ŠKODA Roomster is all about “room” – and this minivan certainly fulfils its promise, with a maximum luggage capacity of up to 1,780 litres. Ample space and extraordinary versatility are what make the ŠKODA Roomster stand out. With a wide variety of different seating and loading configurations, this vehicle can be adapted to any kind of transport needs. The ex-pandable and adjustable Varioflex seating system, in particular, makes the ŠKODA Roomster extremely versatile. Its large windows and compact dimen-sions ensure easy handling and manoeuvr a-bility for city driving, and its finely-tuned driving properties make the ŠKODA Roomster ideal for longer trips. This car with a unique design proves that design and everyday drivability are not mutu-ally exclusive. Since its debut in 2005, the ŠKODA Roomster has become a permanent fixture in the minivan segment. Rising sales are proof of its growing appeal and continued importance to the ŠKODA brand.
In its second full year of production, the ŠKODA Yeti continued to gain momentum. In fact, it reported the most impressive gains across the entire ŠKODA line-up in 2011. This compact SUV scores highly for its excellent handling, both on-road and off, as well as for comfort and spacious-ness. It is a model of versatility for all needs. Since its market launch in 2009, the ŠKODA Yeti has constantly exceeded already-high expecta-tions: By June 2011, no fewer than 100,000 of these compact SUVs had rolled off the assembly line. Customers showed a marked interest in the all-wheel version. The ŠKODA Yeti also plays an important role in the growth markets of Russia, India and China. In the future, the ŠKODA Yeti will be built in Nizhny Novgorod in Russia and in Shanghai as well as at the existing production facilities in Kvasiny in the Czech Republic and Aurangabad, India. After a very promising start in Europe, the ŠKODA Yeti is now ready to take on the world.
Product portfolio

53Annual Report 2011
ŠKODA Fabia ŠKODA Fabia Combi
The ŠKODA Fabia has been one of the best-selling ŠKODA models for years. It confirmed its appeal once again in 2011 with a further increase in global sales figures. One of the ŠKODA Fabia’s greatest assets is the car’s fine balance between size and spaciousness. It effortlessly combines compact size and manoeuvrability with comfort – also for longer trips. The ŠKODA Fabia Sedan boasts a maximum luggage compartment volume of 1,163 litres, while the ŠKODA Fabia Combi, with a luggage compartment of up to 1,485 litres, is even more spacious. Six airbags ensure the highest level of passenger safety, with optional integrated bend lighting to enhance driving safety. The ŠKODA Fabia demonstrates its suitability as an everyday family car through its attention to detail. It is also extremely economical, with an impressive price/performance ratio and a choice of fuel-efficient petrol and diesel engines. Several of the petrol engines are available as environmentally-friendly Green tec versions, ensuring that the ŠKODA Fabia is also state-of-the-art from the environmental per-spective. Different option packages allow the ŠKODA Fabia to be con-figured to suit individual needs and tastes. But this practical car is not short on aesthetics either: In fact, attractive exterior colours make the ŠKODA Fabia quite an eye-catcher, especially in the optional two-tone design with a contrasting roof. The sum of all these features makes the ŠKODA Fabia an especially attractive option in its class.

54 Annual Report 2011
ŠKODA Citigo ŠKODA Rapid
The newest member of the ŠKODA product fam-ily, the ŠKODA Citigo, is opening up the small car segment to the brand. ŠKODA’s new model line initially debuted on the Czech market in late 2011. The strikingly sharp and modern-looking ŠKODA Citigo offers maximum space in the smallest possible package: Only 3.56 metres long, it is one of the most compact vehicles in its class, but is still able to seat four people. Its 251-litre luggage compartment can be extended to 951 litres by folding down the rear seats. Safety was another top priority during development of the ŠKODA Citigo. Its top five-star rating in the Euro NCAP crash test confirms that the measures imple-mented have been highly effective. Active safety is also enhanced by the new “City Safe Drive” brake assistant option which uses a laser sensor to warn of – and therefore help avoid – poten-tial collisions at speeds below 30 km/h. It goes without saying that all ŠKODA Citigo engines are fuel-efficient as well as environmentally-friendly. The most economical Green tec version has a fuel consumption of only 4.1 l/100km, and CO2 emissions of 96 g/km. The new model is of major significance to the Company’s growth strategy. It is designed to give the brand access to new target groups in Europe in particular.
The ŠKODA Rapid compact sedan was developed specially for the needs of the Indian market and is manufactured at the local plant in Pune. Shortly after the official market launch in October 2011, the car was named “Family Car of the Year” by the renowned auto magazine “Top Gear India”. This provided im-pressive confirmation of the ŠKODA Rapid’s special appeal for the Indian automobile market just in time for the start of sales. The sixth ŠKODA model line combines all the usual ŠKODA virtues. The ŠKODA Rapid was designed to be an excellent all-rounder. Top priority was given to developing a family-friendly car with great everyday driveability. That is why the ŠKODA Rapid offers such a roomy interior despite its compact dimensions of only 4.39 metres by 1.70 metres. It incorporates the latest technology and state-of-the-art safety features, while its spaciousness, equipment options and design are tailored specifically to suit the wishes and tastes of Indian customers. The ŠKODA Rapid is nevertheless instantly recognisable as a ŠKODA, both inside and out: This is ensured by characteristic ŠKODA design elements on the radiator grille and rear of the vehicle, as well as practical details inside. In one of the fastest-growing automobile markets in the world, the ŠKODA Rapid is set to play a particu-larly important role in the ŠKODA growth strategy. It will secure the brand a permanent foothold in the region’s highly dynamic compact sedan segment and thereby lay the foundation for further expansion of the ŠKODA AUTO presence in the Indian market.
Product portfolio

Management Report


57Annual Report 2011
Management Report
58 ŠKODAAUTOGroupProfile
59 Corporate Governance 59 Report of the Supervisory Board 60 ŠKODA AUTO bodies 63 Company organisation 64 Principles for remuneration of members of the Supervisory Board,
the Board of Management, the Audit Committee and Senior Executives 65 Declaration of Compliance with the Code of Corporate Governance
66 Business Operations 66 Thefinancialyearinreview 67 Strategy 68 Economic and market development 71 Financial situation 75 Value-based management 76 Technical development 77 Purchasing 78 Production and logistics 82 Sales and marketing 87 Human resources management 90 Sustainability 94 Company Policy
95 Risk Report 95 Risk management system
98 Outlook 98 Short-term and long-term outlook

58 Annual Report 2011
Group profile
ŠKODAAUTOGroupprofile
ŠKODA AUTO is one of the leading corporate groups in the Czech Republic. It comprises the parent company ŠKODA AUTO a.s., its fully consolidated subsidiaries ŠKODA AUTO Deutschland GmbH, ŠKODA AUTO Slovensko, s.r.o., Skoda Auto Polska S.A., Skoda Auto India Private Ltd., and associates.
ŠKODA AUTO a.s.The parent company, ŠKODA AUTO a.s., is a Czech company with a tradition of automotive manufacturing dating back more than a century, making ŠKODA one of the world’s oldest automotive brands. The Company’s principal business is the development, manufacture and sale of ŠKODA-brand auto-mobiles, components and genuine parts and accessories and the provision of maintenance services. The sole shareholder of the parent company, ŠKODA AUTO a.s., is the company Volkswagen International Finance N.V., seated in Amsterdam, the Netherlands. Volkswagen International Finance N.V. is an indirect 100% subsidiary of VOLKSWAGEN AG.
ŠKODAAUTODeutschlandGmbHŠKODA AUTO Deutschland GmbH was established in 1991 and has been a subsidiary of ŠKODA AUTO a.s. since 1995. The company’s principal business comprises the purchase and sale of vehicles, genuine parts and accessories.
ŠKODAAUTOSlovensko,s.r.o.ŠKODA AUTO Slovensko, s.r.o. was established in 1993 as a subsidiary of ŠKODA AUTO a.s. Its principal business is focused on the purchase and sale of vehicles, genuine parts and ac-cessories.
SkodaAutoPolskaS.A.*This company was established in 1994 and became a subsidi-ary of ŠKODA AUTO a.s. in the same year. It engages in the purchase and sale of vehicles, genuine parts and accessories.
SkodaAutoIndiaPrivateLtd.This company was established as a subsidiary of ŠKODA AUTO a.s. in 1999 and began assembling vehicles in 2001. Its princi-pal business comprises the purchase, manufacture and sale of vehicles, genuine parts, accessories and other goods.
OOOVOLKSWAGENGroupRusThe company’s principal business comprises the purchase, manufacture and sale of vehicles, genuine parts and acces-sories. ŠKODA AUTO a.s. holds a minority interest in this com-pany.
In addition to OOO VOLKSWAGEN Group Rus, the company ŠKODAAUTOa.s.alsohassubstantialinfluenceinotherasso-ciated companies. However, their impact on the consolidated entity‘sresultsisinsignificant.
ŠKODA AUTO a.s. registered office: Mladá Boleslav, Czech Republic
ŠKODA AUTO DeutschlandGmbH
ŠKODA AUTO Slovensko,s.r.o.
SkodaAutoPolskaS.A.*
SkodaAutoIndiaPrivateLtd.
OOOVOLKSWAGENGroup Rus
registered office: Weiterstadt, Germany ŠKODA AUTO’s ownership interest: 100%
registered office: Bratislava, Slovakia ŠKODA AUTO’s ownership interest: 100%
registered office: Poznan, PolandŠKODA AUTO’s ownership interest: 51%
registered office: Aurangabad, India ŠKODA AUTO’s ownership interest: 100%
registered office: Kaluga, RussiaŠKODA AUTO’s ownership interest: 16.8%
* With effect as at 1 January 2012 the share of Skoda Auto Polska S.A. has been sold to Volkswagen International Finance N.V.

59Annual Report 2011
Corporate GovernanCe
In the past fiscal year, the Supervisory Boardwas regularlyand extensively informed by the Board of Management of the operations of ŠKODA AUTO a.s. and subsidiaries within theconsolidatedgroup,theirfinancialperformance,andtheirbusiness policies.Business processes which, due to legal regulations or the Arti-cles of Association, require the Supervisory Board’s approval or briefing,orwhichwereofextraordinaryimportance,weredis-cussed in detail at meetings of the Supervisory Board. Based on written and oral reports from the Board of Management, the Supervisory Board was able to continuously oversee the activities of the ŠKODA AUTO a.s. management as well as that of the entire Group, thus duly executing its powers entrusted to it under the law.Under its resolution of 30 March 2011, Volkswagen Interna-tional Finance N.V., as the sole shareholder of ŠKODA AUTO a.s., approved a proposal for commissioning Pricewaterhouse-Coopers Audit, s.r.o., Prague, to carry out an audit of the Com-pany’sfinancialstatementsforthe2011accountingperiod.The auditor, reviewing separate financial statements of theŠKODA AUTO a.s. pursuant to IFRS, the consolidated Group
financialstatementspursuanttoIFRSasat31December2011,andtheReportonRelationsissuedanunqualifiedopinion.Atits meeting on 8 March 2012, the Supervisory Board discussed the financial results and favourably assessed a proposal ofthe Board of Management for distribution of the ŠKODA AUTO a.s.profitsbasedontheannualfinancialstatementspursu-ant to IFRS. The Supervisory Board also reviewed the Report on Relations for 2011 and assessed it favourably without res-ervations. The Super visory Board authorised the Board of Management to submit the annual financial statements for2011andtheproposalforthedistributionofprofitstothesoleshareholder, Volkswagen International Finance N.V.
ReportoftheSupervisoryBoard
Prof.Dr.MartinWinterkornChairman of the Supervisory Board

60 Annual Report 2011
Corporate GovernanCe
General MeetingThe General Meeting is the highest body of a joint-stock com-pany. It decides on matters entrusted to its competence by the Articles of Association and the Commercial Code. In view of the fact that ŠKODA AUTO has a sole shareholder, no Gen-eral Meeting is held and its powers are executed by the sole shareholder. Resolutions of the sole shareholder are made in writing and in cases stipulated by law take the form of a no-tarial record.
Supervisory BoardThe Supervisory Board oversees the activities of the Board of Management and the Company’s business operations in com-pliance with applicable legal regulations, principles of corpo-rate governance and the Articles of Association.The Supervisory Board ensures that relevant systems are in place to protect the Company’s interests and the entitlements ofallstakeholdersandthatadequatefinancialinformationispresented. In accordance with the law, ŠKODA AUTO’s Super-visoryBoardreviewsthefinancialstatementsandtheReporton Relations, voices its standpoint on the recommendation of selection of an auditor, oversees financial reporting andassessesallfinancialtransactionsthatmayhaveamajorim-pact on ŠKODA AUTO.The Supervisory Board consists of six members, four of whom are appointed by the sole shareholder and two are elected by Company employees in accordance with the law. The chair-person of the Supervisory Board is elected by the members of the Supervisory Board. Members of the Supervisory Board serve four-year terms, with reappointment or re-election for additional terms possible. The Supervisory Board meets three times a year.Independent decision-making of ŠKODA AUTO’s Supervisory Board is ensured by the corresponding organisational struc-ture of VOLKSWAGEN AG and the respective number of inde pendent members present on the Supervisory Board of VOLKSWAGEN AG (see VOLKSWAGEN AG’s Annual Report).
SupervisoryBoard
Prof.Dr.rer.nat.MartinWinterkorn(*1947)Chairman of the Supervisory Board since 29 January 2010 (member of the Supervisory Board since 1 January 2010)Chairman of the Board of Management, VOLKSWAGEN AG
ChristianKlingler(*1968)Member of the Supervisory Board since 6 November 2010Member of the Board of Management for Sales and Marketing, VOLKSWAGEN AG
Dr.h.c.MichaelMacht(*1960)Member of the Supervisory Board since 6 November 2010Member of the Board of Management for Production, VOLKSWAGEN AG
Ing.MartinJahn(*1970)Member of the Supervisory Board since 1 April 2009Head of International Fleet Sales, VOLKSWAGEN AG
JaroslavPovšík(*1955)Member of the Supervisory Board since 16 April 1993Chairman of the basic organisation of OS KOVO ŠKODA AUTO
Ing.JanMiller(*1948)Member of the Supervisory Board since 16 April 1993Secretary of the basic organisation of OS KOVO ŠKODA AUTO
ŠKODAAUTObodies

61Annual Report 2011
Corporate GovernanCe
Board of ManagementAs the statutory body of the Company, the Board of Manage-ment runs the Company’s operations and acts on its behalf. The Board of Management is responsible for the Company’s long-term strategic goals, devises business and risk-man-agement policies and ensures business and operations man-agement. The Board’s powers are laid down in the Articles of Association, the Company’s internal regulations and legisla-tion of the Czech Republic.Pursuant to the Company’s Articles of Association, the Board of Management has seven members, all of whom have an executive role within the Company. Board members are ap-pointed by the sole shareholder for a three-year term and may be reappointed for additional terms. The chairperson of the Board of Management is elected by the members of the Board of Management. All members of the Board possess the per-sonalandprofessionalqualificationsandpracticalexperiencenecessary for the performance of their duties. The extent to which they are responsible for performing such duties is gov-erned by Czech legislation. The Board of Management usually meets once a week. In order to ensure its effective function-ing, the Board of Management delegates relevant powers and responsibilities to its subordinate levels of management – senior executives.
CommitteesoftheBoardofManagementIn order to support the activities of the Board of Management, ensureinternalmanagementandfulfilmentofitsresponsibili-ties, the Company has set up committees and panels. These committees are advisory bodies or bodies with decision-mak-ing powers that the Board of Management forms on the basis of resolutions. Their purpose is to initiate, draft and submit to the Board of Management recommendations pertaining to specific issues. Competencies and composition of the com-mittees are governed by their rules of procedure.
BoardofManagement
Prof.Dr.h.c.WinfriedVahland(*1957)Chairman of the Board of Management since 1 September 2010, Central ManagementPrevious job positions:– President and CEO, Volkswagen China Investment Company Ltd. (2005–2010) and Global Vice President, VOLKSWAGEN AG (since 2006)– Member of the Board of Management for Commercial Af-fairs, ŠKODA AUTO (2002–2005) and Vice-Chairman of the Board of Management, ŠKODA AUTO (2003-2005)
Dipl.-Kfm.WinfriedKrause(*1962)Member of the Board of Management since 1 April 2010, Commercial AffairsPrevious job position: Head of Group Controlling, VOLKSWAGEN AG (2006–2010)
Dipl.-Betrw.JürgenStackmann(*1961)Member of the Board of Management since 1 September 2010, Sales and MarketingPrevious job positions:– VOLKSWAGEN AG (07-08/2010)– Managing Director, Ford of Germany (2006–2010)
Dipl.-Ing.MichaelOeljeklaus(*1963)Member of the Board of Management since 1 August 2010, Production and LogisticsPrevious job position: Member of the Board of Management for Production and Technical Development, Shanghai Volkswagen Automotive Company Limited (2005–2010)
Dr.-Ing.EckhardScholz(*1963)Member of the Board of Management since 1 April 2007, Technical DevelopmentPrevious job position: Head of Large Vehicles and Convertibles Product Line, Passenger Car Development, VOLKSWAGEN AG (2005–2007)
Dipl.-Ing.KarlheinzHell(*1963)Member of the Board of Management since 1 January 2010, PurchasingPrevious job position: Head of Purchasing, Volkswagen of South Africa (Pty.) Ltd. (2007–2010)
Ing.BohdanWojnar(*1960)Member of the Board of Management since 1 January 2011, Human Resources ManagementPrevious job position: Member of the Board of Management for Human Resources, Volkswagen Slovakia, a.s. (2009–2010)

62 Annual Report 2011
Corporate GovernanCe
Audit CommitteeThe scope of powers of the Audit Committee comprises pri-marily monitoring the process of preparing and auditing the financial statements and consolidated financial statements,assessing the effectiveness of the Company’s internal con-trols, internal audit and risk management systems, and recom-mending an auditor. Selection of an auditor is performed by the sole shareholder.Members of the Audit Committee are appointed by the sole shareholder. The Audit Committee has three members, who elect their chairperson. The term of service is four years, with reappointment for additional terms allowed.
AuditCommittee
MartinMahlke(*1962)Audit Committee Chairman since 27 April 2010 (Audit Committee member since 1 April 2010)Head of Group Controlling, VOLKSWAGEN AG
Dr.Ingrun-UllaBartölke(*1967)Audit Committee Member since 1 January 2010Head of Group Accounting and External Reporting, VOLKSWAGEN AG
BerndRumpel(*1959)Audit Committee Member since 1 January 2010HeadoftheŠKODALiaisonOffice,VOLKSWAGENAG
ChangesintheSupervisoryBoard, BoardofManagementandAuditCommitteeAppointed to the Board of Management, effective as at 1 January 2011: Bohdan Wojnar - Member since 1 January 2011
The CVs of the members of the Board of Management, Supervisory Board and Audit Committee are available on the Company´s website: http://go.skoda.eu/management-en

63Annual Report 2011
Corporate GovernanCe
TheCompany´sorganisationalstructureThe Company is organisationally divided into seven divisions: — The Central Management division is responsible for en-suring compliance with customer product-quality require-ments, global growth and foreign business development. The division’s other tasks include strategic planning, active com-munication with the media and experts and organisation of meetings of senior management panels. In the year under review, the division was expanded to incorporate the Gover-nance, Corporate Risk & Compliance department. — The Commercial Affairs division is responsible for planning andmanagement,andthustheeffectiveuseoffinancialre-sources. In addition, its tasks include securing information and systems to meet the needs of the Company’s management.— The Production and Logistics division is responsible for the production of vehicles, genuine parts and accessories, en-gines and components thereof, as well as logistical operations and production preparation.— The Sales and Marketing division is responsible for mar-keting manufactured vehicles, genuine parts and accessories.— The Human Resources Management division is responsi-ble for providing personnel services, ensuring that all of the Company’semployeesareoptimallyqualified,motivatedandsatisfied.Italsohandlescommunicationwithvariousinterestgroups.— The Technical Development division is responsible for the development of new products, design, construction, testing, support for vehicle production and on-going improvement of the entire range of ŠKODA products. It bears the same responsibility in relation to engines produced for other VW Group brands.— The Purchasing division ensures purchases of production and other material, services and investment units to meet the needs of ŠKODA AUTO.
RelationsbetweenCompanyandshareholdersThe Company rigorously complies with all legal regulations to the extent necessitated by the fact that the Company’s shares arenotlistedandthatithasaspecificshareholderstructurein the form of a sole shareholder – Volkswagen International Finance N.V.ŠKODA AUTO complies with the rules set forth in legislation for execution of extraordinary transactions (i.e. for transac-tionswhich intermsoftheirscopeorvaluesignificantlyex-ceed the scope of ordinary business activities). Within the Company, there are rules governing the relations between Company bodies in the preparation, approval and implementa-
tion of measures and actions of extraordinary or fundamental importance,suchasfinancialandhumanresourcesplanning,production and sales planning, the Company’s participation as a partner or shareholder in the business of third parties, ac-quisition or disposal of assets beyond the scope of ordinary business activities, fillingof key positions in Companyman-agement, etc.
InformationopennessandtransparencyThe Company rigorously adheres to and complies with all Czech laws and the principles of the Code of Corporate Gov-ernance set forth in its Chapter V, and regularly discloses all relevantinformationaboutitsbusiness,financialandoperat-ingresults,shareholderstructureandothersignificantevents.All information is prepared and disclosed in compliance with the accounting standards and regulations for the disclosure offinancialandnon-financialinformation.Withinthestrategyof openness, the scope of the disclosure of information is, in many areas, beyond that stipulated by law.The Company regularly publishes annual reports. The Annual Report contains audited annual consolidated and separate financial statements and presents a detailed picture of theCompany’sbusinessactivitiesandfinancialposition.TheRe-port on Relations between Related Parties is attached to the Annual Report.Inordertopreventapossibleconflictofinterest,allmembersof the Board of Management and the Supervisory Board and all senior executives are required by internal regulations to notify the Company in writing of any and all material interest theymayhaveintransactionsbenefitingthirdpartiesandtorefrainfromexercisingdirectinfluenceondecision-makinginrelation to such transactions. No incidents were recorded in 2011thatcouldhaveledtoaconflictofinterestinanyoftherelevant groups of Company employees or board members.
CompanypolicytowardsstakeholdersŠKODA AUTO ranks among the largest companies in the Czech Republic and is committed to the sustainable development of the society of which it is a part. The Company is fully aware of its responsibility for the stability of the business environment. Making every effort to foster the Company’s good reputation, credibility and reliability with its business partners, employees and other stakeholders is of key importance.
Company organisation
64 Annual Report 2011
Corporate GovernanCe
The principles for remuneration of members of the Superviso-ry Board, the Board of Management, the Audit Committee and senior executives are in accordance with generally binding lawsandregulationsandfulfilallmaterialaspectsofthere-commendations of the Code of Corporate Governance based on the OECD principles.
SupervisoryBoardMembers of the Supervisory Board are paid remuneration in theformofafixedamountstipulatedbytheCompany’ssoleshareholder. Members of the Supervisory Board also have the option of using company cars.
BoardofManagementThe system for remunerating members of the Board of Man-agement is defined in accordance with Volkswagen Groupprocedures. In terms of form, the remuneration is based on fourmain pillars: fixed remuneration, variable remuneration,benefits,andotherin-kindincomeprovidedbytheCompany.Thespecificconditionsforremuneratingindividualmembersof the Board of Management are set forth in the relevant con-tractual documents.Thebasicportionoftheremunerationconsistsoffixedcashincome that enables members of the Board of Management to carry out their duties in the Company’s interests and with due care, without being dependent on meeting the Company’s short-termtargets.Inadditiontothefixedincomecomponent
in the form of the base remuneration, their remuneration also includes variable income in the form of one-off bonuses.These variable components are dependent on the financialresults of the Company and Volkswagen Group, as well as the fulfilmentofindividualgoalssetfortheBoardmember,there-by ensuring the Board of Management’ interests are aligned with those of the sole shareholder.In addition to the income described above, the company ŠKODA AUTO provides the Board of Management with a portfolio of benefits in a pre-defined amount, as well as other in-kind income. The latter include use of company cars, accommodation, educational programme, and insurance.
AuditCommitteeThe Company does not provide any remuneration to mem bers of the Audit Committee.
SeniorExecutivesSimilarly to the members of the Board of Management, the system for remuneratingseniorexecutives isdefinedby in-ternal directives in accordance with Volkswagen Group pro-cedures.Like the system for remunerating members of the Board of Management, in terms of form, the remuneration is based on thefourbasicpillarsmentionedabove.Thespecificconditionsfor remunerating individual senior executives are set forth in the work contracts.
PrinciplesforremunerationofmembersoftheSupervisoryBoard,theBoardofManagement,theAuditCommitteeandSeniorExecutives

65Annual Report 2011
Corporate GovernanCe
ŠKODA AUTO is aware of its outstanding position in the Czech business environment and its ever-growing respect within Volkswagen Group and among competing manufacturers in the automotive sector. Therefore, it is fundamentally important that ŠKODA AUTO be perceived – by its employees, business partners and all customers, and by the general public – as a suc-cessful, transparent and open company. ŠKODA AUTO is con-scious of its tradition and reputation built up over many years, whichisconsideredofkeysignificanceforthefurthersuccess-ful development of the Company’s business activities.In light of these facts, since 2007 ŠKODA AUTO has been com-mitted to abiding by the relevant recommendations and rules set forth in the Code of Corporate Governance based on the OECD principles (hereinafter referred to as the “Code”) in the form in which it was updated in 2004 under the patronage of the Securities Commission. Through an unceasing improve-ment of its internal processes and procedures in accordance with the Code, the Company’s aim is to further promote trans-parency and ethical business practices in the Czech Republic.
DegreeofcompliancewiththerecommendationsoftheCodeofCorporateGovernanceIn line with best practice employed at Volkswagen Group, a predominant part of the internal processes of the Company’s corporate governance has, in the long run, been established in accordance with the relevant rules of the Code. Given the shareholding structure of the Company (a sole shareholder – Volkswagen International Finance N.V.), the Group’s organisa-tion structure (see the website of VOLKSWAGEN AG) and the fact that the Company’s shares are not listed on any stock exchange, some of the recommendations contained in the Code are not relevant, or are transferred, to the corresponding degree, to the level of the Group within the framework of ef-ficiencyandsynergies,asthecasemaybe.At the same time, the Company’s policies are derived from the adopted Code of Conduct, which prescribes the principles of
conduct for ŠKODA AUTO employees. These adopted princi-ples are based on the application of generally recognised so-cial values and further developed in Volkswagen Group’s Code of Conduct, newly compiled in 2010.The Company is not in full compliance with the recommenda-tions of the Code pursuant to Chapter VI-E-2 (in conjunction with article 18 of the Commentary on the Code), according to which it should establish committees in charge of remunera-tionandnomination.InviewoftheCompany’sspecificshare-holding structure, the activities associated with the commit-tees are in synergy and to the effective degree transferred to the level of the Group. The activities of the remuneration and nomination committees are undertaken by the personnel committee of the Board of Management of VOLKSWAGEN AG. Moreover the Company is not in full compliance with the re-commendations of the Code pursuant to Chapter VI-E-1 (in conjunction with article 5 of the Commentary on the Code), according to which the Board of Management and/or the SupervisoryBoardshouldhaveasufficientnumberofmem-bers who are not employed by the company and who are not in a close relationship with the company or its management throughsignificanteconomic,familyorotherties.Nevertheless, the aforementioned non-compliance with re-spective Code requirements does not represent non-fulfil-ment of the mandatory requirements of the law of the Czech Republic and legal risk for the Company.
ComplianceA new Governance, Risk & Compliance department was formed during 2011 as part of the distribution and adjustment of responsibilities. Before this, Compliance was handled by the Legal department. One of this department’s responsibilities is to advise the Board of Management in all compliance matters and implement preventative measures to manage and moni-tor compliance.
DeclarationofCompliancewiththeCodeofCorporateGovernance
The full text of the “Declaration by ŠKODA AUTO a.s. Board of Directors and Supervisory Board regarding recommendations of the Corporate Admini stration and Management Code based on the OECD Principles (2004)” and “Degree of Harmony with Recommendations of the Corporate Administration and Management Code” are posted at http://go.skoda.eu/sus-dev-en

66 Annual Report 2011
Thefinancialyearinreview
The 2011 financial yearwas themost successful in thehis-tory of ŠKODA AUTO Group. The Group achieved new sales, revenueandprofitaftertaxrecords.Italsoreachedimportantmilestones in the implementation of its growth and interna-tionalisation strategy. A total of 879,184 ŠKODA automobiles were delivered to cus-tomers in 2011, exceeding the previous year’s record high by 15.3%. This sales success is rooted in highly-efficient production.More ŠKODA-brand vehicles were built in 2011 than ever be-fore in the Company’s history. Global production of ŠKODA-brand vehicles reached a new re-cord of 900,628 vehicles – an increase of some 118,000 units over 2010 (+ 15.0%). ŠKODA AUTO also delivered numerous partsforotherbrandsintheVolkswagenGroupandconfirmedits position as an important pillar of the Volkswagen Group’s global production network.
The number of ŠKODA AUTO Group employees rose to 26,565 by the end of 2011. This represents an increase of 7.5%.
Financialstrengthasthebasisforfurther developmentBolstered by an increase in sales and an improved model mix, the Group’s sales revenue and earnings also rose. The cost situation was also improved and net liquidity increased. This provides ŠKODA AUTO with a solid foundation for further in-vestments in new products, capacity and markets.ŠKODA AUTO’s Group revenue rose by 15.1% to reach CZK 252.6 billion – another new record. The operating result reflectedthis positive development and, at CZK 18.3 billion, easily ex-ceeded the previous year’s figure, with an increase of 61.3%.Consolidated profit after tax climbed 81.9% to CZK 16.1 billion. The Group’s net liquidity climbed to CZK 47.3 billion – an improve-ment of 17.7% year-on-year. Capital expenditure (without capital-ised development costs) for the year 2011 totalled CZK 14.2 billion.
Business operations
ŠKODAAUTOGroup–Deliveriesof ŠKODAautomobilestocustomersyear-on-year
ŠKODA AUTO Group – Salesrevenuesyear-on-year(CZKmillion)
2011
2010
879,184
762,600
2011
2010
252,562
219,454
ŠKODA AUTO Group – Operatingresultyear-on-year(CZKmillion)
2011
2010
18,257
11,316
ŠKODA AUTO Group – Profitaftertax(CZKmillion)
2011
2010 8,839
16,075
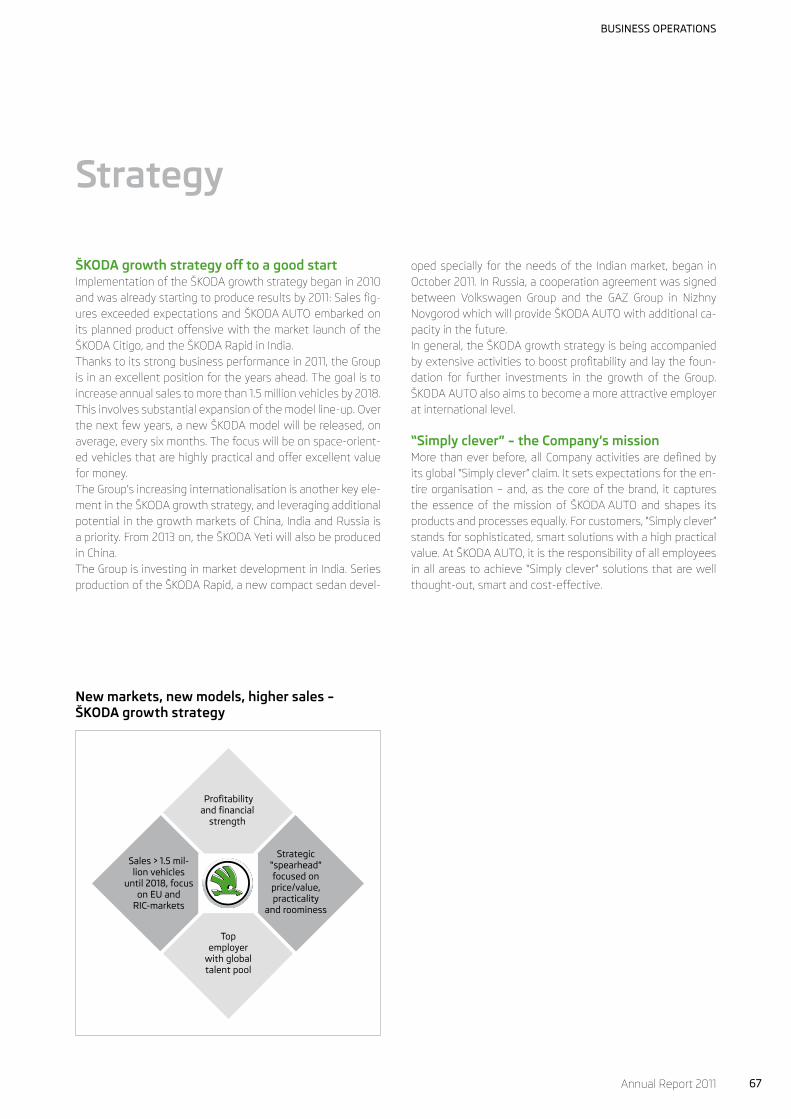
67Annual Report 2011
Business operations
ŠKODAgrowthstrategyofftoagoodstartImplementation of the ŠKODA growth strategy began in 2010 andwasalreadystartingtoproduceresultsby2011:Salesfig-ures exceeded expectations and ŠKODA AUTO embarked on its planned product offensive with the market launch of the ŠKODA Citigo, and the ŠKODA Rapid in India.Thanks to its strong business performance in 2011, the Group is in an excellent position for the years ahead. The goal is to increase annual sales to more than 1.5 million vehicles by 2018. This involves substantial expansion of the model line-up. Over the next few years, a new ŠKODA model will be released, on average, every six months. The focus will be on space-orient-ed vehicles that are highly practical and offer excellent value for money.The Group’s increasing internationalisation is another key ele-ment in the ŠKODA growth strategy, and leveraging additional potential in the growth markets of China, India and Russia is a priority. From 2013 on, the ŠKODA Yeti will also be produced in China.The Group is investing in market development in India. Series production of the ŠKODA Rapid, a new compact sedan devel-
oped specially for the needs of the Indian market, began in October 2011. In Russia, a cooperation agreement was signed between Volkswagen Group and the GAZ Group in Nizhny Novgorod which will provide ŠKODA AUTO with additional ca-pacity in the future.In general, the ŠKODA growth strategy is being accompanied byextensiveactivitiestoboostprofitabilityandlaythefoun-dation for further investments in the growth of the Group. ŠKODA AUTO also aims to become a more attractive employer at inter national level.
“Simplyclever”–theCompany’smissionMorethaneverbefore,allCompanyactivitiesaredefinedbyits global “Simply clever” claim. It sets expectations for the en-tire organisation – and, as the core of the brand, it captures the essence of the mission of ŠKODA AUTO and shapes its products and processes equally. For customers, “Simply clever” stands for sophisticated, smart solutions with a high practical value. At ŠKODA AUTO, it is the responsibility of all employees in all areas to achieve “Simply clever” solutions that are well thought-out, smart and cost-effective.
Strategy
Newmarkets,newmodels,highersales–ŠKODAgrowthstrategy
Profitability and financial
strength
top employer
with globaltalent pool
Strategic “spearhead”focused onprice/value, practicality
and roominess
Sales > 1.5 mil-lion vehicles
until 2018, focus on EU and
RIC-markets

68 Annual Report 2011
Business operations
Economicandmarketdevelopment
Worldeconomicsituationdominated bydebtcrisisGlobal economic trends were mixed in 2011. First and foremost, thepublicfinancesituationinthemajorEuropeaneconomies–andtheburdenitplacedonthefinancialsector–produceda negative impact over the course of the year.
Highly-volatilefinancialmarketsThe downgraded credit rating of leading economies, such as theU.S.andItaly,ledtoincreasinginsecurityonthefinancialmarkets and extremely high volatility.
StrongexchangeratefluctuationsAlthough the national debt crisis considerably weakened the value of the euro, the Czech koruna depreciated by 2.9% against the euro over the course of the year: After starting 2011 at an exchange rate of 25.06 CZK/EUR, the rate reached between 24.00 and 24.50 CZK/EUR by the middle of the year, beforefinishingat25.80CZK/EURbythe lasttradingdayofthe year.Although the average exchange rate between the U.S. dollar andtheeurochangedlittle,strongfluctuationswerereportedover the course of the year: The U.S. dollar fell by approxi-
mately 13% invalueagainst theeuro in thefirsthalfof theyear(from1.30to1.47USD/EUR),butfinishedthesecondhalf-year at a rate of 1.29 USD/EUR.
HighrawmaterialpricesStrongpricefluctuationswerealsoseenontherawmaterialmarkets. Although prices for most industrial raw materials fell towards the end of 2011, price levels were still relatively high after the strong increase the previous year.Oilpricesrosesteeplyinthefirstquarterfromapprox.USD92per barrel to a high for the year of around USD 128 per barrel in May 2011. The average price per barrel for the year of USD 110 was therefore 37% higher than the previous year.The price of copper hovered between USD 9,000 and USD 10,000 per tonne up until September, before falling to USD 7,500 at the end of the year. Aluminium prices rose to almost USD 2,800 per tonne until the middle of the year, but prices also dropped sharply late in the year. At the end of De-cember aluminium cost USD 2,000 per tonne.
Europe–slowingafteradynamicstartThe euro-zone economy grew only slightly in 2011, with a 1.6% increase in gross domestic product. After a dynamic start to
2010
28
26
24
22
20
18
162011
CZK/EURandCZK/USDexchangerates
CZK/USD CZK/EUR

69Annual Report 2011
Business operations
250%
200%
150%
100%
50%
0%
Developmentofpricesforoil,steel,aluminiuminfive-yearcomparison(USD)1 January 2007 = 100%
Brent oil Steel Aluminium
theyear,adefiniteslowdownwasseeninthesecondhalfof2011. The on-going debate about how to resolve the national debt crisis, and, in particular, the situation in Greece and Italy, was the main factor dampening the economic climate. The resilience of the individual European economies varied. While Greece, Spain, Portugal, Italy and Ireland had to contend with high unemployment and the collapse of retail spending, the situation in Germany remained stable.Likewise, the U.K. was unable to escape the impact of the euro-zone crisis. High unemployment and a weak economy dominated the situation there. The British economy grew by only 0.8% in 2011.The Czech Republic’s positive growth continued in 2011. GDP grew by 1.7%. ŠKODA AUTO accounted for about 7.3% of Czech exports in 2011.Household spending, on the other hand, continued to fall and finishedtheyeardown0.4%onthepreviousyear.Theinfla-tion rate in the Czech Republic was reported at 1.9% in 2011.
Russia–steady,moderategrowthRussia’s economic development continued at a moderate pace in 2011. Russian gross domestic product grew at a rate of 3.8% from the previous year. The main force driving expansion
was private consumption, which climbed dramatically despite slowergrowthinrealincomesasaresultofinflation.
Asia–ChinaandIndiaremainstrongInChina,thegrowthcurveflattenedsomewhatfromthepre-viousyear,butstillshowedadefiniteupwardtrend.Overall,the Chinese economy grew by 9.2% in 2011. Political measures and higher wages ensured the positive development of the domestic market. India’s strong rate of economic growth remained relatively strong. GDP grew by 7.0% in 2011. The overall situation was characterised by dynamic growth in domestic demand. Be-sides private spending, Indian industry’s willingness to invest also powered general economic developments.
U.S.andLatinAmericaThe U.S. economy grew by 1.7% in 2011. Unemployment re-mained at a high level despite a continued and pronounced expansionary monetary policy. However, the emerging mar-kets of Latin America continued their positive development, although at a slower rate.
2007 2008 2009 2010 2011

70 Annual Report 2011
Business operations
Overview of developments on the automobile marketsPositivedevelopmentsontheglobalautomobilemarket The recovery that had begun in 2010 on the global automo-bile markets continued in 2011. However, the positive overall growth rate was dampened by stagnation in the euro zone. Germany was an exception to this and reported healthy growth. The Russian automobile market also grew signifi-cantly once more in 2011. Thanks to positive development in the emerging markets of China and India and a slight recovery on the U.S. market, total global automobile sales increased by 4.5%. The global sales volume therefore totalled roughly 73.1 million automobiles, including around 62.1 million passen-ger cars.
CentralEurope–slightdecreaseoverallThe weakness of the Polish market could not be offset by gains in other markets. For this reason, the Central European market contracted slightly overall, finishing 3.3% below theprevious year. As in 2010, a positive development was reported on the Czech automobile market. Year-on-year gains reached 2.4%, with a market volume of around 173,282 vehicles. A slight increase of 4.6% was reported in Hungary.Croatia (+ 7.6%) and the Slovak Republic (+ 6.5%) were the fastest-growing markets in Central Europe. A total of 40,581 vehicles were sold in Croatia and 68,203 in Slovakia. A substantial decrease in sales was reported in Poland in 2011, however, where weak overall domestic demand impacted the development of the automobile market. After a weak per-formance the previous year, the Polish market shrank by a further 10.7% in 2011, with 297,937 vehicles sold.
WesternEurope–mixedtrendsThe number of new vehicle registrations in Western Europe was 1.4% lower than the previous year in 2011. Individual mar-kets varied greatly. Of the major markets, only Germany re-ported positive growth of 8.8%. The U.K. (- 4.4%) and French (- 2.1%) markets contracted slightly, while Italy’s automobile business reported a strong downward trend of 11.7%.
Some Western European automobile markets, on the other hand, saw positive developments. The strongest growth came from the Netherlands (+ 15.2%), followed by Finland (+ 12.7%), Denmark (+ 10.7%), Norway (+ 8.3%), Austria (+ 8.4%), Switzerland (+8.4%) and Sweden (+ 5.3%). Despite the coun-try’s economic problems, the Irish automobile market al-so showed signs of recovery and grew at a rate of 1.6%. Belgium (+ 4.5%), also posted moderate gains.Southern Europe experienced a strong downward trend. The Spanish market reported major losses in sales (- 18.3%). Hard-est hit were Greece (- 31.0%) and Portugal (- 31.3%), where the market virtually collapsed.
EasternEurope–stronggrowththankstoRussiaThe Eastern European automobile market showed a very pos-itive development in 2011; the total market grew at a rate of 35.2%. The momentum came once again from Russia, which also plays an important part in the ŠKODA growth stra tegy. The Russian automobile market grew at a rate of 39.8% compared with the previous year; the Ukrainian market also reported strong gains (+ 35.7%). The automobile market in Romania, however, showed a negative trend, with a decrease of 11.0%.
Asia/Overseas–ChinaandIndiastillgoingstrongThe Asian growth markets once again provided the main im-petus for the global automobile market with an increase in sales of 5.5% overall in 2011.After two years of massive gains, the Chinese auto market resumed a slightly more moderate rate of growth in 2011. The number of vehicles sold nevertheless rose by 8.1% from 2010. In India, increases in interest rates and petrol prevented an even higher rate of growth. However, India still posted an increase in sales from the previous year, with 2,287,460 ve-hicles sold (+ 5.6%). Trends in the remaining countries in the Asia/Overseas region were also predominantly positive, with growth of 4.4% overall.

71Annual Report 2011
Business operations
Financialsituation
ŠKODAAUTOGroup’s consolidated financial statements arereported in accordance with the IAS/IFRS methodology. The consolidated financial statements include financial resultsoftheparentcompanyŠKODAAUTO,financialresultsofthesubsidiaries ŠKODA AUTO Deutschland, Skoda Auto Polska, ŠKODAAUTOSlovensko,SkodaAutoIndia,andashareinfi-nancialperformanceoftheaffiliatedcompanies.
ŠKODA AUTO GroupAs a result of strong growth in automobile sales and success-ful implementation ofmeasures to boost efficiency, ŠKODAAUTOGroupwas able to enhance its financial performanceonce again in 2011. Group sales revenues rose by 15.1% year-on-year to CZK 252.6 billion, the highest in the Group’s history. Group operating profitgrewby61.3%overthepreviousyeartoreachCZK18.3billion.TheGroup’sprofitafter incometaxofCZK 16.1billionrepresents another new all-time high. The ŠKODA AUTO Group thereby continued on its successful course, with im-provementsinallkeyfinancialindicatorscomparedwith2010.
GroupbusinessperformanceIn 2011, ŠKODA AUTO Group delivered a total of 879,184 auto-mobiles to customers worldwide – an increase of 15.3% over the previous year and also a new record. Group sales revenues reflectedthetrendinsales,withanincreaseof15.1%toCZK252.6 billion. Automobile sales accounted for 84.3% of total Group revenues in the year under review. The best-selling models in 2011 were the ŠKODA Octavia and the ŠKODA Fabia. The strongest year-on-year growth was once again reported by the ŠKODA Yeti, followed by the ŠKODA Superb models.
Sales of genuine parts and accessories also performed well in 2011, generating roughly 7.1% of total Group revenues. Income from the sale of parts to other Volkswagen Group companies, plus other revenues, accounted for around 8.6% of total revenues.Mainly due to significantly higher production volumes, thecost of sales rose by 13.5% year-on-year to CZK 216 billion – although the rate of increase was slower than growth in revenues. Material costs (costs of raw materials, production material and purchased goods), which comprise around three-quarters of the Group’s total costs, accounted for much of the increase. Distribution expenses rose by 20.9% year-on-year to CZK 17.5 billion. Administrative expenses for 2011 totalled CZK 6.1 billion – an increase of 16.5% over the previous year.Grossprofitwas25.3%higherthanthepreviousyearatCZK 36.6billion.Thegrossprofitmargin(grossprofit/revenuesratio) climbed to 14.5% and was therefore 1.2 percentage points higher than in 2010. This was essentially due to improved model mix effects, favourable trends in parts and accessories and further productcostoptimisation.Groupoperatingprofitsurged61.3%toCZK18.3billion.ThefinancialresultincreasedbyCZK1.2billionfromthepreviousyear,resultinginaprofitofCZK791million for the reporting period. This was caused by the accounting evaluationoffinancialcurrencyinstruments.Consolidatedprofitbeforetaxclimbed82.1%toCZK19.3bil-lion.Afterincometaxdeductions,profitaftertaxamountedtoCZK 16.1 billion, an 81.9% year-on-year increase and the high-estprofitsofarinthehistoryoftheGroup.
GroupcashflowsCashflowsfromGroupoperatingactivitiesreachedCZK28.3billion in 2011. Net liquidity rose by 17.7% year-on-year to reach CZK 47.3 billion as at 31 December 2011.
Consolidatedbalancesheetstructure(%)
Assets total
Liabilities total
0 20 40 60 80 100
Non-current assets
Currentassets
Equity
Liabilities

72 Annual Report 2011
Business operations
Consolidatedbalancesheet(CZKmillion)
31.12.2011 31.12.2010 2011/2010
Non-current assets 64,686 58,864 9.9%
Current assets 88,871 76,872 15.6%
Of which: deposits* 49,088 35,678 37.6%
Totalassets 153,557 135,736 13.1%
Equity** 81,211 74,772 8.6%
Non-current liabilities 21,347 15,480 37.9%
Current liabilities 50,999 45,484 12.1%
Totalliabilities 153,557 135,736 13.1%
* interest included ** non-controlling interests included
Consolidatedprofitandlossaccount*(CZKmillion)
2011 2010 2011/2010
Salesrevenue 252,562 219,454 15.1%
Costs of sales 215,956 190,234 13.5%
Grossprofit 36,606 29,220 25.3%
Distribution expenses 17,549 14,509 20.9%
Administrative expenses 6,123 5,256 16.5%
Other operating income 10,040 7,856 27.8%
Other operating expenses 4,717 5,995 -21.3%
Operatingprofit 18,257 11,316 61.3%
Financial result 791 -382 >100%
Profitbeforeincometax 19,275 10,586 82.1%
Income tax expense/income 3,200 1,747 83.2%
Profitafterincometax** 16,075 8,839 81.9%
* As a result of a change in accounting policy for presentation of reversals of excess provisions and accruals in 2011 the comparative figures of the Group for 2010 have been changed. For more information please refer to note 1.3.2. in consolidated financial statements for the Group. ** non-controlling interests included
DevelopmentofGroupfinancing(CZKmillion)
2011 2010 2011/2010
Cashandcashequivalentsasat1January2011 35,986 34,809 3.4%
Cashflowsfromoperatingactivities 28,251 28,168 0.3%
Cashflowsfrominvestingactivities -28,225 -23,313 21.1%
Cashflowsfromfinancingactivities -4,854 -3,640 33.4%
Grossliquidity* 52,791 46,002 14.8%
Balance of financial liabilities** -5,443 -5,791 -6.0%
Netliquidity 47,348 40,211 17.7%
* Gross liquidity consists of closing balance of cash and cash equivalents in the amount of CZK 31,251 million (2010: CZK 35,986 million) and closing balance of other deposits in the amount of CZK 21,540 million (2010: CZK 10,016 million).** The position Balance of financial liabilities contains in addition to financial liabilities also liabilities to a factoring company within the Volkswagen Group in the amount of CZK 2,302 million (2010: CZK 2,563 million).

73Annual Report 2011
GroupassetandcapitalstructureThe Group’s balance sheet total grew by CZK 17.8 billion, or a rate of 13.1% year-on-year, to reach CZK 153.6 billion as at 31 December 2011. This growth stemmed primarily from an in-crease in current assets. Short-term investments and depo-sits, trade receivables and inventories especially contributed to this development.Non-currentassetsrosesignificantlytoCZK64.7billionatbal-ance sheet date – an increase of around 9.9% from 31 Decem-ber 2010. In particular, property, plant and equipment saw a major increase of CZK 3.9 billion (+9.2%) over the previous year, mainly due to expansion of the production network. In addi-tion, deferred tax assets of CZK 1.3 billion (+101%) were formed, which also contributed to the increase in non-current assets.
The Group’s capital structure, as defined by the relativeamounts of equity and liabilities, shifted slightly from the pre-vious year. Group equity, less minority interests, rose by CZK 6.5billiontoCZK81.1billionoverthecourseoftheyear.Profitfor the year boosted equity by CZK 16.1 billion, and dividends totalling CZK 4.7 billion were settled.The Group’s current liabilities increased by CZK 5.5 billion (+12.1%) during the reporting period. Non-current liabilities rose CZK 5.9 billion – to end the year 37.9% higher than the previous year.Tangible and intangible investments (less development costs) reached a total of CZK 14.2 billion in 2011 and were therefore 4.1 billion higher than in 2010. The bulk of spending went in-to product investments in connection with new models and engines.
Business operations
ŠKODA AUTO CompanySinceparentcompanyŠKODAAUTOplaysthemostsignificantrole in theGroup’sfinancial results, thedevelopmentof theCompany’s financial position correspondswith the develop-mentoftheGroup’sfinancialposition.
CompanybusinessperformanceThanks to strong sales development, the Company’s revenues also increasedsignificantlyduring the reportingperiod,withyear-on-year growth of 13.8% to CZK 231.7 billion. Parts and accessories and component deliveries to other Volkswagen Group companies, sales of results of technical development, revenues from license fees and revenues from sale of scrap also contributed to this development.Higher vehicle sales also raised the total cost of sales in the reporting period by 11.9% to CZK 201.8 billion. However, the cost of sales grew at a slower rate than sales revenue.GrossprofitclimbedsharplytoCZK30billion,fora28.4%year-on-year increase. Positive model mix effects, the sale of parts and accessories and product cost optimisation were the main factors behind this, and also contributed to a better gross marginprofit.In this reporting period, distribution expenses rose by CZK 2.2 billion (+22.9% year-on-year), due to both higher sales activity and an increase in marketing and advertising expenses. Ad-ministrative expenses climbed 18.0% year-on-year and other operatingprofittotalledCZK4.4billion.TheCompany’soper-atingprofitforthereportingperiodincreasedby56.1%year-on-year to reach a total of CZK 17.2 billion. The Company re-portedadecreaseinfinancialresultfortheyearunderreview,however.AfterpostingaprofitofCZK180milliontheprevious
year,itrecordedalossofCZK69millionfor2011.Profitbeforetax totalled CZK 17.2 billion in 2011 – a 53.0% increase over the previousyear.Thisalsohadapositiveimpactontheprofittosales ratio, which rose from 5.5% in 2010 to 7.4% in the year underreview.Afterincometaxdeductions,profitaftertaxforthe reporting period amounted to CZK 14.3 billion, thereby ex-ceeding the previous year’s total by 51.9%.
CompanycashflowsOperating cash flow rose by CZK 1.0 billion (+3.8% year-on-year) to reach CZK 27.3 billion, mainly due to higher profitbefore tax.Thiswas reflected inan increase innet liquidity,which reached CZK 41.4 billion as at 31 December 2011 (+18.1%).
CompanyassetandcapitalstructureThe Company’s balance sheet total grew by CZK 13.3 billion or a rate of 10.9% year-on-year, to reach CZK 135.6 billion as at 31 December 2011.Non-current assets rose by CZK 4.5 billion to CZK 64.4 billion (+7.4%). Within the non-current assets categories, the main changes in the reporting period occurred in property, plant and equipment. Deferred tax assets also contributed to the increase in non-current assets, which grew by CZK 1.4 bil-lion and were therefore four times higher than at the close of the previous year. The Company’s total deferred tax assets amounted to CZK 1.8 billion.Current assets increased by a total of CZK 8.9 billion to 71.1 billion CZK as at 31 December 2011.The Company’s equity increased by CZK 4.7 billion (+6.2% year-on-year). At the same time, liabilities rose by 8.6 billion CZK (+18.4% year-on-year) to reach a total of CZK 55.2 billion as at 31 December 2011.

74 Annual Report 2011
Business operations
Subsidiariesandaffiliatedcompanies
ŠKODAAUTODeutschlandGmbHŠKODA remains the leading import brand in Germany, and ŠKODA AUTO Deutschland reported substantial growth in de-liveries to customers in 2011. A total of 128,011 ŠKODA automo-biles were delivered to customers – an increase of 13.0% over the previous year. The best-selling ŠKODA models in Germany in 2011 were once again the ŠKODA Octavia and the ŠKODA Fabia, which remains one of the most popular import cars in Germany. The strong-est growth was posted by the ŠKODA Yeti with a 43.6% in-crease in retail over the previous year.In 2011, ŠKODA AUTO Deutschland generated revenues of CZK 55.3 billion (EUR 2.25 billion). This represents an increase of 22.8% year-on-year.Profit before tax also improved significantly to reach CZK540.4 million (EUR 22.7 million), exceeding the previous year’s figureby22.8%.
SkodaAutoPolskaS.A.Despite the continued sluggishness of the overall market, Skoda Auto Polska was able to maintain automobile deliver-ies to customers at the previous year’s level. A total of 38,116 ŠKODA vehicles were delivered to customers in the reporting period (+0.5%), thereby increasing the ŠKODA market share from 11.3% in 2010 to 12.7%. ŠKODA was therefore able to ex-pand its traditionally strong position in Poland and further dis-tance itself from its competitors.The ŠKODA Octavia continued to lead the Polish sales rank-ing, followed by the ŠKODA Fabia and the ŠKODA Superb. The launch of the ŠKODA Citigo in 2012 will also open up additional opportunities for growth in Poland.Skoda Auto Polska reported sales revenues of CZK 11.7 billion (-4%) for the reporting period. Profit before tax was 25.4%lower at CZK 114 million.
ŠKODAAUTOSlovenskos.r.o.The ŠKODA brand remains the market leader in Slovakia. It was able to strengthen its position in 2011 and increase market
share by 0.9 percentage points to 22.1%. Solid sales growth laid the foundation for this. Deliveries to customers rose by 11.2% year-on-year to reach 15,182 vehicles.The ŠKODA Octavia is the best-selling ŠKODA model in Slo-vakia with 6.659 vehicles, followed by the ŠKODA Fabia with 5.749 deliveries to customers.The subsidiary generated sales revenues of CZK 5.8 billion for the reporting period – an increase of 10.2% over the previous year.Profitbeforetaxroseby17.9%toCZK62.6million.
SkodaAutoIndiaPrivateLtd.In the rapidly-growing Indian market, ŠKODA was able to gain market share once again in 2011. A total of 30,005 ŠKODA automobiles were delivered to customers on the Indian sub-continent – an increase in sales of 49.9% compared with the previous year. The positive trend in sales was reported across the model lines ŠKODA Fabia and ŠKODA Yeti. After a face-lift the previ-ous year, the ŠKODA Fabia achieved record sales in the Indian market once again in 2011. Production of the ŠKODA Rapid developed specially for the Indian market will open up further growth opportunities for the ŠKODA brand in India.The Indian subsidiary’s 2011 revenues totalled CZK 15.4 billion, a 23.4% increase year-on-year. ProfitbeforetaxincreasedinthereportingperiodtoCZK63.7million,surpassingthepreviousyear’sfigureby62.9%.
OOOVolkswagenGroupRusThe ŠKODA brand crossed the 3% market share threshold in Russia in 2011. A total of 74,074 ŠKODA vehicles were delivered to customers there in 2011 – 62.5% more than the previous year. ŠKODA therefore strengthened its position in this cru-cial growth market. The ŠKODA Octavia is also the best-selling ŠKODA model in Russia.The associate’s total 2011 revenues amounted to CZK 120.4 billion and were therefore 64% higher than the previous year. ProfitbeforetaxreachedCZK2billionintheyearunderreview,an improvement of CZK 3.8 billion

75Annual Report 2011
Business operations
The top priority for the management of ŠKODA AUTO is to continuously increase the value of the Group over the long term. Through its responsible use of the available resources, the Group is not only securing its own future but also helping ensure a viable environment.
ConsistentvalueenhancementasthefoundationforsustainabledevelopmentLike any company, ŠKODA AUTO faces many different de-mands. The interests of the various stakeholders – from own-ers through customers, employees and neighbours to diverse interest groups – can only be served within the context of the sound economic development of the Group. Business success and sustainable development are mutually dependent and therefore inseparable. As a company, ŠKODA AUTO therefore faces the challenge ofgenerating reliable long-termoperatingprofits toexceedthe cost of capital. This is what creates the scope for further investments, new products and technologies and improve-ments in quality. The management of ŠKODA AUTO is therefore geared to-wards the efficient use of all resources and assuring theGroup’s long-term, sustainable growth.
Financialmanagement:focusingon capitalefficiencyInthiscontext,thefinancialmanagementoftheŠKODAAUTOGroup aims for an optimised asset and capital structure. The Group tracks “return on capital employed” (RoCE) to meas-uretheefficiencyof itscapital investments.This indicator isused as the key measure of the success of the ŠKODA AUTO Group. It also plays an important role in investment decisions, evaluating the economic viability of products and projects, and measuring the success of different Company activities. Returnon capital employed is definedas the ratioof oper-atingprofitafternational incometax to thevalueofcapitalemployed inachievingtheoperatingprofit.Thenotionaltaxliability is based on the Volkswagen Group’s long-term effec-tive tax rate. The capital employed corresponds to the aver-age value of operating assets (tangible and intangible assets, inventories, trade receivables and a portion of receivables re-ported under the “Other” item), less the value of non-interest-bearing capital (trade liabilities with the exception of advances received and unbilled deliveries). In 2011, the Group’s RoCE was 21.1% (2010: 13.2%).
Value-basedmanagement
Groupreturnoninvestedcapital(CZKmillion)
2011 2010
Operating profit before tax 18,257 11,316
Notional income tax * 5,477 3,395
Operatingprofitafternotionaltax 12,780 7,921
Capitalemployed 60,591 60,084
Returnoncapitalemployed(%) 21.1 13.2
* Long-term effective tax rate of the Volkswagen Group ( 2010 and 2011: 30%).

76 Annual Report 2011
Business operations
Technicaldevelopment
The on-going expansion of the model range and the diverse demands of customers in markets around the world will be the key challenges for ŠKODA AUTO’s Technical Development division over the coming years. To face these challenges, the Company created 153 new jobs in Technical Development in the year under review and now employs 1,737 people in this area. ŠKODA AUTO’s expenditure for technical development totalled CZK 9.4 billion in 2011. This is an increase of 22.3% over the previous year. The close cooperation between research centres within the Volkswagen Group is a key success factor for the whole Group. ŠKODA AUTO is an important partner in this network. In the year under review, ŠKODA AUTO’s Technical Development re-ceived CZK 547 million worth of orders from other Volkswagen Group brands – an increase of CZK 96 million or 21.0% year-on-year.
Newdesignconcept:VisionDandMissionLŠKODA AUTO unveiled examples of the brand’s character-istic new design line with the VisionD design study at the Geneva Motor Show and the production-ready MissionL at the IAA Motor Show in Frankfurt. With its clean, sharp looks, the MissionL is designed to appeal to a global public and therefore play a central role in the ŠKODA’s worldwide growth strategy. The new ŠKODA will be released in Europe, Russia and China in 2012.
Cleversolutionsforcitytraffic:ŠKODACitigoThe ŠKODA Citigo marks ŠKODA AUTO’s debut in the small car segment and was designed primarily as a city car. In 2011, the four-seater small car was launched on the Czech market. Over the course of 2012, it will also be released in other European countries. Offering generous space in a compact package as wellasahigh levelofefficiency, theŠKODACitigoperfectlyembodies the ŠKODA “Simply clever” brand philosophy. Active and passive safety were of particular importance in the devel-opment of this vehicle. With its head-thorax side impact air-bags for extra passenger protection and the “City Safe Drive” braking assistant, the ŠKODA Citigo guarantees an unusually high standard of safety for its class. Newly-developed engines ensure excellent fuel economy and low CO2 emissions. The Green tec version of the 44kW engine uses only 4.1l/100 km and produces no more than 96g CO2/km in emissions.
InnovativesafetyconceptsforwidermodelrangeThe expansion of the model range also increases the need forresearchanddevelopmentinthefieldofactiveandpas-sive safety. With the acquisition of the crash-test facility in the Czech town of Úhelnice from the previous owner, TÜV SÜD AG,
in September 2011, ŠKODA AUTO added further capacity for important crash-test programmes. The Company therefore enabled itself to expand its own crash-test programme to entire vehicles or vehicle parts and step up its research into passenger safety. Further investment in the expansion of the facility is planned.
Newenginetestcentre:expansionof ŠKODAAUTOenginedevelopmentŠKODA AUTO’s decision to build its own engine testing centre underlines the importance of development and optimisation of fuel-efficientandenvironmentally-friendlyenginestotheGroup. Construction of the test centre is slated to begin in November 2012, with commissioning in the second half of 2013.
Furtherstepstowardsemission-freemobilityŠKODA AUTO is systematically pursuing a future of zero-emis-sion driving. Following on from the presentation of the ŠKODA Octavia Green E Line at the Paris Motor Show in October 2010, the next logical step was taken in 2011 with the launch of a fleetofthesecarsforpracticaleverydaytesting.Thegoalistogain ground-breaking insights into driving behaviour and the safety of these vehicles over short and long ranges. The eval-uationofthefindingsfromthisfieldtrialwillprovidethebasisfor further development of e-mobility under the ŠKODA brand.
Fuelefficiency:Record-breakingdriveconfirmsefficiencyŠKODA automobiles already set the standard for fuel econ-omy. Austrian driver Gerhard Plattner proved this in May 2011 by driving more than 2,000 kilometres without stopping once for fuel. On his route from Austria to Denmark and back he drove through the whole of Germany, not just once, but twice, in a series-produced ŠKODA Fabia GreenLine. The vehicle’s av-erage fuel consumption at the end of the journey was exactly 2.21 litres/100 km.
Majorrallywins–therewardforyearsof developmentworkVictories in the 2010 and 2011 IRC manufacturer and driver competitionsandthefirst-everSuper2000WRCworldcham-pionship title in 2011 showcased the exceptional qualities of the ŠKODA Fabia Super 2000. Without such a high-perfor-mance car, these major sporting successes would never have been thinkable. Continuous research and development laid the foundations. The successful use of ŠKODA technology under rally’s extreme conditions also prove the high quality of series production and therefore the outstanding reliability of ŠKODA automobiles in everyday driving.
77Annual Report 2011
Business operations
CreatingtherightconditionsforgrowthandinternationalisationThe successful implementation of the ŠKODA growth stra-tegy also creates many challenges for purchasing – both in the procurement of purchased parts and in the planning and monitoring of the relevant processes. It was also essential for the companies in the Volkswagen Group to work together to master the difficult situation on the rawmaterials marketsand further reduce material costs, in light of the anticipated increases in volume.A large number of production ramp-ups were in preparation in2011,withcorrespondingprocurementneedstobefulfilled.To meet requirements for the ramp-up of the ŠKODA Citigo, for example, ŠKODA AUTO worked closely with Volkswagen Group Purchasing and assumed responsibility for key areas at Group level: For instance, ŠKODA AUTO is in charge of procur-ing equipment for production in Mladá Boleslav of the MQ 100 transmission used throughout the Volkswagen Group’s Up! product family.From 2012 on, the DQ 200 dual clutch transmission will be manufactured at the Vrchlabí site. Here, once again, procure-ment plays a key role in process and production planning as well as the supply of purchased parts.On-going construction activities at the plants – in particular, the expansion of ŠKODA Octavia production at the Mladá Boleslav plant, the retooling of the Vrchlabí plant to manu-facture transmissions and the capacity expansion in Kvasiny – have brought new responsibilities for the purchasing division. The priority is to implement these plans in the most economi-cal and timely manner possible.Plant preparations for the production ramp-up of ŠKODA automobiles at the Company’s Russian production partner, GAZ, are on schedule. This is also largely the responsibility ofthepurchasingdivision.ThefirstŠKODAYetimanufacturedby GAZ is due to roll off the assembly line in Nizhny Novgorod by late 2012.Working with Volkswagen Group India Private Ltd. and Volkswagen Group Purchasing, the purchasing division of ŠKODA AUTO also assured the start of production of the ŠKODA Rapid in Pune, India.
OpportunitiesfrominternationalisationThe Group’s increasing internationalisation opens up new op-portunities for the procurement of purchased parts and pro-duction material: The inclusion of additional suppliers creates a wider range of options, while greater purchasing localisation alsoboostsefficiency.
SecuringmaterialsuppliesoverthelongtermThe planned increase in sales to 1.5 million vehicles by 2018 also means much higher purchasing volumes. Key steps were therefore taken in conjunction with Volkswagen Group Purchasing in 2011 to ensure the supply of parts and produc-tion material over the long term. This was also undertaken in response to the parts supply crisis caused by the earthquake in Japan in March 2011. By working with Group Purchasing and the departments concerned, it was possible to resolve the dif-ficultsupplysituation.
MuchhigherpurchasingvolumeThe Group reported total expenditure of CZK 127.9 billion for the purchase of production material in 2011 – an increase of CZK 17.5 billion or 15.9% year-on-year. The Czech Republic still accounts for the majority (55%) of this purchasing volume, fol-lowed by Germany, where about a quarter (26%) of production materials by volume is purchased.The number of suppliers for production-related resources rose to 1,432 (2010: 1,317 suppliers). 288 of these business partners are based in the Czech Republic, 31 in the direct vicinity of the Mladá Boleslav site. In 2011, the total number of suppliers in general purchasing reached 6,044 (2010: 5,749); with a corresponding purchasing volume of CZK 28.5 billion (2010: CZK 20.7 billion).
Negativeimpactfromrawmaterials2011wascharacterisedbytheon-goingdifficultsituationonthe international raw material markets. Volatility is on the in-crease in most markets – which presents new challenges for purchasing. Price developments in steel, plastics and rubber, in particular, but also, increasingly, rare earth elements, had a negative impact on purchasing prices. However, counter-measures using new sources and different types of contracts, as well as alternative and new technologies, were launched in conjunction with Volkswagen Group Purchasing.
“Simplyclever”–inPurchasingaswellSpreading the “Simply clever” idea throughout the Group leverages additional potential for Purchasing. This is exploited alongside on-going process improvements, so that available resourcescanbeusedmoreefficiently.Forexample, in2011,by optimising materials and reducing the number of variants, life-cycle savings of several million euros were achieved for the gear lever knob alone.
Purchasing

78 Annual Report 2011
Business operations
ExpansionofproductioncapacityforglobalgrowthEfficient production is an essential requirement for globalgrowth. With a view to ŠKODA’s internationalisation and growth strategy, measures to expand production were there-fore a priority in 2011. Capacity expansion got underway at the Mladá Boleslav and Kvasiny plants in the Czech Republic. Outside the country, measures to expand production at part-ner plants in Shanghai, China, Aurangabad, India and in Kaluga and Nizhny Novgorod in Russia also started.
NewproductionsitesfortheŠKODAYeti inRussiaandChinaTo meet growing demand for the ŠKODA Yeti compact SUV, production will be expanded to Russia and China. ŠKODA AUTO has great expectations for Russia: An agree-ment was reached with Russian automobile manufacturer GAZ in June 2011 and the assembly of the ŠKODA Yeti at its plant in Nizhny Novgorod started in October 2011.Over the past four years, more than 500,000 ŠKODA cars have been built at Volkswagen Shanghai, China. With the produc-tion of the ŠKODA Yeti at the facility from 2013 on, this will gain further momentum.
NewmodelsasgrowthdriversIn the second half of the year, ŠKODA AUTO launched its planned product offensive with the ŠKODA Citigo in the small car segment and the compact sedan, ŠKODA Rapid, posi-tioned between the ŠKODA Fabia and the ŠKODA Octavia. Se-ries production of the ŠKODA Citigo, initially as a three-door variant, began in October 2011 at the Company’s partner plant in Bratislava. Production of the ŠKODA Rapid also started the same month at the Pune plant in India.
MladáBoleslav–mainplantwithprospectsforthe futureTen million vehicles have been built at the plant in Mladá Boleslav since automobile production began there in 1905.The ten-millionth car, a white ŠKODA Fabia Monte Carlo, rolled off the assembly line on 12 October 2011. It underscored the importance of the plant to the ŠKODA brand and its identity built on tradition.The Mladá Boleslav location is central to the implementation oftheŠKODAgrowthstrategy.Theflexibilityofthebodyshopand paint shop there has been enhanced, while SKODA Octa-via assembly capacity will be expanded by mid-2012. The cere-
Productionandlogistics
CHINA
INDIA
UKRAINE
CZECH REPUBLIC
RUSSIA
KAZAKHSTANSLOVAKIA
ProductionofŠKODAvehiclesworldwide
901,000 cars built in 2011

79Annual Report 2011
Business operations
mony to mark the twentieth anniversary of the partnership with Volkswagen began with ŠKODA AUTO clearly looking to the future of the brand as well as its past – with a symbolic ground-breaking for the new construction measures. The expansion mainly concerns production of the highly-successful ŠKODA Octavia. To meet growing global demand for this model, assembly capacities in Segment I will be sub-stantially increased from 800 vehicles/day currently to 1200 vehicles/day. Once the Mladá Boleslav plant expansion is complete, plans also call for a third model to be built there alongside the best-selling ŠKODA Octavia and ŠKODA Fabia.
Higherproduction–forindividualcomponentsalsoThe main ŠKODA AUTO plant celebrated another anniversary on 13 October 2011: more than 500,000 1.2l TSI engines built at the Mladá Boleslav facility since the start of production in 2009. A total of 529,522 engines were produced in Mladá Boleslav in 2011: 287,100 of which were 1.2 l TSI aggregates, plus another 242,422 1.2 l MPI engines.Implementation of the ŠKODA growth strategy also requires increased production of individual components. The new ve-hicle generation, known as NSF “New Small Family” demands new and smaller aggregates. For this reason, the new weight and space-optimised MQ 100 transmission went into produc-tion at the Mladá Boleslav plant in July 2011 with a produc-tion capacity of 1,100 units/day. Mladá Boleslav also produces the MQ 200 transmission with a capacity of 2,200 units/day alongside the MQ 100 transmission. The MQ 200 transmission production figures increased from 534,033 units in 2010 to604,096 units in 2011.ŠKODA AUTO uses its transmission and engine production capacities not just for its own models, but also to supply other brands within the Volkswagen Group. A total of 413,645 MQ 100 and MQ 200 transmissions and 338,605 1.2 l MPI and 1.2 l TSI engines were manufactured in Mladá Boleslav for the Volkswagen Group in 2011.
Substantial investments were made in the manufacture of front and rear axles for the ŠKODA Superb, ŠKODA Yeti and ŠKODA Octavia models at the Mladá Boleslav plant in 2011. The new, 66-metre production line for rear axles doubled the ex-isting production capacity to 1,700 axles/day. The cycle time was thus reduced to 30 seconds. The new production line will also build axles for the ŠKODA Roomster, ŠKODA Fabia and ŠKODA Octavia in the future.
Vrchlabíplant–switchingtohigh-end transmission manufactureProduction of the ŠKODA Octavia and ŠKODA Roomster con-tinued at the Vrchlabí plant in 2011. From late 2012 on, the inno-vative and technologically-sophisticated high-end DQ 200 dual clutch transmission will be produced in Vrchlabí. The DQ 200 will be used in ŠKODA brand vehicles, as well as in other Volks-wagenGroupbrands.Thefirststepsofthisproductioncon-version were already undertaken in 2011. Once transmission manufacture begins, the Vrchlabí plant will be producing one of the most innovative automatic transmissions in the entire automobile industry. ŠKODA AUTO will be investing a total of CZK 5.9 billion in the plant over the coming years.
Kvasinyplant–100,000YetiperyearinthefutureThe ŠKODA growth strategy also calls for a capacity increase at the Kvasiny plant. A total of 100,000 ŠKODA Yeti per year are to be built there in the future to meet strong global demand for this model. To achieve this, a new 18-shift model was intro-ducedinKvasinytofurtherboosttheplant’sefficiency.
Trainingensurescompetitionandgrowth opportunities The ŠKODA growth strategy and the additional demands it places on employees mean that on-going professional train-ing plays a crucial role in achieving the Company’s goals. For this reason, in-company training in the area of production and
Productionofenginesandtransmissions(units)
100,000 200,000 300,000 400,000 500,000 600,000
MQ 100 transmission
MQ 200 transmission
1.2 TSI engine
1.2 l engineTotal production 2010
Produced for the Volkswagen Group
Total production 2011
Produced for the Volkswagen Group
0

80 Annual Report 2011
Business operations
logistics was intensified in 2011 with the opening of newtraining centres for the paint and pressing plant at the Mladá Boleslav location. Furthermore, the foundation of the new Lean Centre was laid on 13 December 2011 and a new training facility was opened at the service centre in Kosmonosy. An as-sembly training centre and a Lean Centre were also set up at the Aurangabad plant in India.ŠKODA AUTO will make substantial investments in the future to ensure training for all production and logistics employees at its locations in the Czech Republic and abroad.
Production increases for all modelsA total of 900,628 ŠKODA vehicles were manufactured world-wide in 2011. This represents a 15% increase compared with the previous year. The importance of Shanghai, China con-tinued to grow: A total of 223,030 ŠKODA Octavia, ŠKODA Fabia and ŠKODA Superb cars were produced here in 2011 – a year-on-year production increase of 13.2%.Production of Volkswagen and Audi brand models in Aurang-abad, India also increased. A total of 7,870 vehicles of these two brands were manufactured here.
ŠKODA Fabia— The ŠKODA Fabia was in strong demand once again in 2011 and remains one of the mainstays of ŠKODA automobile production. A total of 261,107 ŠKODA Fabia vehicles were produced worldwide – 10.2% more than the pre-vious year (2010: 236,973 ŠKODA Fabia vehicles).
ŠKODA Roomster — The ŠKODA Roomster, which is pro-duced exclusively at the Vrchlabí plant, reported a produc-tion increase of 19.5% over the course of 2011. 36,427 units of this model were manufactured in total (2010: 30,473 ŠKODA Roomster vehicles).
ŠKODA Octavia — The ŠKODA Octavia remained the main volume model in the ŠKODA product family once again in 2011. A total of 402,462 vehicles were produced worldwide. The Octavia therefore accounted for the largest share of ŠKODA AUTO production in 2011 with 44.7% (2010: 357,129 ŠKODA Octavia vehicles, 45.6% of total ŠKODA AUTO production).
ŠKODAYeti— The growing success of the ŠKODA Yeti led toanothersignificantincreaseinproductionofthismodelin2011. With 77,312 vehicles produced, the ŠKODA Yeti reported the highest production gains for a single model over the year. The year-on-year increase reached 47.1% (2010: 52,550 ŠKODA Yeti vehicles).
ŠKODA Superb — The ŠKODA Superb confirmed its ap-peal on many markets with a further upturn in sales in 2011, which was reflected in a corresponding increasein production. A total of 119,732 ŠKODA Superb and ŠKODA Superb Combi vehicles left the production lines. This represents an increase of 13.3% over the previous year (2010: 105,694 ŠKODA Superb vehicles).
Portfolioofmodelsmanufacturedworldwide(asat31December2011)
Cit
igo
Fabia
Rapid
Ro
om
ste
r
Oct
avia
Yeti
SuperbII
VWJetta
VWPassat
AudiA6
AudiA4
AudiQ5
Mladá Boleslav (Czech Republic)
Vrchlabí (Czech Republic)
Kvasiny (Czech Republic)
Bratislava (Slovakia)
Kaluga (Russia)
Aurangabad (India)
Pune (India)
Shanghai (China)

81Annual Report 2011
Business operations
ŠKODAproduction
2011 2010 2011/2010
ŠKODAbrandproduction
Fabia* 142,115 125,596 13.2%
Fabia Combi 73,023 68,079 7.3%
Fabiatotal 215,138 193,675 11.1%
Roomster 33,414 27,728 20.5%
Roomster Praktik 3,013 2,745 9.8%
Roomstertotal 36,427 30,473 19.5%
Octavia* 142,289 119,884 18.7%
Octavia Combi 131,953 113,221 16.5%
Octaviatotal** 274,242 233,105 17.6%
Yeti 77,312 52,550 47.1%
Superb II 26,009 24,970 4.2%
Superb Combi 44,882 40,969 9.6%
Superbtotal 70,891 65,939 7.5%
TotalŠKODAbrand 674,010 575,742 17.1%
ProductionofotherVolkswagenGroupbrands
VW Passat 1,338 786 70.2%
VW Jetta 1,858 4,339 - 57.2%
Audi A6 1,254 810 54.8%
Audi A4 2,328 1,224 90.2%
Audi Q5 1,092 432 > 100%
TotalotherVolkswagenGroupbrands 7,870 7,591 3.7%
TotalŠKODAGroup 681,880 583,333 16.9%
ProductionofŠKODAcarsinPune
Rapid 2,561 - -
TotalŠKODAPune 2,561 - -
ProductionofŠKODAcarsinBratislava
Octavia - 10,000 -
Octavia Combi - - -
Octaviatotal - 10,000 -
Citigo 1,027 - -
TotalŠKODABratislava 1,027 10,000 -
ProductionofŠKODAcarsinChina
Fabia 45,969 43,298 6.2%
Octavia 128,220 114,024 12.5%
Superb II 48,841 39,755 22.9%
TotalŠKODAChina 223,030 197,077 13.2%
TotalŠKODAworldwide 900,628 782,819 15.0%
* including disassembled vehicle kits distributed to production plants outside ŠKODA AUTO Group ** includes Octavia, Octavia Tour I and Octavia Tour II, production of Octavia Tour I was suspended in 2010

82 Annual Report 2011
Business operations
Salesandmarketing
Newsalesrecordin2011ŠKODA AUTO Group ended 2011 with a new record of 879,184 vehicles delivered to customers worldwide – an increase of 15.3% over the year 2010. All regions contributed to this devel-opment,confirmingthatŠKODA’sgrowthand internationali-sationstrategywasalreadyhavingadefiniteimpactinitsfirstyear of implementation.
CentralEurope–positivetrendoverallin weakmarketsIn Central Europe, ŠKODA AUTO Group was able to boost sales and gain valuable market share. A total of 123,156 vehicles were delivered to customers – an increaseof 1.7%.Difficulteconomic conditions in several Central European countries preventedevenbettersalesfigures.In the Czech Republic, ŠKODA maintained its undisputed posi-tion as the leading automobile brand and was able to increase the number of vehicles delivered to customers to 58,202 units. Sales gains were also reported in markets with moder-ate growth, such as Slovakia (+ 11.2%) and Slovenia (+ 10.4%). ŠKODA AUTO Group recaptured market share in Poland, with
38,116 vehicles delivered, and continued to expand its posi-tion as market leader. The same applied to Hungary, where ŠKODA AUTO delivered 5,750 vehicles (+0.4%) to customers in a weak consumer market.
EasternEurope–RussiastilldrivingsalesŠKODA continued to make gains in Eastern Europe, where it delivered a total of 108,423 vehicles to customers – an in-crease of 47.0% over the previous year. Russia, one of the key markets in ŠKODA’s growth strategy, was once again the main growth driver in 2011. Building on the previous year’s growth of 38.1%, deliveries to customers rose 62.5% to reach a total of 74,074 automobiles. ŠKODA AUTO al-so increased delivered volumes in the Ukraine for the second consecutive year. The Company delivered 10,909 automobiles to customers there and ended 2011with a significant salesincrease of 42.6% (2010: + 17.1%). ŠKODA AUTO was even able to expand its market share and improve its market position in Romania’s otherwise shrinking automobile market, with the delivery of 8,192 automobiles (+ 2.4%).
Deliveriestocustomers–largestmarkets
Deliveriestocustomers(vehicles) Changein% %shareofpassengercarmarket**
2011 2010 2011/2010 2011 2010
TotalŠKODAbrand 879,184 762,600 15.3% 1.4% 1.3%
China 220,089 180,515 21.9% 1.8% 1.6%
Germany 128,011 113,323 13.0% 4.0% 3.9%
Russia 74,074 45,577 62.5% 3.0% 2.6%
Czech Republic 58,202 58,033 0.3% 33.4% 34.0%
United Kingdom 45,282 41,632 8.8% 2.3% 2.1%
Poland 38,116 37,918 0.5% 12.7% 11.3%
India 30,005 20,019 49.9% 1.3% 0.9%
France 22,356 20,394 9.6% 1.0% 0.9%
Austria 21,208 18,803 12.8% 5.9% 5.7%
Netherlands 20,879 15,408 35.5% 3.8% 3.2%
Belgium 18,900 15,756 20.0% 3.3% 2.9%
Italy 17,345 18,276 - 5.1% 1.0% 0.9%
Switzerland 16,298 14,320 13.8% 5.1% 4.8%
Spain* 15,873 18,944 - 16.2% 2.1% 2.0%
Slovakia 15,182 13,650 11.2% 22.1% 21.2%
* excl. Canary Islands ** total markets

83Annual Report 2011
Business operations
WesternEurope–stronggrowthinamixedfieldŠKODAAUTOimproveditssalesfiguresforWesternEuropein2011.Despitethedifficulteconomicsituationinseveralcoun-tries within the euro zone, a total of 361,777 vehicles were de-livered to customers in this region, resulting in a sales increase of 8.6%. In the key German market, ŠKODA AUTO once again expanded its market share, to 4.0% currently. With 128,011 vehicles deliv-ered to customers (+ 13.0%), Germany remains ŠKODA AUTO’s second-largest single market. ŠKODA AUTO was also able to boost sales in other major WesternEuropeanmarketsin2011.InthefiercelycompetitiveFrench market, the number of deliveries rose 9.6% to 22,356 automobiles in 2011. ŠKODA AUTO was also successful in the U.K., where it delivered 45,282 cars (+ 8.8%) to customers and expanded its market share; in Ireland, it reported a slight de-crease in deliveries to customers of 5.2% as a result of the economic crisis. The Netherlands, on the other hand, per-formed well with a growth rate of 35.5% and total deliveries of 20,879 vehicles.Most Southern European automobile markets saw deliveries to customers fall, due to the tense economic situation in the region. Never theless, ŠKODA AUTO was able to gain market share in Italy. In Spain, ŠKODA deliveries to customers were lower than in 2010 at 15,873 vehicles, although the brand was still able to gain market share in a sharply declining market.
Portugal’s automobile market felt the full impact of the eco-nomicandfinancialcrisisinthecountryandturnedsignificant-ly negative. As a result, ŠKODA AUTO was also impacted and deliveries to customers decreased by 1,888 vehicles (- 41.9%).
Overseas/Asia–ChinaandIndiaremainstrongThe Overseas/Asia region, including the growth markets of China and India, plays a key role in ŠKODA’s growth strategy. Deliveries to customers in this region grew dynamically once again in 2011, with a total of 285,828 ŠKODA automobiles de-livered here (+ 21.9%). With 220,089 vehicles delivered to customers (+ 21.9%), China in particular, as the world’s largest market for ŠKODA auto-mobiles, was the driving force behind this positive trend. India alsoconfirmeditsgrowthpotentialforŠKODAwithanimpres-sive increase of 49.9% to reach a total of 30,005 vehicles de-livered to customers. ŠKODA had already reported growth in deliveries to customers of 37.7% here in 2010.TheintroductionoftheŠKODARapidreflectsthegrowingsig-nificanceoftheIndianmarketforŠKODAAUTO,whichbeganbuilding this compact car in the Indian city of Pune in Septem-ber 2011. The car was developed specially for the needs of the Indian market and released in late 2011. Positioned between the ŠKODA Fabia and the ŠKODA Octavia, the ŠKODA Rapid is designed to capture additional market share in India’s key compact class.
Deliveriestocustomers(vehicles) Changein% %shareofpassengercarmarket**
2011 2010 2011/2010 2011 2010
Central Europe* 123,156 121,063 1.7% 17.7% 16.8%
Eastern Europe 108,423 73,747 47.0% 3.6% 3.3%
Western Europe 361,777 333,261 8.6% 2.8% 2.6%
Overseas/Asia 285,828 234,529 21.9% 0.6% 0.5%
TotalŠKODAbrand 879,184 762,600 15.3% 1.4% 1.3%
* incl. Czech Republic ** total markets
50,000 100,000 150,000 200,000 250,000 300,000 350,000
Deliveriestocustomersbyregion
Overseas/Asia
Western Europe
Eastern Europe
Central Europe
2010
2011
0

84 Annual Report 2011
Business operations
A total of 35,734 ŠKODA automobiles were delivered to cus-tomers in the remaining markets of the Overseas/Asia region in 2011 – an increase of 5.1% year-on-year.
Successinallmarketsegments
ŠKODAFabiaŠKODA Fabia confirmed its status as one of ŠKODA’s high-volume models once again in 2011. After a decrease in per-centage terms on a year-on-year basis due to the impact of national measures to revive car sales during the 2009 crisis, demand for this model increased substantially in the year un-der review. A total of 266,763 ŠKODA Fabia cars were delivered to customers worldwide – this is the highest annual ŠKODA Fabia volume ever delivered. The largest market for this series is Europe. More than 70% of ŠKODA Fabia vehicles worldwide in 2011 were delivered to customers on this continent. One of the main performance drivers was the new ŠKODA Fabia Mon-te Carlo with a delivered volume of 7,554 vehicles in Europe.
ŠKODA RoomsterSales of the ŠKODA Roomster rebounded in 2011 from the previous year’s decline. A total of 36,010 models were deliv-ered worldwide. This represents an increase of 11.4%. 3,005 vehicles (8.3%) were ordered as the utility version, the ŠKODA Praktik.
ŠKODA OctaviaThe ŠKODA Octavia once again underscored its key role as the best-selling car in ŠKODA’s global model line-up. With 387,183 vehicles delivered to customers in 2011, volumes grew by an-other 10.7%, building on an already strong 2010. With 125,611 vehicles delivered to customers, the ŠKODA Octavia Combi now accounts for 32.4% of total ŠKODA Octavia sales.
ŠKODAYetiThe ŠKODA Yeti is currently the car with the highest rate of sales growth among all ŠKODA vehicles. 70,321 ŠKODA Yeti vehicles were delivered to customers in 2011, 33.7% more than the previous year. In only its second full year of production, theŠKODAYetiisalreadyfirmlyestablishedwithintheŠKODAmodel family. The success of this compact SUV also proves how the Company can quickly and successfully position itself with a new model in a new market segment.
ŠKODASuperbThe top-of-the-range ŠKODA Superb model performed well in 2011 with a healthy increase in sales volumes. A total of 116,726 ŠKODA Superb models were delivered to customers worldwide in the year under review – an increase of 18.1% compared with the previous year. The ŠKODA Superb is es-pecially popular in China: In this country alone, no fewer than 48,000 of these models were delivered, 28.5% more year-on-year.
Deliveriestocustomersbymodel
2011 2010 2011/2010
Citigo 510 - -
Fabia 192,852 161,358 19.5%
Fabia Combi 73,911 67,687 9.2%
Fabiatotal 266,763 229,045 16.5%
Rapid 1,671 - -
Roomster 33,005 29,514 11.8%
Roomster Praktik 3,005 2,818 6.6%
Roomstertotal 36,010 32,332 11.4%
Octavia 261,572 235,735 11.0%
Octavia Combi 125,611 114,011 10.2%
Octaviatotal* 387,183 349,746 10.7%
Yeti 70,321 52,604 33.7%
Superb - 5 -
Superb II 73,125 63,146 15.8%
Superb Combi 43,601 35,722 22.1%
Superbtotal 116,726 98,873 18.1%
TotalŠKODAbrand 879,184 762,600 15.3%
* includes Octavia, Octavia Tour I and Octavia Tour II; production of Octavia Tour I was suspended in 2010

85Annual Report 2011
Business operations
SixthandseventhmodellinesaddedŠKODA AUTO unveiled its production-ready MissionL concept car at the IAA International Motor Show in Frankfurt, provid-ingafirstglimpseofitspreviously-announcedsixthmodelline– the all-new compact limousine. The new car will premiere in European markets in 2012 followed closely by Russia and China. A variant of the new model developed specially for the Indian market, the ŠKODA Rapid, was already delivered to cus-tomers there in 2011. November 2011 saw the launch of ŠKODA’s seventh model line, the ŠKODA Citigo, in the Czech Republic. ŠKODA AUTO expects the new model line to generate new momentum for growth in Europe over the year 2012. Further expansion of the model range will be top priority for ŠKODA AUTO over the coming years. Plans call for a new model to be presented and launched on the market every six months on average.
FleetbusinessasgrowthdriverThefleetmarketwasonceagainoneofthefastest-growingbusinessfields in2011.ŠKODAfleetsales (not incl.China) inthis market segment rose to 239,413 units (2010: 188,900). Thestrongestsales region forfleetbusinesswas,as in theprevious year, Western Europe, with 147,138 vehicles. This was followed by Central Europe with 59,555 units and Eastern Europe – the Ukraine and Russia in particular – with 16,809 vehicles. Germany remained the largest single market for fleetbusiness in 2011. A total of 56,153 vehicles joinedGer-manfleets,accountingfor23.5%ofŠKODA’stotalannualfleetsales. ŠKODA AUTO also launched its “Fit For Fleet” programme in 2011 to create a more comprehensive and professional of-fering for commercial customers and small and mid-sized companies in particular. The programme consists of three main pillars to be developed within the importers’ and es-pecially thedealers’ organisations toupgrade them tofleetcentres, establishing professional processes, developing the necessary sales competence and providing adequate prod-uctsandtoolsforthefleetcustomer.Theprogrammehasal-readybeenrolledoutatmorethan40pilotfleetcentresinsixEuropean countries.After a significant jump in salesfiguresatthesefleetcentres,“FitForFleet”issettorolloutatmoredealers and expand to other countries in 2012.
HighercapacityfordistributionofGenuinePartsandAccessoriesQuality, wide assortment, availability and last, but not least, customer satisfaction – these are the guiding principles of the ŠKODA Genuine Parts and Accessories department. Thanks to the widening of the product range, the number of Genuine Parts and Accessories delivered to more than 100 different markets all over the world is also growing. The Genuine Parts and Accessories logistics department ships more than 24,000 customer items every day. That is why the number of items processed has increased signifi-cantly over the last decade. This development has prompted the extension of the logistics centre for Genuine Parts and Accessories.Thefirstexpansionphase–theextendedincom-inganddistributionterminal–wasfinishedandputintotestoperation in November 2011. The second phase of the ŠKODA parts centre expansion will entail construction of a fully- automated high-rack warehouse with a height of 40 metres and a capacity of 30,000 palettes, and will be completed by the end of next year. The overall space of this warehouse will comprise 74,500 m2.The ŠKODA E-shop was launched in November 2011 to boost customer satisfaction and increase the availability of ŠKODA Genuine Parts and Accessories. In the initial phase, customers from the Czech Republic can order Genuine Accessories and gift products. In the second phase, the ŠKODA E-shop will be rolled out in other markets. Revenues from sales of Genuine Parts totalled CZK 15.7 bil-lion in 2011, representing an annual increase of 3.1% (2010: CZK 15.2 billion).The Group is responding by offering Genuine Accessories to the growing segment of customers who demand a higher degree of individuality, and is at the same time widening its leisure product offering to meet high quality criteria. The revenues generated from sales of ŠKODA Genuine Ac-cessories have reached CZK 2.2 billion. This represents a total increase of 5.8% compared to 2010 (CZK 2.1 billion).
Customer orientation as top priority Anefficientsalesandservicenetworkplaysanintegralpartinthe ŠKODA growth strategy and is imperative to its success. For this reason, numerous process and quality optimisation initiatives were launched in this area in 2010 and continued

86 Annual Report 2011
Business operations
in 2011 to help maintain ŠKODA’s renowned high standards of delivery speed and reliability as the sales and service net-work expands, particularly in growth markets. The continued implementation of the “Human Touch” programme is designed to ensure that the sales and service network retains its customer-friendliness and customer orientation in times of dynamic growth.
CustomerserviceemployeesrecognisedCustomer service is becoming increasingly important in to-day’s highly-competitive automotive business. ŠKODA AUTO is responding to this development with a whole range of measures to improve service quality. A new Service Training Centre for the continuous training and professional education of ŠKODA’s service team all over the world was opened in late 2011 in Mladá Boleslav - Kosmonosy. Its purpose is to guarantee and further enhance the quality of customer service.In 2011, ŠKODA AUTO launched its “ŠKODA Service Challenge” for service staff worldwide. Only service mechanics and re-ceiving technicians who had excelled in preliminary national contests in 38 countries made it through to the challenging final round inPrague.Theoryandpractical skills inallmajorareas of customer service were rigorously tested.
Newcorporatedesignshowcases “NewPowerofŠKODA”In March 2011 ŠKODA AUTO introduced its new corporate de-sign at the Geneva Motor Show. It is intended to support sys-tematic internationalisation and to mark the beginning of a
new era of growth at the ŠKODA brand. The core of the visual solution is the traditional “winged arrow”, which in its modern shape and usage of the newest design elements, symbolises “New Power of ŠKODA”, creating a bridge between the tradi-tion of the brand and its modern approach to the future.
NewmediafornewtargetgroupsIn connection with its new corporate design, ŠKODA AUTO also expanded its social media activities in 2011. Brand, pro-duct and company news are now instantly available around the world via ŠKODA sites on Facebook and YouTube. This initiative is aimed at promoting closer contact with customers and reaching out to new and younger target groups.
SportssponsorshipenteredinGuinnessBookofWorldRecordsRecognition of the ŠKODA brand and its new image got a decisive boost from sponsorship activities in 2011. The brand’s sponsorship of the Ice Hockey World Championships and the Tour de France, in particular, with global TV and internet cov-erage, brought it into contact with relevant target groups. ŠKODA AUTO reached roughly 700 million viewers worldwide through its Ice Hockey World Championship involvement alone.Professional sports promotion has a long tradition at ŠKODA AUTO. Its 19-year cooperation with the organisers of the Ice Hockey World Championships has even earned ŠKODA AUTO a place in the Guinness Book of World Records as “the longest-standing main sponsor in the history of sport-ing world championships”.

87Annual Report 2011
Business operations
Implementation of ŠKODA’s growth strategy and the inter-nationalisationoftheGroupdefinedactivities intheareaofhuman resources management during the year 2011. The top priority for Human Resources is to enhance ŠKODA AUTO’s at-tractiveness as an employer in international competition over the coming years. ŠKODA AUTO’s Human Resources Management division is a proactive partner for the departments and supported them in 2011 with a wide range of activities to recruit and retain the best employees over the long term. Their work focused on intensivequalificationmeasuresandmoreaggressiverecruit-ment. A successful international recruitment campaign led to a substantial increase in the number of job applicants. More than 21,000 people applied for a job with ŠKODA AUTO in 2011. The strong loyalty and motivation of its employees remain the backboneof theCompany’ssuccess.Thiswasconfirmedbyan employee survey conducted in 2011 with 93% partici pation. Theresultsalsoconfirmedafurtherincreaseinmotivation.
ŠKODA AUTO continues to attach great importance to re-taining qualified employees over the long term. Long-termemployment, work-life balance, health protection and gen-der and diversity management are an everyday reality for Company employees. In light of the increasing internatio n-alisation of the Company, a further challenge for the Human Resources division is to promote employee mobility and make foreign assignments more attractive, particularly in manage-ment functions. This will intensify know-how transfer within the Company and at the same time offer employees extensive opportunities for personal development – which more person-alandflexibleHRsupportwillmakeeasiertotakeadvantageof than in the past.
NumberofemployeesincreasesAt the end of 2011, ŠKODA AUTO Group employed 26,565 per-manent staff worldwide (+ 1,851 employees, including train-ees). The number of active permanent employees therefore increased by 7.5% from the previous year. The average num-ber of permanent employees during the year totalled 25,787 – an increase of 4.4%.Internationalisation and the Group’s steady growth also secure employees’ jobs in the Czech Republic. In the year under review, the number of employees in both Mladá Boleslav and Kvasiny increased. Production of the DQ 200 dual clutch transmission for the Volkswagen Group from 2012 on will also secure the future of the Vrchlabí site. ŠKODA AUTO employed a permanent workforce of 24,936 in the Czech Republic at the end of 2011 – 7.0% more than at the end of 2010. Outside the Czech Republic – at subsidiaries in Slovakia, Germany, Poland and India – ŠKODA AUTO employed 1,629 people as at 31 De-cember 2011. This represents a substantial increase in work-force of 15.9%.The Company also uses temporary employment to be able to respondflexiblytochangingconditions.Theaveragenumberof temporary ŠKODA AUTO employees worldwide during 2011 totalled 2,336.
Humanresourcesmanagement
QualificationstructureoftheCompany’scoreemployees
12.7% University education
5.5% Basic education
48.3% Technical secondary education
33.5% Secondary education with certificate

88 Annual Report 2011
Business operations
FocusonvocationalandprofessionaltrainingProfessional development of employees, with a focus on training, is a key element of ŠKODA AUTO’s human resources policy. To prepare employees for the further development of ŠKODA and enhance the competitiveness of the Company in accord-ance with its growth strategy, a main focus in professional training was laid on language courses and intercultural train-ing. Thanks to its secondary education institutes and its own ŠKODA AUTO university, the Company was able to train many of its future employees in-house in 2011. A total of 766 ap-prentices were training for future careers at ŠKODA AUTO in 2011. In this way, the Company not only assumes social responsi-bility at its sites, but also takes active steps to counter demo-graphic trends in Europe.
EmployerbrandingasakeyfactorEmployer branding surveys conducted in 2011 once again ranked ŠKODA AUTO among the most popular companies in the Czech Republic. The Company continues to lead the CZECH TOP 100 list and is therefore the most respected com-pany in the country. The results of the survey show how effective the actions taken sofarhavebeenandconfirmtheCompany’soverallemployeeorientation. The aim is to further enhance the Company’s at-tractiveness as an employer in international competition, so it is in a position to recruit talent worldwide. With this in mind, the ŠKODA AUTO career website was completely redesigned
and relaunched in 2011. A wide range of training placements abroad were established and an English-language manage-ment trainee programme introduced.One measure of the success of these activities is the number of foreign placement students and degree candidates with the Company, which climbed to 680 in 2011 (+ 25%). ŠKODA AUTO is one of a few companies in the Czech Republic with its own university – based at the Na Karmeli education centre in Mladá Boleslav. More than 950 students are current-ly training for their professional careers at the Na Karmeli edu-cation centre, while almost 80,000 people attend Company courses and classes there. The Technical University of Liberec, with which ŠKODA AUTO works closely on materials research, also conducts training at Na Karmeli, and uses the laboratories on its premises for this purpose. The Company also collabo-rates with other universities in the Czech Republic, as well as many in other countries – including Tongji University in Shang-hai. In this way, ŠKODA AUTO is securing itself a competitive position in the global “war for talent” and therefore building the foundation for further international expansion.ŠKODA AUTO supports its employees’ activities and sugges-tions for improvements. This includes its Z.E.B.R.A. project, aimed at continuously improving production processes within the Company and putting various innovations into practice. No fewerthan4,350employeessubmittedspecificsuggestionsfor improvements in 2011 – 11,241 of which are already regis-tered in the system. The success rate for suggestions rose to 71.7%in2011(2010:67.3%),andthebenefitsfortheCompanytotalled CZK 305.4 million.
AgestructureoftheCompany’scoreemployees
0 2,000 4,000 6,000 8,000
over 60
51-60
41-50
31-40
21-30
up to 20

89Annual Report 2011
Business operations
Groupworkforce
31.12.2011 31.12.2010 2011/2010
Company–permanentemployees 24,177 22,506 7.4%
of which:
- Mladá Boleslav plant 19,691 18,355 7.3%
- Vrchlabí plant 860 1,004 - 14.3%
- Kvasiny plant 3,626 3,147 15.2%
Company – apprentices 759 802 - 5.4%
Company–employeestotal* 24,936 23,308 7.0%
Subsidiaries – permanent employees 1,622 1,399 15.9%
Subsidiaries – apprentices 7 7 -
Subsidiaries–employeestotal* 1,629 1,406 15.9%
ŠKODAAUTOGroupemployeestotal* 26,565 24,714 7.5%
* excl. temporary employees, representing the number of employees as at 31 December.

90 Annual Report 2011
Business operations
Corporate sustainability is both an aspiration and an obliga-tionforŠKODAAUTO.Basedonthefirmbeliefthatonlythosewho act responsibly can be successful over the long term, the Company adheres to the principle of sustainability and gives economic, social and environmental aspects equal considera-tion.TheCompanyactivelyfulfilsitsresponsibilitytowardsitscus-tomers, employees, shareholders, business partners and the general public. Responsible conduct in all areas and towards all stakeholders is an integral part of ŠKODA AUTO´s corporate culture and also plays a key role in the Group’s strategy.
Environmental responsibilityFocusonlowemissionsToday’s ŠKODA automobiles are already characterised by their efficiencyandfueleconomy,with37modelswithCO2 emis-sions of less than 120 grams per kilometre. Since 2010 there has been at least one GreenLine variant in eachmodellines,offeringevenhigherstandardsofefficiencyand environmental-compatibility – without compromising on comfortorperformance.Technicalandaerodynamicmodifica-tions make ŠKODA GreenLine versions the most environmen-tally-compatible and economical variants in their respective model range. The second generation of ŠKODA GreenLine models, released in 2011, was able to offer even greater ef-ficiencyandenvironmental-friendliness.ŠKODA AUTO also pursues the goal of lower consumption and emissions with the Green tec package available throughout the entire model range. This technology package includes an automatic start/stop function, brake energy regeneration and
tyres with optimised rolling resistance. It ensures environ-mental-conscious mobility at the same level of comfort and performance.The new ŠKODA Citigo model also meets ŠKODA’s high stand-ards for the fuel and emissions efficiency of its vehicles. The Green tec version of this vehicle, with a 1.0 litre-engine and an output of 44kw, has an average fuel consumption of 4.1 litres/100 km and CO2 emissions of only 96 grams/km. ŠKODA AUTO takes its responsibility for pioneering deve-lopments in individual mobility very seriously and presented the fully-electric ŠKODA Octavia Green E Line concept car for that reason back in 2010. In 2011, ten of these cars were then launchedasatestfleet.Theaimwastolearnpracticallessonsfor the on-going development of everyday emission-free mo-bility.Safetyissuesareanotherimportantaspectofthefieldtrial. With this project, ŠKODA AUTO is consistently working towards its goal of having zero-emission cars ready for series production as soon as possible.
EnvironmentalprotectionatŠKODAAUTOAs a responsible company, ŠKODA AUTO is also under ob-ligation to minimise the environmental impact of its vehicle production. In this respect, all legal requirements are met, and new, stricter standards are complied with as early as possible. Continuous improvements in environmental protection are firmlyentrenchedintheCompany’spolicyandstrategy.Suc-cessful implementationoftheseprincipleswasconfirmedin2011, among others, by the ISO 14001:2004 control audit.
EnvironmentalprotectionfornewinvestmentsThe ŠKODA growth strategy also involves a large number of investments to increase capacity, particularly at its Czech
Sustainability
24 26 28 30
2010
2011
2009
2008
2007
Volatileorganiccompound(VOC)emissionsper1sq.m.ofpaintedbodyarea(gVOC/m2)
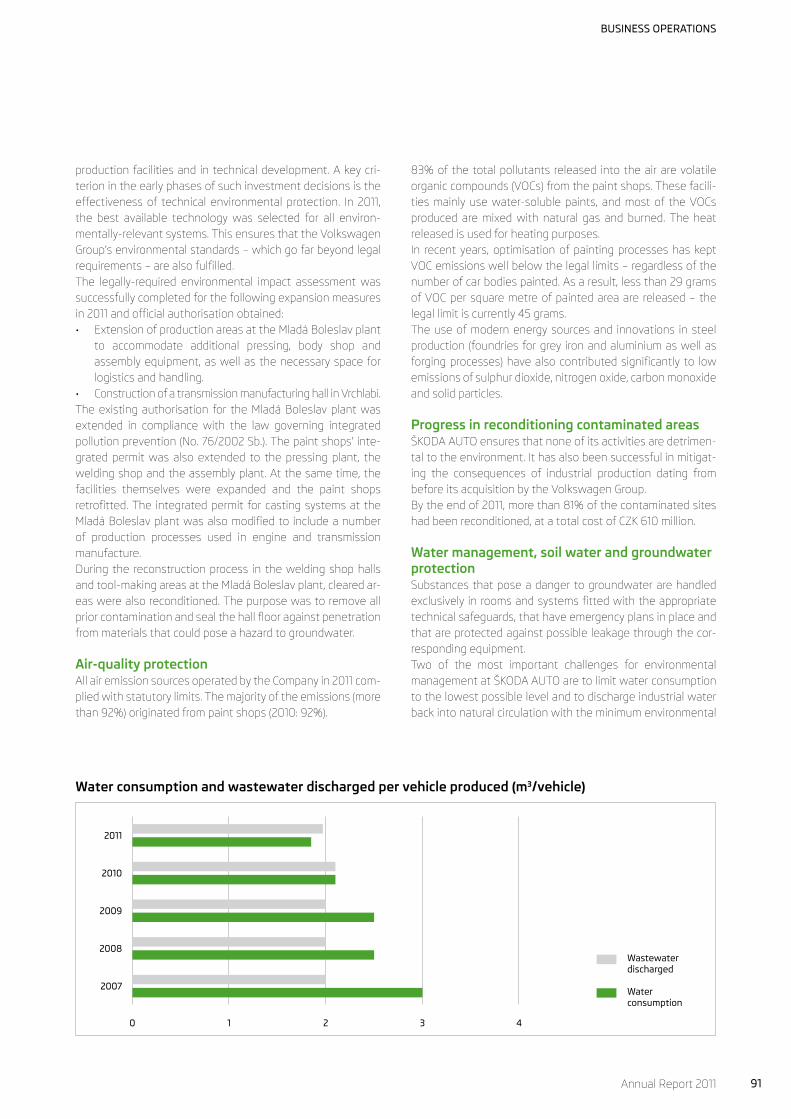
91Annual Report 2011
Business operations
production facilities and in technical development. A key cri-terion in the early phases of such investment decisions is the effectiveness of technical environmental protection. In 2011, the best available technology was selected for all environ-mentally-relevant systems. This ensures that the Volkswagen Group’s environmental standards – which go far beyond legal requirements–arealsofulfilled.The legally-required environmental impact assessment was successfully completed for the following expansion measures in2011andofficialauthorisationobtained:• ExtensionofproductionareasattheMladáBoleslavplant
to accommodate additional pressing, body shop and assembly equipment, as well as the necessary space for logistics and handling.
• ConstructionofatransmissionmanufacturinghallinVrchlabí.The existing authorisation for the Mladá Boleslav plant was extended in compliance with the law governing integrated pollution prevention (No. 76/2002 Sb.). The paint shops’ inte-grated permit was also extended to the pressing plant, the welding shop and the assembly plant. At the same time, the facilities themselves were expanded and the paint shops retrofitted.The integratedpermitforcastingsystemsattheMladáBoleslavplantwasalsomodifiedtoincludeanumber of production processes used in engine and transmission manufacture.During the reconstruction process in the welding shop halls and tool-making areas at the Mladá Boleslav plant, cleared ar-eas were also reconditioned. The purpose was to remove all priorcontaminationandsealthehallflooragainstpenetrationfrom materials that could pose a hazard to groundwater.
Air-qualityprotectionAll air emission sources operated by the Company in 2011 com-plied with statutory limits. The majority of the emissions (more than 92%) originated from paint shops (2010: 92%).
83% of the total pollutants released into the air are volatile organic compounds (VOCs) from the paint shops. These facili-ties mainly use water-soluble paints, and most of the VOCs produced are mixed with natural gas and burned. The heat released is used for heating purposes.In recent years, optimisation of painting processes has kept VOC emissions well below the legal limits – regardless of the number of car bodies painted. As a result, less than 29 grams of VOC per square metre of painted area are released – the legal limit is currently 45 grams.The use of modern energy sources and innovations in steel production (foundries for grey iron and aluminium as well as forgingprocesses)havealsocontributedsignificantly to lowemissions of sulphur dioxide, nitrogen oxide, carbon monoxide and solid particles.
ProgressinreconditioningcontaminatedareasŠKODA AUTO ensures that none of its activities are detrimen-tal to the environment. It has also been successful in mitigat-ing the consequences of industrial production dating from before its acquisition by the Volkswagen Group.By the end of 2011, more than 81% of the contaminated sites had been reconditioned, at a total cost of CZK 610 million.
Watermanagement,soilwaterandgroundwaterprotectionSubstances that pose a danger to groundwater are handled exclusivelyinroomsandsystemsfittedwiththeappropriatetechnical safeguards, that have emergency plans in place and that are protected against possible leakage through the cor-responding equipment.Two of the most important challenges for environmental management at ŠKODA AUTO are to limit water consumption to the lowest possible level and to discharge industrial water back into natural circulation with the minimum environmental
Waterconsumptionandwastewaterdischargedpervehicleproduced(m3/vehicle)
0 1 2 3 4
2007
2008
2009
2010
2011
Wastewater discharged
Water consumption

92 Annual Report 2011
Business operations
impact. Trends in water consumption and wastewater volume per vehicle produced confirm the success of these efforts.Wastewater quality is also considerably higher than the pre-scribed limits.
WastemanagementIn waste management, ŠKODA AUTO subscribes to the prin-ciple of “prevention, then recovery, then disposal”. Processes are designed to prevent waste and keep the volume of waste as low as possible. Reducing the volume of hazardous waste is a priority. Waste is disposed of in an environmentally- sound manner only when all recycling possibilities have been exhausted.Implementation of this strategy has steadily reduced the vol-ume of waste per vehicle produced in recent years (see chart). This progress becomes quite clear from a long-term perspec-tive: Back in 1993, the production of a single car produced 132 kilograms of waste per vehicle, compared with only 33 kilograms in 2011. Only 8.9% of the total waste volume was ultimately disposed of in landfills or incinerators in 2011. Most waste, includingmetals, was recycled. This applies in particular to glass, paper, waste oil, solvents, wire and electronic waste.
InvestmentinenvironmentalprotectionA total of CZK 134 million was invested in preventive environ-mental protection measures in 2011 as part of construction and modernisation projects. Total investment in environmen-tal protection since 1991 amounts to CZK 10.2 billion.
Social responsibilitySocial responsibility has always played a key role at ŠKODA AUTO. As one of the Czech Republic’s leading companies, ŠKODA AUTO believes it has a special responsibility for its employees and
their families, and – as a good neighbour – for people in the communities where its plants are located. The Company pays particular attention to the welfare of its employees,offeringabroadrangeofsocialbenefits,guaran-teeing health and occupational safety standards, and provid-ing a unique system of corporate training and professional development. Furthermore, the Company focuses on equal opportunities, issues arising from an aging population and employee diversity.ŠKODA AUTO complies with all relevant recommendations of the Code of Corporate Governance, by which it declares its openness towards the public, transparency of its internal processes and relations with the sole shareholder. The Com-panymaintainsbilateralandmutuallybeneficialrelationshipswith suppliers and follows the legacy of its founders, Laurin and Klement, stating that “...only the best we can do is good enough for our customers.”The Company pursues a long-term policy of dedicating maxi-mum effort to limiting the negative impact of its operations on the environment. This pertains not only to the Company’s own production and sales operations, but also to its selection of suppliers who meet the most stringent ISO 14000 environ-mental standards. Use of alternative energy sources and de-velopment of new products allows ŠKODA AUTO to reduce its output of CO2 emissions.
MakingroadsafetyapriorityAside from sporting, cultural and social activities pursued within the scope of ŠKODA AUTO’s social responsibility, meas-ures to improve road safety have become increasingly impor-tant. Projects include funding for children’s traffic-themedplaygrounds in the regions where the Company’s production plants are located, and the development of a unique internet application “ŠKODA hrou” (“Playful ŠKODA”) designed to make learning about road safety fun.In cooperation with the City of Mladá Boleslav, the Company
0 10 20 30 40 50
2010
2011
2009
2008
2007
Wastepervehicleproduced(kg/vehicle)

93Annual Report 2011
Business operations
has been implementing a project spanning several years enti-tled “A Safe Journey to School”. In addition, technology boost-ing road safety for pedestrians was installed in the vicinity of ŠKODA AUTO factories in cooperation with local municipali-ties. Another project designed to improve safety features in cars is “Traffic Safety Research” under which the Companycollaborateswithfirefighters,policeandhospitalsatthesiteoftrafficaccidents.In2011,ŠKODAAUTOwasonceagainthegeneral partner for a traffic contest “Cesty městy” (“Roadsthrough Cities”) organised by the Partnership Foundation. The contestpromoteswell-designedtrafficsolutionsforreducingtrafficdensityinCzechcitiesandmunicipalities.
SupportofsocialactivitiesŠKODA AUTO is involved in sponsorships at both local and re-gional levels, i.e. directly where its factories operate, and also on a nationwide and global scale. In cooperation with leading foundations and charitable organisations, the Company spon-sors a variety of social, cultural and humanitarian projects. The Company ensures that it also supports sporting events involv-ing persons with disabilities.
CultureandtheartsŠKODA AUTO’s traditional partners include the Czech Phil-harmonic, the National Theatre, the National Museum and the National Technical Museum. The Company also supports selected international events held outside Prague, such as Smetana’s Litomyšl and the International Film Festival for Children and Youth in Zlín. In addition, ŠKODA AUTO has es-tablished partnerships with the Festival of German Language in Prague and the Municipal Theatre in Mladá Boleslav.
SocialcommitmentŠKODA AUTO is a long-time supporter of the Paraple Centre, specificallyasasupplierofvehicleswithadjustedhandsteer-ing,whichhelp patients becomemore self-sufficient.Otherprojects funded by the Company include the Forum 2000 Foundation, the Foundation for Cancer Research and the Paralympic Committee.
ŠKODA AUTO continues its long-term funding of the organi-sation “Zdravotní klaun” (“Clown Doctors”), which arranges for professional clowns to visit seriously-ill children across the Czech Republic under the motto “laughter is the best doctor”.Another project named “One tree planted for each car sold in the Czech Republic” demonstrates ŠKODA AUTO’s active ap-proach to environmental protection: It allows employees and their families to volunteer for the Company’s social respon-sibility activities. By the end of 2011, nearly 300,000 trees had been planted in more than 40 locations as part of the project.
CommitmentrewardedIn 2011, ŠKODA AUTO was honoured for its exemplary employ-ment policy for people with disabilities. As part of the Czech Republic‘s “Best full responsibility enterprises” prize, the Com-pany took home the award in the “Socially worthwhile project of the year 2011” category. The extensive steps ŠKODA AUTO takes to employ people with disabilities are recognised. This year, the enterprise already received the “Employer without barriers” prize for this commitment. ŠKODA AUTO supports the reintegration of people with disa-bil ities into working life in many ways. One of the main ele-ments consists of no fewer than six workshops employing 200 people with disabilities. In close cooperation with the la-bour union OS KOVO, the manufacturer creates new employ-ment perspectives for disabled people at these facilities. The first facilityof thiskindwasopened in2006, thenewest inMladá Boleslav in October 2010.
ŠKODA AUTO provides further information on the subject of sustainability online at http://go.skoda.eu/sus-dev-en. All of the Company’s sustainability reports can be found here, as well as details of each area of activity and the latest news.

94 Annual Report 2011
Business operations
fehlt

95Annual Report 2011
risk report
The global operations of ŠKODA AUTO Group in automotive markets pose numerous risks that may have a negative im-pact on its financial performance and business success. Atthe same time, economic and legislative changes may lead to a variety of opportunities that the Group strives to utilise to strengthen and further improve its position among competi-tors. Therefore, it is necessary to identify risks arising from op-eratingactivitiesinatimelyfashionandsignificantlyminimiseor eliminate them by applying the proper control system.
Risk management organisation
The risk management structure in ŠKODA AUTO Group is based on the standardised risk management system within Volkswagen Group, which complies with the requirements of the German law on control and transparency in business (KonTraG). Risk management, as an operating component of thebusinessprocess,mustidentifyspecificrisksindetail,as-sesstheirscope,definemeasurestoeliminatetherisksandacquire evidence of the effectiveness of the measures. The overall risk management is centrally run by the Controlling Department in coordination with the Internal Audit Depart-ment and the Governance, Risk & Compliance Department. The joint implementation of the risk management system is described in and ensured by the “Risk Management” opera-tional directive. The risk monitoring system is based on decentralised ac-countability. On an annual basis, standardised inquiries con-cerning assessment of risk situations are forwarded to staff authorisedtocoverrisksinspecificoperationsunits,includingsubsidiaries. Based on feedback, the complete picture of a po-tential risk situation is subsequently updated and each identi-fiedriskisassignedaqualitativeprobabilityofoccurrenceandarelativescopeofdamage.Pertinentmeasuresaredefinedfor each risk in the form of regulations and operational direc-tives with the aim to minimise or eliminate the risk. Opera-tional directives, rules and regulations and job descriptions in thisfieldarestrictlystipulatedandmostlyaccessibleonline.Adherence to these measures is ensured by internal controls performed by the head of the relevant organisation unit, inter-nal audit, the Quality Control Department, Controlling and the Governance, Risk & Compliance Department.The provision of timely and relevant information to manage-ment is a basic prerequisite for effective risk management, aimed at the identification of potential risks and preven-
tion of impending harm to the Company as a going concern by implementing pertinent countermeasures.The management regularly receives a report containing a de-scription of the most material risks to which individual units of the Group, including subsidiaries, are exposed. In accordance with the strategic objectives, measures leading to the elimi-nation or mitigation of risks are proposed and subsequently implemented. The results of these measures are continuously monitored and assessed.The risk management system is integrated into the planning, controlling and business processes system, and its effective-ness and sufficiency are regularly evaluated. The riskman-agement process is optimised on an on-going basis. In this, both internal and external requirements, such as the German Accounting Law Modernisation Act (BilMoG), are of equal impor-tance. The objective of the improvements made to the system is to ensure continuous monitoring of the relevant risk areas, including the organisational units responsible.
Risk description and management
ThemostsignificantrisksfacingtheGrouparefinancialandsector-specificrisks,risksarisingfromchangesintheoveralleconomic and political conditions and changes in legislation, operating risks and other risks, such as those arising from changes in quality and risks in the area of human resources.
Economic,politicalandlegislativerisksWith regard to the Group’s business activities, its financialposition issignificantly influencedbygeneraleconomiccon-ditions, such as the state of the economy and the related economic cycle, legislative changes, and also the political situ-ation in the countries where the Group is active.The ŠKODA brand operates in many countries worldwide not only as an exporter, but also as a local manufacturer, and is thus affected by general developments in both the global economy and relevant national economies. Aftertheeconomicrecoveryin2010andinthefirsthalf-yearof 2011, problems with unfavourable economic development in Greece, Italy, Spain and Portugal started to emerge. This negative trend is accompanied with a persistent threat of risks related to a high level of public indebtedness, high rate ofunemployment,andfluctuationsinpricesofpreciousmet-als, lead, rubber, copper, aluminium, steel, petrol and plastic. OthersignificantrisksthatcouldaffecttheGroup’sbusiness
Risk management system

96 Annual Report 2011
risk report
activity in global markets include a divergent pace of economic growthinspecificcountriesorregionsandavulnerablebank-ing system.Exports to countries carrying potential territorial and political risksareidentifiedwell inadvanceandhedgedusingstand-ard,approvedproductsofthefinancialandinsurancemarkets.Inthisfield,theGrouphaspartneredwithCzechandinterna-tional banking organisations, including EGAP.Intensifying political crises, terrorist activities and possible pandemics can have a negative impact on the world’s auto-motivemarkets and, subsequently, on the Group’s financialposition.In addition, the Group’s financial performance may be ad-versely affected by additional technical-development costs incurred due to changes to legal regulations, such as more stringent legislative requirements for vehicle safety, fuel consumption and reduction in harmful emissions, as well as changestostandardvehiclespecifications.Intermsoflegis-lation pertaining to environmental protection, tightening of the European Union laws governing exhaust-gas emissions needs to be anticipated. Risks ensuing from legislation guar-anteeing scrapping of old cars at no charge through collection pointsdesignatedbycarmakersandimportersaresufficientlycovered by creating provisions.
DemandrisksGrowing and sharper competition in the automotive sector is manifest in increasing support for sales. This is further exacer-bated by market risks related to change in customer demand, as the purchase behaviour of customers depends not just on actual conditions, such as real wages, but also on psychologi-cal factors. To mitigate these risks to a maximum extent, the Group continuously performs analyses of competition and customer behaviour.
Purchase risksVerycloseandeconomicallybeneficialcollaborationbetweencarmakers and their suppliers poses procurement-related risks that might disrupt production, such as late deliveries, failure to deliver and quality defects. Other risks arise from the ever-stronger competition in the supplier industry. To mitigate these risks, the Group has teamed up with additional suppli-ers in sourcing parts for vehicle assembly. In addition, preven-tive measures are being adopted within the risk management system to address possible supplier insolvency. The market
situation is being assessed on an on-going basis, which al-lows for a quick response to changed conditions. As a result of these measures, the Group can prevent purchase risks and problems that might arise due to delivery interruptions.
FinancialrisksFinancial risks and their management have been one of the most closely monitored segments of ŠKODA AUTO Group’s Risk Management over the long term.In terms of materiality, of primary importance is the risk stem-ming from changes in exchange rates, which affect gener-atingcashflows in foreigncurrenciesand their subsequentconversion into the local currency, the Czech crown (CZK). Fluctuations in exchange rates can therefore pose a key risk to the Group’s business performance.The effect of changes in exchange rates and their impact on performance are regularly monitored, assessed and managed with the use of standard instruments approved across the Group. The aim of hedging is to mitigate the currency risk of anticipatedcashflowsfromoperatingactivities.The Group primarily uses forward foreign exchange trans-actions and foreign exchange swaps for hedging. All these transactions are executed to comply with the requirements of the international accounting standards for hedge accounting.As prices of commodities have grown increasingly volatile in recent years, risks arising from hedging purchases of raw materials used for manufacture of products and services pro-vided by the Group’s companies have become more pressing, in particular risks related to procurement of aluminium, cop-perandlead.Futureconsumptionofspecificcommodities isplanned over the long turn and, in line with the Group’s joint strategy, is hedged with standard derivative instruments.Similar to its management of the foregoing foreign exchange and commodity price risks, the Company actively manages the potential impact of developments in interest rates.The Group guards against credit risks by using hedging instru-ments, both preventive (e.g. retention of title, advance pay-ment, documentary letter of credit, etc.) and subsequent (e.g. recognition of liability, payment calendars, bills of exchange). TheGroupemploys standardprocedures andfinancial–mar-ket instruments to manage the liquidity risk that might arise fromfluctuationsincashflows.Theprimaryinstrumentsarefinancialsourcesprovidedintheeventofneedbytheparentand other Group companies in combination with credit lines negotiated with external banks.

97Annual Report 2011
risk report
The total volume of the secured resources is determined in or-dertoallowforsufficientcoverageofanyshortfallsinliquidity over a necessary period stipulated by the Groups’ internal rules.
ResearchanddevelopmentrisksNew products carry an inherent risk that customers might not accept them. Therefore the Group performs extensive analy-ses and customer surveys. Trends are identified early andtheir relevance for customers is tested. Another potential risk arises from the Group’s possible failure to launch production start-ups within the scheduled timeline, in the required quality and with target expenditures. This risk is eliminated by carry-ing out on-going project checks and making comparisons with thedesiredspecifications.Thisallowsrequisitemeasurestobeadoptedintheeventoffindinganyaberrations.
QualityrisksDue to growing competition pressures, the increasing com-plexity of production technologies and the large number of suppliers, quality assurance is an important part of the manu-facturing process. Despite maintaining an effective and sys-tematic approach to quality assurance, product–liability risks cannot be entirely eliminated. In order to minimise quality risks from the very beginning, the Group endeavours to prevent these risks from occurring in all processes affecting product quality,specificallybyimplementingqualitymethodsandcon-trols and performing a variety of tests. These processes com-prise conceptual and development stages, serial production and care for the car during customer use. For the purpose of timelyidentificationoftrends,itisimportanttoshareknow-how and, in cooperation with suppliers, develop tools and possible controls for quality management to maintain product quality at a level that meets the requirements and expecta-tions of the Group’s customers.
HumanresourcesrisksHuman resources management to a great extent reflectscurrent circumstances in ŠKODA AUTO Group‘s key markets. These circumstances typically comprise a highly competitive environment, stagnation of the developed automotive mar-kets and fast growth of the emerging markets. As an employer with considerable social responsibility, ŠKODA AUTO Group makes an extraordinary effort to preserve jobs and retain key personnel. To facilitate this outcome, the employees are continuously trained and systematically prepared to face new
challenges within the Group with the aim to achieve maximum flexibility and performance of the staff, while guaranteeingsafe jobs and a high standard of remuneration for work done.
Informationtechnology(IT)risksIn the area of information systems and technologies, the Group takes great care to protect itself against risks involv-ingdataavailability,confidentialityandintegrity.Increasedat-tention is paid to unauthorised access to and misuse of data through various measures relating to employees, the organi-sation, applications, systems and data networks.Employees are subject to the Company’s directives on han-dling information and internal regulations governing the safe use of information systems. Technical measures include standardactivities,suchasusingfirewallandguardingaccessto individual Group systems and applications. Antivirus protec-tion, managed application administration, as well as limited access rights and data back-ups constitute an additional level of protection against the misuse of sensitive information.With regard to the fast technological development in the IT fieldandgenerallyincreasingactivitiesofexternalentitiesat-tempting to gain unlawful access to corporate data, the Group cannot completely exclude the risk posed to information se-curity. The foregoing organisational and technical safeguards implemented within the Information Security Management System (ISMS) aimed to minimise this risk and its impact on the Group’s economic targets.
LegalrisksThe Group conducts business activities in more than one hun-dred countries worldwide, which can involve risks pertaining to legal disputes against suppliers, dealers and customers, as well as risks of administrative proceedings related to particular areas of business activities of the Group.
Other operating risksAside from the aforementioned risks, there are factors of influence that cannotbepredictedand thatmayaffect theGroup’s future development. Such events comprise mainly natural disasters, epidemics and other threats.
Summary assessment of Group risk positionThe overall risk position of ŠKODA AUTO Group ensues from theforegoingspecificrisks.Theriskmanagementsystemen-suresthatthespecificrisksminimisedasfaraspossible.

98 Annual Report 2011
outlook
Short-termandlong-termoutlook
Although the global economy lost some of its momentum in the second half of 2011, the forecast for 2012 is positive. Av-erage growth of 3% is forecast for 2012. Economic develop-ments in the euro zone will largely depend on the German and French economies. China will remain one of the world’s fast-est-growing economies in 2012, although the pace of growth will slow somewhat. India is also expected to see steady growth.However,thefightagainstinflationwillplayacrucialrole here. In Russia, gross domestic product is forecast to grow at roughly the same high rate as in 2011. One of the main risks for the global economy is the high rate of unemployment in a number of euro zone countries and in the United States. The persistently high level of national debt in certain countries and the crisis-prone banking system could also jeopardise the growth forecast for the global economy.
CzechRepublicThe forecast for 2012 assumes a slight upward trend in the Czech economy. The automobile industry is likely to be one of the driving forces behind the country’s on-going economic development once again this year. The unemployment rate is expected to reach approximately 8.8%. The economic situa-tion in Germany, the country’s most important trading partner, willalsohaveadecisiveinfluenceontheCzecheconomy.
EuropeForecasts for the European economy for the coming year re-main cautious and the euro zone economy is expected to con-tract by about 0.5%. Greece is already in deep recession, and Portugal and Spain will face a shrinking GDP in 2012. Experts also consider Italy to be at risk and a decrease in economic output of 1.5% is thought possible. In France, the possibility of zero economic growth or a slight decrease in economic out-put cannot be ruled out. Unemployment is expected to remain high in all of these countries. Countries with a positive eco-nomic forecast, healthy domestic demand and a stable labour market, such as Germany and Austria, are the exception.
Overseas/AsiaThe strong growth in the Overseas/Asia economic area is expected to continue. Forecasts for China project inflation-adjusted growth of between 8% and 9%. India is predicted to growatarateof8.5%.Inbothcountries,thefightagainsthighinflationmayhinderfurthergrowthinGDP.
InterestratetrendsInterest rates are likely to remain low in the U.S., Europe and Asia, and especially Japan. However, interest rate increases
cannotberuledoutincertaincountriesinresponsetoinfla-tionary pressure. In most cases, emerging markets with high inflationwillmaintaintheirhighinterestrates.
TrendsintherawmaterialsmarketRaw material prices may increase slightly in 2012 in line with the modest 3% growth forecast for the global economy. Strongfluctuationsareconsideredunlikely.
ProjecteddevelopmentontheautomobilemarketsEurope’s economic problems may lead to a decline in sales in certain Southern European markets. Sales are expected to remain stable in other European countries, such as Germany, however. Due to strongly-positive economic developments in growth markets like China, India and Russia, global automobile sales are expected to rise overall in 2012 nonetheless.
CzechRepublicThe overall market in the Czech Republic is expected to re-main at roughly the same level as in 2011.
EuropeDemand is forecast to remain stable, particularly in Germany, the ŠKODA brand’s most important market in Western Europe. The Northern European countries will stagnate or decline slightly in 2012. The markets of Central Europe, on the other hand, will see moderate growth. The Russian market, which expanded rapidly in the recent year 2011 is going to grow in 2012aswell,butwithsignificantlylowerdynamics.
Overseas/AsiaThe highly positive trend in the automobile markets of China and India will continue in 2012. The reasons for this lie in the sustained growth of these economies and their steadily growing domestic demand. ŠKODA AUTO will also be particu-larly active in these markets as part of its international growth strategy.
Overviewofplannedactivitiesandtargets
TechnicaldevelopmentIn line with the ŠKODA growth strategy, technical develop-ment will continue to forge ahead with new innovations for existing model lines and the development of new models for market segments it does not currently serve. A new model is scheduled for presentation to the public on average every six months over the coming years. In spring 2012, the new ŠKODA Citigo will also be introduced as

99Annual Report 2011
outlook
afive-doorversionattheGenevaMotorShow.Thenewcom-pact sedan will come onto the European market in the second half of the year. ŠKODA will also step up its activities in the fieldofelectro-mobility. Initialfindingsfromthetrialfleetoften ŠKODA Octavia Green E Line models that has been on the roads since autumn 2011 will become available in 2012 and will serve as the basis for the further development of e-mobility at ŠKODA. In 2012, ŠKODA Motorsport will compete not only in the IRC, butalso, for thefirst time, intheEuropeanRallyChampion-ship (ERC). The Kopecký/Dresler team will also take part in the Czech championship – which will strengthen ŠKODA Motor-sports’ presence on Czech racetracks. It is ŠKODA’s declared goal to make 2012 just as successful as its record 2011.
Productionandlogistics2012 will be dominated by preparations for the successful implementation of the ŠKODA growth strategy. The expan-sionofproductioncapacityanditsrigorousandefficientusefor the manufacture of current and future models will play a key role – particularly in Russia, China and India. Measures to boost productivity remain a priority. Activities will focus spe-cificallyontheproductionoftheŠKODACitigoandtheŠKODARapid in India. This year, the Mladá Boleslav plant will also be preparing for the ramp-up of a new engine generation, and the Vrchlabí plant will be equipped for production of the new DQ200 automatic transmission for launch in late 2012.
EnvironmentalprotectionGreen Future – This concept will bring together all of ŠKODA AUTO’s environmental-protection activities. In 2012, all key aspects relating to environmental protection will be concen-trated here – in particular through the expansion of capacity in production and technical development – and will become part of an integrated process. This will also include considera-tion of legal requirements as well as proactive environmental protection measures.
Markets,salesandmarketingŠKODA AUTO will strive to increase both its market share and sales volumes in its key markets in 2012. To reach these goals, it will focus in particular on the strategic growth markets of Russia, China and India, alongside its traditional markets. The market launch of the new ŠKODA Rapid in India and the global release of the ŠKODA Citigo will play a crucial role in achieving this aim. In order to strengthen the ŠKODA brand in all relevant mar-kets, the global rollout of the new corporate design across the
entire dealer network will get underway in 2012. The dealer network will be further expanded in the brand’s growth mar-kets. The second phase of the “Human Touch Initiative” will also begin – with further improvements in customer orienta-tion throughout the ŠKODA sales and service network.
EmployeesŠKODA AUTO will increase the size of its workforce once again in2012.Theaimistocreatetherightstaffingconditionsforthe implementation of the Company’s global internationali-sation and growth strategy. ŠKODA AUTO has its sights set mainly on highly-skilled applicants with foreign language pro-ficiencyforassignmentsatvariousŠKODAAUTOproductionfacilities around the world. In addition to the recruitment of well-qualifiednewstaffmembers,afurtherpriorityistopro-vide on-the-job training for as many employees as possible through targeted expansion of training options and the open-ing of new training facilities. Collaboration with foreign uni-versities and more aggressive personnel marketing activities in Russia, China and India are another focal point. Plans also call for more intensive cooperation with the cities and regions where ŠKODA facilities are located.
FinanceŠKODA AUTO aims to maintain its financial performanceand its profitability in 2012. Variousmeasures are designedto ensure the Company achieves these goals: for instance, by strengthening its position on the markets and clear dif-ferentiation from competitors through clever and innovative solutions across all processes. Product cost optimisation and maintaining the productivity will also contribute to the earning power. The focus will be on targeted cost and liquidity man-agement through strict monitoring of cost targets, optimised use of working capital and continuous tracking of all invest-ment and initial capital outlay goals.

100 Annual Report 2011

Financial Section


103Annual Report 2011
Financial Section
104 Auditor‘s report on the annual report and the report on relations
106 Auditor’sreportontheconsolidatedfinancialstatements
108 Consolidatedfinancialstatementsfortheyearended31December2011
113 Notestotheconsolidatedfinancialstatements2011
168 Auditor’sreportontheseparatefinancialstatements
170 Separatefinancialstatementsfortheyearended31December2011
174 Notestotheseparatefinancialstatements2011
230 Reportonrelations
235 Glossaryoftermsandabbreviations
237 Listofnon-consolidatedcapitalholdingsofŠKODAAUTO
238 Personsresponsiblefortheannualreportandpost-balancesheetevents
239 Keyfiguresandfinancialresultsataglance

104 Annual Report 2011
Auditor´s report on the AnnuAl report And the report on relAtions
Auditor s report on the annual report and the report on relations
Independent auditor’s report to the shareholder of ŠKODA AUTO a.s.
WehaveauditedthefinancialstatementsofŠKODAAUTOa.s.,identificationnumber00177041,withregistered officeatTř.VáclavaKlementa869,MladáBoleslav(“theCompany”)fortheyearended31December2011dis-closedintheannualreportonpages170to229andissuedtheopiniondated17February2012anddisclosedonpages168and169.WehavealsoauditedtheconsolidatedfinancialstatementsoftheCompanyfortheyearended31December2011disclosedonpages108to167andissuedtheopiniondated17February2012anddisclosedonpages106and107(hereinaftercollectivelyreferredtoas“thefinancialstatements”).
Report on the Annual Report
Wehaveverified that theother information included in theannual reportof theCompany for theyearended 31 December 2011 is consistent with the financial statements referred to above. The Board of Directors isresponsiblefortheaccuracyoftheannualreport.Ourresponsibility istoexpressanopinion ontheconsistencyoftheannualreportwiththefinancialstatementsbasedonourverificationprocedures.
Auditor’s ResponsibilityWeconductedourverificationproceduresinaccordancewiththeInternationalStandardsonAuditingandtherelatedapplicationguidanceoftheChamberofAuditorsoftheCzechRepublic.Thosestandardsre-quirethatweplanandperformtheverificationprocedurestoobtainreasonableassuranceaboutwhether theotherinformationincludedintheannualreportwhichdescribesmattersthatarealsopresentedinthefinancialstatementsis,inallmaterialrespects,consistentwiththerelevantfinancialstatements.Webe-lievethattheverificationproceduresperformedprovideareasonablebasisforouropinion.
OpinionInouropinion, theother information included in theannual reportof theCompany for the yearended 31December2011isconsistent,inallmaterialrespects,withthefinancialstatements.
PricewaterhouseCoopers Audit, s.r.o., Kateřinská 40/466, 120 00 Prague 2, Czech Republic T: +420 251 151 111, F: +420 251 156 111, www.pwc.com/cz PricewaterhouseCoopers Audit, s.r.o., registered seat Kateřinská 40/466, 120 00 Prague 2, Czech Republic, Identification Number: 40765521, registered with the Commercial Register kept by the Municipal Court in Prague, Section C, Insert 3637, and in the Register of Audit Companies with the Chamber of Auditors of the Czech Republic under Licence No 021.

105Annual Report 2011
Auditor´s report on the AnnuAl report And the report on relAtions
Report on review of the Report on Relations
Inadditionwehavealso reviewedtheaccompanying reporton relationsbetweentheCompanyand itscontrollingpartyandbetweentheCompanyandtheotherpersonscontrolledbythesamecontrollingpartyfortheyearended31December2011(the“Report”),disclosedintheannualreportonpages230to234. ThecompletenessandaccuracyoftheReportistheresponsibilityoftheBoardofDirectorsoftheCompany.OurresponsibilityistoexpressouropinionontheReportbasedonperformedreview.
Scope of Review WeconductedourreviewinaccordancewithAuditstandard56oftheChamberofAuditorsoftheCzechRepublic.Thisstandard requires thatweplanandperformthe reviewtoobtain limitedassuranceas towhether theReport is freeofmaterial factualmisstatement.A review is limitedprimarily to inquiriesofCompanypersonnel,analyticalproceduresandexamination,onatestbasis,offactualaccuracyofdata.Areviewthereforeprovideslessassurancethananaudit.Wehavenotperformedanauditand,accordingly,wedonotexpressanauditopinion.
ConclusionBasedonourreview,nothinghascometoourattentionthatcausesustobelievethattheaccompanyingReporthasnotbeenproperlyprepared, inallmaterial respects, inaccordancewith the requirementsofArticle66aoftheCommercialCode.
8March2012
pricewaterhouseCoopers Audit, s.r.o.representedby
Jiří Zouhar Petr KřížPartner StatutoryAuditor,LicenceNo.1140
Note: Our report has been prepared in the Czech language and in English. In all matters of interpretation of information, views or opinions, the Czech version of our report takes precedence over the English version.

106 Annual Report 2011
Auditor´s report on the ConsolidAted finAnCiAl stAtements
Auditor s report on the consolidated financial statements
Independent auditor’s report to the shareholder of ŠKODA AUTO a.s.
WehaveauditedtheaccompanyingconsolidatedfinancialstatementsofŠKODAAUTOa.s.,identificationnumber00177041,withregisteredofficeatTř.VáclavaKlementa869,MladáBoleslav(“theCompany”)anditssubsidiaries(together“theGroup”),whichcomprisetheconsolidatedbalancesheetasat31December2011,theconsolidatedstatementsofincome,comprehensiveincome,changesinequityandcashflowsfortheyearthenendedandnotes,includingasummaryofsignificantaccountingpolicies(“theconsolidatedfinancialstatements”).
Board of Directors’ Responsibility for the Consolidated Financial StatementsTheBoardofDirectorsisresponsibleforthepreparationoftheconsolidatedfinancialstatementsthatgiveatrueandfairviewinaccordancewithInternationalFinancialReportingStandardsasadoptedbytheEuro-peanUnion,andforsuchinternalcontrolsastheBoardofDirectorsdeterminesisnecessarytoenablethepreparationoffinancialstatementsthatarefreefrommaterialmisstatement,whetherduetofraudorerror.
Auditor’s ResponsibilityOurresponsibilityistoexpressanopinionontheseconsolidatedfinancialstatementsbasedonouraudit.WeconductedourauditinaccordancewiththeActonAuditorsoftheCzechRepublic,InternationalStand-ardsonAuditingandtherelatedapplicationguidanceoftheChamberofAuditorsoftheCzechRepublic.Thosestandardsrequirethatwecomplywithethicalrequirementsandplanandperformtheaudittoobtainreasonableassurancewhetherthefinancialstatementsarefreefrommaterialmisstatement.
PricewaterhouseCoopers Audit, s.r.o., Kateřinská 40/466 Praha 2, Czech RepublicT: +420 251 151 111, F: +420 251 156 111, www.pwc.com/cz
PricewaterhouseCoopers Audit, s.r.o., se sídlem Kateřinská 40/466, 120 00 Praha 2, IČ: 40765521, zapsaná v obchodním rejstříku vedeném Městským soudem v Praze, oddíl C, vložka 3637 a v seznamu auditorských společností u Komory auditorů České republiky pod oprávněním číslo 021.

107Annual Report 2011
Auditor´s report on the ConsolidAted finAnCiAl stAtements
Anauditinvolvesperformingprocedurestoobtainauditevidenceabouttheamountsanddisclosuresinthefinancialstatements.Theproceduresselecteddependontheauditor’s judgment, includingassessmentoftherisksofmaterialmisstatementofthefinancialstatements,whetherduetofraudorerror.Inmakingthoseriskassessments,theauditorconsidersinternalcontrolrelevanttotheGroup’spreparationofthefinancialstatementsthatgiveatrueandfairviewinordertodesignauditproceduresthatareappropriateinthecircumstances,butnotforthepurposeofexpressinganopinionontheeffectivenessoftheGroup’sinternalcontrol.Anauditalsoincludesevaluatingtheappropriatenessoftheaccountingpoliciesusedandthereasonablenessofaccountingestimatesmadebymanagement,aswellasevaluatingtheoverallpres-entationofthefinancialstatements.Webelievethattheauditevidencewehaveobtainedissufficientandappropriatetoprovideabasisforourauditopinion.
OpinionIn our opinion, the consolidatedfinancial statements give a true and fair viewof thefinancial position oftheGroupasat31December2011,itsfinancialperformanceanditscashflowsfortheyearthenended inaccordancewithInternationalFinancialReportingStandardsasadoptedbytheEuropeanUnion.
17February2012
pricewaterhouseCoopers Audit, s.r.o.representedby
Jiří Zouhar Petr KřížPartner StatutoryAuditor,LicenceNo.1140
Note: Our report has been prepared in the Czech language and in English. In all matters of interpretation of information, views or opinions, the Czech version of our report takes precedence over the English version.
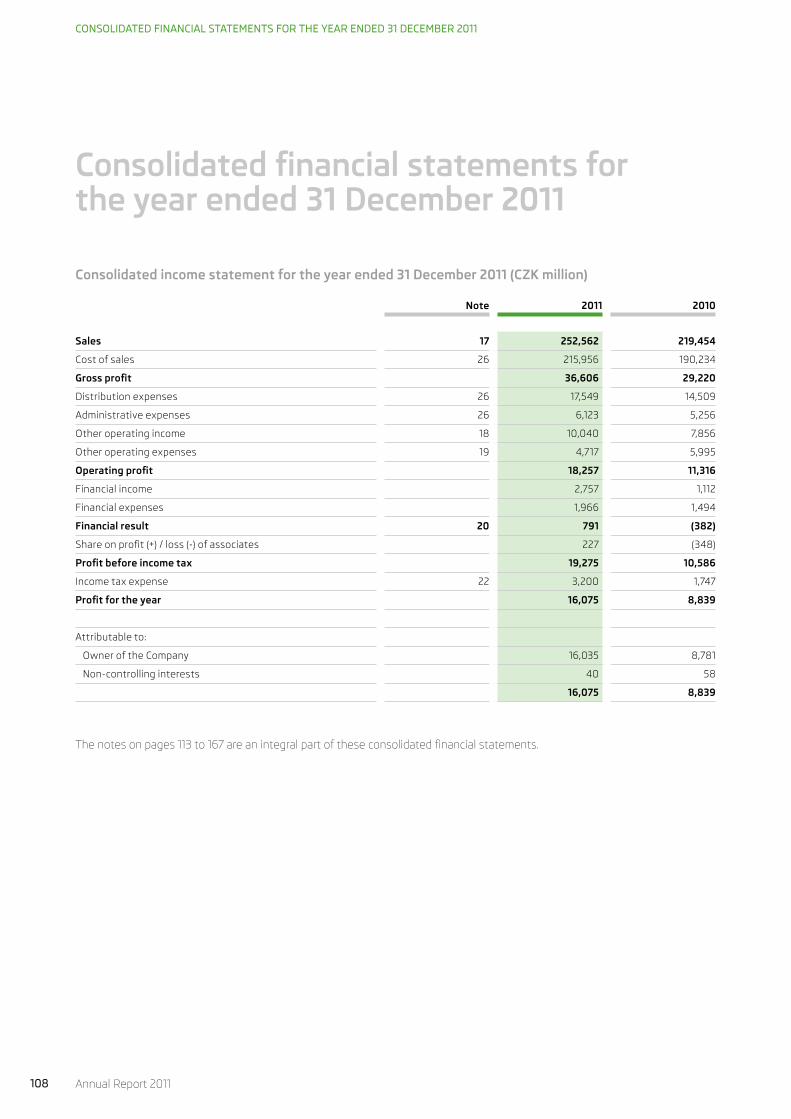
108 Annual Report 2011
ConsolidAted finAnCiAl stAtements for the yeAr ended 31 deCember 2011
Consolidated financial statements for the year ended 31 December 2011
Consolidated income statement for the year ended 31 December 2011 (Czk million)
Note 2011 2010
Sales 17 252,562 219,454
Cost of sales 26 215,956 190,234
Gross profit 36,606 29,220
Distribution expenses 26 17,549 14,509
Administrative expenses 26 6,123 5,256
Other operating income 18 10,040 7,856
Other operating expenses 19 4,717 5,995
Operating profit 18,257 11,316
Financial income 2,757 1,112
Financial expenses 1,966 1,494
Financial result 20 791 (382)
Share on profit (+) / loss (-) of associates 227 (348)
Profit before income tax 19,275 10,586
Income tax expense 22 3,200 1,747
Profit for the year 16,075 8,839
Attributable to:
Owner of the Company 16,035 8,781
Non-controlling interests 40 58
16,075 8,839
Thenotesonpages113to167areanintegralpartoftheseconsolidatedfinancialstatements.

109Annual Report 2011
ConsolidAted finAnCiAl stAtements for the yeAr ended 31 deCember 2011
Consolidated statement of comprehensive income for the year ended 31 December 2011 (Czk million)
Note 2011 2010
Profit for the year 16,075 8,839
Cash flow hedges:
Change in fair value in the period 12 (4,540) (813)
Total transfers of fair value to net profit - effective hedging 12 (1,546) 188
Total transfers of fair value to net profit - ineffective hedging 12 8 (61)
Deferred tax 12 1,155 141
Exchange differences 54 (40)
Other comprehensive loss (4,869) (585)
Total comprehensive income for the year 11,206 8,254
Total comprehensive income attributable to:
Owner of the Company 11,179 8,197
Non-controlling interests 27 57
Thenotesonpages113to167areanintegralpartoftheseconsolidatedfinancialstatements.

110 Annual Report 2011
ConsolidAted finAnCiAl stAtements for the yeAr ended 31 deCember 2011
Consolidated balance sheet as at 31 December 2011 (Czk million)
Note 31 December 2011 31 December 2010
Assets
Intangible assets 5 13,654 12,969
Property, plant and equipment 6 46,265 42,359
Investments in associates 7 940 662
Other receivables and financial assets 8 1,159 1,547
Deferred tax asset 14 2,668 1,327
Non-current assets 64,686 58,864
Inventories 9 16,061 14,408
Trade receivables 8 13,423 11,028
Prepaid income tax 60 89
Other receivables and financial assets 8 28,076 15,361
Cash and Cash equivalents 10 31,251 35,986
Current assets 88,871 76,872
Total assets 153,557 135,736
Note 31 December 2011 31 December 2010
Equity and liabilities
Share capital 11 16,709 16,709
Share premium 1,578 1,578
Reserves 12 62,784 56,307
Equity attributable to owner of the Company 81,071 74,594
Non-controlling interests 140 178
Equity 81,211 74,772
Non-current financial liabilities 13 3,000 3,000
Other non-current liabilities 13 7,317 3,380
Non-current provisions 15 11,030 9,100
Non-current liabilities 21,347 15,480
Current financial liabilities 13 141 228
Trade payables 13 30,105 27,897
Other current liabilities 13 6,258 4,766
Current income tax liabilities 1,217 1,405
Current provisions 15 13,278 11,188
Current liabilities 50,999 45,484
Total equity and liabilities 153,557 135,736
Thenotesonpages113to167areanintegralpartoftheseconsolidatedfinancialstatements.

111Annual Report 2011
ConsolidAted finAnCiAl stAtements for the yeAr ended 31 deCember 2011
Consolidated statement of changes in equity for the year ended 31 December 2011 (Czk million)
NoteShare
capitalShare
premiumRetained earnings
Other reserves*
Equity attributable to owner of
the Company
Non- controlling
interestsTotal
equity
Balance as at 1 January 2010 16,709 1,578 45,993 3,751 68,031 149 68,180
Profit for the year - - 8,781 - 8,781 58 8,839
Change in fair value in the period 12 - - - (813) (813) - (813)
Total transfers of fair value to net profit - effective hedging
12 - - - 188 188 - 188
Total transfers of fair value to net profit - ineffective hedging
12 - - - (61) (61) - (61)
Deferred tax income 14 - - - 141 141 - 141
Exchange differences - - - (39) (39) (1) (40)
Other comprehensive loss - - - (584) (584) (1) (585)
Total comprehensive income for the year - - 8,781 (584) 8,197 57 8,254
Dividends paid 11 - - (1,634) - (1,634) (28) (1,662)
Transfer to statutory reserve fund - - (172) 172 - - -
Balance as at 31 December 2010 16,709 1,578 52,968 3,339 74,594 178 74,772
Balance as at 1 January 2011 16,709 1,578 52,968 3,339 74,594 178 74,772
Profit for the year - - 16,035 - 16,035 40 16,075
Change in fair value in the period 12 - - - (4,540) (4,540) - (4,540)
Total transfers of fair value to net profit - effective hedging
12 - - - (1,546) (1,546) - (1,546)
Total transfers of fair value to net profit - ineffective hedging
12 - - - 8 8 - 8
Deferred tax income 14 - - - 1,155 1,155 - 1,155
Exchange differences - - - 67 67 (13) 54
Other comprehensive loss - - - (4,856) (4,856) (13) (4,869)
Total comprehensive income for the year - - 16,035 (4,856) 11,179 27 11,206
Dividends paid 11 - - (4,702) - (4,702) (65) (4,767)
Balance as at 31 December 2011 16,709 1,578 64,301 (1,517) 81,071 140 81,211
* Explanatory notes on Other reserves are presented in Note 12.
Thenotesonpages113to167areanintegralpartoftheseconsolidatedfinancialstatements.

112 Annual Report 2011
Consolidated cash flow statement for the year ended 31 December 2011 (Czk million)
Note 2011 2010
Cash and cash equivalents as at 1 January 16 35,986 34,809
Profit before income tax 19,275 10,586
Depreciation and impairment of non-current assets 5.6 12,746 14,820
Change in provisions 15 3,875 3,244
Gain on disposal of non-current assets (11) (1)
Net interest (income) / expense 20 53 40
Change in inventories 9 (1,937) (2,847)
Change in receivables (3,701) (3,831)
Change in liabilities 2,355 7,947
Income tax paid from operating activities (3,561) (2,294)
Interest paid (531) (458)
Interest received 652 490
Share on profit (-) / loss (+) of associates (227) 348
Dividends income 20 (125) -
Other adjustments for non-cash transactions (612) 124
Cash flows from operating activities 28,251 28,168
Purchases of non-current assets (13,558) (9,763)
Additions to capitalised development costs 5 (3,306) (3,093)
Increase in financial investments 7 - (530)
Increase in deposits* made 8 (11,500) (10,016)
Proceeds from sale of non-current assets 14 18
Proceeds from dividends 125 71
Cash flows from investing activities (28,225) (23,313)
Net cash flows (operating and investing activities) 26 4,855
Dividends paid (4,767) (1,662)
Repayment of bonds - (2,000)
Loans received 13 33 121
Repayments of loans received (120) (99)
Cash flows from financing activities (4,854) (3,640)
Net change in cash and cash equivalents (4,828) 1,215
Exchange gains / (losses) on cash and cash equivalents 93 (38)
Cash and cash equivalents as at 31 December 16 31,251 35,986
* Deposits which do not meet criteria of cash equivalents according to IAS 7.
Thenotesonpages113to167areanintegralpartoftheseconsolidatedfinancialstatements.
ConsolidAted finAnCiAl stAtements for the yeAr ended 31 deCember 2011

113Annual Report 2011
notes to the ConsolidAted finAnCiAl stAtements 2011
Notes to the consolidated financial statements 2011
Company informationFoundation and company enterprises
ŠKODAAUTOa.s.wasincorporatedasajoint-stockcompanyon20November1990.Thecompany’sprinci-palbusinessactivitiesarethedevelopment,productionandsaleofvehiclesandrelatedaccessories.Registeredoffice: Tř.VáclavaKlementa869 29360MladáBoleslav CzechRepublic IČ:00177041 wwwaddress:www.skoda-auto.czThe company is registered in the Commercial Registermaintainedwith theMunicipal Court in Prague, SectionB,Insert332,withFileNo.Rg.B332.Theorganisationalstructureofthecompanyisdividedintothefollowingmainareas:– Centralmanagementdepartment– Technicaldevelopment– Productionandlogistics– Salesandmarketing– Commercialaffairs– Humanresourcemanagement– PurchasingThecompanyhasitsmainproductionplantinMladáBoleslavandtwootherproductionplantsinVrchlabíandKvasiny.ŠKODAAUTOa.s. is a subsidiaryofVolkswagen International FinanceN.V. included in the consolidationgroupof itsultimateparent companyand itsultimate controllingparty,VOLKSWAGENAG (“VolkswagenGroup”),withitsregisteredofficeinWolfsburg,theFederalRepublicofGermany(fordetailsseeNote30).
Note
Thefinancialstatementshavebeenprepared inCzechand inEnglish. Inallmattersof interpretationofinformation,viewsoropinions,theCzechversionofthesefinancialstatementstakesprecedenceovertheEnglishversion.

114 Annual Report 2011
notes to the ConsolidAted finAnCiAl stAtements 2011
1. Summary of significant accounting policies and principles1.1 Compliance statement
TheconsolidatedfinancialstatementsofŠKODAAUTOa.s.(“theCompany”),itssubsidiariesandassociates(together“theGroup”)fortheyearended31December2011havebeenpreparedinaccordancewithInter-nationalFinancialReportingStandardsasadoptedbytheEuropeanUnion(“IFRS”)asat31December2011.TheCompanyasacontrolledentityisobligedtobepartofconsolidatedfinancialstatementsoftheVolks-wagenGroupinaccordancewiththeInternationalFinancialReportingStandardsasadoptedbytheEuro-peanUnion.AsaresultandbasedontheCompany’ssoleshareholder’sdecisionandundertheparagraph19a)Article8ofActNo.563/1991Coll.onAccounting,theGrouppreparestheconsolidatedfinancialstate-mentsinaccordancewithIFRSasadoptedbytheEuropeanUnion.RefertotheCompanyinformationintheprecedingnote“Companyinformation”.
1.2 Adoption of new or revised standards, amendments and interpretations to existing standards*
1.2.1 New standards, amendments and interpretations to existing standards mandatory for accounting periods beginning on 1 January 2011
New standards, amendments, interpretations and improvements to existing standards mandatory for accountingperiodsbeginningonorafter1January2011,whichareappliedbytheGroup:
IFRS Standard/Interpretation Effective Description Effect
IAS 24 Related Party Disclosures 1 January 2011 The main objective of the amendment is to provide a partial exemption from the disclosure requirements for government-related entities, and to clarify the definition of a related party. The amendment also clarifies the entity’s obligation to disclose information about all commitments, associated with a related party, to do something if a particular event occurs or does not occur in the future, including executory contracts (recognised and unrecognised).
The Amendment to IAS 24 had impact on the extent of disclosure of transactions with related parties. The Group has disclosed the unrecognised executory contracts with related parties as compared with the information disclosed in the notes to financial statements as at 31 December 2010.
IAS 1 (Improvement to IFRS 2010)
Presentation of Financial Statements
1 January 2011 The improvement to IAS 1 clarifies the requirement for the presentation and content of the Statement of Changes in Equity.
The improvement to IAS 1 had impact on the extent of the disclosure of the information in the Statement of changes in equity. The Group has disclosed separately Profit for the year and Other comprehensive loss as compared with the information disclosed in the financial state-ments as at 31 December 2010.
IFRS 7 (Improvement to IFRS 2010)
Financial Instruments: Disclosures
1 January 2011 The improvement to IFRS 7 clarifies the disclosure in the area of financial instruments.
The improvement to IFRS 7 had an impact on the extent of the disclosures of the information in the area of collateral and other credit enhancements of financial instruments. The Group has disclosed value of a secured receivable or value of the security, if it was lower.
* The effective dates express the dates effective for the Group.

115Annual Report 2011
Newstandards,amendments,interpretationsandimprovementstoexistingstandardsmandatoryforac-countingperiodsbeginningonorafter1January2011,whicharenotappliedbytheGroupastheyarenotrelevanttotheGroup’soperations:Newstandards,amendmentsandinterpretationstoexistingstandardsmandatoryforaccountingperiodsbeginningonorafter1January2011:
IFRS Standard/Interpretation Effective Description
IAS 32 Classification of Rights Issues 1 January 2011 The amendment deals with presentation of rights issues denominated in a currency other than the issuing entity’s functional currency. The amendment exempts certain rights issues of shares with proceeds denominated in foreign currencies from classification as financial derivatives.
IFRIC 14 Prepayments of a Minimum Funding Requirement
1 January 2011 The amendment removes an unintended consequence of IFRIC 14 arising from the treatment of prepayments of future contributions in some circumstances when there is a minimum funding requirement.
IFRIC 19 Extinguishing Financial Liabilities with Equity Instruments
1 January 2011 The interpretation addresses the accounting in cases where all or part of the financial liability is extinguished by the debtor by issuing equity instruments to the creditor.
Improvements to International Financial Reporting Standards 2010 mandatory for accounting periods beginningonorafter1January2011(issuedinMay2010):
IFRS Standard/Interpretation Effective Description
IFRS 3 Business Combinations 1 July 2010 Measurement of non-controlling interests.Un-replaced and voluntarily replaced share-based payment awards.Transition requirements for contingent consideration from a business combination that occurred before the effective date of the revised IFRS 3.
IAS 27 Consolidated and Separate Financial Statements
1 July 2010 Transition requirements for subsequent amendments arising as a result of IAS 27.
IAS 34 Interim Financial Reporting 1 January 2011 Significant events and transactions.
IFRIC 13 Customer Loyalty Programmes 1 January 2011 Fair value of award credits.
notes to the ConsolidAted finAnCiAl stAtements 2011

116 Annual Report 2011
1.2.2 New standards, amendments and interpretations to existing standards published not yet effective for accounting periods beginning on or after 1 January 2011
Newstandards,amendmentsandinterpretationstoexistingstandards,whichwillberelevantfortheGroupbuthavenotbeenearlyadoptedbytheGroup:
IFRS Standard/Interpretation Effective Description Effect
IFRS 9 Financial instruments 1 January 2015 IFRS 9 replaces those parts of IAS 39 relating to the classifica-tion and measurement of financial assets and changes also some disclosure requirements as set out by IFRS 7. Per IFRS 9, all financial assets, currently within scope of IAS 39, are required to be classified into two measurement categories – those to be measured subsequently at amortised cost, and those to be measured subsequently at fair value.
The Group expects that the new IFRS 9 will have impact on classification, measurement and disclosure of financial instruments in the notes to the financial statements. However, without a detailed analysis it is not possible to perform reliable estimate of such impact as at the date of the financial statements. The Group does not expect early adoption of the standard, while the transition to IFRS 9 will probably take place after 1 January 2015. The disclosure of information in the area of financial instruments will be ruled by IFRS 7 §44S-44W.
IFRS 13 Fair value measurement 1 January 2013 Aim of the new standard is to reduce complexity, improve consistency and clarify approach to disclosure of items in the financial statements carried at fair value. The standard clearly defines fair value and gives instruction for its application in case the fair value measurement is required or allowed by another IFRS. A definition of the fair value and a single source of fair value measurement and disclosure requirement for use across IFRSs.
The Group expects that the new standard IFRS 13 will not have significant impact on the measurement of items carried at fair value. However, without a detailed analysis it is not possible to confirm this estimated impact.
IAS 1 Presentation of Financial Statements
1 July 2012 The amendments deal with disclosure of items presented in other comprehensive income. The amendments newly require entities to separate items presented in other comprehensive income into two groups, based on whether or not they may be reclassified to profit or loss in the future. Information to the user will be provided what proportion of total comprehensive income will be never reclassified to profit of loss for the period.
The Group expects that the amendments to IAS 1 will have impact on the extent of the disclosure of information in the Statement of comprehensive income.
IAS 19 Employee benefits 1 January 2013 Amendment to IAS 19 makes to the recognition and measurement of defined benefit pension expense and termination benefits. The standard requires recognition of all changes in the defined benefit liability and assets of the plans when they occur, introduces extended disclosures for termination benefits and clarifies many issues including classification of employee benefits.
The Group expects that the amendment to IAS 19 will have impact mainly on presentation of benefits upon employment termination. However, without a detailed analysis it is not possible to perform reliable estimate of such impacts at the date of the financial statements.
notes to the ConsolidAted finAnCiAl stAtements 2011

117Annual Report 2011
Thefollowingstandards,amendmentsandinterpretationstoexistingstandardswhichwillnotberelevantfortheGrouporarenotexpectedtohaveasignificantimpactontheGroup’soperations:
IFRS Standard/Interpretation Effective Description
IFRS 7 Financial Instruments: Disclosures Transfers of Financial Assets
1 July 2011 The amendment enhances the disclosure requirements related to transactions including a transfer of financial assets.
IFRS 7 Disclosure: Offsetting Financial Assets and Financial Liabilities
1 January 2013 The amendment requires disclosures that will enable users of an entity’s financial statements to evaluate the effect or potential effect of netting arrangements, including rights of set-off.
IFRS 10 Consolidated Financial Statements 1 January 2013 IFRS 10 Consolidated Financial Statements replaces previous IAS 27 and SIC-12. The new standard follows up the current principles to determine control, focuses on clarification of the definition of control, while the rules for status of control are substantially extended.
IFRS 11 Joint Arrangements 1 January 2013 IFRS 11 fully replaces IAS 31 and SIC-13. Substantial change introduced by the new standard is elimination of jointly controlled assets and elimination of proportionate consolidation.
IFRS 12 Disclosure of Interests in Other Entities
1 January 2013 IFRS 12 deals with all disclosure requirements in respect of interests held in other reporting entities and replaces the previous standard IAS 27. The scope of the standard includes interests in subsidiaries, associates, joint arrangements and unconsolidated structured entities (formerly “special purpose entities”).
IAS 12 Deferred tax: Recovery of Underlying Assets
1 January 2012 The amendment provides an exception to the general principle as per IAS 12 for deferred tax assets and deferred tax liabilities arising from investment property carried at fair value as per IAS 40 or property, plant and equipment or intangible assets measured using the revaluation model as per IAS 16 or IAS 38.
IAS 27 Separate Financial Statements 1 January 2013 This standard replaces previous standard IAS 27. Requirements for separate financial statements remained without changes. Other parts of IAS 27 were replaced by IFRS 10.
IAS 28 Investments in Associates and Joint Ventures
1 January 2013 The amendment of IAS 28 modified the standard so that changes resulting from issuance of standards IFRS 10, IFRS 11 and IFRS 12 are reflected.
IAS 32 Financial Instruments : Offsetting Financial Assets and Financial Liabilities
1 January 2014 The amendments to IAS 32 deals with offsetting financial assets and liabilities. If clarifies condition under which the offsetting may be applied.
IFRIC 20 Stripping Costs in the Production Phase of a Surface Mine
1 January 2013 The new interpretation IFRIC 20 deals with presentation of stripping costs in the Production Phase of a Surface Mine, the initial measurement and subsequent measurement of the stripping activity asset.
Newstandards, amendmentsand interpretationsdisclosed inNote 1.2.2havenot yetbeenadoptedbytheEuropeanUnion,exceptfortheamendmenttoIFRS7FinancialInstrument:Disclosures–TransfersofFinancialAssets.
notes to the ConsolidAted finAnCiAl stAtements 2011

118 Annual Report 2011
1.3 Reclassification of presented items, changes in accounting policies and comparative amounts
1.3.1 Reclassification of cash equivalents in the balance sheetDuetomoreaccuratepresentationofcashequivalents*inthebalancesheetinrelationtotheirreconcili-ationtothefiguresreportedinthecashflowstatement,effectivefrom1January2011thisaccountingcat-egoryhasbeentransferredfrombalancesheetlineOtherreceivablesandfinancialassetstobalancesheetlineCashandCashequivalents.Theimpactofthereclassificationofcashequivalentsonthereporteddataforthecomparativeperiod2010isshowninthefollowingtable:
CZK million Data reported for comparative
accounting period 2010 in balance sheet as at 31 December 2011
Data reported for current
accounting period 2010 in balance sheet as at 31 December 2010 Difference
Other receivables and financial assets 15,361 41,023 (25,662)
Cash and Cash equivalents 35,986 10,324 25,662
Asat1January2010,afterthereclassificationofthecashequivalents,thevalueofbalancesheetlineOtherreceivablesandfinancialassetswouldbeCZK3,747millionandthevalueofbalancesheetlineCashandCashequivalentswouldbeCZK34,809million.
* Short-term deposits in Volkswagen Group companies with the original maturity not exceeding 3 months have been reported as cash equivalents by the Group in 2011 and in 2010.
1.3.2 Change of presentation of reversals of provisions and accrualsEffectivefrom1 January2011,therehasbeenachangeinaccountingpolicyforpresentationofreversalsofexcessprovisionsandaccruals, inorderto increasetransparencybydisclosingtheamountsreversedseparately,insteadofnettingthemagainstexpensesrelatingtotheadditionstoprovisionsandaccruals.InthefinancialstatementsoftheGroupfortheaccountingperiodbeginningon1January2011,thereversalsofexcessprovisionsandaccrualsarerecognisedaspartofotheroperatingincome.(IntheconsolidatedfinancialstatementsoftheGroupfortheaccountingperiodbeginningon1January2010,thereversalsofexcesspro-visionsandaccrualsweredisclosedinthesameaccountingcategoriesastheiradditionsandutilisation).Asaresultoftheabove-mentionedfact,thereportedcomparativefigureshavebeenchangedwithimpactontheincomestatementandonthedatastatedinthenotestotheseparatefinancialstatements2011(inNote17Sales,inNote18OtheroperatingincomeandinNote26Expensesbynature).
notes to the ConsolidAted finAnCiAl stAtements 2011

119Annual Report 2011
notes to the ConsolidAted finAnCiAl stAtements 2011
Thefollowingtablespecifiestheimpactofthechangeoftheaccountingpolicyforreversalsofexcessprovi-sionsandaccrualsoncomparativefiguresintheincomestatementfortheyearended31December2011:
CZK million Data reported for comparative
accounting period 2010 in income
statement for the year ended
31 December 2011
Data reported for current
accounting period 2010 in income
statement for the year ended
31 December 2010 Difference
Sales 219,454 220,005 (551)
Cost of sales 190,234 189,260 974
Gross profit 29,220 30,745 (1,525)
Distribution expenses 14,509 14,403 106
Administrative expenses 5,256 5,203 53
Other operating income 7,856 6,172 1,684
Inthenotestotheconsolidatedfinancialstatementsthecomparativefiguresfor2010havebeenchanged,inNote4InformationaboutregiontheitemSales-basedonlocationofcustomersinthecolumnCzechRepublichasbeendecreasedbyCZK124millionfromvalueCZK21,966milliontoCZK21,842millionandtheitemincolumnGermanyhasbeendecreasedbyCZK427millionfromvalueCZK54,251milliontoCZK53,824million.InNote17Sales,thelineCarshasbeendecreasedbyCZK464millionfromvalueCZK185,112milliontoCZK184,648millionandthelineSparepartsandaccessorieshasbeendecreasedbyCZK87millionfromvalueCZK17,335milliontoCZK17,248million.Duetothechange inthepresentationofthereversalsofexcessprovisionsandaccruals,totalsaleshavedecreasedbyCZK551million.Inaddition,comparativefiguresfor2010havebeenchangedinNote18Otheroperatingincome.Thesepa-rateitemReversalofexcessprovisionsandaccrualshasbeenaddedwiththereportedamountofCZK1,684million.TheimpactofthechangeoftheaccountingpolicyforreversalsofexcessprovisionsandaccrualsonthecomparativefiguresinNote26.Expensesbynatureisshowninthefollowingtable:
CZK million Data reported for comparative account-ing period 2010 in the notes to the consoli-
dated financial statements for the year ended
31 December 2011
Data reported for current
accounting period 2010 in the notes
to the consolidated financial statements
for the year ended 31 December 2010 Difference
Material costs - raw materials and other supplies, goods 148,720 148,460 260
Production related services 12,387 11,721 666
Personnel costs 16,031 15,968 63
Wages 12,128 12,065 63
Pension benefit costs (defined contribution plans) 2,226 2,226 -
Social insurance and other personnel costs 1,677 1,677 -
Depreciation, amortisation and impairment losses 14,820 14,820 -
Other services 18,041 17,897 144
Total cost of sales, distribution and administrative expenses 209,999 208,866 1,133

120 Annual Report 2011
notes to the ConsolidAted finAnCiAl stAtements 2011
2. Basis of preparation of consolidated financial statementsTheseconsolidatedfinancialstatementshavebeenpreparedunderthehistoricalcostconvention,exceptforfairvaluemeasurementofavailable-for-salefinancialassets,offinancialassetsandfinancialliabilitiesatfairvaluethroughprofitorlossandofallderivativecontracts.ThepreparationoffinancialstatementsinconformitywithIFRSrequirestheuseofcertaincriticalaccount-ingestimates.ItalsorequiresmanagementtoexercisetheirjudgmentintheprocessofapplyingtheGroup’saccountingpolicies.Amountsintheconsolidatedfinancialstatementsandinthenotesaredisclosedinmil-lionsofCzechcrowns(CZKmillion),unlessstatedotherwise.
2.1 Details of the Group
InadditiontoŠKODAAUTOa.s.locatedinMladáBoleslav,theconsolidatedfinancialstatementsincludeallsignificantsubsidiariesandassociates.Seethe“Companyinformation”noteonpage10fortheCompany’sdetails.
Subsidiariesarethosecompaniesandotherentities(includingspecialpurposeentities)inwhichaparentcompany,directlyorindirectly,hasaninterestofmorethanonehalfofthevotingrightsorotherwisehaspowertogovernthefinancialandoperatingpoliciessoastoobtainbenefits.TheexistenceandeffectofpotentialvotingrightsthatarepresentlyexercisableorpresentlyconvertibleareconsideredwhenassessingwhethertheGroupcontrolsanotherentity.Thesecompanies(“subsidiar-ies”)arefullyconsolidatedfromthedateonwhichthecontrolistransferredtotheGroupandaredeconsoli-datedfromthedatethatcontrolceases.ThesignificantsubsidiariesoftheCompanyareasfollows:– ŠKODAAUTODeutschlandGmbH(100%);– ŠKODAAUTOSlovensko,s.r.o.(100%);– SkodaAutoPolskaS.A.(51%);– SkodaAutoIndiaPrivateLtd.(100%).AssociatesareallentitiesoverwhichtheGrouphassignificantinfluencebutnotcontrol,generallyaccom-panyingashareholdingofbetween20%and50%ofthevotingrights.TheŠKODAAUTOa.s.exercisessignificantinfluenceintheassociates(seeNote7):– OOOVOLKSWAGENGroupRus,– ŠKO-ENERGOFIN,s.r.o.
2.2 Consolidation principles
Thesubsidiariesareconsolidatedusingthefull-scopeconsolidationmethod.AssetsandliabilitiesofthesubsidiariesarerecognisedinaccordancewiththeuniformaccountingpoliciesusedwithintheGroup.ThepurchasemethodofaccountingisusedtoaccountfortheacquisitionofsubsidiariesbytheGroup.Thecostoftheacquisitionismeasuredasthefairvalueoftheassetstransferred,equityinstrumentsissuedandliabilitiesincurredorassumedatthedateofexchange.Identifiableassetsacquiredandliabilitiesandcontingentliabilitiesassumedinabusinesscombinationaremeasuredinitiallyattheirfairvaluesasattheacquisitiondate,irrespectiveoftheextentofanynon-controllinginterest.Goodwillismeasuredbydeductingthenetassetsoftheacquireefromtheaggregateoftheconsiderationtransferredfortheacquiree,theamountofnon-controllinginterestintheacquireeandfairvalueofaninter-estintheacquireeheldimmediatelybeforetheacquisitiondate.Anynegativeamount(“negativegoodwill”)isrecognisedinprofitorloss,aftermanagementreassesseswhetheritidentifiedalltheassetsacquiredandallliabilitiesandcontingentliabilitiesassumedandreviewsappropriatenessoftheirmeasurement.TheGroupmeasuresnon-controllinginterestonatransaction-by-transactionbasis,atthenon-controllinginterest’sproportionateshareofnetassetsoftheacquiree.Inter-companytransactions,balancesandunrealisedgainsontransactionsbetweengroupcompaniesareeliminated.Unrealised lossesarealsoeliminatedunlessthetransactionprovidesevidenceofan impair-mentoftheassettransferred.Investmentsinassociatesareaccountedforusingtheequityaccountingandareinitiallyrecognisedatcost.TheGroup’sinvestmentinassociatesincludesgoodwillidentifiedonacquisition.

121Annual Report 2011
notes to the ConsolidAted finAnCiAl stAtements 2011
TheGroup’sshareof itsassociate´spost-acquisitionprofitsor lossesisrecognisedintheincomestate-ment,anditsshareofpost-acquisitionmovementsinothercomprehensiveincomeisrecognisedinothercomprehensive income. The cumulative post-acquisition movements are adjusted against the carryingamountoftheinvestment.WhentheGroup’sshareoflossesinanassociateequalsorexceedsitsinterestintheassociate,includinganyotherunsecuredreceivables,theGroupdoesnotrecognisefurtherlosses,unlessithasincurredobligationsormadepaymentsonbehalfoftheassociate.Unrealisedgainsontrans-actionsbetweentheGroupand itsassociateareeliminatedtotheextentoftheGroup’s interest intheassociate.Unrealisedlossesarealsoeliminatedunlessthetransactionprovidesevidenceofanimpairmentoftheassettransferred.TheaccountingpoliciesoftheassociatehavebeenchangedwherenecessarytoensureconsistencywiththepoliciesadoptedbytheGroup.
2.3 Foreign currency translation
2.3.1 Functional of the Company and presentation currency of the Group ItemsincludedinthefinancialstatementsofeachoftheGroup’sentitiesaremeasuredusingthecurrencyof theprimary economicenvironment inwhich theentity operates (‘the functional currency’). The con-solidatedfinancialstatementsarepresentedinCzechcrowns(CZK),whichistheCompany’sfunctionalandpresentationcurrency.Foreigncurrency transactionsof theCompanyare translated into the functional currencyusing theex-changeratespublishedbytheCzechNationalBankprevailingonthedatesofthetransactions.Foreignexchangegainsandlossesresultingfromthesettlementofsuchtransactionsandfromthetranslationofmonetaryassetsandliabilitiesdenominatedinforeigncurrenciesatyear-endexchangeratespublishedbytheCzechNationalBankarerecognisedintheincomestatement.
2.3.2 Foreign subsidiaries and associatesOnconsolidation,exchangedifferencesarisingfromthetranslationofthenetinvestmentinforeignopera-tions,andofborrowingsandothercurrencyinstrumentsdesignatedashedgesofsuchinvestments,aretakentoshareholders´othercomprehensiveincome.Whenaforeignoperationispartiallydisposedoforsold,exchangedifferencesthatwererecorded inothercomprehensive incomearerecognised inthe in-comestatementaspartofthegainorlossonsale.Foreignsubsidiariesandassociatesaresubjecttolegalandaccountingregulationsintheirrespectivecoun-try.Therespectivelocalcurrencyistheirfunctionalcurrency.TheexchangeratespublishedbytheCzechNational Bankwere usedwhen incorporating their financial statements into the consolidated financialstatementsoftheGroup:– Assetsandliabilitiesforeachbalancesheetpresentedaretranslatedattheclosingrateasatthedateofthatbalancesheet;
– Incomeandexpenses foreach incomestatementare translatedatmonthlyaverageexchange rates,unlessthisaverageisnotareasonableapproximationofthecumulativeeffectoftheratesprevailingonthetransactiondates, inwhichcasethe incomeandexpensesaretranslatedonthedatesofthetransactions;
– All resulting exchange differences are recognised as a separate component of other comprehensive income;
– Goodwillandfairvalueadjustmentsarisingontheacquisitionofaforeignentityaretreatedasassetsandliabilitiesoftheforeignentityandtranslatedattheclosingrate.

122 Annual Report 2011
CZK/Currency 2011 2010
Balance sheet foreign exchange rate as at 31 December
Poland PLN 5.789 6.308
India INR 0.376 0.419
Slovakia, Germany EUR 25.800 25.060
Russia RUB 0.618 0.613
2.4 Intangible assets
Purchasedintangibleassetsarerecordedatcostlesscumulativeamortisationandimpairmentlosses.Allresearchcostsarerecognisedasexpenseswithintheincomestatementwhenincurred.InaccordancewithIAS38,alldevelopmentcostsofnewŠKODAmodelsandotherproductsarerecognisedasintangibleassetswhenitisprobablethattheprojectwillbeasuccessconsideringitscommercialandtechnicalfeasibility,andcostscanbemeasuredreliably.Capitaliseddevelopmentcostsandotherinternallygeneratedintangibleas-setsarecarriedatcostlessaccumulatedamortisationandimpairmentlosses.Ifthecriteriaforrecognitionasanassetarenotmet,thecostsarerecognisedintheincomestatementintheyearinwhichtheyareincurred.Toolingrightsarecapitalisedasintangibleassets.Capitalisedcostsincludealldirectcostsaswellasanappropriateportionofdevelopment-relatedoverheads.Thecostofqualifyingintangibleassetsalsoincludesborrowingcostsrepresentedbyinterestandothercoststhatanentityincursinconnectionwithborrowingfunds.Aqualifyingassetisanassetthatnecessar-ilytakesatleastoneyeartogetreadyforitsintendeduse.TheGroupceasescapitalisingborrowingcostswhenthequalifyingassetisreadyforitsintendeduseorsale.Thedevelopmentcostsareamortisedusingthestraight-linemethodfromthestartofproductionovertheexpectedlifecycleofthemodelsorcomponents.Amortisationrecognisedduringtheyearisallocatedtotherelevantfunctionsintheincomestatement.Goodwill represents theexcessof theaggregateof the consideration transferred for theacquiree, theamountofnon-controlling interest intheacquireeandfairvalueofan interest intheacquireeheld im-mediatelybeforetheacquisitiondateover the fairvalueof thenetassetsof theacquiree.Goodwillonacquisitionsofsubsidiariesisincludedinintangibleassets.Goodwillisnotamortised,onlytestedannuallyforimpairmentandcarriedatcostlessaccumulatedimpairmentlosses.Intangibleassetsareamortisedapplyingthestraight-linemethodovertheirestimatedusefullivesasfol-lows:– Capitaliseddevelopmentcosts 2–10yearsaccordingtotheproductlifecycle– Software 3years– Toolingrights 8years– Otherintangiblefixedassets 3–5yearsEstimatedusefullivesanddepreciationmethodarereviewedattheendofeachaccountingperiod,theef-fectofanychangesinestimatesareaccountedforprospectively.Intangibleassetsnotyetavailableforusearetestedannuallyforpossibleimpairmentandarecarriedatcostlessaccumulatedimpairmentlosses.
2.5 Property, plant and equipment
Allproperty,plantandequipmentarestatedathistoricalcostlesscumulativedepreciationandimpairmentlosses.Historicalcostincludesexpenditurethatisdirectlyattributabletotheacquisitionoftheassets.Allrepairsandmaintenancecostsarechargedtotheincomestatementduringthereportingperiodinwhichtheyareincurred.Subsequentcostsareincludedintheasset’scarryingamountorrecognisedasaseparateasset,asappropriate,onlywhenitisprobablethatfutureeconomicbenefitsassociatedwiththeitemwillflowtotheGroupandthecostoftheitemcanbemeasuredreliably.Thecostofqualifyingtangibleassetsalsoincludesborrowingcostsrepresentedbyinterestandothercosts
notes to the ConsolidAted finAnCiAl stAtements 2011
123Annual Report 2011
thatanentityincursinconnectionwithborrowingoffunds.Aqualifyingassetisanassetthatnecessarilytakesatleastoneyeartogetreadyforitsintendeduse.TheGroupceasescapitalisingofborrowingcostswhenthequalifyingassetisreadyforitsintendeduseorsale.Landisnotdepreciated.Depreciationofotherassetsiscalculatedusingthestraight-linemethodovertheirestimatedusefullivesasfollows:– Buildings 9–50years– Technicalequipmentandmachinery(incl.specialtooling) 2–18years– Otherequipment,operatingandofficeequipment 3–25yearsEstimatedusefullivesanddepreciationmethodarereviewedattheendofeachaccountingperiod,theef-fectofanychangesinestimatesareaccountedforprospectively.
2.6 Impairment of assets
Assetsthataresubjecttoamortisationanddepreciationarereviewedforimpairmentwhenevereventsorchangesincircumstancesindicatethatthecarryingamountmaynotberecoverable.Animpairmentlossis recognised intheamountbywhichtheasset’scarryingamountexceeds its recoverableamount.Therecoverableamountisthehigherofanasset’sfairvaluelesscoststosellandvalueinuse.Forthepurposesofassessingimpairment,assetsaregroupedatthelowestlevelsforwhichthereareseparatelyidentifiablecashinflows(cash-generatingunits).
2.7 Financial instruments
2.7.1 Financial assetsTheGroupclassifiesitsfinancialassetsinthefollowingcategories:financialassetsatfairvaluethroughprofitorloss;loansandreceivables;andavailable-for-salefinancialassets.Theclassificationdependsonthepurposeforwhichthefinancialassetswereacquired.ManagementoftheGroupdeterminestheclas-sificationofitsfinancialassetsatinitialrecognition.
a) Financial assets at fair value through profit or lossFinancialassetsatfairvaluethroughprofitorlossarefinancialassetsheldfortradingorsodesignatedbymanagementoftheGroup.Derivativesarealsocategorisedasheldfortradingunlesstheyaredesignatedashedginginstruments.Realisedandunrealisedgainsandlossesfromchangesinthefairvalueoffinancialassetsvaluedatfairvaluethroughprofitorlossarerecognisedunderfinancialincomeorexpensesintheperiodinwhichtheyarise.Duringtheaccountingperiods2011and2010,theGrouponlyhadfinancialderiva-tiveswithinthiscategory(Note2.7.3).
b) Loans and receivablesLoansand receivablesarenon-derivativefinancialassetswithfixedordeterminablepayments thatarenotquotedinanactivemarket.TheyarisewhentheGroupprovidesmoney,goodsorservicesdirectlytoadebtorwithnointentionoftradingthereceivable.Theyareincludedincurrentassets,exceptformaturi-tiesgreaterthan12monthsafterthebalancesheetdate.Theseareclassifiedasnon-currentassets.Loansandreceivablesareclassifiedastradereceivables,orotherreceivablesandfinancialassetsinthebalancesheet(Note8).
c) Available-for-sale financial assetsAvailable-for-salefinancialassetsarenon-derivatives thatareeitherdesignated in this categoryornotclassifiedinanyoftheothercategories.Theyareincludedinnon-currentassetsunlessmanagementintendstodisposeoftheinvestmentwithin12monthsofthebalancesheetdate.Dividendincomefromtheseactivitiesisincludedinotherfinancialincome.Whensecuritiesclassifiedasavailable-for-salearesoldor impaired, theaccumulated fair valueadjustmentsareincludedintheincomestatementasapartofotheroperatingincomeorexpenses.Intheaccountingperiod2011(2010),theGrouponlyhad,withinthecategoryofavailable-for-salefinancialassetsinvestmentstoequityinstrumentsthatdidnothavequotedpriceinanactivemarket.Purchasesandsalesoffinancialassetsarerecognisedontrade—date–thedateonwhichtheGroupcom-mitstopurchaseorselltheasset.Financialassets,withtheexceptionoffinancialassetscarriedatfairvalue
notes to the ConsolidAted finAnCiAl stAtements 2011

124 Annual Report 2011
throughprofitorloss,areinitiallyrecognisedatfairvalueplustransactioncosts.Financialassetscarriedatfairvaluethroughprofitorlossareinitiallyrecognisedatfairvalue,andtransactioncostsareexpensedintheincomestatement.Available¬-for-salefinancialassetsandfinancialassetsatfairvaluethroughprofitorlossaresubsequentlycarriedatfairvalue.Equityinstrumentsthatdonothavequotedpricesinanactivemarketandtheirfairvaluecannotbereliablymeasuredarevaluedatcost.Long-termloansandreceivablesarecarriedatamortisedcostusingtheeffectiveinterestmethod.TheGroupdeterminesateachbalancesheetdatewhetherthereisobjectiveevidencethatafinancialas-setoragroupoffinancialassetsisimpaired.InitiallytheGroupdetermines,inlinewithIAS39,ifobjectiveevidenceexiststhatindividuallymaterialfinancialassetsareimpairedandperformsthesameassessmentindividuallyorcollectivelyforindividuallyimmaterialfinancialassets.IntheeventthattheGroupdoesnotfindobjectiveevidenceof impairmentfor individuallyassessedfinancialassets,whethermaterialornot,theseassetsareincludedinthegroupoffinancialassetswithcommoncreditriskcharacteristicsandthegroupoffinancialassetsisassessedcollectivelyforimpairment.Individualassetsforwhichobjectiveevi-denceofimpairmenthasbeenidentifiedarenotincludedinagroupofassetsthatareassessedcollectivelyforimpairment.Inthecaseofequitysecuritiesclassifiedasavailable-for-salefinancialassets,asignificantorprolongedde-clineinthefairvalueofthesecuritybelowitscostisconsideredasanindicatorthatthesecurityisimpaired.ThetradereceivablesareconsideredtobeimpairedifobjectiveevidenceexistsatthebalancesheetdatethattheGroupwillnotbeabletocollectalloutstandingbalancesinaccordancewithinitiallyagreedcondi-tions.Significantfinancialdifficulties,theprobabilitythatthedebtorwillenterbankruptcyorfinancialre-organisation,anddefaultordelaysinpaymentofliabilitiesareconsideredindicatorsthattradereceivablesareimpaired.Fortradereceivables,theallowanceisquantifiedonthebasisofdetailedinformationaboutthefinancialsituationofthecustomerandpaymenthistory.Whenthereceivableisassessedasuncollectible,anallow-anceequalto100%ofthereceivablebalanceiscreated.Forotherreceivables,theallowanceisquantifiedonthebasisofdetailedinformationaboutthefinancialsituationofthecustomerandpaymenthistory.Thecreationoftheallowanceisthedifferencebetweentheasset’scarryingamountandthepresentvalueofestimatedfuturecashflows,discountedattheoriginaleffectiveinterestrateofthereceivable.ThevalueoftheallowanceisrecognisedintheincomestatementwithinOtheroperatingexpenses.Whenthereceiv-ablecannotbecollectedthroughlegalaction(i.e.thereceivableshavelapsed;insufficientassetsduetobankruptcyofthedebtor;debtorwasliquidatedwithouta legalsuccessor,etc.), it iswrittenoffthroughprofitandlossandtheallowanceisutilised.FinancialassetsarederecognisedwhentherightstoreceivecashflowsfromtheinvestmentshaveexpiredorhavebeentransferredandtheGrouphastransferredsubstantiallyallrisksandrewardsofownership.
2.7.2 Financial liabilities
a) Financial liabilities measured at fair value through profit and lossFinancialliabilitiesatfairvaluethroughprofitorlossarefinancialliabilitiesheldfortradingorsodesignatedbymanagement.Derivativesarealsocategorisedasheldfortradingunlesstheyaredesignatedashedginginstruments.Realisedandunrealisedgainsandlossesfromchangesinthefairvalueoffinancialliabilitiesvaluedatfairvaluethroughprofitorlossarerecognisedunderfinancialincomeorexpensesintheperiodinwhichtheyarise.Duringtheaccountingperiod2011(2010),theGrouponlyhadfinancialderivativesinthiscategory(Note2.7.3).
b) Financial liabilities measured at amortised costFinancial liabilitiesaremeasuredat fair valuenetof transactioncostsat initial recognition.Subsequentmeasurementisatamortisedcostbyapplyingtheeffectiveinterestratemethod.
2.7.3 Financial derivativesTheGroupusesderivatives tohedge currencyandprice risks.Derivativesare initially recognisedat fairvalueonthedateaderivativecontractisenteredintoandaresubsequentlyre-measuredattheirfairvalue.Themethodofrecognisingtheresultinggainorlossdependsonwhetherthederivativeisdesignatedasahedginginstrumentor instrumentheldfortrading.TheGroupdesignatesashedginginstrumentsonlythosewhichfulfiltherequirementsofhedgeaccounting.
notes to the ConsolidAted finAnCiAl stAtements 2011

125Annual Report 2011
TheGroupusesderivativestohedgefuturecashflows.Thehedgeditemsareasfollows:– Highlyprobablefuturetransactions;and– Cashflowfromselectedliabilities.TheGroup ishedgingagainstchanges incashflowsfromhighlyprobablefuturetransactionscausedbychangesinforeignexchangespotratesandotherpricechanges(arisingespeciallyfromthecombinationofcommodityandcurrencyrisk).Thechanges in thespotcomponentofcurrencyfinancialderivativesthatqualifyaseffectivecash-flowhedging instrumentsarerecognisedinothercomprehensive income.Thechanges intheforwardpointscomponentofcurrencyfinancialderivatives thatqualifyaseffectivecash-flowhedging instrumentsarerecognisedasagainorlossintheincomestatement.Thechangesinfairvalueofcommodityswapsthatqualifyaseffectivecash-flowhedginginstrumentsarerecognisedinothercomprehensiveincome.Thecumulativebalancesrecognisedinothercomprehensiveincomearerecycledintotheincomestate-mentasagainorlossintheperiodswhenthehedgeditemaffectstheincomestatement.Ifthetimingofthehedgedcashflowisdeferred,incompliancewithitshedgingstrategytheGroupprolongsthematurityoftheoriginalhedginginstrument.Insuchcasethespotcomponentoftheoriginalderivativecontractisheldinequityuntilthehedgeditemaffectstheincomestatement.Atthismoment,thebalanceofthespotcomponent isrecycledfromothercomprehensiveincometotheincomestatementandrecognisedasagainorloss.Whenahedging instrumentexpiresor issold,orwhenahedgeno longermeetsthecriteria forhedgeaccounting,any cumulativegainor losspreviously recognised inother comprehensive income from theeffectivepartofthehedginginstrumentatthattimeremainsinothercomprehensiveincomeandisreclas-sifiedtoincomestatementwhentheforecasttransactionisultimatelyrecognisedintheincomestatement.Whenaforecasttransactionisnolongerexpectedtooccur,thecumulativegainorlossthatwasreportedinothercomprehensiveincomeisimmediatelytransferredtotheincomestatement.Thefairvalueoffinancialinstrumentsthatarenottradedinanactivemarketisdeterminedbyusingvalu-ationtechniques,suchasnetpresentvalueoffuturecashflows.Thefairvalueofcurrencyforwardsandswapsisdeterminedasthepresentvalueoffuturecashflowsbasedonforwardexchangemarketratesasatthebalancesheetdate.ThefairvalueofcommodityswapsiscalculatedasthepresentvalueoffuturecashflowsbasedontheratesofLME(LondonMetalExchange).
2.8 Current and deferred income tax
Theincometaxexpenseconsistsofcurrentincometaxanddeferredincometax.Thetaxexpenseisre-cognisedintheincomestatementwiththeexceptionofcaseswhenitrelatestoitemsrecognisedinothercomprehensiveincomeordirectlyinequity.Insuchcasesthecurrentincometaxanddeferredincometaxarerecognisedinothercomprehensiveincomeordirectlyinequity.
2.8.1 Current income taxTaxliabilities(receivables)dueforthecurrentperiodandprecedingperiodsarerecognisedintheamountofexpectedpaymentstoorclaimsfromtaxoffices,usingthetaxrates(andtaxlaws)validinrespectiveperiod.Currentincometaxrelatingtothecurrentaccountingperiodandtoprecedingperiodsreducedbyamountalreadypaidisrecognisedasaliability.Iftheamountalreadypaidinthecurrentandinprecedingperiodsexceedscurrentincometaxrelatedtotheseperiods,thedifferenceisrecognisedasanasset.
2.8.2 Deferred income taxDeferredincometaxisprovided,usingthebalance-sheetliabilitymethod,ontemporarydifferencesaris-ingbetweenthetaxbasesofassetsandliabilitiesandtheircarryingamountsintheconsolidatedfinancialstatements.However,ifthedeferredincometaxarisesfrominitialrecognitionofanassetorliabilityinatransactionotherthanabusinesscombinationthatatthetimeofthetransactionaffectsneitheraccount-ingnortaxableprofitorloss,itisnotaccountedfor.Deferredincometaxisdeterminedusingtaxratesandtaxlaws,thathavebeenenactedbythebalancesheetdateandareexpectedtoapplywhentherelateddeferredincometaxassetisrealisedorthedeferredincometaxliabilityissettled.Deferredincometaxassetsarerecognisedtotheextentthatitisprobablethatfuturetaxableprofitwillbeavailableagainstwhichthetemporarydifferencescanbeutilised.
notes to the ConsolidAted finAnCiAl stAtements 2011

126 Annual Report 2011
InaccordancewithIAS12,deferredtaxassetsandliabilitiesareoffsetifthedeferredtaxassetsandliabili-tiesrelatetoincometaxisleviedbythesametaxationauthority,andwherethecompaniesoftheGrouphavetheenforceablerighttooffsetthecurrenttaxassetsandliabilities.Deferredtaxrelatingtoitemsrecognisedinothercomprehensiveincome(forexampletheeffectiveportionofchangesinthefairvalueoffinancialderivativesthataredesignatedandqualifyascashflowhedges)isrecogniseddirectlyinothercomprehensiveincome.TheGrouprecognisesdeferredincometaxassetsonunusedinvestmenttaxcreditsagainstdeferredtaxincomeintheincomestatementtotheextentthatitisprobablethatfuturetaxableprofitswillbeavailableagainstwhichtheunusedtaxcreditscanbeutilised.
2.9 Inventories
Purchasedinventories(rawmaterials,consumables,suppliesandmaterialsusedinproduction,goods)arestatedatthe lowerofcostandnetrealisablevalue.Costs includepurchasecostsandotheracquisitioncosts(e.g.transport,andpackaging).Inventoriesgeneratedfromownproduction,i.e.workinprogressandfinishedgoods,arestatedatlowerofownproductioncostsornetrealisablevalue.Ownproductioncostsincludedirectmaterial,directwagesandproductionoverheads.Theadministrationoverheadexpensesarenotincludedinthevaluationofworkinprogressandfinishedgoods.Netrealisablevalueistheestimatedsellingpriceintheordinarycourseofbusiness,lessestimatedcostsofcompletionlessapplicablevariablesellingexpenses.Netrealisablevaluereflectsallrisksofobsoleteandredundantrawmaterialsandexcessiveoriginalparts.Aweighted-averagecalculationisusedtoaccountfortheconsumptionofmaterials.
2.10 Provisions for long-term employee benefits
Thefollowingtypesoflong-termemployeebenefitsareincludedintheprovisionforlong-termemployeebenefits:– servicejubilee;– otherlong-servicebenefits.Theentitlementtothesebenefitsisusuallyconditionalontheemployeeremaininginserviceforacertainserviceperiod,oruptothemomentofacertainworkanniversaryoftheemployee.Theamountofprovisioncorrespondswiththepresentvalueofthe long-termemployeebenefits,forpastserviceatthebalancesheetdate,determinedusingtheprojectedunitcreditmethod.Theseobligationsarevaluedannuallybyindependentqualifiedactuaries.Actuarialgainsandlossesarisingfromchangesinactuarialassumptionsandexperienceadjustmentsarechargedorcreditedtotheincomestatement.Thepresentvalueofthelong-termemployeebenefitsisdeterminedbydiscountingtheestimatedfuturecashoutflowsarisingfromtheirsettlementusinginterestratesequallingmarketyieldoftreasurybondsbecausethereisnodeepmarketofhigh-qualitycorporatebondsdenominatedinCZK.Thetermandcur-rencyofthesecorporateortreasurybondsareconsistentwiththecurrencyandtermoftherespectiveotherlong-termemployeebenefits.
2.11 Other provisions
InaccordancewithIAS37,provisionsarerecognisedwhereapresentobligationexiststothirdpartiesasaresultofapastevent;whereafutureoutflowofresourcesisprobable;andwhereareliableestimateofthatoutflowcanbemade.Futureoutflowsareestimatedwithrespecttoparticularspecificrisks.Provisionsnotresultinginanoutflowofresourceswithinoneyeararerecognisedattheirsettlementvaluediscountedtothebalancesheetdate.Discountingisbasedoncurrentmarketinterestrates.Wherethereisanumberofsimilarobligations,thelikelihoodthatanoutflowoccursuponthesettlementisdeterminedbyconsideringtheclassofobligationsasawhole.Aprovisionisrecognisedevenifthelikeli-hoodofanoutflowwithrespecttoanyoneitemincludedinthesameclassofobligationsmaybesmall.
notes to the ConsolidAted finAnCiAl stAtements 2011

127Annual Report 2011
2.12 Revenue and expense recognition
Revenuecomprisesthefairvalueofconsiderationreceivedorreceivableforthegoodssoldandservicesprovided,netofvalue-addedtax,rebatesanddiscountsandaftereliminationofsaleswithintheGroup.Salesofgoodsarerecognisedonlywhenthegoodshavebeendelivered,thatis,whenthesignificantrisksandrewardshavepassedtothecustomer,thesalespriceisagreedordeterminableandreceiptofpaymentisprobable.ThiscorrespondsgenerallytothedatewhentheproductsareprovidedtodealersoutsidetheGroup,ortothedeliverydateinthecaseofdirectsalestoconsumers.Therevenuesfromone-offlicencesarerecognisedincompliancewithrelevantcontractualprovisionsattimeoftransferofintellectualrightsalternativelyattimeofprovisionoftechnicaldocumentation,ortech-nicalsupport.Revenuesfromper-piecelicencesarerecognisedbasedonthenumberofcarsproducedinthecurrentaccountingperiod.Dividendincomeisgenerallyrecognisedonthedateatwhichthedividendislegallyapprovedandwhenthepaymentisprobable.Costsofsales includeproductioncosts, costsofgoodspurchased for resale,andadditions towarrantyprovisions.Researchanddevelopmentcostsnoteligibleforcapitalisationintheperiod,depreciationandimpairmentchargesforcapitaliseddevelopmentcostsandproductionequipmentarelikewisepresentedascostofsales.Distributionexpensesincludepersonnelandmaterialcosts,anddepreciationandamortisationapplicabletothedistributionfunction,aswellasthecostsofshipping,advertising,salespromotion,marketresearchandcustomerservice.Administrativeexpensesincludepersonnelcostsandoverheadsaswellasdepreciationandamortisationapplicabletoadministrativefunctions.Otheroperatingincomeincludesalsoincomefromreversalsofexcessprovisionsandaccruals.
2.13 Leases
Leasesinwhichasignificantportionoftherisksandrewardsofownershipareretainedbythelessorareclassifiedasoperatingleases.Paymentsmadeunderoperatingleasesarechargedtotheincomestate-mentonastraight-linebasisovertheperiodofthelease.
2.14 Investment incentives and subsidies
Subsidiesofentrepreneurialactivitiesandofemployeetrainingandretrainingcostsarerecognisedasin-comeovertheperiodsnecessarytomatchthemwiththerelatedcostswhichtheyareintendedtocom-pensate,onasystematicbasis.Governmentgrants,includingnon-monetarygrantsrelatedtothepurchaseof tangibleand intangibleassets,are recognisedat fair valueas reduction in thevalueof tangibleandintangibleassets.
2.15 Related parties
Arelatedpartyisapersonthathascontrolorjointcontroloverthereportingentity;hassignificantinfluenceoverthereportingentity;orismemberofthekeymanagementpersonnelofthereportingentityorofaparentofthereportingentity.ArelatedpartyisalsoanentitywhichisamemberofthesamegroupasthereportingentityandotherentitiesasdefinedbyIAS24article9par.b.
2.16 Share capital
Thesubstanceofafinancialinstrument,ratherthanitslegalform,governsitsclassificationintheGroup´sstate-mentoffinancialposition.Ordinarysharesareclassifiedassharecapital.TheGrouptypicallyincursvariouscostsinissuingoracquiringitsownequityinstruments.Thosecostsmightincluderegistrationandotherregulatoryfees,amountspaidtolegal,accountingandotherprofessionaladvisers,printingcostsandstampduties.Thetransactioncostsofanequitytransactionareaccountedforasadeductionfromequity (netofanyrelated income tax benefit) to the extent they are incremental costs directly attributable to the equitytransactionthatotherwisewouldhavebeenavoided.Thecostsofanequitytransactionthatisabandonedarerecognisedasanexpense.
notes to the ConsolidAted finAnCiAl stAtements 2011

128 Annual Report 2011
Sharepremiumisrepresentedbythedifferencebetweenthenominalvalueofsharesissuedonsharecapi-talincreaseandthemarketpriceofsharesandisrecognisedwithinequity.
2.17 Critical accounting estimates and assumptions
TheGroupmakesestimatesandassumptionsconcerningthefuture.Theresultingaccountingestimateswill,bydefinition,seldomequaltherelatedactualresults.Theestimatesandassumptionsarecontinuouslyassessedbymanagement.Theestimatesandassumptionsarebasedonhistoricalexperienceandotherfactors, includingtherealisticassessmentoffuturedevelopments.Theestimatesandassumptionsthathaveasignificantriskofcausingamaterialadjustmenttothecarryingamountsofassetsand liabilitieswithinthenextfinancialyeararediscussedbelow.
Capitalisation of development costsTheGroupcontinuouslyinvestsinresearchanddevelopmentofnewproducts,whichareeitherdevelopedinternallywithintheCompany’sresearchanddevelopmentcentreorwithintheVolkswagenGroup.Incom-pliancewithIAS38,foreachdevelopmentprojecttheGroupperformsanassessmentwhethertheprojectmeetsthedevelopmentcosts recognitioncriteria,especially theprobabilitythattheassetwillgeneratefutureeconomicbenefits.TheGroup’sassessmentisbasedonassumptionsandestimatesforthenextfiveandmoreyearswithrespecttotheproductsfuturesales,developmentoftheindividualmarketsandauto-motiveindustryitself.AlthoughtheGroup’sanalysesarebasedonthebestcurrentlyavailableinformation,theriskoffuturechangesanduncertaintywithrespecttofuturedevelopmentoftheassumptionsappliedremainsignificant.PleaserefertoNote5foradditionalinformationincludingtherespectiveamounts.
Impairment of non-current assetsInthecourseoftheproductlifecycleandinexceptionalsituationsalsobeforeitscommencement,theremaybecircumstanceswhichindicatethat“cashgeneratingunits”(tangibleandintangibleassetsemployedforproductionofvehiclesofacertainmodel)mighthavesuffered impairment.Todetermineanypossi-bleimpairment,theGroupestimatesvalueinuseofthecashgeneratingunitswhichiscalculatedasdis-countedexpected futurecashflowsassociatedwith theemploymentof thecashgeneratingunits.Fordeterminationoftheestimatedfuturecashflows,theGroupappliesestimatesandassumptionsregardingfuturesalesofaparticularproduct,economicdevelopmentoftheindividualmarketsanddevelopmentoftheautomotiveindustryduringthenextfiveandmoreyears.AlthoughtheGroupestimatesthevalueinuseofthecashgeneratingunitsbasedonthebestinformationanddatacurrentlyavailabletotheGroup,theriskoffuturechangesanduncertaintywithrespecttothefuturedevelopmentoftheappliedassumptionsinthefollowingyearsremainssignificant.MoredetailedinformationaboutimpairmentlossesisincludedinNote5andNote6inthesectionImpairmentreviews.
Provision for warranty claims TheGrouprecognisesprovisionsforwarrantyclaimsforfutureexpensesconnectedwiththebasicguar-antee (2years),withtheguaranteeforcorrosion (dependentonthemodelfor10or12years)andotherguaranteesbeyondthescopeofbasicguarantee,especiallygood-willrepairs(the3rdandthe4thyear).TheGrouprecognisestheprovisionsforwarrantyclaimsatthemomentofsaleonthebasisofthenumberofsoldcarsandinadvancedeterminedratesforindividualmodelline.Theamountoftherateforthebasicguaranteeisdeterminedonthebasisofamanagementestimateoftheaveragenumberoffailuresintheguaranteeperiodandaveragesinglefailurecostswithregardtothespecificsofindividualcountriesandonthebasisofotherspecificassumptions(inflation,customersgroupsdevelopment,etc.).Theamountoftheprovisionforcorrosionisdeterminedthroughamathematicalmodelwhichextrapolatesthecurveoffuturecostsdevelopmentfortherelevantperiodonthebasisofweightedaverageofactualcostsfrompreviouscalendaryearsofthemodelproduction.Theamountoftheprovisionforgood-willrepairsisdeterminedonthebasisofamanagementestimateofexistinggood-willrepaircostsanddefinedstrategyofthegood-willrepairtrademarkpolicywithregardtospecificsofindividualcountries.Theestimatesoftheratesarecontinuouslyrevisedwiththeuseofthemostrecenthistoricaldataaboutthenumberoffailuresandtheirrepair-costs.Changesintheseestimatescansignificantlyinfluencetheto-talamountoftheprovision.Thedetailedanalysisoftheprovisionaccordingtothesingletypes,productionyears,guaranteetypesandthesalesregionsispreparedattheyearend.
notes to the ConsolidAted finAnCiAl stAtements 2011
129Annual Report 2011
Provision for litigation risksCertaineventsrelatingtotheeconomicactivitiesoftheGroupmightresultindisputesresolvedincourtandout-of-courtproceedings.Theriskthatfuturecashoutflowswillberequiredtosettletheclaim(damages,courtfeesetc.)isassessedbytheGrouponceitbecomesinvolvedinanycourtorout-of-courtproceedings.TheriskisassessedbasedonGroup’sexperiencewithsimilarlegalactions,reflectingthelatestdevelop-mentsintheproceedings.Aprovisionisrecognisedifitismorelikelythannotthatanoutflowofeconomicbenefitsoccursinthefuture.Theprovisionismeasuredbasedonthebestestimateoftheexpectedfuturecashoutflows.PleaserefertoNote15foradditionalinformation.
Useful livesTheestimatedusefullivesofindividualtangibleandintangibleassetsorclassesofassetsaredeterminedbasedontheGroup’sexperiencewithsimilarassetsandinaccordancewiththeexpectedfutureeconomicbenefitsof theassets, taking intoaccountalso changes inproductionplanandexpectedutilisationoftheseassets.
3. Financial risk management TheGroupoperatesintheautomotiveindustry,sellsitsproductsinmanycountriesaroundtheworldandperformstransactionsconnectedwithavarietyoffinancialrisks.TheobjectiveoftheGroupistominimisethese risks through applicationof flexible hedging strategywith utilisationof various instruments. ThestructureofriskmanagementintheCompanyisbasedonunifiedprincipleofriskmanagementappliedintheVolkswagenGroup.TheVolkswagenGroup’sriskmanagementprinciplesareincompliancewithrequire-mentsofGermanActonControlandTransparencyinEnterprises(KonTraG).Incompliancewith theVolkswagenGrouppolicyallhedgingoperationsareagreedand implemented incooperationwiththeTreasurydepartmentoftheVolkswagenGroup.ManagementoftheCompanyisregularlyinformedofthecurrentfinancialandotherrelatedrisks(liquidity,foreignexchangerates,interestrates,invoicecurrencies,paymentconditions,taxesetc.),whichisachievedthroughregular“liquiditymeeting”attendedbyrepresentativesfromTreasury,ControllingandAccounting,VolkswagenGroupTreasury,representativesofsubsidiariesandmanagementofCommercialaffairsdepart-ment.Thesemeetingshavepredefinedagenda,whichincludesalsoinformationonmainmacroeconomicindicatorsfromallimportantcountries,inwhichtheCompanysellsitsproducts.Meetingshaveaformalisedstructureandallminutesincludingthedecisionsarerecordedandtheirfulfilmentisperiodicallyreviewed.
3.1 Credit risk
Creditriskisariskthatonepartytoafinancialinstrumentwillcauseafinanciallosstootherpartybyfailingtodischargeanobligation.CreditriskarisesinthenormalcourseoftheGroup’soperations,aswellasthroughactivitiesconnectedwiththefinancialmarkettransactions(moneymarket,currencyconversion,derivativestransactions,etc.).CreditriskarisingfromoperationsonthefinancialmarketismanagedbytheGroupTreasurythroughdeter-minationofmaximallimitsforindividualcounterparties.Thequantificationofcreditrisksisbasedonseveraldifferentprimarycriteria,ofwhichthemostsignificantarethecountryriskandthecounterpartyrisk.Inassessingtheserisks,attentionispaidtothecountryinwhichtheheadquartersofthecounterpartiesaresituated.Thecreditratingofthesecountries ismoni-toredcloselyandattentionisfocusedontheanalysisofmacroeconomicindices.ApartfromtheVolkswa-genGroup’sRiskManagementDepartment,theGroupalsousestheservicesofexternalagencies(D&B,Creditreform,Reuters,etc.).Theacceptanceofnewbusinesspartnersisreliantonstandardapprovalprocedures.TheGroup’sinvolve-mentwithcounterpartiesismanagedbymeansofcreditlimitsthataremonitoredandre-evaluatedonaregularbasis.Adheringtotheselimitsismonitoredandevaluatedonaregularbasis.Activeadministrationandmanagementofreceivablesisincorporatedintothecreditriskmanagementpro-cess. In respectof the trade receivablessecuritystrategy, trade receivablesaredivided into receivablesfromdomesticcustomers,foreigncustomersandVolkswagenGroupentities.Receivablesaresecuredby
notes to the ConsolidAted finAnCiAl stAtements 2011

130 Annual Report 2011
preventativeandsupplementalinstruments.Receivablesaresecuredbypreventativesecurityinstrumentsusedmainlywhenthecustomercontractsareconcluded.Interestondefaultpaymentsisincorporatedinthewrittencontractsasanobligatoryse-curityinstrument.Selectedtradereceivablesaresecuredbyanownershiptitleuntilfullsettlementofthepurchaseprice.TradereceivablesfromVolkswagenGroupcompaniesandfromassociatesareconsideredtobeartheleastrisk.Thereforethesuppliesofgoodsareperformedwithpaymentatmaturity,orthesuppliesarecoveredbypaymentinadvance,orthereceivablesaretransferredtoafactorthroughfactoring.Trade receivables fromcustomers located abroad include receivables fromgeneral importers andothercustomers.Thereceivablesfromgeneralimportersaresecuredbythefollowinginstruments:paymentsinadvance,lettersofcredit,documentarycollection,bankguarantees,standbylettersofcreditandtransferofreceivablestofactoring.Theimmaterialpartofreceivablesfromothercustomersarisesonsuppliesrealisedwithsettlementatmaturity.Receivablesfromdomesticcustomersaredividedintotwogroups:receivablesfromcontractualpartnersboundbysalesorserviceagreements,andfromotherdomesticcustomers.Thereceivablesarisingfromsalesofnewandusedvehiclestocontractualpartnersaretransferredtofactoring.Creditlimitsaresetupforthesuppliesofnewandusedvehicles,originalpartsandaccessories.Thedeliveriesofgoodsareauto-maticallyblockedincasethecustomerfailstosettleoutstandingbalancesonmaturityanduponthesetlimitisexceeded.Theimmaterialpartofsuppliestootherdomesticcustomersisrealisedwithsettlementatmaturity.Differentcombinationsofthefollowinginstrumentsareusedasanadditionalsecurityofhigh-riskreceiva-bles:acknowledgementsofdebt,paymentschedules,billsofexchange,pledges,orexecutorynote.Loanstoemployeesaresecuredbyotheremployeeguarantees.Asat31December2011(asat31December2010)theGroupdidnotholdanypledgestosecureloans.
3.1.1 Maximum exposure to credit risk (CZK million)Themaximumexposuretocreditrisk incaseofactivitiesconnectedtobusinessoperations,grantingofloans,suppliercreditsprovidedtocustomersandbankdepositsiscalculatedasthegrosscarryingamountoftheabovementionedfinancialassetslessanyimpairmentprovisions.Theexposuretocreditriskofde-rivativesismeasuredatfairvalueofthederivative.
Carrying amount as at 31 December 2011
Non-impaired financial assets
not yet due
Non-impaired financial assets
past dueImpaired
financial assets Total
Loans to employees 542 - - 542
Deposits in companies within Volkswagen Group 49,088 - - 49,088
Positive fair value of financial derivatives 1,851 - - 1,851
Others 457 - - 457
Trade receivables 12,010 1,393 20 13,423
Cash 3,703 - - 3,703
Total 67,651 1,393 20 69,064
notes to the ConsolidAted finAnCiAl stAtements 2011

131Annual Report 2011
Carrying amount as at 31 December 2010
Non-impaired financial assets
not yet due
Non-impaired financial assets
past dueImpaired
financial assets Total
Loans to employees 491 - - 491
Deposits in companies within Volkswagen Group 35,678 - - 35,678
Positive fair value of financial derivatives 2,576 - - 2,576
Others 117 - - 117
Trade receivables 9,548 1,368 112 11,028
Cash 10,324 - - 10,324
Total 58,734 1,368 112 60,214
The LineDeposits in VolkswagenGroup companies includes depositswith originalmaturity from threemonthstooneyearintotalamountofCZK21,540million(asat31December2010:CZK10,016million)in-cludedinbalancesheetintheLineOtherreceivablesandfinancialassets(seeNote8),anddepositswithoriginalmaturity lessthanthreemonths intotalamountofCZK27,548million (asat31December2010: CZK25,662million)includedinbalancesheetintheLineCashandcashequivalents(seeNote10).Inthefollowingtable,thereportedfiguresrepresenteitherbookvalueofsecuredtradereceivables,orthesecuredamountofthetradereceivablesifthisamountislower,determinedindividuallyforeachinstrument:
CZK million 2011 2010
Retention of legal ownership title to sold inventories 2,403 1,508
Bank guarantees 1,761 1,468
Letters of credit 1,230 1,154
Documentary collection 235 201
Accepted deposit 19 15
Total 5,648 4,346
3.1.2 Risk concentrationTheGroupmonitorsconcentrationofcreditriskbydistributionregionsandbythedenominationcurrency.ThesensitivityoftheGrouptoforeignexchangeriskisdisclosedinNote3.4.1.Duringtheaccountingperiod2011(2010),theGroupdidnotidentifyasignificantriskconcentrationonthebasisofdistributionregion.Asignificantportionoffinancialassetsisofanintra-groupnature.TheGroupdepositedfreecashthroughintraGroupcompanies(asin2010).Thetotalvolumeofshort-termdepositswithintra-groupcompaniesamountedtoCZK49,811millionasat31December2011(asat31December2010:CZK40,473million),outofwhich:– depositswithoriginalmaturityfromthreemonthstooneyearincludedinbalancesheetintheLineOtherreceivablesandfinancialassets(seeNote8) intotalamountofCZK21,540million(asat31December2010:CZK10,016million),
– deposits with original maturity less than three months included in balance sheet in the Line Cashand cash equivalents (see Note 10) in total amount of CZK 27,548million (as at 31 December 2010: CZK25,662million),and
– overnightdepositsfromcashpoolingincludedinbalancesheetintheLineCashandcashequivalents(seeNote10)intotalamountofCZK723million(asat31December2010:CZK4,795million).
In2011(2010)theGroupdidnotconsideritprobablethatadefaultcouldoccurinconnectionwiththefreecashdeposited.Possibleriskofunpaidreceivablesfromthirdpartieswasindividuallynotsignificant(spreadbetweenvariousdebtorsandregions).
notes to the ConsolidAted finAnCiAl stAtements 2011

132 Annual Report 2011
3.1.3 Credit quality of financial assets neither past due nor impaired (CZK million)TheGroupusesthefollowingcriteriawhensetting ratingsoffinancialassets thatareneitherpastduenorimpaired.Solvencyclass1includesreceivables,loanstorelatedparties,securedreceivablesfromthirdpartiesandreceivablesthatwillbesubjecttofactoringwithoutrecourse.Thereisnoobjectiveevidenceindicatingimpairmentofthesereceivables.Solvencyclass2includesunsecuredtradereceivablesfromthirdpartiesforwhichthereisnoobjectiveevidenceindicatingimpairment(receivablesfromdealerswithoutriskandreceivablesfromdealerswithscheduleofpayments).
Solvency class 1 Solvency class 2 Total
Balance as at 31 December 2011
Loans to employees 542 - 542
Deposits in companies within Volkswagen Group 49,088 - 49,088
Positive fair value of financial derivatives 1,851 - 1,851
Other receivables and financial assets 457 - 457
Trade receivables 10,743 1,267 12,010
Cash 3,703 - 3,703
Total 66,384 1,267 67,651
Solvency class 1 Solvency class 2 Total
Balance as at 31 December 2010
Loans to employees 491 - 491
Deposits in Volkswagen Group companies 35,678 - 35,678
Positive fair value of financial derivatives 2,576 - 2,576
Other receivables and financial assets 117 - 117
Trade receivables 8,434 1,114 9,548
Cash 10,324 - 10,324
Total 57,620 1,114 58,734
3.1.4 Carrying amount of financial assets past due and not impaired (CZK million)
Months past due
Less than 1 month 1 – 3 months More than 3 months Total
Trade receivables
Balance as at 31 December 2011 935 158 300 1,393
Balance as at 31 December 2010 776 470 122 1,368
Receivablesmorethan3monthspastduearerepresentedmainlybyreceivablesfromVolkswagenGroupcompanies.TheGroupdidnotidentifyanyneedforimpairmentofthesereceivables.Outofthetotalamountofreceivablesfromgroupcompanieswhichwerepastdueasat31December2010(CZK1,161million),CZK24millionwerestillnotpaidasat31December2011.
notes to the ConsolidAted finAnCiAl stAtements 2011

notes to the ConsolidAted finAnCiAl stAtements 2011
133Annual Report 2011
3.1.5 Valuation allowance for receivables and other financial assets (CZK million)Impairmentstatusanddevelopmentofotherreceivablesandtradereceivableshasbeenanalysedasfollows:
2011 2010
Other receivables and financial assets
Gross balance as at 31 December 152 156
Valuation allowance:
Balance as at 1 January (156) (161)
Additions - -
Utilised - -
Released 4 5
Balance as at 31 December (152) (156)
Net balance as at 31 December - -
Trade receivables
Gross balance as at 31 December 385 495
Valuation allowance:
Balance as at 1 January (383) (471)
Additions (57) (100)
Utilised 27 55
Released 48 133
Balance as at 31 December (365) (383)
Net balance as at 31 December 20 112
Duringtheaccountingperiod2011(2010)theGrouphadvaluationallowancesonindividualfinancialassetsonlyforwhichadefaultriskwasidentified.Duringtheaccountingperiod2011(2010)theGrouphadvaluationallowancesonlyonfinancialassetsincludedinthecategoryofloansandreceivables.
3.2 Liquidity risk
Liquidityriskisariskthatanentitywillencounterdifficultyinmeetingobligationsassociatedwithfinancialliabilities.Theobjectiveof liquidity riskmanagement is toensure thebalancebetween the fundingof operatingactivitiesandfinancialflexibilityinordertoensurethatallclaimsoftheGroupssuppliersandcreditorsaresettledtimely.ManagementoftheGroupmonitorstheliquidityanditsdevelopmentattheregularmonthlymeetings,socalled“liquiditymeetings”,attendedbytherepresentativesofTreasury,ControllingandAccountingdepart-ments.Thepredeterminedagendagenerallyincludestheinformationaboutdailydevelopmentofliquidityanditsstructure.TheGroupmanagementisalsopresentedwiththeshort-termforecastsoftheliquiditydevelopment.
Cash managementSince2010,whentheCompanywas integrated intothe“GlobalTreasuryPlatform”ofVolkswagenGroup(GTP)whichisoperatedbyVolkswagenGroupServices(VGS)locatedinBrussels,centralisationandopti-malisationofprocessesisensuredwithintheVolkswagenGroupintheareasofcashmanagement,pay-mentssystemandliquiditymanagement.TheGTPimplementationresultedinchangesinthesystemofoutgoingandincomingpayments.Theout-goingpaymentsareprocessedonbehalfoftheGroupbyVGS,basedonpaymentordersplacedbytheCom-panyandaretransferredfromabankaccountheldbyVGS.TheincomingpaymentsarecreditedtoGroup’sbankaccountsandsubsequentlyattheendofeachworkingdaytheyareautomaticallytransferredtoVGS’
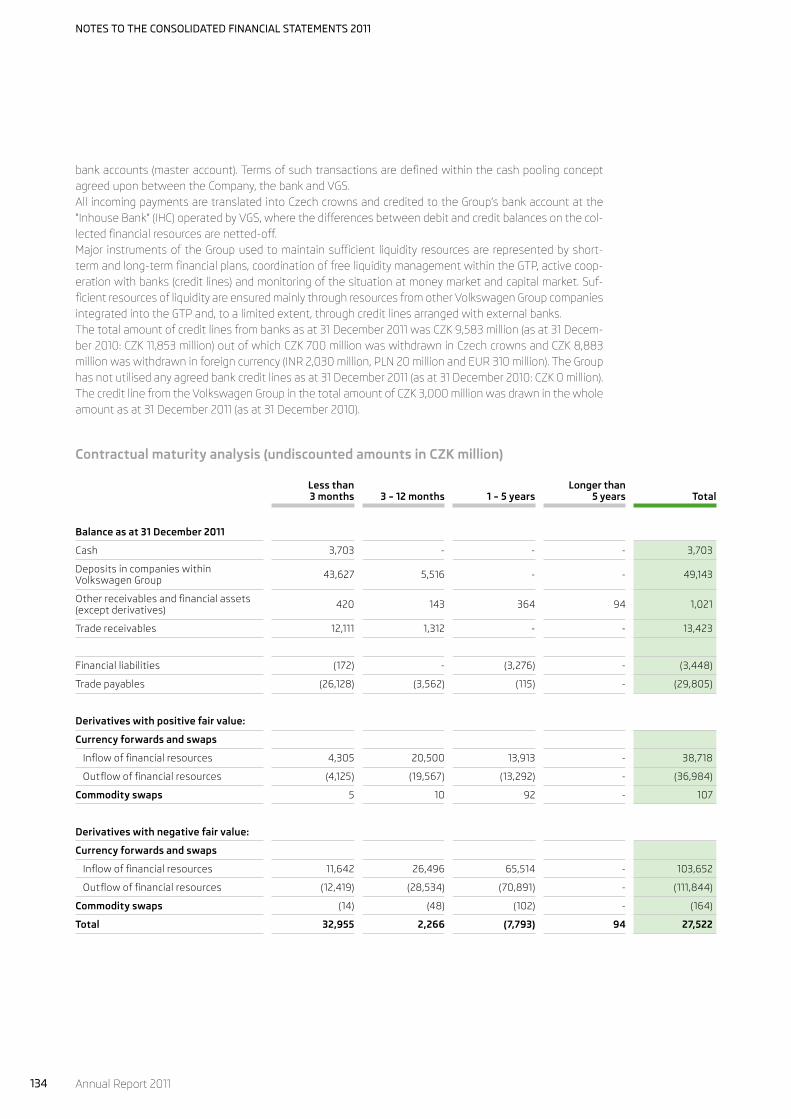
notes to the ConsolidAted finAnCiAl stAtements 2011
134 Annual Report 2011
bankaccounts(masteraccount).TermsofsuchtransactionsaredefinedwithinthecashpoolingconceptagreeduponbetweentheCompany,thebankandVGS.AllincomingpaymentsaretranslatedintoCzechcrownsandcreditedtotheGroup’sbankaccountatthe“InhouseBank”(IHC)operatedbyVGS,wherethedifferencesbetweendebitandcreditbalancesonthecol-lectedfinancialresourcesarenetted-off.Major instrumentsoftheGroupusedtomaintainsufficient liquidityresourcesarerepresentedbyshort-termandlong-termfinancialplans,coordinationoffreeliquiditymanagementwithintheGTP,activecoop-erationwithbanks(creditlines)andmonitoringofthesituationatmoneymarketandcapitalmarket.Suf-ficientresourcesofliquidityareensuredmainlythroughresourcesfromotherVolkswagenGroupcompaniesintegratedintotheGTPand,toalimitedextent,throughcreditlinesarrangedwithexternalbanks.Thetotalamountofcreditlinesfrombanksasat31December2011wasCZK9,583million(asat31Decem-ber2010:CZK11,853million)outofwhichCZK700millionwaswithdrawninCzechcrownsandCZK8,883millionwaswithdrawninforeigncurrency(INR2,030million,PLN20millionandEUR310million).TheGrouphasnotutilisedanyagreedbankcreditlinesasat31December2011(asat31December2010:CZK0million).ThecreditlinefromtheVolkswagenGroupinthetotalamountofCZK3,000millionwasdrawninthewholeamountasat31December2011(asat31December2010).
Contractual maturity analysis (undiscounted amounts in Czk million)
Less than 3 months 3 – 12 months 1 – 5 years
Longer than 5 years Total
Balance as at 31 December 2011
Cash 3,703 - - - 3,703
Deposits in companies within Volkswagen Group 43,627 5,516 - - 49,143
Other receivables and financial assets (except derivatives) 420 143 364 94 1,021
Trade receivables 12,111 1,312 - - 13,423
Financial liabilities (172) - (3,276) - (3,448)
Trade payables (26,128) (3,562) (115) - (29,805)
Derivatives with positive fair value:
Currency forwards and swaps
Inflow of financial resources 4,305 20,500 13,913 - 38,718
Outflow of financial resources (4,125) (19,567) (13,292) - (36,984)
Commodity swaps 5 10 92 - 107
Derivatives with negative fair value:
Currency forwards and swaps
Inflow of financial resources 11,642 26,496 65,514 - 103,652
Outflow of financial resources (12,419) (28,534) (70,891) - (111,844)
Commodity swaps (14) (48) (102) - (164)
Total 32,955 2,266 (7,793) 94 27,522

notes to the ConsolidAted finAnCiAl stAtements 2011
135Annual Report 2011
Contractual maturity analysis (undiscounted amounts in Czk million)
Less than 3 months 3 – 12 months 1 – 5 years
Longer than 5 years Total
Balance as at 31 December 2010
Cash 10,324 - - - 10,324
Deposits in companies within Volkswagen Group 25,692 10,052 - - 35,744
Other receivables and financial assets (except derivatives) 116 143 319 79 657
Trade receivables 8,660 2,368 - - 11,028
Financial liabilities (138) (121) (3,414) - (3,673)
Trade payables (24,446) (2,983) - - (27,429)
Derivatives with positive fair value:
Currency forwards and swaps
Inflow of financial resources 8,439 24,678 33,894 - 67,011
Outflow of financial resources (8,138) (23,671) (33,128) - (64,937)
Commodity swaps 25 71 269 - 365
Derivatives with negative fair value:
Currency forwards and swaps
Inflow of financial resources 5,227 13,730 30,446 - 49,403
Outflow of financial resources (5,507) (14,423) (31,775) - (51,705)
Total 20,254 9,844 (3,389) 79 26,788
3.3 Market risk
Marketriskisariskthatthefairvalueoffuturecashflowsoffinancialinstrumentswillfluctuatebecauseofchangesinmarketprices.Marketriskincludesthreetypesofrisks:currencyrisk,interestrateriskandpricerisk.Developmentsonthefinancialmarketsareconsideredtobethemostsignificantriskfactor,especiallythefluctuationofexchangerates.
3.3.1 Currency riskCurrencyriskisariskthatthefairvalueoffuturecashflowsoffinancialinstrumentswillfluctuatebecauseofchangesinforeignexchangerates.ThefluctuationofexchangeratesrepresentssignificantriskinthattheGroupsellsitsproducts,andpur-chasesmaterial,partsandservicesconcurrentlyinvariousforeigncurrencies.TheGroupactivelymanagesthisriskthroughcontinuallyupdatedmarketanalysis,worldwideprocurementofmaterialandequipmentandproductionofitsproductsinthesalesregions.StandardderivativehedginginstrumentsareusedbytheGrouptomanagethecurrencyrisk.Theriskexposure,asdeterminedbytheanalysisofincomeandexpensestructuresbyforeigncurrency,ishedgedonthebasisofexpectedfutureforeigncurrencycashflows.Forwardexchangecontractsandcurrencyswapsareusedashedginginstrumentsforeliminationofcur-rencyrisk.ThebasicparametersofthehedgingpolicyaredefinedbythehedgingdirectivevalidfortheentireVolkswagenGroup,whichincludesalsothelistofpermittedfinancialproducts(derivatives).ContractsareconcludedupontheCompany’srequestandinitsnamebytheTreasuryDepartmentoftheVolkswagenGroup.TheriskresultingfromchangesinexchangeratesagainstCZKishedgedforatotalof11currencies.ThemostimportanttradingcurrenciesareUSD,EUR,GBP,CHF,PLNandRUB.TheGroupapplieshedgeac-countingforcurrencyrisk.FortheanalysisofsensitivitytoexchangeratespleaserefertoNote3.4.1.

notes to the ConsolidAted finAnCiAl stAtements 2011
136 Annual Report 2011
3.3.2 Interest rate riskInterestrateriskisariskthatthefairvalueoffuturecashflowsofafinancialinstrumentwillfluctuatebe-causeofchangesinmarketinterestrates.Theobjectiveof the interest rate riskmanagement is to eliminate the risk arising fromfluctuationsofinterestratesoffinancialliabilitieswithfloatinginterestratesbymaintaininganappropriatestructureoffinancialliabilities.ThemanagementoftheGroupmonitorstheinterestrateriskattheregularmonthlymeetingsattendedbytherepresentativesofTreasury,ControllingandAccountingdepartments.Thepredeterminedagendagen-erallyincludesthefollowing-informationaboutcurrentdevelopmentofinterbankinterestrates(especiallyPRIBOR,EURIBORandLIBOR)andinformationaboutcentralbanks’interestratesintheregionswheretheGroupoperates.TheGroupmanagementisalsopresentedwiththeshort-termforecastsoftheinterestratesdevelopment.TheexposuretointerestrateriskarisesfromcashdepositsatVolkswagenGroupcompanies.FortheanalysisofsensitivitytointerestratespleaserefertoNote3.4.2.
3.3.3 Price riskPriceriskisariskthatthefairvalueoffuturecashflowsfromthefinancialinstrumentswillfluctuatebe-causeofchangesinmarketprices,especiallycommodityprices(apartfromthatwhichresultfromcurrencyriskandinterestrisk).Duetothecontinuousvolatilityinthepricesoftherawmaterialcommoditiesandlimitedaccessibilitytospecificcommodities,managementhasaimedtoeliminatethese risks throughtarget riskmanagementstrategies.Inthisregard,utilisationofalternativeproductionmaterialsandproceduresaswellasutilisationofrecycledmaterialisbeingexamined.Inaddition,emphasisisplacedonextendingtheinternationalsupplychaininco-operationwiththeVolkswagenGroup.Highriskcommoditiesincludeprimarilyaluminium,cop-per,palladium,lead,platinumandrhodium.ThosecommoditiesidentifiedashighriskarecontrolledattheVolkswagenGrouplevelthroughthelongtermsupplycontractswiththesuppliers.In2011(2010),theGroupwashedgingagainstpricerisksingeneral(asaconsequenceofchangesinparticu-larcommoditypricesandforeignexchangerates)throughcommodityswaps(forcopperandaluminium)andcurrencyforwards.Thosefinancialderivativesaresubjecttohedgeaccounting—hedgingoffuturecashflows.TheGrouphadin2011(2010)nosignificanttradingderivatives.TheGrouphadin2011(2010)nosignificanttradingderivatives.

notes to the ConsolidAted finAnCiAl stAtements 2011
137Annual Report 2011
3.3.4 Derivative financial instruments
Nominal and fair value of derivatives (Czk million)
Nominal value of derivatives Fair value of derivatives
Balance as at 31 December 2011
Balance as at 31 December 2010
Balance as at 31 December 2011
Balance as at 31 December 2010
With positive
fair value
With negative fair value
With positive
fair value
With negative fair value Positive Negative Positive Negative
Currency instruments
Currency forwards - cash flow hedging 36,895 107,628 63,608 49,419 1,696 6,493 2,123 2,231
Currency swaps - cash flow hedging 1,632 4,193 1,709 2,076 50 277 94 113
Commodity instruments
Commodity swaps - cash flow hedging 1,243 1,468 1,475 - 105 160 359 -
Total 39,770 113,289 66,792 51,495 1,851 6,930 2,576 2,344
Thefairvaluesoffinancialderivativesfulfilthecriteriaoflevel2incompliancewiththeIFRS7hierarchy(thefairvaluesarederivedfrommarketquotationsofforwardexchangerates,commoditypricesandyieldcurves,howeverthefinancialderivativesarenotdirectlytradedonactivefinancialmarkets).
Volume of hedged cash flows (Czk million)
Balance as at 31 December 2011 Volume of hedged cash flows
Within 1 year 1 – 5 years Total
Currency risk exposure
Hedging of future cash flows - future receivables 49,167 70,354 119,521
Hedging of future cash flows - future liabilities (15,289) (10,596) (25,885)
Other price risks (combination of commodity and currency risks)
Hedging of future cash flows - future liabilities (609) (1,921) (2,530)
Total 33,269 57,837 91,106
Balance as at 31 December 2010 Volume of hedged cash flows
Within 1 year 1 – 5 years Total
Currency risk exposure
Hedging of future cash flows - future receivables 33,295 51,404 84,699
Hedging of future cash flows - future liabilities (18,026) (12,517) (30,543)
Other price risks (combination of commodity and currency risks)
Hedging of future cash flows - future liabilities (490) (1,077) (1,567)
Total 14,779 37,810 52,589

notes to the ConsolidAted finAnCiAl stAtements 2011
138 Annual Report 2011
3.4 Sensitivity analysis
3.4.1 Sensitivity to exchange ratesTheGroupisexposedtotheforeigncurrencyriskarisingmainlyfromtransactionsperformedwithEUcoun-tries(EUR),withcountriesusingUSDastransactioncurrency.Theforeigncurrencyriskismeasuredagainstthefunctionalcurrency(CZK)asatthebalancesheetdate,whenthefinancialassetsandliabilitiesdenomi-natedinforeigncurrenciesarerecalculatedtoCZKapplyingtheCzechNationalBankexchangerate.Thesensitivityanalysisincludesanalysisofexposurearisingfromderivativefinancialassetsandliabilitiesandunpaidfinancialassetsandliabilitiesdenominatedinforeigncurrencies,andmeasurestheimpactfromrecalculationoftheseitemsasatbalancesheetdatebyusingadjustedexchangeratescomparedtothosepublishedbyCzechNationalBank.In2011theGroupconsidersthemovementsofexchangeratesEUR,USD,CHFandGBPagainstCZKinthefollowingperiod+10%(appreciationofCZK)and-10%(depreciationofCZK)aspossible.In2010theGroupconsideredthemovementsofexchangeratesofEUR,USD,CHFandGBPagainstCZKinthefollowingperiodof+10%(appreciationofCZK)and-10%(depreciationofCZK)aspossible.Thesensitivityanalysistoexchangeratechanges isbasedontheassumptionofexpectedpossibleex-changeratemovements.Thefollowingtablespresentpossibleimpactonprofitandlossandonequitybeforetaxofexpectedpos-sibleappreciationordepreciationofCZKtoforeigncurrencies:
2011 (CZK million) CZK appreciation by 10%
EUR USD CHF GBPOther
currencies Total
Income statement
Non-derivative financial instruments 767 (84) (10) 5 (400) 278
Derivative financial instruments 10 (41) 2 (68) (83) (180)
Equity
Derivative financial instruments (2,510) 2,307 2,436 3,323 3,739 9,295
2011 (CZK million) CZK depreciation by 10%
EUR USD CHF GBPOther
currencies Total
Income statement
Non-derivative financial instruments (767) 84 10 (5) 400 (278)
Derivative financial instruments (10) 41 (2) 68 83 180
Equity
Derivative financial instruments 2,510 (2,307) (2,436) (3,323) (3,739) (9,295)

notes to the ConsolidAted finAnCiAl stAtements 2011
139Annual Report 2011
2010 (CZK million) CZK appreciation by 10%
EUR USD CHF GBPOther
currencies Total
Income statement
Non-derivative financial instruments 995 (105) - - (272) 618
Derivative financial instruments 45 (39) (14) (75) (72) (155)
Equity
Derivative financial instruments (2,608) 1,598 1,700 2,270 2,658 5,618
2010 (CZK million) CZK depreciation by 10%
EUR USD CHF GBPOther
currencies Total
Income statement
Non-derivative financial instruments (995) 105 - - 272 (618)
Derivative financial instruments (45) 39 14 75 72 155
Equity
Derivative financial instruments 2,608 (1,598) (1,700) (2,270) (2,658) (5,618)
3.4.2 Sensitivity to interest ratesTheGroup isexposed to interest riskmainly in relation toshort-termdepositsprovided toVolkswagenGroupcompanies.Theanalysisofsensitivitytochangesininterestrateswasbasedonexposuretoderivativefinancialassetsandliabilitiesasatbalancesheetdateinthesamewayasforthenon-derivativefinancialassets.In2011theGroupassumespossiblemovementsoftheyieldcurveinthefollowingperiodforloans,bankdepositsandcurrencyforwardsandswapsby+100/-25basispoints.In2010,theGroupassumedforbondsandinterestrateswapspossiblemovementsoftheyieldcurveinthefollowingperiodforloansandbankdepositsby+100/-25basispoints.TheGroupismostsensitivetomovementsoftheCZKyieldcurve.Inthecaseofderivativefinancialinstruments,theGroupmeasurestheimpactonthechangeinfairvalueofthesederivativesthatresultsfromthechangeintheyieldcurve.Fornon-derivativefinancialinstrumentstheim-pactonprofitandlossisdeterminedonthebasisofdefinedchangeintheinterestrate,whichwouldariseatthebeginningofthenextaccountingperiodandbasedontheassumptionthatnootherchangesintheinterestratewouldoccurduringtheentireaccountingperiod.

notes to the ConsolidAted finAnCiAl stAtements 2011
140 Annual Report 2011
Thefollowingtablespresentpossibleimpactonprofitandlossandonequitybeforetaxofexpectedin-creaseordecreaseofinterestrates:
2011 (CZK million) Interest rate increased by
100 basis points
Interest rate decreased by
25 basis points
Income statement
Non-derivative financial instruments 454 (114)
Derivative financial instruments 91 (23)
Total 545 (137)
Equity
Derivative financial instruments - -
2010 (CZK million) Interest rate increased by
100 basis points
Interest rate decreased by
25 basis points
Income statement
Non-derivative financial instruments 348 (87)
Derivative financial instruments - -
Total 348 (87)
Equity
Derivative financial instruments (7) 2
3.4.3 Sensitivity to changes in other price risksTheGroupisexposedtoacombinationofcommodityandcurrencyrisksduetovolatilityinpricesofparticu-larcommoditiestradedinforeigncurrencies.Thisriskofchangeincashflowsishedgedbyacombinationofcommodityswapsandcurrencyforwards.Thesensitivityanalysistochangesincommoditypriceswasdeterminedbasedontheexposuretoderivativefinancialassetsandliabilitiesasatthebalancesheetdate.In2011, theGroupassumespotentialmovements inaluminiumprices in the followingperiodof+/-10%.In2011,theGroupassumespotentialmovementsincopperpricesinthefollowingperiodof+/-20%.TheGroupconsiderschangesinthefairvaluesofderivativefinancialinstrumentsduetochangesinspotcom-modityprices.Othernon-derivativefinancialassetsandliabilitiesaredeemedtonotbesensitivetochang-esincommoditypricessincethepricesarefixedatthetimeofrecognitionofthefinancialliabilityorasset.

notes to the ConsolidAted finAnCiAl stAtements 2011
141Annual Report 2011
Thefollowingtablesrepresentapossibleimpactonequitybeforetaxofexpectedincreaseordecreaseofcopperandaluminiumprices:
2011 (CZK million) Increase of copper prices +20%
Decrease of copper prices (20)%
Increase of aluminium prices +10%
Decrease of aluminium prices (10)%
Equity
Derivative financial instruments 270 (270) 120 (120)
2010 (CZK million) Increase of copper prices +20%
Decrease of copper prices (20)%
Increase of aluminium prices +10%
Decrease of aluminium prices (10)%
Equity
Derivative financial instruments 130 (130) 110 (110)
ThepossibleimpactonconsolidatedincomestatementwasassessedbytheGroupasimmaterial.
3.5 Capital risk management
Theoptimalcapitalisationof theGroup is the resultofacompromisebetweentwo interests: returnoncapitalandtheGroup’scapacitytomeetallofitsliabilitiesdueforpayment.ItistheobjectiveofthecapitalmanagementfunctiontomaintainanadequateownedtoborrowedcapitalratiotoguaranteeduepaymentsofallfinancialliabilitieswhilepromotingacontinuedgrowthoftheGroup’svaluefortheshareholders.Theratiosofequityandofborrowedcapitalontotalcapitalareshowninthefollowingtable:
CZK million 2011 2010
Equity 81,211 74,772
Equity ratio 52.9% 55.1%
Non-current financial liabilities 3,000 3,000
Current financial liabilities 141 228
Total financial liabilities 3,141 3,228
Ratio of financial liabilities to total liabilities 2.0% 2.4%
Total equity and liabilities 153,557 135,736

notes to the ConsolidAted finAnCiAl stAtements 2011
142 Annual Report 2011
4. Geographical informationTheGroup’sheadofficeandmainproductionfacilitiesaresituatedintheCzechRepublic.TheGroup’ssalesaregeneratedfromfivebasicgeographicalregions:theCzechRepublic;Germany,Wes-ternEurope-Other;CentralandEasternEurope;andOverseas/Asia/Africa/Australia.Overseas/Asia/Africa/AustraliaregionisduetoitsimmaterialityreportedasUnallocated.InregionsWesternEurope-Other,Cen-tralandEasternEuropeandincategoryUnallocatedthereisnoindividualcountrywhichhasmorethana10%shareoftotalsales.
2011 (CZK million)Czech
Republic Germany
Western Europe -
Other
Central and Eastern Europe Unallocated Total
Sales - based on location of customers 22,084 64,184 83,877 47,661 34,756 252,562
Non-current assets* 59,871 187 - 38 763 60,859
2010 (CZK million)Czech
Republic Germany
Western Europe -
Other
Central and Eastern Europe Unallocated Total
Sales - based on location of customers 21,842 53,824 75,446 40,377 27,965 219,454
Non-current assets* 54,893 172 - 117 808 55,990
*Non-current assets other than financial instruments and deferred tax assets.
5. Intangible assets (CZK million)
Goodwill
Capitalised development costs
for products currently in use
Capitalised development costs for products under
developmentOther intangible
assets Total
Costs
Balance as at 1 January 2011 75 24,577 2,143 6,879 33,674
Additions - 22 3,284 1,896 5,202
Disposals - (2,931) - (288) (3,219)
Transfers - 42 (42) 2 2
Foreign exchange differences 2 - - 4 6
Balance as at 31 December 2011 77 21,710 5,385 8,493 35,665
Cumulative amortisation and impairment losses
Balance as at 1 January 2011 - (16,228) - (4,477) (20,705)
Amortisation - (2,314) - (450) (2,764)
Impairment losses - (758) - (998) (1,756)
Disposals and transfers - 2,931 - 288 3,219
Foreign exchange differences - - - (5) (5)
Balance as at 31 December 2011 - (16,369) - (5,642) (22,011)
Carrying amount as at 31 December 2011 77 5,341 5,385 2,851 13,654

notes to the ConsolidAted finAnCiAl stAtements 2011
143Annual Report 2011
Goodwill
Capitalised development costs
for products currently in use
Capitalised development costs for products under
developmentOther intangible
assets Total
Costs
Balance as at 1 January 2010 79 22,489 1,138 5,197 28,903
Additions - 950 2,143 1,737 4,830
Disposals - - - (46) (46)
Transfers - 1,138 (1,138) 4 4
Foreign exchange differences (4) - - (13) (17)
Balance as at 31 December 2010 75 24,577 2,143 6,879 33,674
Cumulative amortisation and impairment losses
Balance as at 1 January 2010 - (12,570) - (3,252) (15,822)
Amortisation - (2,932) - (609) (3,541)
Impairment losses - (726) - (672) (1,398)
Disposals and transfers - - - 45 45
Foreign exchange differences - - - 11 11
Balance as at 31 December 2010 - (16,228) - (4,477) (20,705)
Carrying amount as at 31 December 2010 75 8,349 2,143 2,402 12,969
Otherintangibleassetsincludemainlytoolingrights,softwareandsoftwarelicences.AmortisationandimpairmentlossesofintangibleassetsofCZK4,731million(2010:CZK4,780million)areincludedinthecostofsales,CZK14million(2010:CZK21million)indistributionexpenses,andCZK135million(2010:CZK138million)inadministrativeexpenses.
Impairment reviewsGoodwillisallocatedtoŠKODAAUTODeutschlandGmbHasthecash-generatingunitforthepurposeofimpairmenttesting.Therecoverableamountofacash-generatingunitiscalculatedbasedonvalue-in-usecalculations.Thesecalculationsusecashflowprojectionsbasedonfinancialbudgetsapprovedbytheman-agementandcoveringafive-yearperiod.Cashflowsbeyondthefive-yearperiodareextrapolatedusingtheestimatedgrowthratethatdoesnotexceedthelong-termaveragegrowthrateforautomotiveindustry.Theexpectedgrowthratefortheimpairmenttestin2011was1%(2010:1%).Thediscountratesusedarepre-taxratesreflectingspecificrisksandcharacteristicsofthesegmentwherethecash-generatingunitoperates.Fortheyear2011,thediscountrateof6%(2010:5.5%)wasused.TherequirementsofIAS1,IAS10andIAS36havebeenassessedbytheGroup’smanagementinrelationtothedecreaseinplannedcashinflowsregardingparticularŠKODAmodelsandtheirpotentialimpactonthecarryingamountoftheGroup‘snon-currentintangibleassets.Duetosubstantialchangesinthemarketen-vironment,theGrouphasexperiencedin2011asignificantdecreaseintheplannedcashinflowsrelatingtothreecash-generatingunits(productionofcarsofcertainmodels).Impairmentreviewsofassetsrelatingtothosecash-generatingunitshavebeenperformed.Thecarryingamountsoftheassetsrelatingtothecash-generatingunitshavebeencomparedwiththerelevantrecoverableamounts.Therecoverableamountshavebeendeterminedbasedonthecalculationofthevalue inuseapplyingcashflowprojectionsoverthelifecycleofthecash-generatingunitsreflectingfinancialplans,approvedbytheGroup’smanagement.Fordiscountingcashflows,thediscountrateof6.8%hasbeenappliedin2011(2010:6.4%),reflectingthespecificrisksassociatedwiththesectorinwhichtheGroupoperates.Fortwocash-generatingunitsthecomparisonofthecarryingamountswiththerelevantrecoverableamountsresultedinanimpairmentlossallocatedtointangibleassetsintheamountofCZK1,756million(2010:CZK1,398million),whichhasbeenpostedtotheincomestatement(withinlineCostofsales)fortheyearended31December2011(31Decem-ber2010).

notes to the ConsolidAted finAnCiAl stAtements 2011
144 Annual Report 2011
Capitalisation of borrowing costs Forthecapitalisationofborrowingcosts in2011,theGroupappliedthecapitalisationrateof4.5%(2010:3.8%).Noborrowingcostshavebeencapitalisedinthecostof intangibleassets in2011or2010astheywerenotsignificant.
The following amounts were recognised in the income statement as research and development expenses (Czk million)
2011 2010
Research and non-capitalised development costs 6,061 4,564
Amortisation and impairment losses of development costs 3,072 3,658
Research and development costs recognised in the income statement 9,133 8,222
6. Property, plant and equipment (CZK million)
Land and buildings
Technical equipment and
machineryTooling, office and
other equipment
Payments on account and assets under construction Total
Costs
Balance as at 1 January 2011 30,243 59,338 46,188 7,468 143,237
Additions 969 1,539 986 8,760 12,254
Disposals (64) (1,932) (1,360) (2) (3,358)
Transfers 456 2,793 623 (3,874) (2)
Foreign exchange differences (57) (93) (26) (1) (177)
Balance as at 31 December 2011 31,547 61,645 46,411 12,351 151,954
Cumulative depreciation and impairment losses
Balance as at 1 January 2011 (12,063) (50,363) (38,452) - (100,878)
Amortisation (1,119) (3,135) (3,479) - (7,733)
Impairment losses (7) (18) (468) - (493)
Disposals and transfers 25 1,933 1,355 - 3,313
Foreign exchange differences 13 80 9 - 102
Balance as at 31 December 2011 (13,151) (51,503) (41,035) - (105,689)
Carrying amount as at 31 December 2011 18,396 10,142 5,376 12,351 46,265

notes to the ConsolidAted finAnCiAl stAtements 2011
145Annual Report 2011
Land and buildings
Technical equipment and
machineryTooling, office and
other equipment
Payments on account and assets under construction Total
Costs
Balance as at 1 January 2010 29,836 61,186 45,633 3,546 140,201
Additions 190 876 1,456 5,871 8,393
Disposals (45) (3,685) (1,710) - (5,440)
Transfers 229 907 809 (1,949) (4)
Foreign exchange differences 33 54 - - 87
Balance as at 31 December 2010 30,243 59,338 46,188 7,468 143,237
Cumulative depreciation and impairment losses
Balance as at 1 January 2010 (10,627) (50,027) (35,676) - (96,330)
Amortisation (1,096) (3,418) (3,916) - (8,430)
Impairment losses (358) (544) (549) - (1,451)
Disposals and transfers 21 3,661 1,683 - 5,365
Foreign exchange differences (3) (35) 6 - (32)
Balance as at 31 December 2010 (12,063) (50,363) (38,452) - (100,878)
Carrying amount as at 31 December 2010 18,180 8,975 7,736 7,468 42,359
DepreciationandimpairmentlossesofthebuildingsandequipmentofCZK7,518million(2010:CZK9,275million)areincludedinthecostofsales,CZK180million(2010:CZK155million)indistributionexpenses,andCZK528million(2010:CZK451million)inadministrativeexpenses.
Impairment reviewsTherequirementsofIAS1,IAS10andIAS36havebeenassessedbytheGroup’smanagementinrelationtothedecreaseinplannedcashinflowsregardingparticularŠKODAmodelsanditspotentialimpactonthecarryingamountoftheGroup‘snon-currenttangibleassets.Duetosubstantialchangesinthemarketen-vironment,theGrouphasexperiencedin2011asignificantdecreaseintheplannedcashinflowsrelatingtothreecash-generatingunits(productionofcarsofcertainmodels).Impairmentreviewsofassetsrelatingtothosecash-generatingunitshavebeenperformed.Thecarryingamountsoftheassetsrelatingtothecash-generatingunitshavebeencomparedwiththerelevantrecoverableamounts.Therecoverableamountshavebeendeterminedbasedonthecalculationofthevalueinuseapplyingcashflowprojectionsoverthelifecycleofthecash–generatingunitsreflectingfinancialplans,approvedbytheGroup’smanagement.Fordiscountingcashflows,thediscountrateof6.8%or7.3%in2011(2010:6.4%or7.1%)hasbeenapplieddependingoncharacteristicsof individual cash-generatingunits. Thediscount rates reflect thespecificrisksassociatedwiththesectorinwhichtheGroupoperates.Foronecash-generatingunit,thecomparisonofthecarryingamountswiththerelevantrecoverableamountsresultedinanimpairmentlossallocatedtotangibleassetsinthetotalamountofCZK493million(2010:CZK1,451million),whichhasbeenpostedtotheincomestatement(withinlineCostofsales)fortheyearended31December2011(31December2010).
Capitalisation of borrowing costs Forthecapitalisationofborrowingcosts in2011,theGroupappliedthecapitalisationrateof4.5%(2010:3.8%).Noborrowingcostshavebeencapitalisedinthecostofproperty,plantandequipmentin2011orin2010astheywerenotsignificant.

notes to the ConsolidAted finAnCiAl stAtements 2011
146 Annual Report 2011
7. Investments in associates (CZK million)
2011 2010
Total Assets 52,911 45,480
Total Liabilities 49,623 43,728
Total Revenue 121,296 74,165
Profit (+)/ Loss (-) (aggregated) 1,600 (1,743)
The table above summarises financial data of the associatesOOOVOLKSWAGENGroupRus and ŠKO-ENERGOFIN,s.r.o.TheCompany’sshareintheregisteredcapitalofthecompanyOOOVOLKSWAGENGroupRusasat31De-cember2011was16.8%(31December2010:16.8%).TheCompany’sshareofprofitsorlossesofthisassociateasat31December2011was17.91%(31December2010:17.91%).TheCompanyexercisessignificant influ-enceinthecompanyOOOVOLKSWAGENGroupRusbasedonthefollowingfactors:theCompanyhasitsrepresentativesinthegoverningbody;theCompanyisparticipatinginpolicy-makingprocesses,includingparticipation indecisionsaboutdistributionofprofit;materialtransactionsareconductedbetweenbothcompanies;aninterchangeofmanagerialpersonneltakesplacesbetweenbothcompaniesandtheCom-panyisprovidingessentialtechnicalinformationtothecompanyOOOVOLKSWAGENGroupRus.Asat1October2010,theCompanyacquiredadditionalshareintheregisteredcapitalofŠKO-ENERGOFIN,s.r.o.from10%to31.25%andasaresultŠKO-ENERGOFINs.r.o.becametheCompany’sassociate.ThevalueoftheCompany’ssharetotalledCZK529millionasat31December2011(asat31December2010:CZK529million).ŠKO-ENERGOFINpaiddividendstotheCompanyintheamountofCZK104million(2010:CZK71million).
Impairment reviews TherequirementsoftheIAS1,IAS10andIAS36standardswereassessedbytheGroup’smanagementinrelationtothedevelopmentoftheautomotiveindustryandplannedvolumesofsoldcarsandthepotentialimpactsonthecarryingamountoftheGroup’sfinancial investments inassociates.Basedonperformedanalyses,nofactorshavebeenidentifiedwhichwouldindicateaneedtorecogniseimpairmentlosseswithanexceptionoffutureeconomicbenefitsarisingfrominvestment inOOOVOLKSWAGENGroupRus,as-sociateaccountedforusingtheequityaccounting.TheGroup’smanagementhasthereforeperformedanimpairmentreviewofthiscash-generatingunit.Carryingvalueofthefinancialinvestmentintheassociatehasbeencomparedwiththerelevantrecoverableamount.Therecoverableamounthasbeendeterminedbasedonthecalculationofthevalueinuseapplyingcashflowprojectionsoverthefollowingfiveyears,reflectingfinancialplansapprovedbytheGroup’smanagement.Cashflowsbeyondthefiveyearsperiodhavebeenextrapolatedwithestimatedgrowthratewhichisnothigherthanexpectedlong-termaveragegrowthrateintheautomotiveindustry.Theapplieddiscountrateispost-taxandreflectsspecificrisksas-sociatedwiththesectorandtheregioninwhichthereviewedcompanyoperates.In2011,discountrateof9.5%(2010:9.3%)hasbeenapplied.Thecomparisonofthecarryingamountswiththerelevantrecoverableamounthasnotgivenrisetoanyimpairmentlossasat31December2011or31December2010.

notes to the ConsolidAted finAnCiAl stAtements 2011
147Annual Report 2011
8. Other non-current and current receivables, financial assets and trade receivables (CZK million)
Balance as at 31 December 2011 Financial assets at fair
value through profit or
loss**Loans and
receivables
Available for sale
financial assets
Financial assets
designated as hedging
instruments Other* Total
Other receivables and financial assets
Loans to employees - 542 - - - 542
Deposits in companies within Volkswagen Group - 21,540 - - - 21,540
Positive fair value of financial derivatives (242) - - 2,093 - 1,851
Available for sale financial assets - - 4 - - 4
Tax receivables (excl. income tax) - - - - 4,405 4,405
Others - 457 - - 436 893
Total (242) 22,539 4 2,093 4,841 29,235
Trade receivables
Third parties - 4,733 - - - 4,733
Related parties - 8,690 - - - 8,690
Total - 13,423 - - - 13,423
* The category Other does not meet a definition of financial instruments in terms of IAS 32.** Financial assets held-for-trading.
Note:The line Positive fair value of financial derivatives in the portfolio Financial assets designated as hedging instruments is represented by the spot component of financial derivatives and in the portfolio Financial assets at fair value through profit and loss it is represented by the forward component of financial derivatives (see also Note 2.7.3). As the spot component exceeded the fair value as at 31 December 2011, the forward component was negative.

notes to the ConsolidAted finAnCiAl stAtements 2011
148 Annual Report 2011
Balance as at 31 December 2010 Financial assets at fair
value through profit or
loss**Loans and
receivables
Available for sale
financial assets
Financial assets
designated as hedging
instruments Other* Total
Other receivables and financial assets
Loans to employees - 491 - - - 491
Deposits in companies within Volkswagen Group - 10,016 - - - 10,016
Positive fair value of financial derivatives (191) - - 2,767 - 2,576
Available for sale financial assets - - 4 - - 4
Tax receivables (excl. income tax) - - - - 3,395 3,395
Others - 117 - - 309 426
Total (191) 10,624 4 2,767 3,704 16,908
Trade receivables
Third parties - 3,863 - - - 3,863
Related parties - 7,165 - - - 7,165
Total - 11,028 - - - 11,028
* The category Other does not meet a definition of financial instruments in terms of IAS 32.** Financial assets held-for-trading.
Note:The line Positive fair value of financial derivatives in the portfolio Financial assets designated as hedging instruments is represented by the spot component of financial derivatives and in the portfolio Financial assets at fair value through profit and loss it is represented by the forward component of financial derivatives (see also Note 2.7.3). As the spot component exceeded the fair value as at 31 December 2011, the forward component was negative.
Thecarryingamountofloanstoemployeesapproximatestheirfairvalue.Thecarryingamountnetofimpairmentforeachclassoffinancialassetswhicharenotcarriedatfairvalueapproximatestheirfairvalueduetotheshort-termnatureoftheseitems.TheitemDepositsincompanieswithinVolkswagenGroupcomprisesdepositsintheamountofCZK21,540millionwithoriginalmaturityfromthreemonthstooneyear(asat31December2010:CZK10,016million)TheweightedaverageeffectiveinterestratebasedonthecarryingamountofdepositsprovidedtoVolkswagenGroupcompaniesasat31December2011was0.88%(31December2010:1.03%).AlldepositsprovidedtoVolkswagenGroupcompanieswithoriginalmaturityfromthreemonthstooneyeararedenominatedinCZKasat31December2011(asat31December2010).LineOthersinotherreceivablesandfinancialassetsincludemainlyotherreceivablesfromemployeesandadvancespaid.Therearenosignificantrestrictionsregardingtherightsofuseimposedontheotherre-ceivablesandfinancialassets.Cumulativeimpairmentlossesreflecttheincurredrisksofthedebtors’delaysordefaults.TheallowancefortheimpairmentoftradereceivablesofCZK365million(2010:CZK383million)hasbeendeductedfrompresentedcarryingvaluesof tradereceivables.Thecarryingamountof tradereceivablesapproximatesthefairvalueatthebalancesheetdateafterthevaluationallowanceistakenintoaccount.

notes to the ConsolidAted finAnCiAl stAtements 2011
149Annual Report 2011
9. Inventories (CZK million)
Carrying value as at 31 December 2011
Carrying value as at 31 December 2010
Structure of the inventories
Raw materials, consumables and supplies 4,818 4,285
Work in progress 2,368 1,738
Finished products and goods 8,875 8,385
Total 16,061 14,408
Theamountofinventoriesrecognisedasanexpenseduring2011wasCZK208,208million(2010:CZK184,858million).
10. Cash and cash equivalents (CZK million)
2011 2010
Cash in hand 4 3
Cash pooling 723 4,795
Bank accounts 2,976 5,526
Cash equivalents 27,548 25,662
Total 31,251 35,986
The lineCashpooling includesalsoovernightdepositsfromtheuseofcashpooling (Note3.2).The linecashequivalentsincludesdepositsinVolkswagenGroupcompanieswithoriginalmaturitylessthanthreemonths.ThesedepositsareincludedintheportfolioLoansandreceivablesintermsofIAS39.Theweighted averageeffective interest rate basedon the carrying amount of bank accounts as at 31December2011was1.91%(asat31December2010:0.20%).TheweightedaverageeffectiveinterestratebasedonthecarryingamountofdepositsinVolkswagenGroupcompanieswithoriginalmaturitylessthanthreemonthsasat31December2011was0.93%(asat31December2010:1.31%).OutofthetotalamountofdepositsprovidedtoVolkswagenGroupcompanieswithoriginalmaturitylessthanthreemonthsofCZK27,548million(asat31December2010:CZK25,662million)thereweredepositsdenominatedinCZKintheamountofCZK23,309million(asat31December2010:CZK24,362million),inEURintheamountofCZK3,484million(asat31December2010:CZK0million)anddepositsdenominatedinINRintheamountofCZK775million(asat31December2010:CZK1,300million).
11. Share capitalTheissuedsharecapitalconsistsof1,670,885ordinarysharesataparvalueofCZK10,000pershare.TheCompany’ssoleshareholderVolkswagenInternationalFinanceN.V.,Amsterdam,TheKingdomoftheNeth-erlands,holds 100%of theshares in theCompany.Volkswagen InternationalFinanceN.V. is indirectlya100%subsidiaryofVOLKSWAGENAG.TherewasnomovementintheGroup’ssharecapitalduringtheaccountingperiod2011(2010).TheCompanypaidadividendofCZK4,702millionin2011(2010:CZK1,634million).ThedividendpersharewasCZK2,814in2011(2010:CZK978).

notes to the ConsolidAted finAnCiAl stAtements 2011
150 Annual Report 2011
12. Reserves (CZK million)
2011 2010
Currency translation reserve (347) (414)
Reserves for cash flow hedges* (4,546) 377
Retained earnings 64,301 52,968
Statutory reserve fund 3,366 3,366
Funds contributed by owner 10 10
Total 62,784 56,307
* Net of deferred tax from financial derivatives.
Thestatutoryreservefundmaybeusedonlytooffsetlosses.Accordingtorelevantregulationsofthecom-mercialcodeoftheCzechRepublic,theCompanyisrequiredtotransfer5%ofitsannualnetprofittothestatutoryreservefunduntilthebalanceofthisreservereaches20%ofthesubscribedcapital.Incompliancewiththerelevantregulationsofthecommercialcode,theunconsolidatedprofitoftheCom-panyfortheyear2011(determinedinaccordancewithIFRS)isgoingtobeappropriatedbasedonthedeci-sionoftheCompany’sannualgeneralmeeting.Movementinreserveforcashflowhedges:
Balance as at 1 January 2011 (CZK million) 377
Total change in fair value in the period (4,540)
Deferred tax on change in fair value 875
Total transfers to net profit in the period - effective hedging (1,546)
Total transfers to net profit in the period - ineffective hedging 8
Deferred tax on transfers to net profit 280
Balance as at 31 December 2011 (4,546)
Balance as at 1 January 2010 (CZK million) 922
Total change in fair value in the period (813)
Deferred tax on change in fair value 130
Total transfers to net profit in the period - effective hedging 188
Total transfers to net profit in the period - ineffective hedging (61)
Deferred tax on transfers to net profit 11
Balance as at 31 December 2010 377
Thetransferfromreservesforcashflowhedgestoprofitandlossarisingfromeffectivehedgingisin2011presentedinthelineOtheroperatingexpenseinamountofCZK1,076million(2010:CZK1,283million, in2010thisamountincludedalsoeffectivehedginglossofCZK59milliondisclosedinfinancialresult)andinthelineOtheroperatingincomeinamountofCZK2,623million(2010:CZK1,095million).

notes to the ConsolidAted finAnCiAl stAtements 2011
151Annual Report 2011
13. Financial, other and trade liabilities (CZK million)
Balance as at 31 December 2011 Financial liabilities at fair
value through profit or loss**
Financial liabilities carried at
amortised costs
Financial liabili-ties designated
as hedging instruments Other* Total
Financial liabilities
Loans - 3,141 - - 3,141
Total - 3,141 - - 3,141
Other liabilities
Negative fair value of financial derivatives (742) - 7,672 - 6,930
Other tax liabilities (excl. income tax) - 2,079 - 1,786 3,865
Liabilities to employees - - - 1,731 1,731
Social security - - - 433 433
Others - - - 616 616
Total (742) 2,079 7,672 4,566 13,575
Trade liabilities to
Third parties - 19,010 - 247 19,257
Related parties - 10,795 - 53 10,848
Total - 29,805 - 300 30,105
* The category Other includes items that are not financial liabilities in terms of IAS 32.** Financial liabilities held for trading.
Note:The line Negative fair value of financial derivatives in the portfolio Financial liabilities designated as hedging instruments is represented by the spot component of financial derivatives and in the portfolio Financial liabilities at fair value through profit or loss it is represented by the forward component of financial derivatives (see also Note 2.7.3). As the spot component exceeded the fair value as at 31 December 2011, the forward component is negative.

notes to the ConsolidAted finAnCiAl stAtements 2011
152 Annual Report 2011
Balance as at 31 December 2010 Financial liabilities at fair
value through profit or loss**
Financial liabilities carried at
amortised costs
Financial liabili-ties designated
as hedging instruments Other* Total
Financial liabilities
Loans - 3,228 - - 3,228
Total - 3,228 - - 3,228
Other liabilities
Negative fair value of financial derivatives 26 - 2,318 - 2,344
Other tax liabilities (excl. income tax) - 1,319 - 1,571 2,890
Liabilities to employees - - - 2,224 2,224
Social security - - - 393 393
Others - - - 295 295
Total 26 1,319 2,318 4,483 8,146
Trade liabilities to
Third parties - 18,218 - 409 18,627
Related parties - 9,211 - 59 9,270
Total - 27,429 - 468 27,897
* The category Other includes items that are not financial liabilities in terms of IAS 32.** Financial liabilities held for trading.
Note:The line Negative fair value of financial derivatives in the portfolio Financial liabilities designated as hedging instruments is represented by the spot component of financial derivatives and in the portfolio Financial liabilities at fair value through profit and loss it is represented by the forward component of financial derivatives (see also Note 2.7.3).
ThelineTradeliabilitiestorelatedpartiesincludesliabilitiestoafactoringcompanywithintheVolkswagenGroupofCZK2,302millionasat31December2011(2010:2,563million).TheseliabilitiesaroseintheordinarycourseofbusinessanddonotrepresentfinancingoftheGroup.Thedetailed informationrelatingtothe liabilitiesarisingoutoffinancialderivativescanbefoundunderNote3.3.4.Thecarryingvalueforotherclassesoffinancialliabilities(otherliabilities,tradepayablesandloans)approxi-matesthefairvalueinallmaterialrespects.Noneofthefinancialliabilitiesaresecuredbyalien.

notes to the ConsolidAted finAnCiAl stAtements 2011
153Annual Report 2011
In the tablebelow, thefinancial conditionsattached to loans receivedaresummarisedat their carryingamounts:
Carrying amount as at 31 December 2011 Weighted average
effective interest
rate based on nominal
amount
Maturity
Currency
Interest terms
Interest commitment
endingNominal amount < 1 year 1-5 years > 5 years Total
CZK fixed 1-5 years 4.53% 3,000 107 3,000 - 3,107
INR fixed < 1 year 10.50% 34 34 - - 34
Total financial liabilities 3,034 141 3,000 - 3,141
Carrying amount as at 31 December 2010 Weighted average
effective interest
rate based on nominal
amount
Maturity
Currency
Interest terms
Interest commitment
endingNominal amount < 1 year 1-5 years > 5 years Total
CZK fixed 1-5 years 4.53% 3,000 107 3,000 - 3,107
EUR floating < 1 year - 121 121 - - 121
Total financial liabilities 3,121 228 3,000 - 3 ,228

notes to the ConsolidAted finAnCiAl stAtements 2011
154 Annual Report 2011
14. Deferred tax liabilities and assets (CZK million)Deferredincometaxassetsandliabilitiesareoffsetwhenthereisalegallyenforceablerighttooffsetthecurrenttaxassetsagainstcurrenttaxliabilities,andwhenthedeferredincometaxesrelatetothesamefiscalauthority.Asat31December2011theGrouprecognisedonthebalancesheetdeferredtaxassetofCZK2,668million(asat31December2010:CZK1,327million).Themovementsindeferredtaxassetsandliabilitiesduringtheyear,withouttakingintoconsiderationtheoffsetting,areasfollows:
DepreciationFinancial
derivatives* ProvisionsConsolidation
differences Other Total
Deferred tax liabilities
Balance as at 1 January 2010 (3,174) (227) - - - (3,401)
Credited/(debited) to the income statement 593 - - - - 593
Charged to other comprehensive income - 141 - - - 141
Exchange differences (1) - - - - (1)
Balance as at 31 December 2010 (2,582) (86) - - - (2,668)
Credited/(debited) to the income statement 86 - - - - 86
Charged to other comprehensive income - 86 - - - 86
Exchange differences (1) - - - - (1)
Balance as at 31 December 2011 (2,497) - - - - (2,497)
DepreciationFinancial
derivatives* ProvisionsConsolidation
differences Other Total
Deferred tax assets
Balance as at 1 January 2010 - - 2,498 46 503 3,047
Credited/(debited) to the income statement - - 728 108 135 971
Exchange differences - - (29) 6 (23)
Balance as at 31 December 2010 - - 3,197 154 644 3,995
Credited/(debited) to the income statement - - 237 (122) 1 116
Charged to other comprehensive income - 1,069 - - - 1,069
Exchange differences - - 57 - (72) (15)
Balance as at 31 December 2011 - 1,069 3,491 32 573 5,165
*Further information on financial derivatives is disclosed in Note 2.7.3.
FurthertheGroupdidnotrecogniseddeferredtaxasset(fromtaxlosses)intheamountofCZK329million,becauseitsutilisationisnotexpected.Asat31December2010,theunrecogniseddeferredtaxassetwasCZK87million.

notes to the ConsolidAted finAnCiAl stAtements 2011
155Annual Report 2011
15. Non-current and current provisions (CZK million)
Provisions for
warranty claims
Provisions for other
obligations arising
from sales
Provisions for
personnel costs
Provisions for the
disposal of end-of-life
vehicles
Provisions for
litigation risks
Provisions for
purchase risks
Other provisions Total
Balance as at 1 January 2010 10,284 3,092 1,306 756 1,183 284 107 17,012
Utilised (3,369) (2,435) (467) - (1) (159) (84) (6,515)
Additions 4,599 3,099 804 323 413 760 1,267 11,265
Interest expense (+)/income (-) 75 - - (42) - - - 33
Reversals (542) (518) (22) (94) (2) (101) (2) (1,281)
Foreign exchange differences (97) (110) (3) (33) - - 17 (226)
Balance as at 1 January 2011 10,950 3,128 1,618 910 1,593 784 1,305 20,288
Utilised (3,546) (2,469) (438) - (1) (161) (570) (7,185)
Additions 5,071 3,792 1,746 81 76 719 1,314 12,799
Interest expense (+)/income (-) 83 (19) - 80 - - - 144
Reversals (149) (336) (191) (272) (176) (611) (148) (1,883)
Foreign exchange differences 53 101 - 24 - - (33) 145
Balance as at 31 December 2011 12,462 4,197 2,735 823 1,492 731 1,868 24,308
Non-currentandcurrentprovisionsaccordingtothetimeofexpecteduseofresources:
< 1 year 1-5 years > 5 years Total
Balance as at 31 December 2011
Provisions for warranty claims 3,830 7,667 965 12,462
Provisions for other obligations arising from sales 3,816 381 - 4,197
Provisions for personnel costs 1,723 328 684 2,735
Provisions for the disposal of end-of-life vehicles - - 823 823
Provisions for litigation risks 1,492 - - 1,492
Provisions for purchase risks 731 - - 731
Other provisions 1,686 182 - 1,868
Total 13,278 8,558 2,472 24,308

notes to the ConsolidAted finAnCiAl stAtements 2011
156 Annual Report 2011
< 1 year 1-5 years > 5 years Total
Balance as at 31 December 2010
Provisions for warranty claims 3,797 6,451 702 10,950
Provisions for other obligations arising from sales 3,128 - - 3,128
Provisions for personnel costs 696 314 608 1,618
Provisions for the disposal of end-of-life vehicles 9 - 901 910
Provisions for litigation risks 1,593 - - 1,593
Provisions for purchase risks 784 - - 784
Other provisions 1,181 124 - 1,305
Total 11,188 6,889 2,211 20,288
Theprovisionforwarrantyrepairsincludesprovisionforbasicguarantees(2years),provisionforcorrosionguarantees(dependentonthemodelfor10or12years)andotherguaranteesbeyondthescopeofbasicwarranty(twoyears)especiallygood-willrepairs(the3rdand4thyear).TheGrouprecognisestheprovisionforwarrantyclaimsatthemomentofsaleonthebasisofthenumberofsoldcarsandinadvancedeter-minedratesforindividualmodelline.Provisionsforotherobligationsarisingfromsales includeprovisionforsalediscounts,salebonusesandsimilarallowancesincurred,settlementofwhichisexpectedafterthebalancesheetdate,butforwhichthereisalegalorconstructiveobligationattributabletosalesrevenuebeforethebalancesheetdate.Theadditionstoprovisionforotherobligationsarisingfromsalesaredecreasingtherevenues.Provisionsforpersonnelcostsincludemainlyprovisionsforotherlong-termemployeebenefits,severancepaymentsandprovisionformanagementpersonnelremuneration.Provisionsfordisposalofend-of-lifevehiclesrelatetocostsofliquidationofend-of-lifevehiclesaccordingtoEUdirectiveno.2000/53/ECandaredeterminedmainlyonthebasisofregisteredcarsinthecountryof the individual companies,official statistics,expectedcostsof thecarsecological scrappingand legalrequirementsvalidinindividualcountries.Provisionsforlitigationrisksrelatemainlytoprovisionforriskslegalfees,penaltyinterestandotherrisksarisingfromlegalproceedings.TheGroupprovidesfortheprobablecashoutflowsforexisting legalandarbitrationproceedingsbymeansofarelevantprovision.TheGroupisnotinvolvedinanylegalcasesorarbitrationproceedingsforwhichnoprovisionhasbeencre-atedandwhichcouldhaveasignificantimpactonthefinancialpositionandthefinancialresults(financialstatements)oftheGroupandtherearenosuchproceedingsexpectedinthenearfuture.Provisions forpurchase risks includemainlyprovision for risksof retrospectivechanges inpricesof rawmaterialsandparts.OtherprovisionsincludemainlyprovisionfortaxandcustomsrisksincountrieswheretheGroupoperates.

notes to the ConsolidAted finAnCiAl stAtements 2011
157Annual Report 2011
16. Cash flow statementThecashandcashequivalentscontainedinthecashflowstatementalsocomprise,inadditiontocashandshort-termdeposits, short-termdeposits inVolkswagenGroupcompanieswithoriginalmaturityof lessthanthreemonths.ThedetailedinformationrelatingtothecashandcashequivalentscanbefoundunderNote10.Cashflowsarepresentedinthecashflowstatementandareclassifiedintocashflowsfromoperatingacti-vities,investingactivitiesandfinancingactivities.Cashflowsfromoperatingactivitiesarederivedindirectlyfromprofitbeforetax.Profitbeforetaxisadjustedtoeliminatenon-cashexpenses(mainlydepreciationandamortisation)andincomeandchangesinworkingcapital.Investingactivitiesincludeadditionstoproperty,plantandequipment,financialassets,aswellastocapi-taliseddevelopmentcost. Financingactivities include inaddition to theoutflowsof cash fromdividendpayments,redemptionofbondsandliabilitiesfromotherfinancing,alsooutflowsandinflowsfromotherborrowings.
17. Sales (CZK million)
2011 2010
Cars 212,787 184,648
Spare parts and accessories 17,930 17,248
Supplies of components within Volkswagen Group 15,363 13,659
Revenues from license fees 1,223 702
Services related to sales 180 150
Other 5,079 3,047
Total 252,562 219,454
Othersalesrelatemainlytosalesofresultsoftechnicaldevelopment,scrap,toolingandusedcars.
18. Other operating income (CZK million)
2011 2010
Foreign exchange gains 2,627 2,753
Income from derivative transactions 2,219 1,171
Gains on non-current assets disposal 10 1
Reversal of provisions and accruals 2,868 1,684
Reversal of provision for receivables 53 138
Services - others 339 497
Other 1,924 1,612
Total 10,040 7,856
Foreignexchangegainsincludemainlygainsfromdifferencesinexchangeratesbetweenthedatesofre-cognitionandpaymentofreceivablesandpayablesdenominatedinforeigncurrencies,aswellasexchange

notes to the ConsolidAted finAnCiAl stAtements 2011
158 Annual Report 2011
rategainsresultingfromrevaluationasatthebalancesheetdateofthesereceivablesandpayables.Foreignexchangelossesfromtheseitemsareincludedinotheroperatingexpenses.Reversalofprovisionsandaccrualsresultedfromchangesinestimatesdrivenmainlybythechangedexter-nalconditionsandcircumstancesonwhichtheGroupbasedtheestimates.
19. Other operating expenses (CZK million)
2011 2010
Foreign exchange losses 2,728 1,998
Losses from derivative transactions 1,078 1336
Receivables write-offs 12 7
Other 899 2654
Total 4,717 5,995
20. Financial result (CZK million)
2011 2010
Interest income 708 537
Foreign exchange gains from cash 45 82
Foreign exchange gains from spot operations 337 208
Dividends received 125 72
Other financial income, thereof: 1,542 213
Total transfers to net profit in the period - ineffective hedging - 61
Forward component of derivatives fair value 1,542 131
Financial income total 2,757 1,112
Interest expenses, thereof: 761 577
Total transfers to net profit in the period - effective hedging - 59
Foreign exchange losses from cash 49 293
Foreign exchange losses from spot operations 378 158
Other financial expenses, thereof: 778 466
Forward component of derivatives fair value 760 442
Financial expenses total 1,966 1,494
Net financial result 791 (382)

notes to the ConsolidAted finAnCiAl stAtements 2011
159Annual Report 2011
21. Net gains and losses from financial instruments (CZK million)
2011 2010
Financial instruments at fair value through profit and loss 783 (262)
Loans and receivables 760 185
Available for sale financial assets 21 -
Financial liabilities carried at amortised costs (792) 554
Financial instruments designated as hedging instruments 1,546 (188)
Net gains total 2,318 289
ThelineFinancialinstrumentsatfairvaluethroughprofitandlossrepresentsaforwardcomponentofcur-rencyforwardsandineffectivepartofcommodityswaps.Otheritemscontainmainlyunrealisedandrealisedforeignexchangegainsandlossesontradereceivablesand liabilities, fromhedging instruments, interest income fromdepositsprovided,net interest loss fromderivativehedginginstruments,foreignexchangegains/lossesfrombankdepositsandimpairmentlossesonfinancialassets.
22. Income tax (CZK million)
2011 2010
Current tax expense - domestic 3,127 2,792
Current tax expense - foreign 275 519
Current tax expense - total 3,402 3,311
Deferred tax income - domestic (139) (1,089)
Deferred tax income - foreign (63) (475)
Deferred tax income - total (202) (1,564)
Income tax total 3,200 1,747
StatutoryincometaxrateintheCzechRepublicforthe2011assessmentperiodwas19%(2010:19%).Asat31December2011and31December2010,deferredincometaxesattributabletotheCzechtaxjuris-dictionweremeasuredatataxrateof19%thatcorrespondswiththestatutorytaxratesenactedforthefutureperiodswhenrealisationofdeferredtaxassetsandliabilitiesisexpected.ThelocalincometaxratesappliedforcompaniesoutsidetheCzechRepublicvarybetween19%and32.45%.

notes to the ConsolidAted finAnCiAl stAtements 2011
160 Annual Report 2011
Reconciliation of expected to effective income tax expense (Czk million)
2011 2010
Profit before income tax 19,275 10,586
Expected income tax expense 3,662 2,011
Effect of different tax rates outside the Czech Republic 93 204
Proportion of taxation relating to:
Permanent differences resulting from:
Tax exempt income (133) (189)
Expenses not deductible for tax purposes 214 193
Tax allowances and other tax credits (659) (318)
Prior-period current tax expense (114) (151)
Investment tax credits 110 (50)
Other taxation effects 27 47
Effective income tax expense 3,200 1,747
Effective income tax rate 17% 17%
LineTaxallowancesandothertaxcreditsrepresentsmainlytaxcreditsfromdoubledeductionofresearchanddevelopmentcosts.
23. Subsidies and investment incentivesSubsidiesIn2011,theGroupreceivedagrantforsupportoftheprojectperformedbytheDevelopmentandTechnol-ogyCentreofCZK19million(2010:CZK42million)andagrantforsupportofprivateschoolsofCZK45million(2010:CZK50million).In2010, theGroupwasprovidedwithapromiseofthegrantfromtheEuropeanRegionalDevelopmentFundbytheMinistryofIndustryandTradeintheCzechRepublicforthefollowingprojects:“CombinedPro-ductionofHeatandElectricityintheKvasinyPlant“,intheamountofCZK27millionand“ServiceTrainingCenter”intheamountofCZK67million.Bothprojectsareintheexecutionphase.Thegrantonlyfortheproject“ServiceTrainingCenter”waspartiallypaidoutin2011inamountofCZK2million(2010:CZK0million).Theremainingpartofgrantfortheproject“ServiceTrainingCenter”andtheproject“CombinedProductionofHeatandElectricityintheKvasinyPlant“willbepaidoutretrospectivelyoncompletionofindividualexe-cutionphases.Inaddition,theGroupwasprovidedwithapromiseofthegrantfromtheEuropeanRegionalDevelopmentFundbytheMinistryof IndustryandTrade intheCzechRepublic in2011 forthefollowingprojects: “ExtensionofDevelopmentCapacitiesŠKODAAUTOa.s.“ in theamountofCZK88million.Theprojectisintheexecutionphase,however,thegrantwasnotpaidoutin2011.(Thegrantwillbepaidoutretrospectivelyoncompletionofindividualexecutionphases).
Investment incentivesTobegrantedtheinvestmentincentives,theGrouphastomeettheGeneralconditionsof§2art.2oftheActNo.72/2000Coll.,onInvestmentIncentives,asamendedandSpecialconditions§35boftheActNo.586/1992Coll.,onIncomeTaxasamended.
EA211 InaccordancewiththeActNo.72/2000Coll.,onInvestmentIncentivesasamendedbasedonresolutiondatedon2August2011theGroupwasprovidedwithapromiseoftheinvestmentincentiveIPNo.49/2011foritsprojectrelatedtoproductionofpartsofengineEA211andassemblyoftheengineintheplantinMladáBoleslavinformoftaxcredit.ThetotalamountofthesubsidyislimitedtotheamountofCZK800million

notes to the ConsolidAted finAnCiAl stAtements 2011
161Annual Report 2011
whichcorrespondsto40%ofthetotaleligibleinvestedcostsrelatedtotheinvestmentproject.In2011,theprojectwasrealised,however,asat31December2011utilisationofinvestmentincentivewasregardedasuncertainbytheGroupandthereforenorelateddeferredtaxassetwasrecognised.
MQ 100InaccordancewiththeActNo.72/2000Coll.,onInvestmentIncentivesasamendedbasedonresolutiondatedon2August2011theGroupwasprovidedwithapromiseoftheinvestmentincentiveIPNo.50/2011foritsprojectrelatedtoproductionexpansionoftransmissionsintheplantinMladáBoleslavinformoftaxcredit.ThetotalamountofthesubsidyislimitedtotheamountofCZK496millionwhichcorrespondsto40%ofthetotaleligibleinvestedcostsrelatedtotheinvestmentproject.In2011,theprojectwasrealisedandtheGroupexpectsutilisationof investmentincentiveandrecogniseddeferredtaxassetofCZK335millionbasedoneligiblecostsinvested.
A-SUVInaccordancewiththeActNo.72/2000Coll.,onInvestmentIncentivesasamendedbasedonresolutiondatedon4August2008theGroupwasgrantedaninvestmentincentiveforproductionoftheSUVmodelintheplantKvasinyinformoftaxcredit.ThetotalamountofthesubsidyislimitedtotheamountofCZK561millionwhichcorrespondsto40%ofthetotaleligibleinvestedcostsrelatedtotheinvestmentproject.Theprojectwascompletedin2010,howeverasat31December2011utilisationofinvestmentincentivewasregardedasuncertainbytheGroupandthereforenorelateddeferredtaxassetwasrecognised.In2011,theGroupwasalsograntedanincentiveintheformofdeferredsalestaxpayment.ThediscountedbalanceoftheliabilitydisclosedinNote13amountedtoCZK2,074million(2010:CZK1,319million).
24. Contingent liabilities Thetaxauthoritiesmayatanytimeinspecttheaccountingbooksandrecordswithintenyearssubsequenttothereportedtaxyear,andmayimposeadditionaltaxassessmentsandpenalties.TheGroupmanagement isnotawareofanycircumstancesthatcouldresult inmaterial liabilitiesarisingfromthetaxauditscarriedoutatpresentorpotentiallyinthefuture,exceptforthetaxrisksforwhichprovi-sionfortaxriskshasbeencreated(pleaserefertoNote15).
25. Contractual obligations and other future commitmentsFuturecommitmentsasatbalancesheetdateareasfollows:
CZK million Payable until year 2012 Payable 2013 – 2016 31 December 2011
Investment commitments - property, plant and equipment 10,926 1,328 12,254
Investment commitments - intangible assets 5,941 3,099 9,040
Operating leasing instalments 184 584 768
Other future commitments - - -
CZK million Payable until year 2011 Payable 2012 – 2015 31 December 2010
Investment commitments - property, plant and equipment 1,729 1,236 2,965
Investment commitments - intangible assets 4,360 4,576 8,936
Operating leasing instalments 170 43 213
Other future commitments 100 75 175

notes to the ConsolidAted finAnCiAl stAtements 2011
162 Annual Report 2011
Onthebasisofnon-cancellableoperatingleaseagreements,theGroupisallowedtorentdifferentmachineandofficeequipmentandbuildings.Inthecaseofterminationoftheseagreementsalloutstandingleasepaymentsuptotheoriginalexpirationdateofthecontractmustbepaid.CategoryOtherfuturecommitmentscomprisesfuturecommitmentswhichareunusualtotheGroup,eitherbecauseoftheirnatureortheirsizeordurationandisrepresentedmainlybysignificantadvertisingandsponsoringcontractsconcludedforaperiodlongerthanoneyear.Inordertoincreaseaccuracyofpresentationofcontractualobligations,figuresforcomparativeperiod2010havebeenchangedinlineInvestmentcommitments–intangibleassets,amountincolumnPayableuntilyear2011ofCZK2,510millionhavebeenincreasedbyCZK1,850milliontoCZK4,360millionandamountincolumnPayable2012–2015ofCZK2,174millionhavebeenincreasedbyCZK2,402milliontoCZK4,576million.Disclosedamountofcontractualobligations2010inthelineInvestmentcommitments–intangibleassetshavebeenincreasedintotalbyCZK4,252million.
26. Expenses by nature – additional information (CZK million)
2011 2010
Material costs - raw materials and other supplies, goods 169,932 148,720
Production related services 14,843 12,387
Personnel costs 18,044 16,031
Wages 13,781 12,128
Pension benefit costs (defined contribution plans) 2,507 2,226
Social insurance and other personnel costs 1,756 1,677
Depreciation, amortisation and impairment losses 12,746 14,820
Other services 24,063 18,041
Total cost of sales, distribution and administrative expenses 239,628 209,999
Number of employees
Number of employees* 27,936 26,529
* Average number of employees (including temporary employees).
27. Related party transactionsThecompanyVOLKSWAGENAGhasbeentheultimateparentcompanyandtheultimatecontrollingpartyoftheCompanyfortheentirecurrentaccountingperiod.ItemsincategoryOtherrelatedpartiesdonotmeetthedefinitionofanentitycontrolledbythesamecon-trollingentitypursuantto§66aoftheActNo.513/1991Coll.,CommercialCode,asamended.In2011,categoryOtherrelatedpartiesincludesmainlytransactionswithShanghaiVolkswagenAutomotiveCompanyLtd.andwiththecompaniesofthePorscheHoldingGmbHGroup,whicharenotfullyconsolidatedbytheultimateparentVOLKSWAGENAG,andtransactionswithcompaniesofthePorscheAutomobilHold-ingSEGroup.Theyaredisclosedwithinotherrelatedpartiesbasedonthefactthatthesecompaniesareonly jointventuresofVOLKSWAGENAG.TransactionswiththecompaniesofthePorscheHoldingGmbHGroup,whicharefullyconsolidatedsince1March2011byVOLKSWAGENAG,are includedinthecategoryCompaniescontrolledbyultimateparentcompanyin2011,inclusivethetransactions(revenuesofCZK2,494million,purchasesofCZK28million)forperiod1January-28February2011,whenthedefinitionofanentitycontrolledbythesamecontrollingentitypursuanttotheCommercialCodewasnotmet.

notes to the ConsolidAted finAnCiAl stAtements 2011
163Annual Report 2011
In2010,categoryOtherrelatedpartiesincludesmainlytransactionswithShanghaiVolkswagenAutomo-tiveCompanyLtd.andwithallcompaniesofthePorscheHoldingGmbHandPorscheAutomobilHoldingSEgroups.
The Group participated in the following transactions with related parties:
Sales to related parties (Czk million)
2011 2010
Parent company
Volkswagen International Finance N.V. - -
Ultimate parent company
VOLKSWAGEN AG 5,352 5,612
Associates
OOO VOLKSWAGEN Group Rus 16,462 10,828
Companies controlled by ultimate parent company 76,919 55,064
Other related parties 2,387 17,827
Total 101,120 89,331
TheabovetableSalestorelatedpartiescomprisesonlyrevenuesfromsalesofvehicles,sparepartsandsuppliesofvehiclecomponents.InadditiontorevenuesspecifiedinthetableSalestorelatedparties,in2011(2010)theGroupalsorealisedrevenuesfromroyalties:
2011 2010
Revenues from license fees
Ultimate parent company 112 -
Associates 72 33
Companies controlled by ultimate parent company - -
Other related parties 1,039 515
Total 1,223 548
InadditiontorevenuesspecifiedinthetableSalestorelatedparties,in2011(2010)theGroupalsorealisedrevenueswithrelatedpartiesrelatingtointerestfromintercompanydeposits:
2011 2010
Interest income from deposits
Ultimate parent company 8 11
Associates - -
Companies controlled by ultimate parent company 416 243
Other related parties - -
Total 424 254
DividendsreceivedfromassociatesaredisclosedinNote7.

notes to the ConsolidAted finAnCiAl stAtements 2011
164 Annual Report 2011
Purchases from related parties (Czk million)
2011 2010
Parent company
Volkswagen International Finance N.V. - -
Ultimate parent company
VOLKSWAGEN AG 35,029 28,914
Associates
OOO VOLKSWAGEN Group Rus 203 203
Companies controlled by ultimate parent company 38,348 33,314
Other related parties 76 410
Total 73,656 62,841
ThetablePurchasesfromrelatedpartiescomprisesonlypurchasesrelatingtotradeactivities.TheamountofdividendspaidtotheparentcompanyisdisclosedinNote11.
Receivables from related parties (Czk million)
31 December 2011 31 December 2010
Parent company
Volkswagen International Finance N.V. - -
Ultimate parent company
VOLKSWAGEN AG 325 352
Associates
OOO VOLKSWAGEN Group Rus 3,508 2,667
Companies controlled by ultimate parent company 3,710 3,420
Other related parties 1,147 726
Total 8,690 7,165
Theabovetablecomprisestradereceivablesandreceivablesfromroyalties.Receivablesfromroyaltiesarespecifiedbelow.
2011 2010
Receivables from royalties
Ultimate parent company - -
Associates 84 59
Companies controlled by ultimate parent company - -
Other related parties 519 465
Total 603 524

notes to the ConsolidAted finAnCiAl stAtements 2011
165Annual Report 2011
Inadditiontotradereceivablesandreceivablesfromroyalties,theGroupalsohaddepositsincompaniescontrolledbyultimateparentcompanyintotalamountofCZK49,037million(31December2010:CZK35,564million).Receivablesfrominterestfromthedepositsasat31December2011amountedtoCZK51million(31December2010:CZK78million).AverageinterestraterelatingtothesedepositsisdisclosedinNote8andNote10.ReceivablesfromrelatedpartiesareconsideredbytheGrouptobeoftheleastrisk.Theproductsdeliveredtotherelatedpartiesaresuppliedwiththepaymentonaduedate,securedbyanadvancepaymentortheyaretransferredtofactoringcompanies.Noimpairmentlosswasidentifiedforanyofthereceivablesfromrelatedparties.CashpoolingbalancewithVolkswagenGroupServicesS.A.isdisclosedinNote10.InvestmentsinassociatesaredisclosedinNote7.
Liabilities to related parties (Czk million)
31 December 2011 31 December 2010
Parent company
Volkswagen International Finance N.V. - -
Ultimate parent company
VOLKSWAGEN AG 1,886 1,086
Associates
OOO VOLKSWAGEN Group Rus 18 6
Companies controlled by ultimate parent company 8,884 8,106
Other related parties 60 72
Total 10,848 9,270
Liabilitiestorelatedpartiesrepresentonlytradeliabilitiesforallthecategoriesstatedabove.Inadditiontothetradeliabilitiesstatedinthetableabove,theGrouphadaliabilityfromaloanfromVOLKS-WAGENAGoftotalamountofCZK3,000millionasat31December2011(31December2010:CZK3,000mil-lion).InterestpayablerelatingtothisloanamountstoCZK107millionasat31December2011(31December2010:CZK107million).Interestrateonthisloanin2011and2010is4.53%.Also,asat31December2010,theGrouphadaloanconnectedwithfactoringwithrecoursefromVolks-wagenBankGmbHinamountofCZK121millionasat31December2011theGroupdisclosednilbalance.
31 December 2011 31 December 2010
Contractual obligations and other future commitments
Ultimate parent company 8,284 8,659
Associates - -
Companies controlled by ultimate parent company 736 247
Other related parties - -
Total 9,020 8,906
Contractualobligationsto relatedparties includecommitments in respectof researchanddevelopmentcostsandtoolingrights.

notes to the ConsolidAted finAnCiAl stAtements 2011
166 Annual Report 2011
Information on key management personnel remuneration (Czk million)
2011 2010
Salaries and other short-term employee benefits* 355 273
Other long-term employee benefits 14 15
Total 369 288
* Salaries and other short-term employee benefits include besides wages, salaries, bonuses and non-monetary remuneration also health and social insurance paid by employer for employees.
TheremunerationofthemembersoftheBoardofDirectors,SupervisoryBoardandotherkeymanagementpersonnelincludesremunerationpaid,payableorprovidedbytheGroupintheformofsalaries,bonusesandnon-monetaryremuneration.Keymanagementpersonnel includemembersof theBoardofDirectors,SupervisoryBoardandmanag-ersoftheGrouphavingauthorityandresponsibilityforplanning,directingandcontrollingtheactivitiesoftheGroup.In2011,otherkeymanagementpersonneloftheGroupincluded42persons(2010:41persons). CZK 130million out of the total amount disclosed in the line Salaries and other short-term employee benefitswasoutstandingasat31December2011(31December2010:CZK98million).
28. Other information (CZK million)The compensation paid to the Group´s auditors for the accounting period was CZK 36 million (2010: CZK31million)andcoveredthefollowingservices:
2011 2010
Audit and other assurance services 20 19
Tax and related services 6 6
Other advisory services 10 6
Total 36 31
29. Significant events after the balance sheet dateAfterthebalancesheetdate,therewerenoeventsthatcouldhaveasignificantimpactontheconsolidatedfinancialstatementsoftheGroupfortheyearended31December2011.Effectiveon1January2012,theCompanysoldits51%shareinthesubsidiarySkodaAutoPolskaS.A.(seeNote2.1)toparentVolkswagenInternationalFinanceN.V.(seeNote11).Asaresult,theCompanyhaslosttheentireinterestinthesubsidiarySkodaAutoPolskaS.A.Withrespecttotheamountoftheinvestment,pro-ceedsfromthesaleandamountsofassets,liabilitiesandactivitiesofthesubsidiarySkodaAutoPolskaS.A.,theeventdoesnothavesignificantimpactontheclassificationofassetsandresultsofoperationsfortheyearended31December2011.

notes to the ConsolidAted finAnCiAl stAtements 2011
167Annual Report 2011
30. Information about Volkswagen Group
ŠKODA AUTO a.s. is a subsidiary included in the consolidation group of its ultimate parent company VOLKSWAGENAGwitharegisteredofficeinWolfsburg,theFederalRepublicofGermany.TheVolkswagenGroupconsistsoftwodivisions-AutomotiveandFinancialServices.TheactivitiesrelatedtotheAutomotiveDivisionincludethedevelopmentofcarsandaggregates,productionandsaleofpassen-gerandcommercialcars,trucksandbusesaswellasthebusinesswithspareparts.Thefollowingbrandsbelong toVolkswagenGroup:VolkswagenPassengerCars,Audi, ŠKODA,SEAT,VolkswagenCommercialVehicles,Bentley,Bugatti,Scania,MANandLamborghini.TheFinancialServicesDivision includesactivities related to thedealer andcustomerfinancing, leasing,bankingandinsuranceservicesandthefleetmanagement.ŠKODAAUTOanditssubsidiaries(ŠKODAAUTODeutschlandGmbH,SkodaAutoPolskaS.A.,ŠKODAAUTOSlovensko,s.r.o.andSkodaAutoIndiaPrivateLtd.)andassociateOOOVOLKSWAGENGroupRusareincludedintheconsolidationofVolkswagenGroup’sfinancialstatements.Theseconsolidatedfinancialstatements,andotherinformationrelatingtotheVolkswagenGroup,areavailableintheannualreportofVOLKSWAGENAGandonitsinternetsite(website:www.volkswagenag.com).
MladáBoleslav,on17February2012
TheBoardofManagement:
WinfriedVahland
WinfriedKrause BohdanWojnar EckhardScholz
JürgenStackmann KarlheinzEmilHell MichaelOeljeklaus Personsresponsibleforaccouting:
DanaNěmečková JanaFernándezZambrano

168 Annual Report 2011
Auditor´s report on the sepArAte finAnCiAl stAtements
Auditor s report on the separate financial statements
Independent auditor’s report to the shareholder of ŠKODA AUTO a.s.
WehaveauditedtheaccompanyingseparatefinancialstatementsofŠKODAAUTOa.s.,identificationnum-ber00177041,withregisteredofficeatTř.VáclavaKlementa869,MladáBoleslav (“theCompany”),whichcomprisethestatementoffinancialpositionasat31December2011,thestatementsofincome,compre-hensiveincome,changesinequityandcashflowsfortheyearthenendedandnotes,includingasummaryofsignificantaccountingpolicies(“theseparatefinancialstatements”).
Board of Directors’ Responsibility for the Separate Financial StatementsTheBoardofDirectors is responsible for thepreparationof theseparatefinancialstatementsthatgive atrueandfairviewinaccordancewithInternationalFinancialReportingStandardsasadoptedbytheEu-ropeanUnion,andforsuchinternalcontrolsastheBoardofDirectorsdeterminesisnecessarytoenable thepreparationoffinancialstatementsthatarefreefrommaterialmisstatement,whetherduetofraudorerror.
Auditor’s ResponsibilityOurresponsibilityistoexpressanopinionontheseseparatefinancialstatementsbasedonouraudit.WeconductedourauditinaccordancewiththeActonAuditorsoftheCzechRepublic,InternationalStandardsonAuditingandtherelatedapplicationguidanceoftheChamberofAuditorsoftheCzechRepublic.Thosestandardsrequirethatwecomplywithethicalrequirementsandplanandperformtheaudittoobtainrea-sonableassurancewhetherthefinancialstatementsarefreefrommaterialmisstatement.
PricewaterhouseCoopers Audit, s.r.o., Kateřinská 40/466 Prague 2, Czech Republic T: +420 251 151 111, F:+420 251 156 111, www.pwc.com/cz PricewaterhouseCoopers Audit, s.r.o., registered seat Kateřinská 40/466, 120 00 Prague 2, Czech Republic, Identification Number: 40765521, registered with the Commercial Register kept by the Municipal Court in Prague, Section C, Insert 3637, and in the Register of Audit Companies with the Chamber of Auditors of the Czech Republic under Licence No 021.

169Annual Report 2011
Auditor´s report on the sepArAte finAnCiAl stAtements
An audit involves performing procedures to obtain audit evidence about the amounts and disclosures inthefinancialstatements.Theproceduresselecteddependontheauditor’sjudgment,includingassess-mentof the risks ofmaterialmisstatementof the financial statements,whether due to fraudor error. Inmaking those risk assessments, the auditor considers internal control relevant to thepreparationofthefinancial statements thatgivea trueand fairview inorder todesignauditprocedures thatareap-propriate in the circumstances, but not for the purpose of expressing an opinion on the effectiveness ofthe internalcontrol.Anauditalso includesevaluatingtheappropriatenessoftheaccountingpoliciesusedandthereasonablenessofaccountingestimatesmadebymanagement,aswellasevaluatingtheoverallpresentationofthefinancialstatements.Webelievethattheauditevidencewehaveobtainedissufficientandappropriatetoprovideabasisforourauditopinion.
OpinionIn our opinion, the separate financial statements give a true and fair view of the financial position oftheCompanyasat31December2011,itsfinancialperformanceanditscashflowsfortheyearthenendedinaccordancewithInternationalFinancialReportingStandardsasadoptedbytheEuropeanUnion.
17February2012
pricewaterhouseCoopers Audit, s.r.o.representedby
Jiří Zouhar Petr KřížPartner StatutoryAuditor,LicenceNo.1140
Note: Our report has been prepared in the Czech language and in English. In all matters of interpretation of information, views or opinions, the Czech version of our report takes precedence over the English version.

170 Annual Report 2011
sepArAte finAnCiAl stAtements for the yeAr ended 31 deCember 2011
Separate financial statements for the year ended 31 December 2011
Income statement for the year ended 31 December 2011 (Czk million)
Note 2011 2010
Sales 18 231,742 203,695
Cost of sales 27 201,765 180,343
Gross profit 29,977 23,352
Distribution expenses 27 11,613 9,449
Administrative expenses 27 5,504 4,666
Other operating income 19 8,347 6,134
Other operating expenses 20 3,983 4,336
Operating profit 17,224 11,035
Financial income 2,790 1,580
Financial expenses 2,859 1,400
Financial result 21 (69) 180
Profit before income tax 17,155 11,215
Income tax expense 23 2,867 1,811
Profit for the year 14,288 9,404
Statement of comprehensive income for the year ended 31 December 2011 (Czk million)
Note 2011 2010
Profit for the year 14,288 9,404
Cash flow hedges:
Change in fair value in the period 13 (4,543) (692)
Total transfers of fair value to net profit - effective hedging 13 (1,481) 5
Total transfers of fair value to net profit - ineffective hedging 13 8 (61)
Deferred tax 13 1,155 141
Other comprehensive loss (4,861) (607)
Total comprehensive income for the year 9,427 8,797
Thenotesonpages174to229areanintegralpartofthesefinancialstatements.

171Annual Report 2011
sepArAte finAnCiAl stAtements for the yeAr ended 31 deCember 2011
Balance sheet as at 31 December 2011 (Czk million)
Note 31 December 2011 31 December 2010
Assets
Intangible assets 5 13,531 12,852
Property, plant and equipment 6 45,397 41,512
Investments in subsidiaries 7 247 1,388
Investments in associates 8 2,352 2,352
Other receivables and financial assets 9 1,152 1,538
Deferred tax asset 15 1,762 347
Non-current assets 64,441 59,989
Inventories 10 8,437 8,660
Trade receivables 9 11,695 9,724
Other receivables and financial assets 9 26,893 14,638
Cash and Cash equivalents 11 24,105 29,256
Current assets 71,130 62,278
Total assets 135,571 122,267
Note 31 December 2011 31 December 2010
Equity and liabilities
Share capital 12 16,709 16,709
Share premium 1,578 1,578
Reserves 13 62,120 57,395
Equity 80,407 75,682
Non-current financial liabilities 14 3,000 3,000
Other non-current liabilities 14 4,965 1,448
Non-current provisions 16 7,361 6,304
Non-current liabilities 15,326 10,752
Current financial liabilities 14 107 107
Trade payables 14 24,466 22,829
Other current liabilities 14 4,676 3,731
Current income tax liabilities 1,184 1,138
Current provisions 16 9,405 8,028
Current liabilities 39,838 35,833
Total equity and liabilities 135,571 122,267
Thenotesonpages174to229areanintegralpartofthesefinancialstatements.

172 Annual Report 2011
sepArAte finAnCiAl stAtements for the yeAr ended 31 deCember 2011
Statement of changes in equity for the year ended 31 December 2011 (Czk million)
Note Share capitalShare
premiumRetained earnings
Other reserves* Total equity
Balance as at 1 January 2010 16,709 1,578 46,106 4,126 68,519
Profit for the year - - 9,404 - 9,404
Change in fair value in the period 13 - - - (692) (692)
Total transfers of fair value to net profit - effective hedging 13 - - - 5 5
Total transfers of fair value to net profit - ineffective hedging 13 - - - (61) (61)
Deferred tax 13 - - - 141 141
Other comprehensive loss - - - (607) (607)
Total comprehensive income for the year - - 9,404 (607) 8,797
Dividends paid - - (1,634) - (1,634)
Transfer to statutory reserve fund - - (172) 172 -
Balance as at 31 December 2010 16,709 1,578 53,704 3,691 75,682
Balance as at 1 January 2011 16,709 1,578 53,704 3,691 75,682
Profit for the year - - 14,288 - 14,288
Change in fair value in the period 13 - - - (4,543) (4,543)
Total transfers of fair value to net profit - effective hedging 13 - - - (1,481) (1,481)
Total transfers of fair value to net profit - ineffective hedging 13 - - - 8 8
Deferred tax 13 - - - 1,155 1,155
Other comprehensive loss - - - (4,861) (4,861)
Total comprehensive income for the year - - 14,288 (4,861) 9,427
Dividends paid - - (4,702) - (4,702)
Balance as at 31 December 2011 16,709 1,578 63,290 (1,170) 80,407
* Explanatory notes on Other reserves are presented in Note 13.
Thenotesonpages174to229areanintegralpartofthesefinancialstatements.

173Annual Report 2011
sepArAte finAnCiAl stAtements for the yeAr ended 31 deCember 2011
Cash flow statement for the year ended 31 December 2011 (Czk million)
Note 2011 2010
Cash and cash equivalents as at 1 January 17 29,256 29,224
Profit before income tax 17,155 11,215
Depreciation and impairment of non-current assets 5, 6 12,601 14,167
Change in provisions 16 2,287 2,756
Gain on disposal of non-current assets (11) (1)
Net interest (income) / expense 21 53 62
Change in inventories 10 117 (846)
Change in receivables (2,783) (3,138)
Change in liabilities 901 4,465
Income tax paid from operating activities (3,081) (1,862)
Interest paid (384) (397)
Interest received 456 412
Dividends income 21 (388) (669)
Impairment losses of investments in subsidiaries 7.21 1,141 -
Other adjustments for non-cash transactions (797) 93
Cash flows from operating activities 27,267 26,257
Purchases of non-current assets (13,312) (9,640)
Additions to capitalised development costs 5 (3,306) (3,093)
Increase in financial investments 8 - (530)
Increase in deposits* made 9 (11,500) (10,016)
Proceeds from sale of non-current assets 14 19
Proceeds from dividends 388 669
Cash flows from investing activities (27,716) (22,591)
Net cash flows (operating and investing activities) (449) 3,666
Dividends paid 12 (4,702) (1,634)
Repayment of bonds - (2,000)
Cash flows from financing activities (4,702) (3,634)
Net change in cash and cash equivalents (5,151) 32
Cash and cash equivalents as at 31 December 17 24,105 29,256
* Deposits which do not meet criteria of cash equivalents according to IAS 7.
Thenotesonpages174to229areanintegralpartofthesefinancialstatements.

174 Annual Report 2011
notes to the sepArAte finAnCiAl stAtements 2011
Notes to the separate financial statements 2011
Company informationFoundation and company enterprises
ŠKODAAUTOa.s.wasincorporatedasajoint-stockcompanyon20November1990.Thecompany’sprinci-palbusinessactivitiesarethedevelopment,productionandsaleofvehiclesandrelatedaccessories.Registeredoffice: Tř.VáclavaKlementa869 29360MladáBoleslav CzechRepublic IČ:00177041 wwwaddress:www.skoda-auto.czThecompanyisregisteredintheCommercialRegistermaintainedwiththeMunicipalCourtinPrague,Sec-tionB,Insert332,withFileNo.Rg.B332.Theorganisationalstructureofthecompanyisdividedintothefollowingmainareas:– Centralmanagementdepartment– Technicaldevelopment– Productionandlogistics– Salesandmarketing– Commercialaffairs– Humanresourcemanagement– PurchasingThecompanyhasitsmainproductionplantinMladáBoleslavandtwootherproductionplantsinVrchlabíandKvasiny.ŠKODAAUTOa.s. isasubsidiaryof Volkswagen InternationalFinanceN.V. included intheconsolidationgroupof itsultimateparent companyand itsultimate controllingparty,VOLKSWAGENAG (“VolkswagenGroup”),withitsregisteredofficeinWolfsburg,theFederalRepublicofGermany(fordetailsseeNote31).
Note
Thefinancialstatementshavebeenprepared inCzechand inEnglish. Inallmattersof interpretationofinformation,viewsoropinions,theCzechversionofthesefinancialstatementstakesprecedenceovertheEnglishversion.

notes to the sepArAte finAnCiAl stAtements 2011
175Annual Report 2011
1. Summary of significant accounting policies and principles1.1 Compliance statement
ThesefinancialstatementsareseparatefinancialstatementsofŠKODAAUTOa.s.(“theCompany”)fortheyearended31December2011andrelatetotheconsolidatedfinancialstatementsofŠKODAAUTOa.s.andits subsidiaries and associates for the year ended31December 2011.Users of these separate financialstatementsshouldreadthemtogetherwiththeconsolidatedfinancialstatementsfortheyearended31December2011inordertoobtainfullinformationonthefinancialposition,resultsofoperationsandchang-esinfinancialpositionoftheGroupasawhole.TheCompanyasacontrolledentityisobligedtobepartofconsolidatedfinancialstatementsoftheVolk-swagenGroupinaccordancewiththeInternationalFinancialReportingStandardsasadoptedbytheEuro-peanUnion.AsaresultandbasedontheCompany’ssoleshareholder’sdecisionandundertheparagraph19a)Article7ofActNo.563/1991Coll.onAccounting,theCompanypreparestheseparatefinancialstatementsinaccordancewithIFRSasadoptedbytheEuropeanUnion.RefertotheCompanyinformationintheprecedingNote“Companyinformation”.
1.2 Adoption of new or revised standards, amendments and interpretations to existing standards*
1.2.1 New standards, amendments and interpretations to existing standards mandatory for accounting periods beginning on 1 January 2011
New standards, amendments, interpretations and improvements to existing standards mandatory for accountingperiodsbeginningonorafter1January2011,whichareappliedbytheCompany:
IFRS Standard/Interpretation Effective Description Effect
IAS 24 Related Party Disclosures 1 January 2011 The main objective of the amendment is to provide a partial exemption from the disclosure requirements for government-related entities, and to clarify the definition of a related party. The amendment also clarifies the entity’s obligation to dis-close information about all commitments, associated with a related party, to do something if a particular event occurs or does not occur in the future, including executory contracts (recognised and unrecognised).
The Amendment to IAS 24 had impact on the extent of disclosure of transactions with related parties. The Company has disclosed the unrecognised executory contracts with related parties as compared with the information disclosed in the notes to financial statements as at 31 December 2010.
IAS 1 (Improvement to IFRS 2010)
Presentation of Financial Statements
1 January 2011 The improvement to IAS 1 clarifies the requirement for the presentation and content of the Statement of Changes in Equity.
The improvement to IAS 1 had impact on the extent of the disclosure of the information in the Statement of changes in equity. The Company has disclosed separately Profit for the year and Other comprehensive loss as compared with the information disclosed in the financial state-ments as at 31 December 2010.
IFRS 7 (Improvement to IFRS 2010)
Financial Instruments: Disclosures
1 January 2011 The improvement to IFRS 7 clarifies the disclosure in the area of financial instruments.
The improvement to IFRS 7 had an impact on the extent of the disclosures of the information in the area of collateral and other credit enhancements of financial instruments. The Company has disclosed value of a secured receivable or value of the security, if it was lower.
* The effective dates express the dates effective for the Company.

notes to the sepArAte finAnCiAl stAtements 2011
176 Annual Report 2011
New standards, amendments, interpretations and improvements to existing standards mandatory for accountingperiodsbeginningonorafter1January2011,whicharenotappliedbytheCompanyastheyarenotrelevanttotheCompany’soperations:Newstandards,amendmentsandinterpretationstoexistingstandardsmandatoryforaccountingperiodsbeginningonorafter1January2011:
IFRS Standard/Interpretation Effective Description
IAS 32 Classification of Rights Issues 1 January 2011 The amendment deals with presentation of rights issues denominated in a currency other than the issuing entity’s functional currency. The amendment exempts certain rights issues of shares with proceeds denominated in foreign currencies from classification as financial derivatives.
IFRIC 14 Prepayments of a Minimum Funding Requirement
1 January 2011 The amendment removes an unintended consequence of IFRIC 14 arising from the treatment of prepayments of future contributions in some circumstances when there is a minimum funding requirement.
IFRIC 19 Extinguishing Financial Liabilities with Equity Instruments
1 January 2011 The interpretation addresses the accounting in cases where all or part of the financial liability is extinguished by the debtor by issuing equity instruments to the creditor.
Improvements to International Financial Reporting Standards 2010 mandatory for accounting periods beginningonorafter1January2011(issuedinMay2010):
IFRS Standard/Interpretation Effective Description
IFRS 3 Business Combinations 1 July 2010 Measurement of non-controlling interests.Un-replaced and voluntarily replaced share-based payment awards.Transition requirements for contingent consideration from a business combination that occurred before the effective date of the revised IFRS 3.
IAS 27 Consolidated and Separate Financial Statements
1 July 2010 Transition requirements for subsequent amendments arising as a result of IAS 27.
IAS 34 Interim Financial Reporting 1 January 2011 Significant events and transactions.
IFRIC 13 Customer Loyalty Programmes 1 January 2011 Fair value of award credits.

notes to the sepArAte finAnCiAl stAtements 2011
177Annual Report 2011
1.2.2 New standards, amendments and interpretations to existing standards published not yet effective for accounting periods beginning on or after 1 January 2011
New standards, amendments and interpretations to existing standards, which will be relevant for the CompanybuthavenotbeenearlyadoptedbytheCompany:
IFRS Standard/Interpretation Effective Description Effect
IFRS 9 Financial instruments 1 January 2015 IFRS 9 replaces those parts of IAS 39 relating to the classification and measurement of financial assets and changes also some disclosure requirements as set out by IFRS 7. Per IFRS 9, all financial assets, currently within scope of IAS 39, are required to be classified into two measurement categories – those to be measured subsequently at amortised cost, and those to be measured subsequently at fair value.
The Company expects that the new IFRS 9 will have impact on classification, measurement and disclosure of financial instruments in the notes to the financial statements. However, without a detailed analysis it is not possible to perform reliable estimate of such impact as at the date of the financial statements. The Company does not expect early adoption of the standard, while the transition to IFRS 9 will probably take place after 1 January 2015. The disclosure of information in the area of financial instruments will be ruled by IFRS 7 §44S-44W.
IFRS 13 Fair value measurement 1 January 2013 Aim of the new standard is to reduce complexity, improve consistency and clarify approach to disclosure of items in the financial statements carried at fair value. The standard clearly defines fair value and gives instruction for its application in case the fair value measurement is required or allowed by another IFRS. A definition of the fair value and a single source of fair value measurement and disclosure requirement for use across IFRSs.
The Company expects that the new standard IFRS 13 will not have significant impact on the measurement of items carried at fair value. However, without a detailed analysis it is not possible to confirm this estimated impact.
IAS 1 Presentation of Financial Statements
1 July 2012 The amendments deal with disclosure of items presented in other comprehensive income. The amendments newly require entities to separate items presented in other comprehensive income into two groups, based on whether or not they may be reclassified to profit or loss in the future. Information to the user will be provided what proportion of total comprehensive income will be never reclassified to profit of loss for the period.
The Company expects that the amendments to IAS 1 will have impact on the extent of the disclosure of information in the Statement of comprehensive income.
IAS 19 Employee benefits 1 January 2013 Amendment to IAS 19 makes to the recognition and measurement of defined benefit pension expense and termination benefits. The standard requires recognition of all changes in the defined benefit liability and assets of the plans when they occur, introduces extended disclosures for termination benefits and clarifies many issues including classification of employee benefits.
The Company expects that the amendment to IAS 19 will have impact mainly on presentation of benefits upon employment termination. However, without a detailed analysis it is not possible to perform reliable estimate of such impacts at the date of the financial statements.

notes to the sepArAte finAnCiAl stAtements 2011
178 Annual Report 2011
Thefollowingstandards,amendmentsandinterpretationstoexistingstandardswhichwillnotberelevantfortheCompanyorarenotexpectedtohaveasignificantimpactontheCompany’soperations:
IFRS Standard/Interpretation Effective Description
IFRS 7 Financial Instruments: Disclosures Transfers of Financial Assets
1 July 2011 The amendment enhances the disclosure requirements related to transactions including a transfer of financial assets.
IFRS 7 Disclosure: Offsetting Financial Assets and Financial Liabilities
1 January 2013 The amendment requires disclosures that will enable users of an entity’s financial statements to evaluate the effect or potential effect of netting arrangements, including rights of set-off.
IFRS 10 Consolidated Financial Statements 1 January 2013 IFRS 10 Consolidated Financial Statements replaces previous IAS 27 and SIC-12. The new standard follows up the current principles to determine control, focuses on clarification of the definition of control, while the rules for status of control are substantially extended.
IFRS 11 Joint Arrangements 1 January 2013 IFRS 11 fully replaces IAS 31 and SIC-13. Substantial change introduced by the new standard is elimination of jointly controlled assets and elimination of proportionate consolidation.
IFRS 12 Disclosure of Interests in Other Entities
1 January 2013 IFRS 12 deals with all disclosure requirements in respect of interests held in other reporting entities and replaces the previous standard IAS 27. The scope of the standard includes interests in subsidiaries, associates, joint arrangements and unconsolidated structured entities (formerly “special purpose entities”).
IAS 12 Deferred tax: Recovery of Underlying Assets
1 January 2012 The amendment provides an exception to the general principle as per IAS 12 for deferred tax assets and deferred tax liabilities arising from investment property carried at fair value as per IAS 40 or property, plant and equipment or intangible assets measured using the revaluation model as per IAS 16 or IAS 38.
IAS 27 Separate Financial Statements 1 January 2013 This standard replaces previous standard IAS 27. Requirements for separate financial statements remained without changes. Other parts of IAS 27 were replaced by IFRS 10.
IAS 28 Investments in Associates and Joint Ventures
1 January 2013 The amendment of IAS 28 modified the standard so that changes resulting from issuance of standards IFRS 10, IFRS 11 and IFRS 12 are reflected.
IAS 32 Financial Instruments : Offsetting Financial Assets and Financial Liabilities
1 January 2014 The amendments to IAS 32 deals with offsetting financial assets and liabilities. If clarifies condition under which the offsetting may be applied.
IFRIC 20 Stripping Costs in the Production Phase of a Surface Mine
1 January 2013 The new interpretation IFRIC 20 deals with presentation of stripping costs in the Production Phase of a Surface Mine, the initial measurement and subsequent measurement of the stripping activity asset.
Newstandards, amendmentsand interpretationsdisclosed inNote 1.2.2havenot yetbeenadoptedbytheEuropeanUnion,exceptfortheamendmenttoIFRS7FinancialInstrument:Disclosures–TransfersofFinancialAssets.

notes to the sepArAte finAnCiAl stAtements 2011
179Annual Report 2011
1.3 Reclassification of presented items, changes in accounting policies and comparative amounts
1.3.1 Reclassification of cash equivalents in the balance sheetDuetomoreaccuratepresentationofcashequivalents*inthebalancesheetinrelationtotheirreconcili-ationtothefiguresreportedinthecashflowstatement,effectivefrom1January2011thisaccountingcat-egoryhasbeentransferredfrombalancesheetlineOtherreceivablesandfinancialassetstobalancesheetlineCashandCashequivalents.Theimpactofthereclassificationofcashequivalentsonthereporteddataforthecomparativeperiod2010isshowninthefollowingtable:
CZK million Data reported for comparative
accounting period 2010 in balance sheet as at 31 December 2011
Data reported for current
accounting period 2010 in balance sheet as at 31 December 2010 Difference
Other receivables and financial assets 14,638 39,000 (24,362)
Cash and Cash equivalents 29,256 4,894 24,362
Asat1January2010,afterthereclassificationofthecashequivalents,thevalueofbalancesheetlineOtherreceivablesandfinancialassetswouldbeCZK3,391millionandthevalueofbalancesheetlineCashandCashequivalentswouldbeCZK29,223million.
* Short-term deposits in Volkswagen Group companies with the original maturity not exceeding 3 months have been reported as cash equivalents by the Company in 2011 and 2010.
1.3.2 Change of presentation of reversals of provisions and accrualsEffectivefrom1 January2011,therehasbeenachangeinaccountingpolicyforpresentationofreversalsofexcessprovisionsandaccruals, inorderto increasetransparencybydisclosingtheamountsreversedseparately,insteadofnettingthemagainstexpensesrelatingtotheadditionstoprovisionsandaccruals.InthefinancialstatementsoftheCompanyfortheaccountingperiodbeginningon1January2011,there-versalsofexcessprovisionsandaccrualsarerecognisedaspartofotheroperatingincome.(InthefinancialstatementsoftheCompanyfortheaccountingperiodbeginningon1January2010,thereversalsofexcessprovisionsandaccrualsweredisclosedinthesameaccountingcategoriesastheiradditionsandutilisation).Asaresultoftheabove-mentionedfact,thereportedcomparativefigureshavebeenchangedwithimpactontheincomestatementandonthedatastatedinthenotestotheseparatefinancialstatements2011(inNote18Sales,inNote19OtheroperatingincomeandinNote27Expensesbynature).

notes to the sepArAte finAnCiAl stAtements 2011
180 Annual Report 2011
Thefollowingtablespecifiestheimpactofthechangeoftheaccountingpolicyforreversalsofexcessprovi-sionsandaccrualsoncomparativefiguresintheincomestatementfortheyearended31December2011:
CZK million Data reported for comparative
accounting period 2010 in income
statement for the year ended
31 December 2011
Data reported for current
accounting period 2010 in income
statement for the year ended
31 December 2010 Difference
Sales 203,695 203,819 (124)
Cost of sales 180,343 179,369 974
Gross profit 23,352 24,450 (1,098)
Distribution expenses 9,449 9,359 90
Administrative expenses 4,666 4,616 50
Other operating income 6,134 4,896 1,238
Inthenotestotheseparatefinancialstatementsthecomparativefiguresfor2010havebeenchanged,inNote4InformationaboutregiontheitemSales-basedonlocationofcustomersinthecolumnCzechRepublichasbeendecreasedbyCZK124millionfromvalueCZK21,966milliontoCZK21,842million.InNote18Sales,thelineCarshasbeendecreasedbyCZK101millionfromvalueCZK174,535milliontoCZK174,434millionandthelineSparepartsandaccessorieshasbeendecreasedbyCZK23millionfromvalueCZK12,333milliontoCZK12,310million.Duetothechangeinthepresentationofthereversalsofexcessprovisionsandaccruals,totalsaleshavedecreasedbyCZK124million.Inaddition,comparativefiguresfor2010havebeenchangedinNote19Otheroperatingincome.Thesepa-rateitemReversalofprovisionsandaccrualshasbeenaddedwiththereportedamountofCZK1,238million.TheimpactofthechangeoftheaccountingpolicyforreversalsofexcessprovisionsandaccrualsonthecomparativefiguresinNote27Expensesbynatureisshowninthefollowingtable:
CZK million Data reported for comparative account-
ing period 2010 in notes to the
financial statements for the year ended 31 December 2011
Data reported for current accounting
period 2010 in the notes to the
financial statements for the year ended 31 December 2010 Difference
Material costs - raw materials and other supplies, goods 138,487 138,227 260
Production related services 11,006 10,340 666
Personnel costs 15,162 15,101 61
Wages 11,392 11,331 61
Pension benefit costs (defined contribution plans) 2,226 2,226 -
Social insurance and other personnel costs 1,544 1,544 -
Depreciation, amortisation and impairment losses 14,167 14,167 -
Other services 15,636 15,509 127
Total cost of sales, distribution and administrative expenses 194,458 193,344 1,114

notes to the sepArAte finAnCiAl stAtements 2011
181Annual Report 2011
2. Basis of preparation of financial statementsTheseseparatefinancialstatementshavebeenpreparedunderthehistoricalcostconvention,exceptforfairvaluemeasurementofavailable-for-salefinancialassets,offinancialassetsandfinancialliabilitiesatfairvaluethroughprofitorloss,andofallderivativecontracts.ThepreparationoffinancialstatementsinconformitywithIFRSrequirestheuseofcertaincriticalaccount-ingestimates.ItalsorequiresmanagementtoexercisetheirjudgmentintheprocessofapplyingtheCom-pany’saccountingpolicies.AmountsinthefinancialstatementsandinthenotesaredisclosedinmillionsofCzechcrowns(CZKmillion),unlessstatedotherwise.
2.1 Foreign currency translation
Functional and presentation currencyItemsincludedinthefinancialstatementsoftheCompanyaremeasuredusingthecurrencyoftheprimaryeconomicenvironmentinwhichtheCompanyoperates(‘thefunctionalcurrency’).ThefinancialstatementsarepresentedinCzechcrowns(CZK),whichistheCompany’sfunctionalandpresentationcurrency.Foreigncurrencytransactionsaretranslated intothefunctionalcurrencyusingtheexchangeratespub-lishedbytheCzechNationalBankprevailingonthedatesofthetransactions.Foreignexchangegainsandlossesresultingfromthesettlementofsuchtransactionsandfromthetranslationofmonetaryassetsandliabilitiesdenominatedinforeigncurrenciesatyear-endexchangeratespublishedbytheCzechNationalBankarerecognisedintheincomestatement.
2.2 Intangible assets
Purchasedintangibleassetsarerecordedatcostlesscumulativeamortisationandimpairmentlosses.Allresearchcostsarerecognisedasexpenseswithintheincomestatementwhenincurred.InaccordancewithIAS38,alldevelopmentcostsofnewŠKODAmodelsandotherproductsarerecognisedasintangibleassetswhenitisprobablethattheprojectwillbeasuccessconsideringitscommercialandtechnicalfeasibility,andcostscanbemeasuredreliably.Capitaliseddevelopmentcostsandotherinternallygeneratedintangibleas-setsarecarriedatcostlessaccumulatedamortisationandimpairmentlosses.Ifthecriteriaforrecognitionasanassetarenotmet,thecostsarerecognisedintheincomestatementintheyearinwhichtheyareincurred.Toolingrightsarecapitalisedasintangibleassets.Capitalisedcostsincludealldirectcostsaswellasanappropriateportionofdevelopment-relatedoverheads.Thecostofqualifyingintangibleassetsalsoincludesborrowingcostsrepresentedbyinterestandothercoststhatanentityincursinconnectionwithborrowingfunds.Aqualifyingassetisanassetthatnecessar-ilytakesatleastoneyeartogetreadyforitsintendeduse.TheCompanyceasescapitalisingborrowingcostswhenthequalifyingassetisreadyforitsintendeduseorsale.Thedevelopmentcostsareamortisedusingthestraight-linemethodfromthestartofproductionovertheexpectedlifecycleofthemodelsorcomponents.Amortisationrecognisedduringtheyearisallocatedtotherelevantfunctionsintheincomestatement.Intangibleassetsareamortisedapplyingthestraight-linemethodovertheirestimatedusefullivesasfol-lows:– Capitaliseddevelopmentcosts 2–10yearsaccordingtotheproductlifecycle– Software 3years– Toolingrights 8years– Otherintangiblefixedassets 3–5yearsEstimatedusefullivesanddepreciationmethodarereviewedattheendofeachaccountingperiod,theef-fectofanychangesinestimatesareaccountedforprospectively.Intangibleassetsnotyetavailableforusearetestedannuallyforpossibleimpairmentandarecarriedatcostlessaccumulatedimpairmentlosses.

notes to the sepArAte finAnCiAl stAtements 2011
182 Annual Report 2011
2.3 Property, plant and equipment
Allproperty,plantandequipmentarestatedathistoricalcostlesscumulativedepreciationandimpairmentlosses.Historicalcostincludesexpenditurethatisdirectlyattributabletotheacquisitionoftheassets.Allrepairsandmaintenancecostsarechargedtotheincomestatementduringthereportingperiodinwhichtheyareincurred.Subsequentcostsareincludedintheasset’scarryingamountorrecognisedasaseparateasset,asappropriate,onlywhenitisprobablethatfutureeconomicbenefitsassociatedwiththeitemwillflowtotheCompanyandthecostoftheitemcanbemeasuredreliably.Thecostofqualifyingtangibleassetsalsoincludesborrowingcostsrepresentedbyinterestandothercoststhatanentityincursinconnectionwithborrowingoffunds.Aqualifyingassetisanassetthatnecessarilytakesat leastoneyeartogetreadyfor its intendeduse.TheCompanyceasescapitalisingofborrowingcostswhenthequalifyingassetisreadyforitsintendeduseorsale.Landisnotdepreciated.Depreciationofotherassetsiscalculatedusingthestraight-linemethodovertheirestimatedusefullivesasfollows:– Buildings 9–50years– Technicalequipmentandmachinery(incl.specialtooling) 2–18years– Otherequipment,operatingandofficeequipment 3–25yearsEstimatedusefullivesanddepreciationmethodarereviewedattheendofeachaccountingperiod,theef-fectofanychangesinestimatesareaccountedforprospectively.
2.4 Impairment of assets
Assetsthataresubjecttoamortisationanddepreciationarereviewedforimpairmentwhenevereventsorchangesincircumstancesindicatethatthecarryingamountmaynotberecoverable.Animpairmentlossisrecognisedintheamountbywhichtheasset’scarryingamountexceedsitsrecoverableamount.Therecov-erableamountisthehigherofanasset’sfairvaluelesscoststosellandvalueinuse.For thepurposesofassessing impairment,assetsaregroupedat the lowest levels forwhich thereareseparatelyidentifiablecashinflows(cash-generatingunits).
2.5 Financial instruments
2.5.1 Financial assetsTheCompanyclassifiesitsfinancialassetsinthefollowingcategories:financialassetsatfairvaluethroughprofitorloss;loansandreceivables,available-for-salefinancialassetsandinvestmentsinsubsidiariesandassociates.Theclassificationdependsonthepurposeforwhichthefinancialassetswereacquired.Man-agementoftheCompanydeterminestheclassificationofitsfinancialassetsatinitialrecognition.
a) Financial assets at fair value through profit or lossFinancialassetsatfairvaluethroughprofitorlossarefinancialassetsheldfortradingorsodesignatedbymanagement.Derivativesarealsocategorisedasheldfortradingunlesstheyaredesignatedashedginginstruments.Realisedandunrealisedgainsand lossesfromchanges inthefairvalueoffinancialassetsvaluedatfairvaluethroughprofitorlossarerecognisedunderfinancialincomeorexpensesintheperiodinwhichtheyarise.Duringtheaccountingperiods2011and2010,theCompanyonlyhadfinancialderivativeswithinthiscategory(Note2.5.3).
b) Loans and receivablesLoansandreceivablesarenon-derivativefinancialassetswithfixedordeterminablepaymentsthatarenotquotedinanactivemarket.TheyarisewhentheCompanyprovidesmoney,goodsorservicesdirectlytoadebtorwithnointentionoftradingthereceivable.Theyareincludedincurrentassets,exceptformaturi-tiesgreaterthan12monthsafterthebalancesheetdate.Theseareclassifiedasnon-currentassets.Loansandreceivablesareclassifiedastradereceivables,orotherreceivablesandfinancialassetsinthebalancesheet(Note9).

notes to the sepArAte finAnCiAl stAtements 2011
183Annual Report 2011
c) Available-for-sale financial assetsAvailable-for-salefinancialassetsarenon-derivatives thatareeitherdesignated in this categoryornotclassifiedinanyoftheothercategories.Theyareincludedinnon-currentassetsunlessmanagementin-tends todisposeof the investmentwithin 12monthsof thebalancesheetdate.Dividend income fromtheseactivitiesisincludedinotherfinancialincome.Whensecuritiesclassifiedasavailable-for-salearesoldorimpaired,theaccumulatedfairvalueadjustmentsareincludedintheincomestatementasapartofotheroperatingincomeorexpenses.Intheaccountingperiods2011(2010),theCompanyonlyhad,withinthecategoryofavailable-for-salefinan-cialassets,investmentstoequityinstrumentsthatdidnothavequotedpriceinanactivemarket.
d) Investments in subsidiaries and associatesInvestmentsinsubsidiariesandassociatesarecarriedintheseparatefinancialstatementsatcostlessanyimpairmentloss.Dividendsreceivedfromsuchassetsarepresentedinfinancial income.Incaseinvestmentsinsubsidiar-iesandassociatesareimpaired,theimpairmentlossispresentedinthelinefinancialexpensesinincomestatement.Purchasesandsalesoffinancialassetsarerecognisedontrade-date–thedateonwhichtheCompanycommitstopurchaseorsell theasset.Financialassets,withtheexceptionoffinancialassetscarriedatfairvaluethroughprofitorloss,areinitiallyrecognisedatfairvalueplustransactioncosts.Financialassetscarriedat fairvaluethroughprofitor lossare initially recognisedat fairvalue,andtransactioncostsareexpensed in the incomestatement.Available-for-sale financial assets andfinancial assets at fair valuethroughprofitorlossaresubsequentlycarriedatfairvalue.Equityinstrumentsthatdonothavequotedpricesinanactivemarketandtheirfairvaluecannotbereliablymeasuredarevaluedatcost.Long-termloansandreceivablesarecarriedatamortisedcostusingtheeffectiveinterestmethod.TheCompanydeterminesateachbalancesheetdatewhetherthereisobjectiveevidencethatafinancialassetoragroupoffinancialassetsisimpaired.InitiallytheCompanydetermines,inlinewithIAS39,ifobjec-tiveevidenceexiststhatindividuallymaterialfinancialassetsareimpairedandperformsthesameassess-mentindividuallyorcollectivelyforindividuallyimmaterialfinancialassets.IntheeventthattheCompanydoesnotfindobjectiveevidenceofimpairmentforindividuallyassessedfinancialassets,whethermaterialornot,theseassetsareincludedinthegroupoffinancialassetswithcommoncreditriskcharacteristicsandthegroupoffinancialassetsisassessedcollectivelyforimpairment.Individualassetsforwhichobjec-tiveevidenceof impairmenthasbeenidentifiedarenotincludedinagroupofassetsthatareassessedcollectivelyforimpairment.Inthecaseofequitysecuritiesclassifiedasavailable-for-salefinancialassets,asignificantorprolongedde-clineinthefairvalueofthesecuritybelowitscostisconsideredasanindicatorthatthesecurityisimpaired.ThetradereceivablesareconsideredtobeimpairedifobjectiveevidenceexistsatthebalancesheetdatethattheCompanywillnotbeabletocollectalloutstandingbalancesinaccordancewithinitiallyagreedcon-ditions.Significantfinancialdifficulties,theprobabilitythatthedebtorwillenterbankruptcyorfinancialre-organisation,anddefaultordelaysinpaymentofliabilitiesareconsideredindicatorsthattradereceivablesareimpaired.Fortradereceivables,theallowanceisquantifiedonthebasisofdetailedinformationaboutthefinancialsituationofthecustomerandpaymenthistory.Whenthereceivableisassessedasuncollect-ible,anallowanceequalto100%ofthereceivablebalanceiscreated.Forotherreceivables,theallowanceisquantifiedonthebasisofdetailedinformationaboutthefinancialsituationofthecustomerandpaymenthistory.Thevalueoftheallowanceisthedifferencebetweentheasset’scarryingamountandthepresentvalueofestimatedfuturecashflows,discountedattheoriginaleffectiveinterestrateofthereceivable.Thecreationof theallowance is recognised in the incomestatementwithinOtheroperatingexpenses.Whenthereceivablecannotbecollectedthroughlegalaction(i.e.thereceivableshavelapsed;insufficientassetsduetobankruptcyofthedebtor;debtorwasliquidatedwithoutalegalsuccessor,etc.),itiswrittenoffthroughprofitandlossandtheallowanceisutilised.FinancialassetsarederecognisedwhentherightstoreceivecashflowsfromtheinvestmentshaveexpiredorhavebeentransferredandtheCompanyhastransferredsubstantiallyallrisksandrewardsofownership.

notes to the sepArAte finAnCiAl stAtements 2011
184 Annual Report 2011
2.5.2 Financial liabilities
a) Financial liabilities measured at fair value through profit and lossFinancialliabilitiesatfairvaluethroughprofitorlossarefinancialliabilitiesheldfortradingorsodesignatedbymanagement.Derivativesarealsocategorisedasheldfortradingunlesstheyaredesignatedashedginginstruments.Realisedandunrealisedgainsandlossesfromchangesinthefairvalueoffinancialliabilitiesvaluedatfairvaluethroughprofitorlossarerecognisedunderfinancialincomeorexpensesintheperiodinwhichtheyarise.Duringtheaccountingperiod2011(2010)theCompanyonlyhadfinancialderivativesinthiscategory(Note2.5.3).
b) Financial liabilities measured at amortised costFinancial liabilitiesaremeasuredat fair valuenetof transactioncostsat initial recognition.Subsequentmeasurementisatamortisedcostbyapplyingtheeffectiveinterestratemethod.
2.5.3 Financial derivativesTheCompanyusesderivativestohedgecurrencyandpricerisks.Derivativesareinitiallyrecognisedatfairvalueonthedateaderivativecontractisenteredintoandaresubsequentlyre-measuredattheirfairvalue.Themethodofrecognisingtheresultinggainorlossdependsonwhetherthederivativeisdesignatedasahedginginstrumentorinstrumentheldfortrading.TheCompanydesignatesashedginginstrumentsonlythosewhichfulfiltherequirementsofhedgeaccounting.TheCompanyusesderivativestohedgefuturecashflows.Thehedgeditemsareasfollows:– Highlyprobablefuturetransactions;and– Cashflowfromselectedliabilities.TheCompanyishedgingagainstchangesincashflowsfromhighlyprobablefuturetransactionscausedbychangesinforeignexchangespotratesandotherpricechanges(arisingespeciallyfromthecombinationofcommodityandcurrencyrisk).Thechanges in thespotcomponentofcurrencyfinancialderivativesthatqualifyaseffectivecash-flowhedging instrumentsarerecognisedinothercomprehensive income.Thechanges intheforwardpointscomponentofcurrencyfinancialderivatives thatqualifyaseffectivecash-flowhedging instrumentsarerecognisedasagainorlossintheincomestatement.Thechangesinfairvalueofcommodityswapsthatqualifyaseffectivecash-flowhedginginstrumentsarerecognisedinothercomprehensiveincome.Thecumulativebalancesrecognisedinothercomprehensiveincomearerecycledintotheincomestate-mentasagainorlossintheperiodswhenthehedgeditemaffectstheincomestatement.Ifthetimingofthehedgedcashflowisdeferred,incompliancewithitshedgingstrategytheCompanyprolongsthematu-rityoftheoriginalhedginginstrument.Insuchcasethespotcomponentoftheoriginalderivativecontractisheldinequityuntilthehedgeditemaffectstheincomestatement.Atthismoment,thebalanceofthespotcomponentisrecycledfromothercomprehensiveincometotheincomestatementandrecognisedasagainorloss.Whenahedging instrumentexpiresor issold,orwhenahedgeno longermeetsthecriteria forhedgeaccounting,any cumulativegainor losspreviously recognised inother comprehensive income from theeffectivepartofthehedginginstrumentatthattimeremainsinothercomprehensiveincomeandisreclas-sifiedtoincomestatementwhentheforecasttransactionisultimatelyrecognisedintheincomestatement.Whenaforecasttransactionisnolongerexpectedtooccur,thecumulativegainorlossthatwasreportedinothercomprehensiveincomeisimmediatelytransferredtotheincomestatement.Thefairvalueoffinancialinstrumentsthatarenottradedinanactivemarketisdeterminedbyusingvalua-tiontechniques,suchasthenetpresentvalueoffuturecashflows.Thefairvalueofcurrencyforwardsandswapsisdeterminedasthepresentvalueoffuturecashflowsbasedonforwardexchangemarketratesasatthebalancesheetdate.ThefairvalueofcommodityswapsiscalculatedasthepresentvalueoffuturecashflowsbasedontheratesofLME(LondonMetalExchange).
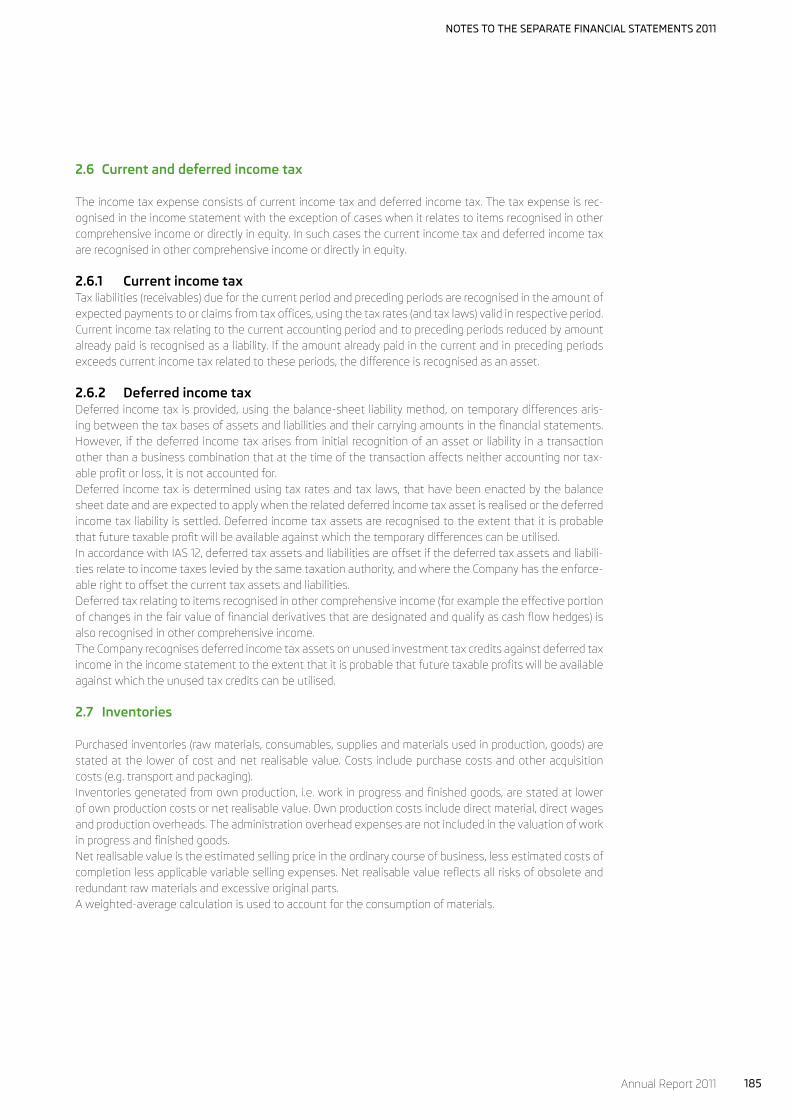
notes to the sepArAte finAnCiAl stAtements 2011
185Annual Report 2011
2.6 Current and deferred income tax
Theincometaxexpenseconsistsofcurrentincometaxanddeferredincometax.Thetaxexpenseisrec-ognisedintheincomestatementwiththeexceptionofcaseswhenitrelatestoitemsrecognisedinothercomprehensiveincomeordirectlyinequity.Insuchcasesthecurrentincometaxanddeferredincometaxarerecognisedinothercomprehensiveincomeordirectlyinequity.
2.6.1 Current income taxTaxliabilities(receivables)dueforthecurrentperiodandprecedingperiodsarerecognisedintheamountofexpectedpaymentstoorclaimsfromtaxoffices,usingthetaxrates(andtaxlaws)validinrespectiveperiod.Currentincometaxrelatingtothecurrentaccountingperiodandtoprecedingperiodsreducedbyamountalreadypaidisrecognisedasaliability.Iftheamountalreadypaidinthecurrentandinprecedingperiodsexceedscurrentincometaxrelatedtotheseperiods,thedifferenceisrecognisedasanasset.
2.6.2 Deferred income taxDeferredincometaxisprovided,usingthebalance-sheetliabilitymethod,ontemporarydifferencesaris-ingbetweenthetaxbasesofassetsandliabilitiesandtheircarryingamountsinthefinancialstatements.However, ifthedeferredincometaxarisesfrominitialrecognitionofanassetor liability inatransactionotherthanabusinesscombinationthatatthetimeofthetransactionaffectsneitheraccountingnortax-ableprofitorloss,itisnotaccountedfor.Deferredincometaxisdeterminedusingtaxratesandtaxlaws,thathavebeenenactedbythebalancesheetdateandareexpectedtoapplywhentherelateddeferredincometaxassetisrealisedorthedeferredincometaxliabilityissettled.Deferredincometaxassetsarerecognisedtotheextentthatitisprobablethatfuturetaxableprofitwillbeavailableagainstwhichthetemporarydifferencescanbeutilised.InaccordancewithIAS12,deferredtaxassetsandliabilitiesareoffsetifthedeferredtaxassetsandliabili-tiesrelatetoincometaxesleviedbythesametaxationauthority,andwheretheCompanyhastheenforce-ablerighttooffsetthecurrenttaxassetsandliabilities.Deferredtaxrelatingtoitemsrecognisedinothercomprehensiveincome(forexampletheeffectiveportionofchangesinthefairvalueoffinancialderivativesthataredesignatedandqualifyascashflowhedges)isalsorecognisedinothercomprehensiveincome.TheCompanyrecognisesdeferredincometaxassetsonunusedinvestmenttaxcreditsagainstdeferredtaxincomeintheincomestatementtotheextentthatitisprobablethatfuturetaxableprofitswillbeavailableagainstwhichtheunusedtaxcreditscanbeutilised.
2.7 Inventories
Purchasedinventories(rawmaterials,consumables,suppliesandmaterialsusedinproduction,goods)arestatedatthe lowerofcostandnetrealisablevalue.Costs includepurchasecostsandotheracquisitioncosts(e.g.transportandpackaging).Inventoriesgeneratedfromownproduction,i.e.workinprogressandfinishedgoods,arestatedatlowerofownproductioncostsornetrealisablevalue.Ownproductioncostsincludedirectmaterial,directwagesandproductionoverheads.Theadministrationoverheadexpensesarenotincludedinthevaluationofworkinprogressandfinishedgoods.Netrealisablevalueistheestimatedsellingpriceintheordinarycourseofbusiness,lessestimatedcostsofcompletionlessapplicablevariablesellingexpenses.Netrealisablevaluereflectsallrisksofobsoleteandredundantrawmaterialsandexcessiveoriginalparts.Aweighted-averagecalculationisusedtoaccountfortheconsumptionofmaterials.

notes to the sepArAte finAnCiAl stAtements 2011
186 Annual Report 2011
2.8 Provisions for long-term employee benefits
Thefollowingtypesoflong-termemployeebenefitsareincludedintheprovisionforlong-termemployeebenefits:– servicejubilee;– otherlong-servicebenefits.Theentitlementtothesebenefitsisusuallyconditionalontheemployeeremaininginserviceforacertainserviceperiodoruptothemomentofacertainworkanniversaryoftheemployee.Theamountofprovisioncorrespondswiththepresentvalueof the long-termemployeebenefits forpastserviceat thebalancesheetdatedeterminedusingtheprojectedunitcreditmethod.Theseobligationsarevaluedannuallybyindependentqualifiedactuaries.Actuarialgainsandlossesarisingfromchangesinactuarialassumptionsandexperienceadjustmentsarechargedorcreditedtotheincomestatement.Thepresentvalueofthelong-termemployeebenefitsisdeterminedbydiscountingtheestimatedfuturecashoutflowsarisingfromtheirsettlementusinginterestratesequallingmarketyieldoftreasurybondsbecausethereisnodeepmarketofhigh-qualitycorporatebondsdenominatedinCZK.Thetermandcur-rencyofthesecorporateortreasurybondsareconsistentwiththecurrencyandtermoftherespectiveotherlong-termemployeebenefits.
2.9 Other provisions
InaccordancewithIAS37,provisionsarerecognisedwhereapresentobligationexiststothirdpartiesasaresultofapastevent;whereafutureoutflowofresourcesisprobable;andwhereareliableestimateofthatoutflowcanbemade.Futureoutflowsareestimatedwithrespecttoparticularspecificrisks.Provisionsnotresultinginanoutflowofresourceswithinoneyeararerecognisedattheirsettlementvaluediscountedtothebalancesheetdate.Discountingisbasedoncurrentmarketinterestrates.Wherethereisanumberofsimilarobligations,thelikelihoodthatanoutflowoccursuponthesettlementisdeterminedbyconsideringtheclassofobligationsasawhole.Aprovisionisrecognisedevenifthelikeli-hoodofanoutflowwithrespecttoanyoneitemincludedinthesameclassofobligationsmaybesmall.
2.10 Revenue and expense recognition
Revenuecomprisesthefairvalueofconsiderationreceivedorreceivableforthegoodssoldandservicesprovided,netofvalue-addedtax,rebatesanddiscounts.Salesofgoodsarerecognisedonlywhenthegoodshavebeendelivered,thatis,whenthesignificantrisksandrewardshavepassedtothecustomer,thesalespriceisagreedordeterminableandreceiptofpaymentisprobable.ThiscorrespondsgenerallytothedatewhentheproductsareprovidedtodealersoutsidetheCompanyortothedeliverydateinthecaseofdirectsalestoconsumers.Therevenuesfromone-offlicencesarerecognisedincompliancewithrelevantcontractualprovisionsattimeoftransferofintellectualrightsalternativelyattimeofprovisionoftechnicaldocumentation,ortech-nicalsupport.Revenuesfromper-piecelicencesarerecognisedbasedonthenumberofcarsproducedinthecurrentaccountingperiod.Dividendincomeisgenerallyrecognisedonthedateatwhichthedividendislegallyapprovedandwhenthepaymentisprobable.Costsofsales includeproductioncosts, costsofgoodspurchased for resale,andadditions towarrantyprovisions.Researchanddevelopmentcostsnoteligibleforcapitalisationintheperiod,depreciationandimpairmentchargesforcapitaliseddevelopmentcostsandproductionequipmentarelikewisepresentedascostofsales.Distributionexpensesincludepersonnelandmaterialcosts,anddepreciationandamortisationapplicabletothedistributionfunction,aswellasthecostsofshipping,advertising,salespromotion,marketresearchandcustomerservice.Administrativeexpensesincludepersonnelcostsandoverheadsaswellasdepreciationandamortisationapplicabletoadministrativefunctions.Otheroperatingincomeincludesalsoincomefromreversalsofexcessprovisionsandaccruals.

notes to the sepArAte finAnCiAl stAtements 2011
187Annual Report 2011
2.11 Leases
Leasesinwhichasignificantportionoftherisksandrewardsofownershipareretainedbythelessorareclassifiedasoperatingleases.Paymentsmadeunderoperatingleasesarechargedtotheincomestate-mentonastraight-linebasisovertheperiodofthelease.
2.12 Investment incentives and subsidies
Subsidiesofentrepreneurialactivitiesandofemployeetrainingandretrainingcostsarerecognisedasin-comeovertheperiodsnecessarytomatchthemwiththerelatedcostswhichtheyareintendedtocom-pensate,onasystematicbasis.Governmentgrants,includingnon-monetarygrantsrelatedtothepurchaseof tangibleand intangibleassets,are recognisedat fair valueas reduction in thevalueof tangibleandintangibleassets.
2.13 Related parties
Arelatedpartyisapersonthathascontrolorjointcontroloverthereportingentity;hassignificantinfluenceoverthereportingentity;orismemberofthekeymanagementpersonnelofthereportingentityorofaparentofthereportingentity.ArelatedpartyisalsoanentitywhichisamemberofthesamegroupasthereportingentityandotherentitiesasdefinedbyIAS24article9par.b.
2.14 Share capital
Thesubstanceofafinancialinstrument,ratherthanitslegalform,governsitsclassificationintheCompany’sstatementoffinancialposition.Ordinarysharesareclassifiedassharecapital.TheCompanytypicallyincursvari-ouscostsinissuingoracquiringitsownequityinstruments.Thosecostsmightincluderegistrationandotherregulatoryfees,amountspaidto legal,accountingandotherprofessionaladvisers,printingcostsandstampduties.Thetransactioncostsofanequitytransactionareaccountedforasadeductionfromequity(netofanyrelatedincometaxbenefit)totheextenttheyareincrementalcostsdirectlyattributabletotheequitytransactionthatotherwisewouldhavebeenavoided.Thecostsofanequitytransactionthatisabandonedarerecognisedasanexpense.Sharepremiumisrepresentedbythedifferencebetweenthenominalvalueofsharesissuedonsharecapitalincreaseandthemarketpriceofsharesandisrecognisedwithinequity.
2.15 Critical accounting estimates and assumptions
TheCompanymakesestimatesandassumptionsconcerningthefuture.Theresultingaccountingestimateswill,bydefinition,seldomequaltherelatedactualresults.Theestimatesandassumptionsarecontinuouslyassessedbymanagement.Theestimatesandassumptionsarebasedonhistoricalexperienceandotherfactors, includingtherealisticassessmentoffuturedevelopments.Theestimatesandassumptionsthathaveasignificantriskofcausingamaterialadjustmenttothecarryingamountsofassetsand liabilitieswithinthenextfinancialyeararediscussedbelow.
Capitalisation of development costsTheCompanycontinuouslyinvestsinresearchanddevelopmentofnewproducts,whichareeitherdevel-opedinternallywithintheCompany’sresearchanddevelopmentcentreorwithintheVolkswagenGroup.IncompliancewithIAS38,foreachdevelopmentprojecttheCompanyperformsanassessmentwhethertheprojectmeetsthedevelopmentcostsrecognitioncriteria,especiallytheprobabilitythattheassetwillgeneratefutureeconomicbenefits.TheCompany’sassessmentisbasedonassumptionsandestimatesforthenextfiveandmoreyearswithrespecttotheproductsfuturesales,developmentoftheindividualmarketsandautomotiveindustryitself.AlthoughtheCompany’sanalysesarebasedonthebestcurrentlyavailable information, the riskof futurechangesanduncertaintywith respect to futuredevelopmentoftheassumptionsappliedremainsignificant.PleaserefertoNote5foradditionalinformationincludingtherespectiveamounts.

notes to the sepArAte finAnCiAl stAtements 2011
188 Annual Report 2011
Impairment of non-current assetsInthecourseoftheproductlifecycleandinexceptionalsituationsalsobeforeitscommencement,theremaybecircumstanceswhichindicatethat“cashgeneratingunits”(tangibleandintangibleassetsemployedforproductionofvehiclesofacertainmodel)mighthavesufferedimpairment.Todetermineanypossibleimpairment,theCompanyestimatesvalueinuseofthecashgeneratingunitswhichiscalculatedasdis-countedexpected futurecashflowsassociatedwith theemploymentof thecashgeneratingunits.Fordeterminationoftheestimatedfuturecashflows,theCompanyappliesestimatesandassumptionsregard-ingfuturesalesofaparticularproduct,economicdevelopmentoftheindividualmarketsanddevelopmentof the automotive industry during the next five andmore years. Although the Company estimates thevalueinuseofthecashgeneratingunitsbasedonthebestinformationanddatacurrentlyavailabletotheCompany,theriskoffuturechangesanduncertaintywithrespecttothefuturedevelopmentoftheappliedassumptionsinthefollowingyearsremainssignificant.MoredetailedinformationaboutimpairmentlossesisincludedinNote5andNote6inthesectionImpairmentreviews.
Provision for warranty claims TheCompanyrecognisesprovisionsforwarrantyclaimsforfutureexpensesconnectedwiththebasicguar-antee (2years),withtheguaranteeforcorrosion (dependentonthemodelfor10or12years)andotherguaranteesbeyondthescopeofbasicguarantee,especiallygood-willrepairs(the3rdandthe4thyear).TheCompanyrecognisestheprovisionsforwarrantyclaimsatthemomentofsaleonthebasisofthenumberofsoldcarsandinadvancedeterminedratesforindividualmodelline.Theamountoftherateforthebasicguaranteeisdeterminedonthebasisofamanagementestimateoftheaveragenumberoffailuresintheguaranteeperiodandaveragesinglefailurecostswithregardtothespecificsofindividualcountriesandonthebasisofotherspecificassumptions(inflation,customersgroupsdevelopment,etc.).Theamountoftheprovisionforcorrosionisdeterminedthroughamathematicalmodelwhichextrapolatesthecurveoffuturecostsdevelopmentfortherelevantperiodonthebasisofweightedaverageofactualcostsfrompreviouscalendaryearsofthemodelproduction.Theamountoftheprovisionforgood-willrepairsisdeterminedonthebasisofamanagementestimateofexistinggood-willrepaircostsanddefinedstrategyofthegood-willrepairtrademarkpolicywithregardtospecificsofindividualcountries.Theestimatesoftheratesarecontinuouslyrevisedwiththeuseofthemostrecenthistoricaldataaboutthenumberoffailuresandtheirrepair-costs.Changesintheseestimatescansignificantlyinfluencetheto-talamountoftheprovision.Thedetailedanalysisoftheprovisionaccordingtothesingletypes,productionyears,guaranteetypesandthesalesregionsispreparedattheyearend.
Provision for litigation risksCertaineventsrelatingtotheeconomicactivitiesoftheCompanymightresultindisputesresolvedincourtandout-of-courtproceedings.Theriskthatfuturecashoutflowswillberequiredtosettletheclaim(dam-ages,courtfeesetc.) isassessedbytheCompanyonceitbecomesinvolvedinanycourtorout-of-courtproceedings.TheriskisassessedbasedonCompany’sexperiencewithsimilarlegalactions,reflectingthelatestdevelopmentsintheproceedings.Aprovisionisrecognisedifitismorelikelythannotthatanoutflowofeconomicbenefitsoccursinthefuture.Theprovisionismeasuredbasedonthebestestimateoftheexpectedfuturecashoutflows.PleaserefertoNote16foradditionalinformation.
Useful livesTheestimatedusefullivesofindividualtangibleandintangibleassetsorclassesofassetsaredeterminedbasedontheCompany’sexperiencewithsimilarassetsandinaccordancewiththeexpectedfutureeco-nomicbenefitsoftheassets,takingintoaccountalsochangesinproductionplanandexpectedutilisationoftheseassets.

notes to the sepArAte finAnCiAl stAtements 2011
189Annual Report 2011
3. Financial risk management TheCompanyoperatesintheautomotiveindustry,sellsitsproductsinmanycountriesaroundtheworldandperformstransactionsconnectedwithavarietyoffinancialrisks.TheobjectiveoftheCompanyistominimisetheserisksthroughapplicationofflexiblehedgingstrategywithutilisationofvariousinstruments.ThestructureofriskmanagementintheCompanyisbasedonunifiedprincipleofriskmanagementappliedintheVolkswagenGroup.TheVolkswagenGroup’sriskmanagementprinciplesareincompliancewithre-quirementsofGermanActonControlandTransparencyinEnterprises(KonTraG).Incompliancewith theVolkswagenGrouppolicyallhedgingoperationsareagreedand implemented incooperationwiththeTreasurydepartmentoftheVolkswagenGroup.ManagementoftheCompanyisregularlyinformedofthecurrentfinancialandotherrelatedrisks(liquidity,foreignexchangerates,interestrates,invoicecurrencies,paymentconditions,taxesetc.),whichisachievedthroughregular“liquiditymeeting”attendedbyrepresentativesfromTreasury,ControllingandAccounting,VolkswagenGroupTreasury,representativesofsubsidiariesandmanagementofCommercialaffairsdepart-ment.Thesemeetingshavepredefinedagenda,whichincludesalsoinformationonmainmacroeconomicindicatorsfromallimportantcountries,inwhichtheCompanysellsitsproducts.Meetingshaveaformalisedstructureandallminutesincludingthedecisionsarerecordedandtheirfulfilmentisperiodicallyreviewed.
3.1 Credit risk
Creditriskisariskthatonepartytoafinancialinstrumentwillcauseafinanciallosstootherpartybyfailingtodischargeanobligation.CreditriskarisesinthenormalcourseoftheCompany’soperations,aswellasthroughactivitiesconnectedwithfinancialmarkettransactions(moneymarket,currencyconversion,derivativestransactions,etc.).CreditriskarisingfromoperationsonthefinancialmarketismanagedbytheCompanyTreasurythroughdetermi-nationofmaximallimitsforindividualcounterparties.Thequantificationofcreditrisksisbasedonseveraldifferentprimarycriteria,ofwhichthemostsignificantarethecountryriskandthecounterpartyrisk.Inassessingtheserisks,attentionispaidtothecountryinwhichtheheadquartersofthecounterpartiesaresituated.Thecreditratingofthesecountriesismonitoredcloselyandattentionisfocusedontheanalysisofmac-roeconomicindices.ApartfromtheVolkswagenGroup’sRiskManagementDepartment,theCompanyalsousestheservicesofexternalagencies(D&B,Creditreform,Reuters,etc.).Theacceptanceofnewbusinesspartnersisreliantonstandardapprovalprocedures.TheCompany’sin-volvementwithcounterpartiesismanagedbymeansofcreditlimitsthataremonitoredandre-evaluatedonaregularbasis.Adheringtotheselimitsismonitoredandevaluatedonaregularbasis.Activeadministrationandmanagementofreceivablesisincorporatedintothecreditriskmanagementpro-cess.Inrespectofthetradereceivablessecuritystrategy,tradereceivablesaredividedintoreceivablesfromdomesticcustomers,foreigncustomers,VolkswagenGroupentities.Receivablesaresecuredbypreventa-tiveandsupplementalinstruments.Receivablesaresecuredbypreventativesecurityinstrumentsusedmainlywhenthecustomercontractsareconcluded.Interestondefaultpaymentsisincorporatedinthewrittencontractsasanobligatoryse-curityinstrument.Selectedtradereceivablesaresecuredbyanownershiptitleuntilfullsettlementofthepurchaseprice.TradereceivablesfromVolkswagenGroupcompaniesandfromassociatesareconsideredtobeartheleastrisk.Thereforethesuppliesofgoodsareperformedwithpaymentatmaturity,orthesuppliesarecoveredbypaymentinadvance,orthereceivablesaretransferredtoafactorthroughfactoring.Trade receivables fromcustomers located abroad include receivables fromgeneral importers andothercustomers.Thereceivablesfromgeneralimportersaresecuredbythefollowinginstruments:paymentsinadvance,lettersofcredit,documentarycollection,bankguarantees,standbylettersofcreditandtransferofreceivablestofactoring.Theimmaterialpartofreceivablesfromothercustomersarisesonsuppliesrealisedwithsettlementatmaturity.Receivablesfromdomesticcustomersaredividedintotwogroups:receivablesfromcontractualpartnersboundbysalesorserviceagreements,andfromotherdomesticcustomers.Thereceivablesarisingfromsalesofnewandusedvehiclestocontractualpartnersaretransferredtofactoring.Creditlimitsaresetupforthesuppliesofnewandusedvehicles,originalpartsandaccessories.Thedeliveriesofgoodsareauto-

notes to the sepArAte finAnCiAl stAtements 2011
190 Annual Report 2011
maticallyblockedincasethecustomerfailstosettleoutstandingbalancesonmaturityanduponthesetlimitisexceeded.Theimmaterialpartofsuppliestootherdomesticcustomersisrealisedwithsettlementatmaturity.Differentcombinationsofthefollowinginstrumentsareusedasanadditionalsecurityofhigh-riskreceiva-bles:acknowledgementsofdebt,paymentschedules,billsofexchange,pledges,orexecutorynote.Loanstoemployeesaresecuredbyotheremployeeguarantees.Asat31December2011(asat31December2010)theCompanydidnotholdanypledgestosecureloans.
3.1.1 Maximum exposure to credit risk (CZK million)Themaximumexposuretocreditrisk incaseofactivitiesconnectedtobusinessoperations,grantingofloans,suppliercreditsprovidedtocustomersandbankdepositsiscalculatedasthegrosscarryingamountoftheabovementionedfinancialassetslessanyimpairmentprovisions.Theexposuretocreditriskofderivativesismeasuredatfairvalueofthederivative.
Carrying amount as at 31 December 2011
Non-impaired financial assets
not yet due
Non-impaired financial assets
past dueImpaired
financial assets Total
Loans to employees 542 - - 542
Deposits in companies within Volkswagen Group 44,848 - - 44,848
Positive fair value of financial derivatives 1,851 - - 1,851
Others 238 - - 238
Trade receivables 11,025 670 - 11,695
Cash 796 - - 796
Total 59,300 670 - 59,970
Carrying amount as at 31 December 2010
Non-impaired financial assets
not yet due
Non-impaired financial assets
past dueImpaired
financial assets Total
Loans to employees 491 - - 491
Deposits in companies within Volkswagen Group 34,378 - - 34,378
Positive fair value of financial derivatives 2,498 - - 2,498
Others 98 - - 98
Trade receivables 8,593 1,131 - 9,724
Cash 4,894 - - 4,894
Total 50,952 1,131 - 52,083
The LineDeposits in VolkswagenGroup companies includes depositswith originalmaturity from threemonthstooneyearintotalamountofCZK21,539million(asat31December2010:CZK10,016million)in-cludedinbalancesheetintheLineOtherreceivablesandfinancialassets(seeNote9),anddepositswithoriginalmaturitylessthanthreemonthsintotalamountofCZK23,309million(asat31December2010:CZK24,362million)includedinbalancesheetintheLineCashandcashequivalents(seeNote11).

notes to the sepArAte finAnCiAl stAtements 2011
191Annual Report 2011
Inthefollowingtable,thereportedfiguresrepresenteitherbookvalueofsecuredtradereceivables,orthesecuredamountofthetradereceivablesifthisamountislower,determinedindividuallyforeachinstrument:
CZK million 2011 2010
Retention of legal ownership title to sold inventories 2,336 1,439
Bank guarantees 837 972
Letters of credit 1,230 1,154
Documentary collection 235 201
Payment in advance - 170
Accepted deposit 19 15
Total 4,657 3,951
3.1.2 Risk concentrationTheCompanymonitorsconcentrationofcreditriskbydistributionregionsandbythedenominationcur-rency.Thesensitivityof theCompany to foreignexchange risk isdisclosed inNote3.4.1.During theac-countingperiod2011(2010)theCompanydidnotidentifyanysignificantriskconcentrationonthebasisofdistributionregion.A significant portion of financial assets is of an intra-group nature. The Company deposited free cashthroughintraGroupcompanies(asin2010).Thetotalvolumeofshort-termdepositswithintra-groupcom-paniesamountedtoCZK45,571millionasat31December2011(asat31December2010:CZK39,173million),outofwhich:– depositswithoriginalmaturityfromthreemonthstooneyearincludedinbalancesheetintheLineOtherreceivablesandfinancialassets(seeNote9) intotalamountofCZK21,539million(asat31December2010:CZK10,016million),
– depositswithoriginalmaturitylessthanthreemonthsincludedinbalancesheetintheLineCashandcashequivalents(seeNote11)intotalamountofCZK23,309million(asat31December2010:CZK24,362million),and
– overnightdepositsfromcashpoolingincludedinbalancesheetintheLineCashandcashequivalents(seeNote11)intotalamountofCZK723million(asat31December2010:CZK4,795million).
In2011(2010)theCompanydidnotconsideritprobablethatadefaultcouldoccurinconnectionwiththefreecashdeposited.Possibleriskofunpaidreceivablesfromthirdpartieswasindividuallynotsignificant(spreadbetweenvariousdebtorsandregions).

notes to the sepArAte finAnCiAl stAtements 2011
192 Annual Report 2011
3.1.3 Credit quality of financial assets neither past due nor impaired (CZK million)TheCompanyusesthefollowingcriteriawhensettingratingsoffinancialassetsthatareneitherpastduenorimpaired.Solvencyclass1includesreceivables,loanstorelatedparties,securedreceivablesfromthirdpartiesandreceivablesthatwillbesubjecttofactoringwithoutrecourse.Thereisnoobjectiveevidenceindicatingimpairmentofthesereceivables.Solvencyclass2includesunsecuredtradereceivablesfromthirdpartiesforwhichthereisnoobjectiveevidenceindicatingimpairment(receivablesfromdealerswithoutriskandreceivablesfromdealerswithscheduleofpayments).
Solvency class 1 Solvency class 2 Total
Balance as at 31 December 2011
Loans to employees 542 - 542
Deposits in companies within Volkswagen Group 44,848 - 44,848
Positive fair value of financial derivatives 1,851 - 1,851
Other receivables and financial assets 238 - 238
Trade receivables 10,600 425 11,025
Cash 796 - 796
Total 58,875 425 59,300
Solvency class 1 Solvency class 2 Total
Balance as at 31 December 2010
Loans to employees 491 - 491
Deposits in companies within Volkswagen Group 34,378 - 34,378
Positive fair value of financial derivatives 2,498 - 2,498
Other receivables and financial assets 98 - 98
Trade receivables 8,292 301 8,593
Cash 4,894 - 4,894
Total 50,651 301 50,952
3.1.4 Carrying amount of financial assets past due and not impaired (CZK million)
Months past due
Less than 1 month 1 – 3 months More than 3 months Total
Trade receivables
Balance as at 31 December 2011 303 91 276 670
Balance as at 31 December 2010 645 399 87 1,131
Receivablesmorethan3monthspastduearerepresentedmainlybyreceivablesfromVolkswagengroupcompanies.TheCompanydidnotidentifyanyneedforimpairmentofthesereceivables.Outofthetotalamountofreceivablesfromgroupcompanieswhichwerepastdueasat31December2010(CZK1,120mil-lion),CZK24millionwerestillnotpaidasat31December2011.

notes to the sepArAte finAnCiAl stAtements 2011
193Annual Report 2011
3.1.5 Valuation allowance for receivables and other financial assets (CZK million)Impairmentstatusanddevelopmentofotherreceivablesandtradereceivableshasbeenanalysedasfollows:
2011 2010
Other receivables and financial assets
Gross balance as at 31 December 152 155
Valuation allowance:
Balance as at 1 January (155) (158)
Additions - -
Utilised - -
Released 3 3
Balance as at 31 December (152) (155)
Net balance as at 31 December - -
Trade receivables
Gross balance as at 31 December 211 223
Valuation allowance:
Balance as at 1 January (223) (285)
Additions (15) (14)
Utilised 13 19
Released 14 57
Balance as at 31 December (211) (223)
Net balance as at 31 December - -
Duringtheaccountingperiod2011(2010)theCompanyhadvaluationallowancesonindividualfinancialas-setsonlyforwhichadefaultriskwasidentified.Duringtheaccountingperiod2011(2010)theCompanyhadvaluationallowancesonlyonfinancialassetsincludedinthecategoryofloansandreceivables.
3.2 Liquidity risk
Liquidityriskisariskthatanentitywillencounterdifficultyinmeetingobligationsassociatedwithfinancialliabilities.Theobjectiveofliquidityriskmanagementistoensurethebalancebetweenthefundingofoperatingac-tivitiesandfinancialflexibilityinordertoensurethatallclaimsoftheCompanysuppliersandcreditorsaresettledtimely.Managementof theCompanymonitors the liquidity and itsdevelopmentat the regularmonthlymeet-ings,socalled“liquiditymeetings”,attendedbytherepresentativesofTreasury,ControllingandAccountingdepartments.Thepredeterminedagendagenerally includesthe informationaboutdailydevelopmentofliquidityanditsstructure.TheCompanymanagementisalsopresentedwiththeshort-termforecastsoftheliquiditydevelopment.
Cash managementSince2010,whentheCompanywas integrated intothe“GlobalTreasuryPlatform”ofVolkswagenGroup(GTP)whichisoperatedbyVolkswagenGroupServices(VGS)locatedinBrussels,centralisationandopti-malisationofprocessesisensuredwithintheVolkswagenGroupintheareasofcashmanagement,pay-mentssystemandliquiditymanagement.TheGTPimplementationresultedinchangesinthesystemofoutgoingandincomingpayments.Theout-goingpaymentsareprocessedonbehalfoftheCompanybyVGS,basedonpaymentordersplacedbytheCompanyandaretransferredfromabankaccountheldbyVGS.The incomingpaymentsarecreditedtoCompany’sbankaccountsandsubsequentlyattheendofeach

notes to the sepArAte finAnCiAl stAtements 2011
194 Annual Report 2011
working day they are automatically transferred to VGS’ bank accounts (master account). Terms of suchtransactionsaredefinedwithinthecashpoolingconceptagreeduponbetweentheCompany,thebankandVGS.AllincomingpaymentsaretranslatedintoCzechcrownsandcreditedtotheCompany’sbankaccountatthe“InhouseBank”(IHC)operatedbyVGS,wherethedifferencesbetweendebitandcreditbalancesonthecollectedfinancialresourcesarenetted-off.Majorinstrumentsusedtomaintainsufficientliquidityresourcesarerepresentedbyshort-termandlong-termfinancial plans, coordinationof free liquiditymanagementwithin theGTP, active cooperationwithbanks(creditlines)andmonitoringofthesituationatmoneymarketandcapitalmarket.SufficientresourcesofliquidityareensuredmainlythroughresourcesfromotherVolkswagenGroupcompaniesintegratedintotheGTPand,toalimitedextent,throughcreditlinesarrangedwithexternalbanks.Thetotalamountofcreditlinesfrombanksasat31December2011wasCZK8,440million(asat31Decem-ber2010:CZK10,618million).AllcreditlinesarecontractedinCzechcrowns.TheCompanyhasnotutilisedanyagreedbankcreditlinesasat31December2011(asat31December2010:CZK0).ThecreditlinefromtheVolkswagenGroupinthetotalamountofCZK3,000millionwasdrawninthewholeamountasat31December2011(asat31December2010).
Contractual maturity analysis (undiscounted amounts in Czk million)
Less than 3 months 3 – 12 months 1 – 5 years
Longer than 5 years Total
Balance as at 31 December 2011
Cash 796 - - - 796
Deposits in companies within Volkswagen Group 39,382 5,516 - - 44,898
Other receivables and financial assets (except derivatives) 210 134 364 94 802
Trade receivables 11,301 394 - - 11,695
Financial liabilities (138) - (3,276) - (3,414)
Trade payables (23,074) (569) (115) - (23,758)
Derivatives with positive fair value:
Currency forwards and swaps
Inflow of financial resources 4,305 20,500 13,912 - 38,717
Outflow of financial resources (4,125) (19,567) (13,292) - (36,984)
Commodity swaps 5 10 92 - 107
Derivatives with negative fair value:
Currency forwards and swaps
Inflow of financial resources 11,642 26,496 65,514 - 103,652
Outflow of financial resources (12,419) (28,534) (70,891) - (111,844)
Commodity swaps (14) (48) (102) - (164)
Total 27,871 4,332 (7,794) 94 24,503

notes to the sepArAte finAnCiAl stAtements 2011
195Annual Report 2011
Contractual maturity analysis (undiscounted amounts in Czk million)
Less than 3 months 3 – 12 months 1 – 5 years
Longer than 5 years Total
Balance as at 31 December 2010
Cash 4,894 - - - 4,894
Deposits in companies within Volkswagen Group 24,388 10,052 - - 34,440
Other receivables and financial assets (except derivatives) 50 143 319 79 591
Trade receivables 9,300 424 - - 9,724
Financial liabilities (138) - (3,414) - (3,552)
Trade payables (19,405) (2,580) - - (21,985)
Derivatives with positive fair value:
Currency forwards and swaps
Inflow of financial resources 7,878 21,987 33,893 - 63,758
Outflow of financial resources (7,577) (21,063) (33,128) - (61,768)
Commodity swaps 25 71 269 - 365
Derivatives with negative fair value:
Currency forwards and swaps
Inflow of financial resources 4,663 13,730 30,446 - 48,839
Outflow of financial resources (4,932) (14,423) (31,775) - (51,130)
Total 19,146 8,341 (3,390) 79 24,176
3.3 Market risk
Marketriskisariskthatthefairvalueoffuturecashflowsoffinancialinstrumentswillfluctuatebecauseofchangesinmarketprices.Marketriskincludesthreetypesofrisks:currencyrisk,interestrateriskandpricerisk.Developmentsonthefinancialmarketsareconsideredtobethemostsignificantriskfactor,especiallythefluctuationofexchangerates.
3.3.1 Currency riskCurrencyriskisariskthatthefairvalueoffuturecashflowsoffinancialinstrumentswillfluctuatebecauseofchangesinforeignexchangerates.ThefluctuationofexchangeratesrepresentssignificantriskinthattheCompanysellsitsproducts,andpur-chasesmaterial,partsandservicesconcurrentlyinvariousforeigncurrencies.TheCompanyactivelymanagesthisriskthroughcontinuallyupdatedmarketanalysis,worldwideprocurementofmaterialandequipmentandproductionofitsproductsinthesalesregions.StandardderivativehedginginstrumentsareusedbytheCom-panytomanagethecurrencyrisk.Theriskexposure,asdeterminedbytheanalysisofincomeandexpensestructuresbyforeigncurrency,ishedgedonthebasisofexpectedfutureforeigncurrencycashflows.Forwardexchangecontractsandcurrencyswapsareusedashedginginstrumentsforeliminationofcur-rencyrisk.Thebasicparametersofthehedgingpolicyaredefinedbythehedgingdirectivevalidfortheen-tireVolkswagenGroup,whichincludesalsothelistofpermittedfinancialproducts(derivatives).ContractsareconcludedupontheCompany’srequestandinitsnamebytheTreasuryDepartmentoftheVolkswagenGroup.TheriskresultingfromchangesinexchangeratesagainstCZKishedgedforatotalof11currencies.ThemostimportanttradingcurrenciesareUSD,EUR,GBP,CHF,PLNandRUB.TheCompanyapplieshedgeaccountingforcurrencyrisk.FortheanalysisofsensitivitytoexchangeratespleaserefertoNote3.4.1.

notes to the sepArAte finAnCiAl stAtements 2011
196 Annual Report 2011
3.3.2 Interest rate riskInterestrateriskisariskthatthefairvalueoffuturecashflowsofafinancialinstrumentwillfluctuatebe-causeofchangesinmarketinterestrates.Theobjectiveof the interest rate riskmanagement is to eliminate the risk arising fromfluctuationsofinterestratesoffinancialliabilitieswithfloatinginterestratesbymaintaininganappropriatestructureoffinancialliabilities.ThemanagementoftheCompanymonitorstheinterestrateriskattheregularmonthlymeetingsattendedbytherepresentativesofTreasury,ControllingandAccountingdepartments.Thepredeterminedagendagenerallyincludesthefollowing—informationaboutcurrentdevelopmentofinterbankinterestrates(es-peciallyPRIBOR,EURIBORandLIBOR)and informationaboutcentralbanks’ interestrates intheregionswheretheCompanyoperates.TheCompanymanagementisalsopresentedwiththeshort-termforecastsoftheinterestratesdevelopment.TheexposuretointerestrateriskarisesfromcashdepositsatVolkswagenGroupcompanies.Fortheanalysisofsensitivitytointerestrates,pleaserefertoNote3.4.2.
3.3.3 Price riskPriceriskisariskthatthefairvalueoffuturecashflowsfromthefinancialinstrumentswillfluctuatebe-causeofchangesinmarketprices,especiallycommodityprices(apartfromthatwhichresultfromcurrencyandinterestrisk).Duetothecontinuousvolatilityinthepricesoftherawmaterialcommoditiesandlimitedaccessibilitytospecificcommodities,managementhasaimedtoeliminatethese risks throughtarget riskmanagementstrategies.Inthisregard,utilisationofalternativeproductionmaterialsandproceduresaswellasutilisationofrecycledmaterialisbeingexamined.Inaddition,emphasisisplacedonextendingtheinternationalsupplychaininco-operationwiththeVolkswagenGroup.Highriskcommoditiesincludeprimarilyaluminium,cop-per,palladium,lead,platinumandrhodium.ThosecommoditiesidentifiedashighriskarecontrolledattheVolkswagenGrouplevelthroughthelong-termsupplycontractswiththesuppliers.In2011(2010),theCompanywashedgingagainstpricerisksingeneral(asaconsequenceofchangesinpar-ticularcommoditypricesandforeignexchangerates)throughcommodityswaps(forcopperandaluminium)andcurrencyforwards.Thosefinancialderivativesaresubjecttohedgeaccounting—hedgingoffuturecashflows.TheCompanyhadin2011(2010)nosignificanttradingderivatives.

notes to the sepArAte finAnCiAl stAtements 2011
197Annual Report 2011
3.3.4 Derivative financial instruments
Nominal and fair value of derivatives (Czk million)
Nominal value of derivatives Fair value of derivatives
Balance as at 31 December 2011
Balance as at 31 December 2010
Balance as at 31 December 2011
Balance as at 31 December 2010
With positive
fair value
With negative fair value
With positive
fair value
With negative fair value Positive Negative Positive Negative
Currency instruments
Currency forwards - cash flow hedging 36,895 107,628 60,303 48,837 1,696 6,493 2,045 2,231
Currency swaps - cash flow hedging 1,632 4,193 1,709 2,076 50 277 94 113
Commodity instruments
Commodity swaps - cash flow hedging 1,243 1,468 1,475 - 105 160 359 -
Total 39,770 113,289 63,487 50,913 1,851 6,930 2,498 2,344
Thefairvaluesoffinancialderivativesfulfilthecriteriaoflevel2incompliancewiththeIFRS7hierarchy(thefairvaluesarederivedfrommarketquotationsofforwardexchangerates,commoditypricesandyieldcurves,howeverthefinancialderivativesarenotdirectlytradedonactivefinancialmarkets).
Volume of hedged cash flows (Czk million)
Balance as at 31 December 2011 Volume of hedged cash flows
Within 1 year 1 – 5 years Total
Currency risk exposure
Hedging of future cash flows - future receivables 49,167 70,354 119,521
Hedging of future cash flows - future liabilities (15,289) (10,596) (25,885)
Other price risks (combination of commodity and currency risks)
Hedging of future cash flows - future liabilities (609) (1,921) (2,530)
Total 33,269 57,837 91,106
Balance as at 31 December 2010 Volume of hedged cash flows
Within 1 year 1 – 5 years Total
Currency risk exposure
Hedging of future cash flows - future receivables 33,295 51,404 84,699
Hedging of future cash flows - future liabilities (14,209) (12,517) (26,726)
Other price risks (combination of commodity and currency risks)
Hedging of future cash flows - future liabilities (490) (1,077) (1,567)
Total 18,596 37,810 56,406
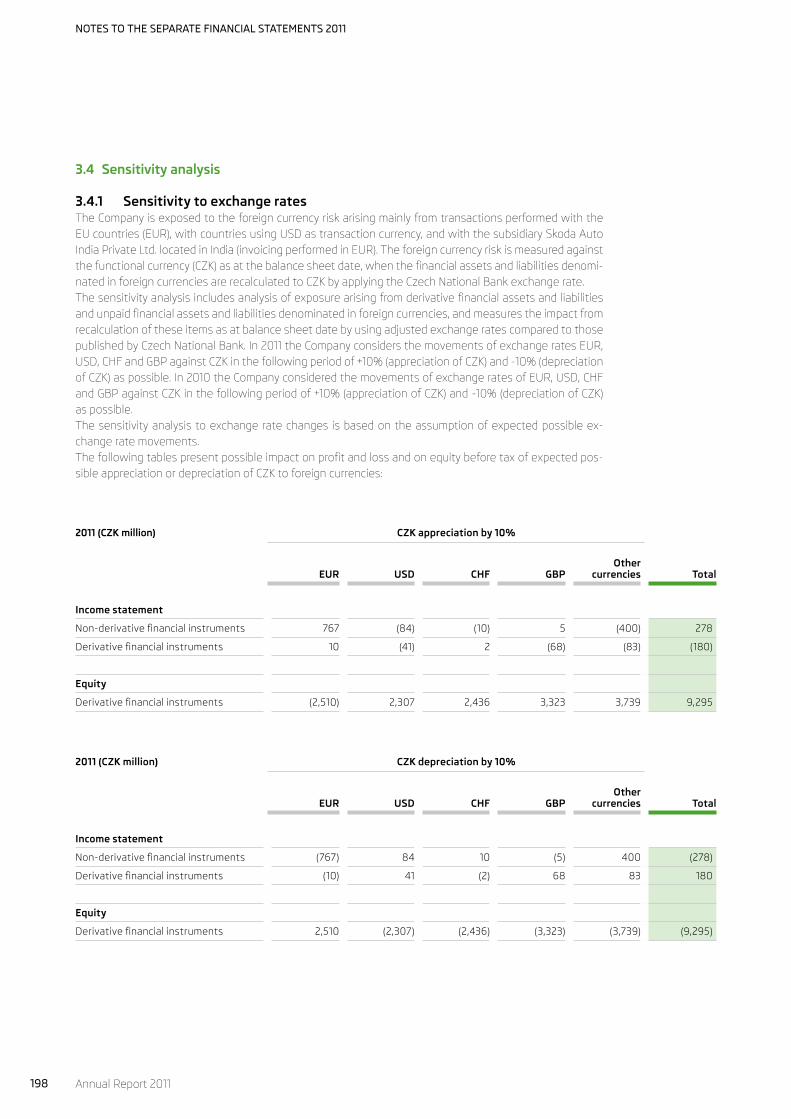
notes to the sepArAte finAnCiAl stAtements 2011
198 Annual Report 2011
3.4 Sensitivity analysis
3.4.1 Sensitivity to exchange ratesTheCompanyisexposedtotheforeigncurrencyriskarisingmainlyfromtransactionsperformedwiththeEUcountries(EUR),withcountriesusingUSDastransactioncurrency,andwiththesubsidiarySkodaAutoIndiaPrivateLtd.locatedinIndia(invoicingperformedinEUR).Theforeigncurrencyriskismeasuredagainstthefunctionalcurrency(CZK)asatthebalancesheetdate,whenthefinancialassetsandliabilitiesdenomi-natedinforeigncurrenciesarerecalculatedtoCZKbyapplyingtheCzechNationalBankexchangerate.Thesensitivityanalysisincludesanalysisofexposurearisingfromderivativefinancialassetsandliabilitiesandunpaidfinancialassetsandliabilitiesdenominatedinforeigncurrencies,andmeasurestheimpactfromrecalculationoftheseitemsasatbalancesheetdatebyusingadjustedexchangeratescomparedtothosepublishedbyCzechNationalBank.In2011theCompanyconsidersthemovementsofexchangeratesEUR,USD,CHFandGBPagainstCZKinthefollowingperiodof+10%(appreciationofCZK)and-10%(depreciationofCZK)aspossible.In2010theCompanyconsideredthemovementsofexchangeratesofEUR,USD,CHFandGBPagainstCZKinthefollowingperiodof+10%(appreciationofCZK)and-10%(depreciationofCZK)aspossible.Thesensitivityanalysistoexchangeratechanges isbasedontheassumptionofexpectedpossibleex-changeratemovements.Thefollowingtablespresentpossibleimpactonprofitandlossandonequitybeforetaxofexpectedpos-sibleappreciationordepreciationofCZKtoforeigncurrencies:
2011 (CZK million) CZK appreciation by 10%
EUR USD CHF GBPOther
currencies Total
Income statement
Non-derivative financial instruments 767 (84) (10) 5 (400) 278
Derivative financial instruments 10 (41) 2 (68) (83) (180)
Equity
Derivative financial instruments (2,510) 2,307 2,436 3,323 3,739 9,295
2011 (CZK million) CZK depreciation by 10%
EUR USD CHF GBPOther
currencies Total
Income statement
Non-derivative financial instruments (767) 84 10 (5) 400 (278)
Derivative financial instruments (10) 41 (2) 68 83 180
Equity
Derivative financial instruments 2,510 (2,307) (2,436) (3,323) (3,739) (9,295)

notes to the sepArAte finAnCiAl stAtements 2011
199Annual Report 2011
2010 (CZK million) CZK appreciation by 10%
EUR USD CHF GBPOther
currencies Total
Income statement
Non-derivative financial instruments 995 (105) - - (272) 618
Derivative financial instruments 45 (39) (14) (75) (72) (155)
Equity
Derivative financial instruments (2,608) 1,598 1,700 2,270 2,658 5,618
2010 (CZK million) CZK depreciation by 10%
EUR USD CHF GBPOther
currencies Total
Income statement
Non-derivative financial instruments (995) 105 - - 272 (618)
Derivative financial instruments (45) 39 14 75 72 155
Equity
Derivative financial instruments 2,608 (1,598) (1,700) (2,270) (2,658) (5,618)
3.4.2 Sensitivity to interest ratesTheCompanyisexposedtointerestriskmainlyinrelationtoshort-termdepositsprovidedtoVolkswagenCompanycompanies.Theanalysisofsensitivitytochangesininterestrateswasbasedonexposuretoderivativefinancialassetsandliabilitiesasatbalancesheetdateinthesamewayasforthenon-derivativefinancialassets.In2011 theCompanyassumespossiblemovementsof theyield curve in the followingperiod for loans,bankdepositsandcurrencyforwardsandswapsby+100/-25basispoints.(In2010,theCompanyassumedforbondsandinterestrateswapspossiblemovementsoftheyieldcurveinthefollowingperiodforloansandbankdepositsby+100/-25basispoints).TheCompanyismostsensitivetomovementsoftheCZKyieldcurve.Inthecaseofderivativefinancialinstruments,theCompanymeasurestheimpactonthechangeinfairvalueofthesederivativesthatresultsfromthechangeintheyieldcurve.Fornon-derivativefinancialinstruments,theimpactonprofitandlossisdeterminedonthebasisofdefinedchangeintheinterestrate,whichwouldariseatthebeginningofthenextaccountingperiodandbasedontheassumptionthatnootherchangesintheinterestratewouldoccurduringtheentireaccountingperiod.

notes to the sepArAte finAnCiAl stAtements 2011
200 Annual Report 2011
Thefollowingtablespresentpossibleimpactonprofitandlossandonequitybeforetaxofexpectedin-creaseordecreaseofinterestrates:
2011 (CZK million) Interest rate increased by
100 basis points
Interest rate decreased by
25 basis points
Income statement
Non-derivative financial instruments 454 (114)
Derivative financial instruments 91 (23)
Total 545 (137)
Equity
Derivative financial instruments - -
2010 (CZK million) Interest rate increased by
100 basis points
Interest rate decreased by
25 basis points
Income statement
Non-derivative financial instruments 348 (87)
Derivative financial instruments - -
Total 348 (87)
Equity
Derivative financial instruments (7) 2
3.4.3 Sensitivity to changes in other price risksTheCompany isexposedtoacombinationofcommodityandcurrencyrisksduetovolatility inpricesofparticularcommoditiestradedinforeigncurrencies.Thisriskofchangeincashflowsishedgedbyacombi-nationofcommodityswapsandcurrencyforwards.Thesensitivityanalysistochangesincommoditypriceswasdeterminedbasedontheexposuretoderivativefinancialassetsandliabilitiesasatthebalancesheetdate.In2011(2010)theCompanyassumespotentialmovementsinaluminiumpricesinthefollowingperiodof+/-10%. In2011, theCompanyassumespotentialmovements incopperprices in the followingperiodof+/-20%.TheCompanyconsiderschanges in thefairvaluesofderivativefinancial instrumentsduetochangesinspotcommodityprices.Othernon-derivativefinancialassetsandliabilitiesaredeemedtonotbesensitivetochangesincommoditypricessincethepricesarefixedatthetimeofrecognitionofthefinancialliabilityorasset.

notes to the sepArAte finAnCiAl stAtements 2011
201Annual Report 2011
Thefollowingtablesrepresentapossibleimpactonequitybeforetaxofexpectedincreaseordecreaseofcopperandaluminiumprices:
2011 (CZK million) Increase of copper prices +20%
Decrease of copper prices (20)%
Increase of aluminium prices +10%
Decrease of aluminium prices (10)%
Equity
Derivative financial instruments 270 (270) 120 (120)
2010 (CZK million) Increase of copper prices +20%
Decrease of copper prices (20)%
Increase of aluminium prices +10%
Decrease of aluminium prices (10)%
Equity
Derivative financial instruments 130 (130) 110 (110)
ThepossibleimpactonincomestatementwasassessedbytheCompanyasimmaterial.
3.5 Capital risk management
TheoptimalcapitalisationoftheCompanyistheresultofacompromisebetweentwointerests:returnoncapitalandtheCompany’scapacitytomeetallofitsliabilitiesdueforpayment.ItistheobjectiveofthecapitalmanagementfunctiontomaintainanadequateownedtoborrowedcapitalratiotoguaranteeduepaymentsofallfinancialliabilitieswhilepromotingacontinuedgrowthoftheCom-pany’svaluefortheshareholders.Theratiosofequityandofborrowedcapitalontotalcapitalareshowninthefollowingtable:
CZK million 2011 2010
Equity 80,407 75,682
Equity ratio 59.3% 61.9%
Non-current financial liabilities 3,000 3,000
Current financial liabilities 107 107
Total financial liabilities 3,107 3,107
Ratio of financial liabilities to total liabilities 2.3% 2.5%
Total equity and liabilities 135,571 122,267

notes to the sepArAte finAnCiAl stAtements 2011
202 Annual Report 2011
4. Geographical informationTheCompany’sheadofficeandmainproductionfacilitiesaresituatedintheCzechRepublic.TheCompany’ssalesaregenerated fromfivebasicgeographical regions: theCzechRepublic;Germany;WesternEurope-Other;CentralandEasternEurope;andOverseas/Asia/Africa/Australia.Overseas/Asia/Af-rica/AustraliaregionisduetoitsimmaterialityreportedasUnallocated.InregionsWesternEurope-Other,CentralandEasternEuropeandincategoryUnallocated,thereisnoindividualcountryhasmorethana10%shareoftotalsales.
2011 (CZK million)Czech
Republic Germany
Western Europe -
Other
Central and Eastern Europe Unallocated Total
Sales - based on location of customers 22,084 55,579 83,877 45,274 24,928 231,742
Non-current assets* 59,457 198 - 1,872 - 61,527
2010 (CZK million)Czech
Republic Germany
Western Europe -
Other
Central and Eastern Europe Unallocated Total
Sales - based on location of customers 21,842 47,675 75,449 38,066 20,663 203,695
Non-current assets* 54,893 198 - 1,872 1,141 58,104
* Non-current assets other than financial instruments and deferred tax assets.
5. Intangible assets (CZK million)
Capitalised development costs
for products currently in use
Capitalised development costs for products under
developmentOther intangible
assets Total
Costs
Balance as at 1 January 2011 24,577 2,143 6,600 33,320
Additions 22 3,284 1,877 5,183
Disposals (2,931) - (288) (3,219)
Transfers 42 (42) - -
Balance as at 31 December 2011 21,710 5,385 8,189 35,284
Cumulative amortisation and impairment losses
Balance as at 1 January 2011 (16,228) - (4,240) (20,468)
Amortisation (2,314) - (434) (2,748)
Impairment losses (758) - (998) (1,756)
Disposals and transfers 2,931 - 288 3,219
Balance as at 31 December 2011 (16,369) - (5,384) (21,753)
Carrying amount as at 31 December 2011 5,341 5,385 2,805 13,531

notes to the sepArAte finAnCiAl stAtements 2011
203Annual Report 2011
Capitalised development costs
for products currently in use
Capitalised development costs for products under
developmentOther intangible
assets Total
Costs
Balance as at 1 January 2010 22,489 1,138 4,933 28,560
Additions 950 2,143 1,713 4,806
Disposals - - (46) (46)
Transfers 1,138 (1,138) - -
Balance as at 31 December 2010 24,577 2,143 6,600 33,320
Cumulative amortisation and impairment losses
Balance as at 1 January 2010 (12,570) - (3,023) (15,593)
Amortisation (2,932) - (590) (3,522)
Impairment losses (726) - (672) (1,398)
Disposals and transfers - - 45 45
Balance as at 31 December 2010 (16,228) - (4,240) (20,468)
Carrying amount as at 31 December 2010 8,349 2,143 2,360 12,852
Otherintangibleassetsincludemainlytoolingrights,softwareandsoftwarelicences.AmortisationandimpairmentlossesofintangibleassetsofCZK4,365million(2010:CZK4,777million)areincludedinthecostofsales,CZK13million(CZK2010:13million)indistributionexpenses,andCZK126million(2010:CZK130million)inadministrativeexpenses.
Impairment reviewsTherequirementsofIAS1,IAS10andIAS36havebeenassessedbytheCompany’smanagementinrelationtothedecreaseinplannedcashinflowsregardingparticularŠKODAmodelsandtheirpotentialimpactonthecarryingamountoftheCompany‘snon-currentintangibleassets.Duetosubstantialchangesinthemarketenvironment,theCompanyhasexperiencedin2011asignificantdecreaseintheplannedcashinflowsrelatingtothreecash-generatingunits(productionofcarsofcertainmodels).Impairmentreviewsofassetsrelatingtothosecash-generatingunitshavebeenperformed.Thecarryingamountsoftheassetsrelatingtothecash-generatingunitshavebeencomparedwiththerelevantrecoverableamounts.Therecoverableamountshavebeendeterminedbasedonthecalculationofthevalueinuseapplyingcashflowprojectionsoverthelifecycleofthecash-generatingunitsreflectingfinancialplans,approvedbytheCompany’smanagement.Fordiscountingcashflows,thediscountrateof6.8%hasbeenapplied in2011 (2010:6.4%),reflectingthespecificrisksassociatedwiththesectorinwhichtheCompanyoperates.Fortwocash-generatingunits,thecomparisonofthecarryingamountswiththerelevantrecoverableamountsresultedinanimpairmentlossallocatedtointangibleassetsintheamountofCZK1,756million(2010:CZK1,398million),whichhasbeenpostedtotheincomestatement(withinlineCostofsales)fortheyearended31December2011(31December2010).

notes to the sepArAte finAnCiAl stAtements 2011
204 Annual Report 2011
Capitalisation of borrowing costs Forthecapitalisationofborrowingcostsin2011,theCompanyappliedthecapitalisationrateof4.5%(2010:3.8%).Noborrowingcostshavebeencapitalisedinthecostof intangibleassets in2011or2010astheywerenotsignificant.
The following amounts were recognised in the income statement as research and development expenses (Czk million)
2011 2010
Research and non-capitalised development costs 6,061 4,564
Amortisation and impairment losses of development costs 3,072 3,658
Research and development costs recognised in the income statement 9,133 8,222
6. Property, plant and equipment (CZK million)
Land and buildings
Technical equipment and
machineryTooling, office and
other equipment
Payments on account and assets under construction Total
Costs
Balance as at 1 January 2011 29,680 58,432 45,427 7,433 140,972
Additions 941 1,468 917 8,697 12,023
Disposals (64) (1,913) (1,337) (1) (3,315)
Transfers 454 2,784 603 (3,841) -
Balance as at 31 December 2011 31,011 60,771 45,610 12,288 149,680
Cumulative depreciation and impairment losses
Balance as at 1 January 2011 (11,931) (49,591) (37,938) - (99,460)
Amortisation (1,098) (3,106) (3,400) - (7,604)
Impairment losses (7) (18) (468) - (493)
Disposals and transfers 26 1,915 1,333 - 3,274
Balance as at 31 December 2011 (13,010) (50,800) (40,473) - (104,283)
Carrying amount as at 31 December 2011 18,001 9,971 5,137 12,288 45,397

notes to the sepArAte finAnCiAl stAtements 2011
205Annual Report 2011
Land and buildings
Technical equipment and
machineryTooling, office and
other equipment
Payments on account and assets under construction Total
Costs
Balance as at 1 January 2010 29,299 60,332 44,939 3,539 138,109
Additions 197 873 1,385 5,839 8,294
Disposals (45) (3,680) (1,706) - (5,431)
Transfers 229 907 809 (1,945) -
Balance as at 31 December 2010 29,680 58,432 45,427 7,433 140,972
Cumulative depreciation and impairment losses
Balance as at 1 January 2010 (10,521) (49,773) (35,274) - (95,568)
Amortisation (1,073) (3,297) (3,793) - (8,163)
Impairment losses (358) (177) (549) - (1,084)
Disposals and transfers 21 3,656 1,678 - 5,355
Balance as at 31 December 2010 (11,931) (49,591) (37,938) - (99,460)
Carrying amount as at 31 December 2010 17,749 8,841 7,489 7,433 41,512
DepreciationandimpairmentlossesofthebuildingsandequipmentofCZK7,444million(2010:CZK8,725million)areincludedinthecostofsales,CZK160million(2010:CZK100million)indistributionexpenses,andCZK493million(2010:CZK422million)inadministrativeexpenses.
Impairment reviewsTherequirementsofIAS1,IAS10andIAS36havebeenassessedbytheCompany’smanagementinrelationtothedecreaseinplannedcashinflowsregardingparticularŠKODAmodelsanditspotentialimpactonthecarryingamountoftheCompany‘snon-currenttangibleassets.Duetosubstantialchangesinthemarketenvironment,theCompanyhasexperiencedin2011asignificantdecreaseintheplannedcashinflowsre-latingtotwocash-generatingunits (productionofcarsofcertainmodels). Impairmentreviewsofassetsrelatingtothosecash-generatingunitshavebeenperformed.Thecarryingamountsoftheassetsrelatingtothecash-generatingunitshavebeencomparedwiththerelevantrecoverableamounts.Therecoverableamountshavebeendeterminedbasedonthecalculationofthevalueinuseapplyingcashflowprojectionsoverthelifecycleofthecash-generatingunitsreflectingfinancialplans,approvedbytheCompany’smanagement.Fordiscountingcashflows,thediscountrateof6.8%hasbeenappliedin2011(2010:6.4%),reflectingthespecific risksassociatedwith thesector inwhich theCompanyoperates.Foronecash-generatingunit,thecomparisonofthecarryingamountswiththerelevantrecoverableamountsresultedinanimpairmentlossallocatedtotangibleassetsintheamountofCZK493million(2010:CZK1,084million),whichhasbeenpostedtotheincomestatement(withinlineCostofsales)fortheyearended31December2011(31Decem-ber2010).
Capitalisation of borrowing costs Forthecapitalisationofborrowingcostsin2011,theCompanyappliedthecapitalisationrateof4.5%(2010:3.8%).Noborrowingcostshavebeencapitalisedinthecostofproperty,plantandequipmentin2011orin2010astheywerenotsignificant.

notes to the sepArAte finAnCiAl stAtements 2011
206 Annual Report 2011
7. Investments in subsidiaries
Country of incorporation Shareholding %
Subsidiaries:
ŠKODA AUTO Deutschland GmbH Germany 100
ŠKODA AUTO Slovensko, s.r.o. Slovakia 100
Skoda Auto Polska S.A. Poland 51
Skoda Auto India Private Ltd. India 100
ThesubsidiariesinwhichtheCompanyhasafinancial investmentpaiddividendstotheCompanyintheamountofCZK263million(2010:CZK598million).
Impairment reviews TherequirementsoftheIAS1,IAS10andIAS36standardswereassessedbytheCompany’smanagementinrelationtothedevelopmentoftheautomotiveindustryandplannedvolumesofsoldcarsandthepoten-tialimpactsonthecarryingamountoftheCompany’sfinancialinvestmentsinsubsidiaries.TheCompany’smanagementhasperformedanimpairmentreviewofthecash-generatingunit,forwhichthedevelopmentoftheautomotiveindustryandplannedvolumesofsoldcarsindicatedapossibleimpairmentloss.Carry-ingvalueofthefinancial investmentinthesubsidiaryhasbeencomparedwiththerelevantrecoverableamount.Therecoverableamounthasbeendeterminedbasedonthecalculationofthevalueinuseapply-ingcashflowprojectionsoverthefollowingfiveyears,reflectingfinancialplansapprovedbytheCompany’smanagement.Cashflowsbeyondthefiveyearsperiodhavebeenextrapolatedwithestimatedgrowthratewhichisnothigherthanexpectedlong-termaveragegrowthrateintheautomotiveindustry.Fordeterminationofthevalueinuseofthefinancialinvestmentin2011(2010),estimatedgrowthrateof1%hasbeenapplied.Theapplieddiscountrateispre-taxandreflectsspecificrisksassociatedwiththesectorandtheregioninwhichthereviewedcompanyoperates.In2011,discountrateof7.3%(2010:7.1%)hasbeenapplied.Foronecash-generatingunit,thecomparisonofthecarryingamountwiththerelevantrecoverableamountresultedinanimpairmentlossintheamountofCZK1,141million(2010:CZK0million),whichhasbeenpostedtotheincomestatement(withinlineFinancialexpensefortheyearended31December2011).
8. Investments in associates (CZK million)
2011 2010
Total Assets 52,911 45,480
Total Liabilities 49,623 43,728
Total Revenue 121,296 74,165
Profit (+)/ Loss (-) (aggregated) 1,600 (1,743)
The table above summarises financial data of the associates OOO VOLKSWAGEN Group Rus and ŠKO-ENERGOFIN,s.r.o.TheCompany’sshareintheregisteredcapitalofthecompanyOOOVOLKSWAGENGroupRusasat31De-cember2011was16.8%(31December2010: 16.8%).TheCompany’sshareofprofitsor lossesof thisas-sociateasat31December2011was17.91%(31December2010:17.91%).TheCompanyexercisessignificant

notes to the sepArAte finAnCiAl stAtements 2011
207Annual Report 2011
influenceinthecompanyOOOVOLKSWAGENGroupRusbasedonthefollowingfactors:theCompanyhasitsrepresentativesinthegoverningbody;theCompanyisparticipatinginpolicy-makingprocesses,includ-ingparticipationindecisionsaboutdistributionofprofit;materialtransactionsareconductedbetweenbothcompanies;aninterchangeofmanagerialpersonneltakesplacesbetweenbothcompaniesandtheCom-panyisprovidingessentialtechnicalinformationtothecompanyOOOVOLKSWAGENGroupRus.Asat1October2010,theCompanyacquiredadditionalshareintheregisteredcapitalofŠKO-ENERGOFIN,s.r.o.from10%to31.25%andasaresultŠKO-ENERGOFINs.r.o.becametheCompany’sassociate.ThevalueoftheCompany’ssharetotalledCZK529millionasat31December2011(asat31December2010:CZK529million).ŠKO-ENERGOFINpaiddividendstotheCompanyintheamountofCZK104million(2010:CZK71million).
Impairment reviews The requirementsof the IAS 1, IAS 10and IAS36standardswereassessedby theCompany’smanage-mentinrelationtothedevelopmentoftheautomotiveindustryandplannedvolumesofsoldcarsandthepotentialimpactsonthecarryingamountoftheCompany’sfinancialinvestmentsinassociates.Basedonanalysesperformed,nofactorshavebeenidentifiedwhichwouldindicateaneedtorecogniseimpairmentlosseswithanexceptionoffutureeconomicbenefitsarisingfrominvestmentinOOOVOLKSWAGENGroupRus,associateaccountedforusingtheequityaccounting.TheCompany’smanagementhasthereforeper-formedanimpairmentreviewofthiscash-generatingunit.Carryingvalueofthefinancialinvestmentintheassociatehasbeencomparedwiththerelevantrecoverableamount.Therecoverableamounthasbeende-terminedbasedonthecalculationofthevalueinuseapplyingcashflowprojectionsoverthefollowingfiveyears,reflectingfinancialplansapprovedbytheCompany’smanagement.Cashflowsbeyondthefiveyearsperiodhavebeenextrapolatedwithestimatedgrowthratewhichisnothigherthanexpectedlong-termaveragegrowthrateintheautomotiveindustry.Theapplieddiscountrateispost-taxandreflectsspecificrisksassociatedwiththesectorandtheregioninwhichthereviewedcompanyoperates.In2011,discountrateof9.5%(2010:9.3%)hasbeenapplied.Thecomparisonofthecarryingamountswiththerelevantre-coverableamounthasnotgivenrisetoanyimpairmentlossasat31December2011or31December2010.

notes to the sepArAte finAnCiAl stAtements 2011
208 Annual Report 2011
9. Other non-current and current receivables, financial assets and trade receivables (CZK million)
Balance as at 31 December 2011 Financial assets at fair
value through profit or
loss**Loans and
receivables
Available for sale
financial assets
Financial assets
designated as hedging
instruments Other* Total
Other receivables and financial assets
Loans to employees - 542 - - - 542
Deposits in companies within Volkswagen Group - 21,539 - - - 21,539
Positive fair value of financial derivatives (242) - - 2,093 - 1,851
Available for sale financial assets - - 4 - - 4
Tax receivables (excl. income tax) - - - - 3,574 3,574
Others - 238 - - 297 535
Total (242) 22,319 4 2,093 3,871 28,045
Trade receivables
Third parties - 2,773 - - - 2,773
Subsidiaries - 955 - - - 955
Other related parties - 7,967 - - - 7,967
Total - 11,695 - - - 11,695
* The category Other does not meet a definition of financial instruments in terms of IAS 32.** Financial assets held for trading.
Note:The line Positive fair value of financial derivatives in the portfolio Financial assets designated as hedging instruments is represented by the spot component of finan-cial derivatives and in the portfolio Financial assets at fair value through profit and loss it is represented by the forward component of financial derivatives (see also Note 2.5.3). As the spot component exceeded the fair value as at 31 December 2011, the forward component was negative.

notes to the sepArAte finAnCiAl stAtements 2011
209Annual Report 2011
Balance as at 31 December 2010 Financial assets at fair
value through profit or
loss**Loans and
receivables
Available for sale
financial assets
Financial assets
designated as hedging
instruments Other* Total
Other receivables and financial assets
Loans to employees - 491 - - - 491
Deposits in companies within Volkswagen Group - 10,016 - - - 10,016
Positive fair value of financial derivatives (191) - - 2,689 - 2,498
Available for sale financial assets - - 4 - - 4
Tax receivables (excl. income tax) - - - - 2,834 2,834
Others - 98 - - 235 333
Total (191) 10,605 4 2,689 3,069 16,176
Trade receivables
Third parties - 2,442 - - - 2,442
Subsidiaries - 1,446 - - - 1,446
Other related parties - 5,836 - - - 5,836
Total - 9,724 - - - 9,724
* The category Other does not meet a definition of financial instruments in terms of IAS 32.** Financial assets held for trading.
Note:The line Positive fair value of financial derivatives in the portfolio Financial assets designated as hedging instruments is represented by the spot component of finan-cial derivatives and in the portfolio Financial assets at fair value through profit and loss it is represented by the forward component of financial derivatives (see also Note 2.5.3). As the spot component exceeded the fair value as at 31 December 2011, the forward component was negative.
Thecarryingamountofloanstoemployeesapproximatestheirfairvalue.Thecarryingamountnetofim-pairmentforeachclassoffinancialassetswhicharenotcarriedatfairvalueapproximatestheirfairvalueduetotheshort-termnatureoftheseitems.TheitemDepositsincompanieswithinVolkswagenGroupcomprisesdepositsintheamountofCZK21,539million(asat31December2010:CZK10,016million)withoriginalmaturityfromthreemonthstooneyear.TheweightedaverageeffectiveinterestratebasedonthecarryingamountofdepositsprovidedtoVolkswagenGroupcompaniesasat31December2011was0.88%(31December2010:1.03%).AlldepositsprovidedtoVolkswagenGroupcompanieswithoriginalmaturityfromthreemonthstooneyeararedenominatedinCZKasat31December2011(asat31December2010).LineOthersinotherreceivablesandfinancialassetsincludemainlyotherreceivablesfromemployeesandadvancespaid.Therearenosignificantrestrictionsregardingtherightsofuseimposedontheotherre-ceivablesandfinancialassets.Cumulativeimpairmentlossesreflecttheincurredrisksofthedebtors’delaysordefaults.TheallowancefortheimpairmentoftradereceivablesofCZK211million(2010:CZK223million)hasbeendeductedfromthepresentedcarryingvaluesoftradereceivables.Duetotheirshorttermnaturethecarryingamountoftradereceivablesapproximatesthefairvalueasatthebalancesheetdateafterthevaluationallowanceistakenintoaccount.
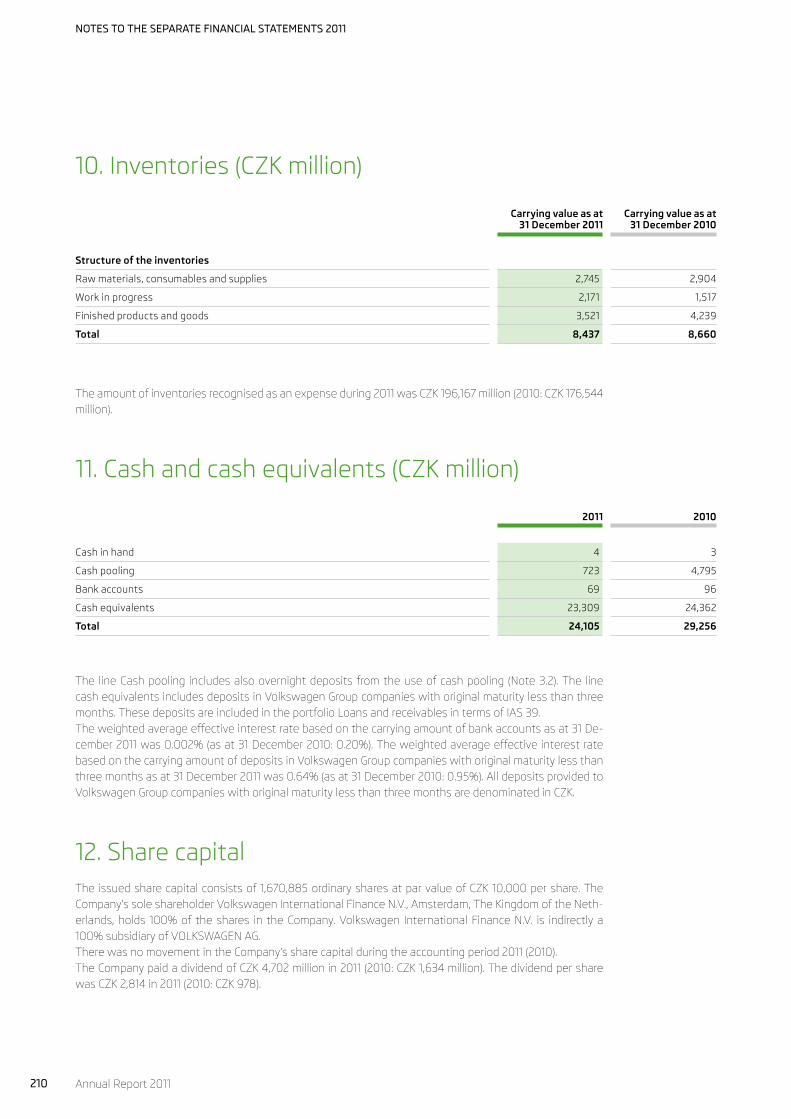
notes to the sepArAte finAnCiAl stAtements 2011
210 Annual Report 2011
10. Inventories (CZK million)
Carrying value as at 31 December 2011
Carrying value as at 31 December 2010
Structure of the inventories
Raw materials, consumables and supplies 2,745 2,904
Work in progress 2,171 1,517
Finished products and goods 3,521 4,239
Total 8,437 8,660
Theamountofinventoriesrecognisedasanexpenseduring2011wasCZK196,167million(2010:CZK176,544million).
11. Cash and cash equivalents (CZK million)
2011 2010
Cash in hand 4 3
Cash pooling 723 4,795
Bank accounts 69 96
Cash equivalents 23,309 24,362
Total 24,105 29,256
The lineCashpooling includesalsoovernightdepositsfromtheuseofcashpooling (Note3.2).The linecashequivalentsincludesdepositsinVolkswagenGroupcompanieswithoriginalmaturitylessthanthreemonths.ThesedepositsareincludedintheportfolioLoansandreceivablesintermsofIAS39.Theweightedaverageeffectiveinterestratebasedonthecarryingamountofbankaccountsasat31De-cember2011was0.002%(asat31December2010:0.20%).TheweightedaverageeffectiveinterestratebasedonthecarryingamountofdepositsinVolkswagenGroupcompanieswithoriginalmaturitylessthanthreemonthsasat31December2011was0.64%(asat31December2010:0.95%).AlldepositsprovidedtoVolkswagenGroupcompanieswithoriginalmaturitylessthanthreemonthsaredenominatedinCZK.
12. Share capitalTheissuedsharecapitalconsistsof1,670,885ordinarysharesatparvalueofCZK10,000pershare.TheCompany’ssoleshareholderVolkswagenInternationalFinanceN.V.,Amsterdam,TheKingdomoftheNeth-erlands,holds 100%of theshares in theCompany.Volkswagen InternationalFinanceN.V. is indirectlya100%subsidiaryofVOLKSWAGENAG.TherewasnomovementintheCompany’ssharecapitalduringtheaccountingperiod2011(2010).TheCompanypaidadividendofCZK4,702millionin2011(2010:CZK1,634million).ThedividendpersharewasCZK2,814in2011(2010:CZK978).

notes to the sepArAte finAnCiAl stAtements 2011
211Annual Report 2011
13. Reserves (CZK million)
2011 2010
Reserves for cash flow hedges* (4,546) 315
Statutory reserve fund 3,366 3,366
Funds contributed by owner 10 10
Retained earnings 63,290 53,704
Total 62,120 57,395
* Net of deferred tax from financial derivatives.
Thestatutoryreservefundmaybeusedonlytooffsetlosses.Accordingtorelevantregulationsofthecom-mercialcodeoftheCzechRepublic,theCompanyisrequiredtotransfer5%ofitsannualnetprofittothestatutoryreservefunduntilthebalanceofthisreservereaches20%ofthesubscribedcapital.Incompliancewiththerelevantregulationsofthecommercialcode,theunconsolidatedprofitoftheCom-panyfortheyear2011(determinedinaccordancewithIFRS)isgoingtobeappropriatedbasedonthedeci-sionoftheCompany’sannualgeneralmeeting.Movementinreserveforcashflowhedges:
Balance as at 1 January 2011 (CZK million) 315
Total change in fair value in the period (4,543)
Deferred tax on change in fair value 875
Total transfers to net profit in the period - effective hedging (1,481)
Total transfers to net profit in the period - ineffective hedging 8
Deferred tax on transfers to net profit 280
Balance as at 31 December 2011 (4,546)
Balance as at 1 January 2010 (CZK million) 922
Total change in fair value in the period (692)
Deferred tax on change in fair value 130
Total transfers to net profit in the period - effective hedging 5
Total transfers to net profit in the period - ineffective hedging (61)
Deferred tax on transfers to net profit 11
Balance as at 31 December 2010 315
Thetransferfromreservesforcashflowhedgestoprofitandlossarisingfromeffectivehedgingisin2011presentedinthelineOtheroperatingexpenseinamountofCZK1,074million(2010:CZK1,100million,in2010thisamountincludedalsoeffectivehedginglossofCZK59milliondisclosedinfinancialresult)andinthelineOtheroperatingincomeinamountofCZK2,555million(2010:CZK1,095million).

notes to the sepArAte finAnCiAl stAtements 2011
212 Annual Report 2011
14. Financial, other and trade liabilities (CZK million)
Balance as at 31 December 2011 Financial liabilities at fair
value through profit or loss**
Financial liabilities carried at
amortised costs
Financial liabili-ties designated
as hedging instruments Other* Total
Financial liabilities
Loans - 3,107 - - 3,107
Total - 3,107 - - 3,107
Other liabilities
Negative fair value of financial derivatives (742) - 7,672 - 6,930
Liabilities to employees - - - 1,679 1,679
Social security - - - 429 429
Others - - - 603 603
Total (742) - 7,672 2,711 9,641
Trade liabilities
Third parties - 15,905 - 222 16,127
Subsidiaries - 825 - 433 1,258
Other related parties - 7,028 - 53 7,081
Total - 23,758 - 708 24,466
* The category Other includes items that are not financial liabilities in terms of IAS 32.** Financial liabilities held for trading.
Note:The line Negative fair value of financial derivatives in the portfolio Financial liabilities designated as hedging instruments is represented by the spot component of financial derivatives and in the portfolio Financial liabilities at fair value through profit or loss it is represented by the forward component of financial derivatives (see also Note 2.5.3). As the spot component exceeded the fair value as at 31 December 2011, the forward component is negative.

notes to the sepArAte finAnCiAl stAtements 2011
213Annual Report 2011
Balance as at 31 December 2010 Financial liabilities at fair
value through profit or loss**
Financial liabilities carried at
amortised costs
Financial liabili-ties designated
as hedging instruments Other* Total
Financial liabilities
Loans - 3,107 - - 3,107
Total - 3,107 - - 3,107
Other liabilities
Negative fair value of financial derivatives 26 - 2,318 - 2,344
Liabilities to employees - - - 2,167 2,167
Social security - - - 389 389
Others - - - 279 279
Total 26 - 2,318 2,835 5,179
Trade liabilities
Third parties - 15,405 - 330 15,735
Subsidiaries - 1,237 - 455 1,692
Other related parties - 5,344 - 58 5,402
Total - 21,986 - 843 22,829
* The category Other includes items that are not financial liabilities in terms of IAS 32.** Financial liabilities held for trading.
Note:The line Negative fair value of financial derivatives in the portfolio Financial liabilities designated as hedging instruments is represented by the spot component of financial derivatives and in the portfolio Financial liabilities at fair value through profit and loss it is represented by the forward component of financial derivatives (see also Note 2.5.3)
Theline“Tradeliabilitiestootherrelatedparties”includesliabilitiestoafactoringcompanywithintheVolk-swagenGroupofCZK1,138millionasat31December2011(2010:CZK1,118million).TheseliabilitiesaroseintheordinarycourseofbusinessanddonotrepresentfinancingoftheCompany.Thedetailed informationrelatingtothe liabilitiesarisingoutoffinancialderivativescanbefoundunderNote3.3.4.Thecarryingvalueforotherclassesoffinancialliabilities(tradepayablesandloans)approximatesthefairvalueinallmaterialrespects.Noneofthefinancialliabilitiesaresecuredbyalien.

notes to the sepArAte finAnCiAl stAtements 2011
214 Annual Report 2011
In the tablebelow, thefinancial conditionsattached to loans receivedaresummarisedat their carryingamounts:
Carrying amount as at 31 December 2011 Weighted average
effective interest
rate based on nominal
amount
Maturity
Currency
Interest terms
Interest commitment
endingNominal amount < 1 year 1-5 years > 5 years Total
CZK fixed 1-5 years 4.53% 3,000 107 3,000 - 3,107
Total financial liabilities 3,000 107 3,000 - 3,107
Carrying amount as at 31 December 2010 Weighted average
effective interest
rate based on nominal
amount
Maturity
Currency
Interest terms
Interest commitment
endingNominal amount < 1 year 1-5 years > 5 years Total
CZK fixed 1-5 years 4.53% 3,000 107 3,000 - 3,107
Total financial liabilities 3,000 107 3,000 - 3,107
15. Deferred tax liabilities and assets (CZK million)Deferredincometaxassetsandliabilitiesareoffsetwhenthereisalegallyenforceablerighttooffsetthecurrenttaxassetsagainstcurrenttaxliabilities,andwhenthedeferredincometaxesrelatetothesamefiscalauthority.Asat31December2011theCompanyrecognisedonthebalancesheetdeferredtaxassetofCZK1,762mil-lion(2010:deferredtaxliabilityCZK347million).Themovementsindeferredtaxassetsandliabilitiesduringtheyear,withouttakingintoconsiderationtheoffsetting,areasfollows:
DepreciationFinancial
derivatives*
Provisions, Valuation
allowances Other Total
Deferred tax liabilities
Balance as at 1 January 2010 (3,187) (227) - - (3,414)
Credited/(debited) to the income statement 405 - - - 405
Charged to other comprehensive income - 141 - - 141
Balance as at 31 December 2010 (2,782) (86) - - (2,868)
Credited/(debited) to the income statement 102 - - - 102
Charged to other comprehensive income - 86 - - 86
Balance as at 31 December 2011 (2,680) - - - (2,680)
* Further information on financial derivatives is disclosed in Note 2.5.3.

notes to the sepArAte finAnCiAl stAtements 2011
215Annual Report 2011
DepreciationFinancial
derivatives*
Provisions, Valuation
allowances Other Total
Deferred tax assets
Balance as at 1 January 2010 - - 2,167 472 2,639
Credited/(debited) to the income statement - - 487 89 576
Charged to other comprehensive income - - - - -
Balance as at 31 December 2010 - - 2,654 561 3,215
Credited/(debited) to the income statement - - 282 (124) 158
Charged to other comprehensive income - 1,069 - - 1,069
Balance as at 31 December 2011 - 1,069 2,936 437 4,442
* Further information on financial derivatives is disclosed in Note 2.5.3.
16. Non-current and current provisions (CZK million)
Provisions for
warranty claims
Provisions for other
obligations arising
from sales
Provisions for
personnel costs
Provisions for the
disposal of end-of-life
vehicles
Provisions for
litigation risks
Provisions for
purchase risks
Other provisions Total
Balance as at 1 January 2010 7,807 921 1,202 317 958 284 16 11,505
Utilised (2,119) (861) (434) - - (159) (16) (3,589)
Additions 3,160 1,037 756 - 391 760 1,059 7,163
Interest expense (+)/income (-) 74 - - (4) - - - 70
Reversals (542) (60) (20) (94) - (101) - (817)
Balance as at 1 January 2011 8,380 1,037 1,504 219 1,349 784 1,059 14,332
Utilised (2,393) (991) (391) - (1) (161) (478) (4,415)
Additions 3,344 1,346 1,655 - 61 719 1,082 8,207
Interest expense (+)/income (-) 147 - - - - - - 147
Reversals (142) (46) (190) (195) (176) (611) (145) (1,505)
Balance as at 31 December 2011 9,336 1,346 2,578 24 1,233 731 1,518 16,766

notes to the sepArAte finAnCiAl stAtements 2011
216 Annual Report 2011
Non-currentandcurrentprovisionsaccordingtothetimeofexpecteduseofresources:
< 1 year 1-5 years > 5 years Total
Balance as at 31 December 2011
Provisions for warranty claims 2,974 5,369 993 9,336
Provisions for other obligations arising from sales 1,346 - - 1,346
Provisions for personnel costs 1,603 291 684 2,578
Provisions for the disposal of end-of-life vehicles - - 24 24
Provisions for litigation risks 1,233 - - 1,233
Provisions for purchase risks 731 - - 731
Other provisions 1,518 - - 1,518
Total 9,405 5,660 1,701 16,766
< 1 year 1-5 years > 5 years Total
Balance as at 31 December 2010
Provisions for warranty claims 3,194 4,496 690 8,380
Provisions for other obligations arising from sales 1,037 - - 1,037
Provisions for personnel costs 605 292 607 1,504
Provisions for the disposal of end-of-life vehicles - - 219 219
Provisions for litigation risks 1,349 - - 1,349
Provisions for purchase risks 784 - - 784
Other provisions 1,059 - - 1,059
Total 8,028 4,788 1,516 14,332
Theprovisionforwarrantyrepairsincludesprovisionsforbasicguarantees(2years),provisionsforcorro-sionguarantees(dependentonthemodelfor10or12years)andotherguaranteesbeyondthescopeofbasicwarranty(twoyears)especiallygood-willrepairs(the3rdand4thyear).TheCompanyrecognisestheprovisionforwarrantyclaimsatthemomentofsaleonthebasisofthenumberofsoldcarsandinadvancedeterminedratesforindividualmodelline.Provisionsforotherobligationsarisingfromsales includeprovisionforsalediscounts,salebonusesandsimilarallowancesincurred,settlementofwhichisexpectedafterthebalancesheetdate,butforwhichthereisalegalorconstructiveobligationattributabletosalesrevenuebeforethebalancesheetdate.Theadditionstoprovisionforotherobligationsarisingfromsalesaredecreasingtherevenues.Provisionsforpersonnelcostsincludemainlyprovisionsforotherlong-termemployeebenefits,severancepaymentsandprovisionformanagementpersonnelremuneration.Provisionsfordisposalofend-of-lifevehiclesrelatetocostsofliquidationofend-of-lifevehiclesaccordingtoEUdirectiveno.2000/53/ECandaredeterminedmainlyonthebasisofregisteredcars,officialstatisticsandexpectedcostsofthecarsecologicalscrapping.Provisionsforlitigationrisksrelatemainlytoprovisionforriskslegalfees,penaltyinterestandotherrisksarisingfromlegalproceedings.TheCompanyprovidesfortheprobablecashoutflowsforexistinglegalandarbitrationproceedingsbymeansofarelevantprovision.

notes to the sepArAte finAnCiAl stAtements 2011
217Annual Report 2011
TheCompanyisnotinvolvedinanylegalcasesorarbitrationproceedingsforwhichnoprovisionhasbeencreatedandwhichcouldhaveasignificantimpactonthefinancialpositionandthefinancialresults(finan-cialstatements)oftheCompanyandtherearenosuchproceedingsexpectedinthenearfuture.Provisions forpurchase risks includemainlyprovision for risksof retrospectivechanges inpricesof rawmaterialsandparts.OtherprovisionsincludemainlyprovisionfortaxandcustomsrisksincountrieswheretheCompanyoper-ates.
17. Cash flow statementThecashandcashequivalentscontainedinthecashflowstatementalsocomprise,inadditiontocashandshort-termdeposits, short-termdeposits inVolkswagenGroupcompanieswithoriginalmaturityof lessthanthreemonths.ThedetailedinformationrelatingtothecashandcashequivalentscanbefoundunderNote11.Cashflowsarepresentedinthecashflowstatementandareclassifiedintocashflowsfromoperatingac-tivities,investingactivitiesandfinancingactivities.Cashflowsfromoperatingactivitiesarederivedindirectlyfromprofitbeforetax.Profitbeforetaxisadjustedtoeliminatenon-cashexpenses(mainlydepreciationandamortisation)andincomeandchangesinworkingcapital.Investingactivitiesincludeadditionstoproperty,plantandequipment,financialassets,aswellastocapi-taliseddevelopmentcost. Financingactivities include inaddition to theoutflowsof cash fromdividendpayments,redemptionofbondsandliabilitiesfromotherfinancing,alsooutflowsandinflowsfromotherborrowings.
18. Sales (CZK million)
2011 2010
Cars 197,746 174,434
Spare parts and accessories 13,071 12,310
Supplies of components within Volkswagen Group 15,366 14,071
Revenues from license fees 1,265 702
Services related to sales 180 150
Other 4,114 2,028
Total 231,742 203,695
Othersalesrelatemainlytosalesofresultsoftechnicaldevelopment,scrapandtooling.
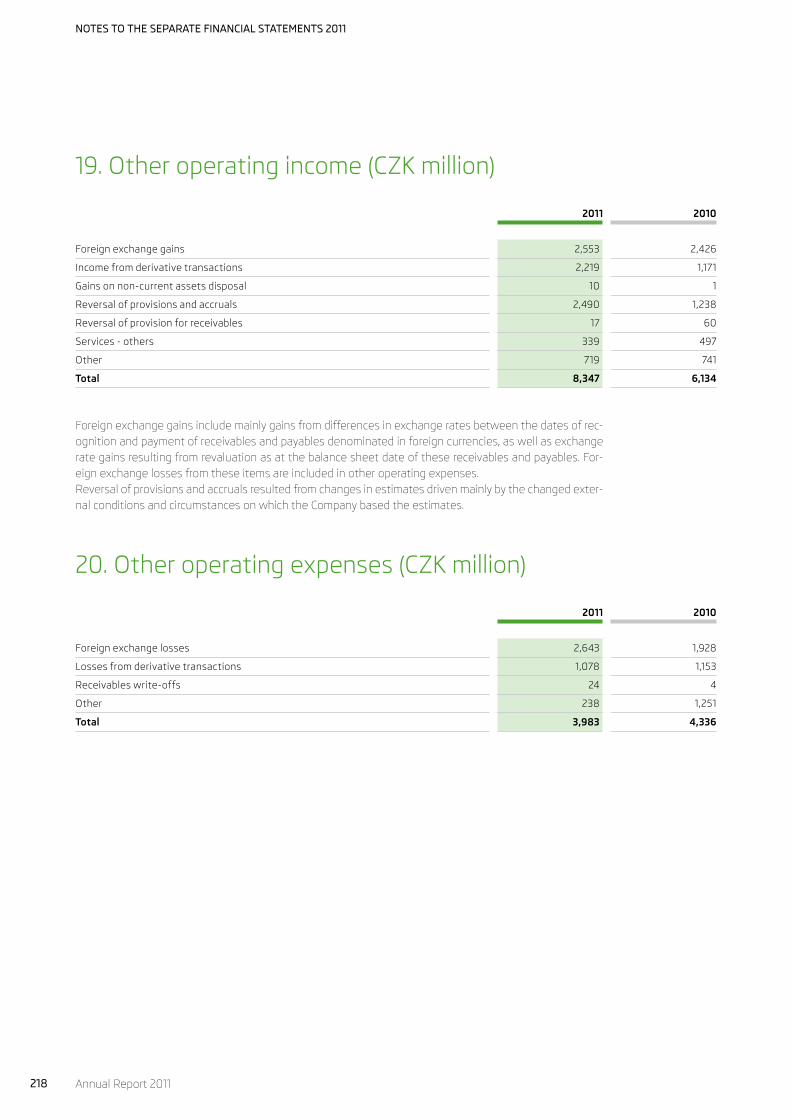
notes to the sepArAte finAnCiAl stAtements 2011
218 Annual Report 2011
19. Other operating income (CZK million)
2011 2010
Foreign exchange gains 2,553 2,426
Income from derivative transactions 2,219 1,171
Gains on non-current assets disposal 10 1
Reversal of provisions and accruals 2,490 1,238
Reversal of provision for receivables 17 60
Services - others 339 497
Other 719 741
Total 8,347 6,134
Foreignexchangegainsincludemainlygainsfromdifferencesinexchangeratesbetweenthedatesofrec-ognitionandpaymentofreceivablesandpayablesdenominatedinforeigncurrencies,aswellasexchangerategainsresultingfromrevaluationasatthebalancesheetdateofthesereceivablesandpayables.For-eignexchangelossesfromtheseitemsareincludedinotheroperatingexpenses.Reversalofprovisionsandaccrualsresultedfromchangesinestimatesdrivenmainlybythechangedexter-nalconditionsandcircumstancesonwhichtheCompanybasedtheestimates.
20. Other operating expenses (CZK million)
2011 2010
Foreign exchange losses 2,643 1,928
Losses from derivative transactions 1,078 1,153
Receivables write-offs 24 4
Other 238 1,251
Total 3,983 4,336
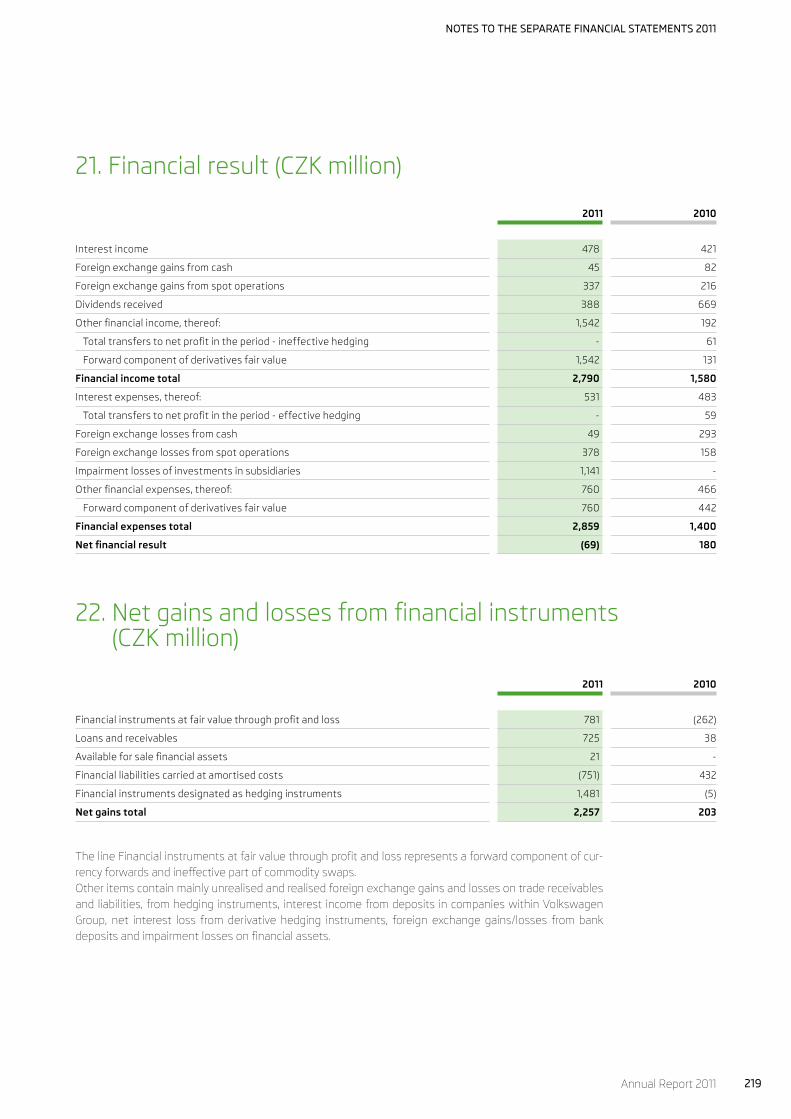
notes to the sepArAte finAnCiAl stAtements 2011
219Annual Report 2011
21. Financial result (CZK million)
2011 2010
Interest income 478 421
Foreign exchange gains from cash 45 82
Foreign exchange gains from spot operations 337 216
Dividends received 388 669
Other financial income, thereof: 1,542 192
Total transfers to net profit in the period - ineffective hedging - 61
Forward component of derivatives fair value 1,542 131
Financial income total 2,790 1,580
Interest expenses, thereof: 531 483
Total transfers to net profit in the period - effective hedging - 59
Foreign exchange losses from cash 49 293
Foreign exchange losses from spot operations 378 158
Impairment losses of investments in subsidiaries 1,141 -
Other financial expenses, thereof: 760 466
Forward component of derivatives fair value 760 442
Financial expenses total 2,859 1,400
Net financial result (69) 180
22. Net gains and losses from financial instruments (CZK million)
2011 2010
Financial instruments at fair value through profit and loss 781 (262)
Loans and receivables 725 38
Available for sale financial assets 21 -
Financial liabilities carried at amortised costs (751) 432
Financial instruments designated as hedging instruments 1,481 (5)
Net gains total 2,257 203
ThelineFinancialinstrumentsatfairvaluethroughprofitandlossrepresentsaforwardcomponentofcur-rencyforwardsandineffectivepartofcommodityswaps.Otheritemscontainmainlyunrealisedandrealisedforeignexchangegainsandlossesontradereceivablesandliabilities,fromhedginginstruments,interestincomefromdepositsincompanieswithinVolkswagenGroup, net interest loss fromderivative hedging instruments, foreign exchange gains/losses frombankdepositsandimpairmentlossesonfinancialassets.

notes to the sepArAte finAnCiAl stAtements 2011
220 Annual Report 2011
23. Income tax (CZK million)
2011 2010
Current tax expense 3,127 2,792
of which: adjustment in respect of prior years (114) 64
Deferred tax (260) (981)
Income tax total 2,867 1,811
StatutoryincometaxrateintheCzechRepublicforthe2011assessmentperiodwas19%(2010:19%).Asat31December2011and31December2010,deferredincometaxesattributabletotheCzechtaxjurisdictionweremeasuredatataxrateof19%thatcorrespondswiththestatutorytaxratesenactedforthefutureperiodswhenrealisationofdeferredtaxassetsandliabilitiesisexpected.
Reconciliation of expected to effective income tax expense (Czk million)
2011 2010
Profit before income tax 17,155 11,215
Expected income tax expense 3,259 2,131
Proportion of taxation relating to:
Permanent differences resulting from:
Tax exempt income (133) (189)
Expenses not deductible for tax purposes 404 173
Tax allowances and other tax credits (659) (318)
Prior-period current tax expense (114) 64
Investment tax credits 110 (50)
Effective income tax expense 2,867 1,811
Effective income tax rate 17% 16%
LineTaxallowancesandothertaxcreditsrepresentsmainlytaxcreditsfromdoubledeductionofresearchanddevelopmentcosts.
24. Subsidies and investment incentivesSubsidiesIn2011,theCompanyreceivedagrantforsupportoftheprojectperformedbytheDevelopmentandTech-nologyCentreofCZK19million(2010:CZK42million)andagrantforsupportofprivateschoolsofCZK45million(2010:CZK50million).In2010,theCompanywasprovidedwithapromiseofthegrantfromtheEuropeanRegionalDevelopmentFundbytheMinistryofIndustryandTradeintheCzechRepublicforthefollowingprojects:“CombinedPro-ductionofHeatandElectricityintheKvasinyPlant“,intheamountofCZK27millionand“ServiceTrainingCenter”intheamountofCZK67million.Bothprojectsareintheexecutionphase.Thegrantonlyfortheproject“ServiceTrainingCenter”waspartiallypaidoutin2011inamountofCZK2million(2010:CZK0million).Theremainingpartofgrantfortheproject“ServiceTrainingCenter”andtheproject“CombinedProductionofHeatandElectricityintheKvasinyPlant“willbepaidoutretrospectivelyoncompletionofindividualex-ecutionphases.

notes to the sepArAte finAnCiAl stAtements 2011
221Annual Report 2011
Inaddition,theCompanywasprovidedwithapromiseofthegrantfromtheEuropeanRegionalDevelop-mentFundbytheMinistryofIndustryandTradeintheCzechRepublicin2011forthefollowingprojects:“ExtensionofDevelopmentCapacitiesŠKODAAUTOa.s.“intheamountofCZK88million.Theprojectisintheexecutionphase,however,thegrantwasnotpaidoutin2011.(Thegrantwillbepaidoutretrospectivelyoncompletionofindividualexecutionphases).
Investment incentivesTobegrantedtheinvestmentincentives,theCompanyhastomeettheGeneralconditionsof§2art.2oftheActNo.72/2000Coll.,onInvestmentIncentives,asamendedandSpecialconditions§35boftheActNo.586/1992Coll.,onIncomeTaxasamended.
EA211 InaccordancewiththeActNo.72/2000Coll.,onInvestmentIncentivesasamendedbasedonresolutiondated on 2August 2011 the Companywas providedwith a promise of the investment incentive IPNo.49/2011foritsprojectrelatedtoproductionofpartsofengineEA211andassemblyoftheengineintheplantinMladáBoleslavinformoftaxcredit.ThetotalamountofthesubsidyislimitedtotheamountofCZK800millionwhichcorrespondsto40%ofthetotaleligibleinvestedcostsrelatedtotheinvestmentproject.In2011,theprojectwasrealised,howeverasat31December2011utilisationofinvestmentincentivewasre-gardedasuncertainbytheCompanyandthereforenorelateddeferredtaxassetwasrecognised.
MQ 100InaccordancewiththeActNo.72/2000Coll.,onInvestmentIncentivesasamendedbasedonresolutiondated on 2August 2011 the Companywas providedwith a promise of the investment incentive IPNo.50/2011foritsprojectrelatedtoproductionexpansionoftransmissionsintheplantinMladáBoleslavinformoftaxcredit.ThetotalamountofthesubsidyislimitedtotheamountofCZK496millionwhichcorre-spondsto40%ofthetotaleligibleinvestedcostsrelatedtotheinvestmentproject.In2011,theprojectwasrealisedandtheCompanyexpectsutilisationofinvestmentincentiveandrecogniseddeferredtaxassetofCZK335millionbasedoneligiblecostsinvested.
A-SUVInaccordancewiththeActNo.72/2000Coll.,onInvestmentIncentivesasamendedbasedonresolutiondatedon4August2008theCompanywasgrantedan investment incentive forproductionof theSUVmodelintheplantKvasinyinformoftaxcredit.ThetotalamountofthesubsidyislimitedtotheamountofCZK561millionwhichcorrespondsto40%ofthetotaleligibleinvestedcostsrelatedtotheinvestmentpro-ject.Theprojectwascompletedin2010,howeverasat31December2011utilisationofinvestmentincentivewasregardedasuncertainbytheCompanyandthereforenorelateddeferredtaxassetwasrecognised.
25. Contingent liabilities Thetaxauthoritiesmayatanytimeinspecttheaccountingbooksandrecordswithintenyearssubsequenttothereportedtaxyear,andmayimposeadditionaltaxassessmentsandpenalties.TheCompany’smanagementisnotawareofanycircumstancesthatcouldresultinmaterialliabilitiesaris-ingfromthetaxauditscarriedoutatpresentorpotentiallyinthefuture,exceptforthetaxrisksforwhichprovisionfortaxriskshasbeencreated(pleaserefertoNote16).

notes to the sepArAte finAnCiAl stAtements 2011
222 Annual Report 2011
26. Contractual obligations and other future commitments (CZK million)
Futurecommitmentsasatbalancesheetdateareasfollows:
Payable until year 2012 Payable 2013 – 2016 31 December 2011
Investment commitments - property, plant and equipment 10,894 1,328 12,222
Investment commitments - intangible assets 5,941 3,099 9,040
Operating leasing instalments 178 248 426
Other future commitments - - -
Payable until year 2011 Payable 2012 – 2015 31 December 2010
Investment commitments - property, plant and equipment 1,694 1,236 2,930
Investment commitments - intangible assets 4,360 4,576 8,936
Operating leasing instalments 166 42 208
Other future commitments 75 75 150
Onthebasisofnon-cancellableoperatingleaseagreements,theCompanyisallowedtorentdifferentma-chineandofficeequipmentandbuildings.Inthecaseofterminationoftheseagreements,alloutstandingleasepaymentsuptotheoriginalexpirationdateofthecontractmustbepaid.CategoryOtherfuturecommitmentscomprisesfuturecommitmentswhichareunusualtotheCompany,eitherbecauseoftheirnatureortheirsizeordurationandisrepresentedmainlybysignificantadvertisingandsponsoringcontractsconcludedforaperiodlongerthanoneyear.Inordertoincreaseaccuracyofpresentationofcontractualobligations,figuresforcomparativeperiod2010havebeenchangedinlineInvestmentcommitments–intangibleassets,amountincolumnPayableuntilyear2011ofCZK2,510millionhavebeenincreasedbyCZK1,850milliontoCZK4,360millionandamountincolumnPayable2012–2015ofCZK2,174millionhavebeenincreasedbyCZK2,402milliontoCZK4,576million.Disclosedamountofcontractualobligations2010inthelineInvestmentcommitments–intangibleassetshavebeenincreasedintotalbyCZK4,252million.

notes to the sepArAte finAnCiAl stAtements 2011
223Annual Report 2011
27. Expenses by nature – additional information (CZK million)
2011 2010
Material costs - raw materials and other supplies, goods 158,044 138,487
Production related services 12,955 11,006
Personnel costs 17,099 15,162
Wages 12,979 11,392
Pension benefit costs (defined contribution plans) 2,507 2,226
Social insurance and other personnel costs 1,613 1,544
Depreciation, amortisation and impairment losses 12,601 14,167
Other services 18,183 15,636
Total cost of sales, distribution and administrative expenses 218,882 194,458
Number of employees
Number of employees* 26,265 25,077
* Average number of employees (including temporary employees).
28. Related party transactionsThecompanyVOLKSWAGENAGhasbeentheultimateparentcompanyandtheultimatecontrollingpartyoftheCompanyfortheentirecurrentaccountingperiod.ItemsincategoryOtherrelatedpartiesdonotmeetthedefinitionofanentitycontrolledbythesamecon-trollingentitypursuantto§66aoftheActNo.513/1991Coll.,CommercialCode,asamended.In2011,categoryOtherrelatedpartiesincludesmainlytransactionswithShanghaiVolkswagenAutomotiveCompanyLtd.andwiththecompaniesofthePorscheHoldingGmbHGroup,whicharenotfullyconsolidatedbytheultimateparentVOLKSWAGENAG,andtransactionswithcompaniesofthePorscheAutomobilHold-ingSEGroup.Theyaredisclosedwithinotherrelatedpartiesbasedonthefactthatthesecompaniesareonly jointventuresofVOLKSWAGENAG.TransactionswiththecompaniesofthePorscheHoldingGmbHGroup,whicharefullyconsolidatedsince1March2011byVOLKSWAGENAG,are includedinthecategoryCompaniescontrolledbyultimateparentcompanyin2011,inclusivethetransactions(revenuesofCZK2,494million,purchasesofCZK28million)forperiod1January-28February2011,whenthedefinitionofanentitycontrolledbythesamecontrollingentitypursuanttotheCommercialCodewasnotmet.In2010,categoryOtherrelatedpartiesincludesmainlytransactionswithShanghaiVolkswagenAutomo-tiveCompanyLtd.andwithallcompaniesofthePorscheHoldingGmbHandPorscheAutomobilHoldingSEgroups.
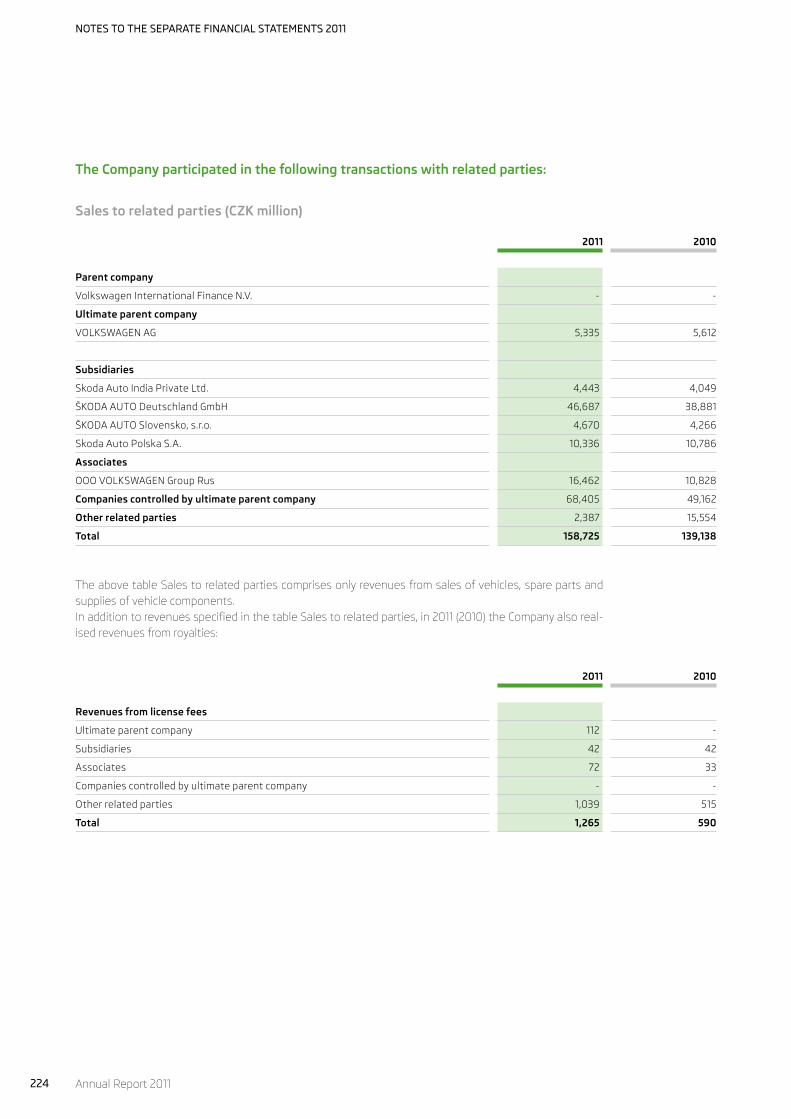
notes to the sepArAte finAnCiAl stAtements 2011
224 Annual Report 2011
The Company participated in the following transactions with related parties:
Sales to related parties (Czk million)
2011 2010
Parent company
Volkswagen International Finance N.V. - -
Ultimate parent company
VOLKSWAGEN AG 5,335 5,612
Subsidiaries
Skoda Auto India Private Ltd. 4,443 4,049
ŠKODA AUTO Deutschland GmbH 46,687 38,881
ŠKODA AUTO Slovensko, s.r.o. 4,670 4,266
Skoda Auto Polska S.A. 10,336 10,786
Associates
OOO VOLKSWAGEN Group Rus 16,462 10,828
Companies controlled by ultimate parent company 68,405 49,162
Other related parties 2,387 15,554
Total 158,725 139,138
TheabovetableSalestorelatedpartiescomprisesonlyrevenuesfromsalesofvehicles,sparepartsandsuppliesofvehiclecomponents.InadditiontorevenuesspecifiedinthetableSalestorelatedparties,in2011(2010)theCompanyalsoreal-isedrevenuesfromroyalties:
2011 2010
Revenues from license fees
Ultimate parent company 112 -
Subsidiaries 42 42
Associates 72 33
Companies controlled by ultimate parent company - -
Other related parties 1,039 515
Total 1,265 590
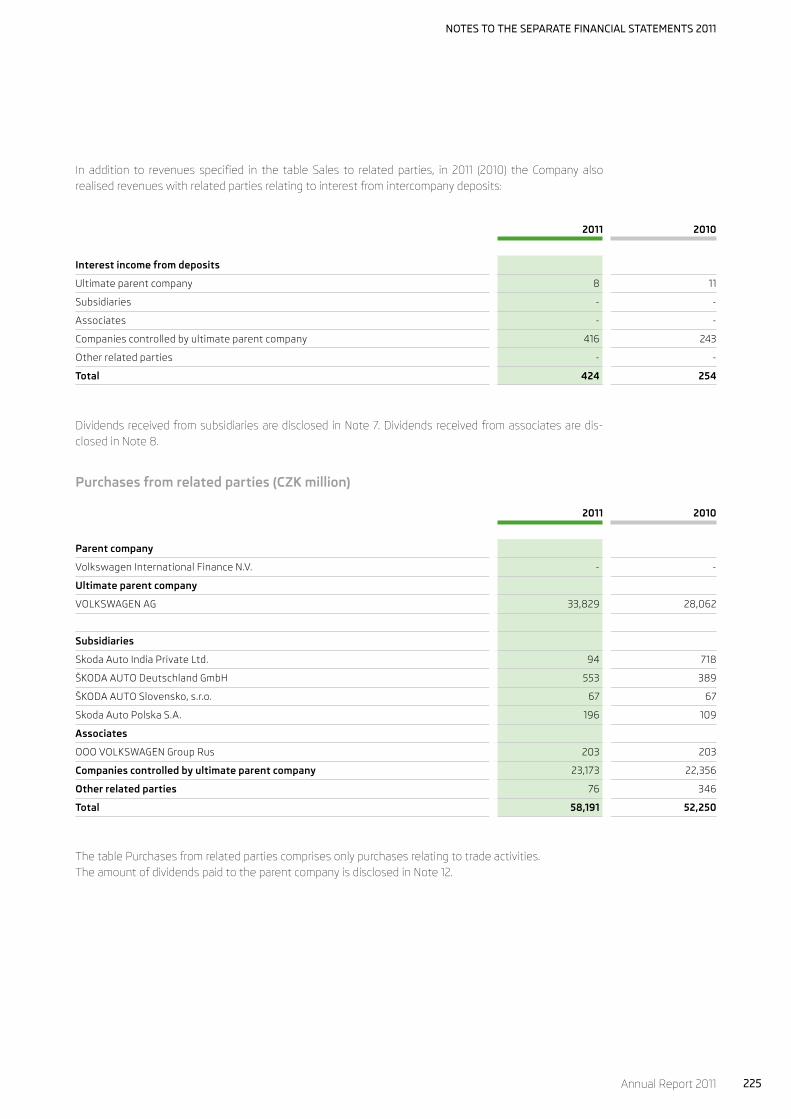
notes to the sepArAte finAnCiAl stAtements 2011
225Annual Report 2011
In addition to revenues specified in the table Sales to related parties, in 2011 (2010) the Company also realisedrevenueswithrelatedpartiesrelatingtointerestfromintercompanydeposits:
2011 2010
Interest income from deposits
Ultimate parent company 8 11
Subsidiaries - -
Associates - -
Companies controlled by ultimate parent company 416 243
Other related parties - -
Total 424 254
DividendsreceivedfromsubsidiariesaredisclosedinNote7.Dividendsreceivedfromassociatesaredis-closedinNote8.
Purchases from related parties (Czk million)
2011 2010
Parent company
Volkswagen International Finance N.V. - -
Ultimate parent company
VOLKSWAGEN AG 33,829 28,062
Subsidiaries
Skoda Auto India Private Ltd. 94 718
ŠKODA AUTO Deutschland GmbH 553 389
ŠKODA AUTO Slovensko, s.r.o. 67 67
Skoda Auto Polska S.A. 196 109
Associates
OOO VOLKSWAGEN Group Rus 203 203
Companies controlled by ultimate parent company 23,173 22,356
Other related parties 76 346
Total 58,191 52,250
ThetablePurchasesfromrelatedpartiescomprisesonlypurchasesrelatingtotradeactivities.TheamountofdividendspaidtotheparentcompanyisdisclosedinNote12.

notes to the sepArAte finAnCiAl stAtements 2011
226 Annual Report 2011
Receivables from related parties (Czk million)
31 December 2011 31 December 2010
Parent company
Volkswagen International Finance N.V. - -
Ultimate parent company
VOLKSWAGEN AG 321 352
Subsidiaries
Skoda Auto India Private Ltd. 786 1,367
ŠKODA AUTO Deutschland GmbH 22 43
ŠKODA AUTO Slovensko, s.r.o. 60 17
Skoda Auto Polska S.A. 87 19
Associates
OOO VOLKSWAGEN Group Rus 3,508 2,667
Companies controlled by ultimate parent company 2,991 2,109
Other related parties 1,147 708
Total 8,922 7,282
Theabovetablecomprisestradereceivablesandreceivablesfromroyalties.Receivablesfromroyaltiesarespecifiedbelow.
31 December 2011 31 December 2010
Receivables from royalties
Ultimate parent company - -
Subsidiaries 17 36
Associates 84 59
Companies controlled by ultimate parent company - -
Other related parties 519 465
Total 620 560
Inadditiontotradereceivablesandreceivablesfromroyalties,theCompanyalsohaddepositsincompa-niescontrolledbyultimateparentcompanyintotalamountofCZK44,800million(31December2010:CZK34,300million).Receivablesfrominterestfromthedepositsasat31December2011amountedtoCZK49million(31December2010:CZK78million).AverageinterestraterelatingtothesedepositsisdisclosedinNote9andNote11.ReceivablesfromrelatedpartiesareconsideredbytheCompanytobeoftheleastrisk.Theproductsdeliv-eredtotherelatedpartiesaresuppliedwiththepaymentonaduedate,securedbyanadvancepaymentortheyaretransferredtofactoringcompanies.Noimpairmentlosswasidentifiedforanyofthereceivablesfromrelatedparties.CashpoolingbalancewithVolkswagenGroupServicesS.A.isdisclosedinNote11.InvestmentsinsubsidiariesaredisclosedinNote7andinvestmentsinassociatesaredisclosedinNote8.
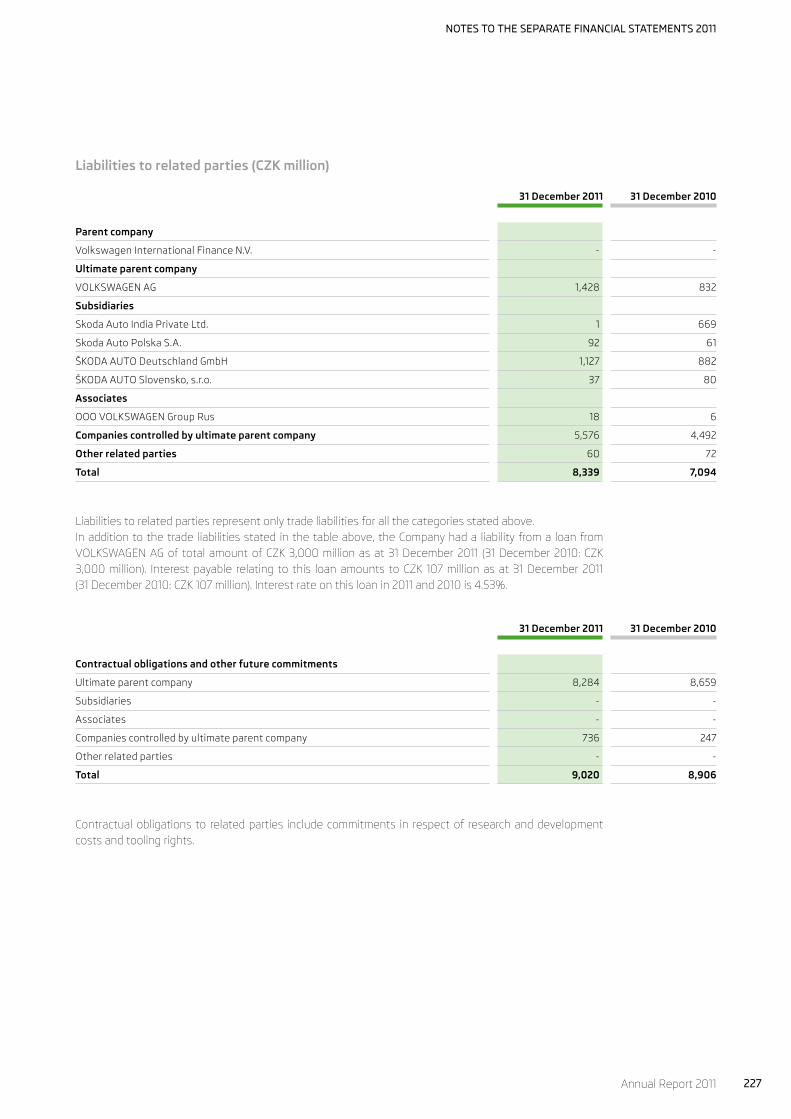
notes to the sepArAte finAnCiAl stAtements 2011
227Annual Report 2011
Liabilities to related parties (Czk million)
31 December 2011 31 December 2010
Parent company
Volkswagen International Finance N.V. - -
Ultimate parent company
VOLKSWAGEN AG 1,428 832
Subsidiaries
Skoda Auto India Private Ltd. 1 669
Skoda Auto Polska S.A. 92 61
ŠKODA AUTO Deutschland GmbH 1,127 882
ŠKODA AUTO Slovensko, s.r.o. 37 80
Associates
OOO VOLKSWAGEN Group Rus 18 6
Companies controlled by ultimate parent company 5,576 4,492
Other related parties 60 72
Total 8,339 7,094
Liabilitiestorelatedpartiesrepresentonlytradeliabilitiesforallthecategoriesstatedabove.Inadditiontothetradeliabilitiesstatedinthetableabove,theCompanyhadaliabilityfromaloanfromVOLKSWAGENAGoftotalamountofCZK3,000millionasat31December2011 (31December2010:CZK3,000million). Interestpayable relating to this loanamounts toCZK 107millionasat31December2011 (31December2010:CZK107million).Interestrateonthisloanin2011and2010is4.53%.
31 December 2011 31 December 2010
Contractual obligations and other future commitments
Ultimate parent company 8,284 8,659
Subsidiaries - -
Associates - -
Companies controlled by ultimate parent company 736 247
Other related parties - -
Total 9,020 8,906
Contractualobligationsto relatedparties includecommitments in respectof researchanddevelopmentcostsandtoolingrights.

notes to the sepArAte finAnCiAl stAtements 2011
228 Annual Report 2011
Information on key management personnel remuneration (Czk million)
2011 2010
Salaries and other short-term employee benefits* 355 273
Other long-term employee benefits 14 15
Total 369 288
* Salaries and other short-term employee benefits include besides wages, salaries, bonuses and non-monetary remuneration also health and social insurance paid by employer for employees.
TheremunerationofthemembersoftheBoardofDirectors,SupervisoryBoardandotherkeymanagementpersonnelincludestheremunerationpaid,payableorprovidedbytheCompanyintheformofsalaries,bo-nusesandnon-monetaryremuneration.KeymanagementpersonnelincludemembersoftheBoardofDirectors,SupervisoryBoardandmanagersoftheCompanyhavingauthorityandresponsibilityforplanning,directingandcontrollingtheactivitiesoftheCompany.In2011,otherkeymanagementpersonneloftheCompanyincluded42persons(2010:41persons).CZK130millionoutofthetotalamountdisclosedinthelineSalariesandothershort-termemployeeben-efitswasoutstandingasat31December2011(31December2010:CZK98million).
29. Other information (CZK million)ThecompensationpaidtotheCompany’sauditorsfortheaccountingperiodwasCZK29million(2010:CZK25million)andcoveredthefollowingservices:
2011 2010
Audit and other assurance services 16 16
Tax and related services 4 4
Other advisory services 9 5
Total 29 25
30. Significant events after the balance sheet dateAfterthebalancesheetdate,therewerenoeventsthatcouldhaveasignificantimpactontheseparatefinancialstatementsoftheCompanyfortheyearended31December2011.Effectiveon1January2012,theCompanysoldits51%shareinthesubsidiarySkodaAutoPolskaS.A.(seeNote7)toparentVolkswagenInternationalFinanceN.V.(seeNote12).Asaresult,theCompanyhaslosttheentireinterestinthesubsidiarySkodaAutoPolskaS.A.Withrespecttotheamountoftheinvestmentandproceedsfromthesale,theeventdoesnothavesignificantimpactontheclassificationofassetsandresultsofoperationsfortheyearended31December2011.

notes to the sepArAte finAnCiAl stAtements 2011
229Annual Report 2011
31. Information about Volkswagen Group ŠKODA AUTO a.s. is a subsidiary included in the consolidation group of its ultimate parent company, VOLKSWAGENAG,witharegisteredofficeinWolfsburg,theFederalRepublicofGermany.TheVolkswagenGroupconsistsoftwodivisions-AutomotiveandFinancialServices.TheactivitiesrelatedtotheAutomotiveDivisionincludethedevelopmentofcarsandaggregates,productionandsaleofpassen-gerandcommercialcars,trucksandbusesaswellasthebusinesswithspareparts.Thefollowingbrandsbelong toVolkswagenGroup:VolkswagenPassengerCars,Audi, ŠKODA,SEAT,VolkswagenCommercialVehicles,Bentley,Bugatti,Scania,MANandLamborghini.TheFinancialServicesDivision includesactivities related to thedealer andcustomerfinancing, leasing,bankingandinsuranceservicesandthefleetmanagement.ŠKODAAUTOanditssubsidiaries(ŠKODAAUTODeutschlandGmbH,SkodaAutoPolskaS.A.,ŠKODAAUTOSlovensko,s.r.o.andSkodaAutoIndiaPrivateLtd.)andassociateOOOVOLKSWAGENGroupRusareincludedintheconsolidationofVolkswagenGroup’sfinancialstatements.Theseconsolidatedfinancialstatements,andotherinformationrelatingtotheVolkswagenGroup,areavailableintheannualreportofVOLKSWAGENAGandonitsinternetsite(website:www.volkswagenag.com).
MladáBoleslav,17February2012
TheBoardofManagement:
WinfriedVahland
WinfriedKrause BohdanWojnar EckhardScholz
JürgenStackmann KarlheinzEmilHell MichaelOeljeklaus Personsresponsibleforaccouting:
DanaNěmečková JanaFernándezZambrano

230 Annual Report 2011
report on relAtions
Report on relationsReport on relations between VOLKSWAGEN AG and ŠKODA AUTO a.s. and between ŠKODA AUTO a.s. and other entities controlled by VOLKSWAGEN AG in the accounting period 1 January 2011 - 31 December 2011
ThereportonrelationsbetweenVOLKSWAGENAG,havingitsregisteredofficeinWolfsburg,FederalRe-publicofGermany,(hereinafterreferredtoasthe“ControllingEntity”or“Volkswagen”)andŠKODAAUTOa.s.,havingitsregisteredofficeinMladáBoleslav,Tř.VáclavaKlementa869,Postcode:29360,IDNo.:00177041(hereinafterreferredtoasthe“ControlledEntity”or“theCompany”or“ŠKODAAUTO”),andbetweenŠKODAAUTOandotherentitiescontrolledbyVolkswagenintheaccountingperiod1January2011to31December2011(hereinafterreferredtoasthe“accountingperiod”)waspreparedpursuanttoprovision§66aparagraph9oftheActNo.513/1991Coll.,CommercialCode,asamended.VolkswagenwasthesoleshareholderofŠKODAAUTOwith100%votingrightstill18July2007.AtthedateVolkswagenInternationalFinanceN.V.,havingitsregisteredofficeinAmsterdam,TheKingdomoftheNeth-erlands,becameanewsoleshareholderofŠKODAAUTOduetostructuralchangeswithintheVolkswagenGroup.VolkswagenInternationalFinanceN.V.isindirectlya100%subsidiaryofVolkswagenAG.InaccordancewiththeCommercialCodeandinternalpolicies,theControllingEntityconsidersmoredetailedinformationregardingcontracts,whicharelistedinthesection“Contractsconcluded”ofthisReport,asamatteroftradesecret,whichcannotbepubliclydisclosed.AlltransactionsregardingtheControllingEntityarisingfromthesecontractswerecarriedoutinadequateamountsandreflectedcontractualconditionsinrespectofpriceandqualityofservicesthatwouldbeotherwiseprovidedbythirdpartiesatthesametimeandonthesameorsimilarmarket.Fortheabovestatedreasons,thisreportdoesnotcontainanyinforma-tionaboutprices,quantitiesorvalues.
Contracts concludedŠKODAAUTOandVolkswagen,andŠKODAAUTOandthecompaniescontrolledbyVolkswagenconcludedcontractsinthefollowingareasduringtheaccountingperiod:
1. Sale of own products, goods and services
a) vehiclesŠKODAAUTOdidnotconcludeanynewcontractsregardingsaleofvehiclesintheaccountingperiod.
b) genuine parts ŠKODAAUTOdidnotconcludeanynewcontractsregardingsaleofgenuinepartsintheaccountingperiod.
c) other ŠKODAAUTOenteredintonewcontractsregardingsaleofservices,licenses,aggregates,bodyworksandotherproductswiththefollowingcompanies:
AUDIAGGroupeVOLKSWAGENFrances.a.OOOVOLKSWAGENGroupRusSEAT,S.A.VOLKSWAGENAGVolkswagenArgentinaS.A.VolkswagenAutoeuropa,Lda.VolkswagenGroupIrelandLtd.VOLKSWAGENGroupUnitedKingdomLtd.VolkswagenMotorsportGmbHVOLKSWAGENSLOVAKIA,a.s.VOLKSWAGENTransmission(Shanghai)CompanyLtd

231Annual Report 2011
report on relAtions
2. Purchase of goods and services
a) production material and goodsŠKODAAUTOconcludednewcontractsregardingpurchasesofproductionmaterialwiththefollowingcompanies:
GearboxdelPrat,S.A.SITECHSp.zo.o.VOLKSWAGENAGVolkswagenMotorPolskaSp.zo.o.VolkswagenOsnabrückGmbHVolkswagenSachsenGmbHVOLKSWAGENSLOVAKIA,a.s.
b) indirect material and servicesŠKODAAUTOenteredintonewcontractsregardingpurchasesofindirectmaterialandservices(purchasesof indirectmaterialandservices,researchanddevelopmentcooperation,ITservices,softwareandhard-waresupplies,customerservicesconsultancy)withthefollowingcompanies:
AUDIAGAudiAkademieGmbHAUDIBRUSSELSS.A.AUDIElektronicsVentureGmbHAUDIHUNGARIAMOTORKft.AudiVertriebsbetreuungsgesellschaftmbHAutomobilmanufakturDresdenGmbHAutostadtGmbHAutoVisionGmbHCarmeqGmbHe4telectronicsfortransportations.r.o.GearboxdelPrat,S.A.GroupeVOLKSWAGENFrances.a.ImportVOLKSWAGENGroups.r.o.INISInternationalInsuranceServices.r.o.,vezkratceINISs.r.o.IntercarAustriaGmbHItaldesignGiugiaroS.p.A.OOOVOLKSWAGENGroupRusPorscheAlbaniaSh.p.k.PorscheInterAutoCZspol.s.r.o.PorscheInterAutoHungariaKft.PORSCHEROMANIASRLSALLIG-S.R.L.SEAT,S.A.ScaniaCzechRepublics.r.o.SITECHSp.zo.o.SkodaAutoIndiaPrivateLtd.SkodaAutoPolskaS.A.ŠKODAAUTODeutschlandGmbHŠKODAAUTOSlovensko,s.r.o.ŠkoFINs.r.o.VOLKSWAGENAGVolkswagen(China)InvestmentCompanyLtd.VolkswagenArgentinaS.A.VolkswagenAutoeuropa,Lda.VolkswagenCoachingGmbHVolkswagenDesignCenterPotsdamGmbHVolkswagendoBrasilIndústriadeVeículosAutomotoresLtda.VolkswagenGroupAustraliaPtyLtd.

232 Annual Report 2011
report on relAtions
VolkswagenGroupIrelandLtd.VOLKSWAGENGroupItaliaS.p.A.VOLKSWAGENGroupJapanK.K.VolkswagenGroupofAmerica,Inc.VOLKSWAGENGroupUnitedKingdomLtd.VolkswagenIndiaPrivateLtd.VolkswagenLogisticsGmbH&Co.OHGVolkswagenMotorPolskaSp.zo.o.VolkswagenNavarra,S.A.VolkswagenPoznanSp.zo.o.VolkswagenProcurementServicesGmbHVolkswagenSachsenGmbHVOLKSWAGENSARAJEVO,d.o.oVOLKSWAGENSLOVAKIA,a.s.VOLKSWAGENTransmission(Shanghai)CompanyLtd.VolkswagenVersicherungsvermittlungGmbHVolkswagen-AudiEspaňaS.A.
c) genuine partsŠKODAAUTOenteredintonewcontractsregardingpurchasesofgenuinepartswiththefollowingcompanies:
AUDIHUNGARIAMOTORKft.GearboxdelPrat,S.A.SITECHSp.zo.o.VOLKSWAGENAGVolkswagenSachsenGmbHVOLKSWAGENSLOVAKIA,a.s.
d) investmentsŠKODAAUTOenteredintonewcontractsregardingpurchasesofinvestmentswiththefollowingcompanies:
VOLKSWAGENAGVolkswagenProcurementServicesGmbHSITECHSp.zo.o.MAHAGGmbHe4telectronicsfortransportations.r.o.
3. Other contractual relationships
ŠKODAAUTOalsoestablishednewcontractualrelationships(particularlymarketingservices,training,salessupport,financialservices,systemsupport,consultancy,andproductionofcars)withthefollowingcompanies:
AUDIAGGroupeVOLKSWAGENFrances.a.IntercarAustriaGmbHOOOVOLKSWAGENGroupRusPorscheAlbaniaSh.p.k.PorscheAustriaGmbH&Co.OGPorscheHungariaHandelsKft.PorscheInterAutoCZspol.sr.o.PorscheMakedonijadooelPorscheRomanias.r.l,PorscheSLOVENIJAd.o.oSkodaAutoIndiaPrivateLtd.SkodaAutoPolskaS.A.ŠKODAAUTODeutschlandGmbHŠKODAAUTOSlovensko,s.r.o.ŠkoFINs.r.o.

233Annual Report 2011
report on relAtions
VOLKSWAGENAGVolkswagenGroupAustraliaPtyLtd.VolkswagenGroupIrelandLtd.VOLKSWAGENGroupItaliaS.p.A.VolkswagenGroupSverigeABVOLKSWAGENGroupUnitedKingdomLtd.VolkswagenIndiaPrivateLtd.Volkswagen-AudiEspaňaS.A.
Transactions relating to contracts concluded in previous years
Besidescompaniesdisclosedinpoints1,2and3,theControlledEntitycarriedouttransactionswiththefol-lowingcompanies,controlledbythesamecontrollingentity,basedoncontractsconcludedinpreviousyears:
BentleyMotorsLtd.CentroTécnicoDeSEAT,S.A.MMIMarketingManagementInstitutGmbHSITECHSitztechnikGmbHSEATSportS.A.ŠKO-ENERGOFIN,s.r.o.ŠKO-ENERGO,s.r.o.VolkswagendeMéxicoS.A.deC.V.VOLKSWAGENFINANCIALSERVICESAGVolkswagenGroupServicesS.A.VolkswagenofSouthAfrica(Pty.)Ltd.VolkswagenOriginalTeileLogistikGmbH&Co.KGVolkswagenQualifizierungsgesellschaftmbHVolkswagenZubehörGmbHVolkswagen-BildungsinstitutGmbH
Other legal actsBasedonthecontractfromDecember2011andeffectiveon1January2012,theCompanysoldits51%shareinthesubsidiarySkodaAutoPolskaS.A.toparentVolkswagenInternationalFinanceN.V.Asaresult,theCompanyhaslosttheentireinterestonthesubsidiarySkodaAutoPolskaS.A.IntheaccountingperiodnofurtherlegalactswerereportedwhichwerecarriedoutinfavourofVolkswagenandentitiescontrolledbyVolkswagen,whichwentbeyondthescopeofstandardlegalactscarriedoutbyVolkswagenwhileexercisingitsrightsastheControllingEntityofŠKODAAUTO.ŠKODAAUTOpaidadividendofCZK4,701,770thousandtoVolkswagenInternationalFinanceN.V.,asthesoleshareholder,on1April2011basedontheDecisionofthesoleshareholderVolkswagenInternationalFinanceN.V.from30March2011.In2011dividendsandshareinprofitofCZK263,377thousandwerepaidouttotheCompanybythesubsidi-aries.In2011dividendsandshareinprofitofCZK124,555thousandwerepaidouttotheCompanybytheassociate.
Other measures, their advantages and disadvantagesDuringtheaccountingperiod,ŠKODAAUTOdidnotadoptortakeanymeasuresonthebehalfoforattheincentiveofVolkswagen,andotherentitiescontrolledbyVolkswagen,otherthanstepsnormallytakenvis-a-visVolkswagenastheControllingEntityofŠKODAAUTO.
234 Annual Report 2011
report on relAtions
Performance provided and counter-performance accepted
Intheaccountingperiodnootherperformanceandcounter-performanceinfavourorattheinitiativeofVolkswagen,andentitiescontrolledbyVolkswagen,whichexceededthescopeofstandardperformanceandcounter-performancetakenbyŠKODAAUTOregardingVolkswagen,astheControllingEntityofŠKODAAUTO,weretakenorimplementedbyŠKODAAUTO.Totalvaluesof transactionswith relatedpartiesamongwhichbelongalsothe relatedentityduringtheaccountingperiodaredisclosed inthenotes7,8,9,12,14and28ofthenotestotheseparatefinancialstatements.TheBoardofDirectorsoftheControlledEntitydeclaresthatŠKODAAUTOdidnotsufferfromanydamageordetrimentasaresultoftheconclusionoftheabovementionedcontracts,theotheraforesaidlegalacts,othermeasures,performanceprovidedoracceptedcounter-performance.
InMladáBoleslav,17February2012
MembersofBoardofDirectors:
WinfriedVahland
WinfriedKrause JürgenStackmann
MichaelOeljeklaus EckhardScholz
BohdanWojnar KarlheinzEmilHell

235Annual Report 2011
GlossAry of terms And AbbreviAtion
Glossary of terms and abbreviationA-suv —Sportutilityvehicleinthemid-rangecategoryofcars
Assembled car —acarthatwentthroughaspecifiedoutputcontrolontheassemblyline.IntheGroup´sassemblyplantscarsareassembledfromkitssuppliedbytheparentcompany
bilmoG —dasBilanzrechtsmodernisierungsgesetz–GermanAccountingAct
CAs — Czechaccountingstandards forbusinessesandotheraccounting regulationsvalid in theCzechRepublic,particularlyActNo.563/1991Coll.onAccountingandDecreeNo.500/2002Coll., implementingselectedprovisionsoftheAccountingAct,assubsequentlyamended
Company —intheAnnualReport,theterm“theCompany”isusedasasynonymforthecompanyŠKODAAUTO
Consolidated group —inadditiontoŠKODAAUTOa.s.withregisteredofficeinMladáBoleslav,alsoincludesallsignificantsubsidiariesandassociates
deliveries to customers —numberofŠKODA-brandvehiclesdeliveredtoendcustomersthatwerepro-ducedinŠKODAAUTOGroupand/orpartnerplants
e-learning —atrainingmethodbasedonelectronictrainingprogramsrunningonpersonalcomputers
Gross liquidity —liquidfunds,i.e.cash,short-termdepositsandshort-termlendings
Group —intheAnnualReport,theterms“theGroup”and“theŠKODAAUTOGroup”areusedassynonymsfortheŠKODAAUTOConsolidatedGroup
iAs / ifrs —InternationalAccountingStandards/InternationalFinancialReportingStandardsasadoptedbytheEuropeanUnion
investment ratio — ratioofcapitalexpenditures (lesscapitaliseddevelopmentexpenses) to totalsalesrevenues
KonTraG —dasGesetzzurKontrolleundTransparenzimUnternehmensbereich–GermanInformationDis-closureandTransparencyAct
manufactured car —acarthatwentthroughaspecifiedoutputcontrolintheframeworkofthemanufac-turingprocess,afterallmandatorytestswerecarriedoutandbeforeitishandedovertothedealer
net liquidity —gross liquidity lessfinancialobligationsand liabilities toa factoringcompanywithin theVolkswagenGroup
platform mQb —ModularerOuerbaukasten–modularplatform
production —numberofvehiclesproduced.ThetotalproductionfigurealsoincludesproductionofvehiclesforotherVolkswagenGroupbrands(Volkswagen-andAudi-brandvehiclesproducedbySAIPL).Foraccu-racy,vehicleassemblykitsarereportedinthevehiclessegment
registrations —numberofnewŠKODA-brandvehiclesofficiallyregisteredinagivencountry
sales —numberofvehiclessoldtoimportersanddealers.Theunitsalesfigurealsoincludessalesofve-hiclesmanufacturedbyotherVolkswagenGroupbrands(SEATvehiclessoldbySAS;VWandAUDIvehiclessoldbySAIPL).Foraccuracy,vehicleassemblykitsarereportedinthevehiclessegment

236 Annual Report 2011
GlossAry of terms And AbbreviAtion
sAd —ŠKODAAUTODeutschlandGmbH,asubsidiaryofŠKODAAUTOa.s.
sAipl —SkodaAutoIndiaPrivateLtd.,asubsidiaryofŠKODAAUTOa.s.
sAp —SkodaAutoPolskaS.A.,asubsidiaryofŠKODAAUTOa.s.
sAs —ŠKODAAUTOSlovensko,s.r.o.,asubsidiaryofŠKODAAUTOa.s.
tdi / tsi —Turbochargeddieselenginewithdirectfuelinjection/TurbochargedpetrolenginewithdirectfuelInjection
temporary workers —employeesofalabouragencywhoaretemporarilysecondedtoworkforadifferentemployer
Z.E.B.R.A. —aninternalcorporatesystemofproposalsforworkimprovements

237Annual Report 2011
LisT of non-consoLidATEd cAPiTAL hoLdinGs of ŠKodA AuTo
List of non-consolidated capital holdings of ŠKODA AUTO
ŠKODA AUTO a.s.
ŠKO-ENERGO, s.r.o e4t electronics for transportation s.r.o
Mladá Boleslav, Czech RepublicŠKODA AUTO stake: 44.5%
Principal business:generation and distribution of heat,electricity generation and trading,gas distribution, production of drinking and service waterwater mains and sewer systems operation
Prague, Czech RepublicŠKODA AUTO stake: 49.0%
Principal business:Research and development in the field of natural,technical and social sciences, training and consulting services.

238 Annual Report 2011
persons responsible for the AnnuAl report And post-bAlAnCe sheet events
Persons responsible for the annual report and post-balance sheet eventsEvents after the Balance Sheet Date
Nomaterialeventshaveoccurredbetween thebalancesheetdateand thedateofpreparationof this AnnualReportthathavehadanimpactonanassessmentoftheCompany’sorGroup’sassets,liabilitiesandequityortheresultsofitsoperations.
Affirmation
Thepersonsstatedbelow,responsibleforthepreparationofthisAnnualReport,herebydeclarethattheinformationcontainedinthisAnnualReportisfactualandthatnosubstantivemattersthatcouldinfluenceanaccurateandcorrectevaluationofŠKODAAUTOGroupandtheCompanyhavebeenknowinglyomittedordistorted.
MladáBoleslav,on8March2012
TheBoardofManagement:
WinfriedVahland
WinfriedKrause BohdanWojnar EckhardScholz
JürgenStackmann KarlheinzEmilHell MichaelOeljeklaus Personsresponsibleforaccouting:
DanaNěmečková JanaFernándezZambrano

239Annual Report 2011
KEy fiGuREs And finAnciAL REsuLTs AT A GLAncE
Key figures and financial results* at a glanceŠKODA AUTO key figures and financial results according to CAS
Production, sales and technical data
1999 2000 2001 2002 2003 2004
Deliveries to customers vehicles 385,330 435,403 460,252 445,525 449,758 451,675
Sales vehicles 376,329 448,394 460,670 440,572 438,843 441,820
Production vehicles 371,169 450,910 460,886 442,469 437,554 444,121
Employees persons 22,030 25,833 24,129 23,470 22,798 24,561
Profit and loss account
1999 2000 2001 2002 2003 2004
Sales CZK millions 110,409 136,283 153,271 145,694 145,197 153,550
of which:
Domestic % 19 18 18 18 17 15
Export % 81 82 82 82 83 85
Raw materials and consumables CZK millions 80,426 105,996 116,350 109,868 108,283 115,382
% of revenues 72.8 77.8 75.9 75.4 74.6 75.1
Value added CZK millions 18,513 18,977 22,296 22,056 23,343 24,884
% of revenues 16.8 13.9 14.6 15.1 16.0 16.2
Staff costs CZK millions 6,629 7,465 7,583 7,834 8,060 8,500
Depreciation CZK millions 6,516 7,768 9,646 10,826 10,296 10,606
Operating profit CZK millions 5,237 5,204 4,643 3,677 5,209 5,856
% of revenues 4.7 3.8 3.0 2.5 3.6 3.9
Financial result CZK millions (1,422) (1,029) (1,969) (1,188) (2,692) (1,041)
Profit before income tax CZK millions 3,814 4,175 2,674 2,489 2,517 4,815
Profit before income tax-to-revenues ratio % 3.5 3.1 1.7 1.7 1.7 3.2
Tax on profit or loss CZK millions 1177 839 545 664 1039 1318
Profit for the year CZK millions 2,637 3,336 2,129 1,825 1,478 3,497
Profit for the year-to-revenues ratio % 2.4 2.4 1.4 1.3 1.0 2.3
* The financial results reported according to CAS are not comparable with the financial results reported according to IFRS.

240 Annual Report 2011
KEy fiGuREs And finAnciAL REsuLTs AT A GLAncE
Balance sheet / financing
1999 2000 2001 2002 2003 2004
Fixed assets CZK millions 33,687 39,175 45,008 44,873 44,074 41,143
Current assets and other assets CZK millions 21,923 27,486 21,603 21,945 22,077 30,694
of which:
Loans to and deposits CZK millions - - - - - 8,600
Equity CZK millions 22,700 26,032 28,157 29,817 31,758 32,844
Liabilities and other liabilities CZK millions 32,910 40,629 38,454 37,001 34,393 38,993
of which:
Bonds CZK millions - 10,000 10,000 10,000 10,000 10,000
Provisions under special regulations CZK millions 4,949 4,284 3,939 4,398 5,108 6,522
Bank loans CZK millions 3,000 4,850 2,000 5,000 - -
Assets CZK millions 55,610 66,661 66,611 66,818 66,151 71,837
Net liquidity CZK millions (1,339) (4,007) (798) (4,660) 2,495 4,534
Investments CZK millions 11,313 13,873 16,235 11,586 10,248 8,430
Investment ratio % 10.2 10.2 10.6 8.0 7.1 5.5
Equity ratio % 40.8 39.1 42.3 44.6 48.0 45.7
Equity-to-fixed assets ratio % 67.4 66.5 62.6 66.4 72.1 79.8

241Annual Report 2011
key figures and financial results according to IFRS
Production, sales and technical data
ŠKODA AUTO Group ŠKODA AUTO Company
2005 2006 2007 2008 2005 2006 2007 2008
Deliveries to customers vehicles 492,111 549,667 630,032 674,530 492,111 549,667 630,032 674,530
Sales vehicles 498,467 562,251 619,635 625,819 493,119 555,202 623,085 622,090
Sales of ŠKODA cars 496,387 559,821 617,269 621,683 493,119 555,202 623,085 622,083
Production vehicles 494,127 556,347 623,291 606,614 494,637 556,433 623,529 603,247
Production of ŠKODA cars 494,127 556,347 622,811 603,981 494,637 556,433 623,529 603,247
Employees* persons 26,742 27,680 29,141 26,695 26,014 26,738 27,753 25,331
ŠKODA AUTO Group ŠKODA AUTO Company
2009 2010 2011 2009 2010 2011
Deliveries to customers vehicles 684,226 762,600 879,184 684,226 762,600 879,184
Sales vehicles 551,604 584,763 690,350 539,382 583,780 676,787
Sales of ŠKODA cars 545,690 576,270 679,112 539,380 583,780 676,785
Production vehicles 522,542 583,333 681,880 519,910 576,362 673,127
Production of ŠKODA cars 519,645 575,742 674,010 519,910 576,362 673,127
Employees* persons 26,153 24,714 26,565 24,817 23,308 24,936
* In 2010 the method of reporting the employee’s headcount was altered. The number of employees is reported excluding temporary employees and including apprentices and represents actual number of employees as at 31 December.
KEy fiGuREs And finAnciAL REsuLTs AT A GLAncE

242 Annual Report 2011
Profit and loss account
ŠKODA AUTO Group ŠKODA AUTO Company
2005 2006 2007 2008 2005 2006 2007 2008
Sales revenue CZK millions 187,382 203,659 221,967 200,182 177,822 189,816 211,026 188,572
of which:
Domestic % 13.3 12.6 11.8 11.9 14.0 13.5 12.4 12.7
Export % 86.7 87.4 88.2 88.1 86.0 86.5 87.6 87.3
Cost of sales CZK millions 163,738 175,636 185,474 171,523 159,187 167,709 180,865 165,600
% of revenues 87.4 86.2 83.6 85.7 89.5 88.4 85.7 87.8
Gross profit CZK millions 23,644 28,023 36,493 28,659 18,635 22,107 30,161 22,972
% of revenues 12.6 13.8 16.4 14.3 10.5 11.6 14.3 12.2
Distribution expenses CZK millions 10,611 11,903 13,201 12,804 6,558 6,905 7,964 7,590
Administrative expenses CZK millions 3,676 3,587 4,207 4,712 3,329 3,161 3,701 4,223
Balance of other operating revenues/costs
CZK millions 1,503 2,069 699 2,477 1,256 1,735 525 1,477
Operating profit CZK millions 10,860 14,602 19,784 13,620 10,004 13,776 19,021 12,636
% of revenues 5.8 7.2 8.9 6.8 5.6 7.3 9.0 6.7
Financial result CZK millions (787) (404) 171 262 (564) (216) 425 651
Profit before income tax CZK millions 10,073 14,198 19,860 13,376 9,440 13,560 19,446 13,287
Profit before income tax-to-revenues ratio % 5.4 7.0 8.9 6.7 5.3 7.1 9.2 7.0
Income tax expense CZK millions 2,180 3,136 3,878 2,558 2,077 2,678 3,554 2,020
Profit for the year* CZK millions 7,893 11,062 15,982 10,818 7,363 10,882 15,892 11,267
Profit for the year-to-sales ratio % 4.2 5.4 7.2 5.4 4.1 5.7 7.5 6.0
* Consolidated figures are given net of non-controlling interests.
KEy fiGuREs And finAnciAL REsuLTs AT A GLAncE

243Annual Report 2011
Profit and loss account
ŠKODA AUTO Group** ŠKODA AUTO Company**
2009 2010 2011 2009 2010 2011
Sales revenue CZK millions 187,858 219,454 252,562 170,666 203,695 231,742
of which:
Domestic % 11.5 10.0 8.7 12.5 10.7 9.5
Export % 88.5 90.0 91.3 87.5 89.3 90.5
Cost of sales CZK millions 166,296 190,234 215,956 155,868 180,343 201,765
% of revenues 88.5 86.7 85.5 91.3 88.5 87.1
Gross profit CZK millions 21,562 29,220 36,606 14,798 23,352 29,977
% of revenues 11.5 13.3 14.5 8.7 11.5 12.9
Distribution expenses CZK millions 13,153 14,509 17,549 7,702 9,449 11,613
Administrative expenses CZK millions 4,826 5,256 6,123 4,320 4,666 5,504
Balance of other operating revenues/costs CZK millions 2,341 1,861 5,323 1,948 1,798 4,364
Operating profit CZK millions 5,924 11,316 18,257 4,724 11,035 17,224
% of revenues 3.2 5.2 7.2 2.8 5.4 7.4
Financial result CZK millions (667) (382) 791 (343) 180 (69)
Profit before income tax CZK millions 4,702 10,586 19,275 4,381 11,215 17,155
Profit before income tax-to-revenues ratio % 2.5 4.8 7.6 2.6 5.5 7.4
Income tax expense CZK millions 1,240 1,747 3,200 942 1,811 2,867
Profit for the year* CZK millions 3,462 8,839 16,075 3,439 9,404 14,288
Profit for the year-to-sales ratio % 1.8 4.0 6.4 2.0 4.6 6.2
* Consolidated figures are given net of non-controlling interests.** As a result of a change in accounting policy for presentation of reversals of excess provisions and accruals in 2011 the comparative figures of the Group and of the Company for 2010. For more information please refer to note 1.3.2. in consolidated financial statements for the Group and to note 1.3.2. in separate financial statements for the Company.
KEy fiGuREs And finAnciAL REsuLTs AT A GLAncE

244 Annual Report 2011
Balance sheet / financing
ŠKODA AUTO Group ŠKODA AUTO Company
2009 2010 2011 2009 2010 2011
Non-current assets CZK millions 59,083 58,864 64,686 59,926 59,989 64,441
Current assets CZK millions 59,293 76,872 88,871 48,099 62,278 71,130
of which:
Loans and deposits CZK millions 13,562 35,678 49,088 13,562 34,378 44,848
Equity* CZK millions 68,180 74,772 81,211 68,519 75,682 80,407
Non-current and current liabilities CZK millions 50,196 60,964 72,346 39,506 46,585 55,164
of which:
Nominal value of bonds CZK millions 2,000 - - 2,000 - -
Assets CZK millions 118,376 135,736 153,557 108,025 122,267 135,571
Net liquidity CZK millions 28,013 40,211 47,348 23,350 35,047 41,399
Cash flows from operating activities CZK millions 26,529 28,168 28,251 22,321 26,256 27,267
Cash flows from investing activities CZK millions (10,942) (23,313) (28,225) (11,454) (22,590) (27,716)
Investment ratio % 5.4 4.6 5.6 6.0 4.9 6.0
Equity ratio % 57.6 55.1 52.9 63.4 61.9 59.3
Equity-to-fixed assets ratio % 115.4 127.0 125.5 114.3 126.2 124.8
* Consolidated figures are given net of non-controlling interests.
KEy fiGuREs And finAnciAL REsuLTs AT A GLAncE
Balance sheet / financing
ŠKODA AUTO Group ŠKODA AUTO Company
2005 2006 2007 2008 2005 2006 2007 2008
Non-current assets CZK millions 55,424 54,292 56,767 60,017 55,023 53,936 56,903 60,119
Current assets CZK millions 34,331 50,920 59,014 62,439 28,956 43,499 48,658 51,276
of which:
Loans and deposits CZK millions 11,200 23,950 25,554 25,721 11,200 23,950 25,554 25,238
Equity* CZK millions 46,757 58,321 67,034 71,608 46,483 58,007 66,532 71,721
Non-current and current liabilities CZK millions 42,998 46,891 48,747 50,848 37,496 39,428 39,029 39,674
of which:
Nominal value of bonds CZK millions 5,000 5,000 2,000 2,000 5,000 5,000 2,000 2,000
Assets CZK millions 89,755 105,212 115,781 122,456 83,979 97,435 105,561 111,395
Net liquidity CZK millions 4,911 21,157 29,736 18,272 6,070 19,352 26,283 18,353
Cash flows from operating activities CZK millions 23,550 27,420 30,787 13,014 21,421 24,203 29,275 13,978
Cash flows from investing activities CZK millions (11,566) (11,090) (13,785) (16,147) (11,299) (10,910) (13,913) (14,445)
Investment ratio % 4.7 4.1 4.9 5.6 4.8 4.3 4.9 5.4
Equity ratio % 52.1 55.4 57.9 58.5 55.4 59.5 63.0 64.4
Equity-to-fixed assets ratio % 84.4 107.4 118.1 119.3 84.5 107.5 116.9 119.3
* Consolidated figures are given net of non-controlling interests.


Published by:© ŠKODA AUTO a.s., 2012Tř. Václava Klementa 869293 60 Mladá BoleslavCzech RepublicID No.: 00177041
Recorded in the Commercial Register maintainedby the Prague Municipal Court,Part B, Entry No. 332Tel.: +420 326 811 111Fax: +420 326 721 328
The Annual Report 2011 is also available on the Company’s website:www.skoda-auto.czwww.skoda-auto.com
2011 Annual Report closing date: 8 March 2012Financial section prepared in-house using FIRE.sys
Consulting, text (magazine) and print production:© Carlsberg & Richter – Communications Consulting, Munich, 2012Art Direction: Ludwig Heiss