simplifying total residual chlorine compliance testing
TRANSCRIPT

1
Graham AndersonGeorge Bowman andDeWayne Kennedy-Parker
Rick Mealy
Simplifying Total Residual Chlorine
Compliance Testing
Disclaimer
Any reference to product or company names does not constitute endorsement by
the Wisconsin State Laboratory of Hygiene, the University of Wisconsin, or
the Department of Natural Resources.

2
Measurement of total residual chlorine (TRC) at levels low enough to meet wastewater discharge limits has been (historically) difficult at best. Methods approved for measurement of chlorine in wastewater are often technically demanding and time consuming. Commercial test kits are available to simplify these procedures. However, commercial test kits often gloss over the very important aspects of the testing, including calibration, spiking and other quality control (QC) processes.
Getting the Best Chlorine Residual Data
North Carolina:current chlorine standards are 0.017 mg/L total residual chlorine (TRC) for trout waters 0.017 mg/L TRC as an action level for non-trout waters.
What Other States Are Doing
Pennsylvania:current permit limits set at 0.011 mg/L total residual chlorine (TRC)
Wisconsin:current permit limits set at 0.038 mg/L total residual chlorine (TRC) Accept 0.100 mg/L as an LOD

3
Challenges in Testing Chlorine at levels required to meet discharge limitsNR219 states the chlorine must be analyzed immediately (within 15 minutes of collection)The 15 minute time frame is very restrictive – Difficult to calibrate, warm sample to room
temperature and test within 15 minutes– Almost precludes analysis by the ISE method-
ISE is extremely temperature sensitive– Sampling and analysis to achieve the 0.038
ppm discharge limit becomes a logistical challenge
Today’s ObjectivesDiscuss wastewater chlorine compliance testing requirementsDiscuss logistics to achieve quality chlorine results:– Working with your DNR engineer– Optimizing sampling
Describe testing options availableTwo part session:– DPD method-Part 1– ISE method-Part 2
Break into 4 groups for hands-on demos for DPD Method– Compare standard curves among groups
Live demonstration of the ISE methodDiscussion-which approach best meets your needs?

4
Collecting a Sample for Total Residual Chlorine
Collect samples in amber, glass bottles treated with bleach to remove chlorine demand.– Treat bottles by filling with DI water, adding a few
mL of household bleach, allow to soak about 30 minutes and then rinse thoroughly with tap water followed by DI water.
Minimize the time between sampling and analysis (preferably = < 15 mins.)Warm samples to room temperature before testing with the ISE method.Fill sample completely to minimize contact with the air until samples are tested.
Sampling Logistics
Calibrate your instrument before sampling– Have it ready to roll when you arrive with the
sampleCollect sample in stabilized amber glass bottleWork with you DNR engineer:– Collect some test data to see how time delays affect
results– Your engineer may be able work with you through
the permit process

5
Chlorine Analysis Options
Two principal techniques
Ion Selective Electrode (ISE)
DPD Colorimetric
DPD

6
The exclusive use of generic instructions is not acceptable.– No true calibration– No QC– No spikes/dupes
These instructions are useful for quick checks and summary only
Generic InstructionThese instructions are simplistic. Alone, they are insufficient for proper testing.
Using a commercial method does not exempt you from the QA and QC established in the original EPA/Std. Methods.
Commercial Method + QA/QC = Acceptable Testing
0.891 g KMnO4 X 1 mole X 5 moles I2 X 2 equivalents Cl2L 158 g KMnO4 2.5 moles I2 mole
= 0.028093 equivalents X 1 mL = 0.0002819 N as Cl2L 100 mL
Dark bottle prevents degradation due to light
Standard is of correct concentration and
labeled appropriately
Preparing Potassium Permanganate -Chlorine Equivalent Standard
1000 ppm Cl2

7
Preparing Calibration Standards
with Class A Pipets
Stocksol.
(1000ppm)
Workingsol.
(1 ppm)
0.03 ppmDNR LOD goal
0.038 ppm
DNR req’d LOD0.100 ppm
0.05 ppm
0.20 ppm100 ml20.00 ml
0.15 ppm100 ml15.00 ml
0.10 ppm100 ml10.00 ml
100 ml5.00 ml
100 ml3.00 ml
Final ConcentrationFinal VolumeWorking Solution 1 ppm
Prepare working standard by diluting 1 mL of 1000 ppm to 1L with DI water. Must use pipettor & 1L volumetric flask.
Preparing Calibration Standards
with a Variable Volume Pipettor
* Use a 0.1-1 mL variable volume pipettor
0.05 ppm DNR LOD goal0.038 ppm
DNR req’d LOD0.100 ppm
0.20 ppm50 ml1.0 ml*0.15 ppm50 ml0.75 ml*
100 ml1.0 ml*
100 ml0.5 ml*
0.03 ppm100 ml0.30 ml*
Final ConcentrationFinal VolumeWorking Solution 10 ppm
0.10 ppm
Prepare a 10 ppmworking standard by diluting 1 mL of 1000 ppm to 100 mL with DI water. Must use pipettor
8
Approaches for Color Development
Commercially available DPD ampulesDry powder
Packets “pillows”Dispenser bottles
Commercially available DPD Solutions (per Standard Methods)
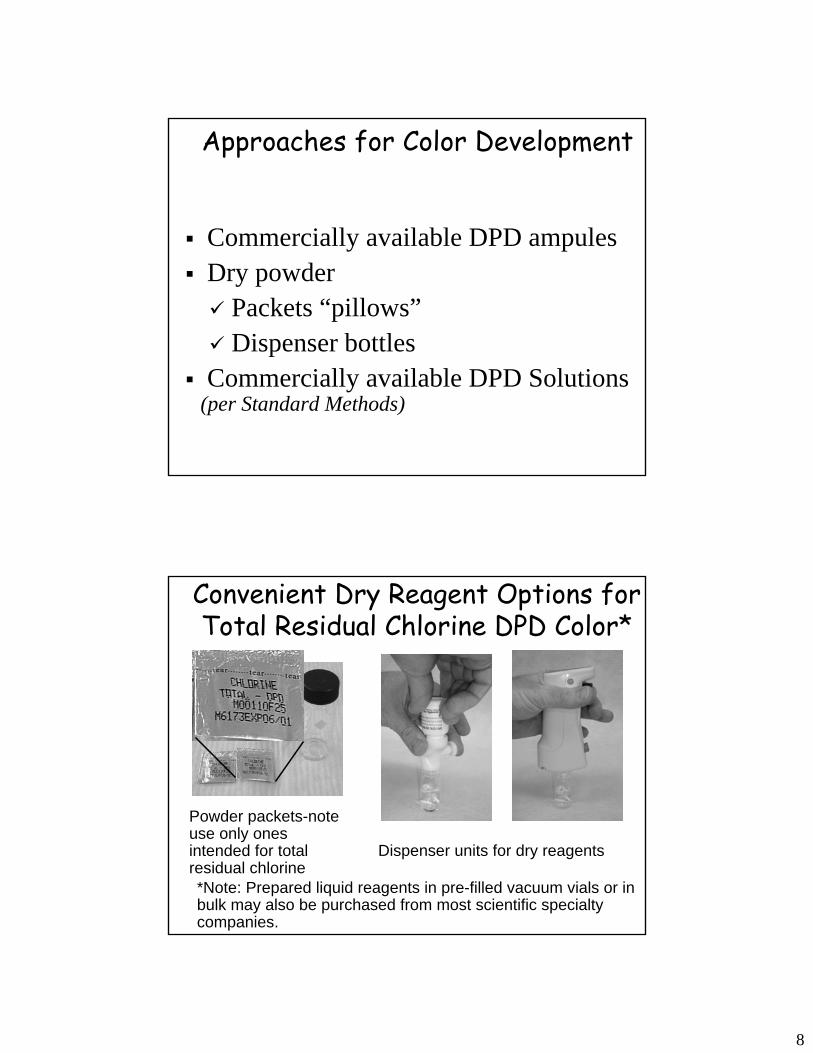
Convenient Dry Reagent Options for Total Residual Chlorine DPD Color*
Powder packets-note use only ones intended for total residual chlorine
Dispenser units for dry reagents
*Note: Prepared liquid reagents in pre-filled vacuum vials or in bulk may also be purchased from most scientific specialty companies.

9
Instruments for the DPD method
Most brands of spectrophotometers or filter photometers may be used to measure chlorine in wastewater effluent using the DPD method if they meet the following requirements:– The wavelength can be adjusted to the 515-530 ηm range– It will accommodate a 2 cm or large cell.– Check the instrument manual to confirm the above
Initial Instrument Set-up
1. Allow instrument to warm up according to manufacturer, generally at least 30 minutes.
2. Select mode (program or absorbance) and set the wavelength to 515 or 530ηm depending on instrument type.
3. Zero the instrument with lab reagent water with DPD reagent and proceed with the calibration step.
10
Tips for CalibrationWe recommend using only 1 sample cell when for calibration and sample analysisWe also recommend calibrating dailyAlways align the cell in the instrument the same way…use mark to align
If you use more than one cell, make sure they are “matched”– Optical quality cells vary from cell to cell– Fill all cells with DI water– Zero instrument with one cell– Measure and record absorbance, and compare– Group cells that have similar absorbance –
best results when cells vary by <0.005 from each other
Today’s demo-will use multiple cells because of time restrictions
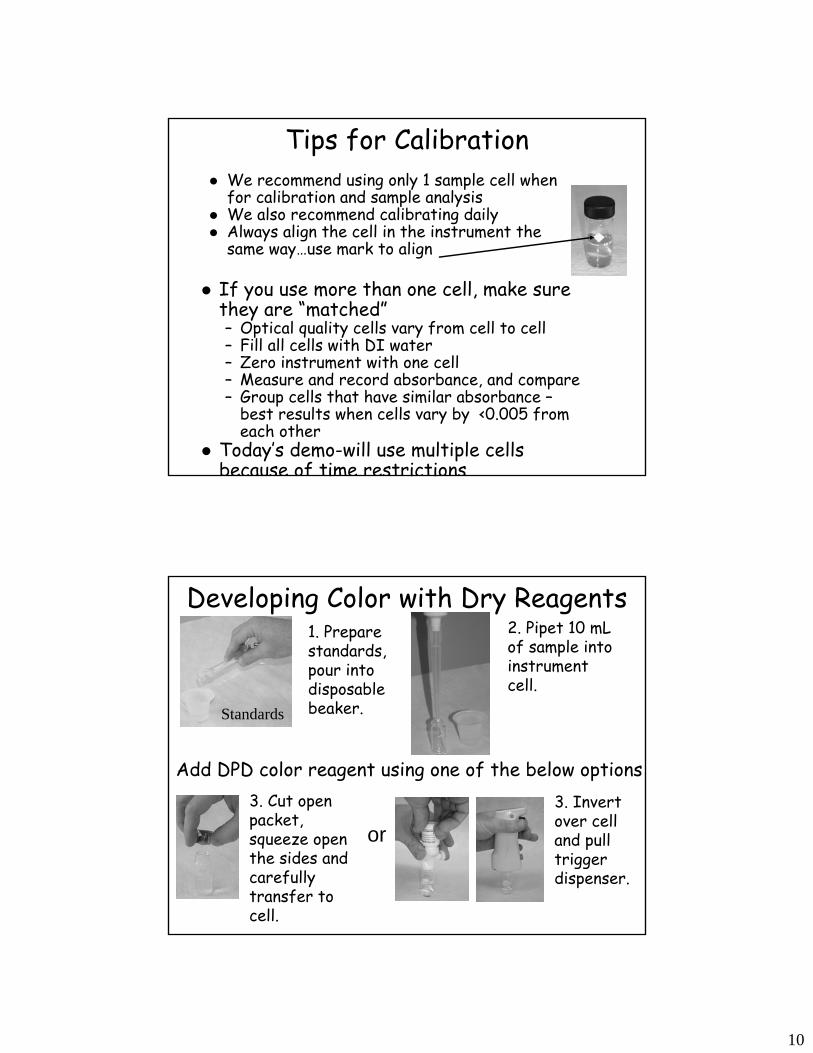
Developing Color with Dry Reagents
Standards
1. Prepare standards, pour into disposable beaker.
2. Pipet 10 mL of sample into instrument cell.
3. Cut open packet, squeeze open the sides and carefully transfer to cell.
Add DPD color reagent using one of the below options3. Invert over cell and pull trigger dispenser.
or

11
Developing Color with Powder Pillows
4. Cap cell, mix thoroughly and start timer.
5. If using the Hachreagents and wait 3 minutes. Note: HF Science recommends 2 minutes. Our experience shows 3 minutes works best.
6. Wipe-off any smudges from the cell with a soft, lint-free tissue, place in spectrophotometer and observe the absorbance or press read.
7. Remove cell, discard sample, rinse thoroughly with DI water and proceed to the next standard.
Remember to align the cell in the instrument the same way EVERY time!
Note: If using multiple cells, time reagent addition so that you may proceed to the next standard quickly….this takes good timing and lots of practice.

12
Making a Calibration Curve:Record Data
Record the absorbance of each calibration standardThis data is used when calculating a calibration curve.
Use a calculator, Excel, or “on-board” software that comes with most spectrophotometers.In Excel, you can use the CORREL formula.
Calibration Curve (permanganate chlorine equivalent)
y = 0.522974x + 0.001154
0.000
0.020
0.040
0.060
0.080
0.100
0.120
0.140
0.160
0.000 0.100 0.200 0.300Conc. (ppm)
Abs
orba
nce
SampleCalibration BlankStandard 1Standard 2Standard 3Standard 4Standard 5Standard 6
True Value Notes
0.00.030.050.100.150.200.25
Absorbance0.0000.0160.0290.0560.0800.1000.135
R = 0.998079
Chlorine by the DPD Method (Hach 2500)
y = 0.6301x - 0.0053R2 = 0.9917
-0.020
0.020.040.060.080.1
0.120.14
0 0.05 0.1 0.15 0.2 0.25Chlorine mg/L
Abs
orba
nce
r=0.9958
Calibration Curve-up close
Std. Conc. ppm ABS.0 0
0.03 0.0130.05 0.0220.07 0.034
0.1 0.0610.2 0.122
13
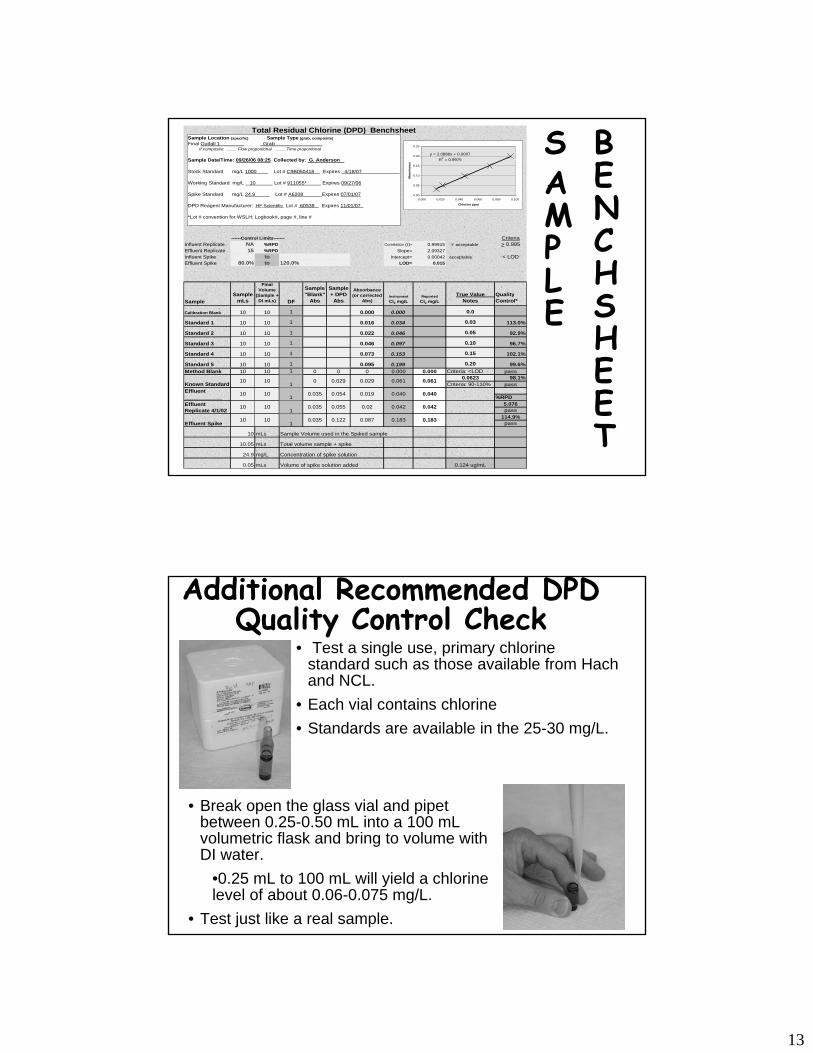
Total Residual Chlorine (DPD) Benchsheet
------Control Limits------- CriteriaInfluent Replicate NA %RPD Correlation (r)= 0.99915 'r' acceptable > 0.995Effluent Replicate 15 %RPD Slope= 2.09327Influent Spike to Intercept= 0.00042 acceptable < LODEffluent Spike 80.0% to 120.0% LOD= 0.015
SampleSample
mLs
Final Volume
(Sample + DI mLs) DF
Sample "Blank"
Abs
Sample + DPD Abs
Absorbance (or corrected
Abs)Instrument Cl2 mg/L
Reported Cl2 mg/L
True Value Notes
Quality Control*
Calibration Blank 10 10 1 0.000 0.000 0.00 0.0
Standard 1 10 10 1 0.016 0.034 RF= 0.533 0.03 113.0%
Standard 2 10 10 1 0.022 0.046 RF= 0.440 0.05 92.9%
Standard 3 10 10 1 0.046 0.097 RF= 0.460 0.10 96.7%
Standard 4 10 10 1 0.073 0.153 RF= 0.487 0.15 102.1%
Standard 5 10 10 1 0.095 0.199 RF= 0.475 0.20 99.6%Method Blank 10 10 1 0 0 0 0.000 0.000 Criteria: <LOD pass
0.0623 98.1%Criteria: 90-110% pass
%RPD5.076pass
114.9%pass
10 mLs Sample Volume used in the Spiked sample by mass:
10.05 mLs Total volume sample + spike 114.3%
24.9 mg/L Concentration of spike solution
0.05 mLs Volume of spike solution added 0.124 ug/mL
0.087 0.183 0.183
0.02 0.042 0.042
0.019 0.040 0.040
0.061Known Standard 10 101
0.029 0.0610 0.029
0.035 0.054
Effluent Spike10 10
1Effluent Replicate 4/1/02
10 10
1
Effluent ____________ 10 10
1
0.035 0.055
0.035 0.122
Sample Location (specific) Sample Type (grab, composite)Final Outfall 1 Grab If composite: ____ Flow proportional ____Time proportional
Sample Date/Time: 09/26/06 08:25 Collected by: G. Anderson Stock Standard mg/L 1000 Lot # C9B050418 Expires 4/18/07
Working Standard mg/L 10 Lot # 911055* Expires 09/27/06
Spike Standard mg/L 24.9 Lot # A6208 Expires 07/01/07
DPD Reagent Manufacturer: HF Scientific Lot # 60539 Expires 11/01/07
*Lot # convention for WSLH: Logbook#, page #, line #
y = 2.0886x + 0.0007R2 = 0.9975
0.00
0.05
0.10
0.15
0.20
0.25
0.000 0.020 0.040 0.060 0.080 0.100
Chlorine ppm
Abs
orba
nce
SAMPLE
BENCHSHEET
Additional Recommended DPD Quality Control Check
• Break open the glass vial and pipetbetween 0.25-0.50 mL into a 100 mL volumetric flask and bring to volume with DI water.
•0.25 mL to 100 mL will yield a chlorine level of about 0.06-0.075 mg/L.
• Test just like a real sample.
• Test a single use, primary chlorine standard such as those available from Hachand NCL.
• Each vial contains chlorine• Standards are available in the 25-30 mg/L.
14
Analyzing a SampleWhen analyzing a sample record both absorbances (without DPD and with DPD) on the data sheet.Subtract the without DPD absorbance from the with DPD absorbance to get the adjusted absorbance.This adjusted absorbance corrects for any natural absorbance of the sample due to color or turbidity.Handle blank & sample +DPD the same (timing)!
WITH DPD - without DPD = Adjusted Absorbance
Sample no. no DPD with DPD Adj. Abs.Outfall no. 1 0.01 0.032 0.022Outfall no. 2 0.012 0.048 0.036 Use this value to
calculate the sample concentration
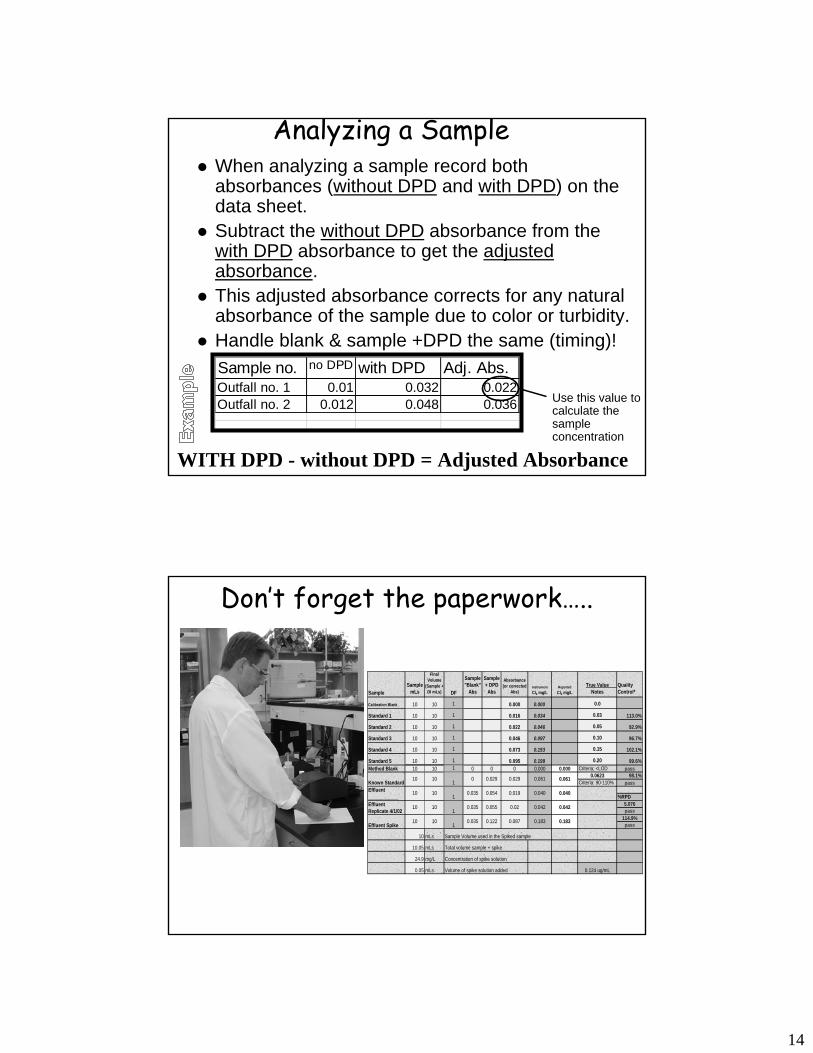
Don’t forget the paperwork…..
SampleSample
mLs
Final Volume
(Sample + DI mLs) DF
Sample "Blank"
Abs
Sample + DPD
Abs
Absorbance (or corrected
Abs)Instrument Cl2 mg/L
Reported Cl2 mg/L
True Value Notes
Quality Control*
Calibration Blank 10 10 1 0.000 0.000 0.00 0.0
Standard 1 10 10 1 0.016 0.034 RF= 0.533 0.03 113.0%
Standard 2 10 10 1 0.022 0.046 RF= 0.440 0.05 92.9%
Standard 3 10 10 1 0.046 0.097 RF= 0.460 0.10 96.7%
Standard 4 10 10 1 0.073 0.153 RF= 0.487 0.15 102.1%
Standard 5 10 10 1 0.095 0.199 RF= 0.475 0.20 99.6%Method Blank 10 10 1 0 0 0 0.000 0.000 Criteria: <LOD pass
0.0623 98.1%Criteria: 90-110% pass
%RPD5.076pass
114.9%pass
10 mLs Sample Volume used in the Spiked sample by mass:
10.05 mLs Total volume sample + spike 114.3%
24.9 mg/L Concentration of spike solution
0.05 mLs Volume of spike solution added 0.124 ug/mL
0.035 0.055
0.035 0.122
Effluent ____________ 10 10
10.035 0.054
Effluent Spike10 10
1Effluent Replicate 4/1/02
10 10
1
0.061Known Standard10 10
10.029 0.0610 0.029
0.019 0.040 0.040
0.183
0.02 0.042 0.042
0.087 0.183

15
rep #1rep #2rep #3rep #4rep #5rep #6rep #7meanstdevLOD=
LOD data by approach
Spikes level: 0.090 mg/L
0.041 0.0910.037 0.0840.039 0.0870.040 0.0890.036 0.0820.038 0.0860.041 0.0910.0870.003650.0115
HACH DR890Abs. CURVE
0.053 0.0920.048 0.0840.047 0.0830.049 0.0860.047 0.0830.054 0.0940.049 0.0860.08680.00440.0133
HACH DR2500Abs. CURVE
DPDHands on DEMOS

16
ISE
• Electronic or mechanical, variable volume pipettors in the 100 to 1000 µL range
• Orion model 97-70 residual chlorine electrode
• pH/ISE meter• Magnetic stir plate• Magnetic stir bar
Key Equipment needed for ISE

17
Ion Selective Electrode (ISE) TheoryBased on iodometric measurement of chlorineIodide (I-)and acid (H+) are added to the sampleIodide reacts with chlorine to form iodineThe iodine concentration is equal to the chlorine concentrationThe ISE contains a platinum sensing element and iodine sensing reference elementThe platinum element develops a potential that depends on the relative amount of iodine and iodide in solution.The iodine-sensing element develops a potential that depends on the iodide level in solutionThe meter measures the difference between these potentials (the iodine concentration)Iodine concentration = total residual chlorine concentrationDifferences from ammonia:– A. Slope is positive– B. mV per decade of concentration is 29.0, not 58
From: Orion Research. 1983. Instruction Manual
Chlorine Residual electrode Model 97-70-00
Problems with the ISE method
2. Temperature changeis also a problem
Calibration curve shifts about 0.2 mV per degree C difference between standards and samples
1. Non-linearity
Orion specifies blank subtraction below 0.2 ppm
18
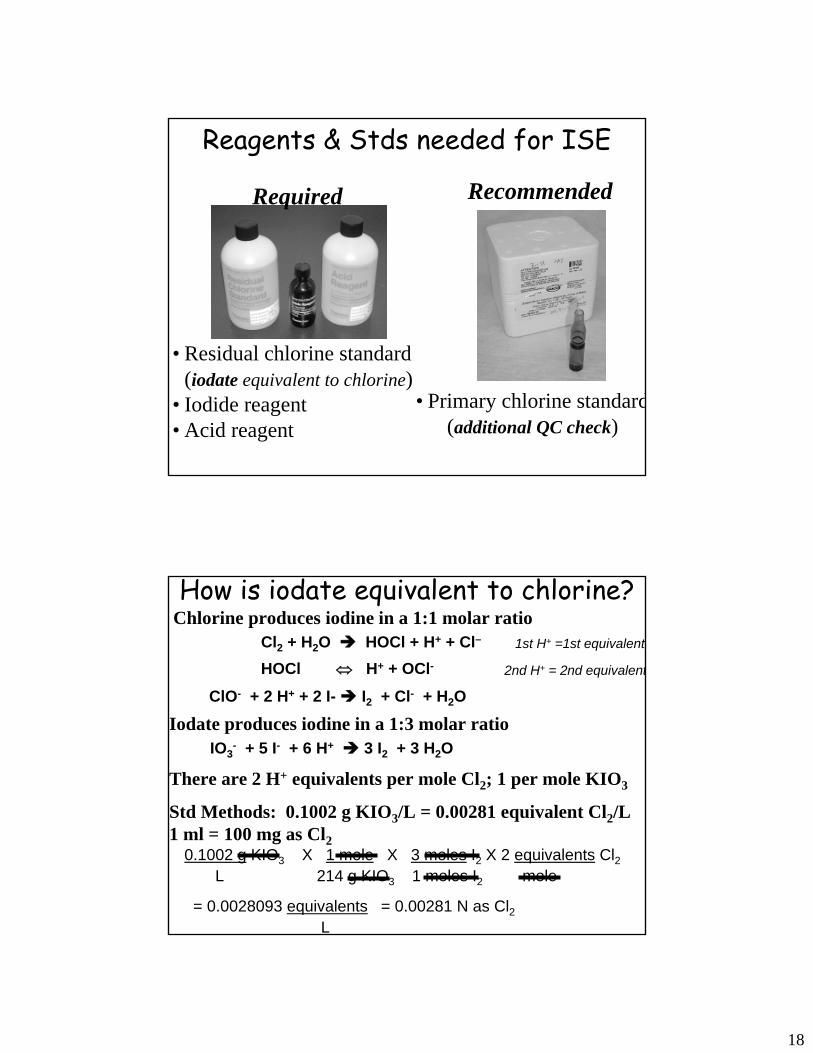
• Residual chlorine standard (iodate equivalent to chlorine)
• Iodide reagent• Acid reagent
Required Recommended
• Primary chlorine standard(additional QC check)
Reagents & Stds needed for ISE
How is iodate equivalent to chlorine?
Cl2 + H2O HOCl + H+ + Cl–
HOCl ⇔ H+ + OCl-
ClO- + 2 H+ + 2 I- I2 + Cl- + H2O
IO3- + 5 I- + 6 H+ 3 I2 + 3 H2O
0.1002 g KIO3 X 1 mole X 3 moles I2 X 2 equivalents Cl2L 214 g KIO3 1 moles I2 mole
= 0.0028093 equivalents = 0.00281 N as Cl2L
Chlorine produces iodine in a 1:1 molar ratio
There are 2 H+ equivalents per mole Cl2; 1 per mole KIO3
Std Methods: 0.1002 g KIO3/L = 0.00281 equivalent Cl2/L1 ml = 100 mg as Cl2
1st H+ =1st equivalent
2nd H+ = 2nd equivalent
Iodate produces iodine in a 1:3 molar ratio
19
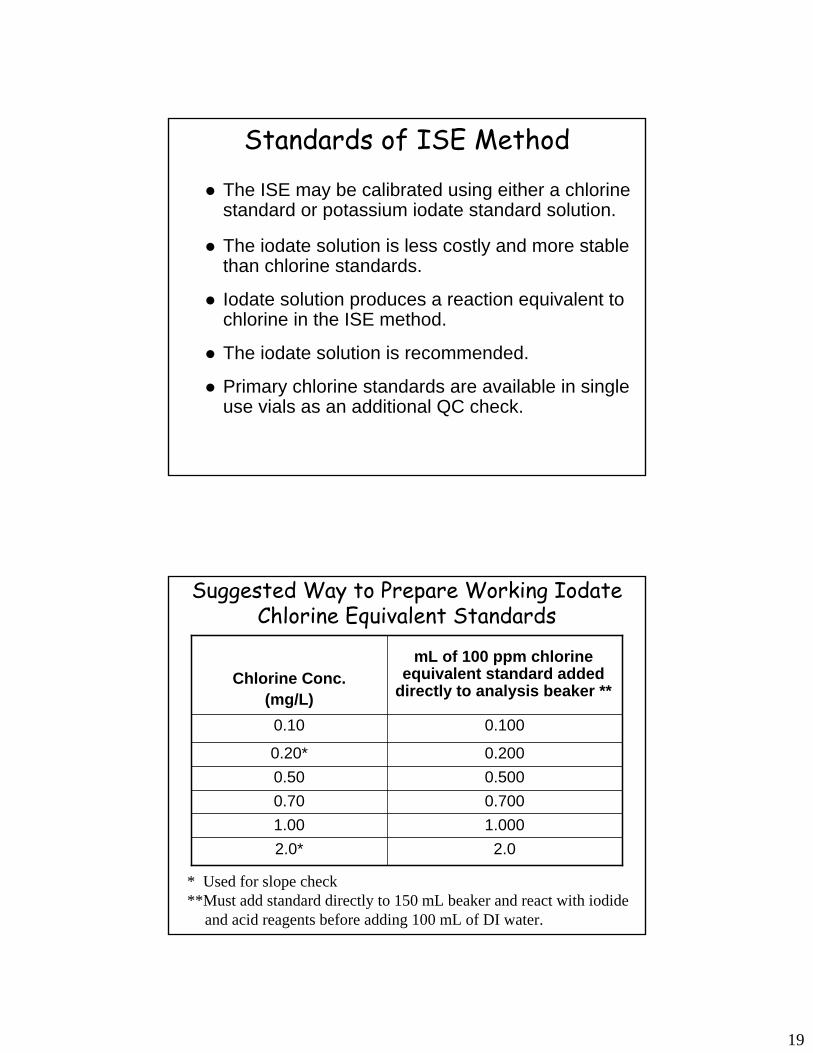
Standards of ISE Method
The ISE may be calibrated using either a chlorine standard or potassium iodate standard solution.
The iodate solution is less costly and more stable than chlorine standards.
Iodate solution produces a reaction equivalent to chlorine in the ISE method.
The iodate solution is recommended.
Primary chlorine standards are available in single use vials as an additional QC check.
Suggested Way to Prepare Working IodateChlorine Equivalent Standards
2.02.0*1.0001.000.7000.700.5000.500.2000.20*
0.1000.10
mL of 100 ppm chlorine equivalent standard added
directly to analysis beaker **Chlorine Conc.
(mg/L)
* Used for slope check**Must add standard directly to 150 mL beaker and react with iodide
and acid reagents before adding 100 mL of DI water.

20
1. Add a magnetic stir bar to a 150 mL beaker
2. Pour off 100 ppm chlorine or iodate (chlorine equivalent) standard into a dispo-beaker
3. Insert a clean disposable tip a 1000 µL pipettor.
4. Pipet standard into 150 mL beaker, starting with the lowest concentration.
Standardizing the ISE
5. Pour off acid and iodide reagent into dispo-beakers.
6. Add 1 mL of acid reagent to the beaker containing the standard
7. Add 1 mL of iodide reagent to the beaker.
8. Swirl beaker to mix
9. Allow solution to sit and react for2 minutes
ISE Sample Analysis Procedure

21
10. Add 100 mL of distilled water to beaker.
11. Place beaker on magnetic stirrer and allow solution to mix about 20-30 seconds.
12. Insert electrode into solution and turn off magnetic stirrer, set meter to the mV mode.
13. Allow meter to stabilize. Be patient, it may take 5 or more minutes to stabilize. Record mV readings on bench sheet.
14. Repeat steps 3-13 to measure the remaining standards.
ISE Sample Analysis Procedure
id
ISE Calibration Example

22
• Plug observed mV readings and chlorine concentration of standards into the spreadsheet.
Calculating std curve
• Calculate a standard curve and record the equation of the line and correlation coefficient (r) on the bench sheet.
• The “r” value must be 0.995 or greater
• DO NOT proceed with sample measurements unless the slope and “r” requirements are met.
Remember that , like ammonia, you need to use the LOG of concentration when generating a regression.
Slope Check and Other Considerations
Check the slope by finding the difference between the 2.0 and 0.20 mg/L (one decade) chlorine standards. (e.g., 610.5 – 581.9 = 28.6 mV).
The slope must be in the 26-30 mV/decade range
The manufacturer states the ISE is only linear from 0.2 to 20 mg/L. Consequently, the 26-30 mV/decade specification is only valid above 0.2 mg/L.
The observed mV readings increase with increasing concentrations of chlorine.
NOTE: The opposite is true for most other ISE applications (such as ammonia).

23
Total Residual Chlorine by ISE
CriteriaCorrelation (r)= 0.99988 > (0.995) ok
Slope= 28.01 26 to 30 mV okIntercept= 602.21
LOD= 0.015------Control Limits-------
Influent Replicate 18.1 % RPDEffluent Replicate 0.04 RangeInfluent Spike 75% to 125%Effluent Spike 80% to 120%
SampleSample
mLsSample + DI mLs DF mV Cl2 mg/L
True Value Notes
Quality Control
Standard 1 50 50 1 574.4 0.10 0.1 101.7% okStandard 2 50 50 1 582.4 0.20 0.20 98.2% okStandard 3 50 50 1 593.6 0.49 0.5 98.6% okStandard 4 50 50 1 597.8 0.70 0.70 99.5% okStandard 5 50 50 1 602.5 1.02 1.0 102.4% okStandard 6 50 50 1 610.6 1.99 2.0 99.7% ok
Blank 50 50 1 532.3 0.003 Criteria: <LOD pass
3enter "%RPD"
3 or "Range"
y = 28.013x + 602.21R2 = 0.9998
570575580585590595600605610615
-1.5 -1 -0.5 0 0.5log of concentration (mg/L)
mill
volts
Sample Location (specific) Sample Type (Grab, composite)Raw ____________________ _______________________Final ____________________ _______________________ If composite: ____ Flow proportional ____Time proportionalSample Date/Time: ___________ Collected by: ______________
“Back-calculate” stds+ 5% for high std +10% for mid stds+30% for low std
Look for points that don’t “fit”.
Check slope & intercept
Evaluate the Calibration Data
1. Add a magnetic stir bar to a 150 mL beaker
3. Insert a clean disposable tip a 1000 µL pipettor.
2. Pipet (or pour-graduated cylinder) 100 mL of sample into a clean 150 mL beaker.
4. Add 1 mL of iodide reagent to the beaker.
Measuring Chlorine in Samples using the ISE

24
6. Place beaker on magnetic stirrer and allow solution to mix about 20-30 seconds.
7. Insert electrode into solution and turn off magnetic stirrer, set meter to the mV mode.
10. Repeat steps 3-9 to measure the remaining samples.
5. Add 1 mL of acid reagent to the beaker containing the standard
9. Allow meter to stabilize. Be patient, it may take 5 or more minutes to stabilize. Record mV readings on bench sheet.
8. Allow solution to sit and react for 2 minutes
Measuring Chlorine in Samples using the ISE
SampleSample
mLsSample + DI mLs DF mV Cl2 mg/L
Standard 1 50 50 1 574.4 0.10Standard 2 50 50 1 582.4 0.20Standard 3 50 50 1 593.6 0.49Standard 4 50 50 1 597.8 0.70Standard 5 50 50 1 602.5 1.02Standard 6 50 50 1 610.6 1.99Blank 50 50 1 532.3 0.003
0.101
567.5
0.040
50 50
Effluent Spike 50
1 569.2
50
1
50
574.31
563.1Known Standard
0.066Effluent Replicate
Effluent 4/1/02 0.05850 1
50 50
REMEMBER:
Record all appropriate information on the benchsheet

25
Additional Recommended ISE Quality Control Check
• Break open the glass vial and pipet a portion into a 150 mL beaker.
• Add distilled water to bring the volume to 100 mL.
• Test just like a real sample.
• Test a single use, primary chlorine standard such as those available from Hachand NCL.
• Each vial contains chlorine• Standards are available in the 25-30 mg/L
and 50-75 mg/L range.
Total Residual Chlorine by ISE
Criteria
Correlation (r)= 0.99988 > (0.995) okSlope= 28.01 26 to 30 mV ok
Intercept= 602.21LOD= 0.015
------Control Limits-------Influent Replicate 18.1 % RPDEffluent Replicate 0.04 RangeInfluent Spike 75% to 125%Effluent Spike 80% to 120%
SampleSample
mLsSample + DI mLs DF mV Cl2 mg/L
True Value Notes
Quality Control
Standard 1 50 50 1 574.4 0.10 0.1 101.7%Standard 2 50 50 1 582.4 0.20 0.20 98.2%Standard 3 50 50 1 593.6 0.49 0.5 98.6%Standard 4 50 50 1 597.8 0.70 0.70 99.5%Standard 5 50 50 1 602.5 1.02 1.0 102.4%Standard 6 50 50 1 610.6 1.99 2.0 99.7%Blank 50 50 1 532.3 0.003 Criteria: <LOD pass
0.037 108.6%Criteria: 90-110% pass
Range0.009pass
116.9%pass
50 mLs Sample Volume used50.0185 mLs Total volume sample + spike
100 mg/L Concentration of spike solution0.0185 mLs Volume of spike solution added
0.101
567.5
3enter "%RPD" 3 or "Range"
0.040
50 50
Effluent Spike 50 50
563.1
1 569.2
50
574.31
Known Standard
0.066Effluent Replicate
Effluent 4/1/02 0.05850 1
50 50 1
y = 28.013x + 602.21R2 = 0.9998
570
575
580
585
590
595
600
605
610
615
-1.2 -1 -0.8 -0.6 -0.4 -0.2 0 0log of concentration (mg/L)
Sample Location (specific) Sample Type (Grab, composite)Raw NA NA Final Outfall 001 Grab If composite: ____ Flow proportional ____Time proportionalSample Date/Time: 09/25/06 08:50 Collected by: G. Anderson Stock Standard mg/L 100 Lot # C9A060831 Expiration 08/31/07 Working Std mg/L Same Lot # ______ Expiration _______Spike Standard mg/L 50 Lot # 911056 Expiration 09/26/06Iodide Reagent Lot # I55060810 Expiration 02/10/08 Acid Reagent Lot # A13060713 Expiration 07/13/09
SAMPLE
BENCHSHEET

26
Special thanks to Graham who can do! …..Those that can’t … manage
Graham Anderson
Conclusions
An LOD of less than 0.038 ppm IS achievable0.100 ppm is certainly a realistic LOQ.Quality low level calibrations CAN be easily developed.The use of electronic or mechanical pipettors is required to obtain quality data at these trace levels.Either technique will get the results you need

27
More Conclusions
The best DPD data will be obtained using a technique providing a path-length of > 2 cm.Both hand-held and table-top spectrophotometers are available that will meet your needs.Internal calibrations not sufficiently accurate.Commercial powder and liquid DPD reagents are generally satisfactory
DPD
ISEUse the more stable potassium iodate standard for calibrationAvoid calibrating below 0.1 ppm due to non-linearityCheck the slope from 0.2 to 2.0 (start above 0.1)30-45 minutes for 5-pt calibrationISE method is extremely temperature-sensitive
DPD Advantages DisadvantagesMost labs have a spectrophotometer Color & turbidity interfereFewer reagents; can be purchased Color correction is critical stepTemperature not critical factor Need at least 2 cm cellMay not need full daily calibrationLess costly initial set-up (assuming have spectrophotometer )Less equipment requiredCalculations easierSame instrumentation allows free & total chlorine measurement
ISE Advantages DisadvantagesFew interferences Higher initial set-up cost (electrode)
Requires full calibration dailySlowerMore reagentsTemperature is criticalCan only measure total residual
Advantages/Disadvantages: ISE v. DPD

28
George BowmanGraham AndersonDeWayne Kennedy-Parker
(608) 224-6281State Laboratory of Hygiene2601 Agriculture DriveMadison, WI 53718
For more information:Rick Mealy
(608) 264-6006Wisconsin DNRPO Box 7921Madison, WI 53707
State Lab web address: http://www.slh.wisc.edu/outreach/
DNR’s LabCert homepage:http://www.dnr.state.wi.us/org/es/science/lc/
Acknowledgements
We’d like to thank the following for their assistance in developing this session:
• Graham Anderson…for “doing” while we “managed”
• Jim Burk and Hach Company... for loaning us the pipettes and supplies
• Chris Scott and Thermo-Orion... for providing a chlorine electrode and meter