simplify the following radicals 1. 2. 3. continue to work on the logarithm worksheet! you will have...
TRANSCRIPT

Warm-Up 10/10
Simplify the Following Radicals1. 2.
3.
CONTINUE TO WORK ON THE LOGARITHM WORKSHEET! You will have 20 mins
20 90
72

Graphs of Radical & Absolute Value
FunctionsDomain, Range, &
Shifts
Thursday October 10th

Graphing Square Root Functions
A square root function is a function containing a square root with the independent variable in the radicand.
The easiest way to graph a function is to create an x and y table.
Graph y = x y
0
1
2
4
9
x

Now when you are graphing square roots there is no need for you to include negative x values in your table.
Remember taking the square root of a negative number creates no real roots, so you will be unable to graph non-real roots.
So to find what number to start with we need to find the x-value that will give you a real number answer

Set the radicand equal to zero. Solving will provide us with the start value.
For example what if we had
We would set x – 2 = 0 and solve for x.
Radicand
2 xy

Graphing Radical Functions
To complete the x/y table, we need to decide where to start.
Do you remember how to calculate the starting x-value?
Set the RADICAND equal to 0. x + 7 = 0, Start with x = -7
37 x

Determine the start values
x
x
x
x
x
32
74
5
16
8

Domain of a Radical Function
3
93
093
93
x
x
x
xGiven the Radicand:
Set up an inequality showing the radicand is greater than or equal to 0.
Solve for x.
The result is your DOMAIN!

Determine the DOMAIN
x
x
x
x
x
32
74
5
16
8

Graph the function
Domain: Domain:Range: Range:
xx 8 x yx y

Graph the function
Domain: Domain:Range: Range:
xx 2 4x yx y

Graph the function
Domain: Domain:Range: Range:
xx3
2 3
x yx y

Graph the function
Domain: Domain:Range: Range:
xx 3 5x yx y

Compare the graphs
We are going to look back at the graphs we made and compare/contrast the similarities and differences among their graphs and functions.

Compare Functions
What is different about the graphs? How did the 2nd graph “shift”?
xx 8 x y-8 0
-7 1
-4 2
1 3
8 4
x y0 0
1 1
4 2
9 3
16
4

Graph the function
When you ADD or SUBTRACT under the radical, you shift in the opposite direction.
4xx y4 0
5 1
8 2
13
3
20
4

xx 2 3
2
x y0 0
.5 1
2 2
4.5
3
8 4
x y0 0
1.5 1
3 2
13.5
3
24 4
When you DIVIDE or MULTIPLY under the radical, the graph is STRETCHED out side to side or COMPRESSED.
Graph the function
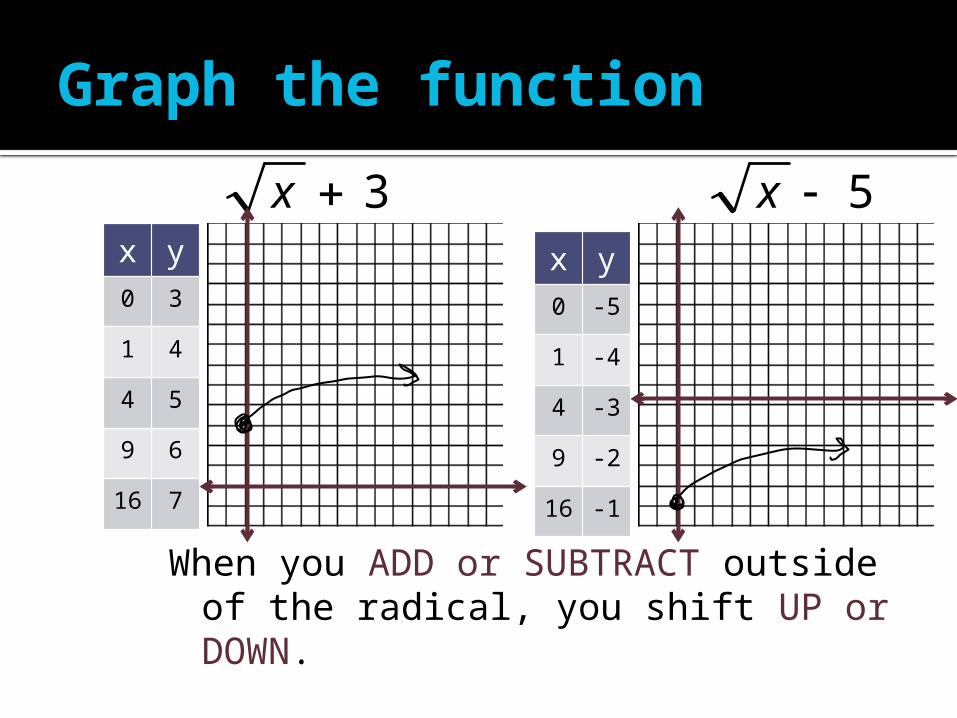
When you ADD or SUBTRACT outside of the radical, you shift UP or DOWN.
5 3 xxx y0 -5
1 -4
4 -3
9 -2
16
-1
x y0 3
1 4
4 5
9 6
16
7

Recap Radical Shifts Matching
1. Subtract under the radical
2. Add under the radical
3. Multiply under the radical
4. Divide under the radical
5. Add outside of the radical
6. Subtract outside of the radical
a)Move upb)Move rightc)Move downd)Move lefte)Stretchf) Compress

We simplify the radicand if possible
23 xy
Check the 1st and 3rd lines in your calculator.
Do they match?

Graphing a Cubed Root Function
Parent Function:3 x
x y
0
1
2
4
9

How do Cubed Roots Move?

Cubed Root Transformations Subtract under the radical
Add under the radical
Multiply under the radical
Divide under the radical
Add outside of the radical
Subtract outside of the radical

You Try – sketch the graphs of each of the following and give their domain and range:
32)( 3 xxf 142)( 3 xxf
54
1)( 3 xxf

Absolute Value
By definition, absolute value is the distance from zero.
Can we ever have a negative distance?
How far away from zero is 3? How about -2?

Absolute value
How many ways are there to be 4 units away from zero?

Evaluating absolute value
Evaluating an absolute value expression still requires PEMDAS. We treat absolute value bars like parenthesis, so we want to simplify inside of the bars first.
Example: Evaluate when x = 1.

Examples:
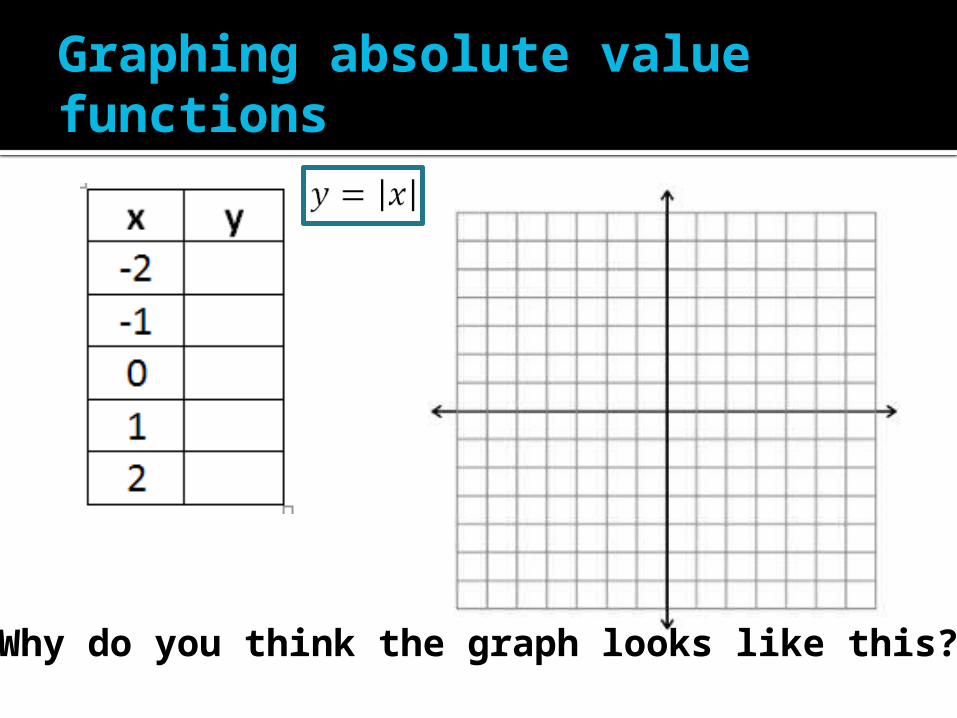
Graphing absolute value functions
Why do you think the graph looks like this?

Domain and Range
Domain:
Range:

Graphing absolute value functions
This will always give us the basic shape of our absolute value functions.
We will use what we know about transformations to shift the graph.

Based on what happened to radicals, describe the transformations that might occur for each of the following from the parent function:
Check this in your calculator.

How Absolute Value Functions Move Add/Subtract INSIDE the bars:
opposite direction, left and right
Multiply by a value greater than 1 in FRONT: stretch (skinny), slope of right side
Multiply by a value between 0 and 1 in FRONT: wider, slope of right side
Add/Subtract after the bars: up and down

Graphing with transformations:
To graph absolute value functions with transformations, we want to look from left to right. We will graph the transformations in that order.

Domain:
Range:

Examples:
Domain: Range:
Domain: Range:

You Try – sketch the graphs of each of the following and give their domain and range:

Homework
Worksheet