simple sugars shape giant vesicles into multispheres with
TRANSCRIPT

1246 | Soft Matter, 2020, 16, 1246--1258 This journal is©The Royal Society of Chemistry 2020
Cite this: SoftMatter, 2020,
16, 1246
Simple sugars shape giant vesicles intomultispheres with many membrane necks†
Tripta Bhatia, Simon Christ, Jan Steinkuhler, Rumiana Dimova andReinhard Lipowsky *
Simple sugars such as glucose and sucrose are ubiquitous in all organisms. One remarkable property
of these small solutes is their ability to protect biomembranes against dehydration damage. This
property, which reflects the underlying sugar–lipid interactions, has been intensely studied for lipid bilayers
interacting with a single sugar at low hydration. Here, we use giant vesicles to investigate fully hydrated
lipid membranes in contact with two sugars, glucose and sucrose. The vesicles were osmotically balanced,
with the same total sugar concentration in the interior and exterior aqueous solutions. However, the two
solutions differed in their composition: the interior solution contained only sucrose whereas the exterior
one contained primarily glucose. This sugar asymmetry generated a striking variety of multispherical or
‘‘multi-balloon’’ vesicle shapes. Each multisphere involved only a single membrane that formed several
spherical segments, which were connected by narrow, hourglass-shaped membrane necks. These
morphologies revealed that the sugar–lipid interactions generated a significant spontaneous curvature with
a magnitude of about 1 mm�1. Such a spontaneous curvature can be generated both by depletion and by
adsorption layers of the sugar molecules arising from effectively repulsive and attractive sugar–lipid inter-
actions. All multispherical shapes are stable over a wide range of parameters, with a substantial overlap
between the different stability regimes, reflecting the rugged free energy landscape in shape space. One
challenge for future studies is to identify pathways within this landscape that allow us to open and close
the membrane necks of these shapes in a controlled and reliable manner. We will then be able to apply
these multispheres as metamorphic chambers for chemical reactions and nanoparticle growth.
1 Introduction
Simple sugars such as glucose and sucrose are ubiquitous inthe living world. Glucose is the most important source of energyin all organisms,1 with a particularly high consumption in thehuman brain.2 Sucrose is the end product of photosynthesisand the primary sugar transported in most plants.3,4 Oneremarkable property of simple sugars is their ability to protectbiomembranes against damage by dehydration arising fromdessication and freezing.5,6 This property allows many organismsto survive in a strongly dehydrated state of cryptobiosis, inwhich their metabolism has reversibly come to a standstill.7,8
Even though this bioprotective property of simple sugars iswell documented, the underlying molecular mechanisms is stillcontroversial.
It is generally believed that hydrogen bonds between waters,sugars, and lipid head groups make an important contributionto sugar–lipid interactions. However, the resulting hydrogenbond network involves different types of hydrogen bonds andone controversial aspect of the ongoing debate about sugar–lipidinteractions is which hydrogen bonds are the dominant ones.Some experimental studies support the view that the lipidsprefer to form hydrogen bonds with the water and not withthe sugar molecules. As a consequence, the sugars experienceeffectively repulsive interactions with the lipids and are partiallyexcluded from the hydration shells of the membranes.9–14 Otherexperimental studies provide evidence that the lipids preferto form hydrogen bonds with the sugar molecules, whichthen experience effectively attractive interactions towards themembranes.15–21 These opposing views have been reconciliatedby the proposal that the sugar–lipid interactions depend on thebulk concentration of the sugar, being attractive for low con-centrations and repulsive for high concentrations.18
The interactions between lipid bilayers and sugar moleculeshave also been investigated by molecular dynamics (MD)simulations.21–25 In several simulation studies, the sugar mole-cules were observed to form multiple hydrogen bonds with the
Theory and Bio-Systems, Max Planck Institute of Colloids and Interfaces,
14424 Potsdam, Germany. E-mail: [email protected]; Fax: +49 331 5679602;
Tel: +49 331 5679600
† Electronic supplementary information (ESI) available: Tables S1 and S2 withparameter values for bar charts in Fig. 7 and 9; Fig. S1 with multisphere shapesfor reversed sugar asymmetries; movie captions for seven movies, Movies 1–7. SeeDOI: 10.1039/c9sm01890e
Received 18th September 2019,Accepted 14th December 2019
DOI: 10.1039/c9sm01890e
rsc.li/soft-matter-journal
Soft Matter
PAPER
Ope
n A
cces
s A
rtic
le. P
ublis
hed
on 1
6 D
ecem
ber
2019
. Dow
nloa
ded
on 1
/13/
2022
8:5
8:53
AM
. T
his
artic
le is
lice
nsed
und
er a
Cre
ativ
e C
omm
ons
Attr
ibut
ion
3.0
Unp
orte
d L
icen
ce.
View Article OnlineView Journal | View Issue

This journal is©The Royal Society of Chemistry 2020 Soft Matter, 2020, 16, 1246--1258 | 1247
lipid head groups, thereby replacing a couple of watermolecules.21–23 Some simulation results for the disaccharidetrehalose were interpreted in terms of a glassy sugar layer,24
alluding to the so-called vitrification hypothesis.26 In addition,MD simulations were also used to demonstrate that sucrosestrongly affects the phase separation within lipid bilayersby shifting the binodal lines and dissolving liquid-ordereddomains.25
The experimental studies in ref. 9–21 addressed the interactionsbetween lipid bilayers and a single sugar species. In contrast, inthe present paper, we consider lipid vesicles exposed to twotypes of simple sugars, glucose and sucrose. Our experimentalprocedure involved several steps as schematically shown inFig. 1. First, the vesicles were prepared in aqueous solutionsthat contained only sucrose. After this preparation step, bothleaflets of the vesicle membrane were exposed to the samesucrose concentration. Subsequently, a small amount of thevesicle-sucrose solution was transferred into the observationchamber and added to a much larger amount of aqueousglucose solution. Thus, after this transfer step, the inner leafletof each vesicle membranes was still exposed to sucrose whereasthe outer leaflet was now exposed to an exterior solution that
contained primarily glucose. Furthermore, immediately aftertransfer, the vesicles had the same volume and the samesucrose concentration as before. However, because the totalsugar concentration in the exterior solution was typically largerthan in the interior solutions, water started to permeatethrough the membrane and the vesicle volume decreased untilboth solutions were osmotically balanced. The resulting asym-metry between the two bilayer leaflets created a striking varietyof multispherical or ‘‘multi-balloon’’ vesicles, consisting ofa variable number of large and small spheres connected byvery narrow, hourglass-shaped membrane necks, in accordancewith the theory of curvature elasticity.27 Analogous necks arealso formed by cellular membranes, e.g., during endocytosis orcell division.28 These necks have a diameter of about 10 nm,corresponding to twice the bilayer thickness.
To make the vesicle shapes accessible to optical microscopy,we used giant unilamellar vesicles (GUVs), a versatile researchtool for membrane science as demonstrated in many previousstudies.28–31 The multispherical shapes of the GUVs had severalremarkable properties. First, for each such shape, the radii ofthe individual spheres could attain at most two different values.Thus, the multispherical shapes were either composed of largeand small spheres with two different radii or, alternatively,of several equally sized spheres. This morphological featureimplies that all spherical membrane segments experiencedthe same mechanical tension and that the whole multispherewas formed by a single bilayer membrane. Second, each multi-sphere is stable for a wide range of parameters as we show by adetailed comparison between theory and experiment. Third,the stability regimes for the different multispheres have asignificant overlap which implies that GUVs with the samemembrane area and the same initial volume can attain manydifferent multispherical shapes even though they are exposedto the same sugar asymmetry, as illustrated in Fig. 1. Finally, wediscuss possible molecular mechanisms for the sugar-inducedmembrane curvature and show that this curvature can arisefrom repulsive or attractive interactions between the sugars andthe lipid head groups.
2 Results and discussion2.1 GUV membranes exposed to asymmetric sugar solutions
The GUVs were prepared from a binary lipid mixture of1-palmitoyl-2-oleoyl-sn-glycero-3-phosphocholine (POPC) and10 mol% cholesterol in aqueous sucrose solutions. Cholesterolwas added to the GUV membranes to ensure that the curvature-elastic behavior of these bilayer membranes is adequatelydescribed by the spontaneous curvature model.27 In contrastto POPC, cholesterol undergoes frequent flip-flops between thetwo leaflets of the bilayers on the typical time scales of theexperiments. In the absence of cholesterol, we would have totake into account that the number of POPC molecules isseparately conserved in each leaflet. In fact, the detailedcomparison between experiment and theory as provided inthe present paper directly demonstrates that the observed
Fig. 1 The formation of different multispherical shapes depends on thevolume-to-area ratio v of the initial GUV: (a–c) a spherical GUV with v = 1 istransformed into three different multispheres with v = 0.9, all of whichare exposed to the same sugar asymmetry; and (d–f) a prolate GUV withv = 0.7 is transformed into three different multispheres with v = 0.652,which are again exposed to the same sugar asymmetry. These transfor-mations are experimentally obtained by the following two-step procedure.(a and d) First, osmotically balanced vesicles are prepared in the prepara-tion chamber. At this stage, both the exterior and the interior aqueoussolution contain the same concentration of sucrose (yellow). The vesiclesare subsequently transferred from the preparation into the observationchamber; (b and e) during the transfer, the exterior sucrose solution isreplaced by a glucose (blue) solution but the vesicles retain their previousshapes immediately after this transfer. At this stage, the osmotic pressurein the exterior glucose solution exceeds the osmotic pressure in theinterior sucrose solution. This pressure difference leads to water permea-tion across the membranes, thereby reducing the vesicle volumes until theinterior sucrose solution has reached the same concentration as theexterior glucose solution. In these examples, the volumes of the sphericaland prolate vesicles in (a) and (d) are reduced to v = 0.9 and v = 0.652,respectively; (c and f) different multispherical shapes that can be obtainedfor v = 0.9 and v = 0.652 when the GUV membranes are exposed to thesame sugar asymmetry.
Paper Soft Matter
Ope
n A
cces
s A
rtic
le. P
ublis
hed
on 1
6 D
ecem
ber
2019
. Dow
nloa
ded
on 1
/13/
2022
8:5
8:53
AM
. T
his
artic
le is
lice
nsed
und
er a
Cre
ativ
e C
omm
ons
Attr
ibut
ion
3.0
Unp
orte
d L
icen
ce.
View Article Online

1248 | Soft Matter, 2020, 16, 1246--1258 This journal is©The Royal Society of Chemistry 2020
multitude of multisphere shapes is in full agreement with thespontaneous curvature model.
To balance the osmotic pressure arising from the exteriorsucrose solution, the vesicles changed their volume until theinterior solutions contained the same sucrose concentration asthe exterior one and the two leaflets of the bilayer membranewere exposed to identical aqueous environments. Therefore,this preparation procedure led to symmetric bilayers with zerospontaneous curvature. Two examples for such osmoticallybalanced vesicles with symmetric bilayers are displayed inFig. 1(a and d). Next, a small aliquot of the prepared sucrose-GUV solution was transferred into the observation chamberand added to a larger aqueous droplet that contained onlyglucose or an excess of glucose, with a glucose or glucose–sucrose concentration that exceeded the sucrose concentrationin the aliquot. This transfer or dilution step led to the reductionof the vesicle volume by osmotic deflation and, at the sametime, to the generation of bilayer asymmetry and spontaneouscurvature. Immediately after transfer, the vesicles retained theirvolume as in Fig. 1(b and e) until the higher osmotic pressurein the exterior glucose solution started to reduce these volumesby water permeation across the membranes, thereby increasingthe sucrose concentration in the interior solution. The latterprocess continued until the interior sucrose concentration wasequal to the total sugar concentration in the exterior solution.
When we reduce the volume of a GUV, we always createexcess area of the vesicle membrane that allows the GUV toundergo a variety of shape transformations. One examplefor such a transformation process is displayed in Fig. 2. Inthis case, the GUV was prepared in 172 mM sucrose andtransferred into an observation chamber with 200 mM glucose.The resulting water permeation led to a reduction of the vesiclevolume and to an increase of the interior sucrose concentrationuntil this latter concentration was equal to 200 mM as well. As aresult, the inner leaflet of the GUV membrane was exposed to200 mM sucrose whereas the outer leaflet of this membranewas in contact with 200 mM glucose. This bilayer asymmetryled to a shape transformation of the GUV, from the pear shapein the first snapshot of Fig. 2 to the dumbbell shape in the lastsnapshot of this figure. The dumbbell shape consisted of two
spheres, a large and a small one that did not separate from eachother. Furthermore, the time evolution in Fig. 2 and Movie 1(ESI†) also shows that the morphological transformation from apear to a two-sphere shape was quite fast and completed withinabout 15 s. The resulting two-sphere morphology representsa stable shape of the GUV that remained unchanged formany hours.
2.2 Striking diversity of stable multispherical morphologies
The two-sphere morphology in Fig. 2 represents the simplestexample for a stable multispherical shape. In general, manymore complex multispherical morphologies can be formed andremain stable for hours, provided we exposed the inner andthe outer leaflets of the GUV membranes to different sugarsolutions. Indeed, control experiments in which we used onesugar species and exposed both leaflets to the same sugar,either sucrose or glucose, did not generate multisphericalvesicles, see Methods section.
Any multispherical morphology that is formed by a uniformmembrane can involve at most two different sphere radii asshown in the Methods section. Vice versa, the observation ofsuch a multispherical shape provides direct evidence that allspherical membrane segments experience the same mechan-ical tension and that the whole multisphere is formed by asingle bilayer membrane. Thus, we can observe a variety of(Nl + Ns)-spheres that are built up from a variable number Nl oflarge spheres and a variable number Ns of small spheres.Several examples for these morphologies, which have the formof necklaces and linear or branched chains, are displayedin Fig. 3 and 4. In addition, multispherical shapes with N*
equally sized spheres are also possible, see Fig. 5. Because thenecklaces and chains of multispheres undergo thermal fluctua-tions, the individual spheres move in and out of optical focuswhich implies that their apparent radii in the confocal imagechange. The true radii are obtained from equatorial crosssections which can be determined by adjusting the focus foreach sphere separately but can be rarely seen for all spheres onthe same image. Thus, the images in Fig. 3–5 have beenselected in such a way that the visible cross sections providegood approximations to the equatorial cross sections.
Fig. 2 Morphological transformation of a GUV with an initial pear-like shape: time evolution of shape with selected images from Movie 1 (ESI†). The firstimage shown here defines time t = 0 s and corresponds to about 38 min after the aliquot of sucrose-GUV solution was transferred to the observationchamber. Within 15 s, the GUV transforms into a two-sphere morphology consisting of a large and a small sphere which are connected by a membraneneck. The GUV was prepared in 172 mM sucrose and then transferred into an observation chamber filled with 200 mM glucose. The osmotic imbalancereduces the volume of the GUV until the interior solution reaches a concentration of 200 mM sucrose. The scale bar is 5 mm.
Soft Matter Paper
Ope
n A
cces
s A
rtic
le. P
ublis
hed
on 1
6 D
ecem
ber
2019
. Dow
nloa
ded
on 1
/13/
2022
8:5
8:53
AM
. T
his
artic
le is
lice
nsed
und
er a
Cre
ativ
e C
omm
ons
Attr
ibut
ion
3.0
Unp
orte
d L
icen
ce.
View Article Online

This journal is©The Royal Society of Chemistry 2020 Soft Matter, 2020, 16, 1246--1258 | 1249
The multispherical shapes shown in Fig. 3 are composed ofup to four spheres. Apart from the (1 + 1)-sphere consisting ofone large and one small sphere, this figure displays threedifferent multispherical shapes with N = 3 and four distinctmultispheres with N = 4. The two (1 + 2)-spheres in Fig. 3(b and c)consist of one large and two small spheres but differ in thenecklace arrangement of the spheres: in Fig. 3(b), the two smallspheres form a short chain, in Fig. 3(c), they form two separatebuds. Thus, in Fig. 3(b), the three spheres are linked into thelinear arrangement large–small–small whereas they form thelinear arrangement small–large–small in Fig. 3(c). We will callthese two arrangements an (lss)-necklace and an (sls)-necklace,respectively. Likewise, for N = 4, Fig. 3 displays a (1 + 3)-spherethat forms a (lsss)-necklace, two distinct (2 + 2)-spheres corres-ponding to an (lssl)-necklace and an (lsls)-necklace, as well as a(3 + 1)-sphere arranged as a (llsl)-necklace.
Another type of multispheres is shown in Fig. 4. The lattershapes consist of one large sphere and Ns Z 4 small spheresthat form a single chain, which may be linear or branched.A chain with a larger Ns-value is more likely to be branched.
In fact, as a result of thermal fluctuations, the small spheres aresurprisingly mobile: individual spheres can move along thechains, thereby transforming linear chains into branched ones andvice versa, an example is shown in Movie 2 (ESI†). Furthermore, inFig. 5 as well as in Movies 3 and 4 (ESI†), we display severalexamples for multispherical shapes consisting of N* equally sizedspheres.
The time-dependent relaxation process towards the finalmultispherical shape with a chain of Ns small spheres canproceed via a transient shape that resembles a capped unduloidwith open necks. One example with Ns = 5 is displayed in Movie 5(ESI†). In this example, the transformation from open to closednecks is completed within about two minutes. Two additionalexamples that further illustrate the time-dependent formation ofclosed membrane necks are provided by Movies 6 and 7 (ESI†).The initial frame of Movie 6 (ESI†) displays a shape thatresembles a thick letter ‘C’ which then develops two constric-tions and three bellies as well as a spherical bud connected tothe belly in the middle. After about 78 s, the GUV has beentransformed into a multispherical shape consisting of three largeand two small spheres, arranged as an linear (lslsl)-necklaceconnected by four ls-necks. The initial frame of Movie 7 (ESI†)displays a shape that resembles a three-armed starfish. This shapetransforms into a (3 + 1)-sphere, for which the three large spheresare all connected to the small sphere in the middle, resembling athree-leaved trefoil. The latter process leads to the formation ofthree ls-necks and takes about 60 s.
The multisphere images displayed in Fig. 3–5 have beenobserved for a variety of sugar concentrations. The (3 + 1)-sphere in Fig. 3h and the (1 + 5)-sphere in Fig. 4(b), for example,
Fig. 3 Multispherical shapes with a total number of up to four spheres, asobserved for various sugar concentrations: (a) one large and one smallsphere as in Fig. 2; (b and c) multispheres consisting of one large and twosmall spheres, the latter forming a 2-sphere chain and two separate buds,respectively; (d) a small sphere in between two large spheres; (e) one largesphere connected to a linear chain of three small spheres; (f and g)two large spheres and two small spheres forming two distinct necklaces;and (h) three large (l) spheres and one small (s) sphere arranged in an(llsl)-necklace. The scale bar in (a) is 10 mm and applies to all panels.
Fig. 4 Multispherical shapes consisting of one large sphere and a linearor branched chain with Ns Z 4 small spheres: (a–c) linear chains with(a) Ns = 4, (b) Ns = 5, and (c) Ns = 6. (d–h) Branched chains with (d) Ns = 7,(e and f) Ns = 8, (g) Ns = 14 and (h) Ns = 15. Various sugar concentrations;all scale bars are 10 mm.
Fig. 5 Multispherical shapes consisting of N* equally sized spheresas observed for different sugar concentrations: (a) branched chain withN* = 14. Twelve of these spheres are clearly visible. In addition, one sphere,located at the right chain end, is out of focus and another one, connectedto the second sphere from the left, is hardly visible, see Movie 3 (ESI†);(b) branched chain with N* = 15; (c) branched chain with N* = 15. Fourteenof these spheres are visible, another one is hidden behind the bottomsphere, see Movie 4 (ESI†); (d) linear chain with N* = 24; and (e) branchedchain with N* = 39. Various sugar concentrations; the scale bar in (a) is10 mm and applies to all panels.
Paper Soft Matter
Ope
n A
cces
s A
rtic
le. P
ublis
hed
on 1
6 D
ecem
ber
2019
. Dow
nloa
ded
on 1
/13/
2022
8:5
8:53
AM
. T
his
artic
le is
lice
nsed
und
er a
Cre
ativ
e C
omm
ons
Attr
ibut
ion
3.0
Unp
orte
d L
icen
ce.
View Article Online

1250 | Soft Matter, 2020, 16, 1246--1258 This journal is©The Royal Society of Chemistry 2020
were observed after adding the GUVs to a 180 mM glucosesolution in the observation chamber whereas the (1 + 3)-shape inFig. 3(e) was observed after adding them to a 326 mM glucosesolution. In fact, we observed multispherical shapes after adding theGUVs to even much lower glucose concentrations, down to 60 mM.In order to elucidate the interrelations of the GUV morphologies andthe sugar concentrations, we will now analyze the multisphericalshapes in a systematic manner. This analysis will proceed in severalsteps. First, we describe the geometry of the multispherical shapesand show that this geometry is completely determined by a singledimensionless parameter, the ‘‘reduced volume’’ or volume-to-arearatio v, see next subsection. Second, we discuss two general stabilityconditions for multispheres, one for the stability of closedmembrane necks against neck opening and another one for thestability of the individual spheres against prolate deformations.27
Third, we use the stability conditions to estimate the numericalvalues of the spontaneous curvature for two specific sugar asymme-tries. Finally, we discuss the overall morphology diagram, whichdepends on two dimensionless parameters, and show that theexperimentally observed multispherical shapes belong to the theo-retically predicted stability regimes.
2.3 Geometry of multispherical shapes
The shape of a laterally uniform membrane depends only onthree parameters: the vesicle volume V, the membrane area A,and the spontaneous curvature m.32 For all multisphericalmorphologies described here, the vesicle membranes bulgedtowards their outer leaflets, from which we can directly con-clude that all membranes had a positive spontaneous curva-ture, m 4 0.27 Furthermore, it is convenient to use the vesiclesize as defined by
Rve �ffiffiffiffiffiffiffiffiffiffiffiffiffiffiffiA=ð4pÞ
p(1)
as the basic length scale. When we measure all lengths in unitsof Rve, we reduce the number of relevant parameters to twodimensionless shape parameters as given by the dimensionlessspontaneous curvature
�m � mRve ¼ mffiffiffiffiffiffiffiffiffiffiffiffiffiffiffiA=ð4pÞ
p4 0 (2)
and the volume-to-area or volume parameter ratio
v � V
4p3Rve
3
¼ 6ffiffiffipp V
A3=2with 0o v � 1: (3)
The parameter space or morphology diagram is now definedby the ( %m,v)-plane with %m 4 0 and 0 o v r 1. The largestpossible volume-to-area ratio v = 1 corresponds to a singlesphere.
Now, let us consider a (Nl + Ns)-sphere consisting of Nl largeand Ns small spheres. Using the basic length scale Rve, weintroduce the dimensionless sphere radii
rl �Rl
Rveand rs �
Rs
Rve: (4)
which fulfill the geometric relations27
Nlrl2 + Nsrs
2 = 1 and v = Nlrl3 + Nsrs
3. (5)
The first equation is equivalent to the condition that the totalarea of all large and small spheres must be equal to A and thesecond equation to the condition that the total volume of allspheres must be V. For given values of the sphere numbers Nl
and Ns, these two equations determine the two radii rl and rs interms of the volume-to-area ratio v. In other words, the geometryof any (Nl + Ns)-sphere is completely determined by the volumeparameter v. As a consequence, this geometry does not dependon any other parameter such as, e.g., the spontaneous curvature.
A multisphere consisting of Nl large and Ns small spherescan only be formed if the volume parameter v exceeds a certainminimal value. This lowest possible v-value is provided by N* =Nl + Ns spheres of equal size. For equal sphere radii rl = rs = r*,the two relations in eqn (5) lead to the unique solution
v ¼ v� ¼1ffiffiffiffiffiffiffiffiffiffiffiffiffiffiffiffi
Nl þNs
p ¼ 1ffiffiffiffiffiffiN�p ; (6)
which also implies r* = v*. Thus, in order to obtain a (Nl + Ns)-sphere, the volume parameter must satisfy v Z (Nl + Ns)
�1/2.
2.4 Stability of multispherical shapes
Next, we must examine the stability of the multispherical shapes,which is primarily determined by the stability of the closedmembrane necks with respect to neck opening. The latter stabilitydepends on two parameters. First, it depends on the spontaneouscurvature that provides a quantitative measure for the bilayerasymmetry arising from the different sugar solutions on the twosides of the membranes. Second, the neck stability depends onthe geometry of the closed neck, which we will characterize interms of a certain neck curvature. In general, we have to distin-guish different types of necks. First, a multisphere typicallyexhibits at least one ls-neck between a large and a small sphere.Such ls-necks can be seen in all images of Fig. 3 and 4. Second, weobserve ss-necks between two small spheres as in panels b, e, and fof Fig. 3 and in all images of Fig. 4. Occasionally, we also observedll-necks, one example is shown in Fig. 3h.
Each neck is governed by a simple stability condition thatdepends on the curvature radii of the spherical segmentsadjacent to the neck. These sphere radii can be directly measuredfrom the optical images. For the sake of generality, we will firstdenote these two radii by Ra and Rb. As we move across a closedneck, the mean curvature of the membrane changes abruptlyfrom the value Ra
�1 to the value Rb�1. It is then useful to define
the neck curvature
Mab �1
2
1
Raþ 1
Rb
� �ðab-neckÞ; (7)
which interpolates linearly between the mean curvatures Ra�1
and Rb�1 of the two spherical membrane segments. The
limiting case with Rb = Ra leads to Mab = Maa = Ra�1. Both
analytical and numerical studies27,32,33 have shown that anab-neck is stably closed if the spontaneous curvature m satisfiesthe inequality
m �Mab or �m �MabRve ¼1
2
1
raþ 1
rb
� �(8)
Soft Matter Paper
Ope
n A
cces
s A
rtic
le. P
ublis
hed
on 1
6 D
ecem
ber
2019
. Dow
nloa
ded
on 1
/13/
2022
8:5
8:53
AM
. T
his
artic
le is
lice
nsed
und
er a
Cre
ativ
e C
omm
ons
Attr
ibut
ion
3.0
Unp
orte
d L
icen
ce.
View Article Online

This journal is©The Royal Society of Chemistry 2020 Soft Matter, 2020, 16, 1246--1258 | 1251
with the dimensionless radii ra = Ra/Rve and rb = Rb/Rve. There-fore, a closed neck is only stable if the spontaneous curvature%m = mRve is sufficiently large. More precisely, a closedmembrane neck with neck curvature Mab is only stably closedif the spontaneous curvature m exceeds Mab. The equalityMab = m represents a boundary case because the neck remainsclosed for m 4 Mab but opens up for m o Mab. Vice versa, theneck closes continuously as we increase the spontaneouscurvature from moMab to m = Mab. Therefore, the equalityMab = m represents the closure condition for the ab-neck.Note that the stability condition for the closed membrane neckas given by eqn (8) provides a local relation between thespontaneous curvature m, which is a curvature-elastic materialparameter, and the neck curvature Mab as defined by eqn (7),which is a purely geometric quantity. The neck curvature can bedirectly deduced from the optical micrographs, provided thecurvature radii Ra and Rb of the two membrane segmentsadjacent to the neck can be optically resolved.
The stability condition as given by eqn (8) can be applied tothe different types of necks that have been observed in Fig. 3–5.For an ls-neck, we identify ab in eqn (8) with ls and concludethat the spontaneous curvature m satisfies the inequality
m �Mls ¼1
2Rl�1 þ Rs
�1� �. Likewise, the observation of a stable
ss- or ll-neck implies that m Z Mss = Rs�1 and m Z Mll = Rl
�1.When a multispherical shape exhibits several types of membranenecks, this shape is only stable if all of its necks are stableagainst neck opening. In practice, we typically encounter twodifferent cases. The first case corresponds to multispheres thatinvolve only ls-necks, see the images in the panels a, c, d, and gof Fig. 3. The second case is provided by multispheres thatinvolve at least one ss-neck, see all images in Fig. 4 and 5.
In addition to the stability against neck opening, multi-spherical shapes must also be stable against prolate deforma-tions of the individual spheres. As shown in the Methodssection, the large sphere is always stable whereas the stabilityof the small sphere requires that the spontaneous curvature msatisfies the inequality
mo3
Rs 1� Rs=Rlð Þ � Bup; (9)
where we introduced the abbreviation Bup for the right handside of this inequality. For Rs o Rl, this stability conditioncannot be fulfilled for sufficiently large positive m. In the lattercase, the small spheres are transformed into prolates. On theother hand, for Rs = Rl = R* corresponding to equally sizedspheres, these spheres are stable for an arbitrarily large spon-taneous curvature.
2.5 Estimating the magnitude of the spontaneous curvature
We will now use the stability conditions for the multisphericalshapes as described in the previous paragraphs to estimate themagnitude of the spontaneous curvature m. First, we consider acertain membrane neck and measure the corresponding sphereradii Ra and Rb from which we deduce the neck curvature Mab asdefined by eqn (7), with ab replaced by the corresponding neck
type. According to eqn (8), the neck curvature Mab of each neckprovides a lower bound for the spontaneous curvature. In orderto improve this bound, we studied whole populations of GUVs,all exposed to the same sugar asymmetry. For each sugarasymmetry, we examined about 100 GUV shapes with at leastone membrane neck. We performed confocal z-stacks for eachof these shapes and determined the corresponding crosssections of both large and small membrane segments, usingthe software ImageJ-Analysis. We then selected those shapes forwhich these largest cross sections were circular to a very goodapproximation and thus provided the equatorial cross sectionsof large and small spheres. For sugar asymmetry I and II, thisselection procedure led to 9 and 15 vesicles, respectively, forwhich we determined the radii Rl and Rs as well as the neckcurvatures Mne of the ls- and ss-necks as obtained from eqn (7),see Fig. 7 and 9. The strongest lower bound is then obtained bythe largest neck curvature within the whole vesicle population.This largest lower bound also represents the best estimatefor the spontaneous curvature m based on the observedneck curvatures.
Likewise, we use the measured values for the radii Rl and Rs
of the large and small spheres to determine the parameter Bup
in eqn (9). We examine again the whole vesicle populationexposed to the same sugar concentrations in the interior andexterior solution and determine the parameter Bup for eachmultisphere. The strongest upper bound is then obtained bythe smallest value of Bup. This smallest upper bound providesthe best estimate for the spontaneous curvature based on thestability of the individual spheres. We will now use the upperand lower bounds just described to estimate the spontaneouscurvature for two specific sugar asymmetries.
2.6 Spontaneous curvature generated by sugar asymmetries
Sugar asymmetry I. The first sugar asymmetry that weanalyzed in detail was obtained by adding the GUVs with theirenclosed sucrose solution to a 234 mM glucose solution in theobservation chamber. In this case, we examined nine multi-spheres, five of which are displayed in Fig. 6 and one in Fig. 5e.For all of these vesicles, we measured the radii Rl and Rs of thelarge and small spheres from which we determined the neckcurvatures Mls of the ls-necks as defined in eqn (7) as well as theneck curvatures Mss = Rs
�1 of the ss-necks, see the bar chartin Fig. 7a. The neck stability implies that the spontaneouscurvature must be larger than all of these neck curvatures.
Fig. 6 Five multispheres from a vesicle population that was exposed to aninterior solution of 234 mM sucrose and an exterior solution of 234 mMglucose. These concentrations define the sugar asymmetry I of the twoleaflets of the bilayer membranes. Another multisphere obtained for thissugar asymmetry is the (39*)-sphere in Fig. 5e. The scale bar in (a)corresponds to 5 mm and applies to the images in (b–e) as well.
Paper Soft Matter
Ope
n A
cces
s A
rtic
le. P
ublis
hed
on 1
6 D
ecem
ber
2019
. Dow
nloa
ded
on 1
/13/
2022
8:5
8:53
AM
. T
his
artic
le is
lice
nsed
und
er a
Cre
ativ
e C
omm
ons
Attr
ibut
ion
3.0
Unp
orte
d L
icen
ce.
View Article Online
1252 | Soft Matter, 2020, 16, 1246--1258 This journal is©The Royal Society of Chemistry 2020
Likewise, using the measured radii Rl and Rs, we determinedthe parameters Bup as defined in eqn (9) for all multisphereswith both large and small spheres. The observed sphericity ofthe small spheres implies that the spontaneous curvature mustbe smaller than all of these Bup-parameters. The correspondingbar chart is displayed in Fig. 7b.
Inspection of Fig. 7a shows that the largest neck curvaturesare obtained for the ss-necks of the vesicles with index numbers7 and 8. These neck curvatures are quite similar in size andhave the value Mss = (1.4 � 0.5) mm�1 which provides the bestlower bound for the spontaneous curvature. The large uncertaintyof this numerical value arises from the smallness of the smallspheres which were only about 1.5 mm in diameter and thus onlyabout three times the optical resolution. Furthermore, from thebar chart in Fig. 7b, the smallest value for the parameter Bup isfound to be Bup = (1.3 � 0.1) mm�1, corresponding to the vesiclewith index number 1. This value of Bup provides the best upperbound for the spontaneous curvature. Combining the bestlower bound Mss = (1.4 � 0.5) mm�1 with the best upper boundBup = (1.3� 0.1) mm�1, we estimate the spontaneous curvature mto be (1.3 � 0.1) mm�1 for sugar asymmetry I.
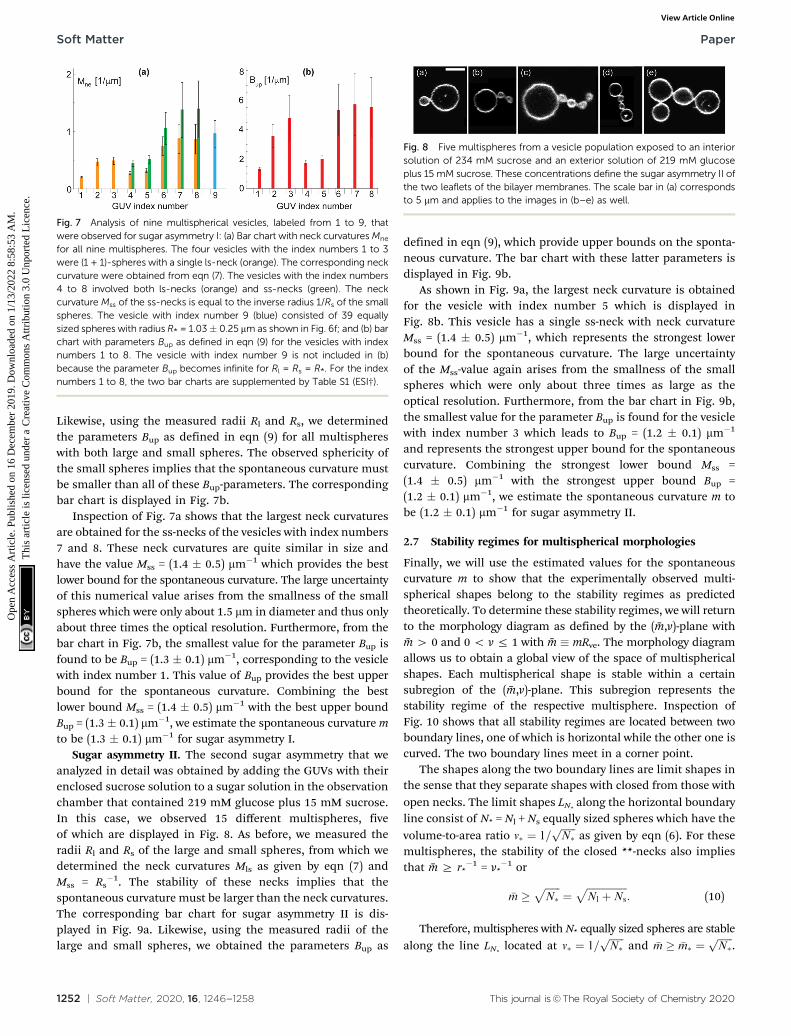
Sugar asymmetry II. The second sugar asymmetry that weanalyzed in detail was obtained by adding the GUVs with theirenclosed sucrose solution to a sugar solution in the observationchamber that contained 219 mM glucose plus 15 mM sucrose.In this case, we observed 15 different multispheres, fiveof which are displayed in Fig. 8. As before, we measured theradii Rl and Rs of the large and small spheres, from which wedetermined the neck curvatures Mls as given by eqn (7) andMss = Rs
�1. The stability of these necks implies that thespontaneous curvature must be larger than the neck curvatures.The corresponding bar chart for sugar asymmetry II is dis-played in Fig. 9a. Likewise, using the measured radii of thelarge and small spheres, we obtained the parameters Bup as
defined in eqn (9), which provide upper bounds on the sponta-neous curvature. The bar chart with these latter parameters isdisplayed in Fig. 9b.
As shown in Fig. 9a, the largest neck curvature is obtainedfor the vesicle with index number 5 which is displayed inFig. 8b. This vesicle has a single ss-neck with neck curvatureMss = (1.4 � 0.5) mm�1, which represents the strongest lowerbound for the spontaneous curvature. The large uncertaintyof the Mss-value again arises from the smallness of the smallspheres which were only about three times as large as theoptical resolution. Furthermore, from the bar chart in Fig. 9b,the smallest value for the parameter Bup is found for the vesiclewith index number 3 which leads to Bup = (1.2 � 0.1) mm�1
and represents the strongest upper bound for the spontaneouscurvature. Combining the strongest lower bound Mss =(1.4 � 0.5) mm�1 with the strongest upper bound Bup =(1.2 � 0.1) mm�1, we estimate the spontaneous curvature m tobe (1.2 � 0.1) mm�1 for sugar asymmetry II.
2.7 Stability regimes for multispherical morphologies
Finally, we will use the estimated values for the spontaneouscurvature m to show that the experimentally observed multi-spherical shapes belong to the stability regimes as predictedtheoretically. To determine these stability regimes, we will returnto the morphology diagram as defined by the ( %m,v)-plane with%m 4 0 and 0 o v r 1 with %m � mRve. The morphology diagramallows us to obtain a global view of the space of multisphericalshapes. Each multispherical shape is stable within a certainsubregion of the ( %m,v)-plane. This subregion represents thestability regime of the respective multisphere. Inspection ofFig. 10 shows that all stability regimes are located between twoboundary lines, one of which is horizontal while the other one iscurved. The two boundary lines meet in a corner point.
The shapes along the two boundary lines are limit shapes inthe sense that they separate shapes with closed from those withopen necks. The limit shapes LN*
along the horizontal boundaryline consist of N* = Nl + Ns equally sized spheres which have thevolume-to-area ratio v� ¼ 1=
ffiffiffiffiffiffiN�p
as given by eqn (6). For thesemultispheres, the stability of the closed **-necks also impliesthat %m Z r*
�1 = v*�1 or
�m �ffiffiffiffiffiffiN�
p¼
ffiffiffiffiffiffiffiffiffiffiffiffiffiffiffiffiNl þNs
p: (10)
Therefore, multispheres with N* equally sized spheres are stablealong the line LN*
located at v� ¼ 1=ffiffiffiffiffiffiN�p
and �m � �m� ¼ffiffiffiffiffiffiN�p
.
Fig. 7 Analysis of nine multispherical vesicles, labeled from 1 to 9, thatwere observed for sugar asymmetry I: (a) Bar chart with neck curvatures Mne
for all nine multispheres. The four vesicles with the index numbers 1 to 3were (1 + 1)-spheres with a single ls-neck (orange). The corresponding neckcurvature were obtained from eqn (7). The vesicles with the index numbers4 to 8 involved both ls-necks (orange) and ss-necks (green). The neckcurvature Mss of the ss-necks is equal to the inverse radius 1/Rs of the smallspheres. The vesicle with index number 9 (blue) consisted of 39 equallysized spheres with radius R* = 1.03� 0.25 mm as shown in Fig. 6f; and (b) barchart with parameters Bup as defined in eqn (9) for the vesicles with indexnumbers 1 to 8. The vesicle with index number 9 is not included in (b)because the parameter Bup becomes infinite for Rl = Rs = R*. For the indexnumbers 1 to 8, the two bar charts are supplemented by Table S1 (ESI†).
Fig. 8 Five multispheres from a vesicle population exposed to an interiorsolution of 234 mM sucrose and an exterior solution of 219 mM glucoseplus 15 mM sucrose. These concentrations define the sugar asymmetry II ofthe two leaflets of the bilayer membranes. The scale bar in (a) correspondsto 5 mm and applies to the images in (b–e) as well.
Soft Matter Paper
Ope
n A
cces
s A
rtic
le. P
ublis
hed
on 1
6 D
ecem
ber
2019
. Dow
nloa
ded
on 1
/13/
2022
8:5
8:53
AM
. T
his
artic
le is
lice
nsed
und
er a
Cre
ativ
e C
omm
ons
Attr
ibut
ion
3.0
Unp
orte
d L
icen
ce.
View Article Online

This journal is©The Royal Society of Chemistry 2020 Soft Matter, 2020, 16, 1246--1258 | 1253
In addition, the shape of a (N*)-sphere remains unchangedas we vary %m because this shape is uniquely determined byv* alone.
The second boundary line and the associated limit shapesdepend on three features of the multispheres: on the number oflarge spheres, on the number of small spheres, and, in addi-tion, on the types of membrane necks that connect the different
spheres. Thus, the second boundary line is denoted by LlsNlþNs
if the corresponding limit shapes involve only ls-necks con-necting Nl large and Ns small spheres. Two examples for theselatter lines are displayed in panels a and c of Fig. 10. On theother hand, if the (Nl + Ns)-spheres are connected by at least oness-neck, we indicate this feature by the notation (Nl + Ns)
ss anddenote the corresponding line of limit shapes by Lss
NlþNs. Six
examples for this latter case are displayed in panels b, d, e, f, g,and h of Fig. 10. All boundary lines displayed in Fig. 10 can bedescribed by explicit functions of the form v = v( %m), see eqn (22)and (20) in the Methods section.
All stability regimes in Fig. 10 exhibit a corner point at whichthe second boundary line meets the horizontal line LN*
of N*
equally sized shapes with N* = Nl + Ns. These corner points arelocated at v ¼ v� ¼ 1=
ffiffiffiffiffiffiN�p
and �m ¼ �m� ¼ffiffiffiffiffiffiN�p
. Furthermore,the multispherical shape at any such corner point is character-ized by zero bending energy27 and by the mechanical tensionS = 2km2, see eqn (15) in the Methods section.
Fig. 9 Analysis of 15 multispherical vesicles, labeled from 1 to 15, that wereobserved for sugar asymmetry II: (a) bar chart with neck curvatures Mne forall 16 multispheres. The four vesicles with index numbers 1 to 4 were (1 + 1)-spheres with a single ls-neck (orange). The corresponding neck curvatureMls were obtained from eqn (7). The vesicles with index numbers 5 to 15involved both ls-necks (orange) and ss-necks (green). The neck curvatureMss of the ss-necks is equal to the inverse radius 1/Rs of the small spheres;and (b) bar chart with parameters Bup as defined in eqn (9) for all 15multispheres. The two bar charts are supplemented by Table S2 (ESI†).
Fig. 10 Comparison between calculated stability regimes (light blue areas) and experimental data (orange and red crosses) for eight differentmultispherical shapes (yellow cartoons). The orange and red data were obtained for sugar asymmetry I and II, using the spontaneous curvature valuesestimated via Fig. 7 and 9. All stability regimes depend on two dimensionless parameters, the rescaled spontaneous curvature %m = mRve and the volume-to-area ratio v, and are located between two boundary lines. The horizontal boundary lines LN*
correspond to the special shapes consisting of N* equallysized spheres, see examples in Fig. 5. The orange data point in (h) describes the 39*-sphere as shown in Fig. 5e. When we leave a stability regime bycrossing one of the horizontal boundary lines, all membrane necks open up simultaneously. The second type of boundary lines, denoted by Lls
n+n in(a and c) and Lss
NlþNsin (b) and (d)–(g), are curved and described by eqn (22) and (20), respectively. The superscripts ls and ss indicate which type of neck
opens up when we cross one of the latter boundary lines. In all eight cases, the experimental data points for the observed multispheres lie within thecalculated stability regimes, demonstrating the good agreement between theory and experiment.
Paper Soft Matter
Ope
n A
cces
s A
rtic
le. P
ublis
hed
on 1
6 D
ecem
ber
2019
. Dow
nloa
ded
on 1
/13/
2022
8:5
8:53
AM
. T
his
artic
le is
lice
nsed
und
er a
Cre
ativ
e C
omm
ons
Attr
ibut
ion
3.0
Unp
orte
d L
icen
ce.
View Article Online

1254 | Soft Matter, 2020, 16, 1246--1258 This journal is©The Royal Society of Chemistry 2020
For all eight different types of multispherical shapes inFig. 10, the experimental data points belong to the theoreticallypredicted stability regimes, within the accuracy of the measure-ments. This agreement provides strong evidence that the spon-taneous curvature model used here does indeed describe thecurvature elasticity of lipid membranes with one lipid speciessuch as cholesterol that undergoes fast flip-flops on the timescale of the experiments.27 Inspection of Fig. 10 also reveals tworemarkable properties of the stability regimes. On the onehand, the extension of the stability regime as described by theboundary lines is somewhat different for each type of multi-sphere. On the other hand, when we superimpose all eightstability regimes, we see that these regimes have substantialoverlap. Therefore, when we consider a GUV with a certainvolume and membrane area, exposed to a certain sugar asym-metry, leading to the same values of v and %m in the morphologydiagram, this GUV can attain many distinct and stable multi-spherical shapes that differ in their numbers of large and smallspheres as well as in the necklace arrangements of these spheres.
Two examples for this polymorphism are provided in theintroductory Fig. 1. In panel c of this figure, we see threedistinct multispherical shapes which can be formed when wedeflate a spherical vesicle with v = 1 to v = 0.9 by exposing it toan exterior glucose solution, which generates a sufficiently largesugar asymmetry and spontaneous curvature as well. Likewise,panel f of Fig. 1 displays three distinct multispherical shapes,which can be obtained by deflating a prolate vesicle from v = 0.7to v = 0.652 by exposing it to an exterior glucose solution, againcreating, at the same time, a sufficiently large sugar asymmetryand spontaneous curvature. The stability regimes for the threemultispherical shapes in Fig. 1c are shown in the three panelsa, b, and e of Fig. 10. Likewise, the stability regimes of the threemultispherical shapes in Fig. 1f are displayed in the threepanels b, e, and d of Fig. 10. In both cases, a superpositionof all three stability regimes reveals the minimal value of therescaled spontaneous curvature %m = mRve for which all threemultispherical shapes can coexist in the same batch of vesicles.Furthermore, all multispherical vesicles built up from differentnumbers of large and small spheres differ in the bendingenergy of their membranes whereas all vesicles with the samenumber of large and small spheres have the same bendingenergy. Therefore, the multispherical vesicles form a ruggedenergy landscape with many metastable states.27,28
2.8 Generation of membrane curvature by simple sugars
For all multispherical morphologies described in this paper,the vesicle membranes bulged towards their outer leaflets, fromwhich we can directly conclude that all membranes had apositive spontaneous curvature. Thus, one robust conclusionthat we can draw from our study is that an osmotically balancedvesicle membrane with its inner leaflet exposed to sucrose andits outer leaflet exposed to glucose acquires a positive sponta-neous curvature. Furthermore, when we exposed the innerleaflet of the GUV membranes to glucose only and the outerleaflet to a sucrose-glucose solution, thereby reversing the sugarasymmetry, we observed inward-pointing buds and chains of
small spheres, see Fig. S1 (ESI†), as predicted for negativespontaneous curvature.27 We will now focus on the case of positivespontaneous curvature and will show that this sugar-inducedcurvature can arise via two molecular mechanisms.
Analytical theories and computer simulations have pre-viously shown that small solutes in contact with lipid mem-branes can generate membrane curvature, both by formingadsorption and by forming depletion layers at the two sides ofthe membranes. For solute depletion, membrane curvatureis generated by the loss of translational entropy of thesolutes, arising from the inaccessibility of the other aqueouscompartment. Because the larger solutes lose more entropy, thebilayer prefers to bulge towards the solution with the smallersolutes.34,35 Thus, if both glucose and sucrose were effectivelyrepelled from the lipid head groups and formed depletionlayers in front of the two leaflets, the membrane would bulgetowards the glucose solution as observed experimentally.Furthermore, a simple but useful estimate for the magnitudeof the sugar-induced curvature can be obtained if one takes thesugar molecules to be hard-core particles, with particle sizesthat correspond to the hydrodynamic radii of the molecules.The hydrodynamic radius of glucose is 0.36 nm, the one ofsucrose is 0.47 nm.36 Using the previously developed theory,35
one then finds that an interior sucrose solution of 234 mM andan exterior solution of 234 mM glucose generate a sugar-induced curvature of about 0.94 mm�1, which is in reasonableagreement with the value 1.3 mm�1 obtained from the experi-mental data in Fig. 7. It is quite remarkable that this agreementis obtained without any fit parameter.
For solute adsorption, on the other hand, we must distinguishtwo cases depending on whether or not the bilayer contains a lipidspecies that undergoes frequent flip-flops from one leaflet tothe other. In the absence of flip-flops, the adsorption-inducedcurvature can be estimated in terms of the mechanical leaflettensions.34,37,38 One then finds, in accordance with the Gibbsadsorption equation, that the bilayer bulges towards the leafletwith the larger coverage, i.e., with the larger number density ofmembrane-bound solutes. Alternatively, we may also consider theareas per lipid in the two leaflets, which leads to the conclusionthat the bilayer bulges towards the leaflet with the larger averagearea per lipid. In the presence of a flip-flopping lipid species, thebilayer should relax towards a state in which both leaflets aretensionless as has been observed in MD simulations of lipidbilayers with compositional asymmetry.39 Relaxation towardstensionless leaflets implies that we can no longer use the leaflettensions to estimate the adsorption-induced curvature. However,the study in ref. 39 also showed that a bilayer with tensionlessleaflets can have a significant spontaneous curvature and that thiscurvature can be estimated by considering two leaflets with equalpreferred areas. For different leaflet compositions, these equalleaflet areas contain different numbers of lipids and are thuscharacterized by different average areas per lipid. Therefore, evenfor tensionless leaflets, we could use the average lipid areas in thetwo leaflets to estimate the adsorption-induced curvature.
Unfortunately, it is notoriously difficult to determine the areaper lipid experimentally and even more difficult to measure
Soft Matter Paper
Ope
n A
cces
s A
rtic
le. P
ublis
hed
on 1
6 D
ecem
ber
2019
. Dow
nloa
ded
on 1
/13/
2022
8:5
8:53
AM
. T
his
artic
le is
lice
nsed
und
er a
Cre
ativ
e C
omm
ons
Attr
ibut
ion
3.0
Unp
orte
d L
icen
ce.
View Article Online

This journal is©The Royal Society of Chemistry 2020 Soft Matter, 2020, 16, 1246--1258 | 1255
changes in this area. For simple sugars, only a few examples havebeen reported in the literature10,18,21 and these examples revealthat the sugar-induced changes in area per lipid are of the sameorder of magnitude as the area changes induced by typicalmembrane tensions. Furthermore, in these experiments, differentmembrane systems have been used – multilamellar vesicles,10
polydisperse liposome dispersions,18 and oriented bilayerstacks21 – without paying any attention to the tensions in thesemembranes. From an intuitive point of view, one may imaginethat the adsorbing sugar molecules intercalate partially betweenthe lipid head groups, a plausible view that has been repeatedlyadvocated.5,17,18,23,24 If both sucrose and glucose intercalatedbetween the head groups of the respective leaflets, we mightnaively expect that the larger size of sucrose leads to a larger areaincrease per lipid compared to glucose. We would then concludethat the bilayer prefers to bulge towards the inner leaflet withadsorbed sucrose, in contrast to our experimental observations.However, the relevant quantities to compare are not the dimen-sions of the individual sugar molecules but rather the sugarcoverage, i.e., the number density of membrane-bound sugarmolecules on the two leaflets. These densities depend onthe binding free energies between the sugars and the lipidbilayer. Therefore, the smaller size of the glucose could beovercompensated by a higher binding free energy of this moleculewhich would then lead to a positive sugar-induced curvature,in agreement with our experimental observations.
3 Conclusions
In summary, we have studied giant vesicles which were pre-pared in aqueous sucrose solutions and transferred intoanother aqueous solution that contained only glucose or aglucose–sucrose mixture with a much larger mole fraction ofglucose. The osmotic balance between the two sugar solutionsacross the lipid membranes implied that both solutions con-tained the same total concentration of sugar. In this way, weprepared asymmetric bilayers, with the inner leaflet in contactwith sucrose and the outer leaflet in contact with (primarily)glucose. This sugar asymmetry across the bilayer membranescreated a striking diversity of multispherical vesicle shapes.One remarkable property of these shapes is that the individualspheres have either two different radii, Rl and Rs, corres-ponding to large and small spheres, or have all the same size,see Fig. 3–5. Vice versa, the observation of a multisphericalshape that involves at most two different sphere radii providesdirect evidence that all spherical membrane segments experi-ence the same mechanical tension and that the whole multi-sphere is formed by a single bilayer membrane. Thus, we canconclude that all individual spheres of each multisphere wereconcatenated by very narrow, hourglass-shaped membranenecks even though these necks were below optical resolution.Such multispherical shapes were observed over a wide range oftotal sugar concentrations, from 60 mM to 326 mM.
We performed a systematic analysis of the multisphericalshapes which involved several steps. First, we showed that the
geometry of any multisphere is completely determined by thenumbers of large and small spheres as well as by the dimen-sionless volume-to-area ratio v defined in eqn (3). We thendetermined the overall stability of multispheres by derivingstability conditions both for the closed membrane necksagainst neck opening (eqn (8)) and for the individual spheresagainst prolate deformations (eqn (9)). These stability condi-tions can be used to derive lower and upper bounds for thesugar-induced spontaneous curvature of the vesicle mem-branes. By analyzing many multispheres for two specificsugar asymmetries, see Fig. 7 and 9, we obtained the values(1.3 � 0.1) mm�1 and (1.2 � 0.1) mm�1 for the correspondingspontaneous curvatures. The known magnitude of these curva-tures allowed us to map the multispherical shapes into theglobal morphology diagram in Fig. 10 and to compare theexperimental data with the theoretically determined stabilityregimes. This detailed comparison between experiment andtheory directly shows that the shapes of lipid bilayers with asingle flip-flopping species such as cholesterol are quantita-tively described by the spontaneous curvature model. In addi-tion, the strong overlap between the eight stability regimesshown in Fig. 10 also implies that the same sugar asymmetrycan transform a GUV into many different multispherical shapesas schematically shown in Fig. 1c and f.
Last not least, we argued that the sugar-induced curvatureobserved here can arise via two molecular mechanisms. Thefirst mechanism is based on effectively repulsive interactionsbetween the sugar molecules and the lipid bilayers whichlead to partial exclusion of the sugars from the lipid headgroups and to the formation of two depletion layers adjacent tothe two leaflets. Furthermore, a simple theoretical model forthe mutual exclusion of sugars and head groups leads even tothe correct order of magnitude for the sugar-induced curvature,without adjusting any fit parameter. The second mechanism bywhich sugar molecules can generate a positive spontaneouscurvature are effectively attractive interactions between the sugarsand the lipid bilayer, provided the number density of glucosemolecules bound to the outer leaflet exceeds the number densityof sucrose molecules bound to the inner leaflet. To distinguishthese two mechanisms in a reliable way, it will be very valuableto determine the number density of membrane-bound sugarmolecules and the associated binding free energies by atomisticMD simulations.
In this paper, we focused on the most basic propertiesof multispherical vesicles. Many interesting properties andprocesses remain to be investigated. Changing the vesicle volumeby osmotic inflation or deflation, for example, we should be ableto transform multispheres into other shapes via many differentmorphological pathways. Particularly entangled pathways shouldbe obtained when we start from a multisphere with N* equallysized spheres as in Fig. 5. In the latter case, the multispherecan grow, via inflation, into many different multispheres withvariable numbers of Nl large spheres and Ns = N* � Nl smallspheres. Other intriguing aspects of multispheres that requirefurther studies are their responses to mechanical forces arisingfrom micropipette aspiration, adhesion to other surfaces, or
Paper Soft Matter
Ope
n A
cces
s A
rtic
le. P
ublis
hed
on 1
6 D
ecem
ber
2019
. Dow
nloa
ded
on 1
/13/
2022
8:5
8:53
AM
. T
his
artic
le is
lice
nsed
und
er a
Cre
ativ
e C
omm
ons
Attr
ibut
ion
3.0
Unp
orte
d L
icen
ce.
View Article Online

1256 | Soft Matter, 2020, 16, 1246--1258 This journal is©The Royal Society of Chemistry 2020
compression by confining walls. In all of these cases, theapplied forces will have to overcome certain threshold valuesto open up the different membrane necks. Once we know howto open and close the membrane necks in a controlled andreliable manner, we will be able to use these multispheresas metamorphic chambers for chemical reactions and nano-particle growth. Another challenge for future studies is tocouple the multispherical vesicles to membrane fission andfusion processes in order to change their topology.
4 Methods4.1 Lipids and GUV preparation
GUVs were prepared by electroformation.31,40 We dissolved thephospholipid 1-palmitoyl-2-oleoyl-sn-glycero-3-phosphatidylcholine,POPC (purchased from Avanti Polar Lipids, 850457C) and 10 mol%cholesterol (purchased from Sigma-Adrich C8667) in chloroformcontaining about 0.1 mol% Texas-Red DHPE (purchased fromFischer Scientific, T1395MP). About 10 ml of lipid solution werespread onto two indium tin oxide coated glass plates. The samplewas kept covered inside a desiccator with little vacuum during1–2 hours. Coated glass plates with dried sample were spacedusing a Teflon spacer of about 2 mm thickness and clamped atthe edges. Solvent was introduced between coverslips of samplecells through a tiny hole in the Teflon spacer using a syringe.The open hole was sealed using Teflon tape, immediately afterthe solvent filled the whole gap. A sinusoidal AC electric field at10 Hz, 1.1 Vpp was applied for electroswelling the lipid films atroom temperature (23 1C).
4.2 Sugar solutions
We have prepared sucrose (Sigma) and glucose (Sigma) solu-tions in millipore water. The osmolality of the solutions wasmeasured using Osmomat 3000 (freezing point osmometer,Gonotec). Osmolality is defined as the number of osmotically activesolutes per kg water. The unit of osmolality is mosmol kg�1 forwhich we use the acronym mM. The osmometer measures theosmolality with an accuracy of�2 mM for aqueous sugar solutions.It is important to notice that the overall osmotic pressure is thesame for 234 mM sucrose, 234 mM glucose and an aqueoussolution composed of 219 mM glucose plus 15 mM sucrose.
4.3 Observation chamber
For GUVs observations, we prepared an observation chambercomposed of two glass coverslips: the lateral dimensions ofthe bottom coverslip were 26 � 56 mm and its thickness was0.17 � 0.01 mm, the top coverslip had l 22 � 22 mm andthickness 0.17 � 0.01 mm. 5 ml of GUVs solution was trans-ferred in 50 ml of exterior aqueous solution on bottom coverslipand then sealed by the top coverslip with silica spacer in themiddle. All the experiments are performed at room tempera-ture. Before introduction of GUVs, the coverslips were coatedwith 2 mg ml�1 b-casein (Sigma) solution. After 30 min, theb-casein was washed with Millipore filtered water and driedin nitrogen stream. b-Casein prevents vesicle adhesion and rupture
upon contact with the glass coverslips. Before use, the silica spacerwas washed in water and ethanol and dried in nitrogen stream.
4.4 GUV imaging
The vesicles in the sample cell were observed under a confocalmicroscope (Leica TCS-SP5) equipped with a 63� water immer-sion objective (HCX PL APO CS 1.2 N. A.). The objective has aworking distance of 220 mm and xy-resolution of 0.163 mm. Theoptical section with pinhole of 1 AU is 1.25 mm. A thin 2Dplanar optical slice (or xy-section) of the GUVs is imaged inraster pattern. In order to build a 3D image, the confocalobjective is moved via controlled step in the z-direction toimage the consecutive 2D optical slice. Texas-red DHPEwas excited with either a He–Ne laser at 594 nm or DPPSlaser 561 nm and emission collected between (605–700) nmor (590–680) nm respectively. Experimental images shown infigures are the confocal section of GUVs as imaged in the red(membrane dye) channel. For display purpose only, we displaymost of the confocal images of GUVs (except Fig. 2) as blackand white showing the best image contrast.
4.5 Control experiments
We performed control experiments, in which the GUVs wereexposed to only one type of sugar, either sucrose or glucose.GUVs were prepared as described in the previous paragraph on lipidsand GUV preparation and then transferred into the observationchamber, see Fig. 1. The sucrose concentration used in these controlexperiments was between 60 and 326 mM, the glucose concentrationwas between 60 and 130 mM. After osmotic balance was reached,no multispherical vesicles were observed as expected. Indeed,when the exterior and the interior solution are osmoticallybalanced, these two solutions have the same sugar concentration,i.e., either the same sucrose or the same glucose concentration.As a consequence, both bilayer leaflets are exposed to identicalconcentrations of the same sugar molecules, which implies no sugarasymmetry and zero spontaneous curvature.
4.6 Coexistence of large and small spheres
We consider a uniform membrane with bending rigidity k andspontaneous curvature m. As in the main text, we take thespontaneous curvature m to be positive which implies that allspherical segments have positive mean curvatures. The membraneexperiences the pressure difference DP = Pin � Pex between theinterior and exterior solution and the mechanical tension S.The curvature radius Rsp of a spherical segment then satisfiesthe Euler–Lagrange or shape equation
DP ¼ 2SRsp� 4kmRsp
2with S ¼ Sþ 2km2: (11)
This equation is quadratic in the inverse curvature radius1/Rsp which represents the mean curvature of the sphericalsegment. For DP o S2/4km, the quadratic equation has twosolutions, Rsp = Ra and Rsp = Rb, but only one solution, Rsp = R*,for DP = S2/4km. The two distinct solutions correspond to theformation of large and small spheres on the same vesicle whereas
Soft Matter Paper
Ope
n A
cces
s A
rtic
le. P
ublis
hed
on 1
6 D
ecem
ber
2019
. Dow
nloa
ded
on 1
/13/
2022
8:5
8:53
AM
. T
his
artic
le is
lice
nsed
und
er a
Cre
ativ
e C
omm
ons
Attr
ibut
ion
3.0
Unp
orte
d L
icen
ce.
View Article Online

This journal is©The Royal Society of Chemistry 2020 Soft Matter, 2020, 16, 1246--1258 | 1257
the degenerate solution with Rsp = R* corresponds to a multi-spherical shape consisting of several equally sized spheres.
4.7 Mechanical tension and pressure difference formultispherical shapes
The two solutions Ra�1 and Rb
�1 of the spherical shape equa-tion can be used to obtain explicit expressions for the mechan-ical tension and the pressure difference in terms of the tworadii.27 As a result, one obtains the mechanical tension
S ¼ 2km1
Raþ 1
Rb
� �� 2km2 (12)
and the pressure difference
DP ¼ 4kmRaRb
: (13)
These two relationships allow us to calculate S and DP fromthe experimentally observed curvature radii Ra and Rb providedwe know the bending rigidity k and the spontaneous curvaturem. It is instructive to rewrite the mechanical tension S as givenby eqn (12) in terms of the neck curvature Mab as given byeqn (7) and of the spontaneous tension37
s � 2km2 (14)
which leads to
S ¼ 2Mab �m
ms: (15)
This relationship has several interesting consequences. First,apart from the special case m = 0, the spontaneous tension sprovides the basic tension scale for the mechanical tension S.Second, for those limit shapes, for which the least stable necksbecome marginally unstable, the corresponding neck closure con-dition m = Mab implies the positive mechanical tension S = s = 2km2
irrespective of the numbers Nl and Ns of large and small spheres.This tension value applies, in particular, at the corner points in themorphology diagrams of Fig. 10, corresponding to N* equallysized spheres with N* = Nl + Ns. At these corner points, therescaled spontaneous curvature �m ¼ mRve ¼
ffiffiffiffiffiffiN�p
which impliesS = 2kN*/Rve
2. Third, the mechanical tension S vanishes form = 2Mab. When we express the latter condition in terms of therescaled curvatures %m and %Mab � MabRve, we obtain another set oflines within the different stability regimes in Fig. 10. The latter linesmeet the horizontal lines LN*
of N* equally sized spheres at
�m ¼ 2ffiffiffiffiffiffiN�p
.
4.8 Stability of individual spheres
A single sphere with radius Rsp is stable for32,41
DP44kRsp
3mRsp � 3� �
: (16)
First, let us apply this stability criterion to the large sphereswith radius Rsp = Rl which leads to
DP44kRl
3mRl � 3ð Þ: (17)
When we combine this relation with the pressure differencefor the large and small spheres as given by eqn (13), we obtain
3 4 mRl(1 � Rl/Rs). (18)
Because the large-sphere radius Rl is never smaller than thesmall-sphere radius Rs, the right hand side of this inequality isnever positive and the inequality is always fulfilled. Therefore,the large spheres are always stable.
For the small spheres with radius Rsp = Rs, we obtain
DP ¼ 4kmRlRs
44kRs
3mRs � 3ð Þ (19)
which is equivalent to eqn (9) in the main text.
4.9 Boundary lines of limit shapes within the morphologydiagram
The neck closure condition for an ss-neck has the formm = Mss = Rs
�1. Therefore, the limit shapes LssNlþNs
have the
property that the small-sphere radius Rs = 1/m. It then followsthat the dependence of the volume-to-area ratio v on thespontaneous curvature mRve� %m has the explicit functional form
v ¼ vssNlþNsð �mÞ ¼ 1ffiffiffiffiffi
Nl
p 1� Ns
�m2
� �3=2
þNs
�m3
for �m �ffiffiffiffiffiffiffiffiffiffiffiffiffiffiffiffiNl þNs
p:
(20)
The line of limit shapes LssNlþNs
meets the horizontal line oflimit shapes LN*
at a corner point, which has the coordinates
v ¼ v� ¼ 1=ffiffiffiffiffiffiN�p
and �m ¼ffiffiffiffiffiffiN�p
. Furthermore, the line LssNlþNs
behaves as
v 1ffiffiffiffiffiNl
p for large �m: (21)
The latter v-value represents the volume of Nl equally sizedspheres. Therefore, the line of limit shapes Lss
NlþNsapproaches
the line of limit shapes LNl*for large spontaneous curvatures.
In the two panels a and c of Fig. 10, we display multisphereswith only ls-necks which have the same number n of large andsmall spheres. The corresponding lines of limit shapes Lls
n+n aredescribed by
v ¼ vlsnþnð �mÞ � �n
4 �m3þ 1� n
2 �m2
� � ffiffiffiffiffiffiffiffiffiffiffiffiffiffiffiffiffi1
nþ 1
4 �m2
rfor �m �
ffiffiffiffiffi2np
:
(22)
These lines behave as
v 1ffiffiffinp for large �m: (23)
The latter v-value represents the volume of n equally sizedspheres. Therefore, the line of limit shapes Lls
n+n approaches theline of limit shapes Ln*
for large spontaneous curvature.
Conflicts of interest
There are no conflicts to declare.
Paper Soft Matter
Ope
n A
cces
s A
rtic
le. P
ublis
hed
on 1
6 D
ecem
ber
2019
. Dow
nloa
ded
on 1
/13/
2022
8:5
8:53
AM
. T
his
artic
le is
lice
nsed
und
er a
Cre
ativ
e C
omm
ons
Attr
ibut
ion
3.0
Unp
orte
d L
icen
ce.
View Article Online

1258 | Soft Matter, 2020, 16, 1246--1258 This journal is©The Royal Society of Chemistry 2020
Acknowledgements
We acknowledge support by the Max Planck Society and theFederal Ministry of Education and Research (BMBF) via theMaxSynBio consortium. Open Access funding provided bythe Max Planck Society.
Notes and references
1 A. Lehninger, D. Nelson and M. Cox, Principles of biochem-istry, Worth Publishers, New York, 2nd edn, 1993.
2 P. Mergenthaler, U. Lindauer, G. A. Dienel and A. Meisel,Trends Neurosci., 2013, 36, 587–597.
3 Y.-L. Ruan, Annu. Rev. Plant Biol., 2014, 65, 3367.4 D. M. Daloso, L. dos Anjos and A. R. Fernie, New Phytol.,
2016, 211, 809–818.5 J. H. Crowe, L. M. Crowe and D. Chapman, Science, 1984,
223, 701–703.6 M. Caffrey, V. Fonesca and A. C. Leopold, Plant Physiol.,
1988, 86, 754–758.7 J. S. Clegg, Comp. Biochem. Physiol., Part B: Biochem. Mol.
Biol., 2001, 128, 613–624.8 E. P. Feofilova, Appl. Biochem. Microbiol., 2003, 29, 1–18.9 B. Deme, M. Dubois and T. Zemb, Biophys. J., 2002, 82,
215–225.10 T. Soderlund, J.-M. I. Alakoskela, A. L. Pakkanen and
P. K. J. Kinnunen, Biophys. J., 2003, 85, 2333–2341.11 T. Lenne, G. Bryant, C. J. Garvey, U. Keiderling and
K. L. Koster, Physica B, 2006, 385-386, 862–864.12 P. Westh, Phys. Chem. Chem. Phys., 2008, 10, 4110–4112.13 C. J. Garvey, T. Lenne, K. L. Koster, B. Kent and G. Bryant,
Int. J. Mol. Sci., 2013, 14, 8148–8163.14 B. Kent, T. Hauß, B. Deme, V. Cristiglio, T. Darwish, T. Hunt,
G. Bryant and C. J. Garvey, Langmuir, 2015, 31, 9134–9141.15 G. Strauss, P. Schurtenberger and H. Hauser, Biochim.
Biophys. Acta, 1986, 858, 169–180.16 C. Lambruschini, A. Relini, A. Ridi, L. Cordone and
A. Gliozzi, Langmuir, 2000, 16, 5467–5470.17 M. D. C. Luzardo, F. Amalfa, A. M. Nunez, S. Daz, A. C. B. de
Lopez and E. A. Disalvo, Biophys. J., 2000, 78, 2452–2458.18 H. D. Andersen, C. Wang, L. Arlethc, G. H. Peters and
P. Westh, Proc. Natl. Acad. Sci. U. S. A., 2011, 108, 1874–1878.19 K. B. Konov, D. V. Leonov, N. P. Isaev, K. Y. Fedotov,
V. K. Voronkova and S. A. Dzuba, J. Phys. Chem., 2015,119, 10261–10266.
20 M. I. Morandi, M. Sommer, M. Kluzek, F. Thalmann,A. P. Schroder and C. M. Marques, Biophys. J., 2018, 114,2165–2173.
21 A. Dhaliwal, A. Khondker, R. Alsop and M. C. Rheinstadter,Membranes, 2019, 9, 15.
22 A. K. Sum, R. Faller and J. J. de Pablo, Biophys. J., 2003, 85,2830–2844.
23 C. S. Pereira and P. H. Hunenberger, J. Phys. Chem. B, 2006,110, 15572–15581.
24 J. Kapla, J. Wohlert, B. Stevensson, O. Engstrom,G. Widmalm and A. Maliniak, J. Phys. Chem. B, 2013, 117,6667–6673.
25 G. Moiset, C. A. Lopez, R. Bartelds, L. Syga, E. Rijpkema,A. Cukkemane, M. Baldus, B. Poolman and S. J. Marrink,J. Am. Chem. Soc., 2014, 136, 16167–16175.
26 W. Q. Sun and A. C. Leopold, Comp. Biochem. Physiol., PartA: Mol. Integr. Physiol., 1997, 117, 327–333.
27 R. Lipowsky, The Giant Vesicle Book, ed. R. Dimova andC. Marques, Taylor & Francis, 2019, ch. 5.
28 P. Bassereau, R. Jin, T. Baumgart, M. Deserno, R. Dimova,V. A. Frolov, P. V. Baskirov, H. Grubmuller, R. Jahn,H. J. Risselada, L. Johannes, M. M. Kozlov, R. Lipowsky,T. J. Pucadyil, W. F. Zeno, J. C. Stachowiak, D. Stamou,A. Breuer, L. Lauritsen, C. Simon, C. Sykes, G. A. Voth andT. R. Weikl, J. Phys. D: Appl. Phys., 2018, 51, 343001.
29 Y. Liu, J. Agudo-Canalejo, A. Grafmuller, R. Dimova andR. Lipowsky, ACS Nano, 2016, 10, 463–474.
30 T. Bhatia, J. Agudo-Canalejo, R. Dimova and R. Lipowsky,ACS Nano, 2018, 12, 4478–4485.
31 R. Dimova, Annu. Rev. Biophys., 2019, 48, 93–119.32 U. Seifert, K. Berndl and R. Lipowsky, Phys. Rev. A: At., Mol.,
Opt. Phys., 1991, 44, 1182–1202.33 B. Fourcade, L. Miao, M. Rao, M. Wortis and R. Zia, Phys.
Rev. E: Stat. Phys., Plasmas, Fluids, Relat. Interdiscip. Top.,1994, 49, 5276–5286.
34 R. Lipowsky and H. G. Dobereiner, Europhys. Lett., 1998, 43,219–225.
35 B. Rozycki and R. Lipowsky, J. Chem. Phys., 2016, 145,074117.
36 A. C. F. Ribeiro, O. Ortona, S. M. N. Simoes, C. I. A. V. Santos,P. M. R. A. Prazeres, A. J. M. Valente, V. M. M. Lobo andH. D. Burrows, J. Chem. Eng. Data, 2006, 51, 1836–1840.
37 R. Lipowsky, Faraday Discuss., 2013, 161, 305–331.38 B. Rozycki and R. Lipowsky, J. Chem. Phys., 2015, 142,
054101.39 M. Miettinen and R. Lipowsky, Nano Lett., 2019, 19,
5011–5016.40 M. Angelova and D. Dimitrov, Faraday Discuss. Chem. Soc.,
1986, 81, 303–311.41 Z.-C. Ou-Yang and W. Helfrich, Phys. Rev. A: At., Mol., Opt.
Phys., 1989, 39, 5280–5288.
Soft Matter Paper
Ope
n A
cces
s A
rtic
le. P
ublis
hed
on 1
6 D
ecem
ber
2019
. Dow
nloa
ded
on 1
/13/
2022
8:5
8:53
AM
. T
his
artic
le is
lice
nsed
und
er a
Cre
ativ
e C
omm
ons
Attr
ibut
ion
3.0
Unp
orte
d L
icen
ce.
View Article Online