simple stats at umd - wordpress.com · 2013-04-17 · simple stats at umd sunshine carter...
TRANSCRIPT

Simple Stats at UMD
Sunshine Carter
University of Minnesota Duluth
June 1, 2012
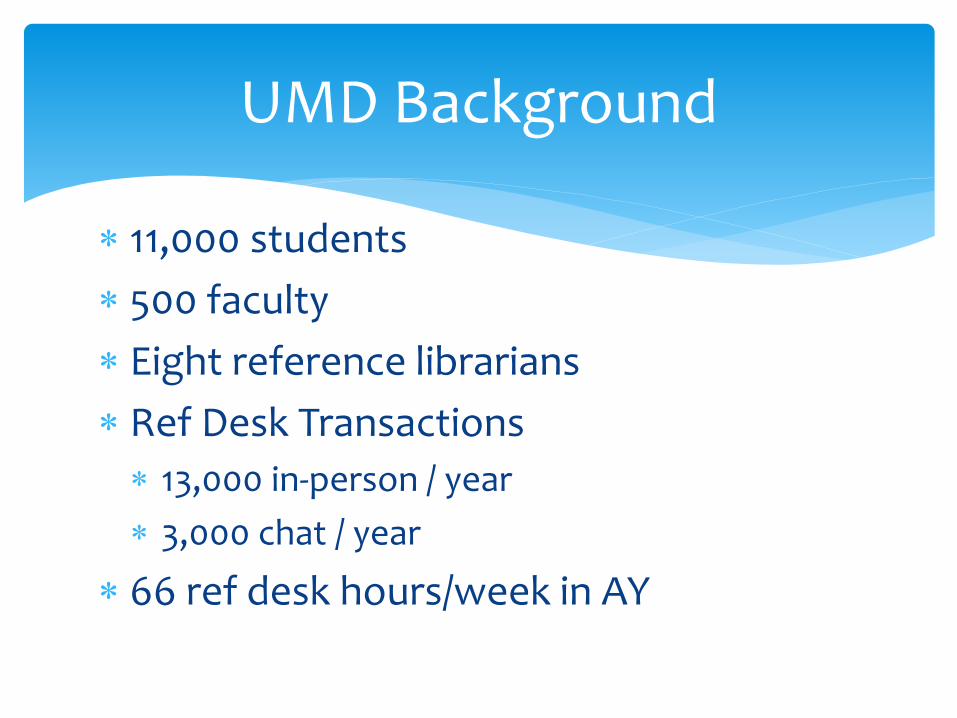
11,000 students
500 faculty
Eight reference librarians
Ref Desk Transactions
13,000 in-person / year
3,000 chat / year
66 ref desk hours/week in AY
UMD Background
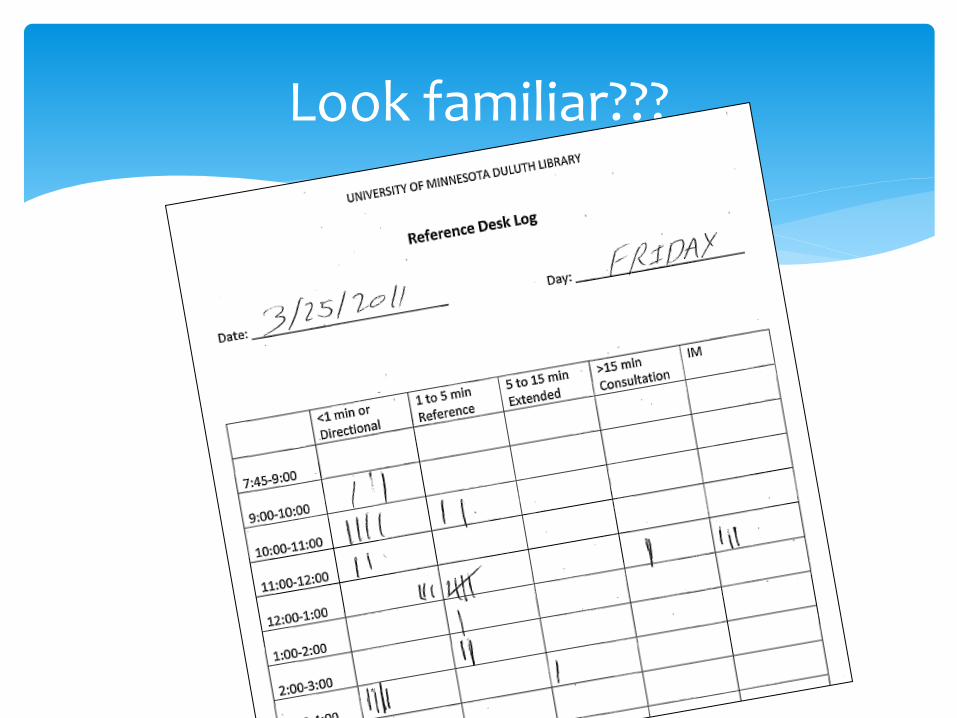
Look familiar???
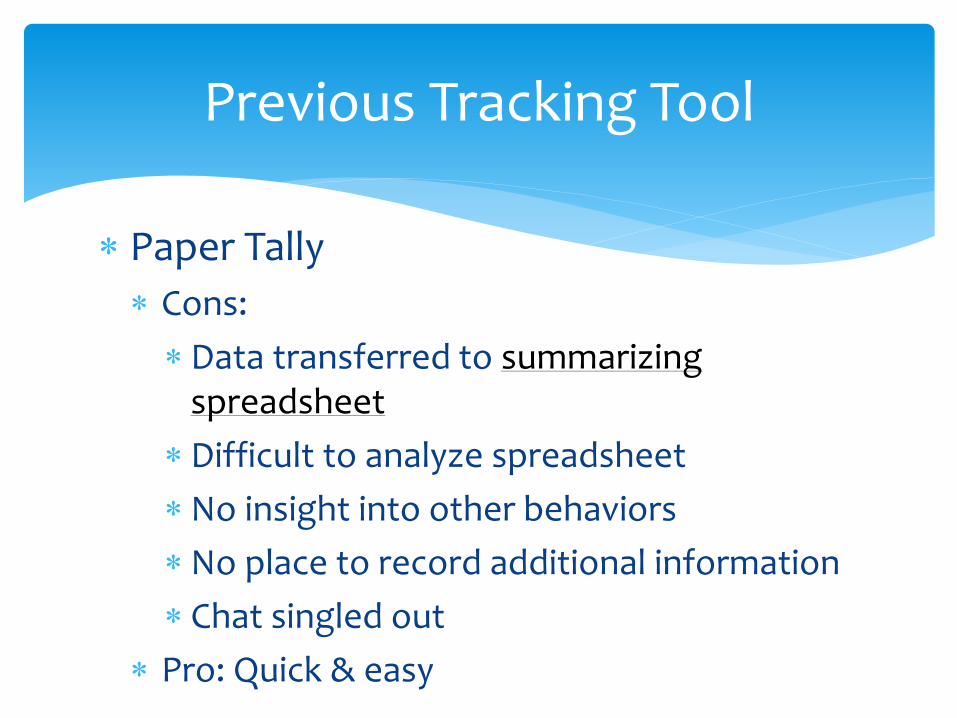
Paper Tally
Cons:
Data transferred to summarizing spreadsheet
Difficult to analyze spreadsheet
No insight into other behaviors
No place to record additional information
Chat singled out
Pro: Quick & easy
Previous Tracking Tool

2008 began quest to move to digital tracking tool
Investigated Libstats, Desk Tracker and a fancy Excel program.
Chose Libstats with a 7/1/09 implementation date. Pushed back indefinitely due to technical issues with installation
A Microsoft Access tracker was created. Abandoned due to lack of enthusium and ease of use
Path to a New Way of Life
Quick
Limited demand on IT support staff
Simple
Minimal clicks
Ability to add optional notes
Years later, we finally knew what we wanted.

Epiphany
How to build it?
MySQL – too dependent on IT staff
Forms in Google Docs (UofM version) – hmm?
One hour later, we had a working prototype, with no prior experience.
Creation of SimpleStats

Brainstorm
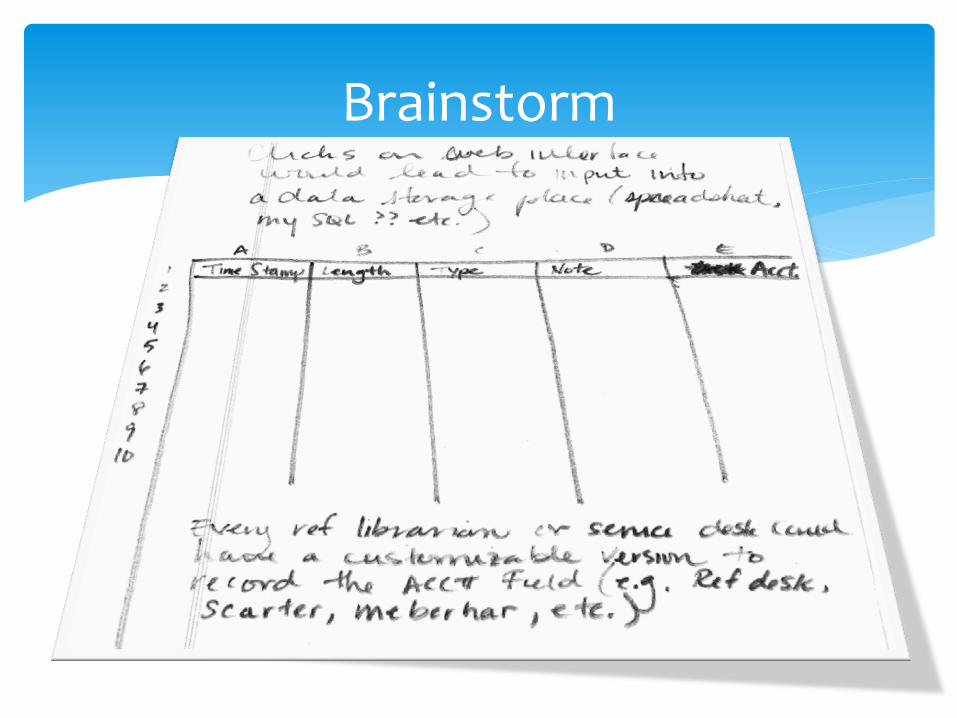
Brainstorm

Epiphany
How to build it?
MySQL – too dependent on IT staff
Forms in Google Docs (UofM version) – hmm?
One hour later, we had a working prototype, with no prior experience.
Creation of SimpleStats

SimpleStats FrontEnd

Simple Stats Backend

The steps to creating a desk statistics tracking tool are simple:
1. Create a Google account (if needed)
2. Log into Google and open Google Docs
3. Create a form
5. Add/format questions and customize form
6. Create an access point
7. Start recording
Google Docs
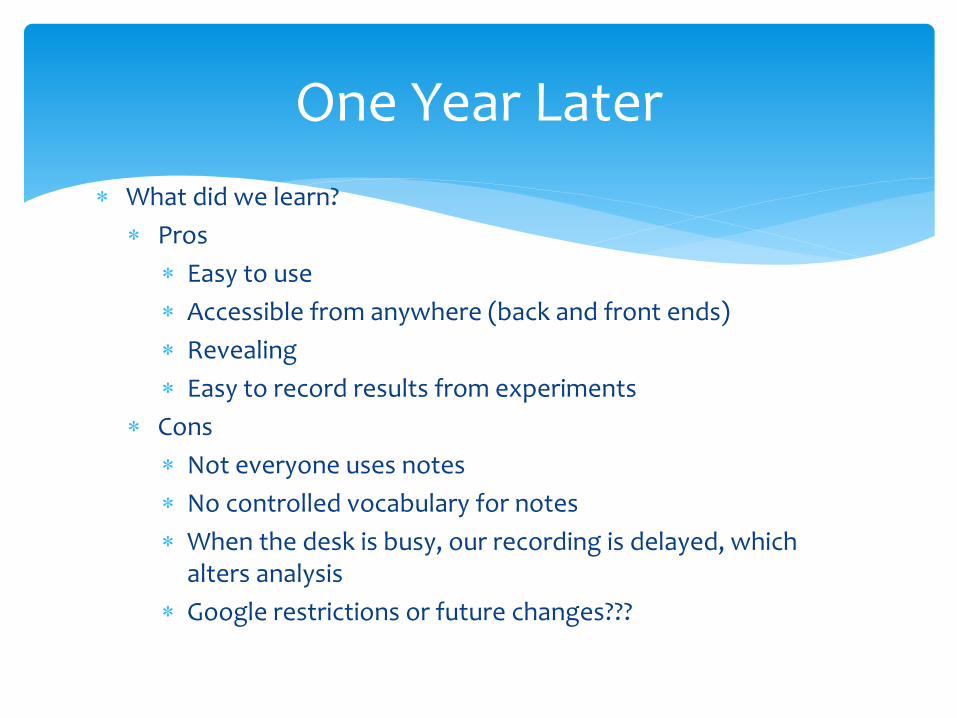
What did we learn?
Pros
Easy to use
Accessible from anywhere (back and front ends)
Revealing
Easy to record results from experiments
Cons
Not everyone uses notes
No controlled vocabulary for notes
When the desk is busy, our recording is delayed, which alters analysis
Google restrictions or future changes???
One Year Later
Supplies

Directional
7
9
11
13
15
17
19
21
23
0 1 2 3 4 5 6 7 8
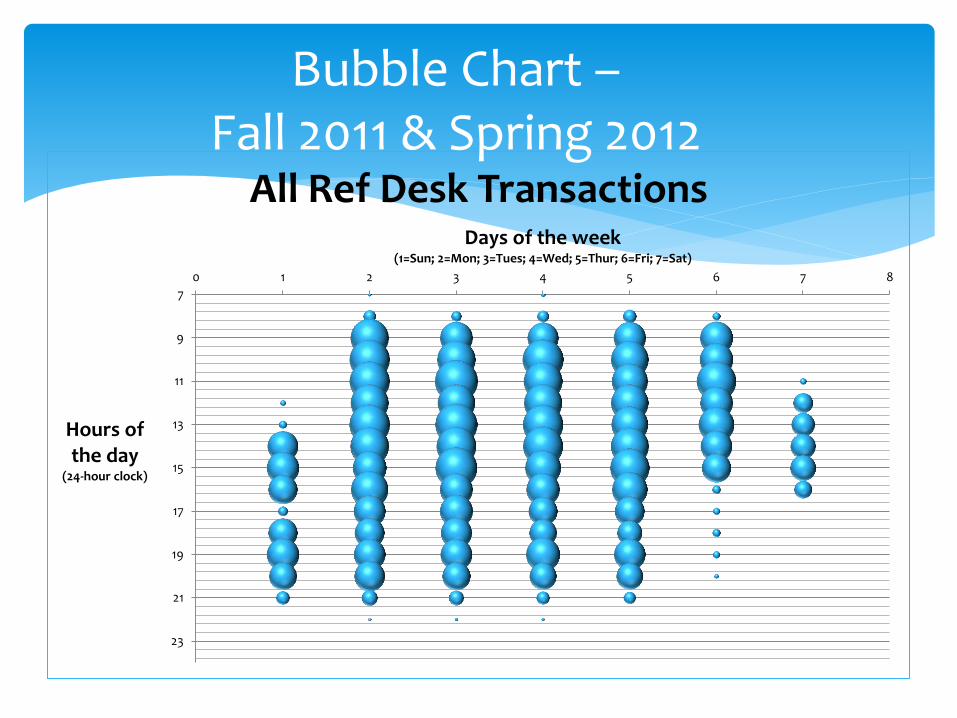
Hours of the day
(24-hour clock)
Days of the week (1=Sun; 2=Mon; 3=Tues; 4=Wed; 5=Thur; 6=Fri; 7=Sat)
All Ref Desk Transactions
Bubble Chart – Fall 2011 & Spring 2012

Bubble Chart – Fall 2011 & Spring 2012
7
9
11
13
15
17
19
21
23
0 1 2 3 4 5 6 7 8
Hours of the day (24-hour clock)
Days of the week (1=Sun; 2=Mon; 3=Tues; 4=Wed; 5=Thur; 6=Fri; 7=Sat)
Reference Transactions
Series1

Statistics by Day (Fall 2011 & Spring 2012 only)

Statistics by Hour (Fall 2011 & Spring 2012 only)

Question: Is a 9-10PM shift necessary?
Spring 2012
24, 9-10PM shifts were randomly added
Preliminary results: 4th highest transaction/hour at 3.83 (after 11AM, 10AM
and 1PM; the 9AM spot held the #8 position with 3.25)
1st place in terms of reference transactions/hour at 2.13 (the 9AM spot held the #11 position with 1.32)
Preliminary data incorporates all statistics generated from 9-10PM, even if it was not a scheduled 9-10PM shift. Further analysis of data is warranted.
9AM v. 9PM
Thanks to Tom Ambrosi, Sarah Beaubien & Rory Litwin.
Thanks to the UMD Reference Team.
Carter, Sunshine, and Thomas Ambrosi. "How to build a desk statistics tracker in less than an hour using Forms in Google Docs.” Computers in Libraries 31.8 (2011): 12-16. (http://z.umn.edu/simplestats)
Acknowledgements & Reference

Sunshine Carter
Reference & Electronic Resources Librarian
UMD Library
218-726-6693
Questions?