simple parametric model for estimating development …€¦ · simple parametric model for...
TRANSCRIPT

Simple Parametric Model for Estimating Development (RDT&E)
Cost for Large-Scale Systems
Robert R. JonesPaul HardinAnna Irvine
Research SponsorMr. Robert Flowe, Office of the Deputy Under-Secretary of Defense, Acquisition Technology and Logistics, Software Engineering & System Assurance
Presented at the 2009 ISPA/SCEA Joint Annual Conference and Training Workshop - www.iceaaonline.com

Slide 242nd Annual DoDCAS, February 2009
Outline
1. Notional Problem Statement2. Research History3. Data4. Analytical Hypothesis5. Analysis / Results6. Conclusions7. Backups
Presented at the 2009 ISPA/SCEA Joint Annual Conference and Training Workshop - www.iceaaonline.com
Internal to the UAV systemInternal to the UAV system
42nd Annual DoDCAS, February 2009
UAVUAV
Ground Control Station
Ground Control Station
Sensors PayloadSensors Payload
Image Capture Payload
Image Capture Payload
Communications Relay Payload
Communications Relay Payload
Payload status & Video
Payload status & Video
Payload status & images
Payload status & images
Payload status
Payload status
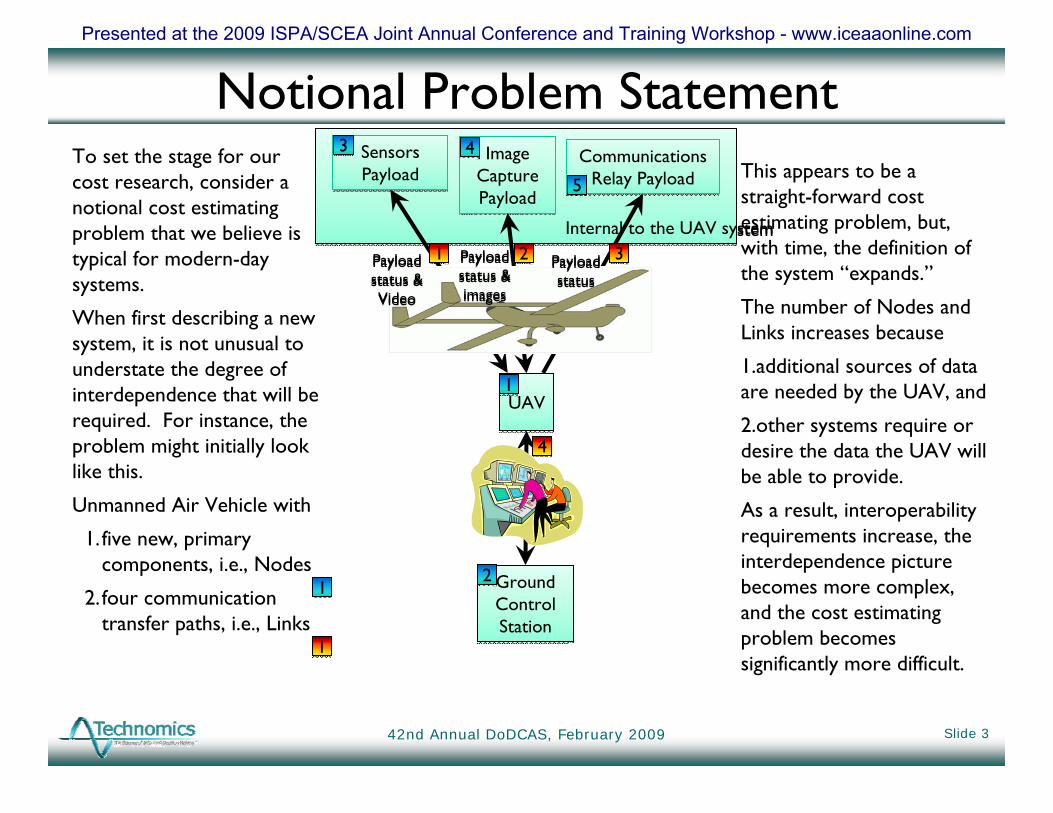
Notional Problem StatementTo set the stage for our cost research, consider a notional cost estimating problem that we believe is typical for modern-day systems.
When first describing a new system, it is not unusual to understate the degree of interdependence that will be required. For instance, the problem might initially look like this.
Unmanned Air Vehicle with
1.five new, primary components, i.e., Nodes
2.four communication transfer paths, i.e., Links
This appears to be a straight-forward cost estimating problem, but, with time, the definition of the system “expands.”
The number of Nodes and Links increases because
1.additional sources of data are needed by the UAV, and
2.other systems require or desire the data the UAV will be able to provide.
As a result, interoperability requirements increase, the interdependence picture becomes more complex, and the cost estimating problem becomes significantly more difficult.
Slide 3
11
22
33
55
44
11 22 33
44
11
11
Presented at the 2009 ISPA/SCEA Joint Annual Conference and Training Workshop - www.iceaaonline.com

Slide 442nd Annual DoDCAS, February 2009
Interdependence Complexity
Internal to the UAV system
UAV
Ground Control Station
Global Positioning
Info Network
Weapons Platforms
“Shooters”
Flight Control Services
Tactical Operations
CenterJoint Task Force
Home Station
Operations Center
Direct Payload User
Manned Platforms
Sensors Payload
Image Capture Payload
Communications Relay Payload
3D Location
UAV/payload status & data
C2 Info
Payload status & data
UAV Location
Target Info
Messages
Maintenance Info
Admin Info
Dynamic Tasking
Payload data
Payload data
Flight Clearance Flight
Coordination
IFF Interrogation
IFF Interrogation
IFF Response
Payload status & Video
Payload status & images
Payload status
1
2
3
5
4
1 2 3
6
7
8
9
1011
13
14
154
5
6
7
8
910
11
12
13
4
The current, expanded UAV system is
1. at least fifteen primary Nodes (some Nodes such as “Manned Platforms” might represent several distinct Nodes, and we believe more Nodes will be identified as the system definition is refined)
2. five new Nodes, six legacy Nodes, and four “future legacy” Nodes
3. at least thirteen Links (see the Nodes comment above),
4. five uni-directional Links and eight bi-directional Links
5. two security levels, four media types, several throughput rates, etc., etc.
This is becoming a more and more difficult problem; we are confronted with increasing scope and uncertainty of the system’s interdependence
requirements.
This is becoming a more and more difficult problem; we are confronted with increasing scope and uncertainty of the system’s interdependence
requirements.
Presented at the 2009 ISPA/SCEA Joint Annual Conference and Training Workshop - www.iceaaonline.com

Slide 542nd Annual DoDCAS, February 2009
Research History
Our research was initiated in 2003 and is still ongoing; we have adjusted our focus and emphasis to address sponsor issues and concerns.
Currently, we are sponsored by Robert Flowe, ODUSD(A&T)/SSAOther sponsors who have participated in the research are:
Office of the Deputy Assistant Secretary of the Army for Cost and EconomicsAir Force Cost Analysis AgencyOffice of the Secretary of Defense, Program Analysis and Evaluation
Our principal investigators areRobert Flowe, ODUSD(A&T)/SSEDr. Maureen Brown, University of North CarolinaDr. David Zubrow and James McCurley, Software Engineering InstituteRobert Jones, Paul Hardin, and Michael Jeffers, Jr., and Anna Irvine, Technomics, Inc.Gary Eiserman and Ajay Choudhary, Raytheon Virtual Technology Corporation
Objective:To understand the behavior of Development cost (RDT&E $) as a function of the complexity of a system and its interdependencies with other systems; improve our ability to estimate RDT&E $ and avoid cost growth.
Objective:To understand the behavior of Development cost (RDT&E $) as a function of the complexity of a system and its interdependencies with other systems; improve our ability to estimate RDT&E $ and avoid cost growth.
Presented at the 2009 ISPA/SCEA Joint Annual Conference and Training Workshop - www.iceaaonline.com

Data
The next several slides explain the data we use, our sources, our specific data selections, our data extraction processes, how we organize our data, and how we validate our data.
But, first, we need to explain Nodes and Links.
Slide 642nd Annual DoDCAS, February 2009
Mandatory and external to our process
Problem Statement
Nodes and Links
Taxonomy
RDT&E $ and
Schedule Data
Nodes and LinksData
(DoDAF OV-2 and SV-6)
1. Source2. Selection3. Extraction4. Organization5. Validation
Operational Requirements
System Engineering
Information Support Plan
(DoDAF Data)
Presented at the 2009 ISPA/SCEA Joint Annual Conference and Training Workshop - www.iceaaonline.com

Nodes and Links Taxonomy
Slide 742nd Annual DoDCAS, February 2009
Nodes, N = an element of architecture that produces, consumes, or processes data. Send / Receive Nodes, Ns/r = A Node that both sends and receives information.Send Nodes, Ns = A Node that sends information.Receive Nodes, Nr = A Node that receives information.
Links, L = A representation of the physical realization of connectivity between Nodes. Uni-Directional Links, Lud = A Link with a uni-directional information flow.Bi-Directional Links, Lbd = A Link with a bi-directional information flow.
Nodes and Links
Taxonomy
Potential Link
Ns/r Ns/r
Ns/r Nr
SystemsNode, N1 N2
N3 N4Link
L1
L2
L3
L4L5
5/6Integration Density, Lt/LtMax6Metcalfe Number, LtMax
Systems Nodes, N
5/4Links per Node, Lt/Nt
5Total, Lt3Bi- directional, Lbd2Uni- directional, Lud
Links, L4Total, Nt1Receive, Nr0Send, Ns3Send/Receive, Ns/r
ValueItem
5/6Integration Density, Lt/LtMax6Metcalfe Number, LtMax
Systems Nodes, N
5/4Links per Node, Lt/Nt
5Total, Lt3Bi- directional, Lbd2Uni- directional, Lud
Links, L4Total, Nt1Receive, Nr0Send, Ns3Send/Receive,
ValueItem
Presented at the 2009 ISPA/SCEA Joint Annual Conference and Training Workshop - www.iceaaonline.com

Nodes and Links Data1. Source: Information Support Plans (ISPs), Capability Development
Document (CDD), and the Capability Production Document (CPD), specifically data provided by Department of Defense ArchitectureFramework (DoDAF) products. (See Slides 9 and 10)
2. Selection: DoDAF System View 6 (SV-6) and Operational View 2 (OV-2), supplemented with other views. (See Slide 11)
3. Extraction: Via a specialized MS Excel worksheet. (See Slide 12)
4. Organization: Database of thirty-three+ ACAT I, II, and III programs along with SV-6 extracted and calculated data.
5. Validation: Via consistency checks across the DoDAF views and “Integration Density” analysis. (See Slide 13)
(Please see the backup slides for a bit more information on DoDAF.)
Slide 842nd Annual DoDCAS, February 2009
Nodes and LinksData
Presented at the 2009 ISPA/SCEA Joint Annual Conference and Training Workshop - www.iceaaonline.com

Sources of Data
Slide 942nd Annual DoDCAS, February 2009
Nodes and LinksData
Our primary sources of DoDAF data, i.e., the ISP, the CDD, and the CPD, are required (repeated) documents for all programs.
Some DoDAF data advantages are:
1.use of standard, suggested templates,
2.directly-relatable to requirements,
3.products of systems engineering processes,
4.provide integrated, multi-dimensional views, and
5.enable cross-program comparisons.
And, software packages are available to insure consistency of the DoDAF data and products.
Presented at the 2009 ISPA/SCEA Joint Annual Conference and Training Workshop - www.iceaaonline.com

DoDAF Products vs Data SourcesThe ISP, the CDD, and the CPD provide an assortment of DoDAF products that reflect an integrated picture of operational and system capabilities.
The data we use are provided by five of the DoDAF products. (See Slide 11)
Slide 1042nd Annual DoDCAS, February 2009
Nodes and LinksData
Policy Source Product
AV
-1
AV
-2
OV
-1
OV
-2
OV
-3
OV
-4
OV
-5
OV
-6C
SV-1
SV-2
SV-4
SV-5
SV-6
SV-1
0
TV
-1
DODI 4630.8ISP X 1 X X X X X X X X X
ISP NR-KPP X X X X X X X X X
CJCSM 3170.01ICD X
CDD X X X X X X X X 2
CPD X X X X X X X X 3
CRD 4 4 4
CJCSI 6212.01ICD X
CDD-NR X X X X X X X X X
CPD NR-KPP X X X X X X X X X
CRD (I-KPP) 4 4
CRD (NR-KPP) 4 4
DoDAFIntegrated Architecture
X X X X X X X
Source: Defense Acquisition Guidebook, Table 7.2.8.1 Policy-Based Architecture Product Requirements
X = Required architecture product
1 = Acronym list
2 = Draft Information Technology (IT) Standards Profile generated by DoD IT Standards Registry (DISR)
3 = Final IT Standards Profile generated by DoD IT Standards Registry (DISR)
4 = Required for legacy Capstone requirements Documents and Capstone Requirements Document updates directed by the
Joint Requirements Oversight Council
ISP - Information Support Plan (Replaces C4I Support Plan - C4ISP)
ICD - Initial Capabilities Document CDD - Capability Development Document
CPD - Capability Production Document CRD - Capstone Requirements Document
NR = Net-Ready KPP = Key Performance Parameter I = Interoperability
Policy References do not show requirements for OV-6b, OV-6a, OV-7, SV-3, SV-7, SV-8, SV-9, SV-10a, SV-10b, SV-11, or TV-2.
DODI 4630.8, Procedures for Interoperability and Supportability of Information Technology (IT) and National Security Systems (NSS)
CJCSM 3170.01, Joint Capabilities Integration and Development System
CJCSI 6212.01, Interoperability and Supportability of Information Technology and National Security Systems
DoDAF = Department of Defense Architecture Framework
DoDAF Products
DODI 4630.8
CJCSM 3170.01
CJCSI 6212.01
DoDAF
Presented at the 2009 ISPA/SCEA Joint Annual Conference and Training Workshop - www.iceaaonline.com

Required / Desired DoDAF Products
Slide 1142nd Annual DoDCAS, February 2009
The five DoDAF products we require / desire are listed above.The most important of these is the SV-6 (See Slide 12); it provides a tabular set of information that is readily adaptable to our specialized MS Excel worksheet used to extract the Nodes and Links data we need.
Nodes and LinksData
DoDAF Product General Description
Required (R) or
Desired (D)
Graphical Insight
Nodes Links Nodes Links
OV-1, High-Level Operational Concept Graphic
High-level graphical/tectual description of operational concept
D X
OV-2, Operational Node Connectivity Description
Operational nodes, connectivity, and information exchange need lines between nodes
R X
OV-3, Operational Information Exchange Matrix
Information exchanged between nodes and the relevant attributes of that exchange
D X X
SV-1, Systems Interface Description, Services Interface Description
Identification of system nodes, systems, systems items, services , and services items and their
interconnections, within and between nodesD X
SV-6, System Data Exchange Matrix, Service Data Exchange Matrix
Provides details of system or service or service data
elements being exchanged between systems or services and the attributes of that exchange
R X X X X
General Description Source: DoD Architecture Framework Version 1.5 Volume I: Definitions and Guidelines, 23 April 2007.
QantityTechnical
Characteristics
X
X
X
D
R
D
D
R X X
X
X
X
X
Quantity
Presented at the 2009 ISPA/SCEA Joint Annual Conference and Training Workshop - www.iceaaonline.com

SV-6 Data “Template”
Slide 1242nd Annual DoDCAS, February 2009
Here you see the DoDAF-suggested content of an SV-6.While we monitor and extract as many of these attributes as possible, our current analysis focuses is on the numbers and types of Nodes and Links.
Nodes and LinksData
Data Description
Name and Identifier
Content
Format Type
Media Type
Accuracy
Units of Measurement
Data Standard
Producer(Sender Systems Node)
Consumer(Receiver Systems Node)
Link
Nature of Transaction
Transaction Type
Triggering Event
Interoperability Level
Criticality
Security
Protection
Classification
Caveat
Releasability
Security Standard
Information Assurance
Access Control
Availability
Confidentiality
Dissemination Control
Integrity
Non-Repudiation
Performance Attributes
Periodicity
Timeliness
Throughput
Size
Available for every System Data Exchange Required to Support the Role(s) or Mission(s)
Note: Producers (Senders) can be Consumers (Receivers) or both. This phenomenon leads to the possibility of Links being either uni-directional or bi-directional.
Presented at the 2009 ISPA/SCEA Joint Annual Conference and Training Workshop - www.iceaaonline.com

Nodes and Links Data ValidationWe found an important relationship
between the total number of Nodes in a system, Nt, and the “Integration Density,” i.e., the ratio of the actual number of Links to the maximum possible number Links.
The maximum possible number of Links is given by the Metcalfe number:
We use this relationship to “validate”extracted SV-6 data.
We also can make two important observations:
1. Given Nt, we can estimate Lt, and
2. As Nt increases, fewer and fewer potential Links are implemented.
Slide 1342nd Annual DoDCAS, February 2009
0.00
0.05
0.10
0.15
0.20
0.25
0.30
0.35
0.40
0.45
0.50
0.55
0 10 20 30 40 50 60 70 80 90 100 110 120
Actual Links / M
aximum
Possible Links
Total Number of Nodes, Nt
Integration Density
Program Data
Power Trendline
2NtNtLtMax 2 /)( −=
Nodes and LinksData
R2 = 0.9105
Note: In this figure, the correlation between the number of Nodes and Links is suggestive of a "scale-free network“ in that there is a non-random relationship of Links to Nodes that is consistent at any scale.
Presented at the 2009 ISPA/SCEA Joint Annual Conference and Training Workshop - www.iceaaonline.com

RDT&E $ and Schedule Data
Slide 1442nd Annual DoDCAS, February 2009
RDT&E $ and
Schedule Data
1. Source: Selected Acquisition Reports (for ACAT I programs) and Budget Exhibits (for ACAT II and III programs)
2. Selection (Typical December, 2007, SAR data):RDT&E $: “Cost and Funding, Cost Summary,
Total Acquisition Cost and Quantity, Appropriation, RDT&E, SAR Baseline (Dev Est), BY$M”
Schedule, Milestone II or B: “Schedule, Milestones, Milestone B or II, SAR Baseline (Dev Est)”
Schedule, Milestone C or III: Similar to Milestone B or II
3. Extraction: Via Defense Acquisition Management Information Retrieval (DAMIR) system or manually via Budget Exhibits
4. Organization: Database of ACAT I, II, and III programs along with RDT&E $ and schedule data
5. Validation: We use only “authoritative” $ and schedule data sources
Slide 14
As much as possible, we want the timing of our DoDAF data and our $ and
schedule data to coincide.
As much as possible, we want the timing of our DoDAF data and our $ and
schedule data to coincide.
Presented at the 2009 ISPA/SCEA Joint Annual Conference and Training Workshop - www.iceaaonline.com
Slide 1542nd Annual DoDCAS, February 2009 Slide 15
Analytical HypothesisAnalytical
Hypothesis
CER Analysis / Results
CER Analysis / Results
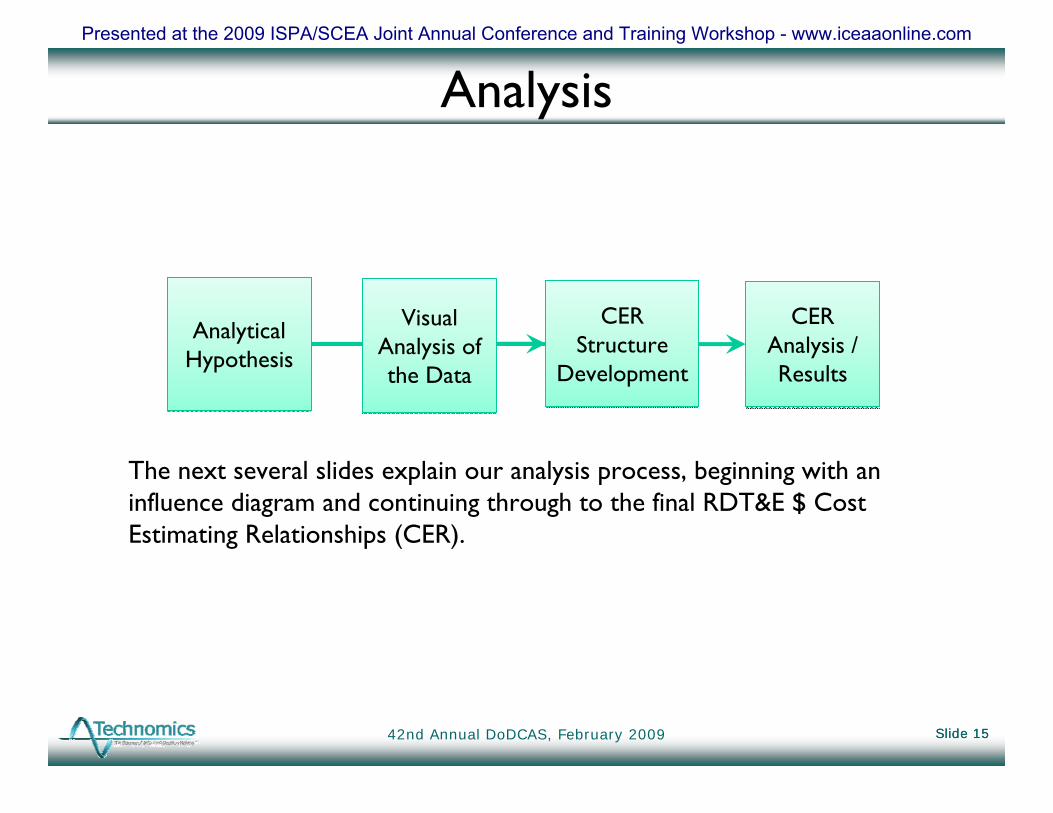
Analysis
The next several slides explain our analysis process, beginning with an influence diagram and continuing through to the final RDT&E $ Cost Estimating Relationships (CER).
Visual Analysis of the Data
Visual Analysis of the Data
CER Structure
Development
CER Structure
Development
Presented at the 2009 ISPA/SCEA Joint Annual Conference and Training Workshop - www.iceaaonline.com

Slide 1642nd Annual DoDCAS, February 2009
Analytical Hypothesis
RDT&E $
Linksper
Node
Node, Nt- Receive Information- Send Information- Send and Receive
Links, Lt- Uni-directional flow- Bi-directional flow
RDT&E $ are influenced by1. Number of Nodes and Links2. Node and Link complexity3. Interdependency complexity measured in number of Links per
Node
1. Number of Nodes and Links2. Node and Link complexity3. Interdependency complexity measured in number of Links per
Node
Analytical Hypothesis
Presented at the 2009 ISPA/SCEA Joint Annual Conference and Training Workshop - www.iceaaonline.com

Slide 1742nd Annual DoDCAS, February 2009 Slide 17
RDT&E $ versus Nodes Analysis
RDT&E $M versus Nodes
R2 = 0.6898
$0
$5,000
$10,000
$15,000
$20,000
$25,000
0 20 40 60 80 100 120Number of Nodes
RD
T&E
FY08
$M
RDT&E $ relates to the total number of Nodes, independent of the type, or complexity.
Number of Nodes = Ns/r + Ns + Nr
In this dataset, by not considering the influence of Links in this relationship, one of the largest and most complex programs would be underestimated.
Visual Analysis of the Data
Presented at the 2009 ISPA/SCEA Joint Annual Conference and Training Workshop - www.iceaaonline.com
RDT&E $ versus Links Analysis
Slide 1842nd Annual DoDCAS, February 2009
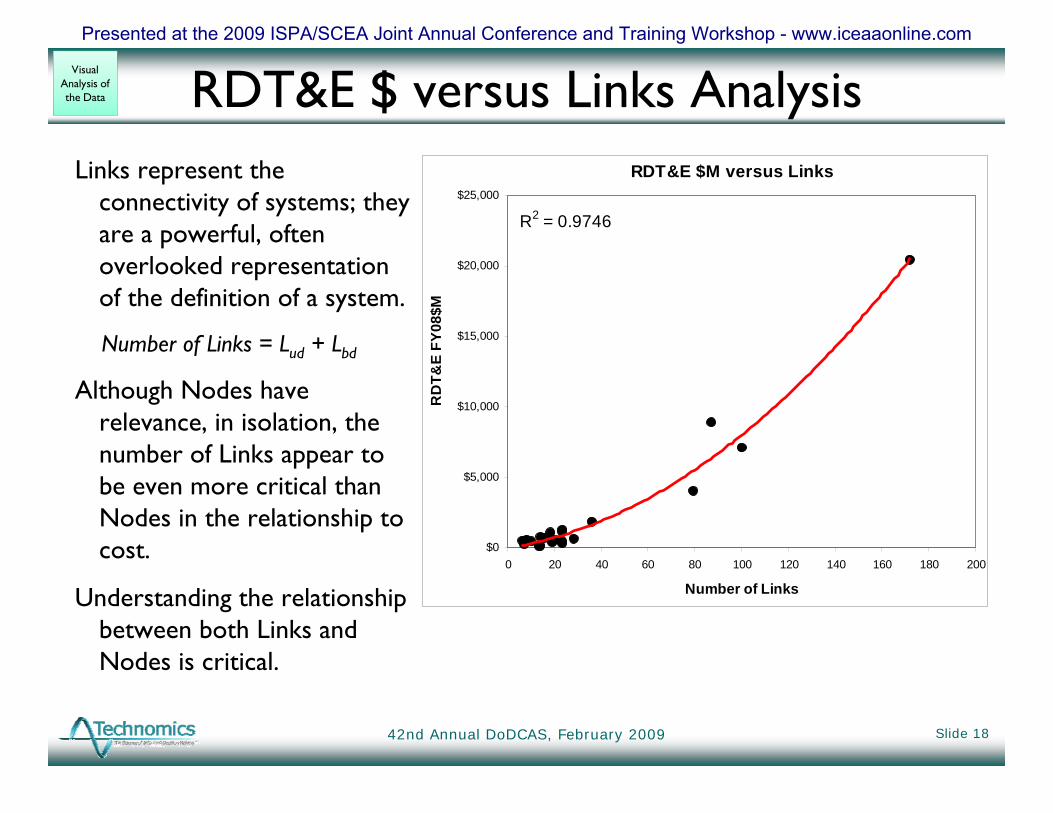
Links represent the connectivity of systems; they are a powerful, often overlooked representation of the definition of a system.
Number of Links = Lud + Lbd
Although Nodes have relevance, in isolation, the number of Links appear to be even more critical than Nodes in the relationship to cost.
Understanding the relationship between both Links and Nodes is critical.
RDT&E $M versus Links
R2 = 0.9746
$0
$5,000
$10,000
$15,000
$20,000
$25,000
0 20 40 60 80 100 120 140 160 180 200
Number of Links
RD
T&E
FY08
$M
Visual Analysis of the Data
Presented at the 2009 ISPA/SCEA Joint Annual Conference and Training Workshop - www.iceaaonline.com

Slide 1942nd Annual DoDCAS, February 2009 Slide 19
Equivalent Nodes (Ne) Analysiswhere$& b
eaNERDT =
c
t
t
t
t
rsrse
NLavg
NL
hNgNdNN⎟⎟⎟⎟
⎠
⎞
⎜⎜⎜⎜
⎝
⎛
⎟⎠⎞⎜
⎝⎛
++= )( /
Capture complexity associated with the types of Nodes.
Capture the connectivity complexity associated with the system.
The equation parameters a, b, d, g, h, and c are estimated using MS Excel Solver and residual-minimization techniques.The equation parameters a, b, d, g, h, and c are estimated
using MS Excel Solver and residual-minimization techniques.
CER Structure
Development
Presented at the 2009 ISPA/SCEA Joint Annual Conference and Training Workshop - www.iceaaonline.com

RDT&E $ versus Equivalent Nodes
Slide 2042nd Annual DoDCAS, February 2009
By accounting for both Nodes and Links in one equation, we improved our predictive capability over that obtained when considering Nodes and Links in isolation.
Now, our two equations are
and
These two equations have explicit sensitivity to connectivity complexity and to interdependence.
( )
221
t
t
rsrse 021N
LN290N50NN1
.
/ .)..(
⎟⎟⎟
⎠
⎞
⎜⎜⎜
⎝
⎛
++=
( ) 381eN720M08FYERDT2 ..$& =
RDT&E $M versus Equivalent Nodes
R2 = 0.9952
$0
$5,000
$10,000
$15,000
$20,000
$25,000
0 20 40 60 80 100 120 140 160Number of Equivalent Nodes
RD
T&E
FY08
$M
.
CER Analysis / Results
Presented at the 2009 ISPA/SCEA Joint Annual Conference and Training Workshop - www.iceaaonline.com
One Last Thought on Lt / Nt
Slide 2142nd Annual DoDCAS, February 2009
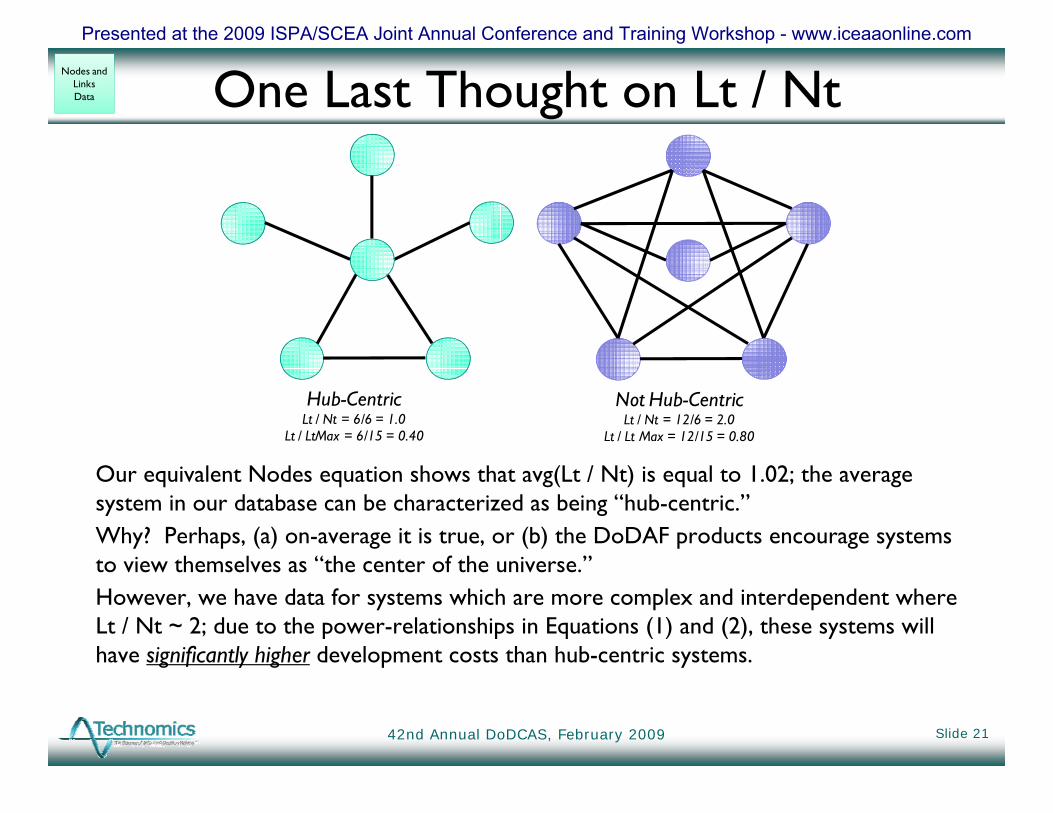
Our equivalent Nodes equation shows that avg(Lt / Nt) is equal to 1.02; the average system in our database can be characterized as being “hub-centric.”Why? Perhaps, (a) on-average it is true, or (b) the DoDAF products encourage systems to view themselves as “the center of the universe.”However, we have data for systems which are more complex and interdependent where Lt / Nt ~ 2; due to the power-relationships in Equations (1) and (2), these systems will have significantly higher development costs than hub-centric systems.
Nodes and LinksData
Hub-CentricLt / Nt = 6/6 = 1.0
Lt / LtMax = 6/15 = 0.40
Not Hub-CentricLt / Nt = 12/6 = 2.0
Lt / Lt Max = 12/15 = 0.80
Presented at the 2009 ISPA/SCEA Joint Annual Conference and Training Workshop - www.iceaaonline.com

Slide 2242nd Annual DoDCAS, February 2009 Slide 22
Conclusions1. Documents normally produced during the DoD acquisition process,
such as ISPs, CDDs, CPDs, provide incredibly useful information.
2. DoDAF products can be a data engine for applied-cost research.
3. Based on our analysis, Equations (1) and (2) can estimate RDT&E $ with explicit sensitivity to interdependence requirements.
4. Equations (1) and (2) can also be used for marginal RDT&E $ estimates: a) adding new Nodes and Links to an existing system, or
b) combining two or more existing systems.
5. Future research will attempt to include additional parameters and address identified issues like a) other Node and Link characteristics,
b) sensitivity to Legacy versus New Nodes and Links, and/or to Internal (to the Program) versus External Nodes and Links,
c) RDT&E $ growth from MS B to MS C, and
d) programmatic effects.
Presented at the 2009 ISPA/SCEA Joint Annual Conference and Training Workshop - www.iceaaonline.com

Slide 2342nd Annual DoDCAS, February 2009
Presented at the 2009 ISPA/SCEA Joint Annual Conference and Training Workshop - www.iceaaonline.com

Slide 2442nd Annual DoDCAS, February 2009
Definitions, 1 of 2Node: An element of architecture that produces, consumes, or processes data. We use Systems Nodes, i.e., nodes with
the identification and allocation of resources (e.g., platforms, units, facilities, and locations) required to implement specific roles and missions. We determine the number unique nodes in a system and group them into three categories, those that receive information, those that send information, and those that send and receive information. (DoD Architecture Framework Version 1.5 Volume I: Definitions and Guidelines, 23 April 2007.)
Link: A representation of the physical realization of connectivity between Systems Nodes. We determine the number unique links in a system and group them into two categories, those that have a uni-directional information flow and those that have a bi-directional information flow. (DoD Architecture Framework Version 1.5 Volume I: Definitions and Guidelines, 23 April 2007.)
“Integration Density,” Lt/LtMax = the actual number of unique Links versus the maximum possible number of unique Links. We use this as a metric for the degree of integration, i.e., sharing of information, within a system relative to the maximum possible amount.
Integration: 1) The act of putting together, as the final End Item, the various Components of a system. 2) The gathering and joining together of all of the technical and functional activities and Interfaces required to link and operate the many facets of a complex weapon system. (http://www.sceaonline.net/)
We think of integration as a set of activities that are performed to achieve interoperability between and among systems. Estimates can be made of the cost associated with integration activities.
Interdependence: The output of one organization becomes one of the input for others and vice versa; organizational boundaries become less distinguishable, and the combined performance of the organizations requires complex forms of coordination. (Credit to Commentary, “Fostering Joint Logistics Interdependence,” by Colonel Christopher R. Paparone, Army Logistician, Professional Bulletin of United States Army Logistics, PB 700-05-1 Volume 37, January-February 2005)
We think of interdependence as a condition in which systems are mutually reliant.
Interoperability: The ability of systems, units or forces to provide data, information, materiel and services to and accept the same from other systems, units or forces and to use the data, information, materiel and services so exchanged to enable them to operate effectively together. IT and NSS interoperability includes both the technical exchange of information and the operational effectiveness of that exchanged information as required for mission accomplishment. Interoperability is more than just information exchange. It includes systems, processes, procedures, organizations, and missions over the lifecycle and must be balanced with IA. (CJCSI 6212.01E, 15 December 2008)
We think of interoperability as a desired capability for a group of systems achieved via a set of Integration activities.
Presented at the 2009 ISPA/SCEA Joint Annual Conference and Training Workshop - www.iceaaonline.com
Definitions, 2 of 2
Slide 2542nd Annual DoDCAS, February 2009
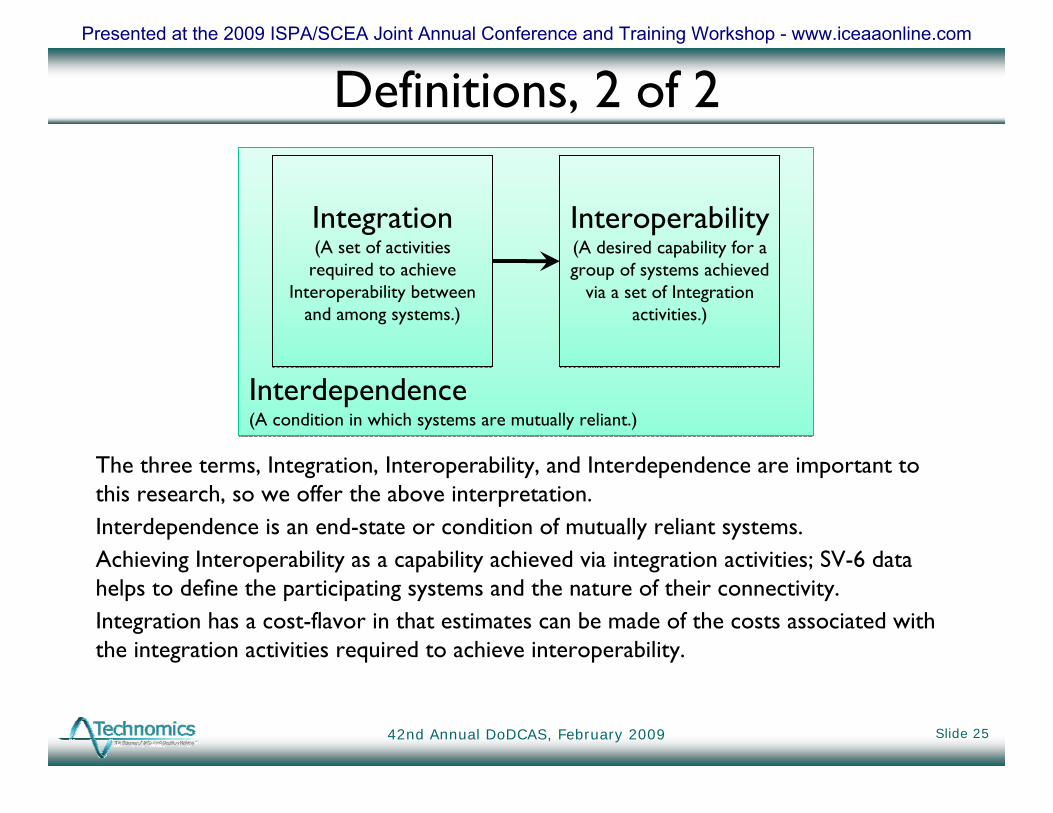
The three terms, Integration, Interoperability, and Interdependence are important to this research, so we offer the above interpretation.Interdependence is an end-state or condition of mutually reliant systems. Achieving Interoperability as a capability achieved via integration activities; SV-6 data helps to define the participating systems and the nature of their connectivity.Integration has a cost-flavor in that estimates can be made of the costs associated with the integration activities required to achieve interoperability.
Interdependence(A condition in which systems are mutually reliant.)Interdependence(A condition in which systems are mutually reliant.)
Integration(A set of activities
required to achieve Interoperability between
and among systems.)
Integration(A set of activities
required to achieve Interoperability between
and among systems.)
Interoperability(A desired capability for a group of systems achieved
via a set of Integration activities.)
Interoperability(A desired capability for a group of systems achieved
via a set of Integration activities.)
Presented at the 2009 ISPA/SCEA Joint Annual Conference and Training Workshop - www.iceaaonline.com

Linkages Among DoDAF Views
Slide 2642nd Annual DoDCAS, February 2009
Prescribes Standards and Conventions
Standards Rules
Conventions
Prescribes Standards and Conventions
Standards Rules
Conventions
TechnicalStandards View
Information Flow
OperationalElements
Activities/Tasks
Identifies What Needs ToBe Done And Who Does It
Operational View
Systems Data Flow
Communications
X YXZ
XY
Y
X YXZ
XY
YRelates Systems and
Characteristics toOperational Needs
SystemsView
DoD Architecture Framework Version 1.5 Volume I: Definitions and Guidelines, 23 April 2007.
Nodes and LinksData
Presented at the 2009 ISPA/SCEA Joint Annual Conference and Training Workshop - www.iceaaonline.com
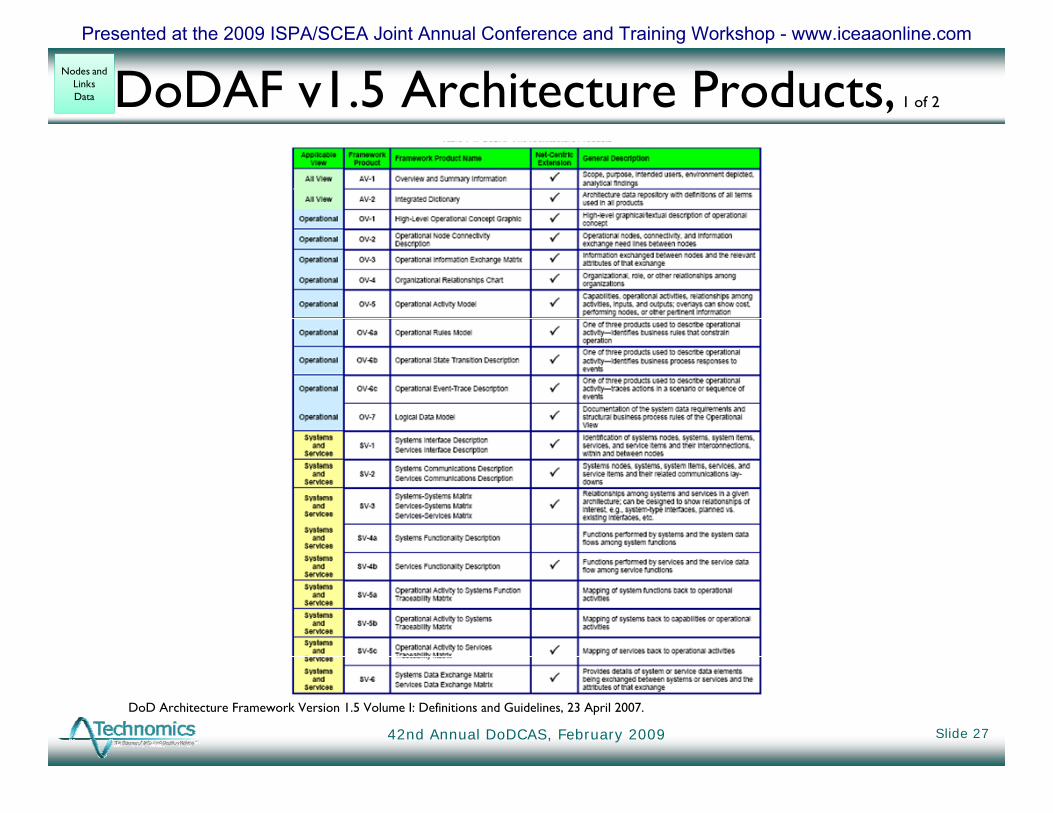
DoDAF v1.5 Architecture Products, 1 of 2
Slide 2742nd Annual DoDCAS, February 2009
Nodes and LinksData
DoD Architecture Framework Version 1.5 Volume I: Definitions and Guidelines, 23 April 2007.
Presented at the 2009 ISPA/SCEA Joint Annual Conference and Training Workshop - www.iceaaonline.com

DoDAF v1.5 Architecture Products, 2 of 2
Slide 2842nd Annual DoDCAS, February 2009
Nodes and LinksData
DoD Architecture Framework Version 1.5 Volume I: Definitions and Guidelines, 23 April 2007.
Presented at the 2009 ISPA/SCEA Joint Annual Conference and Training Workshop - www.iceaaonline.com