simple meteor scatter out-5tation antennas
TRANSCRIPT
SIMPLE METEOR SCATTER OUT-5TATION ANTENNAS
Ofer Givati
A dissertation submitted to the Faculty o f Engineering, University o f the Witwatersrand,
Johannesburg, in fu lfilm ent o f the requirements for the degree o f Master o f Science in Engineering
Johannesburg, 1989

DECLARAT'vN
I declare that this dissertation is m y own, unaided work. I t is being submitted fo r the Degree o f
Master o f Science in Engineering in the University o f the Witwatersrand, Johannesburg. I t has not
been submitted before fo r any degree or examination in any other University.
__________3̂0/(Signature o f candidate)
) S ^ day o f 1989

ABSTRACT
This dissert, ̂ on examines simple Meteor Burst Communication (MBC) out-starioL * i-^nas. The
eSect o f illumination gain, beam width and orientation was studied using computer ^vr.t-iation.
Sim ilarly, the performance o f M BC links using a half-wave dipole, a quarter-wave rnonopole, a
square loop, a long wue and a 5-elements Yagi-Uda antennas was determined. The performance
o f these links are related to the antennas’ sky i l lumination. This investigation provides designers
some bench-mark results which indicate the role played by the antennas ’ radiation patterns in M B C.
A value system was formulated to provide practical and electrical trade-offs fo r mobile andmanpack
antennas in the meteor scatter environment. Simulated results indicate that simple antennas cause
degraded communications due to their reduced size and complexity. The conclusion is that the
directional master station should provide adequate sky illumination. I t is recommended that the
results obtained be validated by measurements and further work concentrate on master station
antennas.

ACKNOWLEDGMENTS
I w ish to acknowledge gratefully the following:
M y w ife Shelley and m y sons Yaron and Yo’ av fo r their support, love, consideration and
encouragement a t a ll times.
APC Fourie w ho always found the time to listen, support, guide and encourage when needed.
A R Clark fo r his helpful proof-reading.
Prof. HE Hanrahan fo r his k ind guidance.
SALBU (PTY)Ltd. fo r their sponsorship.

CONTENTS
DECLARATION ...!..............................................................................................................
A B S TR A C T ...........................................................................................................................
ACKNOW LEDGM ENTS.....................................................................................................
CONTENTS ...........................................................................................................................
TAB LE OF FIGURES ..........................................................................................................
L IS T OF SYMBOLS ........................ - .................................................................................
1 IN TR O D UC TIO N.............................................................................................................1.1 Statement O f The Problem .....................................................................................1.2 In troductkm ToM etsorBa istC onm uaicam n ......................................................1.3 W hy Simple Antennas?...........................................................................................1.4 The Investigation O f Simple Antennas For M B C .................................................1.5 Dissertation L a y o u t.................................................................................................
2 BACKGROUND TO METEOR BURST COMMUNICATION AN D THE ROLE FLAYED B Y THE ANTEN N A ......................................................................................
2.1 The Nature O f Meteors And M B C ..........................................................................2.2 The Geometry O f M BC L in k ..................................................................................2.3 Reflection From Underdense Meteor T ra ils ...........................................................2.4 The Dependence O f Trails Detection On Sky Regions.......................'..................2.5 The Merits O f D ifferent Type O f Antennas In The Meteor Scatter
Environm ent..................................................................................... .......................2.5.1 Antenna radiation pa tte rn...............................................................................2.5.2 Electrical problems due to size lim ita tion .....................................................2.5.3 The effect o f noise in relation to the antennas...................... ........................
3 DESIGN OF SIMPLE ANTENNAS FOR M B C ............................................................3.1 A Value System For The Remote MBC Antenna System ....................................3.2 Computer Aided Analysis O f Antenna Performance And M BC L ink
Performance.............................................................................................................3.2.1 Numerical Electromagnetic Code version 2, N E C 2 .....................................3.2.2 Prediction software fo r M BC system performance......................................
3.3 The Effect O f Antenna Beamwidth/Directivity And Orientation OnMeteor Burst Communication................................................................................
3.3.1 Description O f The Experiment And Evaluation M ethod...........................3.3.2 Test L in k Description.....................................................................................3.3.3 Results .............................................................................................................
4 PREDICTION OF M BC LIN K PERFORMANCE USING SIMPLE ANTENNAS ...4.1 Description O f Evaluation M e th o d .........................................................................4.2 Evaluation O f Traditional Simple Antennas ..........................................................
4.2.1 Radiation patterns o f the traditional simple antennas...................................
235
7
262729
3333
363738
3940

4.2.2 Results predicted by METEOR fo r die traditional simple antennas 52 -4.3 Evaluation O f A M obile Square Loop Antenna ....... 55
4.3.1 Radiation patterns o f the square loop antenna 55 a4.3.2 Results predicted by M ETEOR fo r the square I t l ip antenna ...... 57
4.4 Evaluation O f A Manpack Long Linear Terminated W ire Antenna.................... 614.4.1 Radiation pattern o f the long linear terminated w irl; antenna..................... 62 .4.4.2 Results predicted by METEOR fo r the long terminated w ire antenna 64 I
4.5 Summary O f Results ................................................................................................ 66
5 CONCLUSIONS 68 "5.1 Summary O f Findings And Conclusions................................................................ 63
5.1.1 Antennas fo r M BC ......................................................................................... 68 /5.1.2 Antenna design considerations 68 y /5.1.3 Simple antennas in the meteor scatter environment..................................... 70
53. Proposal For Further Investigation.......................................................................... 71 ?
APPENDIX A - THE PROCEDURE OF V A LU E A N A L Y S IS ..................................... 72 . .
APPENDIX B - THEORY AND IMPLEMENTATIONS OF THE M ETHOD OFM O M E N TS ............................................................................................. 75
APPENDIX C • NUMERICAL M ODELLING CONSTRAINTS A N DL IM IT A T IO N S ...................................................................................... 81 ' -
APPENDIX D - PREDICTION M OD EL SETTINGS FOR M BC L IN K & :S IM U LA T IO N ....................................................................................... 85
APPENDIX E - TABULATED R ESU LTS................................... 89 , ,
RFERENCES ................................................................................................... :..................... 155

TABLE OF FIGURES
Figure l:T h e geometry o f M BC transmission pa th ....................Figure 2: The earth orb it in the ecliptic p la ne .............................figu re 3: Plan view o f the "hot spots" areas......................... —Figure 4: A typical configuration o f a remote s ta tion.................Figure 5: Scattering geometry ................................... .................Figure 6: Time variation o f the received po w er..........................Figure 7: The transmitter electric vector at the meteor t ra i........Figure 8: The chu-hamngton lim its .............................................figu re 9: Consequences o f the dtu-hanington lim its .................Figure 10: Q Vs D ire c tiv ity ..........................................................Figure 11: Average median day time values o f ro is e .................fig u re 12: The value system fo r mobile out-station antenna.....Figure 13: The value system for manpack out-station antenna...Figure 14: Contour chart o f meteor distribution ...................... .Figure 15: Graphs o f Channel Duration Vs. D ire c tiv ity ............Figure 16: Graphs o f Meteor count Vs. D irectivity ....................Figure 17: Graphs o f Channel Duration Vs. Meteor count........figu re 18: Azimuth-plane radiation pattern o f T x antenna........Figure 19: Elevation-plane radiation pattern o f Tx anrenna.....Figure 20: Radiation pattern o f half-wave dipole antenna........Figure 22: Radiation pattern o f quaner-wave roonopole---------Figure 22: The orientation o f the skew quarter-wave monopole Figure 23:Radiation partem o f skew quarter-wave monopole .... Figure 24:Radiation pattern o f skew quarter-wave monopole ....Figure 25: Graph o f Channel Duration Vs. D istance.................Figure 26: Graph o f meteors count Vs. D istance.......................Figure 27: A mobile square loop antenna................................ .Figure 28: Azimuth-plane radiation pattern o f square lo o p .Figure 29: Elevation-plane radiation pattern o f square lo o p .Figure 30: Graph o f Channel Duration Vs. D istance..................Figure 31: Graph o f meteors count Vs. D istance....................... .Figure 32: Graph o f Channel Duration Vs. D istance.................figu re 33: Graph o f meteors count Vs. D istance--------------------Figure 34: A long linear terminated wire antenna......................Figure 35: Azimuth-plane radiation pattern o f a long w ire .Figure 36: Elevation-plane radiation pattern o f a long wire ..... .figu re 37: Graph o f Channel Duration Vs. D istance.................Figure 38: Graph o f meteors count Vs. Distance.......................Figure A - l : Relative importance decision making table............Figure A-2: Relative importance for mobil out-station...............Figure A-3: A rating system fo r any specific design ............ ......Figure B - l: General radiating body ............................................Figure B-2: A th in cylindrical w ire .............................................Figure C -l: Resonant wavelength Vs. angle between sections.. figu re C-2: Two w ire jun c tion ........................................... .........
S11
28293235364243
47484950
5455565658596061626363
737575
LIST OF SYMBOLS
Symbols
X
RjaadRz
Is the wave length in meters.
Is the transition wave-length defining the shortest wave-length fo r which
equation (3) is applicable.
Are respectively the points from transmitter and receiver to the point on
the trail at which the reflection requirement is satisfied.
Is ha lf the angle between R, and R2.
Is the angle bctw. .>n the tra il axis and the plane containing the transmitter
receiver and meteor trail at the centre o f the principal Fresnel zone.
H a lf the length o f the tra il in the principal Fresnel zone.
Defines a narrow band on the celestial sphere where meteor trails must
lie in order to b r properly oriented to produce a reflection between two
stations.
Is the length o f the meteor tr-ul.
Is the transmitted power in Watts.
A re respectively, the transmitter and receiver antenna gain relative to an
isotropic radiator immersed in free space.
Is the radius o f the electron in :
Is the electron line density o f the trail in electrons per metre.
Is the maximum electron line density in electrons per metre.
Is the dot product o f a un it incident electric vector and a un it vector o f the
reflected wave in the direction o f the polarization o f thereceiving antenna.

D Is the ambipolar diffusion coefficient in m2/sec.
r0 Is the in itia l radius o f the trail in meters.
andV Are signal time constants,
t Is the rime measured from the formation o f the tra il in seconds.
Po Is the permeability o f free space.
e Is the charge o f an electron
m. Is the mass o f an election,
m Is the in itia l mass o f the meteor,
v Is the meteor geocentric velocity.
vH Is the velocity o f the meteor in its orb it around the sun.
vE Is the velocity o f the earth ia its orb it around the sun.
ve Is the geocentric velocity o f meteors taking the earth’s gravity into
account
5 Is the angle o f the meteor radiant from the t - ca
y Is the apparent angle o f meteor radiant from tn,. s apex,
h Is the meteor height in km.
ha. Is the height o f maximum ionization.
H Is the atmospheric scale height This parameter depends on the
temperature and degree o f dissociation o f the gas molecules at any given
p Is the angle between the incident electric vector on the tra il and the electric
vector at the receiving antenna.
Page -v iii-

a is the angle between the transmitter electric vector at the meteor trail and
V£ Is the zenith angle o f meteor path axis.
B1 Is the probability that a single atom w ill produce a free electron.
D, Is the antenna’s directivity.
7'(Q&}au Is the antenna’s maximum radiation intensity.
U * , Is the antenna’s radiation intensity averaged over all directions.
t\ Is die radiation efficiency o f the antenna.
T Is the temperature in TC
B Is the bandwidth in Hz.
V Is the nns value o f noise voltage.
R Is resistance in Ohms.
We Is the noise power in Watts.
1 INTRODUCTION
1.1 Statement Of The Problem
Simple meteor scatter out-stadoa antennas is the topic o f this dissertation. The main thrust o f
this work is, therefore, two fold :
• To examine the effect o f different illumination schemes o f useful sky regions on
MeteOT Burst Communication (MBC) link performance.
• T o evaluate the relative performance o f M BC links using various standard simple
out-station amcnnas. The performance o f these are then related to the sky illumination
they produce.
1.2 Introduction To Meteor Burst Communication
A meteor particle is a solid body that ordinarily revolves about the sun as part o f our solar
system. Each day billions o f these meteors intersect theearth’ sorbitand penetrate its atmosphere.
As the meteor enters the earth’s atmosphere an iunited trail is formed which undergoes a rapid
diffusion process and the density o f the ionized particles in its tra il permits the scattering o f
radio waves. Data transfer o f an intermittent nature can thus be accomplished via these short
lived trails provided their orientation obey some geometrical requirements. Hence the name:
Meteor Burst Communication (MBC).
Commonly used methods fo r long range data telecommunications are telephone lines, radio
repeaters stations,-satellites and High Frequency (HF) communications using reflection from
the ionosphere.
Telephone lines require a continuous interconnection between the nodes o f a system. Radio
repeaters stations require towers at line-of-sight distances between repeater sites, as w ell as
power supplies. This presents an installation, maintenance and versatility problem. In recent
years, satellites were thought to provide adequate coverage fo r long range communications.
However, to tal dependency on satellites, due to their vulnerability to jamming and destruction,
in addition to enormous capital outlay, has recently sparked the need to develop an alternative
means o f communication. Long range HF communications require large antennas and complex
frequency management techniques due to changing ionospheric conditions [1,2,3],

M BC is a reliable alternative to these methods o f long distance data communications fo r low
volume applications. I t offers a secure method fo r communications due to its jamming and
intercept resistance characteristics. For any particular meteor tra il there is a relatively small
terrestrial "footprint'' where the reflected signal is present, providing low probability o f intercep;
(LPI) and jamming. This also ensures that a single frequency can be time-shared among many
stations w ith in a network, eliminating the need fo r multiple frequencies. In addition, M BC may
also prove useful in maintaining post nuclear attack communications. Ionospheric disturbances
associated w ith post nuclear attack conditions are expected to greatly increase D-layer
absorption, which w ill in turn reduce the availability o f HF communications [4,5,6].
The major drawback o f M BC is due to the fact that only intermittent communication can be
supported and hence voice communication, although possible, is s till very limited [7]. However,
latter-day computing power allows the use o f short duration data communications signals. Such
techniques have made M BC attractive fo r applications where intermittent communication can
be tolerated. Undoubtedly, M BC systems present a scope fo r applications such as monitoring
waterZe velsinremotedams; safeJoQgdistancecmamanicatioa fo r troops with their base station;
the control o f a fleet o f trucks scattered over large distances as w ell as backing up existing
communication methods.
1.3 Why Simple Antennas?
There exists a demand fo r meteor scatter communications in mobile, manpack and other
situations where large and complex antennas are undesirable. This dissertation, therefore,
examines aspects o f simple out-station antennas for such applications. In this context, simple
antennas are those complying w ith severe size and complexity constraints. Reducing the size
and complexity o f the antenna system inevitably results in communication systems o f degraded
connectivity and hence throughput Connectivity, the fractional duration fo r which a channel
exists, is a major aspect determining the quality o f the link , while throughput is the amount o f
data transmitted per unit time. In the remote out-station M BC systems o f interest, these aspects
are traded o f f fo r simplicity.
1.4 The Investigation Of Simple Antennas For MBC
Before one can proceed to design simple antennas fo r M BC out-stations, i t is imperative to
understand the trade-offs involved w ith different sky illumination schemes. This outlines the
importance o f the role played by the antenna's radiation pattern, which may be synthesized to
achieve optimumperformance. Having established these, one can study the relative performance
o f M BC links uring traditional simple antennas. This provides important guide-lines fo r the
amp.nna designer in terms o f relative performance o f various type o f antennas in the meteor
scatter environment This work, therefore, is not intended to provide novel antenna designs but
rather to evaluate traditional simple antennas and relate their performance to sky illumination.
This w ill give designers some bench-mark results as well as an indication o f the role played by
the different illumination schemes.
Earlier research in this fie ld was performed during the 1950’s [8,9]. These studies illustrated
the importantroleplayed by the antenna's radiation pattern in the medium o f M BC. O f particular
interest is the Hines et aL study o f 1935 [8) examining the effect of:
(1) broadening the antenna beam centred on the transmitter receiver axis,
(2) swinging a narrow beam o f f to the side o f the transmitter receiver axis, and
(3) swingingwhilebroadeningthebeam, always maintaining its edge along the transmitter
receiver axis.
However, even though Hines’s study [8] may be c.' value in the design o f antennas fo r M BC
links i t does not comprehensively outlines the effect o f different illumination schemes o f useful
sky regions on M BC link performance. Nevertheless, i t emphasised the need fo r a methodical
and comprehensive. westigation o f this nature.
A prerequisite fo r a meaningful investigation o f antennas is an understanding o f the role o f the
antenna system played in M B C Equally important are the mechanisms governing the behaviour
o f antennas. A review o f this nature delineates the fundamental trade-offs concerned with
physical constraints Imposed by the remote antennas o f interest, as w ell as these which are
imposed by the medium. Once these trade-offs areestablished one mayproceed to design suitable
antennas.
The technique o f value engineering hopes to quantify the trade-offs during design. The design
phase o f a product is a process whereby all the facts are organized to support a design concept
which is later developed into a product. This process requires an organized synthesis o f known

factors and usually some creative th inking. There is often a single fundamental reason why new
design is required. The technique o f value engineering, resulting in a value system, is in essence
an organized procedure fo r eliminating from a design all that is unnecessary. I t ensures that the
procedure has the opportunity o f offering best overall value to the end user. Knowing what is
required by the end user provides the guide-lines for the design. However, engineering design tools are also required to investigate different approaches fo r the development o f the end product
Powerful engineering tools were developed as a result o f the availability o f computing power.
The availability o f computing power which were not within reach until recent years led to the
development o f methods which allows rigorous simulation o f antenna geometries and prompt
the engineer towards solutions o f such problems. O f particular use fo r the analysis o f the
electromagnetic response o f antennas is the Method o f Moments technique, which solves
Maxwell’s equations numerically fo r w ire structures [10,11]. The problem o f course in using
this technique manifests itself in the loss o f insight into the mechanisms o f operation o f the
antennas and hence i t should not be b lindly used as a design tool but rather as the means to
evaluate an antenna’ s performance.
A Method o f Moment based software package is the NEC2 code [12]. Features include the
facility to model wires and solid surfaces, the option o f specifying many loads and sources,
computation o f radiation patterns and antenna interaction calculations. Another useful feature
o f the NEC2 code is that i t allows modelling o f imperfect earths and hence its effect on antenna
performance can be investigated. The mathematical and numerical modelling o f the antenna
and its environment is the most important aspect o f simulation where accurate results o f
performance are desired. Numerical limitations may be inherent either in the mathematical
model used to approximate a physical system, the actual physical complexity o f the system, or
in the numerical techniques used fo r computation. TheNEC2 code thus provide with the means
to evaluate antennas.
The performance o f an antenna, which is an integral part o f an M BC link , cannot be viewed in
isolation. The antenna’s ultimate worth can only be established subject to its performance in
the medium o f MBC. A computer based predictive model which is designed to simulate a
point-to-point M BC links is the METEOR code [13]. This engineering tool permits the setting
up o f an M BC lin k in terms o f distance, time, orientation and antenna configuration, and
computes the link performance in terms o f meteor counts, antenna illumination, trail duration,
noise and data communication.

The work reported in this dissertation uses these computer aided design tools fo r the simulation
o f antennas and M BC link performance. The technique o f value engineering is applied to
establish a value system fo r simple out-station antenna systems o f interest
1.5 Dissertation Layout
To conclude this introductory chapter a short preview o f the remainder o f this dissertation is
outlined to emphasise its organisation.
The second chapter o f this report commences with an overview o f M BC and antenna theorv.
The nature o f meteors and the geometry o f an M BC Hnk is delineated followed by a brief
description o f the mechanisms o f reflection from untierdense meteor trails. Next, a description
o f the computation method used to determine the number o f meteor trails producing reflections
arising from useful sky regions is out-lined to illustrate the importance o f the role played by the
antennas in the meteor scatter environment. Succeeding that, the merits o f different types o f
antennas in the meteor scatter environment with emphasis on the antenna radiation pattern is
presented. Thereafter, electrical problems due to antenna size lim itation are outlined. Thechapter
concludes w ith a review o f the effect o f noise in relation to antennas. This chapter encapsulates
the fundamental principles o f M BC and emphasizes the role played by the antenna system.
The th ird chapter is devoted to design aspects o f antennas fo r M B C I t presents a discussion on
the technique o f value engineering. This technique was used for the synthesis o f a value system
fo r the remote mobile and manpack M BC antenna sy stems. Thereafter the functional description
oftheMethodofMomentbasedcode, the NEC2 software package [12] is outlined w ith reference
to numerical modelling constraints and limitations as imposed by the NEC2 code, deduced by
experience gained in using the code, and structure modelling considerations. This is followed
by, a brief description o f the prediction softwarefor M BC systemperformance, METEOR [13].
Finally, the relationships between antenna beam width/gain and orientation to waiting time
between messages as w ell as channel duration are established. For this investigation, idealized
radiation patterns were synthesized. These ideal patterns were utilized fo r different illumination
schemes in order to establish the trade-offs in the meteor scatter environment.
The fourth chapter presents theoretical M BC link performance using simple antennas. Electrical
performances o f simple antennas were evaluated using the NEC2 [12]. The resulting radiation

patterns were used to predict, w ith the prediction software M ETEOR [13], the effect o f these
simple antennas on M BC lin k throughput fo r stations separation rangingfrom 100km to2000km.
Both optimum antenna orientation as w ell as the worst case were considered.
The final chapter concludes this report w ith a short hindsight overview, critical comments oc
principle issues concerning simple meteor scatter out-station antennas as w ell as suggestions
fo r further work.

2 BACKGROUND TO METEOR BURST COMMUNICATION AND THE ROLE PLAYED BY THE ANTENNA
In this chapter the process o f radio waves scattering via meteor trails is briefly described outlining some important charaf;terisncsofMBCas w e ll asitsapplicMions: and limitations. Particularattention
is paid to the peculiar geometrical requirements imposed by the M BC link, the mechanisms o f
reflection from underdense meteor trails and the variation in contribution o f useful reflection from
different sky regions. Once the importance o f the role played by the antenna system becomes evident,
the merits o f different type o f antennas in the medium o f M BC are discussed. These include the
antennas radiation pattern, electrical problems due to size limitation and the effect o f noise on the
antennas.
2.1 The Nature Of Meteors And MBC
Meteors fo rm part o f our solar system and travel in elliptical mbits w ith heliocentric velocities
which are less than the solar escape velocity. The velocities o f meteors approaching die earth
range from 11.3km/s to 72km/s. The lower l im it is the escape velocity o f a particle leaving the
earth. The upper l im it is the sum o f the escape velocity fo r a particle leaving the solar system
(42knVs) and the earth’ s velocity around the sun (30km/s) [14,15]. Each day billions o f meteors
intercept the earth’ s atmosphere. I t is estimated that o r the average at least 1010 particles of
mass greater than 10"3 grams are swept up by the earth daily [16]. Upon interception, the particle
is heated by collision w ith air molecules, forming an ionized trail. The distribution o f ioidzation
along the tra il is a function o f the meteor mass, velocity, and angle o f incidence [17]. These
rapidly diffusing trails reflect radio signals, typically for hundreds o f milliseconds during their
brief existence, thus providing radio transmission paths over long distances. Typical spatial loss
is in the order o f 90dB in addition to about 8(tiB which is lost on scattering o f f a meteor tra il
Therefore, M BC links are inherently weak signal systems [15,18,19].
Meteor trails occur in aregion lying roughly between 80km and 120km above theearth’ s surface,
called the meteor region, pennittidg M BC over distances up to approximately 2000km The
average length o f a tra il is 15km [17] while the diameter increases with time due to diffusion.
This expansion causes rapidly weakening signal reflection and hence the duration fo r which i t
is useful fo r communication is limited. The reflected wave from a typical meteor tra il illuminates
a small area on the earth called the "footprint". This area o f reception is estimated to be typically

8krn wide by 40km long. The footprint, Vnich is still bang studied, appears to depend on the
orientation, position and direction o f travel o f the meteors in space as w ell as the position o f the
receiver relative to the transmitter and the antenna pattern [2,17,20].
The communication l in k between transmitter and receiver is established only when these are
properly oriented w ith respect to the meteor tra il This occurs when the angles o f incidence and
reflection on the tra il are equal. Hence, the geometrical orientationresults in a useful path when
both the transmitter and receiver are located at the foci o f an ellipsoid and the tra il is tangential
to the ellipsoid as illustrated in figure (1). This fixed-path geometry, coupled w ith the irregular
arrival o f meteors, causes a highly localized footprint MBC, therefore, offers considerable
advantages in terms o f Low Probability o f Intercept and high resistance to jamming [2,21].
F IG U R E 1: The geometry o f the transmission path required fo r M B C
The reflection o f radio waves via meteor trails is a function o f the ionization density distribution
along and across the trail. In discussing the reflection properties i t is customary to classify the
trails either as "underdense" or "overdense". The dividing line, in terms o f the electron density
per metre o f tra il length, is 2x10" electrons per metre which corresponds to the ionization
produced by meteors o f about 10'3 grams. Meteors trails w ith fewer than 2 x I0M electrons per
metre are referred to as underdense. Those with electron densities higher than this lim it are
termed overdense. Usable meteors fo r communication purposes typically have masses larger
than iO"5 grams [15], Smaller meteors w ill not produce sufficiently high electron density to
reflect signals. The mass distribution o f meteors is such that the total number o f meteors greater
than a certain mass is inversely proportional to that mass. The constant o f proportionality is thus
a measure o f the influx rate and is dependent on time o f day, year and the zenith angle with
which meteors approach the upper atmosphere [18].
Trail A x is

The low electron density o f underdense trails allow the signal to penetrate through the ionized
column, causing the signal to be scattered by the individual electrons. These electrons, which
are excited by the radio wave, act as small dipole antennas andre-radiate the signal. The received signal energy is thus the vector sum o f all discrete reflections. Since the diffusion o f the tra il is
rapid, the phase difference increases and the amount o f received energy reduces rapidly [2,15}.
In overdense trails the electron density is sufficiently high to prevent complete penetration o f
the radio wave into the ionized column and therefore signals w ill be mostly reflected from the
surface o f the trails [15],
Due to the mass distribution o f meteors, underdense trails are much more common than
overdense ones and hence more useful as a medium for MBC. Overdense trails on the other
hand produce high signal strength and longer usable duration fo r communication. From this it
is clear that the M BC system design is based on the use o f underdense trails w hile overdense
trails enhance the lin k performances [6].
A t certain times o f the year meteor showers occur. These meteor showers are caused by a large
number o f particles moving w ith a common velocity about the sun and their orb it intersect the
orb it o f the earth at a specific times each year. They usually last fo r several hours only. Ttiis
phenomenon only accounts fo r a small fraction o f all meteors and is therefore o f little use for
reliable communications. Sporadic meteors which mostly fo llow random orbits about the sun
andare incident upon the earth from all directions, play the most important role in M BC [14,15}.
As pointed out before, the incident flux o f sporadic meteors is a function o f time o f day, the
season and the geographical location at the point o f observation. The motion o f the earth around
the sun produces a diurnal variation in die rate o f arrival o f meteors, since the portion o f the
earth experiencing dawn (the apex in figure 2) w ill have the maximum surface area in the
direction o f the earth’ s movement Thus, the apex w ill intercept many more meteors than the
opposite side o f the earth (the antiapex in figure 2) since only meteors o f high velocity w ill
overtake and intercept the earth [15,16]. Furthermore, the earth encounters a higher meteor density during the second half o f the year, the period when i t is closest to the sun. Some authors
[6,21,22,23] believe that seasonal variations are due to the seasonal t i l t o f the northern
hemisphere away from the earth’s direction o f travel. Fortius reasoning to holdtrue, the seasonal
variations in the southern hemisphere would be tire opposite o f those experienced in the northern
hemisphere. However, measurements taken in Adelaide [24], Australia, indicare similar annual
trends to those in the northern hemisphere and the reason fo r this trend is therefore not clear.
H ie extent o f diumal variations in meteoric rate varies with latitude. A n observer at the equator
would encounter the greatest meteoric rate in the early morning hours since at that time the
trajectory described by the earth about the sun is directly overhead. During the evening hours,
only those meteors moving w ith velocities greater than that o f the earth w ill be detected. An
observer at the poles on the other hand would not observe any diumal change in meteoric rare.
To summarise: A t moderate latitudes in either hemisphere the largest number o f meteors w ill
be enrering the atmosphere at about 0600 local time and during the later ha lf o f the year. The
smallest number w ill enter at about 1800 local time and in the firs t ha lf o f the year. The ratio
o f maximum to minimum depends on the latitude o f the point o f observation [16,24].
The diumal and seasonal characteristics described above only considered the total meteor in flux
rate. The number o f meteors available fo r useful communications depends not only on their
influx rate, but also upon their radiants. The "radiant" is that point on the celestial sphere from
which meteors appear to emanate. The radiant points are not uniformly distributed in the sky.
They are, however, predominantly concentrated toward the ecliptic plane (the plane o f the earth’ s
orbit) and move in the same direction around the sun as the earth. The concentration o f meteor
radiants towards the apex o f the earth’ s path, shown in figure (2), is the cardinal factor affecting
thedirectional characteristicsofaMBClink. This non-uniform distributionof meteors determine
the relative importance o f sky regions and hence the desired illumination pattern o f an antenna
fo r a particular link [25].
Noteven all meteorsinterceptingibeearth'satmo^bereandwhjch comply w ith thegeometrical
requirements o f the M BC link are useful fo r communication. The usefulness o f meteor echoes
fo r communication depend upon their number as w ell as their individual duration. The duration
that the signal remains above some predefined value, usually determined by the noise level, is
called the duty cycle. The areas that contribute most to the duty cycle o f an M B C lin k are those
where the product o f number and duration o f meteors is a maximum and is most favourable for
meteor propagation. These areas, as f irs t shown by Eshleman and Manning [26], are located at
either side o f the midpoint between receiver and transmitter as illustrated in figure (3) and are
referred to as "hotspots" (20,27], However, the ccfitourplorproducedbyEshleman andManning
Page-10-

# *
Equatorial view Polar view
FTOinRF. 2: The earth orb it in the ecliptic plane illustrates the cause o f diurnal
variations o f meteor rates.
[26] and later supported by Hines and Pugh [28] assumed uniform radiant distribution in
calculating their results. Subsequent w ork illustrate [25], as stated before, non-isotropic meteor
radiant distribution.
Clearly, the diurnal and seasonal variations in tleradiant distribution on the celestial hemisphere
above a particular meteor l in k control the relative magnitude and position o f the two hot spots
areas o f meteor activity. Thus, as suggested by figure (3), the importance o f one hot spot relative
to the other may not be equaL Their shape and location varies diumally, seasonally, w ith latitude
and w ith path length as w ell as direction o f communication path due to the non-unifarm meteor
radiant distribution [20,25]. Thus, these constantly changing hot spots characteristic is a
significant factor in the design o f antennas fo r MBC.
m m in# ti i .

FIG U R E 3: Plan view o f the "hot spots" areas fo r M BC lin k over a north-south
path oflOOOkzn between terminals. These contours were computed by thepredictiorii
code METEOR [13]. Both transmitting and receiving antennas i l luminate the sky
w ith an idealized isotropic radiation pattern.
Another parameter effecting the quality o f an M BC link is its operating frequency. The operating
frequency o f M BC systems may vary from 30MHz to 100MHz. Below 30MHz, the E-layer o f
the ionosphere may reflect the signal independently o f the meteor tra il as in normal High
Frequency (HE) communication, giving rise to interference. On the other hat d, power reflected
from the meteor trails decreases w ith increasing frequency as w ill be shown in section 2.3. Above 50MHz the reflected power decreases rapidly w ith frequency and therefore a longer
message waiting time as well as lower received signal strength w ill result Hence, higher
transmitter power would be required to achieve the same received signal strength. In general,
frequencies ranging from 40MHz to 50MHz are preferred to minimize antenna size and allow
practical levels o f RF power [3).
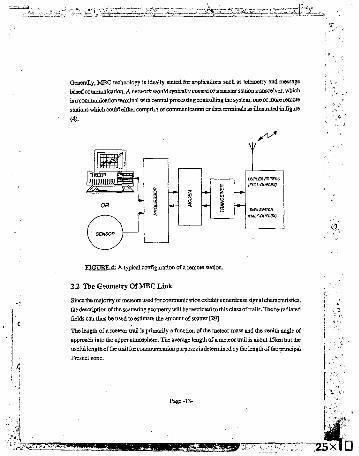
Generally, M BC technology is ideally suited fo r applications such as telemetry and message
based communicatioa. A network would typically consist o f axoaster station transceiver, which
is a communication terminal w ith central processing controlling the system, one orm ore remote
stations which could either compru- o f communication or data terminals as illustrated in figure
(4).
FIG U R E 4: A typical configuration o f a remote station.
2.2 The Geometry Of MBC Link
Since the majority o f meteors used fo r communication exhibit underdense signal characteristics,
the description o f the scattering geometry w ill be restricted to this class o f trails. There-radiated
fields can thus be used to estimate the amount o f scatter [29].
The length o f a meteor trail is prim arily a function o f the meteor mass and the zenith angle of
approach into the upper atmosphere. The average length o f a meteor tra il is about 15km but the
useful length o f the tra il fo r communication purposes is determined by the length o f the principal
Fresnel zone.

For a sufficient amount o f energy to be reflected by the ionized trail, both the transmitter and
receiver w i ll be located at the foci o f an ellipsoid to which the meteor trail is tangential as shown
in figures (1) and (5). The total transmission path length between the terminals is a minimum
fo r reflections from these tangent points, marking the centre o f the principal Fresnel zone (point
M in figure 5). The principal Fiesnel zone is that region surrounding the tangent point where
reflections between transmitter and receiver fo llow a path length o f no more than a quarter wave
length longer than the minimum path length. A t the boundaries o f this principal Fresnel zone,
subsequent Fresnel zones are formed. Reflections from these further Fresnel zones w ill be in
anti-phase to those from the previous Fresnel zones. Hence, the received signal energy may be
thought o f as coming from the principal Fresnel zone only, since more remote Fresnel zones,
produce reflected fields which more or less cancel each other out [15,29,30].
Thus, the portion o f the meteor tra il confined to the principal Fresnel zone is, hence, only a
small fraction o f the trail length and need not be the region o f the tra il where the maximum
ionization occurs. This geometry fo r a meteor burst propagation path is illustrated in figure (5).
F IG U R E 5: Scattering geometry.

In figure (5), P4 is the plane o f p ro r*"ation defined by the transmitter, the scattering point M
and the receiver, g is the ellipse -penned by die intersection o f the ellipsoid, with foci at the
transmitter andrccdver, and the planeP, o f whichP4 is asub-plane. The meteor tra il is tangential
to the ellipse E, and is contained in the tangential plane P2 perpendicular to plane Pv The centre
o f the principal Fresnel zone occurs where a meteor path is exactly tangential to E. The plane
P3 is a vertical plane from the transmitter to the receiver.
The total length o f the trail in die principal Fiesnel zone, 2 L is given by:
X is die wave length in meters.
R, and R% are respectively the points from transmitter and receiver to the point on die trail
a$ which the reflection requirement is satisfied.
4> is ha lf the angle between R , and R2.
J$ is the angle between the tra il axis and the plane containing the transmitter receiver and
meteor tra il at the centre o f die principal Fresnel zone,
provided Rt and R% are much greater than L.
Eshleman and Manning [18] stated that echoes w ill be received from points along a meteor trail
other than those tangent to an ellipsoid defined by the foci at the receiver and transmitter. An
echo w ill result when the angle, between the tangent plane (P2 o f figure 5) and the meteor
path satisfies:
Where Lj- is the length o f the trail, and assuming that L f c R, and R j
Page-15-

2.3 Reflection From Underdense Meteor Trails
The distribution o f energy reflected by a meteor trail is a function o f many variables. A sample
o f these are the ionization density distribution along and across the trail, the signal frequency,
the polarization o f the incident wave relative to the antenna, the gain o f the antennas and die
motion o f the trail w ith respect to the coordinate system.
As a result o f the randomness o f the various-parameters, die probability o f two identical
reflections tends to zero. On the other hand, the complexity o f the various mechanisms involved
as w ell as the degree o f uncertainty introduced leads to a situation where formulation o f the
physical problems are at best only useful approximations. They w ill apply rather w ell to some
o f the trails observed and quite poorly to others.
The derivation o f transmission laws o f reflections from underdense trails [15,31,32], a ir based
on a mathematical model which assumes the tra il to be a right-circular cylinder o f electrons.
The diameter o f these electrons is Eus/b smaller than the signal wave length and their density
w ith in the tra il is low enough fo r the incident wave to penetrate through the ionized column
without major modification. This mathematical model is extended to account fo r the geometrical
requirement that the tra il be tangential to an ellipsoid w ith foc i at the transmitter and receiver.
Hence, the M BC lin k can "see" only a fraction o f all trails incident on the ionosphere w ithin its
range since most do not have the proper orientation (outlined in section 2.2). For simplicity i t
is further assumed that the time taken fo r the meteor to traverse one ha lf o f the principalFresnel
zone is short compared with the duration, t , required fo r the signal amplitude to decay to e"1 (the
reciprocal o f the natural logarithm base) o f its in itia l value. That is, the time o f formation o f the
meteor trail is assumed to be short compared with the total time that radio waves are scattered
by the trail and hence transient effects ate neglected. Thus, accounting fo r the length o f the
principal Fresnel zone, the received signal power scattered from an underdense trail can be
estimated from the expression [15,31.32]:
p ( tx = - - ________16c‘R ,lW R 1« t i a - d « , * c w ‘ P]
PI GI 0,X., q V S i

PT is the transmitted power in Watts.
GTandG t are respectively, the transmitter andrecelver antenna gain Tslat, veto an iso tropic
radiator immersed in free space,
r is the radius o f die electron in meters,
q is the electron line density o f the tra il in electrons per metre.
S is the dot product o f a unit incident electric vector and a unit vector o f the reflected
wave in the direction o f the polarization o f the receiving antenna [32].
D is the aiabipolar diffusion coefficient in m2/sec.
Tq is die in itia l radius o f the trail in meters.T is the duration required fo r the signal amplitude to decay to e"1 o f its in itia l value,
t is the time measured from the formation o f the trail in seconds.
The classical radius o f the electron is given by:
r = ^ ™ = 2.8178 x 10~15 metre
Where Mo is t j permeability o f free space, e is the charge o f the electron and m, is the mass o f
the electron.
The time constant, t , required fo r the signal amplitude to decay to e"1 o f its in itia l value is given
by:
A? sec?* (5)
X~ lAfDIn the derivation o f equation (3) i t was assumed, as pointed out before, that the formation time
ofameteor tra il is short compaie w ith t . However, the increase in the tra il radius due toambipolar
diffusion during its formation can be appreciable. That is the ambipolar diffusion coefficient,
D , may be large. Moreover, as indicated by equation (5), t decreases as the square o f the signal
wave length. Therefore, the above assumption does not hold fo r short wavelengths, and/or large
ambipolar diffusion coefficient.
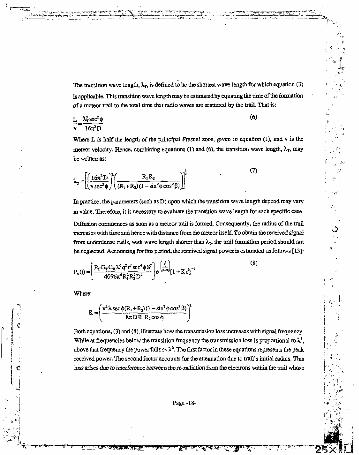
The tncr»ition wave length, Xt, is defined to be the shortest wave length fo r which equation (3)
is applicable. This transition wavelength may be estimated by equating the time o f the formation
o f a meteor tra il to the total time that radio waves are scattered by the trail. That is:
v I f t f D
Where L is ha lf the length o f the principal Fresnel zone, given in equation (IX and v is the
meteor velocity. Hence, combining equations (1) and (6), the transition wave length, Xt, may
be written as:
In practice, the parameters (such as D ) upon which the transition wave length depend may vary
in value. Therefore, i t is necessary to evaluate die transition wave length fo r each specific case.
Diffusion commences as soon as a meteor trail is formed. Consequently, the radius o f the trail
increases w ith time and hence w ith distance from the meteor itself. To obtain tbe received signal
from underdense trails, with wave length shorter than Xj, the tra il formation period should not
be neglected. Accounting fo r this period, the received signal power is estimated as follows [15]:
f vi X sec^(R i+R i)(l - s in ^ c o s ^ Y^ 8%DR,RzCOs4i J
Both equations, (3) and (8), illustrate how the transmission loss increases w ith signal frequency.
While at frequencies below the transition frequency the transmission loss is proportional to X3,
above that frequency the power fa ll; x X6. The first factor in these equations represents the peak
received power. The second factor accounts fo r the attenuation due to trail's in itia l radius. This
loss arises due to interference between the re-radiation from the electrons w ithin the tra il whose
L X^secH
P - rG rG ^ q V s e c ^ S 2
40967^R?R|D2
(8)

thickness at formation is comparable w ith die signal wave length. The th ird factor indicates the
received signal time dependence. This loss factor accounts fo r the increase in the tra il radius
due to ambipolar diffusion which can be significant even fo r as short a period as is required for
the fotmation o f the trail.
The variation o f the received signal, at frequencies above the transition frequency, w ith time is
as shown in figure (6).
Is
FIGURE.<S: Time variation o f the received power
Defining the duration, t = 1/Vk, o f this signal as the duration o f a rectangular pulse o f equal
energy w ith its peak value equal to the peak value o f the received power [33], x maybe expressed
as follows:
. f __________ 87fDR:&2_________ 1 (9)
1 (yX se ^ iK ^+ R zX l -sin^cofpOJComparing the expressions in equations (5) and (9) fo r the echo duration, i t can be seen that at
frequencies below the transition frequency t is proportional to X1. On the other hand, ar
frequencies above the transition frequency, t is inversely proportional to X. I t may be argued
that x and x d iffer in their definition. Nevertheless, they both describe the usable echo duration

and hence can be qualitatively unified. Quantitatively, t is the time taken fo r the received power
estimated in equation (3) to decay to about 0.37 o f its initia l value, while x is the duration taken
fo r the received power in equation (5) so fa ll to about 0.29 o f its peak value.
In order to obtain a practical estimate o f the received signal power i t is required to realistically
approximate the various variable parameters on which i t is dependent A brief summary,
delineating how some o f these variables are quantified w ill be illustrative.
The velocity o f a meteor approaching the earth is a function o f the meteor's and the earth s
orbital velocities around the sun and the augular distance o f the radiant from the apex. This
geocentric velocity o f the meteor before coming under the influence o f the earth’ s gravity may
be expressed [31] as:
v2 = Vh+ ve+ 2 vh vecos4 (1%
Where vH and vE are respectively the velocity o f the meteor and earth in their orbit around the
sun and \ is the angle o f the radiant from the apex.
The geocentric velocity, vfl taking the earth 's gravity into account, may be written as [34):
v ^ = 1 2 5 + f (11)
The apparent angle o f radiant from the apex, %for an observer on earth may be transformed as
follows:
As mentioned before, the velocities o f the meteors approaching the earth are in the range
11.3km/s to 72km/s. Clearly, equation (10) illustrates that meteors which emanate from angular
distances, & smaller than 90° are speeded up. Conversely, those meteors emanating from angles
greater than 90° appear to be retarded. The correction introduced in equation (11) is based on
Newton’ s law o f gravitation.
As the meteor collides w ith air molecules, kinetic energy transforms to heat and the particle
vaporizes. The velocity o f the vaporized atoms is further restricted by air molecules, which
ionize them by detachment The ionization causes a tra il o f positive charged ions and free
electrons, w ith an in itia l radius r0, to form behind the meteor. The ionization le ft by the meteor
Page -20-

is ordinarily in a shape o f a cylindrical column which expands rapidly to a low density. The
ambipoiar diffusion coefficient, D , is a measure o f how fast the tra il diffuses and hence thins
o u t Both, the ambipolar diffusion coefficient and the initia l radius are by no means constant
and rather rapidly increase in magnitude with meteor height. This may be illustrated by an
expression [35] which empirically relates die ambipolar diffusion coefficient to height in the
region 80km to 110km as follow:
log10D = 0.067 h -5 .6 (13)
Where D is in mysec and h is in km. An empirical equation relating the in itia l radius to height
[30] is as follows:
l°gioro= 0.035 h -3.45 (14)
Where rfl is the in itia l radius o f the trail in meters.
Clearly, the characteristics and orientation o f the antenna employed by the M BC lin k has direct
bearing on the received signal power. I t is, therefore, important to acquire a global overview o f
the various parameters governing the behaviour o f this signal to gain insight o f their
interdependences. In the above transmission equation the factors o f prime concern fo r die
development o f antennas are the polarization factor and the antenna gains.
The received signal power is directly proportional to PTGTGRq2. Thus, i f transmitter power
remain cot stent and the receiver threshold is unchanged then the minimum value o f q can '■ .
reduced by increasing the gain o f die antennas. Lower threshold value o f electron line density,
q, w ill in turn increase the number o f detectable meteor trails illuminated and hence the link ’s
duty cycle.
I f both receiving and transmitting antennas are linearly polarized, die polarization factor, S, may
be computed by defining the angle | i between the incident electric vector on the tra il and the
electric vector at the receiving antenna. Hence the polarization factor may be expressed as
Alternatively, the angle between the incident electric vector and the direction o f the scattering
ray may be considered. That is, defining an angle a between the transmitter electric vector at
themeteor trail andRa, as shown in figure (7), w ill provideameasure o f the change inpolarization

upon scattering. Maximum signal strength w ilt be received when a linearly polarized antenna . is oriented perpendicular to the plane o f propagation since a = 90” and S = sin a w ill be unity
[32}.
F IG U R E 7: The transmitter electric vector at the meteor tra il
2.4 The Dependence Of Trails Detection On Sky Regions
The theoretical prediction o f the relative contribution o f sky regions to the detection o f meteor
trails commences by evaluation o f the number o f meteors whose electron line density exceed a
minimum value as a function o f meteor velocity, mass, zenith angle o f tra il axis and height
aboveground. I t w i ll be assumed [31, chapter?] that all meteors have their point o f maximum
ionization at a mean height o f 93km. Furthermore, i t is assumed that the variation o f electron
line density w ith respect to maximum ionization at a given height is the same for all meteor
trails. The maximum electron line density, q*,, in electrons per metre may be written as [36]:
q „= k ,tfm c o s £ (15)
B* - is the probability that a single atom w ill produce a free electron,
m - is the in itia l mass o f the meteor,
k , - is a constant of proportionality.
( - is the zenith angle o f meteor path axis.
M 'kinley [31, chapter 7] stated that B « v 5, where v is the velocity o f the meteor. Hence, on
substitution into equation (15):

qa,= k 2V 5mcosi; (16)
Where k j is a constant o f proportionality.
Follow ing the above formulas presented by Kaiser [36], i t was shown [17] that the number o f
free elections produced per unit trail length, q, at atmospheric height h is given by:
hm, = 93km - is the height o f maximum ionization.
H = 7 k m - is the atmospheric scale height. This parameter, as shown by M'Jdnley [3J,
chapter 7], depends on the temperature and degree o f dissociation o f the gas molecules
at any given height.
Substituting equation (16) into equation (17) yields:
(18)
The number o f meteors o f mass greater than m entering the earth's atmosphere per unit area per
unit time given by [37]:
k^ksCO sC (20)
k , - is a constant Based on experimental data [16], this constant has the value o f about
k j - is a function o f time o f day and year also found empirically.
Combining equations (19) and (20) yields an expression fo r the number o f meteors o f mass
grearerthaii n entering the earth's atmosphere per unit area per second as Follows:
(21)
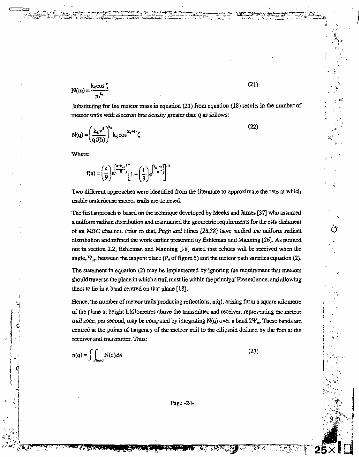
jubstirating fo r the meteor mass in equation (21) from equation (18) results in the number o f
meteor trails w ith electron line density greater than q as follows:
Two different approaches were identified from the literature to approximate the rate at which
usable underdense meteor trails are detected.
The firs t approach is based on the technique developed by Meeks and James [37] who assumed
a uniform radiant distribution and maintained the geometric requirements fo r the establishment
o f an M BC channel. Prior to chat, Pugh and Hines [28,38] have studied the uniform radiant
distribution and refined the work earlier presented by Eshleman and Manning [26]. As pointed
out in section 2.2, Eshleman and Manning [18] stated that echoes w ill be received when the
angle, between the tangent plane (?z o f figure 5) and the meteor path satisfies equation (2).
The statement in equation (2) may be implemented by ignoring the requirement that meteors
should traverse the plane in which a tra il must lie within theprincipal Fresnel zone, and allowing
them to lie in a band centred on that plane [18].
Hence, the number o f meteor trails producing reflections, n(q), arising from a square kilometre
o f the plane at height h kilometres above the transmitter and receiver, representing the meteor
trail zone, per second, may be computed by integrating N(q) over a band 2 'i'„ . These bands are
centred at the points o f tangency o f the meteor tra il to the ellipsoid defined by the foc i at the
receiver and transmitter. Thus:
(22)
n(q) = | J ^ N ( q ) d 4 (23)
Page -24-

The second approach, is based on the work o f Rudie [39] who improved on the work o f Pugh
and Hines [28,38] and Meeks and James [37] by accounting fo r some o f their geometrical
simplifications [40]. Rudie [39] developed a mathematical model fo r the radiant distribution,
which approximates the empirical data reported by Davies [41]. However, i t appears as though
the major contribution o f Rudie’ s work is in the development o f the mathematics fo r coordinates
transformation. He developed expressions to transform the distribution o f meteor orbits from
the heliocentric coordinate system to the distribution o f meteor radiants. These radiants are the
intersection o f the meteor trails and the celestial sphere, observed on the earth. Computation o f
the number o f detectable trails is performed fo r each point in the plane, at height h kilometres
above the transmitter and receiver, which represents the meteor tra il zone by integration with
respect to height A t each height, between the lower and upper lim its o f the meteor region, only
meteor trails which satisfy the requirement that meteors should traverse the plane in which a
trail must lie to present a principal Fresnel zone are accounted for.
As shown, in this section and section 2.3,-the observed occurrence rate o f useful meteors and
the mean received signal level is a function o f the antenna system employed. The dependence
can be predicted theoretically by combining the antenna illumination pattern w ith a model of
meteor trail distribution function, and then integrating the product over the relevant volumetric
sky region illuminated by the antennas.
2.5 The Merits Of Different Type Of Antennas In The Meteor Scatter Environment
The antenna is that component o f the communication system which links and interfaces the
transmitter and receiver networks to the medium through which signals propagate.
Owing to the small footprint, a single frequency may be time-shared among all stations within
ameteor scatter network. Antenna bandwidth is, therefore, o f little concent in M BC applications.
This simplifies the design, since broadband antennas produce difficulties in term o f pattern and
impedance constancy. Manpack and mobile applications may necessitate the use o f small
antennas which are the main thrust o f this research. Such antennas are inherently inefficient and
this parameter w ill be considered in more detail.

Due to the concentration o f useful meteors w ithin the hot spots, i t is clear that the antenna
radiation pattern and its associated gain characteristics plays a predominant role in the meteor
scatter environment. Since simple M BC systems operate at a fixed frequency, impedance
matching is triv ia l and hence considered to be o f lesser importance.
2.5.1 Antenna radiation pattern
The directional characteristics o f an antenna is given by its radiation pattern. Whether
operating in the transmitting or receiving mode, the pattern o f the antenna is the same in
accordance w ith the reciprocity theorem fo r antennas [42,43], The antenna radiation pattern
is a graphical representation o f the relative strength o f radiated fields as a function o f the
zenith, 0, and azimuth, <j>, angles o f the spherical coordinate system fo r a constant radial
distance from the source. The radiation characteristics o f an antenna is, therefore, represented
by a three dimensional pattern.
Some important radiation characteristics are expressed in terms o f scalar quantities. One
useful measure o f this is the directivity, D „ which is the ratio o f the maximum radiation
intensity, U (64)IM, to the radii don intensity averaged over all directions, U ^,. The radiation
intensity is a measure o f the power radiated from an antenna per unit solid angle.
The gain o f an antenna (referred to a lossless isotropic source) is a function o f its directivity
and efficiency. This efficiency accounts fo r ohmic losses arising from the conductivity o f
metal and dielectric losses. Thus, the gain o f an antenna in a specified (Lection (6,0) is given
by:
0 ( 8 4 ) = I D , (8,4) (25)
Where T) is the radiation efficiency o f the antenna. Although antenna’ s gain can be specified
in any direction, i t is usual to refer to the peak value which coincides w ith the direction o f
the main beam radiated by the antenna.
In the meteor scatter environment, the question to be addressed w ith regard to radiation
pattern is whether better connectivity can be achieved by focusing a narrow beam onto a
region where useful meteors are more likely. The radiation intensity in the main lobe o f an
antenna is, to a good approximation, inversely proportional to the angular w idth o f the main
lobe. As a corollary, the gain o f the antenna is inversely proportional to the beam width in
the zenith and azimuth planes.
The use o f narrow beam antennas reduces the solid angle subtended and therefore the volume
o f sky illuminated. But the higher gain o f the antenna compensates by increasing the
observable number o f meteors per solid angle. M BC simulation results [19] indicate that a
split beam pattern directed at the hoc spots to either sides o f the transmitter receiver axis
results in a larger number o f useful meteor bursts per hour compare w ith a wide low-gain
receiving beam directed at the transmitter.
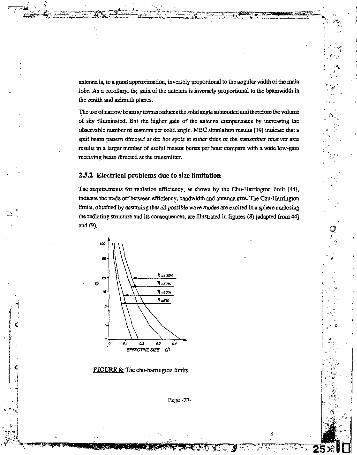
2.5.2 Electrical problems due to size limitation
The requirements fo r radiation efficiency, as shown by the Chu-Harrington lim it [44],
indicate the trade o f f between efficiency, bandwidth and antenna size. The Chu-Harrington
lim its, obtained by assuming that all possible wave modes are excited in a sphere enclosing
the radiating structure and its consequences, are illustrated in figures (8) [adapted from 44]
EFFECTIVE SI2E lt>FIG U R E 8: The chu-haningtoti limits.

o
I£
EFFECTIVE SIZE toF IG U R E 9: Consequences o f the chu-hairington limits.
The effective Q-value o f an antenna is a reciprocal measure o f its bandwidth. These lim its indicate that areduction in the antenna’ s dimension wou'^ ^sult in reduced efficiency fo r
afixed bandwidth. Furthennore, to achieve a desired efficiency performance while reducing
the antenna's dimension would result in a higher effective Q-value (or reduction in the
antenna’s bandwidth). The antenna’s bandwidth often suffers as a result o f the reduction in
dimension brought about to satisfy some practical constraints. This constraint is not a major
problem in the simple meteor scatter environment, since such a system operate at a low data
rate and hence requires narrow bandwidth. Directivity constraints due to size lim itation is a more serious problem.
The directivity o f an antenna with uniformly distributed electric field (ie. constant radiation
pattern) across its aperture (termed aperture distribution) may be increased by large electric
fie ld fluctuations in the vicinity o f the aperture’s edges. This is known as superdirective
condition [45, pp. 517-520]. Thus, antennas whose directivity is much larger than the
directivity o f a uniformly excited reference antenna o f the same size, is known as a
superdirective antenna.
Page -28-

In an array, superdirectivity is achieved by insertion o f multiple elements w ithin a fixed
length, thus decreasing die spacing. This causes large, out o f phase currents to circulate
within the elements, increasing the amount o f recirculating energy, the effective Q o f the
array, and the ohmic loss, which in m m causes the antenna's efficiency to rapidly decrease.
Superdirectivity, therefore, suffers ftom problems such as low radiation resistance andhencc
low efficiency, narrow tolerances due to large and oppositely directed currents and small
r*indwidth. Figure (10) [adapted from 44] is an example o f such an array. I t indicates the
variation o f Q w ith a directivity increase. A two wavelength long superdirective array,
occupied by various numbers o f isotropic elements illustrates an exponential increase o f Q
with directivity.
a
Directivity
FIG U R E 10: Q Vs D irectivity computed fo r a ZA. array.
2.5.3 The effect of noise in relation to the antennas
The assessment o f the effect o f noise on M BC systems may be categorized in terms o f
internal and external interference. The internal source o f noise is due to ohmic resistance o f
the antenna. External interference affecting the reception o f VHP signals includes galactic
nor local atmospheric noise and man-made noise. The effect o f noise on the M BC link is
Page -29-

to decrease die usable signal duration since this is defined as the time period during which
the signal-to-noise ratio is above a predefined l im it Hence, the system waiting time for
transmission o f an error free message frame is increased [46]. In the transmitting mode, the
main requirement is to radiate as much o f the available energy as possL.v, whereas in the
receiving mode the main consideration is a good signal to noise ratio.
Owing to die thermal agitation o f charges in a conductor, there is a certain amount o f energy
distributed over the whole radio frequency spectrum. The noise power (in Watts) resulting
from this energy may be expressed as:
k = 1.38 x lO-23 J/°K is the Boltzmann’ s constant
T is the temperature in °K.
B is the bandwidth in Hz.
V is the nns value o f noise voltage.
R is the resistance in Ohms.
This level o f noise power w ill always be present and is often used as reference.
Galactic noise, arriving from regions outside the earth’ s atmosphere, "seen" by an antenna
depends both on its beamwidth and on the direction in which it is pointing. To minimize
this effective noise temperature, the antenna beam should avoid pointing near discrete
celestial radio sources. Although the presence o f galactic noise appears to diminish as
frequency is increased toward the GHz region, an isotropic noise temperature background
w ill always prevail, independent o f beam direction [47],
Anatmospheric sourceof noise which may be significantat the VHFbandisdue to discfirges
taking place in the immediate vicinity o f the receiving antenna. This form o f noise, k.'own
as precipitation static, is caused by electrically charged particles which may be raindrops,
snow, hailstones or dust clouds. Other sources o f atmospheric noise is due to the currents
caused by flashes o f lightning. These currents are o f such intensity and short duration that

they produce a continuous spectrum o f energy throughout the band o f radio frequencies.
Intermittent thunderstorm activity would give rise to impulse noise in a receiver, but the
combined fie ld o f many flashes in a short time interval w ill appear as fluctuation noise [48].
Man-made noise include all noise sources due to electrical appliances and machinery. The
lower portion o f the VHF frequency spectrum is dominated by industrial equipment, with
power lines and automobile ignition noise being majoi contributors [48].
O f all types o f interference encountered, man-made noise is most severe [46,48]. Noise
measurements, carried out by the Naval Ocean Systems Centre (NOSC) in the USA [46],
indicaie that man-made radio noise can be detected at distances in excess o f hundred miles
from large metropolitan centres and was found to increase w ith altitude. When man-made
noise is eliminated by directing the antenna beam skywards, galactic noise predominates.
An indication o f the expected noise levels in business, residential andrural areas is presented
in figure (11). These correlations [49], however, should only be viewed as a yard stick since
other factors, such as the orientation and height o f the antenna above ground as w ell m the
specific external interferences prevailing at a particular site at any point in time, w ill cause
significant deviation from the indicated noise levels.
Figure (11) indicate median day-time values o f surface man-made radio noise power and
galactic noise power in dB above thermal noise, kT B , at 288°K as a function o f frequency.
In general, noise sources should not be illuminated by the antenna’s radiation pattern.
Although noise cannot be completely eliminated, its level can be reduced. A significant
reduction o f man-made noise can be achieved by increasing the elevation angle o f the main
beam. In addition, minimising the height o f the antenna above ground w ill reduce noise
power in t weed via the antenna’ s minor lobes.
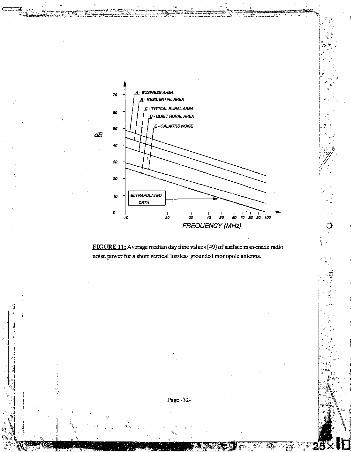
FR EQ U EN C Y (MHz)
le values [49] o f surface man-made radio
;e power fo r a short vertical lossless grounded monopole antenna.

3 DESIGN OF SIMPLE ANTENNAS FOR MBC
In chapter 2 the a theoretical overview on the mechanisms o f M BC and the role played by die
antenna system was outlined. In this context the merits o f different type o f antennas in the meteor
scatterenviionment are delineated. In this chapter design aspects o f antennas fo r M BCare presented.
These include the synthesis o f value systems o f antennas fo r mobile and manpack applications, a
review o f thedesign tools used toacquire theoretical results o f MBClinkperformance using different
antennas, and an examination o f the merits o f different sky illumination schemes fo r MBC.
3.1 A Value System For The Remote MBC Antenna System
Value may be defined as those uatities on which the worth, desirability or utility o f the system
depends. The objective o f this remote M BC antenna value system aims at establishing antenna
characteristics for design and evaluation to ensure the best overall antenna system fo r the
end-user.
The value o f a system is therefore perceived in terms o f the degree to which i t satisfies the
end-user requirement. A value system is die result o f value analysis, which is the analytical
investigation o f the factors or circumstances which affcct the value o f the system. Value analysis,
is therefore, the process o f weighing the various aspects o f a system against each other in a
quantitative fashion.
This procedure is a valuable tool during the normal design process. A n engineer always aims
at a good value, but is often concerned with the technical activities o f the system, andit is difficu lt
fo r him to make an objective appraisal o f the total system in its fina l application. The technique
o f value analysis provides a method whereby this could be methodically achieved.
The approach in value analysis is to identify the crucial aspects o f the system and to assess these
relative to each other. In the meteor scatter environment these functional virtues could typically
be the size o f the set, waiting time between messages, the size o f the antenna, its ruggedness
and the 1 - n the value analysis the user is forced to indicate the importance o f the various
functions aspects in comparison to all the others, thereby assigning a quantitative value to each.
I t is often discovered that a conventional design concentrates on areas o f lesser importance and
simultaneously high cost These functional aspects o f lesser importance are ofteii the

consequences o f others which are in reality more important I f the designer is able to implement
the design goal using alternative methods and thereby eliminate some, o r all, o f these less
important aspects, a better system value is achieved.
The use o f a value engineering technique requires considerable sk ill and judgment. One must
guardagainstdegradingthe system attheexpenseofsome quality which is notstrictiy functional,
but which nevertheless contributes to its worth. This could include appearance, ultimate
durability, transportability, maintainability and so forth. An attempt was made to formulate a
value system fo r both mobile and manpack use in MBC. This attempt follows a procedure o f
value analysis suggested by GHV' Bodman [50].
From the discussion on M BC and the role played by the antenna presented in chapter 2, i t is
clear that M BC require high gain antennas which are synthesized to illuminate specific sky
regions. The type o f illumination schemes best suited fo r M BC w ill be investigated in section
3.3. This w ill determine the shape o f the antenna’s radiation pattern ideally suited fo r optimum
performance. But these desired characteristics may differ considerably to that which can be
achieved using simple antennas due to complexity and size limitations. I t may be found, for
instance, that the ideal antenna should have horizontal beamwidth in the order o f 8 degrees and
vertical beamwidth, including ground effects, o f about 6 degrees. M inor lobes should be about
40dB down on the main beam and the. radiation efficiency o f greater than 90 percent The antenna
should also illuminate the sky region at a height o f about 95km above the mid-path between
receiver and transmitter. Clearly, many o f these idealized technical requirements clash w ith the
requirement fo r a simple anienna, as i f is difficu lt to obtain high directivity as well as accurate
directionality o f antennas mounted on moving vehicles. Hence, a value analysis indicates how
the technical requirements can be optimally met while s till satisfying the practical aspects of
the system.
Mobile and manpack remute out-station antenna systems are o f particular interest. In mobile
MBC severe constraints are placed on the antenna, especially in terms o f its height and
ruggedness, whereas the size o f the set itself is not o f that much importance. The mnnpnr.k
remote station, on the other hand, may employ a more elaborate antenna, but the antonna must
be collapsable and the weight o f the set should be minim zed. The size and weight o f the set is
related to its power capability. Clearly, remote out-station antennas o f reduced size and
complexity w illresult in communication systems o f degi"adedthroughput Therefore, the waiting

time between messages and their size w ill be traded o ff fo r simplicity. But just how important
are these aspects in relation .to one another? The answer to this must emerge from the value
system analysis.
The procedure fo llowed to determine the weighting o f the various important aspects is such that
a decision is forced to be made on a one-to-one basis. The relative importance o f each aspect
with respect to all other aspects is then determined. These can then be plotted to graphically
illustrate groups o f aspects w ith similar importance. Often, the groups w ith lower weighting are
those which degrade the worth o f the system. I t may be possible to eliminate the less important
aspects by different methods o f implementing some o f the more important ones, thereby
enhancing the system’s worth. Finally, any design o f a system can be evaluated on the basis o f
how well the requirements, la id down by the value system, are fu lfilled. The detailed procedure
o f value analysis used is outlined in Appendix A for the interested reader.
Following the procedure o f value analysis presented in Appendix A , the value systems obtained
fo r the remote mobile and manpack antenna systems in terms o f priority and weighting are
shown in figures (12) and (13) respectively. The weighting factors were arrived at after
discussion between university researchers and engineers from S ALBU(PTY)Ltd. [51] who were
familiar w ith the end-user requirements.
MOBILE REMOTE OUT-STATION
ASPECTS WEIGHTING
Reduce! height of antenna 11
Ruggedness of antenna 3
Short waiting time between messages 7
Reduced size of antenna <
Large messages (Vs. short)
Limit No. of antennas to one only f
- remote out-stadon antenna systems.

MANPACK REMOTE OUT-STATION
ASPECTS WEIGHTING
Small weight of set (power out) 10
Small size of collapsed antenna 5
Short waiting time between messages 9
Ruggedness of antenna *
Ease of antenna orientation 2
Large messages (Vs. short) '
E !£zUEEJ3: The value systems fo r manpack rraiote i '* "'alien antenna sysiems.
Cleariy, the weight o f the set is o f prime importance in the ma t station and is not important
when mounted on vehicles. This finding has an ultimate bearing on the output power capability
o f these stations and consequently the implementation o f the antenna system. Short waiting time
between messages is an important functional aspect in both manpack and mobile applications
while large messages are o f considerably lesser importance, especially formanpack applications.
The point o f concern in the manpack situation is the problem o f having to carry the equipment
on one’s back. As aresuit o f this, the importance o f having competent users to align andassemble
the antenna system is evident. When an M BC lin k is mounted on a vehicle, i t is the reduced
height and ruggedness o f the antenna which is important rather than its reduced size and
complexity.
3.2 Computer Aided Analysis Of Antenna Performance And MBC Link Performance
The design o f antennas must adhere to the value system establish fo r its specific application and
thus examined in this light. But before this can be done, an evaluation o f the performance o f
these antennas in terms o f their electrical characteristics, as w ell as the performance o f MBC
links employing these antennas must be carried out. A powerful technique fo r the simulation

o f antennas is the Method o f Moments described in Appendix B. In this work. The Method o f
Moment based code NEC2 [12] was used to evaluate antenna’s performance. The performance
o f M BC links was theoretically predicted using the computer code METEOR [13].
3.2.1 Numerical Electromagnetic Code version 2, NEC2
The Numerical Electromagnetic Code version 2, NEC2, is a popular Method o f Moments
software package used fo r analysis o f the electromagnetic response o f antennas and other
metal structures. The analysis is attained by the numerical solution o f both an electric-field
and magnetic-field integral equation for currents induced on the structure by sources or
incident fields [12].
Results obtained by employing computer simulation o f physical systems are only as reliable
as their mathematical approximations, coupled w ith constraints imposed by numerical
limitations. Numerical limitations may be inherent either in the mathematical model used
to approximate a physical system, the actual physical complexity o f a system, or in the
numerical techniques used fo r computation.
The basic devices fo r modelling structures w ith the NEC2 code are short, straight segments
fo r modelling wires, and fia t patches fo r modelling surfaces. The proper choice o f these
segments and patches is critical in order to obtain accurate results. Some guide-lines appear
in Appendix C as to the modelling technique and constraints to be followed when using
NEC2.
The features o f NEC2 include:
• Analysis o f arbitrarily oriented wires and surfaces.
• Inclusion o f ap&fect ground plane, areal groundplane using Fresnelreflection
coefficients orareal groundplane using the more rigorous Sommerfeld/Norton
solutions.
Up to 10 excitations can be specified on an antenna structure.
« Up to 30 lumped loads may be specified w ithin the wire structure,
• The program output includes:
-Input impedance at the pons which were excited.- Current distribution on the antenna.
Page-37-

- Both, near and far fields from the antenna.
- Efficiency o f the antenna.
- Three dimensional radiation pattern.
In order toobtain valid results, the numerical and mathematical modelling o f structures must
obey a rig id set o f rules imposed by the NEC2 code (see Appendix C). In addition, the input
data file which interfaces the NEC2 code is row and column dependent This constitutes a
user unfriendly interface which demands a high level o f expertise to use. Thus, an Intelligent
Pre-processor fo r NEC2 was written [52]. The intent o f this pre-processor is to keep the
userisolated from the various constraints and limitations imposed by the NEC2 code as well
as the automatic creation o f the input data file.
3.2.2 Prediction software for MBC system performance
The computer code "METEOR" version 1.0 [13] is a prediction package fo r determining
M BC link performance. This code is implemented as a u tility fo r M BC designs in such a
way that the user is permitted to set up the model o f any point-to-point l in k in terms o f its
parameters. Three type o f user modes are provided fo r
• The Novice mode: Permits the user to select a predefined M BC lin k and instruct
the computation o f its performance.
• The User mode: For the more experienced user, allowing the setting o f most o f
the important M BC link parameters.
The Expert mode: Provides the user with complete control over the M BC system
parameters, including the mathematical model used fo r computation.
This prediction tool allows the user to assess the data communication performance o f an
M BC link through the specification o f the fo llowing pars miters:
Frequency.
Transmit power.
Receive sensitivity.
Yagi-Uda antenna type and orientation or NEC2 input data file.
Data rate and protocol specification.
Stations geographical location.
• Local noise environment.
Page -38-

• Time o f day and year,• Theory used fo r simulation.
The output o f the program include the prediction of:
Relative contribution o f various sky regions to detectable reflections.
= Antenna illumination contours and patterns.
Absolute number o f detectable meteors.
• Distribution o f trails duration.
• Estimate o f data communication performance.
Antetmaillumination is computed by the program for Yagi-Uda antennas or using the NEC2
code. Using the NEC2 code allow fo r any radiation pattern to be incorporated in the
computation o f the M BC link performances. From the antenna designer view point, one o f
the useful aspects o f the prediction model is its ability to predict MBC link performances
for different antennas due to incorporation o f NEC2 into this package.
The package enables the user to display measured results obtained fo r specific links during
field tests. These results may be displayed together w ith the results computed by the
prediction program. This facility serves to indicate the degree o f confidence which may be
placed on the ability o f the package to produce accurate simulation results. In addition, it
may be used to test the valid ity o f different mathematical models employed for the
computation o f M BC link performances.
The prediction code METEOR [13] uses the two approaches outlined in section 2.4. In its
computation o f the number o f detectable trails the underdense transmission equation o f
received signal power outlined in section 2.3 is employed. Furthermore, the contribution to
the number o f usable meteor trails in the planeh kilometres above the transmitter and receiver
(used to represent the meteor trail zone) is calculated. This computation is carried out over
the common sky region illuminated by the antennas.
3.3 The Effect Of Antenna Beamwidth/Directivity And Orientation On Meteor Burst Communication
In the preceding sections o f this chapter the synthesis o f value systemfor antennas was discussed
and cite computer codes to predict antennas and M BC links performance were outlined. Since

meteor scatter propagation is dependent on antennas in a point-to-point link , base- stadon as well
as out station antennas need to be considered in this respect This calls fo r an examination o f
the effect o f different sky illuminadon schemes. In this section, therefore, the relationships
between antenna beamwidth/gain to waiting time and channel duration are established.
3.3.1 Description Of The Experiment And Evaluation Method
The task o f antennas employed by M BC systems is to illuminate sky regions where radio
waves are most successfully reflected via meteor trails to establish channel openings. These
regions o f sky w ill, however, vary due to the migration o f the hot spots discussed in section
2.1. Therefore, to examine the effect o f different illumination schemes on the M BC link
performance, a fixed link bad to be considered at a set time. For the purpose o f this study,
an idealized radiation pattern was synthesized and used fo r illumination.
In this experiment, theoretical channel .duration above threonold and meteor count results
are presented fo r various idealized antenna illumination schemes over a 530km M BC link.
These show that the correct choice o f antenna directivity and orientation may dramatically
enhance link performance. This investigation was repeated fo r a 1115km link to confirm
the valid ity o f the results.
The computer code METEOR [13] was used to predict the M BC lin k performance. As
pointed out in section 3.2.2. some coefficient contained w ithin the formulas implemented
in this prediction model are adjustable. Hence, i t is imperative to carefully calibrate t..e
prediction model by ccmparison o f results to en% -.ical values before useful vimulations'can
commence. The availability o f measured data over 530km and 1115km paths was thus the
reason fo r choosing these two representative links. The absolute numerical values resulting
from simulation are therefore approximate, but the identified trends are reliable.
3.3.2 Test Link Description
The complete description o f the M BC link and the various parametric settings o f the
prediction model used for this simulatron are presented in Appendix D . An extract o f the
global features o f this M BC link is as follows:
530km Jink.
Page -40-
• Transmider Latitude: 26® South
• Transmitter Longitude: 286East
• Receiver Latitude: SO® South
• Receiver Longitude: 31" East
• 400W transceivers.• 8kHz receiver bandwidth.
• 270*K receiver noise temperature.
Minimum,detectable signal strength o f lOdB above noise.
• Trails w ith more than tiOmsec duration above threshold.
• A time o f 06h00.The antenna radiation pattern was synthesized to be a circular cone with uniform power
density over the cai.ic sa'id .v»gle ana no 'J jijjiis .’a o r elsewhere. Far this idealized panem
there is a simple nVtationship beev-^n the cuiifc tiE ie , 6, and the isotropic d irectivity, D,,
approximated b$:
The top vie-f <>' the d n u l& ' j tifik is in figure ('14;:
Three differen; ty'-es o f ^ten ifn tigA ece iv ing antenns Itommadon scherr'3 were
investigated fa - rja* &(dk
Type I : Both rfx -ii.i & aatVtrav m iner beams are directed along the Eransniiiter-receivei- axis
always illura«Badl)g|hecerm'eiaLflie meteoric region iZheight^S.ki1)- At mid-path. Ihereceivea-
beam width M W U p q a t T f St would be. typicad f-or mobile Or manpack applications
where simple autvAg/.e are used, w) iile the transc>tftor t E ia iW idih ii incrementally reduced.
The value o f 72* m s chosen to completel)r illuminate V it hex spc-i-s regions.
Type 2: The receiver radiation pattern is the same as in Ty=e L Thtt ■xysnsitter illumination
iscentredon one hot spot only, while reducingits b^gnlw iijA and hetxaincKasing direcdvit)'
incrementally.
Type 3: Both receiver and transmitter on one hot spot only, the transmitter in
Type 2, and the beamwidth o f both aic varied simultaneously.
(27)
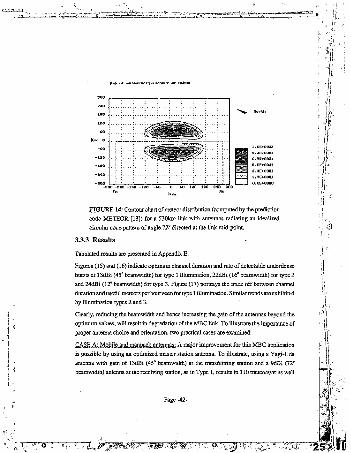
FIG U R E 14: Contour chart o f meteor distribution (computed by the prediction
code METEOR [13]) fo r a 530km link w ith antennas radiating an idealized
circular core pattern o f angle 72® directed at the lin k mid-point.
33.3 Results
Tabulated results are presented in Appendix E.
Figmes (15) and (16) indicate optimum channel duration and rate o f detectable underdense
bursts at 13dBi (45° beam width) for type 1 illumination, 22dBi (16° bearawidsh) fo r type 2
and 24dBi (12° beamwidth) fo r type 3. Figure (17) portrays the trade o f f between channel
durationand useful meteon per hour seen for type 1 illumination. Similar trends are exhibited
by illumination types 2 and 3.
□early, reducing the beamwidth and hence increasing the gain o f the antennas beyond the
optimum values, w ill result in degradation o f the MBC link. To illustrate the importance o f
proper antenna choice and orientation, two practical cases are examined:
is possible by using an optimized master station antenna. To illustrate, using a Yagi-Uda
antenna w ith gain o f 13dBi (45° beamwidth) at the transmitting station and a 9dBi (72°
beamwidth) antenna at the receiving station, as in Type 1, results in 110 meteors/hr as well
. A major improvement fo r this M BC application

s. D irectivity fo r the three types
o f illuminations. Note: Scaling differences are indicated oa vertical axes,
as 50 sec/hr channel duration. An optimized master station antenna w ith 21 dB i gain (18°
beamwidth) and a 9dBi (72° beam width) remote station antenna, as' in Type 2, yields 210
meteors/hr; 70 sec/hr. A master station having two beams o f the above optimum value was
also simulated and produced an increase in the number o f meteors/hr to 250 meteors/hr and
the channel duration to 85 sec/hr.Thus, to summarise, an optimum master station antenna fo r mobile communications w ill
result in more than double the number o f meteors/hr seen and approximately 70% increase
o f available channel duration.
CASE B: A fixed link MBC: Using the Yagi-Uda antennas w ith gain o f 13dBi (45°
beamwidth), directed along the Transmitter-Receiver axis, fo r both, master and remote
stations results in 140 meteors/hr and 75 sec/hr. Using a 25 dB i (12° beamwidth) antennas,
directed at one hot spot only, as in Type 3, yields 1860 meteors/hr and 575 sec/hr. This is
more than 10 times increase in the number o f meteors seen per hour and over 7 times increase

F If l l IR E 16: The graphs o f useful Meteors per hour Vs. D irectivity fo r the
three types o f illuminations. Note: Scaling differences are indicated on vertical
in available channel duration. I t is possible that these theoretical results are numerically
somewhat higher than those which can be achieved in practice. Nevertheless, the trend is
believed to be correct A master station having two beams o f this optimum value each,
directed at the Different hot spots, was also simulated and produced an increase in the number o f meteors seen and channel duration by approximately 23%.
From this investigation i t is clear that proper antenna choice and orientation partic larly at
the master station (for mobile communications) w ill result in dramatic link improvement.
I t should be noted that such optimum antennas are not unrealistic since a stacked array o f 8
Yagi-Uda antennas with 5 elements each produce about 21dBi gain. For networking
applications, however, steerable arrays w ill provide a more versatile solution.

FIG U R E 17; The graphs o f Channel duration Vs. useful Meteors p a hour fo r
type 1 illumination (shown in figures (15) and (16)). D irectivity o f illumination
is indicated.
Page -45-

4 PREDICTION OF MBC LINK PERFORMANCE USING SIMPLE ANTENNAS
The study outlined in section 3.3 illustrated the importance o f the correct choice o f antenna
directivity, radiation pattern and orientation in the meteor scatter environment The requirement for
simple antenna systems fo r mobile and manpack applications results in communication systems o f
degraded throughput As indicated by the value system analysis (in section 3.1) fo r die mobile
out-station, a higher weighting o f importance is placed on the antenna’s height and ruggedness than
on the demand fo r short waiting time between messages. For the manpack remote station, the small
weight o f the set as well as the small size and collapsability o f the antenna, out-weighs the
requirement fo r short waiting time between massages. In view o f this gi’ide-line information one
can now examine the performance o f M BC links employing different antennas.
In this chapter, theoretical channel duration above threshold and meteor count results are presented,
using varioas simple antennas, fo r stations separation ranging from 100km to 2000km. Tabulated
results are presented in Appendix E.
4.1 Description Of Evaluation Method
The objective o f this investigation is to establish performance o f M BC links employing simple
antennas. The performance o f these, however, can only be useful i f viewed on a reference basis.
That is, the performance predicted fo r links employing any specific antfcnna should be viewed
w ith respect to these same links employing other antennas. As reference antennas, therefore, a
dipole antenna and its monopole ve si on were studied. Another useftil reference antenna is a
5-eiements Yagi-Uda antenna since this is often used fo r MBC. Subsequent simulations were
performed fo r a mobile square loop antenna and amanpack long w ire (terminated) antenna. The
antennas were deliberately simulated cither in free space or above an infin ite conducting ground
in order to eliminate the varying effect o f real ground on the antenna's radiation pattern. Clearly,
in practical cases the NEC2 code may be used to determine the radiation pattern due to a particular
ground plane. These theoretical results are presented fo r
400W transceivers.
• 8kHz receiver bandwidth.
270°K receiver noise temperature.
• M inimum detectable signal strength o f lOdB above noise.
Page -46-

• Trails w ith more than 60msec duration above threshold.
• A time Of 06h00.
The transmitting station o f the M BC link , fixed at longitude 28° east and latitude 26° south,
employs a 5 elements Yagi-Uda antenna w ith radiation pattern as shown in figures (18) and
(19>
FTOTJRE18: The azimuth-plane radiation partem o f the 5 elements Yagi-Uda
mounted at the transmitting station. Maximum forward gain: lO .ldB i as evaluated
by NEC2 [12],
This transmitting antenna is directed along the transmitter-receiver axis always illuminating the
centre o f the meteoric region (height 95km) at mid-path. The receiving station is not fixed. I t
traverses a north-south path along longitude 28° east, varying its latitude location from. 100km
to 2000km south o f the transmitting station. A ll other settings o f the prediction model, used [13]
are identical to those used in section 3.3. These can be viewed in Xppendix D.
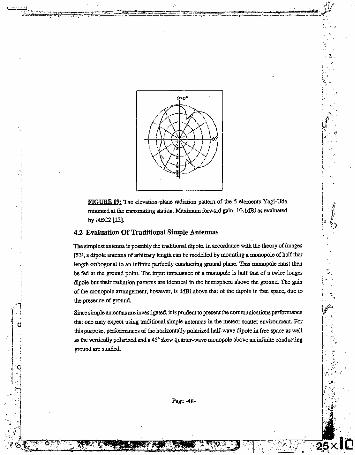
A
FIG U R E 19: The elevation-plane radiation pattern o f the 5 elements Yagi-Uda
mounted at the transmitting station. Maximum forward gain: lO .ldB i as evaluated
by NEC2 [12).
4.2 Evaluation Of Traditional Simple Antennas
The simplest antenna is possibly the traditional dipole. In accordance w ith the theory o f images
[53], a dipole antenna o f arbitrary length can be modelled by mounting p monopole o f ha lf that
length orthogonal to an infinite perfectly conducting ground plane. This monopole must then
be fed at the ground point. The input impedance o f a monopole is half that o f a twice longer
dipole but their radiation patterns are identical in the hemisphere above the ground. The gain
o f the monopole arrangement, however, is 3dBi above that o f the dipole in free space, due to
the presence o f ground.
Since simple antennas are investigated, i t is prudent to present the communications performance
that one may expect using traditional simple antennas in the meteor scatter environment For
this purpose, performances o f the horizontally polarized half-wave dipole in free space as well
as the vertically polarized and a 45® skew quarter-wave monopole above an infinite conducting
ground are studied.
Page -48-
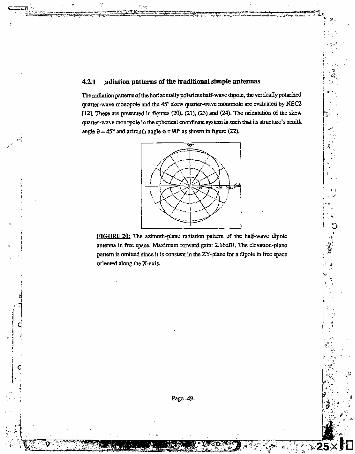
4.2.1 adiation patterns of the traditional simple antennas
Theradiation'panemsoftheborizontallypolarizes half-wave dipole, the vertically polarized
quarter-wave monopole and the 45” skew quaiter-wave monopole are evaluated by NEC2
[12]. These are presented in figures (20), (21), (23) and (24). The orientation o f the skew
quarter-wave monopole in the spherical coordinate system is such that its structure’s zenith
angle 6 = 45° and azimuth angle * = 90° as shown in figure (22).
F IG U R E 20: The azimuth-plane radiation pattern o f the half-wave dipole
antenna in free space. Maximum forward gain: 2.16dBi. The elevation-plane
pattern is omitted since i t is constant in the ZY-plane fo r a dipole in free space
oriented along the X-axis.
Page -49-
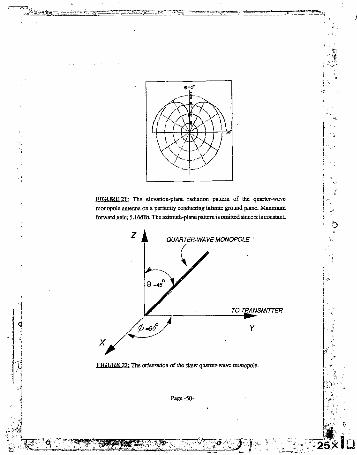
I I i < Y - h
1F
FTatJRE 21: The elevation-plane radiation pattern o f the quarter-wave
monopole antenna on a perfectly conducting infinite ground plane. Maximum
forward gain: 5.16dBi. The azunutb-planepattem is omitted since i t is constant.
QUARTER-WAVE MONOPOLE "
TO TRANSMITTER
FIG U R E 22: The orientation o f the skew quarter-wave monopoJe.

4 h .
4- y
FIG U R E 23: The elevation-plane radiation, pattern o f a 45° skew quarter-wave
monopole antennaonaperfectly conducting infinitegroundplane(fromazimurh
view-point § = 90°). Maximum forward gain: 4.65dBi. j .
' o
Page -51-
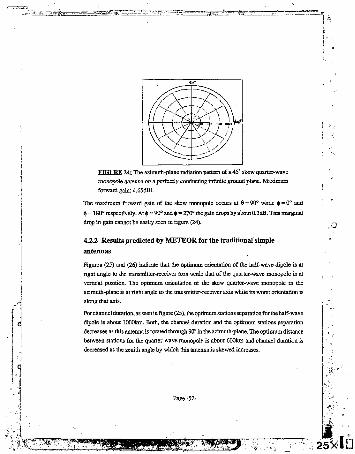
FIG U R E 24: The azimuth-plane radiation pattern o f a 45° skew quarter-wave
znonopole antenna on a perfectly conducting infin ite ground plane. Maximum
forward gain: 4.65dBi.
The maximum fi-w a id gain o f the skew monopole occurs at 8= 9 0 ° while $ = 0° and
$ = 180° respectively. A t $ = 90° and $=270° the gain drops by about 0.3dB. This marginal
drop in gain cannot be easily seen in figure (24).
4.2.2 Results predicted by METEOR for the traditional" simple antennas
Figures (25) and (26) indicate that the optimum orientation o f tire half-wave dipole is at
right angle to the transmitter-receiver axis while that o f the quarter-wave monopole is at
vertical position. The optimum orientation o f the skew quarter-wave monopole in the
azimuth-plane is at right angle to the transmitter-receiver axis while its worst orientation is
along that axis.
For channel duration, as seen in figure (25), the optimumstationsseparatioafor the half-wave
dipole is about 1000km. Both, the channel duration and the optimum stations separation
decreases as this antenna is rotated through 90° in the azimuth-plane. The optimum distance
between stations fo r the quarter-wave monopole is about 600km and channel duration is
decreased as the zenith angle by which this antenna is skewed increases.

I
F IG U R E 25: The graphs o f Channel Duration Vs. Distance fo r the half-wave
dipole and quarter-wave monopole at various orientations. Note: Scaling
differences are indicated by symbols on vertical axes.
For average waiting time between useful meteors, which is inversely proportional to the
meteoric rate, as shown in figure (26), the optimum station separation fo r the half-wave
dipole is about 800km. Both, the number o f useful meteors seen per hour and optimum
distance between stations decreases as the dipole is rotated through 906 in the azimuth-plane.
The optimum station separation fo r the quarter-wave monopole is about 500km and the
meteor count is decreased as the zenith angle by which the monopole is skewed increases.
The half-wave dipole provide improved connectivity compare to that which is achieved
employingthequarter-wavemonopoie.Figures (20)and(21) indicate that greater sky regions
are illuminated by the dipole antenna, particularly at short range. As the distance between
stations increases, the higher gain illumination o f the monopole covers increasingly greater
regions o f sky and would, therefore, be expected to perform better than indicated in figures
Page-53-
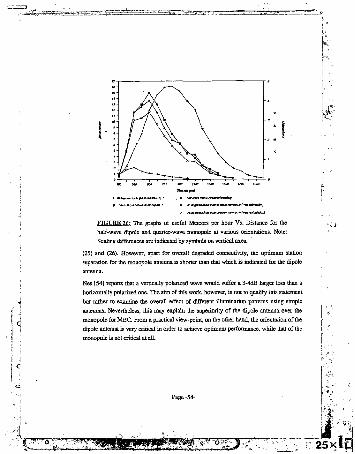
*■ raf'Wan rfpefafbggo
F IG U R E 2fi: The graphs o f useful Meteors per hour Vs. Distance fo r the
half-wave dipole and quarter-wave monopole at various orientations. Note:
Scaling differences are indicated by symbols on vertical axes.
(25) and (26). However, apart fo r overall degraded connectivity, the optimum station
separation fo r the monopole antenna is shorter than that which is indicated fo r die dipole
Nes [54] reports that a vertically polarized wave would suffer a 3-4dB larger loss than a
horizontally polarized one. The aim o f this work, however, is not to qualify this statement
but rather to examine the overall effect o f different illumination patterns using simple
antennas. Nevertheless, this may explain the superiority o f the dipole antenna over the
monopoIefdrMBC. From a practical view-point, on the other hand, the orientation o f the
dipole antenna is very critical in order to achieve optimum performance, while that o f the
monopole is not critical at all.
Page -54-
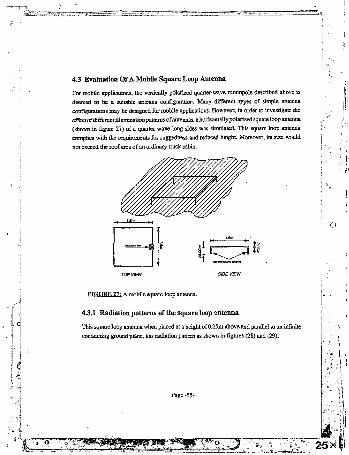
4.3 Evaluation Of A Mobile Square Loop Antenna
For mobile applications, the vertically polarized qnaner-wave monopole described above is
deemed to be a suitable antenna configuratior. Many different types o f simple antenna
fnnfignratinns may be designed fo r mobile applications. However, in order to investigate the
eSectofdiffereatiilurainadoD patterns o f antennas, a horizontally polarized square loop antenna
(shown in figure 27) o f a quarter-wave long sides was simulated. This square loop antenna
complies w ith the requirements fo r ruggedness and reduced height Moreover, its size would
not exceed the roo f area o f an ordinary truck cabin.
SIDE VIEWFIG U R E 27: A mobile square loop antenna.
4.3.1 Radiation patterns of the square loop Antenna
This square loop antenna whim placed at a height o f 0.25m above and parallel to an infinite
conducting ground plane, has radiation pattern as shown in figures (28) and (29).

FIG U R E 28: The azimuth-plane radiation pattern o f the square loop antenna
sliced at zenith angle 9 = 70° as computed by NEC2 [12].
Maximum upward gain: 9.5dBi as evaluated by NEC2 [12].
As seen in figure (29), a square loop antenna which is place parallel at a small height above
a metal truck roo f w ill radiate mostly upwards. The azimuth-plane radiation pattern, shown
in figure (28), is nearly omnidirectional but the direction o f the pattern maximum is seen
tilted by about 12® from the Y-axis (azimuth angle* =90°). This radiation pattern resulted
Page -56-
from the dimension o f the loop (a wavelength circumference) as w ell as its proxim ity to the
grouad plane. B u i since the roo f is o f fin ite dimensions and in practice w ill be only slightly
larger than the area occupied by the loop antenna, the radiation pattern o f such an antenna
w ill actually be directed to the sides (zenith angle 8 > ±90”) as well. As a consequence o f
this, the upward gain o f the loop antenna wiB be somewhat reduced. This effect is favourable
fo r M B C, as may be deduced from the performance o f the half-wave dipole shown in figures
(25) and (26), since greater volume o f useful sky w ill be illuminated. On the other hand,
directing the main beam vertically upward while reducing its height above the ground plane
is desirable in order to reduce the effect o f man-made noise (discussed in section 2.5.3).
However, as outlined in section 2.5.2, decreasing the spacing between the loop antenna and
the ground plane causes a rapid decrease o f the structure’ s input impedance. The antenna’s
input impedance needs to be matched when coupled to the M BC link. Thus, the height o f
the loop above the ground was established to allow a practical impedance transformation
4.3.2 Results predicted by METEOR for the square loop antenna
The performance o f this horizontally polarized square loop antenna in the meteor scatter
environment, compared w ith that o f the quarter-wave monopole described above, can be
viewed in figures (30) and (31).
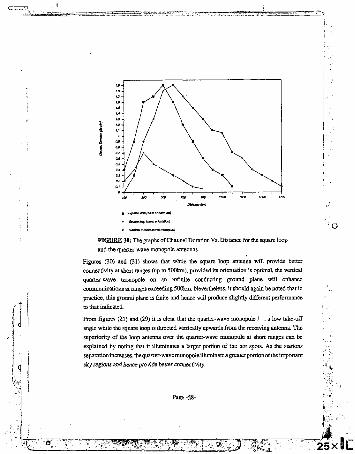
I
FTRIIRE jffl: The graphs o f Channel Duration Vs. Distance fo r the square loop
and the quarter-wave monopole antennas,
figures (30) and (31) shows that while the square loop antenna w ill provide better
connectivity at short ranges (up to 500km), piovided its orientation is optimal, the vertical
quarter-wave, monopole on an infin ite conducting ground plane w ill enhance
communications at ranges exceeding 500km. Nevertheless, i t should again be noted that in
practice, this ground plane is finite and hence w ill produce slightly different performance
to that indicated.
From figures (21) and (29) i t is clear that the quarter-wave monopole I . a low take-off
angle while the square loop is directed vertically upwards from the receiving antenna. The
superiority o f the loop antenna over the quarter-wave monopole at short ranges can be
explained by noting that i t illuminates a larger portion o f the hot spots. As the stations
separation increases, the quaier-wave monopoie illuminate a greater portion o f the important
sky regions and hence provide better connectivity.
Page -58-

loop and the quarter-wave monopole antennas.
Since the radiation pattern o f this square loop antenna is directed mainly at sky regions above
the receiving station, the effect o f illuminating these sky regions by the transmitting antenna
with higher gain was examined. For this purpose, the transmitting 5 elements Yagi-Uda
antenna which thus far was directed at the link mid-point (height 95km) was aimed at the
linkend-poiat (height 95km above the receiving square loop antenna). The results, as shown
in figures (32) and (33), indicate that these two types o f illumination schemes produce almost
identical results. I t can therefore be concluded that there is no advantage in illuminating the
end-path when using these antenna. The idea o f end-path illumination using differert
antennas should, however, be further investigated.

I A
■ M»fia»fMariHeKn| f M&pacnfKitttsriKXtt&V
o e»flam foesi ortenestoy A Cnd-Mto/worefortOTBifiyy
antenna w ith the transmitting Yagi-Uda antenna illuminating the mid-point and
end-point o f the link.
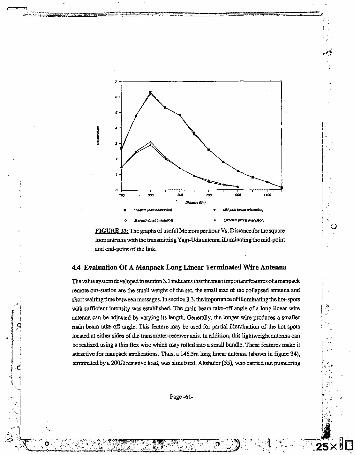
e ««*a» (Ben eiemeWm)
FIG U R E The graphs o f useful Meteors per hour Vs. Distance fo r the square
loop antenna with the transmitting Yagi-Uda antenna iUmninating"the mid-point
and end-point o f the link.
4.4 Evaluation Of A Manpack Long Linear Terminated Wire Antenna
The value system developedin section 3.1 indicates thatthemost important features o f amanpack
remote out-station are the small weight o f the set, the small size o f the collapsed antenna and
shcm waiting time between messages. In section3.3, the importance o f iUuminating the hot-spots
with sufficient intensity was established. The main beam take-off angle o f a long linear wire
antenna can be adjusted by varying its length. Generally, the longer wire produces a smaller
main beam take-off angle. This feature may be used fo r partial illumination o f the hot spots located at either sides o f the transmitter-receiver axis. In addition, this lightweight antenna can
be realized using a thin flex wire which may rolled into a small bundle. These features make it
attractive fo r manpack applications. Thus, a 146.5m long linear antenna (shown in figure 34),
terminated by a 200n resistive load, was simulated. Altshuler {55], who carried out pioneering

on resistively loaded, wire antennas showed that the insertion o f a suitable resistance one
r o f a wavelength from the end o f the monqpole effectively terminates die antenna
itry by its characteristic impedance. Hence a travelling wave current distribution is
ced between the source and the termination.
___________________ ns.5m____________________________t.5m r .
F IG U R E 34: A long linear terminated wire antenna.
4.4.1 Radiation pattern of the long linear terminated wire
The length o f this a?, tenna was chosen to be 146.5m so itcan radiate withanarrowbeamwidth
and high gain at about 10® to the sides o f the transmitter-receiver axis, enabling partial
illumination o f the hot spots. A t short ranges the antenna was tilted to higher take-off angles
fo r optimum illumination. The long wire antenna shown in figure (34), when placed at a
height o f 2m above and parallel to an infinite conducting ground plane, has radiation pattern
as indicated in figures (35) and (36).

= 1 ^
FIG U R E 35; The azimuth-piane radiation pattern o f the long linear
(terminated) antenna sliced at zenith angle 9=80° as computed by NEC2 [12].
: /
F IG U R E 36: The elevation-plane radiation pattern o f the long linear
(terminated) antenna. Maximum forward gain: 12dBi as evaluated by NEC2
[12].
Radiation patterns w ill not be presented fo r the various t i lt angles, but are similar to the one
shown above with somewhat increased gain. The correct orientation o f this travelling wave
antenna can be achieved by the use o f a balloon and ropes to control its elevation angle and
direction.

4.4.2 Results predicted by METEOR for the long terminated wire antenna
The performances o f this long wire antenna is compared w ith the 5 elements Yagi-Uda
antenna (pointed to mid-path) and the half-wave dipole described before. These results are
presented in figures (37) and (38).
For channel duration, the optimum stations separation is about 1000km for the long wire
antenna and about 1300km fo r the Yagi-Uda antenna. Fo r meteor count (or average waiting
time), the optimum range is about 1000km fo r the long wire antenna, and about 1100km for
the Yagi-Uda antenna. Optimum illumination o f the hot spots is d ifficu lt to achieve w ith
the long wire antenna due to ground effects and multiple nulls. Therefore, the curves
presenting the results fo r the long w ire antenna are not smooth.
1i
F IG U R E 37: The graphs o f Channel Duration Vs. Distance for the long
(terminated) wire, 5 elements Yagi-Uda and half-wave dipole antennas.
MianceimV
I Hattnvefl̂ oronofflWto«MAw«nsmSieferis»i6seeaaei • ^StienwiByagUtolitoespece

FTfrTJRE 38: The graphs o f useful Meteors per hour Vs. Distance fo r the long
(terminated) wire, 5 elements Yagi-Uda and half-wave dipole antennas.
These results clearly indicate the importance o f the antenna's gain and illumination pattern.
The Yagi-Uda and the long wire antennas have maximum forward gains o f comparable
magnitude. The main beam produced by the Yagi-Uda antenna, however, is much wider
than that produced by the long wire antenna. Hence, larger portion o f useful sky regions can
be i l luminated by the Yagi-Uda antenna which results in improved connectivity. On the
other hand, the half-wave dipole antenna’ s beamwidth is comparable to that produced by
the Yagi-Uda antenna, but with much reduced gain. Thus using the dipole antenna results
in poorer connectivity titan can be achieved when using the Yagi-Uda and the long wire
antennas.

4.5 Summary Of Results
The take-off angle required fo r mid-path illumination at 100km station separation is about 59°.
This angle decreases as the distance between stations increases. The elevation-plane radiation
pattern o f the half-wave dipole in free space is constant in the ZY-plane (see figure (20)).
Simiiariy, the azimuth-plane radiation pattern o f die vertical monopole is constant at any
elevation angle (see figure (21)). Thus, as seen in figures (20) and (21), at short ranges the
half-wave dipole antenna provides better illumination o f useful sky regions than the
quarter-wave monopole antenna. As the station separation increases, the illumination pattern
produced by the monopole antenna w ill cover a greater portion o f useful sky regions with
improved gain. In fact, using the illumination pattern and gain argument, at large distances the
mrnopole antenna would be expected to provide with improved connectivity to that which may
be achieved w ith the dipole antenna. However, theoretical results (presented in figures (25) and
(26)) indicate that the half-wave dipole provide w ith better connectivity at all distances. This
may be explained by the effect o f antenna polarization on M BC performance. As discussed in
section 2.3 and pointed out in section 4.2.2, a horizontally polarized antenna performs better
than 4 vertically polarized antenna in the meteor scatter environment
The half-wave dipole antenna, modelled in free space, was included in this investigation as a
reference antenna. The square loop and the monopole antennas were considered to be suitable
fo r mobile applications. The radiation pattern produced by the square loop antenna is directed
vertically upwards, with high gain, to illuminate mainly sky regions above the receiving station
(as shown in figure (29)). A t short ranges (up to 300km) this loop antenna performs better than
the half-wave dipole (as can be seen when comparing figures (30) and (31) to (25) and (26)).
As the station separation increases, the connectivity achieved w ith the square loop antenna is
rapidly degraded below that which may be achieved using a quarter-wave monopole. This is
due to the feet that i t illuminates smaller portions o f useful sky regions as the station separation
increases. However, as pointed out before, in practice this loop antenna w ill be place above a
finite conducting plane. As a consequence, i t is expected to illuminate a larger volume o f sky
at the expense o f reduced upward gain and thereby offer improved connectivity.
As shown in figures (37) and (38), much improved connectivity can he achieved w ith a long
wire manpack antenna compare to that which can be realized using mobile antennas. This is
due to the requirements differences in the value systems (discussed in section 3.1) established
Page -66-

fo r the remote mobile and manpack antei na systems in tom s o f priority and weighting. While
fo r mobile applications the emphasise Liu the reduced height, size and the TUggedness o f the
antenna, fo r manpack applications i t is only important to have a rugged and small size collapsed
aatenna.

5 CONCLUSIONS
In a given point-to-point link, the success o f meteor scatter communication is largely dependent on
the antenna system. Thus, base station as w ell as out-stadon antennas need to be consideredin this
respect The w ork presented in this dissertation, however, is concerned only w ith the investigation
o f simple out-station antennas which are suitable fo r mobih and manpack applications.
5.1 Summary Of Findings And Conclusions
5.1.1 Antennas for MBC
The basic concepts o f MBC, introduced in chapter 2, underlines the importance o f the role
played by the antenna system in the meteor scatter environment. Directional properties arc
exhibited by the geometry o f the link, the reflection mechanisms o f meteor scatter
propagation; and the dependence o f trail detection on the illumination o f certain sky regions.
These directional properties are directly related to the antenna system employed. Hence, the
antenna’s polarization, radiation pattern, gain and attitude effects the performance o f the
M BC link. To maximize throughput, all regions o f sky which contribute to M BC should be
illuminated w ith high gain antennas.
5.1.2 Antenna design considerations
A logical extension was therefore to examine the principle factors governing the behaviour
o f simple antennas and the effect o f noise on the system. The requirement o f simple antenna
systems inevitably results j i M BC systems o f degraded performance due to their reduced
size and complexity. The onus is thus placed on the directional master station to provide
adequate illumination ofsky regions connectiugremote stations. Theeffeaof noise onMBC
links is to decrease the number o f detectable1 rails as well as the usable signal duration, since
signal duration is determined by the period during which the signal-to-ncdse ratio is above
some predefined l im it Unfortunately, noise cannot be completely eliminated, but its
introduction via the antetmc’ s beam ran be reduced.
Simpje antennas are generally defined in this dissertation as those complying w ith severe
size and complexity limitations. However, a simple antenna suitable fo r mobile applications
differs from that which is suitable fo r a manpack or any other application.
In chapter 3, the value systems fo r the remote environments o f interest are formulated. The
value systems enumerate all that is necessary to ensure test value fo r money in terms of
priority and weighting in the antenna design phase. I t furnishes a concise specification o f
the antenna required fo r any specific application.
Knowing what sort o f antennas are required paves the way fo r their synthesis, evaluation
and the prediction o f their effect on M BC link performance. In chapter 3 the computer aided
antenna analysis tool, NEC2, which is incorporated within the MBCpredictive model code,
METEOR, is described. These computer based codes, as well as the value systems derived
for manpack and mobile applications, are used as engineering tools in the investigation o f
simple out-station antennas fo r M BC (outlined in chapter 4). But before particular designs
o f antennas were appraised in the meteor scatter environment, i t was important to establish
the effect o f different types o f sky illumination schemes on M BC l in k performance. This
information, as generalized as i t may be, is vital for the design o f any antenna fo r M B C
Hence, a clear categorisation o f the link type is furnished in terms o f its illumination capability.
For this investigation o f the relationships between antenna beamwidth/gain and orientation
to the M BC link performance, idealized radiation patterns were synthesized. These ideal
patterns were used in the simulation o f different illumination schemes. Theresults, presented
in chapter 3, support what is already deduced from the theory (in chapter 2) w ith regard to
the importance o f the master station illumination when simple out-station antennas are used.
While simple out-station mobile antennas may be o f limited directionality, a directional base
station concentrating its radiated power on those regions o f sky which contribute most to
the duty cycle o f an MBC link (the "hot spots") w ill result in dramatic l ink improvement
Best connectivity is achieved when both ends o f the link direct their beams at the hot spots, but this requires complex antennas at the two ends. For each type o f illumination scheme
there is a nade-off between beamwidth (which is related to the antenna’ s gain) and
throughput Reducing the antenna’s beamwidth (while increasing its gain) results in the

illumination v f ̂ reduced volume o f sky with increased intensity. Up to a certain beam width
(which if, l in k dependent) this effect improves the throughput Beyond that point, further
reduction o f the beamwidth w ill degrade the throughput
The indicated optimum master station antenna illumination is not unrealistic since an array
o f 8 Yagi-Uda antennas with 5 elements each produces approximately 21dBi gain. For
networking applications, though, steerable arrays or other versatile solutions should be
sought However, antenna design fo r master stations is outside the scope o f this work.
5.13 Simple antennas in the meteor scatter environment
In chapter 4, the electrical performance o f simple antennas was evaluated using the NEC2
code. The resulting radiation patterns o f these antennas were, used to predict, using the
prediction software M P ^ O R , the effect o f these simple antennas on M BC link throughput
fo r station separation iv .p n g from 100km to 2000km. Both optimum antenna beaming as
well as worst case beaming was used in this evaluation.
The purpose o f this investigation was to establish bench -mark performance guide fo r MBC
links using simple out-station antennas with emphasis on mobile andmanpack applications.
The relative performance o f M BC links employing three traditional antennas were evaluated
in addition to particular designs fo r mobile and manpack applications. The traditional
antennas chosen were the half-wave dipole, the quarter-wave monopole and a 5 element
Yagi-Uda antennas. For mobile and manpack applications, a square loop and a long wire
antenna wns designed and evaluated respectively.
The quarter-wave monopole and the square loop are practical mobile antennas. Theoretical
results indicate that at short ranges (up to about 500km) the square loop antomta w ill offer
improved connectivity. Owing to the inability o f the loop antenna to illuminate sufficient
useful sky regions at larger station separation, the quarter-wave monopole w ill enhance
communications. Both antennas, however, are modelled on an infin ite conducting ground
plane. In practice, the ground plane is finite and hence slightly different performance to that
indicated is expected. The effect o f mounting the square loop above a finite conducting
plane (such as the roof o f a truck) w ill be to 12!.',ruinate a larger volume o f sky at the expense
o f upward gain. This should effectively improve communications as range increases since
Page -70-
more sky regions w ill be illuminated. The effect o f afin ite conducting plane on the monopole
antenna is to reduce its forward gain and thereby degrade die overall performance o f the
Considerably improved throughput can be achieved with a long w ire manpack antenna
compare to that which is attainable using the mobile antennas described- This is due to the
differences in the requirements indicated in the value systems established fo r remote mobile
end manpack antenna systems. While fo r mobile applications the emphasis is on the teduced
height, size and the ruggedness o f the antenna, fo r manpack use i t is only important to have
a lightweight, rugged and small size collapsed antenna. In fact, for manpack applications the entire communication setmustbelightweight as ithas to be carriedonone’ sback. Mobile
stations are not constrained by weight and hence their transmit power capability can be
increased to enhance throughput The improved performance o f the manpack antenna thus
compensates fo r power restrictions on the manpack out-station.
5.2 Proposal For Further Investigation
The wmkpresentedin this dissertation is limited to the theoretical investigation o f simple meteor
scatter out-station antennas. The theoretical results obtained by performing computer
simulations o f physical systems are only as reliable as their mathematical approximations,
coupled w ith the constraints imposed by the numerical limitations. I t is recommended that the
theoretical results obtained be validated by measurements. However, in terms o f the statement
o f the problem set to be examined in this dissertation, the effect o f different illumination schemes
on M BC lin k performance is established. Different illumination schemes may be dictated for
different links such as mobile-to-mobile, manpack-to-manpack, mobile-to-base station,
manpack-to-base station etc. Nevertheless, the relative performance associated w ith these
schemes fo r M BC are indicated. In addition, designs o f simple antennas can be assessed with
reference to the bench-mark results presented here.
I t is envisaged that subsequent work w ill concentrate on validation o f the theoretical results by
measurements o f simple antennas and M BC link performance. Due to the importance o f the
master station discussed previously, further work should be carried out on their design and
evaluation. Validation o f theoretical results w ill provide the confidence needed to ensure that
these form a solid base for further design.
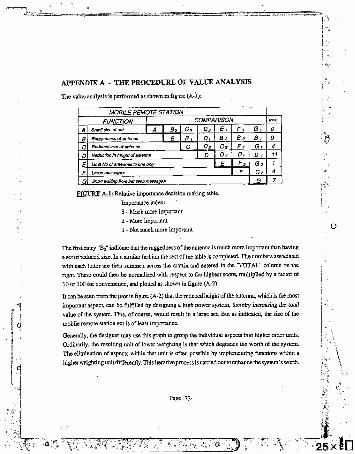
A P P E N D IX A - T H E P R O C E D U R E O F V A L U E A N A L Y S IS
The vain'; analysis is performed as shown in f ig ire (A-).):
MOB/L£ REMOTE STATION
FUNCTION COMPARISON
Small she o> sat S3 c * Ds E , F i G iRuggedness 0f antenna 8 , D , B 2 B S 6 ,Reduced size of antenna D? C * F t GrReduction in height of antenna D 03 D , D ,
Limit No of antennas to one only F p Gs
Laroe messages GsShort waiting time between messages G
Importance index:
3 - Much more important
2 - More important 1 - Not much more important
The firs t entry "B3" indicate that the ruggedness o f the antenna is much more important than having
a set o f reduced size. In a similar fashion the rest o f the table is completed. The numbers associated
w ith each letter are then summed across the matrix and entered in the "TO TAL" column on the
r ig h t These could then be normalized w ith respect to thu highest score, multiplied by a factor o f
10 or 100 fo r convenience, and plotted as shown in figure (A-2)
I t can be seen from the p lo t in figure (A-2) that the reduced height o f the antenna, which is the most
important aspect, can be fu lfilled by designing a high power system, thereby increasing the total
value o f the system. This, o f course, would result in a large set But as indicated, the size o f the
mobile remote station set is o f least importance.
Generally, the designer may use this graph to group the individual aspects into higher order units.
Ordinarily, the resulting unit o f lower weighting is that which degrades the worth o f the system.
The elimination o f aspects within that unit is often possible by implementing functions w ithin a
higher weighting unit differently. This iterative process is carried out to enhance the system’s worth.

>■
FUNCTION
FIGURE A -2: A graphical view o f the relative importance fo r a mobile remote
oul-station antenna system.
Finally, any design o f a system can be evaluated on the basis o f how well the requirements, laid
down by the value system, are fu lfilled using a rating system as shown in figure (A-3) <f
F IGURE A-3: A rating system fo r any specific design.
2 5 x l l l
The normalized weight o f importance values corresponds to those presented in figure (A-2). Any
designed system can then be rated on the basis o f the individual aspects. The compound rating o f
each functional aspect is the multiplication o f the normalized weight o f importance o f each aspect
by the rating o f the implementation o f that functional aspect Clearly, the higher total score o f the
compound rating indicates a better design.
Page -74-

APPENDIX B ■ THEORY AND IMPLEMENTATIONS OF THE METHOD OF MOMENTS
The Method o f Moments is a technique used fo r the simulation o f antennas. This technique, which
solves Maxwell's equations numerically fo r cylindrical wire structures and surfaces, is reviewed in [12]. This technique is in general applicable to conducting bodies with current distribution, J, as
shown in figure (B -l) . O f particular interest is the current distribution along a thin wire as shown
in figure (B-2).
OBSBPVATION POINT
FIGURE B - l; General radiating body.
FIGURE B-2: A th in cylindrical wire.
Assuming the w ire radius to be much smaller than the wavelength implies that current flows axially
only. A t the surface o f the conducting wire, the electric f ield boundary condition states that the
tangential fie ld component is zero. That is:
% + % - C (B"1)
where Ez is the tangential component o f the scattered electric fie ld radiated by J, and E% is the
tangential incident (or impressed) component o f the electric fie ld due to some source o f excitation.
I t can be shown (56) that Pockiington equation may be written as:
IGZf) denotes the current
[3 = cWjie is the phase constantCKZ.Z-) is the free space Green’s function given by:
$ ( Z ,Z ) =(B-3)
where R is the distance between the two points (X ,Y ,Z ) and (X '.Y '.Z ) given b y :
R i= V (X —X')24-(Y—Y')2 + ( Z -Z )2 ^
For s im plid ly, equation (B-2) may be written as:
-Ei-J^KZjKCZ.ZMZ (B'5)
The solution obtained fo r I(Z ) is obtained by using the Method o f Moments as follows:
Consider the approximation o f the current by a series o f expansion functions, FB, such that:
(B"6>
Page -76-
where y s are complex expansion coefficients.
For simplicity, consider a set o f pulse functions:
Fb = 1 fw Z 'e A Z C
= 0 elsewhere
where the wire is divided into N segments o f length A Z,. Thus on substitution into equation (B-5):
J ^ F .c z ' jK & .z V z (B"S)
where m indicates that the integral equation is being enforced at m. T h i
- 4 K . ) a | i I . ^ K ( Z i . z V Z (B‘9)
Defining:
f ( Z . . * - J az.K(Z..Z')dZ (B~im
Which in general can be written as:

Equation (B-12) has N unknowns. We therefore require N such equations fo r a solution to be
acquired. This c m be achieved by enforcing the integral equation at N points on the wire. This
process is called "Point Matching" which is a special case o f the Method o f Moments.
i Z f c j i y = r v j
Pm.J M =
I . f (Z ,.Z ,) ^ . Z z )
i , f ( z 2,z ;) i . % . 4
t v j *
- % )
Therefore:
L
where:
[ y i s a column vector o f generalized currents.
[Z ^ J is a matrix o f generalized impedances.
[V J is a column vector o f generalized voltages.
Clearly, this derivation assumes only a single wire on the Z-axis, but could be extended to arbitrarily
orientated wires interacting with each other. The special case o f Point Matching can be viewed as
a relaxation o f the boundary conditions such that i t is only satisfied at a specific p o in t In between
these points we can only hope that the boundary conditions are not so badly violated that the solution
is not useful.
The more general method is derived by considering the so called "Residual” , R(Z), as:
This equation evaluated at Z = Z„ gives the residual R(ZJ at the n6 point where i t must clearly be
zero. However, at other points the residual electric field may not be zero. In the method o f weigh ted
residuals, the current are found such that R(Z) is forced to be zero in the average sense, by means
o f weighted functions W ro(Z). i.e.:
R (Z )= % + %
Clearly, we wish R(Z) to be zero in order to satisfy boundary conditions. Hence:
R (Z )= i ^ f C Z X H E ^ Z )
Jwm(Z)R(Z)dZ = 0 (B-17)
Hence, substituting fo r R(Z), we can write the integral equation as:
£ ^W JZ ) I ! Inf(2 ,2; )d 2+ J^W ni(Z)4(Z)dZ = 0
I f we use impulse weighting functions:
W B(Z) = 8 (2 -2 ^ ) (B-19)
Page -79-

w ith pulse testing functions where 8 (2 -2 * ) are the Dirac-delta functions, then substitution into
equation (B-18) yields:
B k z y (B"20>
which is the special case o f Point Matching as shown above. However, i f alternatively we define
Wmtobe pulse functions:
W B= 1 f o r Z e A Z * (B-21)
= 0 elsewhere
w ith pulse testing functions, then we obtain what is known as a "Galetkin Method", i.e.:
i ^ z . o <B"22)
The Method o f Moments is therefore equivalent to the method o f weighted residuals anti the choice
o f expansion and weighting functions ultimately determines the value o f the specific method.
NEC2 utilizes the Pocklington integral equation fo r currents on thin wires. NEC2 analysis is carried
out using the "point matching" Method o f Moments technique which uses the Dirac delta functions
as weighting functions and a three term function fo r test functions. These three warns consist o f the
sum o f a Sine, Cosine and a constant term. In the Method o f Moments computer time is proportional
to the third power o f the number o f segments thereby lim iting die possible size o f structures that
may be analysed.
Page-80-

APPENDIX C - NUMERICAL MODELLING CONSTRAINTS AND LIMITATIONS
Tbe mathematical modelling o f the antenna and its environment is the most important aspect o f
simulation where accurate results o f performance are desired. This together with the constraints
and lim itations o f the particular method o f analysis used, coupled w ith the computer capabilities
determines the accuracy o f the evaluation.
The Method o f Moments, presented in Appendix B, assumes all wires to have a radius which is
much smaller than the wavelength. This implies that current flows in the axial direction only since
die Method o f Moments does not iccount fo r circulating currents. As a result o f this the ratio of
wire ndms to wavelength, the ratio o f segments length to radius and the number of segments per
wavelength are parameters on which some lim it is imposed [12].
The effect o f mutual interaction between the antenna and its environment must not be overlooked.
A common environmental effect on antennas, especially at lower frequencies, is the earth above
which the structure is erected. Hansen [57] demonstrated the fo llow ing effect o f different ground
planes on the antennas performance : The effect o f power lost into an imperfect earth becomes indepent lent o f the height once the antenna is higher than about 0.2 wavelengths above groundlevei
This finding implies that antennas can be compared in terms o f structure efficiency onceit is erected
higher than G.2 wavelength above the earth.
Another important aspect in antenna modelling, especially for the purpose o f complex structure
simplification, is the effect o f the wire length. I t has been demonstrated by Fvizrie [55] that the
physical length o f a wire between discontinuities is retained as long as the aatyv between sections
does not exceed a certain l im it The validation o f this finding is illustrated in figure (C -l) [adapted
2romref. 58]. Figure (C-1) shows thcmodel on which simulation was perfurmed and the investigation
results o f the extent to which the wire length, rather than the dimensions measured in a straight line,
is the predominant factor in antenna performance.
For evaluation using the NEC2 code, a wire is defined by its radius and the coordinates o f its two
end points. The wore consists o f straight segments following its path in a piece-wise linear fashion.
Generally, a segment length should be less than 0.1 o f a wavelength and greater than 0.001 o f a
wavelength at the desired frequency o f analysis.

f/? , = 0.3
9 IN DEGREES
L The graph o f antenna resonant wavelength versus the angle w ith the
vertical, 0.
The Method o f Moments technique used considers only current flow in the axial direction on a
segment The acceptability o f these approximations is dependenton the wire radius such that unless
the ratio o f wire radius to wavelength is much less than 1/(2%), the validity o f these approximations
is not necessarily accurate.
The accuracy o f the numerical solution fo r axial currents is also dependent on the ratio o f segment
length to wire radius. This ratio must be greatf e than 8 in order to achieve errors o f less than I
percent, using the standard th in wire kernel, and may be as !,mall as 2, i f the extended thin wire
kernel is used.
Segments are treated as connected when the separation o f th r r ends i i less than 0.001 times the
length o f the shortest segment

Maintenance o f current continuity across wire junction presents another limitation since antennas
with short sections o f wire coupled to long ones require exceedingly large number o f segments to
be analysed [58]. Kubina'sruleof thumb states that "Theresmction on the relative length o f segments
that form a junction, require that these lengths be comparable w ithin a factor o f five" [59]. Further
more, the number o f wires joined at a single junction cannot exceed 30 due to a dimeosioa limitation
in the NEC2 code.
Kubina’s rule o f thumb, which can be viewed in conjunction with figure (C-2), states that the
restriction on the relative length o f segments that fonn a junction is given by:
A conducting surface is modelled by means o f multiple, small fla t surface patches corresponding
% segments used to model wires. The patches are specified such that they cover the entire surface
to be modelled. The parameters defining a surface patch are the cartesian coordinates o f the patch
centre, the component o f the outward directed unit normal vector and the patch area.
For accuracy o f results, a minimum o f 25 patches per square wavelength o f surface area should be
used and the maximum size o f an individual patch should not exceed 0.04 square wavelengths.
Since the division o f current between two overlapping segments or patches is indeterminate,
segments or patches may no? overlap.

Theradius o f tapered wires may not changedrasticallysincealarge radius change betweenconnected
segments may decrease accuracy. This rule particularly applies where the ratio o f segment length
to radius is small.
Asegmentmost exist at each poiat where anetwork connection or voltage source w ill be positioned.
Th.’s constraint is imposed so that voltage drop can be speciSed as a boundary condition.
F inally, the order in which the various cards are specified must obey some rules which are imperative
fo r a successful run o f the NEC2 code. Generally, the card deck begins w ith cards containing
comments made by the user. These are followed by geometry data cards specifying the geometry
oftheantennaandthereaftertheprogramcontrol cards, specifying electrical parameters and requests fo r the computation o f antenna characteristics.
The above does not araempt to cover ati the modeJJiog consnaints which are imposed by the NEC2
code but only to highlight a cross section o f them. This is carried out in the hope o f conveying the
complexity which is involved with structure modelling, such that meaningful evaluation results
may be obtained. Furthermore, numerical evaluation o f the performance o f antennas, using the
Method o f Moments would be nore erroneous when computing parameters such as input impedance
rather than integrated quantities such as efficiency, radiation panem or gain [59]. This is due to the
fact that the input impedance calculation is based on the absolute value o f current at the feed point.
Subsequent integration has a smoothing effect thus reducing the error. Hen :e, measured results
which compare well w ith the computed input impedance may serve as a good indication as to the
valid ity o f the numerical model employed.
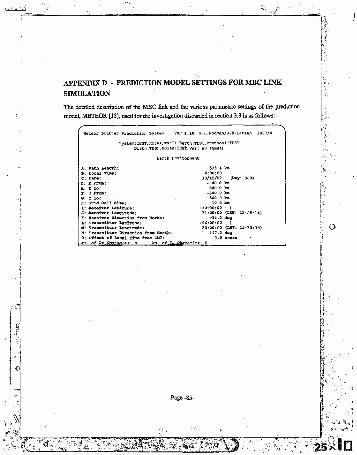
APPENDIX D - PREDICTION MODEL SETTINGS FOR MBC LINK SIMULATION
The detailed description o f the M BC link and the various parametric settings o f the prediction
model, METEOR [13], used fo r die investigation discarded in section 3.3 is as follows:
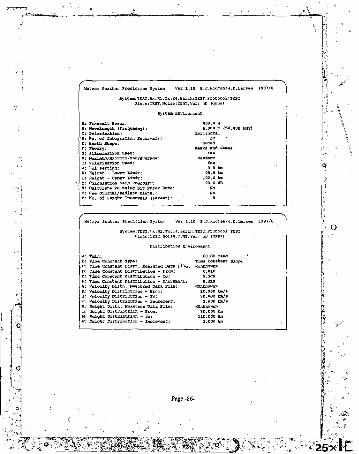
A
c
Page -86-
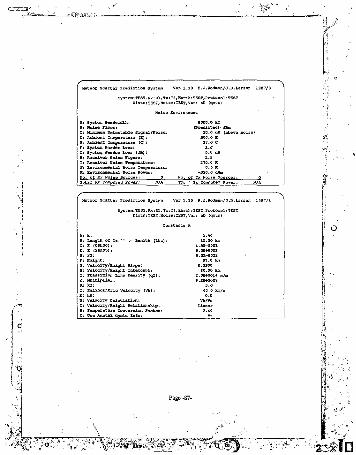
i
j

Big K Maltiplier:Bawkins' Badiaat Oi Initial Radius Effe
Benith Attraction Cutoff f Shower Computation;Shower Big K Multiplier: Shower Velocity Multipliei Initial Radius Effect (She trail Formation Effect (St Diffusion Effect (Showers) Psi m Effect (Showers) :
Apart fo r the geographical location o f the stations, the same settings were used fo r the simulations
outlined in chapter 4.
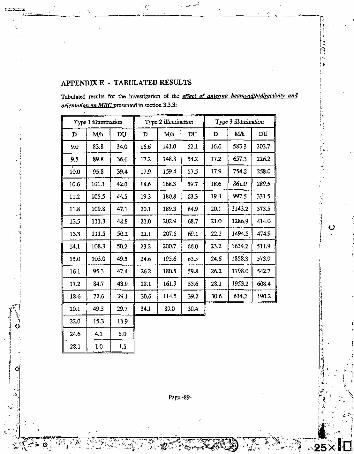
APPENDIX E - TABULATED RESULTS
Tabulated results fo r the investigation o f the
Type 1 illumination Type 2 illumination Type 3 illumination
DU M /h M /h
83.8 34.0 141j) 583.3
.9.5 89.8 36.6 148.8 17.2 657.3
ib.o 95.8 39.4 17.9 159.4 17.9 754.2 258.0
10.6 101.1 42.0 18.6 18.6 861.0 289.5
44.5 19.3 19.3 997.5 331.5
47.1 20.1 20.1 1143.2 373.5
48.8 21.0 1286.9 414.0
111.5 50.2 69.1 1494.5. 474.9
108.3 502 66.0 16342 511.9
103.0 49J 24.6 635 1858.3 573.9
95.3 47.4 26.2 1805 59.8 1798.0 542.7
84.7 43.9 161.9 53.6 28.1 1953.2 608.4
72.6 39.1 114.5 30.6 6342 1902
20.1 49.3 29.7 89.0
22.0 13.9
24.6 5.0
28.1 1.5
I

M d ssD = D irectivity (dBi).
M /b = Meteors per hour.
D U - Channel duration (Sec/hr).
Type 1 ,2 and 3 illuminations are as described in section 3.3.2.

Results fo r half-wave dipole, vertical q uaner-wave monopole and 45° skew quaner-w vae monopole
(section A 2 2 )
HWD QW M SWQM
Best Worst Best Best Worst
D M/h D U M/h DU M /h DU M/h DU M /h DU
100 0.1 0.2 0.1 0.1 0.1 0.2 0.1 0.2 0.1
200 2.3 0.5 0.5 0.1 1.4 0.3 1.5 0.3 1.4 0.3
5.3 1.5 O.f 0.2 3.4 0.9 3.4 0.9 0.8
7.9 3.0 0.4 0.1 3.8 1.3 3.7 1.3 1.1
500 12.0 5.6 0.3 0.1 4.4 1.8 4.0 1.7
600 14.6 8.2 0.3 0.1 3.8 1.9 3.4 1.7 1.4
700 15.9 10.7 0.2 0.1 3.0 1.7 2.6 1.5 1.3
16.1 12.6 0.1 QJ 2.3 1.5 2.0 1.3 1.1
900 15.2 13.7 1.8 1.3 1.8 1.3' 1.3 1.1
1000 13.5 13.9 1.3 1.1 1.4 1.1 0.9 0.7
1100 12.1 14.0 1.2 1.0 1.1 0.9 0.9 0.6
1200 8.8 11.7 0.7 0.7 0.7 0.6 0.6 0.5
1300 6.6 9.9 0.5 0.6 0.4 0.5 0.3 0.4
1400 4.5 7.5 0.3 0.4 0.2 0.3 0.2 0.3

SWQMHW D
M /h
600
HW D = Half-wave dipole.
Q W M = Quarter-wave monopole.
SQWM =45" skew quarter-wave monopole.
Best= Best orientation o f antenna.
W orst = Worst orientation o f antenna.
D = Stations separation (km).
M /b = Meteors per hour.
D U = Channel duration "'sc/hr).
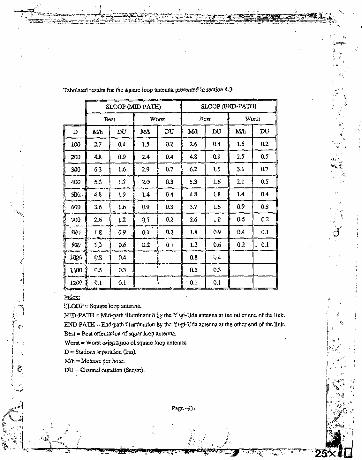
Tabulated results for the square loop antenna presented in section 4.3;
SLOOP (MID-PATH) SLOOP (END-PATH)
Best Worst Pest Worst
D M A D U W h D U M/h D U M /h DU
100 2.7 0.4 1.5 0.2 2.6 0.4 1.5 0.2
200 4.8 0.9 2.4 0.4 4.8 0.9 2.5 03
300 6.3 1.6 2.9 0.7 6.2 1.5 3.1 0.7
400 5 3 1.7 2.0 0.5 2.1
506 4.8 1.9 1.4 0.4 1.8
H so o 3.6 1.6 0.9 0.3 1.6
2.6 13 9,5 0.2 2.6 ..2 0.6 0.2
w , 1.8 0.9 . 03 0.1 1.8 0.9 0.4 0.1
I m ■ u 9.6 !L2 01 1.2 0.6 0.2 . 0.1
: iges 03 0.4 0.8. 0.4
i 1AO0 0 3 0.3 0.5 03
B̂11SSS«G=:<1.1 0.1 0.1
("LOOP - Square loop anteitna.
M ID -PATH = Mid-path illumination by the Y/g i-U da antenna at the oilier end o f the link.
END-PA1H = End-path ilkttoiiiation fey the Yngi-Uda antenna at the other end of the link.
Best = Best orientation o f squSrlKip antenna.
Worst = Worst o f square loop antem fl..
D = Stations sepssadon (km).M /h = Meteors per hour.
D U = Channel duration (Sec/hr).

Tabulated results for the Yagj-Uda and long wire (iensmated) antennas pr 1 seated in section 4.4:
LONG-W IRE YAGI-U DA 1
D M /h DU W H DU
100 1.7 0.3 4.7 0.7
200 0.9 11.0 2 2
300 3.5 24.7 6.7
400 9.6 44.0 15.1
500 17.1 68.3
600 642 2A6 91.2
700 77.0 41.3. 111.8 62.7
1 800 79.8 46.1 128.4 81.1
900 85.6 613 139.9 98.3
1000 88.9 70.3 147.1 113.5
1100 80.0 62.6 149.7 125.8
1200 71.6 60.7 145.5 133.0
1300 61.5 56.4 134.0 133.9
1400 49.3 49.0 216.8 127.4
1500 34.9 37.6 89.8 104.8
d e ro f table on next page...

l o n g -w ir e YAGI u d a |
M/h DU M /h DU |
| 1600 18.4 22.0 66.6 86.9 JI 1700 12.0 48.9 68.9 |
1 1800 7.5 32.0 48.9 |
| 1900 2.2 3.2 19.5 322
| 2000 0.3 0.6 10.5 18.8 |
LONG-W ISE = Long w ire (terminated) antenna.
YA G I-U DA = Yagi- Uda antenna.
D = Stations separation (km).
M /h = Meteors per hour.D U = Channel duration (Sec/hr).
Zenith-plane radiation pattern o f the 5-elements Yagi-Uda antenna.
ANGLES DIRECTIVE GAIN |
| Theta Phi Vertical Horizontal Total |
Degrees Degrees dB dB I
0 90 -99.31 -1.46 1
4 90 -99.33 -2.31 -2.31 |
8 90 -99.39 -3.69 -3.69 J
I 12 90 -99.49 -5.9 -5.9 1
I 16 90 -99.64 -9.52 -9.52 1
1 2090 -99.83. -15.34 -15.34 |
1 24 90 -100.06 -13.11 -13.11 |
1 28 90 -100.35 -6.92 -6.92 |
1 32 90 -100.69 -2.89 -2.89 |
1 36 90 -101.1 -0.04 -0.04 |
1 40 90 -101.56 2.11 2.11 I
1 44-102.1 3.8 3.8 1
1 48 90 -102.72 5.16 5.16 j
1 52 90 -103.44 626 6.26 |
1 56 90 -104.27 7.16 7-.16 j1 60 90 -105.24 7.9 7.9 I]1 64 90 -106.38 8.5 8.5 1
| 68 -107.75 8.99 8.99 |
1 72 -209.42 9.37 9.37 |
76 90 -111.54 9.66 9.66
j 80 90 -114.42 9.87 9.87 I
1 84 90 -118.83 10.01 10.01 j
88 90 -128.36 10.08 10.08
92 90 -128.36 10.08 10.08
96 90 -118.83 10.01 10.01
100 90 -114.42 9.87 9.87
104 90 -111.54 9.66 9.66
108 90 -109.42 9.37 9.37 |
112 90 -107.75 8.99 8.99 |
1 116 90 -106.38 8.5 8.5 ]
. 120 90 -105.24 7.9 7.9 |
1 124 90 -104.27 7.16 7.16
128 90 -103.44 6.26 6.26
132 90 -102.72 5.16 5.16
136 90 -102.1 3.8 3.8 |
140 90 -101.56 2-11 2.11 J
I” 144 90 -101.09 -0.04 -0.04
1 148 90 -100.69 -2.89 -2.89
S 152 90 -100.35 -6.92 -6.92 |
1 156 90 -100.06 -13.11 -13.11 |
160 90 -99.83 -15.34 -15.34 [
164 90 -99.64 -9.52 |
-16.99
-109.48
-106.44.
-100.36
-102.76
■100.71
-100.36
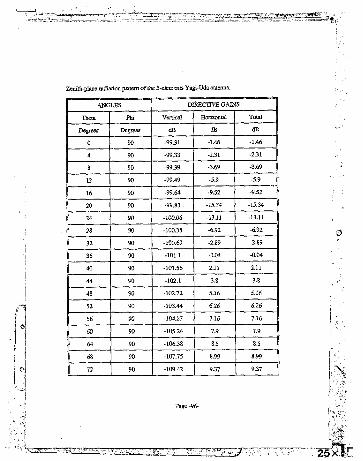
Zenith-plane radiation pattern o f the 5-elements Yagi-Uda antenna.
ANGLES DIRECTIVE GAINS ,
Theta PM Vertical Horizontal Total
Degrees Degrees dB dB
90 -99.31 -1.46 -1.46
4 90 -99.33 -2.31 -2.31
8 90 -99.39 -3.69 -3.69 1
12 90 -99.49 -5.9 -5.9
16 90 -99.64 -9.52 -9.52
| 20 90 -99.83. -15.34 -15.34
| 24 90 -100.06 -13.11 -13.11
| 28 90 -100.35 -6.92 -6.92
| 32 90 -100.69 -2.89 -2.89
1 36 90 -101.1 -0.04 -0.04 |
1 40 90 -101.56 2.11 2.11
44 90 -102.1 3.8 3.8
48 90 -102.72 5.16 5.16
52 90 -103.44 6.26 6.26
56 90 -104.27 7.16 7.16 |
60 90 -105.24 7.9 7.9 |
1 64 90 -106.38 8.5 8.5
i 68 -107.75 8.99 8.99
72 -109.42 9.37 9.37
Page -96-
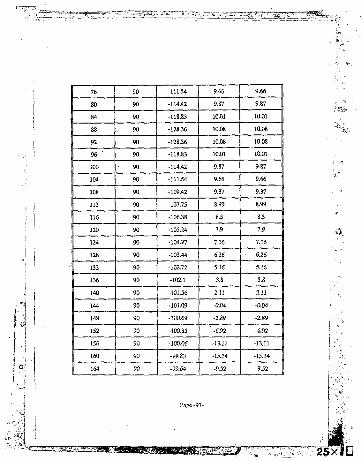
76 90 9.66 9.66
80 90 -114.42 9.87 9.87
S4 90 -118.83 10.01 10.01 1
1 88 90 -128.36 10.08 10.08 1
92 90 -128.36 10.08 10.08
96 90 -118.83 10.01 10.01
90 -114.42 9.87 9.87
104 90 -111.54 9.66 9.66
108 90 -109.42 9.37 9.37
112 90 -107.75 8.99 8.99
116 90 -106.38 8.5 8.5
120 90 -105.24 7.9 7.9
124 90 -104.27 7.16 7,16
128 90 -103.44 6.26 6.26
132 90 -102.72 5.16 5.16
136 90 -102.1 3.8 3.8
140 90 -101.56 2.11 2.11
144 90 -101.09 -0.04 -0.04
148 90 -100.69 -2.89 -2.89
152 90 -100.35 -6.92 -6.92
156 90 -100.06 -13.11 -13.11
160 90 -99.83 -15.34 -15.34
90 -99.64 -9-52 -9.52
Page-97-

1 168 90 -99.49 -5.9 -5.9
172 90 -99.39 -3.69 -3-69
[_ 176 90 -99.33 -2.31 -2.31
1 ISO 90 -99.31 -1.46 -1.46
184 90 -99.32 -1.02
188 90 -99.39 -0.88
192 90 -99.49 -1
| 196 90 -99.64 -1.32 -1.32
1 200 90 -99.83 -1.81 -1.81
| 204 90 -100.07 -2.44 -2.44
208 90 -100.36 -3.16 -3.16
212 90 -100.71 -3.96 -3.96
216 90 -101.12 -4.81 -4,81 |
220 90 -101.59 -5.68 -5.68 |
224 90 -102.13 -6.58 -6,58 |
228 90 -10 -76 -7.5 -7.5 |
232 90 -103.49 -8.47 -8.47 |
236 90 -104.32 -9.48 -9.48 |
240 90 -105.3 -30.56 -10.56 |
244 90 -106.44 -11.69 -11.69
1 248 90 -107.81 -12.88 -12.88
1 252 90 -109.48 -14.08 -14.08
1 256 90 -111.61 -15.23 -15.23 1

260 90 -Z 14.49 -16.24 -16.24
264 90 -118.9 -16.99 -16.99
268 90 -128.43 -17.4 -17.4
I 272 90 -128.43 -17.4 -17.4
| 276 90 -118.9 -16.99 -16.99
| 280 90 -114.49 -16.24 -16.24
284 90 -111.61 -15.23 -15.23
288 - 90 -109.48 -14.08 -14.08
j 292 90 -107.81 . -12.88
j 296 90 -106.44. -11.69 -11.69
| 300 90 -105.3 -10.56 -10.56
| 304 90 -104.32 -9.48 -9.48
| 308 90 -103.49 -8.47 -8.47
312 90 -102.76 -7.5 -7.5
316 90 -102.13 -6.58 -6.58
320 90 -101.59 -5.68 -5.68
324 90 -101.12 -4.81 -4.81
328 90 -100.71 -3.96 -3.96
332 90 -100.36 -3.16 -3.16
336 90 -100.07 -2.44 -2.44
| 340 90 -99.83 -1.81 -1.81
| ’ 344 90 -99.64 -1.32 -1.32
| 348 90 -99.49 -1 -1
Page -99-
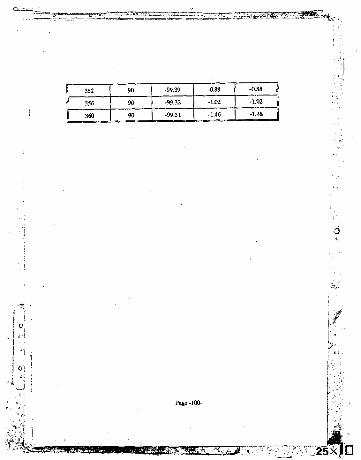
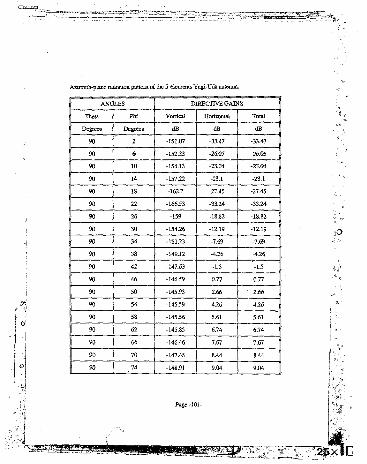
Azimuth-plane radianon pattern o f the 5-elements Yagi-Uda antenna.
| ANGLES DIRECTIVE GAINS
Theta Phi Vertical Horizontal Total
Degrees Degrees dB dB
90 -151.07 -33.47 -33.47
90 -15223 -26.05
90 -154.13 -23.04 -23.04
90 14 -157.22 -23.1 -23.1
90 18 -162.7 -27.45 -27.45
90 22 -166.53 -3324 -33.24
90 -159 -18.82 -18.82
90 -154.26 -12.19 -12.19
90 34 -151.23 -7.69 -7,69
90 38 -149.12 -4.26 -4.26
90 42 -147.63 -1.5 -15
90 46 -146.59 0.77
90 50 -145.93 2.66
90 54 -145.59 4.26 4.26
90 5.61 5.61
90 62 6.74 6.74
90 66 7.67 7.67
90 70 -147.45 8.44 8.44
90 74 -148.91 9.04 9.04

90 78 -151.05 93 9.5
j 90 82 -154.32 9.83 9.83
90 86 -160.2 10.02 10.02
90 90 -999.99 10.08 10.08
90 94 -1602 10.02 10.02
| 90 98 9.83 9.83
90 102 -151.05 9.5 9.5
90 106 -148.91 9.04
90 n o -147.45 8.44 8.44
90 114 -146.46. 7.67 7.67
90 118 -145.85 6.74 6.74
90 122 -145.56 5.61 5.61
90 126 - 145.59 4.26 4.26
90 130 -145.93 266 2.66
90 134 - 146.59 0.77 0.77
90 138 -147.63 -13 -13
90 , 142 -149.12 -4.26 -426
90 146 -151.23 -7.69 -7.69
90 -154.26 -1219 -12.19
90 154 -159 -18.82 -18.82
90 138 -166.53 -33.24 -33.24
90 162 -162.7 -27.44 -27.44
90 166 -15722 -23.1 -23.1

90 170 -154.13 -23.03
1 90 174 -152.23 -26.05 -26.05
90 178 -151.07 -33.47 -33.47
| vO 182 -150.4 -26.78 -26.78
90 -150.12 -20.33 -20.33
90 190 -150.16 -16.6 -16.6
90 194 -150.46 -14.18 -14.18
198 -150.98 - 12.56 -12J6
202 -151.7 -11.47 -11.47
90 206 -152.59 -10.77 -10.77
90 210 -153.61 -10.37 -10.37
90 214 -154.74 -10.19 -10.19
90 218 -155.95 -10.18 -10.18
90 222 -157.25 -10.32 -10.32
90 226 -10.57 -1057
90 230 -10.93 -1093
90 234 -11.4 -11.4
90 238 -11.97 -11.97
90 242 -165.38 -12.66 -12.66
90 246 -167.53 -13.46 -13.46
90 250 -169.95 -14.33 -14.33
90 254 -172.71 -15.23 -15.23
. _90 .258 •175.94 -16.08 -16.08
Page-103-

90 262 -180.04 -16.8
90 266 -186.44 -17.28
90 270 -999.99 -17.45
90 274 -186.43 -17.28
90 278 -180.04 -16.8
90 282 -175.93 -26.08
90 286 -172.7 -15.23 -15.23
90 290 -169.95 -14.33 -14.33
90 294 -167.53 -13.46 -13.46
90 298 -165.38 -12.66 -12.66
90 302 -163.44 -11.97 -11.97
| 90 306 -161.7 -11.4 -11.4
90 310 -160.1 -10.93 -10.93
90 314 -158.63 -10.57 -10.57
90 318 -157.25 - I d # -10.32
90 322 -155.95 -10.38 -10.18
90 326 -154.74 -10.19 -10.19
90 330 -153.61 -10.37 -10.37
90 334 -152.59 -10.77 -10.77
90 338 -151.7 -11.47 -11.47
90 342 -15098 -12.56 -12.56
9 0 ' 346 -150.46 -14.18 -14.18
350 -150.16 -16.6 -16.6
IIJ I " " V-

90 354 -150.12 -20.33 -20.33
90 358 -150.4 -26.78 -26.78
90 362 , -151.07 -33.47 -33.47

Azimuth-plane radiation pattern o f the half-wave dipole antenna in free space.
ANGLES DIRECTIVE GAINS
Theta Vertical Horizontal Total
Degrees Degrees dB
90 -29.24
90 6 -19.68 -19.68
90 10 -15.23 -1523
90 14 -147.41 -12.28 -1228
90 18 -147.5 -10.07 -10.07
90 22 -147.61 -8.3 -8.3
90 26 . -6.81 -6.81
90 30 -147.95 -5.54 -5.54
90 34 -148.19 -4.42 -4.42
90 38 -148.48 -3.43 -3.43
90 42 -148.83 -2.55 -2.55
90 46 , -149.26 -1.77 -1.77
90 50 -149.78 -1.07 -1.07
90 54 -150.4 -0.44 -0.44
90 58 -151.16 0.11 0.11
90 62 0.59 0.59
90 66 -153.2 1.01 1.01
90 70 -154.6 1.36 1.36
90 74 -156.39 1.65 1.65
Page -106-
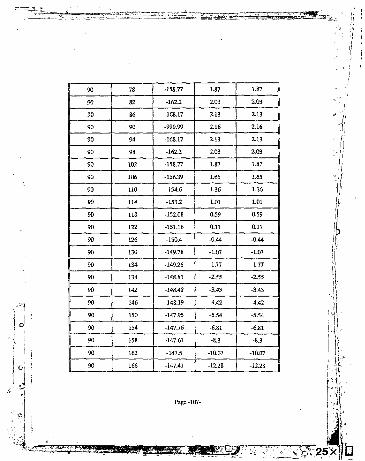
90 78 -156.77 1.87 1.87
90 82 -1622 2.03 2.03
86 -168.17 2.13
90 90 -999.99 2.16 2.16
90 -168.17 2.13
90 -162.2 2.03 2.03
90 -158.77 1.87 1.87
90 106 -156.39 1.65 1.65
90 n o -154.6 1.36 1.36
90 114 -153.2 1.01 1.01
90 -152.08 0.59 0.59
90 122 -151.16 0.11 0.11
90 126 -150.4 -0.44 -0.44
90 130 -149.78 -1.07 -1.07
90 134 -14926 -1.77 -1.77
90 -148.83 -2.55 -2.55
90 -148.48 -3.43 -3A3
90 -148.19 -4,42 -4.42
90 -147.95 -5J4
90 154 -147.76 -6.81 -6.81
90 158 -8.3 -8.3
90 162 -10.07 -10.07
90 166 -12.28 -12.28
Page -107-

170 -147.35 -15.23 -15.23 |
90 174 -147.31 -19.68 -19.68
90 178 -147.29 -29.24 -29.24
90 182 - 147.29 -29.24 -29.24
1 90 186 -14731 -19.68 -19.68
90 190 -147.35 -1533 -15.23
I 90 194 -1128 -12.28
| 90 198 -10.07 -10.07
90 202 -8.3 -8.3
90 206 -147.76. -6.81 -6.81
90 210 -147.95 -5.54 -5.54
90 214 -148.19 -4.42 -4.42
90 218 -148.48 -3.43 -3.43
90 222 -148.83 -2.55 -2.55
90 226 -149.26 -1.77 -1.77
90 230 -149.78 -1.07 -1.07
90 234 -0.44 -0.44
90 238 -151.16 0.11 a n
90 242 -152.08 0.59 0.59
90 246 -153.2 1.01 1.01
90 250 -154.6 1.36 1.36
90 254 -156.39 1.65 1.65
90 258 -158.77 1.87 1.87

90 262 -162.2 2.03 1
90 266 -168.17 2.13 2.13
90 270 -999.99 2.16 2.16
90 274 -168.17 2.13 2.13
90 278 -162.2 2.03 2.03
90 1.87 1.87
90 286 1.65 1.65
90 290 1.36 1.36
90 294 -153.2 1.01 1.01
90 298 -152.08 0.59 0.59
90 302 -151.16 0.11 0.11
90 306 -150.4 -0.44 -0.44
90 310 -149.78 -1.07 -1.07
90 314 -149.26 -1.77 -1.77
90 318 -148.83 -2.55 -2.55
90 322 -148.48 -3.43 -3.43
90 326 -148.19 -4.42 -4.42
90 330 -147.95 -5.54 -5.54
90 334 -147.76 -6.81 -6.81
90 338 -147.61 -8.3 -8.3
90 342 -10.07 -10.07
90 346 -147.41 -12.28 -12.28
90 350 -147.35 -15.23 -15.23 |
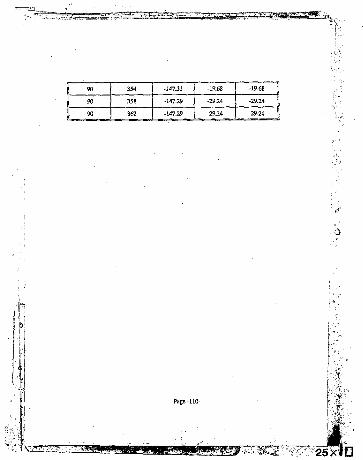
-347.31

Zenith-plane radiation pattern o f the vertical quarter-wave monopole on a perfectly conducting
infin ite ground plane.
| ANGLES DIRECTIVE GAINS
1 Theta Vertical Horizontal Total
Degrees Degrees dB dB
1 -90 90 5.16 -999.99 5.16
1 -88 90 5.15 -999.99 5.15
90 -999.99 5.13
90 5.09 -999.99
90 5.03 -999.99 5.03
-80 90 4.96 -999.99 4.96
-78 90 4.87 -999.99 4.87
-76 4.77 -999.99
90 4.65 -999.99 4.65
90 4.51 -999.99 4.51
-70 90 4.36 -999.99 4.36
-68 90 4.19 -999.99
-66 90 4 -999.99 4
-64 90 38 -999.99
-62 90 3.58 -999.99
-60 90 3.34 -999.99 3.34
-58 90 3.09 -999.99 3.09
-56 90 2.82 -999.99 2.82
-54 90 2.53 -999.99 2.53

-52 90 222 -999.99 222
-50 90 1.9 -999.99 1.9
| -48 90 1.56 -999.99 U 6
| -46 90 1.19 -999.99 1.19
[ -44 90 -999.99 0.81 |
-42 90 0.4 -999.99 0.4 |
-40 90 -0.03 -999.99 -0.03 |
-38 90 -0.49 -999.99 -0.49 |
-36 90 -0.97 -999.99 -0.97 |
-34 90 -1.48. -999.99 -1.48 |
-32 90 -2.02 -999.99 -2.02 j
-30 90 -2.6 -999.99 -2.6
-28 90 -3.22 -999.99 -3.22
| -26 90 -3.88 -999.99 -3.88 |
| -24 90 -4.6 -999.99 -4.6
-22 90 -5.37 -999.99 -5.37
-20 90 -6.22 -999.99 -6.22 |
-18 90 -7.15 -999.99 -7.15
-16 90 -8.19 -999.99 -8.19 |
-14 90 -9.37 -999.99 -9.37 |
90 -10.72 -999.99 -30.72
.10 90 -12.32 -999.99 -12.32
, 90 -14.26 -999.99 -1426
f-
" ' ' I I','': f ' gjxilEI

_ . . -90 -16.77 ■999.99 -16.77
-4 90 -20.3 -999.99 -20.3
-2 90 -26.32' -999.99 -26.32
i 0 90 -999.99 -999.99 -999.99
2 90 -26.32 ■999.99 -26.32
90 -20.3 -999.99 -20.3
6 90 -999.99 -16.77
8 90 -14.26 -999.99 -14.26
10 90 -12.32 -999.99 -12.32
12 90 -10.72. -999.99 -10.72
14 90 -9.37 -999.99 -9.37
16 90 4.19 -999.99 -8.19
18 90 -7.15 -999.99 -7J5
20 90 -6.22 -999.99 -6.22
22 90 -5.37 -999.99 -5.37
24 90 -4.6 -999.99 -4.6
26 90 -3.88 -999.99 -3.88
28 90 -3.22 -999.99 -3.22
30 90 -2.6 -999.99 -2.6
32 90 -2.02 -999.99 -2.02
34 90 -1.48 -999.99 -1.48
36 90 -0.97 -999.99 -0.97
38 90 -0.49 -999.99 -0.49
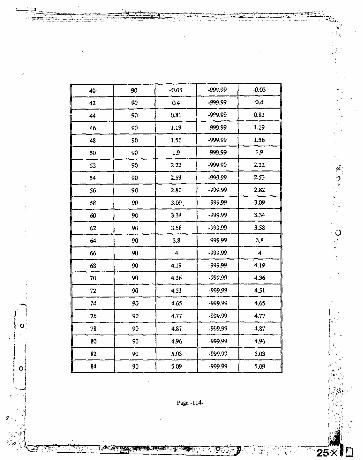
90 -0.03 -999.99 -0.03 |
90 0.4 -999.99 0.4 |
90 0.81 -9^9.99 0.81 |
90 1.19 -999.99 1.19
90 1.56 -999.99
50 90 -999.99
52 90 2.22 -999.99 2.22
54 2.53 -999.99 2.53
56 90 2.82 -999.99 2.82
58 90 , 3.09, -999.99 3.09
60 90 3.34 -999.99 3.34
62 90 3.58 -999.99 3.58
64 90 3.8 -999.99 3.8
66 90 4 -999.99 4
68 90 4.19 -999.99 4.19
70 90 4.36 -999.99 4.36
90 4.52 -999.99 4.51
90 -999.99 4.65
76 90 -999.99 4.77
78 90 4.87 -999.99 4.87
80 90 4.96 -999.99 4.96
82 90 5.03 -999.99 5.03
84 90 5.09 -999.99 5.09

0=3Z3„Z.. "
I 86 5.13 -999.99 5.13 |
1 88 90 5.15 -999,99 5.15 1
| 90 90 5.16 -999.99 5.16 |
-115-
p m
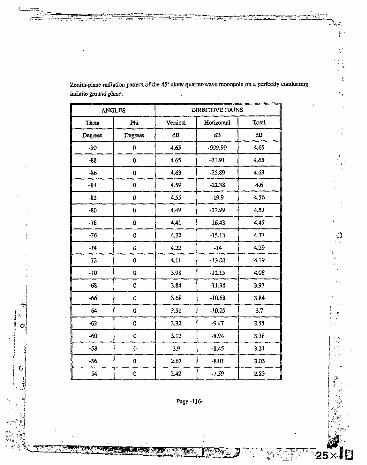
Zenith-plane radiation pattern o f the 45° skew quarter-wave monopole on a perfectly conducting
in fin ite ground plane.
ANGLES DIRECTIVE GAINS
Theta Phi Vertical Horizontal Total
Degrees dB dB dB
j -90 4.65 -999.99 4.65
-88 4.65 -31.91 4.65
-86 0 4.63 -25.89 4.63
I -84 0 439 -22.38 4.6
-82 0 4.55 -19.9 4.56
-80 4.49 -17.99 4.51
-78 4.41 -16.43 4.45
-76 4.32 -15.13
-74 4.22 -14 4.29
4.11 -13.02 •4.19
-70 3.98 -12.15 4.08
-68 3.84 -11.38 3.97
-66 3.68 - 10.68 3.84
•64 0 331 -10.05 3.7
-62 0 3.32 -9.47 3.55
-60 3.12 -8.94 3.38
-58 0 2.9 -8.45 3.21
-56 2.67 -8.01 3.03
-54 2.42 -7.59 2.83

-52 0 2.15 -7.21 2.63
-50 0 1.87 -6.86 2.42
-48 0 -6.53 2.19
-46 0 1.24 -6.23 1.96
-44 0.9 -5.95 1.72
0.54 -5.69 1X7
0.15 -5.45 , 1.2 :
-38 0 -0.27 -5.22 0.94
-36 0 -0.71 -5.01 0.66
-34 0 - U * . -4.82 0J 8
-1.68 -4.64 0.1
0 -4.48 -0.2
-28 -2.8 -4.33 -0,49
-26 -3.43 -4.2 -0.79
-24 -4.11 -4.07 -1.08
1 -22 -3.96 -1.37
-20 -5.67 -3.86 -1.66
-18 0 -6J 8 -3.77 -1.94
-16 0 -7.6 -3.69 -2.2
-14 -8.75 -3.62 -2.45
-12 -10.08 -3.55 -2.68
-10 -11.66 i -3.5 -2.89
, -3.46 -3.06
Page-117-
£>
%5X

0 -16.09 -3.43 -3.2
0 -19.61 -3.41 -3.31
0 -25.63 -339 -3.37
0 0 -999.99 -3.39 -3.39
Z 0 -25.63 -3.39 -3.37
4 0 -19.61 -141 -3.31
0 -16.09 -3.43 -3.2
0 -13.6 -3.46 -3.06
-3.5 -2.89
12 0 -10.08. -3.55 -2.68
14 j 0 -8.75 -3.62 -2.45
16 0 -7.6 -3.69 -22
-6.58 -3.77 -154
20 0 -5.67 -3.86 -1.66
22 0 -4.86 -3.96 -1.37
24 0 -4.11 -4.07 -1.08
26 0 -3.43 -4.2 -0.79
28 0 -2.8 -4.33 -0.49
30 0 -2.22 -4.48 -0.2
0 -1.68 -4.64 0.1
34 0 -1.18 -4.82 0.38
36 -0.71 -5.01 0.66
38 -0.27 -5.22 0.94 1

40 0 -5.45 1.21
42 0 0.54 -5.69 1.47
44 0 0.9 -5.95 1.72
46 1.24 -6.23 1.96
48 I S t -6.53 .2.19
50 1.87 •6.86 2.42
52 0 -7.21 2.63
2.42 -7.59 2.83
2.67 -8.01 3.03
, 58 2.9 . .8.45 321
<0 3.12 -8,94 3.38
62 0 3.32 -9.47 3.55
64 0 331 3-7
66 0 3.68 3.84
68 0 3.84 -11.38 3.97
70 0 3.98 -12.25 4.08
72 0 4.11 -13.02 4.19
74 0 4.22 -14 4.29
76 0 4.32 -15.13 4.37
78 0 4.41 -16.43 4.45
80 -17.99 4.51
82 0 -19.9 4.56
84 0 -22.38 4.6
Pagb-119-
4.63
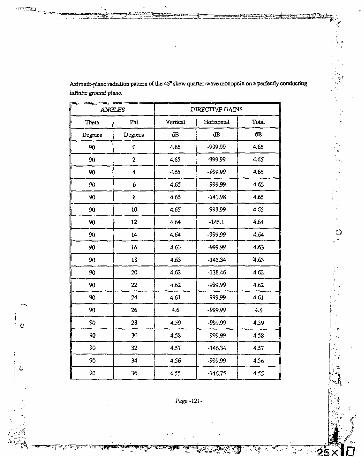
Azimuth-plane radiation pattern o f the 45° skew quarter-wave monopoie on a perfectly conducting
infin ite ground plane.
|— ANGLES
-999.99 4.65
-999.99 4.65
4.63
4.6
-999.99
-999.99
Page-121-
; asxiO

| 90 -999.99 4.54 |
| 90 40 -153.24 4.53
j 90 42 -153.51 4.52
j 90 44 -141.75 4.51
| 90 46 4.5 4.5
j 90 48 4.49 -154.42 4.49
90 50 4.48 -148.74 4.48
1 90 52 4.47 -149.12 4.47
| 90 4.46
90 -999.99 4.45
90 4.44 -156.44 4.44
90 4.43 -150.93 4.43
90 4.42 -151.47 4.42
90 64 -148.55 4.41
90 66 4.4 -158.74 4.4
90 68 4.39 -159.46 4.39
90 70 4.38 -154.23 4.38
90 4.38 -151.58 4.38
90 74 4.37 -153.09 4.37
90 76 4.36 -163.25 4.36
90 7: -999.99 4.36
90 80 -160.11 4.36
90 82 -162.04 4.35
J; Page-122-

1 90 84 4.35 -999.99 4.35
90 ' 86 4.35 -174.06 4.35
90 88 4.35 -180.07 4.35
90 90 4.35 -999.99 4.35
90 92 4.35 -180.07 4.35
90 94 4.35 -174.06 4.35
90 96 4.35 -999.99 4.35
90 98 4.35 -162.04 4.35
90 100 4.36 -160.11 4.36
90 4.36. -999.99 4.36
90 104 4.36 -163.25 4.36
90 106 4,37 -153.09 4.37
90 108 4.38 -151.58 4.38
90 110 4,38 -154.23 4.38
90 112 4.39 -159.46 4.39
90 114 -158.74
90 116 4.41 -148.55
90 118 442 -151.47 4.42
90 120 4.43 -147.92 4.43
90 4.44 -156.44 4.44
90 124 4,45 -155.98 4.45
90 126 4.46 -148.55 4.46
90 128 4.47 -149.12 4.47

130 4.48 -148.74 4.48
90 132 4.49 -999.99 4.49
90 134 4.5 -148.07 4.5
90 136 4.51 -146.8 4.51
1 % 138 4.52 -153.51
90 140 4.53 -147.22
1 90 4.54 -999.99 4.54
90 144 -146.75 4.55
90 146 4.56 -999.99 4.56
90 148 4.57 • -146.34 4.57
90 150 j 4.58 -146.16 4.58
90 152 4.59 -999.99 4.59
90 -999.99
90 4.61 -139.67 4.61
90 158 . 4.62 -999.99 4.62
90 160 4.62 -145.45 4.62
90 162 4.63 -139.32 4.63
90 164 4.63 -999.99 4.63
90 166 4.64 -999.99 4.64
90 168 4.64 -145.1
90 170 4.65 -142.03
90 172 4.65 -141.98 4.65
90 174 -999.99 465 ;

j 90 4.65 -■>>9.99 4.65
90 4.65 -144.91 4.65
90 180 4.65 -999.99 4.65
j 90 182 4.65 -999.99 4.65
1 90 184 4.65 4.65
| 90 186 4.65 4.65
j 90 188 4.64 -144.99 4.64
| 90 190 4.64 -145.04 4.64
90 4.63 -139.08 4.63
90 194 4.63. -999.99
90 196 -999.99
90 198 4.61 -999.99
| 90 200 4.6 4.6
90 . 202 4.59
| 90 204 -14268 4.58
90 206 4.57 -145.83 4.57
90 208 -152.01 4.56
90 210 -152.18 4.55
90 212 4.54 -999.99 4.54
90 214 4.53 -146.53 4.53
90 4.52 -152.77 4.52
90 218 4.51 -153 4 J i
90 220 4.49 -147.22 4.49 ,

222 4.48 -147.48 4.48
224 -253.79 4.47
90 226 4.46 -145.06 4.46
90 228 -999.99
90 230 -148.74
90
90 -999.99
90 4.4 -155.98
90 4.39 -149.45
240 4.37. -156.95 4.37
90 4.36 -148.46 4.36
90 244 -152.07 4.35
90 246 -158.74 434
248 4.34 -153.43 4.34
250 4.33 -154.23
4.32 -999.99
254 4.31 -162.12
256 4.31 -999.99
90 258 4.3
90 260 4.3 ■999.99
90 262 4.29 -168.06
264 4.29 -170.54
266
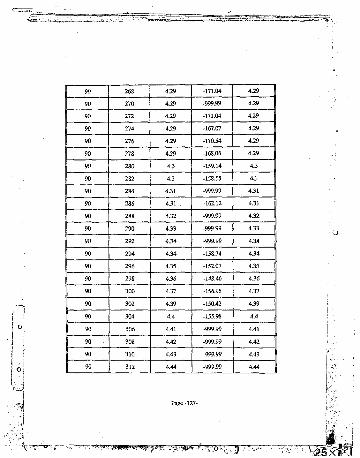
! 90 268 -171.04 4.29
90 270 -999.99 4.29
90 272 -171.04 4.29
| 90 274 -167.07 4.29
90 276 -170.54 4.29
90 278 -168.06
90 280 4.3
90 282 4.3 -158.55
90 284 4.31 -999.99
90 286 4.31 . -162.12
90 288 4.32 -999.99
90 290 4.33 -999.99
90 292 4.34 -999.99 4.34
90 294 4.34 -158.74 4.34
296 -152.07 4.35
298 4.36 -148.46 4.36
90 300 4.37 -156.95 4.37
90 302 4.39 -150.42 4.39
90 304 -155.98 4.4
90 306 -999.99
90 308 -999.99
90 310 ■999.99
90 312 -999.99
Page -127-

90 1 314 4.46 -145.06 4.46 1
90 316 4.47 -147.77 4.47
90 318 4.48 -146.52 4.48
90 320 4.49 -147.22 4.49
90 322 4.51 -153 4.51
90 324 4.52
90 326 4.53
90 328 -999.99 4.54
90 330 -152.18 4.55
90 332 4.56 . -145.99 4.56
90 334 - 151.85 4.57
90 -151.71 4.58
90 338 -151.58 4.59
90 340 -999.99 4.6
90 342 4.61 -145.34 4.61
90 344 4.62 -999.99 4.62
90 346 4.63 -145.17 4.63
90 348 4.63 -142.09 4.63
90 350 4.64 -999.99 4.64
90 352 4.64 -144.99 4.64
90 354 4.65 4.65
90 356 4.65 - 144.93 4.65
90 •358 4.65 -999.99 4.65

Zenith-plane radiation pattern of the square loop antenna.
ANGLES DIRECTIVE GAINS
Theta Vertical Horizontal
Degrees Degrees dB dB
-90 -999.99 -999.99 -999.99
-89 -76.77 -28.78 -28.78
-83 -64.73 -22.75 -"3.75
90 -57.69 -19.23 -19.23
90 -52.69 -16.73 -16.73
90 -48.82, -14.78 -14.78
90 -45.66 -23.19 -13.19
-11.85 -11.84
90 -10.68
-81 90 -38.65 -9.65 -9.64
-80 90 -36.83 -8.72 -8.71
-79 90 -35.19 -7.88 -7.87
-78 90 -33.69 -7.11 -7.1
-77 90 -32.32 -6.41 -6.39
-76 90 -31.05 -5.75 -5.73
-75 90 -29.87 -5.13 -5.12
-74 90 -28.77 -4.56
-73 90 -27.74 -4.01 -4
-72 90 -26.77 -3.5 -3.48
Page -129-

-71 -25.86 -3.01 -2.99
-70 -24.99 -2.55 -2J3
-69 90 -24.17 -2.11 -2.08
-68 90 -23.39 -1.68 -1.65
-67 90 -22.65 -1.28 -1.25
-65 90 -0.89 -0.85
-65 -0.51 -0.48
-64 90 -0.15 -0.11
-63 90 0.19 0.24
-62 90 0.53 0.57
-61 90 0.86 0.9
-60 90 -18.3 122
-59 90 -17.77 1.48
-58 90 -17.27 1.77
-57 90 -16.78 2.06
-56 90 -16.31 2.34 2.4
-55 90 -15.86 2.61 2.67
-54 90 -15.42 2.87 2.93
-53 90 -15 3.13 3.19
-52 90 -14.59 3.37 3.44
-51 90 -14.2 3.62 3.69
-50 90 -13.82 3.85 3.92
-49 90 -13.45 4.08 4.16
: " - 'T *

90 4.3 4.38
90 4 3 2 4.6
90 4.73 4.81
90 -12.1 4.94 5.02
-11.79 5.14 5.22
90 -11.49 5.33 5.42
90 -11.19 5.52 5.61
90 5.7 5.8
-10.64 5.88 5.98
1 -39 90 -10J8 6.06 6.15
-38 90 -10.13 6.23 6.33
-37 90 -9.88 6.39 6.49
-36 90 -9.65 6.55 6.65
-35 90 -9.42
-34 90 -9.2
-33 90 -8.99 7 7.11
-32 90 -8.78 7.14 7.25
-31 90 -8.58 12% 7.39
-30 90 -8.39 7.41 7.52
-29 90 -8.21 7.54
90 7.66 7.77
-27 90 7.78 7.89
-26 90 7.89 8.01

-25 -7.55 8 8.12 1
1 *24 -7.41 8.22
-23 -7.27 8.2 8.33
-22 90 -7.13 8.3 8.42
90 -7 8.39 8.52
-20 90 8.48 8.61
19 90 8.56 8.69 |
-18 90 8.77
-17 90 -6.56 8.84
90 -6.46. 8.79 8.92
-6.37 8.85 8.98
-14 -6.29 8.92 9.05
-13 90 -6.21 8.97 9.1
-12 90 -6.14 9.03 9.16
-11 90 -6.07 9.08 9.21
-10 90 -6.01 9.12 9.25
-9 90 -5.95 9.16 9.29
-8 90 -5.91 9.2 9.33
-7 90 -5.86 923 9.36
-6 90 -5.83 9.26 9.39
-5 90 -5.79 9.28 9.42
90 -5.77 9.3 9.44
-3 90 -5.75 9.32 9.45
Page -132-
a s x ld

9.12
9.06
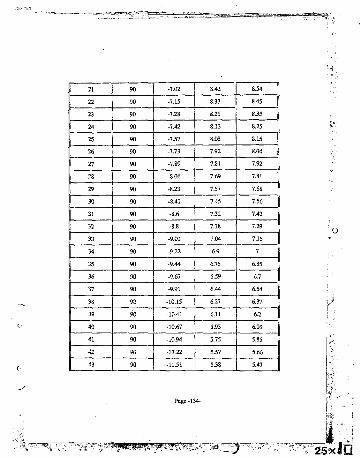
a •7.02 8.42 8J4
22 90 -7.15 8.33 8.45
23 90 -7.28 8.23 8.35
24 90 -7.42 8.13 8.25
25 90 -7.57 8.03 8.15
26 -7.73 8.04
27 90 -7.89 7.92
28 90 -8.06 7.81
29 90 -8.23 7.68
30 90 -8.41. 7.56
31 90 -8.6 7.32 7.42
32 90 -8.8 7.18 7.29
33 -9.01 7.04 7.15
34 90 -9.22 6.9 7
35 90 -9.44 6.75 6.85
36 90 -9.67 6.59 6.7
37 90 -9.91 6.44 6.54
38 90 6.27 6.37
39 90 -10.43 6.11 6.2
40 90 -10.67 5.93 6.03
41 90 -10.94 5.75 5.85
42 90 5J7 5.66
43 90 5.38 5.47
Page-134-

i 44 90 -11.81 5.19 5.28
43 90 -12.12 4.99 5.08
46 90 -12.45 4.79 4.87
47 90 -12.78 4.58
48 90 -13.12 4.36 4.44
49 90 -13.48 4.14 42\
50 90 -13.85 3.91 3.98
51 90 •14.23 3.68 3.75
52 90 -14.62 3.44 3.51
53 90 3.29 3.26
54 -15.45 2.94 3
55 90 -15.89 2.67 2.73
56 90 -16.34 2.41 2.46
57 90 -16.81 2.13 2.18
58 90 -17.3 1.84 1.89
59 90 -17.81 1.55 1.6
60 90 -18.33 1.24 1.29
61 90 -18.88 0.93 0.98
62 90 -19.45 0.61 0.65
63 90 -20.04 0.27 0.31
64 90 -0.08 -0.04
65 90 -21.31 -0.44 -0.4
66 90 -21.98 -0,81 -0.78
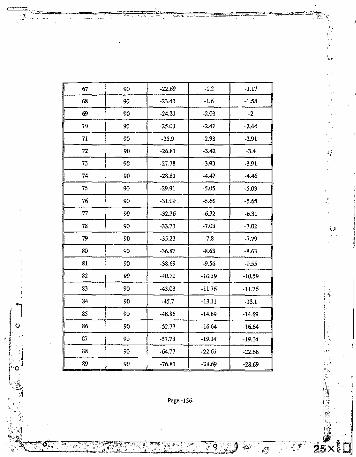
-1.2 - m
90 -1.6 -1.58
69 90 -24.21 -2.03
79 90 -25.03 -2.47
71 -25.9 -2.93
90 -3.42 -3.4
90 -3.91
90 -4.46
90 -5.05 -5.03
90 -31.09. -5.66 -5.65
90 -32.36 -6.32 -6.31
90 -33.73 -7.03 -7.02
-35.23 -7.8 -7.79
-36.87 -8.63 -8.63
90 -9.56 -9.55
90 -10.59 -10.59
83 90 -43.03 -11.76 -11.76
84 90 -45.7 -13.11 -13.1
85 90 -48.86 -14.69 -14.69
90
90 -57.73
88 90 -64.77 -22.67
99 90 -76.81 -25.69

Azimuth-plane radiation pattern o f the square loop antenna sliced at zenith angle 6= 70°.
DIRECTIVE GAINS
HorizontalVertical
Page-137-

70 38 -13.46 -4.56 -4.03
40 -13.83 -4.31 -3.85
42 -14.22 -4.08 -3.68
-14.65 -3.87 •3.52
-15.1 -3.68 -3.37
48 -15.59 -3.5 -3.24
70 50 -16.12 -3.33 -3.11
70 52 -16.69 -3.18 -2.99
70 -17.31 -3.05 -2.89
70 -2.92 -2.79
70 -18.73 -2.81
60 -19.56 -2.71
70 62 -20.47 -2.63
70 64 -2 i.5 I -2.55 -2.49
70 66 -22.69 -2.48 -2.44
| 70 68 -24.07 -2.43 -2.4
70 70 -2.38 -2.36
-27.75 -2.35 -2.34
70 74 -30.42 -2.33 -2.32
70 76 -34.29 -2.31 -2.31
70 78 -41.43 -2.31 -.2.3
70 80 -51.67 -2.31 -2.31
82 -2.32
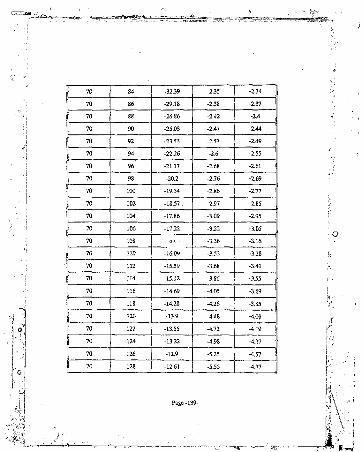
1 70 84 -32.39 -2.34
70 86 -29.18 -2.37
1 70 -14
70 -25.03 -2.44
| 70 -23.53 -2.49
| 70 -22.26 •2.55
70 -161
70 -2.69
70 -2.86 -2.77
70 •2.97 -2.85
70 104 -17.86 -3.09 -2.95
106 -17.22 -3.22 -3.05
108 •**'. ■ -3.16
n o -16.09 -3.28
-15.59 -3.68 -3.41
-15.12 -3.86 -3.55
116 -4.05 -3.69
118 -14.28 -3.85
70 120 -13.9 -4.0}
70 -13.55 -4.72 -4.; 9
70 124 -13.22 -4.98 -4.37
126 -12.9 -5.25 -4.57
128 -12.61 -4.77
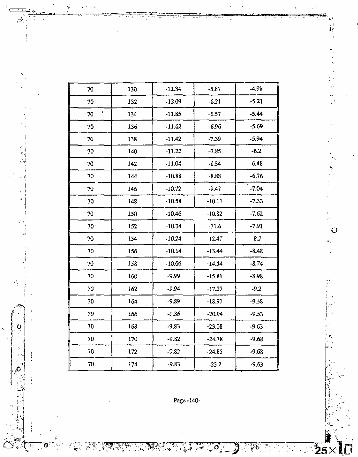
70 130 -12.34 -5.87 -4.98
70 132 -12.09 -6.21 -5.21
70 ' 134 -6.57 -5.44
136 -6.96 -5.69
70 138 -7.39 -5.94
70 140 -7.85 -6.2
70 142 -11.04 -8.34 -6.48
70 -10.88 -8.88 -6.76
70 -10.72 -9.47 " -7.04
• 10.58 -10.11 -7.33
-10.46 -10.82 -7.62
-10.34 -n .6 -7.91
70 -10.24 -12.47 -8.2
156 -8.48
158 -14.54 -8.74
160 -9.99 -15.81 -8.98
70 162 -9.94 -27.27 -9.2
70 164 -9.89 -18.97 -9.38
70 166 -9.86 -20.94 -9.53
70 168 -9.83 -9.63
70 170 -9.82 -24.78 -9.68
70 172 -9.82 -24.85 -9.68
174 -9.83 -23.2 -9.63

70 -9.85 -21.05 -9.53
70 178 -9.88 -19.04 -9.39
70 180 -9.93 -17.3 -9.2
282 -9.99 -15.8 -8.97
70 184 -10.05 -14.51 -8.72
70 -13.38 -8.45
70 -8.16 .
70 -11.49 -7.86
70 -10.45 -10.69 -7 .56
70 194 -10.58. -9.96 -7.25
-10.73 -9.3
-10.89 -8.7
-11.06 -8.14 -6.35
-7.63 -6.07
70 -7.16 -5.79
70 -6.73 -5.52
70 208 -11.92 -6.33 -5.27
70 210 -12.17 -5.96 -5.03
70 212 -12.45 -5.61 -4.79
70 -12.74 -5.29 -4.57
70 216 -13.06 -4.99 -4.36
70 218 -13.4 -4.72 -4.17
70 220 -13.77 -4.46 -3.98
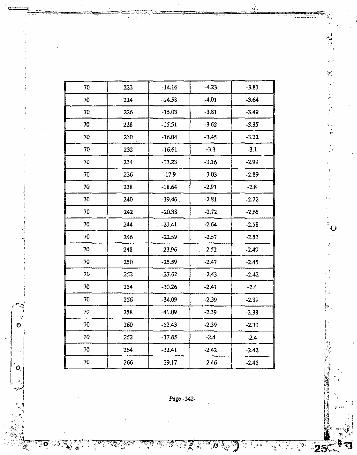
70 -14.16 -423 -3.81
70 • 14.58 -4.01 -3.64
70 -15.03 -3.81 -3.49
70 228 -15.51 -3.62 -3.35 |
70 230 -16.04 -3.45 -3.22
70 232 -16.61 -3.3
70 234 -17.23 -3.16
236 -3.03
238 -2.91
70 240 -19.46. -2.81 -2.72
70 -20.38 -2.72 -2,65
70 -21.41 -2.64 -2.58
70 -251 -2.53
70 248 . -2.52 -2.49
70 250 -2.47
70 252 -27.62 -2.43
70 254 -30.26 -2.41 -2.4
70 256 -34.09 -2-39 -2.39
j 70 258 -41.09 -2.39 -2.38
70 260 -52.43 -2.39 -2.39
1 70 262 -2.4
70 264 -2.42
70 266 -2.46
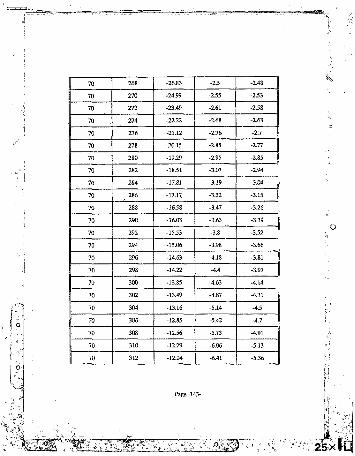

70 314 -11.8 -6.79 -5.6
70 316 -11.58 -7.2 -5.85
70 318 -11.38 -7.64 -6.1!
70 320 -11.18 -8.12 -6.37
70 -11.01 ' -8.63 -6.65
70 324 -10.84 - 9 2 -6.93
326 -7.22
328 -10.55 -7.51
330 -10.43 -11.23 -7.8
70 332 -10.32 -12.06 -8.09
70 334 -12.98 -8.37
70 336 -14.02 -8.64
70 338 -15.2 -8.89
70 340 -9.98 -16.57 -9.12
70 342 -9.93 -18.15 -9,32
-9 os -20 -9.48
70 346 -9.85 -22.09 -9.6
70 348 -9.83 -24.12 -9.67
70 350 -9.82 -25.08 -9.69
)52 -9.82 -24.09 -9.66
354 -9.83 -22.04 -9.58
70 356 -9.86 -19.94 -9.45
70 358 -9.89 -18.07 -9.28

Azimuth-plane radiation pattern of the long wire (terminated) antenna sliced at zenith angle 6 = 80°.
ANGLES DIRECTIVE GAINS
Theta Vertical Horizontal
Degrees Degrees
80 0 -999.99
80 -49.69 -11.38 -11.38
80 -35.68 -3.43 -3.42
80 12 -22.57 -3.91 -3S
80 i d -11.72 -11.71
80 20 -26 -2.01 -1.99
80 24 ,29.93 -7.59 -7.5"
80 >8 -23.17 -2.47
',2 -26.71 -7.36 I
80 -18.72 .7.74 -0.67
80 -to •25.48 4.75 - 8.66
to 44 -21.7 -6.07
fc) 48 -0.64 -0.49
80
80 -10.35 1.72
' 80 60 -9.33 u 1.48
80 64 >13.42 -4.45 -193
80 68 -927 -1.19
1 ... 80 . 72 4.54 5.63
Page-145-

76 -3.44 -1.72
80 80 2.88 . 5.82
80 9.26 4.9 10.61
80 11.13 11.3
80 92 11.13 -2.8 11.3
80 96 4.9106,
80 100 2.88 5.82
80 104 -3.44 -1.72
80 108 4.54 5.63
80 112 -9.27. -1.19 j
80 -13.42 -3.93
80 -9.33 1.48
80 -10.35 1.44 1.72
80 -12.22 0.84 1.05
80 -0.64 -0.49
80 -21.7 -6.19 -6.07
80 140 -25.48 -8.75 *8.66
80 144 -18.72 -0.74 -0.67
80 148 -26.71 -7.36
80 152 -23.17 -2.47 -2.44
80 156 29.83 -7.59 -7.57 1
80 160 -26 -2.01 -1.99 i
80 164 -37.78 -11.72 -11.71

168 -3.9
172 -3.43 -3.42
80 176 -11.38 -11.38
80 180 .162.38 -6 -6
80 184 -3.91 -3.91
80 188 -9.31 -9.3
80 192 -8.81 -8.8
80 196 -31.26 -5.21 -5.19
80 -35.91 -11.93 -11.91
@0 204 -29.74 -7.51 -7.48
80 208 -30.44 -9.75 -9.71
212 -28.37 -9.08 -9.03
216 -31.41 -13.43 -1136
220 -25.31 -8.58 -8.49
80 224 -28.18 -12.67 -12.55
80 228 -35.88 -21.59 -21.43
80 232 -30.84 -17.77 -17.56
80 236 -28.33 -16.54 -16.26
80 240 -30.69 -20.26 -19.88
80 244 -34.78 -25.81 -25.29
80 246 -11.06 -10.32
80 252 -15.6 -10.16 -9.07
80 256 -15.97 -12.83 -11.11

80 -11.86 -8.78
80 264" -3.78 -2.43
80 268 -1.55 -15.49 -1.38
80 272 -1.55 -15.49 -1.38
80 -3.78 -8.15 -2.43
80 -11.86 -8.78
80 -15.97 -11.11
80 288 -15.6
80 292 -18.39 - r . 9 6
80 -34.78. -25.81 -25.29
80 300 -30.69 -20.26 -19.88
80 304 -28.33 -16.26
80 308 -30.84
80 312 -35.88
80 -28.18
80 320 -25.32 -8.49
80 324 -31.41 -13.43 -13.36
80 328 -28.37 -9.08 -9.03
80 332 -30.44 -9.75 -9.71
80 336 -29.74 -7.51 -7.48
80 340 -35.91 -11.93 -11.91
80 344 ' -31.26 -5.21 -5.19
80 348 -8.81 4 4

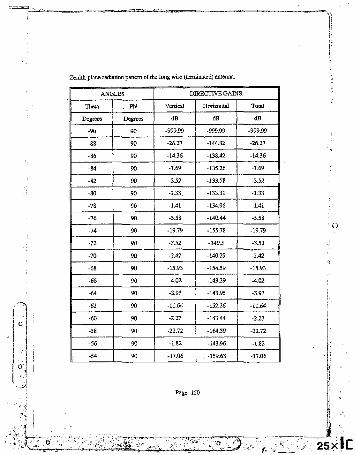
Zenith-piane radiation pattern of the long wire (terminated) antenna.
ANGLES DIRECTIVE GAINS.
. Phi Vertical Horizontal Total
Degrees Degrees
-86 -14.36
-84 -135.26 -7.69
-8.2 -133.58 -3.52
-L33. -133.31 -1.33
-134.96 -1.41
-140.44 -5.58
-74 90 -19.79 -155.78 -19.79
-12 90 -3.52 -240.5 -3.52
-70 90 -2.42 -140.29 -2.42
-68 -15.93
-4.02
90 -3.93 -3.93
-62 90 -11.64
-60 90 -2.27
-58 90 -164.39
-56 90 -143.96
-54 -159.63
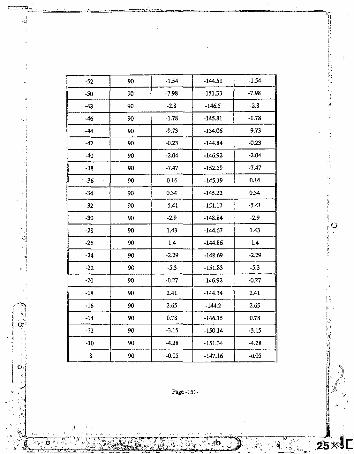

-.6 90 2.77 -144.37 2.77
-4 90 3.89 -143.27 3.89
-2 90 3.57 -143.61 3.57
0 90 1.71 1.71
2 -2.03
4 -4.24
6 -146.88
8 3.73 -143.38
10 90 5.26 -141.79 5.26
12 90 5.03. 5.03
14 90 2.56 2.56
90
18 90 -0.66
20 90 4.86 -141.79
22 90 6.73 -139.8
1 24 90 5.23 -141.18
26 90 -2.03 -148.29 -2.03
28 90 1.59 -144.51 1.59
30 90 7.27 7.27
32 90 6.85
34 90 -2.71
36 90 -140.38
38 -136.56

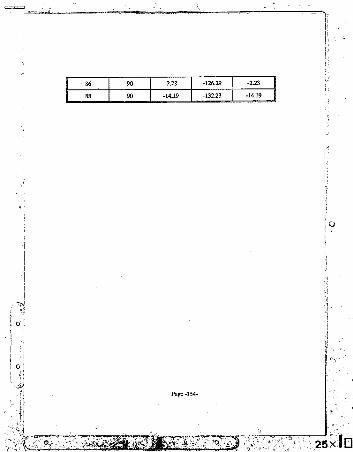

RFERENCES
(U
[2].
[3].
M.
[5].
[6].
[7).
[8].
[9]-
[10].
[11].
Jnce, AN . "Coaananicadous Through EM-Wavs ScaiteriDg" IEEE Communications
Magazine, Vo l 20, No 3, May 1982, pp 27-43.
Day, WE. "Meteor Burst Communications Bounce Signals Between; Remote Sites"
Electronics, V o l 55, No 26, Dec. 1982,pp71-75.
Westwater, GE. "Meteor Burst Communications Systems" Pacific
Telecommunications Council (PTC), Honaiulu H i, USA, Jan. 1983.
Oerang, JD. "An Analysis o f Meteor Burst Communications fo r M ilitary
Applications" IEEE Transactions on Communications, V o l COM-28, No 9 P t l, Sept.
1980, pp 1591-1601.
Gottlieb, I. "Meceoric Burst Could Keep Past-Aaaek Communication Open" Defence
Electronics, Vo! 13, No 11, USA, Nov. 1981,pp 61-69.
Richmond, RL. "Meteor Burst Communications Part I : M BC Advances Assist C3
Objectives" M ilita ry Electronics/Countermeasures (USA), V o l 8, No 8, August 1982,
pp 68-72.
Herman, JR.; Duggan, C C ; Thompson, W L; Costa, RA." and Deluca, DM.
"Nanrowband Digital Voice Communications Over A Meteor Burst Channel"
Electron. Lett. (GB) Vol. 23, No. 1,2 Jan. 1987, - . , "0. '
Hines, CO.; Forsyth, PA., Vogan, EL. and Pug "ependence o f Meteoric
Forward-Scattering on Antenna Patterns and O. Can. J. Phys., Vol. 33,
1955, pp. 609-610.
Hines, CO. and O’grady, M . "Height-Gain in theForward-Scatteringof Radio Waves by Meteor Trails” Can. l.Phys. Vol. 35,1957, pp. 125-127.
Harrington, RF. "Field Computation by Moment Methods” Macmillan, New York,
Smtzman, W L. and Thiele, GA. "Antenna Theory and Design" Chapters 2 & 6, John
W iley and Sons, Inc. 1981.
Page-155-
[12].
[13].
[14].
[15].
[ 16}.
[17].
[18].
[19].
[20].
[21].
[22].
Burke, GJ. and Poggio, AJ. “Numerical Eiectromagneric Code (NEC) • Method o f
Moments" Parts I , D, H . NOSC Tech Doc 116, Naval Ocean Systems Centre, San
Diego, CA., Jolly 1977 (NEC I); Revised Jan. 1980 (NEC2).
Larsen, JL. and Rodman, PJ. "Study Into Meteor Scatter Communication Systems,
Project IV Part 2, Computer Prediction Model" SALBU (PTY)Lcd. Internal Report,
Ludlow, JD V . "VHP Meteor Scatter Propagation” Radio Communication (GB), Vo l
51, No 2, Feb. 1975, pp 100-107.
Sugar, RG. "Radio Propagation by Reflection from Meteor Trails" Proceedings o f the
IEEE, Vo l 52, Feb. 1964, pp 116-136.
Villard, OG.; Eshleman, Von R.; Manninig, LA . and Peterson, AM . "The Role o f
Meteors In Extended-Range VHP Propagation" Proceedings o f the IRE, Vo l 43, Oct.
1955, pp 1473-1481.
Eshleman, Von R. "The Theoretical Length Distribution o f Ionized Meteor Trails"
Journal o f Atmospheric and Terrestrial Physics, Vo l 10, PergamtonPress Ltd. London,
1957, Fp 57-72.
Manning, LA . and Eshleman, Von R. "Meteors In The Ionosphere" Proceedings o f
the IRE, V o l 47, Feb. 1959, pp 186-199.
Felber, F.; Davis, H.; Stahl, R. and Wright, D. "Concepts fo r Near Continuous
Reception o f VHP (Very High Frequency) Signals Using Meteor Burst Propagation"
JAYCOR, San Diego, CA, Repon No JAYCOR-J200-85-875/2393, July 1985.
Esleman, Von R. and Mlodnosky, RF. "Directional Characteristics o f Meteor
Propagation Derived from Radar Measurements" Proceedings o f the IRE, Vo l 45,
Dec. 1957, pp 1715-1723.
Gray, KG. "Meteor Burst Communications" Signal (USA), Vo l 36, No 9, May 1982,
pp 125-134.
Spezio, AE. "Meteor-Burst Communication Systems: Analysis and Synthesis" Naval
Research Laboratory Report 8286, Washington, D.C., USA., Dec. 1978.
Page -156-
[23]. Helwcg, QG. "Meteor-Burst Communications: Is This What die Navy Needs?" Naval
Postgraduate Schools, Monterey, CA., USA., Master dissertation, June 1987.
[24]. Weiss, A A . "H ie Incidence o f Meteor Particles Upon the Earth" Australian Journal
o f Physics, Vo l 10, pp 397-411.
[25]. Brown, DW . "A Physical Meteor-Burst Propagation Model and Some Significat Results fo r Communication System Design" IEEE Journal on Selected Area in
Communications, Vo l SAC-3, No 5, Sept. 1985, pp 745-755.
[26]. Eshleman, Von R. and Manning, L A "Radio Communication by Scattering from
Meteoric Ionization" Proceedings o f the IRE, V o l 42, March 1954, pp 530-536.
[27]. Ince, AN . "Spatial Properties o f Meteor Burst Propagation" IEEE Transaction on
Communications, Vol COM-28, No 6, June 1980, pp 841-849.
[28]. Hines, CO. and Pugh, RE. "The Spatial Distribution o f Signal Sources in Meteoric
Forward-Scattering" Canadian Journal o f Physics, V o l 34, O ct 1956, pp 1005-1015.
[29]. Forsyth, PA.; Vogan, EL.; Hansen, DR. and Hines, CO. "The Principles o f JANET-A
Meteor-Burst Communication System" Proceedings o f the IRE, V o l 45, Dec. 1957,
pp 1642-1657.
[30]. Brown, DW . and Williams, HP. "The Performance o f Meteor-Burst Communications
at D ifferent Frequencies” AGARD Conference Proceedings, Aspects o f
Electromagnetic Wave Scattering in Radio Communications, Cambridge Mass, Oct.
3 -7 ,1977,pp 24.1-24.6.
[31]. MTdnley, DWR. "Meteor Science and Engineering" IvFgraw-Hill Book Co., Inc., New
York, 1961.
[32]. James, JC. and Meeks, NL. "On the Relative Contributions o f Various Sky Regions
to Meteor-Trail Communications" Georgia Institute o f Technology, Atlanta, Georgia,
Engineering Experiment Station, Technical Report No 1, Naval Research Contract
No Nonr-991(02), June 1956, pp 1-65.
[33]. Eshleman, Von R. "Meteor Scatter" in "The Radio Noise Spectrum"' Harvard
University Press, Cambridge Mass, Ch. 4,1960.
Page -157-
[34]. Steffancin, W . and Brown, D . "CSC (Computer Sciences Corporation) Meteor Burst
Model Enhancement Test Report" Computer Sciences Corp., Fail Church, VA.,
Contract No DC100-84-C-0030. Feb. 1986.
[35]. Greenhow, JS.andNeufeld,EL. 'Turbulance A t Altitudes o f 80-1 lOkmand’ iEffects
on Long-Duration Meteor Echoes" J Atmos. Terr. Phys., V o l 16,1959, pp 384-392.
[36]. Kaiser, TR. "RadioEcho Studies o f Meteor Ionization" Advances in Physics, Vo l 2,
1953, pp 495-544.
[37]. Meeks, M L. and James, JC. "On the Influence o f Meteor-Radiant Distributions in
Meteor-Scatter Communication" Proc. o f the IRE, V o l 45, Dec. 1957, pp 1724-1733.
[38]. Pugh, RE. "The Number Density o f Meteor Trails Observable by the
Forward-Scattering o f Radio Waves" Can. J. Phys. Vo l 34, Ap ril 1956, pp.997-1004.
[39]. Rudie, NH. "The Relative Distribution o f Observable Meteor Trails inForward Scatter
Meteor Communications" PhXi thesis. M o n t State Univ., Bozeman. 1967.
[40]. Weitzen, JA. "Predicting the Arrival o f Meteors Useful fo r Meteor Burst
Communication" Radio Science (USA), Vo l 21, No. 6, Nov. 1986, pp 1009-1020.
[41]. Davies, JG. "Radio Observations o f Meteors" Advancees in Electronics andElectror
Physics, V o l 9, Academic, Orlando, F3a., 1957, pp 95-128.
[42]. Lord Rayleigh, "The Theory o f Sound" The Macmillan Company, NY., USA., Vol.
1 (1877,1937), pp. 98 and 150-157, and Vol. 2 (1878,1929), p. 145.
[43]. Carson,-JR. "A Generalization o f the Reciprocal Theorem" Bell System Tech. J., 3,
Juiy 1924, pp. 393-399.
[44]. Hansen, RC. "Fundumental Limitations in Antennas" Proceedings o f the IEEE, Vo l
69,No 2, Feb. 1981, pp 170-182.
[45]. Kraus, JD. "Antennas" M cGraw-Hill Inc., Second Edition, 1988.
[46]. Roy, IN . "Airborne Man-Made Radio Noise Assessment" Naval Ocean Systems
Center (NOSC) San Diego, USA, April 1981.
[47]. Rudge, AW .; Milne, K.; Olver, AD. and Knight, P. "The Handbook o f Antenna
Design" Vo l 1, Peter Peregrinus Ltd., London, UK, 1982.
Page -158-

[48]. W illiams, HP. "Antenna Theory and Design" Vo l 2, S ir Isaac Pitman & Sons Ltd.,
London 1966, pp 318-329.
[49]. Spaulding, AD . and Disney, RT. "Man-Made Radio Noise, Part I , Estimates fo r
Business, Residential and Rural Areas" US Dept, o f Commerce, OT Report 74-38,
June 1974.
[50] Bodman, GHW. Personal Communication; The South African Value Management
Foundation; P O Box 1894, Rivonia, Sandton 2128, RSA.
[51] Handley, P. Personal Communication; S ALBU(PTY)Ltd.; P O Box 109, Irene 1675,
[52]. Givati, O.; Clark, AR. and Fourie, APC. "Intelligent Pre-Processor fo r NEC Antenna
Design Software" 5* Annual Review o f Progress in Applied Computational
Electromagnetics, Conf. Proc., March 1989, pp.572-583.
[53]. Kraus, JD. "Electromagnetics" McGraw-Hill Inc., Third Edition, 1984.
[54]. Nes, H . "Meteor Burst Polarization Trails" Elec. Letters (GB), Vol. 21, No. 24,
Oct.l985,pp. 1132-1133.
[55] Altshuler, EE. "The Travelling-Wave Linear Antenna" IRE Trans, on Antennas and
Propagation, Vol. AP-9, No. 4.1961.
[56]. Thiele, GA. "Wire Antennas" Chapter 2 in "Computer Techniques for
Electromagnetics" By Mittra, R., Pergamon Press, 1973, pp 7-73.
[57]. Hansen,-PM. "The Radiation Efficiency o f Dipole Antenna Located Above an
Imperfect Conducting Ground" IEEE Trans, in Antennas andPropagation, Vo l AP-20,
No. 6, Nov. 1972, pp 766-770.
[58]. Austin, BA . and Fourie, APC- "Numerical Modelling and Design o f Loaded
Broadband W ire Antennas" IEE Fourth International Conference on HF Radio
Systems and Techniques, April 1988, pp 125-129.
[59]. Kubina, SJ. "Numerical Modelling Methods for Predicting Antenna Performance on
Aircraft" AGARD Lecture Series No. 131, Sept. 1983, pp 9-1 to 9-38.
Page -159-

Author Givati OferName of thesis Simple meteor scatter out-station antennas. 1987
PUBLISHER:University of the Witwatersrand, Johannesburg ©2013
LEGAL NOTICES:
Copyright Notice: All materials on the Un i ve r s i t y of t he W i t w a t e r s r an d , Johannesbu r g L i b r a r y website are protected by South African copyright law and may not be distributed, transmitted, displayed, or otherwise published in any format, without the prior written permission of the copyright owner.
Disclaimer and Terms of Use: Provided that you maintain all copyright and other notices contained therein, you may download material (one machine readable copy and one print copy per page) for your personal and/or educational non-commercial use only.
The University o f the W itwatersrand, Johannesburg, is not responsible for any errors or omissions and excludes any and all liability for any errors in or omissions from the information on the Library website.