simon property group, l.p
TRANSCRIPT
UNITED STATESSECURITIES AND EXCHANGE COMMISSION
Washington, D.C. 20549
FORM 10-KANNUAL REPORT PURSUANT TO SECTION 13 OR 15 (d) OF THE
SECURITIES EXCHANGE ACT OF 1934
For the fiscal year ended December 31, 2009
SIMON PROPERTY GROUP, L.P.(Exact name of registrant as specified in its charter)
Delaware 333-11491 34-1755769(State or other jurisdiction of (Commission File No.) (I.R.S. Employerincorporation or organization) Identification No.)
225 West Washington StreetIndianapolis, Indiana 46204
(Address of principal executive offices) (ZIP Code)
(317) 636-1600(Registrant’s telephone number, including area code)
Securities registered pursuant to Section 12 (b) of the Act: None
Securities registered pursuant to Section 12 (g) of the Act: None
Indicate by check mark if the Registrant is a well-known seasoned issuer (as defined in Rule 405 of the SecuritiesAct). Yes � No �
Indicate by check mark if the Registrant is not required to file reports pursuant to Section 13 or Section 15(d) of theAct. Yes � No �
Indicate by check mark whether the Registrant (1) has filed all reports required to be filed by Section 13 or 15(d) ofthe Securities Exchange Act of 1934 during the preceding 12 months (or for such shorter period that the Registrant wasrequired to file such reports), and (2) has been subject to such filing requirements for the past 90 days. Yes � No �
Indicate by check mark whether the registrant has submitted electronically and posted on its corporate Web site, ifany, every Interactive Data File required to be submitted and posted pursuant to Rule 405 of Regulation S-T (§232.405 ofthis chapter) during the preceding 12 months (or for such shorter period that the registrant was required to submit and postsuch files). Yes � No �
Indicate by check mark if disclosure of delinquent filers pursuant to Item 405 of Regulation S-K is not containedherein, and will not be contained, to the best of Registrant’s knowledge, in definitive proxy or information statementsincorporated by reference in Part III of this Form 10-K or any amendment to this Form 10-K. �
Indicate by check mark whether the Registrant is a large accelerated filer, an accelerated filer, a non-accelerated filer,or a smaller company. See the definitions of ‘‘large accelerated filer,’’ ‘‘accelerated filer,’’ and ‘‘smaller reporting company’’in Rule 12b-2 of the Exchange Act.
Large accelerated filer � Accelerated filer � Non-accelerated filer � Smaller reporting company �(Do not check if a smaller
reporting company)
Indicate by checkmark whether the Registrant is a shell company (as defined in rule 12-b of the Act). Yes � No �
Registrant had no publicly-traded voting equity as of June 30, 2009.
Registrant has no common stock outstanding.
Documents Incorporated By Reference
None.
Simon Property Group, L.P. and SubsidiariesAnnual Report on Form 10-K
December 31, 2009
TABLE OF CONTENTS
Item No. Page No.
Part I
1. Business . . . . . . . . . . . . . . . . . . . . . . . . . . . . . . . . . . . . . . . . . . . . . . . . . . . . . . . . . . 31A. Risk Factors . . . . . . . . . . . . . . . . . . . . . . . . . . . . . . . . . . . . . . . . . . . . . . . . . . . . . . . . 71B. Unresolved Staff Comments . . . . . . . . . . . . . . . . . . . . . . . . . . . . . . . . . . . . . . . . . . . . . 112. Properties . . . . . . . . . . . . . . . . . . . . . . . . . . . . . . . . . . . . . . . . . . . . . . . . . . . . . . . . . 113. Legal Proceedings . . . . . . . . . . . . . . . . . . . . . . . . . . . . . . . . . . . . . . . . . . . . . . . . . . . . 464. Reserved . . . . . . . . . . . . . . . . . . . . . . . . . . . . . . . . . . . . . . . . . . . . . . . . . . . . . . . . . . 46
Part II
5. Market for the Registrant’s Common Equity, Related Stockholder Matters, and IssuerPurchases of Equity Securities . . . . . . . . . . . . . . . . . . . . . . . . . . . . . . . . . . . . . . . . . . . . 47
6. Selected Financial Data . . . . . . . . . . . . . . . . . . . . . . . . . . . . . . . . . . . . . . . . . . . . . . . . 487. Management’s Discussion and Analysis of Financial Condition and Results of Operations . . . 49
7A. Quantitative and Qualitative Disclosure About Market Risk . . . . . . . . . . . . . . . . . . . . . . . 658. Financial Statements and Supplementary Data . . . . . . . . . . . . . . . . . . . . . . . . . . . . . . . . 659. Changes in and Disagreements with Accountants on Accounting and Financial Disclosure . . . 65
9A. Controls and Procedures . . . . . . . . . . . . . . . . . . . . . . . . . . . . . . . . . . . . . . . . . . . . . . . 659B. Other Information . . . . . . . . . . . . . . . . . . . . . . . . . . . . . . . . . . . . . . . . . . . . . . . . . . . . 67
Part III
10. Directors, Executive Officers and Corporate Governance . . . . . . . . . . . . . . . . . . . . . . . . . 6811. Executive Compensation . . . . . . . . . . . . . . . . . . . . . . . . . . . . . . . . . . . . . . . . . . . . . . . 6812. Security Ownership of Certain Beneficial Owners and Management and Related Stockholder
Matters . . . . . . . . . . . . . . . . . . . . . . . . . . . . . . . . . . . . . . . . . . . . . . . . . . . . . . . . . . . 6813. Certain Relationships and Related Transactions and Director Independence . . . . . . . . . . . . 6814. Principal Accountant Fees and Services . . . . . . . . . . . . . . . . . . . . . . . . . . . . . . . . . . . . . 68
Part IV
15. Exhibits, and Financial Statement Schedules . . . . . . . . . . . . . . . . . . . . . . . . . . . . . . . . . . 69
Signatures . . . . . . . . . . . . . . . . . . . . . . . . . . . . . . . . . . . . . . . . . . . . . . . . . . . . . . . . . . 109
2
Part I
Item 1. Business
Simon Property Group, L.P., is a Delaware limited partnership and the majority-owned subsidiary of SimonProperty Group, Inc. In this report, the terms ‘‘Operating Partnership’’, ‘‘we’’, ‘‘us’’ and ‘‘our’’ refer to Simon PropertyGroup, L.P. and its subsidiaries and the term ‘‘Simon Property’’ refers specifically to Simon Property Group, Inc.
We own, develop, and manage retail real estate properties, which consist primarily of regional malls, PremiumOutlet� Centers, The Mills�, and community/lifestyle centers. As of December 31, 2009, we owned or held an interestin 321 income-producing properties in the United States, which consisted of 162 regional malls, 41 Premium OutletCenters, 67 community/lifestyle centers, 36 properties acquired in the 2007 acquisition of The Mills Corporation, orthe Mills acquisition, and 15 other shopping centers or outlet centers in 41 states and Puerto Rico. Of the 36 propertiesacquired in The Mills portfolio, 16 of these properties are The Mills, 16 are regional malls, and four are communitycenters. We also own an interest in one parcel of land held in the United States for future development.Internationally, as of December 31, 2009, we had ownership interests in 51 European shopping centers (France, Italyand Poland), eight Premium Outlet Centers in Japan, one Premium Outlet Center in Mexico, and one Premium OutletCenter in South Korea. Also, through joint venture arrangements we have a 24% interest in two shopping centers inItaly currently under development. On February 4, 2010, we and our partner entered into a definitive agreement to sellall of the interests in Simon Ivanhoe S.a.r.l, or Simon Ivanhoe, which owns seven shopping centers located in Franceand Poland.
For a description of our operational strategies and developments in our business during 2009, see the‘‘Management’s Discussion and Analysis of Financial Condition and Results of Operations’’ which appears in Item 7 tothis Form 10-K.
Other Policies
The following is a discussion of our investment policies, financing policies, conflict of interest policies andpolicies with respect to certain other activities. One or more of these policies may be amended or rescinded from timeto time by Simon Property without a vote by our limited partners.
Investment Policies
While we emphasize equity real estate investments, we may, at our discretion, invest in mortgages and otherreal estate interests consistent with Simon Property’s qualification as a real estate investment trust, or REIT. We do notcurrently intend to invest to a significant extent in mortgages or deeds of trust; however, we hold a mortgage notewhich results in us receiving 100% of the economics of a property. We may invest in participating or convertiblemortgages if we conclude that we may benefit from the cash flow or any appreciation in the value of the property.
We may invest in securities of other entities engaged in real estate activities or securities of other issuers.However, any of these investments would be subject to the percentage ownership limitations and gross income testsnecessary to maintain Simon Property’s qualification as a REIT. These REIT limitations mean that Simon Propertycannot make an investment that would cause its real estate assets to be less than 75% of its total assets. In addition, atleast 75% of Simon Property’s gross income must be derived directly or indirectly from investments relating to realproperty or mortgages on real property, including ‘‘rents from real property,’’ dividends from other REITs and, incertain circumstances, interest from certain types of temporary investments. At least 95% of Simon Property’s incomemust be derived from such real property investments, and from dividends, interest and gains from the sale ordispositions of stock or securities or from other combinations of the foregoing.
Subject to REIT limitations, we may invest in the securities of other issuers in connection with acquisitions ofindirect interests in real estate. Such an investment would normally be in the form of general or limited partnership ormembership interests in special purpose partnerships and limited liability companies that own one or more properties.We may, in the future, acquire all or substantially all of the securities or assets of other REITs, management companiesor similar entities where such investments would be consistent with our investment policies.
Financing Policies
We must comply with the covenants contained in our financing agreements that limit our ratio of debt to totalassets or market value, as defined. For example, our lines of credit and the indentures for our debt securities contain
3
covenants that restrict the total amount of debt to 65%, or 60% in relation to certain debt, of total assets, as definedunder the related arrangement, and secured debt to 50% of total assets. In addition, these agreements contain othercovenants requiring compliance with financial ratios. Furthermore, the amount of debt that we may incur is limited asa practical matter by our desire to maintain acceptable ratings for Simon Property’s equity securities and our debtsecurities.
We may raise additional capital by issuing units of limited partnership interests, or units, or debt securities,creating joint ventures with existing ownership interests in properties, retention of cash flows or a combination of thesemethods. If Simon Property’s Board of Directors determines to raise additional equity capital, at the OperatingPartnership level, we may, without limited partner approval, issue additional units or other equity interests in us. Wemay issue units in any manner and on such terms and for such consideration as we deem appropriate. This may includeissuing units in exchange for property. We may issue preferred units that could be senior to our units and may beconvertible into units. Existing holders of units have no preemptive right to purchase units in any subsequent offerings.Any such offering could dilute a limited partner’s investment in us.
We expect most additional borrowings would be made in the form of bank borrowings, publicly and privatelyplaced debt instruments, or purchase money obligations to the sellers of properties. Any such indebtedness may besecured or unsecured. Any such indebtedness may also have full or limited recourse to the borrower or cross-collateralized with other debt, or may be fully or partially guaranteed by us. Although we may borrow to fund thepayment of distributions, we currently have no expectation that we will regularly be required to do so.
On December 8, 2009, we entered into a new $3.565 billion unsecured revolving corporate credit facility whichreplaced our $3.5 billion unsecured credit facility, or the Credit Facility, which expired on January 11, 2010. The newcredit facility contains an accordion feature allowing the maximum borrowing capacity to expand to $4.0 billion. Thenew credit facility matures on March 31, 2013. We also issue debt securities, and we may issue our debt securities whichmay be convertible into units, preferred units or be accompanied by warrants to purchase equity interests or beexchangeable for stock of Simon Property. We also may sell or securitize our lease receivables. The proceeds from anyborrowings or financings may be used for one or more of the following:
• financing acquisitions;• developing or redeveloping properties;• refinancing existing indebtedness;• working capital or capital improvements; or• assisting Simon Property to meet the income distribution requirements applicable to REITs.
We may also finance acquisitions through the following:
• issuance of additional units or preferred units;• issuance of other securities; or• sale or exchange of ownership interests in properties.
Our ability to issue units to transferors of properties or other partnership interests may defer gain recognitionfor tax purposes by the transferor. It may also be advantageous for us since there are ownership limits that restrict thenumber of units that investors may own.
We do not have a policy limiting the number or amount of mortgages that may be placed on any particularproperty. Mortgage financing instruments, however, usually limit additional indebtedness on such properties. We alsohave covenants on our unsecured debt that limit our total secured debt.
Typically, we invest in or form special purpose entities to assist us in obtaining permanent financing at attractiveterms. Permanent financing may be structured as a mortgage loan on a single property, or on a group of properties,and generally requires us to provide a mortgage interest on the property in favor of an institutional third party, as ajoint venture with a third party, or as a securitized financing. For securitized financings, we create special purposeentities to own the properties. These special purpose entities are structured so that they would not be consolidatedwith us in the event we would ever become subject to a bankruptcy proceeding. We decide upon the structure of thefinancing based upon the best terms then available to us and whether the proposed financing is consistent with ourother business objectives. For accounting purposes, we include the outstanding securitized debt of special purposeentities owning consolidated properties as part of our consolidated indebtedness.
4
Conflict of Interest Policies
We maintain policies and have entered into agreements designed to reduce or eliminate potential conflicts ofinterest. Simon Property has adopted governance principles governing its affairs and the affairs of its subsidiaries andthe Simon Property Board of Directors, as well as written charters for each of the standing Committees of the Board ofDirectors. In addition, the Board of Directors of Simon Property has a Code of Business Conduct and Ethics, whichapplies to all of its officers, directors, and employees. At least a majority of the members of the Simon Property Boardof Directors must qualify as independent under the listing standards for New York Stock Exchange companies andcannot be affiliated with the Simon family who are significant stockholders. Any transaction between us and theSimons, including property acquisitions, service and property management agreements and retail space leases, must beapproved by a majority of Simon Property’s non-affiliated directors.
The sale of certain of our properties may have an adverse tax impact on the Simons and the other limitedpartners. In order to avoid any conflict of interest between Simon Property and our limited partners, the SimonProperty charter requires that at least six of the non-affiliated directors of the Board of Directors must authorize andrequire us to sell any property we own. Any such sale is subject to applicable agreements with third parties.Noncompetition agreements executed by each of the Simons contain covenants limiting the ability of the Simons toparticipate in certain shopping center activities in North America.
Policies With Respect To Certain Other Activities
We intend to make investments which are consistent with Simon Property’s qualification as a REIT, unless theBoard of Directors determines that it is no longer in Simon Property’s best interests to so qualify as a REIT. The Boardof Directors may make such a determination because of changing circumstances or changes in the REIT requirements.We have authority to offer units of equity interest or other securities in exchange for property. We also have authorityto repurchase or otherwise reacquire our units or any other securities. Our policy prohibits us from making any loansto the directors or executive officers of Simon Property for any purpose. We may make loans to the joint ventures inwhich we participate.
Competition
The retail industry is dynamic and competitive. We compete with numerous merchandise distribution channelsincluding regional malls, outlet centers, community/lifestyle centers, and other shopping centers in the United Statesand abroad. Internet retailing sites and catalogs also provide retailers with distribution options beyond existing brickand mortar retail properties and the numerous projects in development by commercial developers, real estatecompanies and other owners of retail real estate. The existence of competitive alternatives could have a materialadverse effect on our ability to lease space and on the level of rents we can obtain. This results in competition for boththe tenants to occupy the properties that we develop and manage as well as for the acquisition of prime sites (includingland for development and operating properties).
We believe that there are numerous factors that make our properties highly desirable to retailers including:
• the quality and diversity of our properties;• our management and operational expertise;• our extensive experience and relationships with retailers and lenders;• our mall marketing initiatives and consumer focused strategic corporate alliances; and• our ability to reduce the total occupancy cost of our tenants.
Certain Activities
During the past three years, we have:
• issued 6,133,556 units to Simon Property upon limited partners conversion of units for common stock ofSimon Property;
• issued 7,661,355 units to other partners upon the conversion of preferred units;• issued 753,824 restricted units to Simon Property, net of forfeitures, with respect to the issuance of a like
number of restricted shares of common stock of Simon Property issued under The Simon Property Group1998 Stock Incentive Plan, or the 1998 plan;
5

• issued 694,981 units to Simon Property in exchange for cash contributed by Simon Property resulting fromexercise of stock options under the 1998 plan;
• issued 147,241 units for the purchase of Maine Premium Outlets;• issued 67,309 units to the Mills Limited Partners;• purchased and retired 23,000 units;• purchased 572,000 units for $49.3 million;• redeemed 484,586 limited partner units for cash upon conversion of limited partner units;• redeemed all outstanding Series D. Series F, and Series G preferred units for units or cash;• redeemed 5,000 Series I preferred units;• issued 11,876,076 units and 2,637,341 limited partner units as part of quarterly distributions;• issued 40,250,000 units to Simon Property in exchange for the cash proceeds of public offerings of an equal
number of shares of common stock;• issued and repurchased 6,000,000 Series L preferred units in 2007;• borrowed a maximum amount of $2.6 billion under the Credit Facility; the outstanding amount of borrowings
under this facility as of December 31, 2009 was $446.1 million, all related to the U.S. dollar equivalent ofEuro and Yen-denominated borrowings;
• entered into our new $3.565 billion credit facility on December 8, 2009;• not made loans to other entities or persons, including our officers and directors, other than to certain joint
venture properties;• not invested in the securities of other issuers for the purpose of exercising control, other than certain wholly-
owned subsidiaries and to acquire interests in real estate;• not underwritten securities of other issuers; and• not engaged in the purchase and sale or turnover of investments for the purpose of trading.
Employees
At January 5, 2010, we and our affiliates employed approximately 5,200 persons at various properties andoffices throughout the United States, of which approximately 1,900 were part-time. Approximately 1,000 of theseemployees were located at our corporate headquarters in Indianapolis, Indiana and 100 were located at our Chelseaoffices in Roseland, New Jersey.
Corporate Headquarters
Our corporate headquarters are located at 225 West Washington Street, Indianapolis, Indiana 46204, and ourtelephone number is (317) 636-1600.
Available Information
Our Internet website address is www.simon.com. Our annual reports on Form 10-K, quarterly reports onForm 10-Q, current reports on Form 8-K and amendments to those reports filed or furnished pursuant to Section 13(a)or 15(d) of the Exchange Act are available or may be accessed free of charge through the ‘‘About Simon/InvestorRelations/Financial Information’’ section of our Internet website as soon as reasonably practicable after weelectronically file such material with, or furnish it to, the SEC. Our Internet website and the information containedtherein or connected thereto are not intended to be incorporated into this Annual Report on Form 10-K.
6
Item 1A. Risk Factors
The following factors, among others, could cause our actual results to differ materially from those contained inforward-looking statements made in this Annual Report on Form 10-K and presented elsewhere by our management fromtime to time. These factors, among others, may have a material adverse effect on our business, financial condition, operatingresults and cash flows, and you should carefully consider them. It is not possible to predict or identify all such factors. Youshould not consider this list to be a complete statement of all potential risks or uncertainties and we may update them in ourfuture periodic reports.
Risks Relating to Debt and the Financial Markets
We have a substantial debt burden that could affect our future operations.
As of December 31, 2009, our consolidated mortgages and other indebtedness, excluding the related premiumand discount, totaled $18.6 billion. We are subject to the risks normally associated with debt financing, including therisk that our cash flow from operations will be insufficient to meet required debt service. Our debt service costsgenerally will not be reduced if developments at the property, such as the entry of new competitors or the loss of majortenants, cause a reduction in the income from the property. Should such events occur, our operations may be adverselyaffected. If a property is mortgaged to secure payment of indebtedness and income from the property is insufficient topay that indebtedness, the property could be foreclosed upon by the mortgagee resulting in a loss of income and adecline in our total asset value.
Disruption in the credit markets or downgrades in our credit ratings may adversely affect our ability to access externalfinancings for our growth and ongoing debt service requirements.
We depend primarily on external financings, principally debt financings, to fund the growth of our business andto ensure that we can meet ongoing maturities of our outstanding debt. Our access to financing depends on our creditrating, the willingness of banks to lend to us and conditions in the capital markets. We cannot assure you that we willbe able to obtain the financing we need for future growth or to meet our debt service as obligations mature, or that thefinancing available to us will be on acceptable terms.
Adverse changes in our credit rating could affect our borrowing capacity and borrowing terms.
Our outstanding senior unsecured notes and the preferred stock of Simon Property are periodically rated bynationally recognized credit rating agencies. These credit ratings are based on our operating performance, liquidityand leverage ratios, overall financial position, and other factors viewed by the credit rating agencies as relevant to ourindustry and the economic outlook in general. These credit ratings can also affect the amount of capital we can access,as well as the terms of any financing we obtain. Since we depend primarily on debt financing to fund our growth,adverse changes in our credit rating could have a negative effect on our future growth.
Our hedging interest rate protection arrangements may not effectively limit our interest rate risk.
We manage our exposure to interest rate risk by a combination of interest rate protection agreements toeffectively fix or cap a portion of our variable rate debt. In addition, we refinance fixed rate debt at times when webelieve rates and terms are appropriate. Our efforts to manage these exposures may not be successful.
Our use of interest rate hedging arrangements to manage risk associated with interest rate volatility may exposeus to additional risks, including a risk that a counterparty to a hedging arrangement may fail to honor its obligations.Developing an effective interest rate risk strategy is complex and no strategy can completely insulate us from risksassociated with interest rate fluctuations. There can be no assurance that our hedging activities will have the desiredbeneficial impact on our results of operations or financial condition. Termination of these hedging agreements typicallyinvolves costs, such as transaction fees or breakage costs.
Factors Affecting Real Estate Investments and Operations
We face risks associated with the acquisition, development and expansion of properties.
We regularly acquire and develop new properties and expand and redevelop existing properties, and theseactivities are subject to various risks. We may not be successful in pursuing acquisition, development or redevelopment/expansion opportunities. In addition, newly acquired, developed or redeveloped/expanded properties may not perform
7
as well as expected. We are subject to other risks in connection with any acquisition, development and redevelopment/expansion activities, including the following:
• construction costs of a project may be higher than projected, potentially making the project unfeasible orunprofitable;
• we may not be able to obtain financing or to refinance construction loans on favorable terms, if at all;• we may be unable to obtain zoning, occupancy or other governmental approvals;• occupancy rates and rents may not meet our projections and the project may not be profitable; and• we may need the consent of third parties such as anchor tenants, mortgage lenders and joint venture partners,
and those consents may be withheld.
If a development or redevelopment/expansion project is unsuccessful, either because it is not meeting ourexpectations when operational or was not completed according to the project planning, we could lose our investmentin the project. Further, if we guarantee the property’s financing, our loss could exceed our investment in the project.
Real estate investments are relatively illiquid.
Our properties represent a substantial portion of our total consolidated assets. These investments are relativelyilliquid. As a result, our ability to sell one or more of our properties or investments in real estate in response to anychanges in economic or other conditions is limited. If we want to sell a property, we cannot assure you that we will beable to dispose of it in the desired time period or that the sales price of a property will exceed the cost of ourinvestment.
Environmental Risks
As owners of real estate, we can face liabilities for environmental contamination.
Federal, state and local laws and regulations relating to the protection of the environment may require us, as acurrent or previous owner or operator of real property, to investigate and clean up hazardous or toxic substances orpetroleum product releases at a property or at impacted neighboring properties. These laws often impose liabilityregardless of whether the property owner or operator knew of, or was responsible for, the presence of hazardous ortoxic substances. These laws and regulations may require the abatement or removal of asbestos containing materials inthe event of damage, demolition or renovation, reconstruction or expansion of a property and also govern emissions ofand exposure to asbestos fibers in the air. Those laws and regulations also govern the installation, maintenance andremoval of underground storage tanks used to store waste oils or other petroleum products. Many of our propertiescontain, or at one time contained, asbestos containing materials or underground storage tanks (primarily related toauto service center establishments or emergency electrical generation equipment). The costs of investigation, removalor remediation of hazardous or toxic substances may be substantial and could adversely affect our results of operationsor financial condition but is not estimable. The presence of contamination, or the failure to remediate contamination,may also adversely affect our ability to sell, lease or redevelop a property or to borrow using a property as collateral.
Our efforts to identify environmental liabilities may not be successful.
Although we believe that our portfolio is in substantial compliance with Federal, state and local environmentallaws, ordinances and regulations regarding hazardous or toxic substances, this belief is based on limited testing. Nearlyall of our properties have been subjected to Phase I or similar environmental audits. These environmental audits havenot revealed, nor are we aware of, any environmental liability that we believe will have a material adverse effect on ourresults of operations or financial condition. However, we cannot assure you that:
• existing environmental studies with respect to the portfolio reveal all potential environmental liabilities;• any previous owner, occupant or tenant of a property did not create any material environmental condition
not known to us;• the current environmental condition of the portfolio will not be affected by tenants and occupants, by the
condition of nearby properties, or by other unrelated third parties; or• future uses or conditions (including, without limitation, changes in applicable environmental laws and
regulations or the interpretation thereof) will not result in environmental liabilities.
8
Retail Operations Risks
Ongoing economic conditions are adversely affecting the general retail environment.
Our concentration in the retail real estate market means that we are subject to the risks that affect the retailenvironment generally, including the levels of consumer spending, seasonality, the willingness of retailers to leasespace in our shopping centers, tenant bankruptcies, changes in economic conditions, consumer confidence andterrorist activities. The economy appears to be recovering from the recent recession, during which consumer spendingin the United States declined significantly. The unemployment rate remains relatively high and consumer confidenceremains relatively depressed. We derive our cash flow from operations primarily from retail tenants, many of whom arecurrently under considerable economic stress. A significant deterioration in our cash flow from operations couldrequire us to curtail planned capital expenditures or seek alternative sources of financing.
We may not be able to lease newly developed properties and renew leases and relet space at existing properties.
We may not be able to lease new properties to an appropriate mix of tenants or for rents that are consistentwith our projections. Also, when leases for our existing properties expire, the premises may not be relet or the terms ofreletting, including the cost of allowances and concessions to tenants, may be less favorable than the current leaseterms. To the extent that our leasing plans are not achieved, our cash generated before debt repayments and capitalexpenditures could be adversely affected.
Some of our properties depend on anchor stores or major tenants to attract shoppers and could be adversely affected bythe loss of or a store closure by one or more of these tenants.
Regional malls are typically anchored by department stores and other large nationally recognized tenants. Thevalue of some of our properties could be adversely affected if these tenants fail to comply with their contractualobligations, seek concessions in order to continue operations, or cease their operations. Larger store, also referred toas ‘‘big box’’, consolidations typically result in the closure of existing stores or duplicate or geographically overlappingstore locations. We do not control the disposition of those department stores or larger stores that we do not own. Wealso may not control the vacant space that is not re-leased in those stores we do own. Other tenants may be entitled tomodify the terms of their existing leases in the event of such closures. The modification could be unfavorable to us asthe lessor and could decrease rents or expense recovery charges. Additionally, major tenant closures may result indecreased customer traffic which could lead to decreased sales at other stores. If the sales of stores operating in ourproperties were to decline significantly due to closing of anchors, economic conditions, or other reasons, tenants maybe unable to pay their minimum rents or expense recovery charges. In the event of default by a tenant or anchor store,we may experience delays and costs in enforcing our rights as landlord to recover amounts due to us under the terms ofour agreements with those parties.
We face potential adverse effects from the increasing number of tenant bankruptcies.
Although bankruptcy filings by retailers occur regularly in the course of our operations, the number of tenantbankruptcies has increased in the past two years. We continually seek to re-lease vacant spaces resulting from tenantterminations. The bankruptcy of a tenant, particularly an anchor tenant, may make it more difficult to lease theremainder of the affected properties. Future tenant bankruptcies could adversely affect our properties or impact ourability to successfully execute our re-leasing strategy.
Risks Relating to Joint Venture Properties
We have limited control with respect to some properties that are partially owned or managed by third parties, which mayadversely affect our ability to sell or refinance them.
As of December 31, 2009, we owned interests in 182 income-producing properties with other parties. Of those,18 properties are included in our consolidated financial statements. We account for the other 164 properties under theequity method of accounting, which we refer to as joint venture properties. We serve as general partner or propertymanager for 93 of these 164 properties; however, certain major decisions, such as selling or refinancing theseproperties, require the consent of the other owners. Of the properties for which we do not serve as general partner orproperty manager, 61 are in our international joint ventures. The other owners also have other participating rights thatwe consider substantive for purposes of determining control over the properties’ assets. The remaining joint venture
9

properties are managed by third parties. These limitations may adversely affect our ability to sell, refinance, orotherwise operate these properties.
We guarantee debt or otherwise provide support for a number of joint venture properties.
Joint venture debt is the liability of the joint venture and is typically secured by a mortgage on the joint ventureproperty. As of December 31, 2009, we had loan guarantees to support $47.2 million of our total $6.5 billion share ofjoint venture mortgage and other indebtedness. A default by a joint venture under its debt obligations may expose usto liability under a guaranty or letter of credit.
Other Factors Affecting Our Business
Our Common Area Maintenance (CAM) contributions may not allow us to recover the majority of our operatingexpenses from tenants.
CAM costs typically include allocable energy costs, repairs, maintenance and capital improvements to commonareas, janitorial services, administrative, property and liability insurance costs, and security costs. We historically haveused leases with variable CAM provisions that adjust to reflect inflationary increases. We have made a concerted effortto convert our leases to a fixed payment methodology which fixes our tenants’ CAM contributions and should in turnreduce the volatility of and limitations on the recoveries we collect from our tenants for the reimbursement of ourproperty operating expenses. However, with respect to both variable and fixed payment methodologies, the amount ofCAM charges we bill to our tenants may not allow us to recover all of these operating costs.
We face a wide range of competition that could affect our ability to operate profitably.
Our properties compete with other retail properties and other forms of retailing such as catalogs ande-commerce websites. Competition may come from regional malls, outlet centers, community/lifestyle centers, andother shopping centers, both existing as well as future development projects. The presence of competitive alternativesaffects our ability to lease space and the level of rents we can obtain. Renovations and expansions at competing sitescould also negatively affect our properties.
We also compete with other retail property developers to acquire prime development sites. In addition, wecompete with other retail property companies for tenants and qualified management.
Our international expansion may subject us to different or greater risk from those associated with our domesticoperations.
We hold interests in joint venture properties that operate in Italy, France, Poland, Japan, Korea, and Mexico,and we have a minority investment in common shares of a U.K. retail real estate company. We may pursue additionalexpansion opportunities outside the United States. International development and ownership activities carry risks thatare different from those we face with our domestic properties and operations. These risks include:
• adverse effects of changes in exchange rates for foreign currencies;• changes in foreign political and economic environments, regionally, nationally, and locally;• challenges of complying with a wide variety of foreign laws including corporate governance, operations, taxes,
and litigation;• differing lending practices;• differences in cultures;• changes in applicable laws and regulations in the United States that affect foreign operations;• difficulties in managing international operations; and• obstacles to the repatriation of earnings and cash.
Although our international activities currently are a relatively small portion of our business (internationalproperties represented approximately 6.3% of the GLA of all of our properties at December 31, 2009), to the extentthat we expand our international activities, these risks could increase in significance which in turn could adverselyaffect our results of operations and financial condition.
10
Some of our potential losses may not be covered by insurance.
We maintain commercial general liability, fire, flood, extended coverage and rental loss insurance on all of ourproperties in the United States through wholly-owned captive insurance entities and other self-insurance mechanisms.Rosewood Indemnity, Ltd. and Bridgewood Insurance Company, Ltd. are our wholly-owned captive insurancesubsidiaries, and have agreed to indemnify our general liability carrier for a specific layer of losses for the propertiesthat are covered under these arrangements. The carrier has, in turn, agreed to provide evidence of coverage for thislayer of losses under the terms and conditions of the carrier’s policy. A similar policy written through these captiveinsurance entities also provides initial coverage for property insurance and certain windstorm risks at the propertieslocated in coastal windstorm locations.
There are some types of losses, including lease and other contract claims that generally are not insured. If anuninsured loss or a loss in excess of insured limits occurs, we could lose all or a portion of the capital we have investedin a property, as well as the anticipated future revenue from the property. If this happens, we may still remainobligated for any mortgage debt or other financial obligations related to the property.
We currently maintain insurance coverage against acts of terrorism on all of our properties in the United Stateson an ‘‘all risk’’ basis in the amount of up to $1 billion per occurrence for certified foreign acts of terrorism and$500 million per occurrence for non-certified domestic acts of terrorism. The current federal laws which provide thiscoverage are expected to operate through 2014. Despite the existence of this insurance coverage, any threatened oractual terrorist attacks in high profile markets could adversely affect our property values, revenues, consumer trafficand tenant sales.
Risks Relating to Federal Income Taxes
The failure of either of our two REIT subsidiaries to maintain their qualifications as REITs have adverse taxconsequences to us, our unitholders, and Simon Property.
Simon Property and two of our subsidiaries have elected to qualify as a REIT. Qualification as a REIT forfederal income tax purposes is governed by highly technical and complex provisions for which there are only limitedjudicial or administrative interpretations. If either of the REIT subsidiaries fails to comply with those provisions, and ifavailable relief provisions do not apply:
• The REIT subsidiary will not be allowed a deduction for distributions to us in computing its taxable income;• The REIT subsidiary will be subject to corporate level income tax, including any applicable alternative
minimum tax, on its taxable income at regular corporate rates;• Unless entitled to relief under relevant statutory provisions, the REIT subsidiary will also be disqualified
from treatment as a REIT for the four taxable years following the year during which qualification was lost;and
• Simon Property would also fail to qualify as a REIT as a result of the REIT subsidiary’s failure and the sameadverse consequences would apply to it and its stockholders.
As a result, net income and funds available for distribution to our unitholders would be reduced for those yearsin which a REIT subsidiary fails to qualify as a REIT. Although we currently intend to operate the REIT subsidiariesso as to qualify each as a REIT, we cannot assure you we will succeed or that future economic, market, legal, tax orother considerations might cause us to revoke the REIT election of either of the REIT subsidiaries.
Item 1B. Unresolved Staff Comments
None.
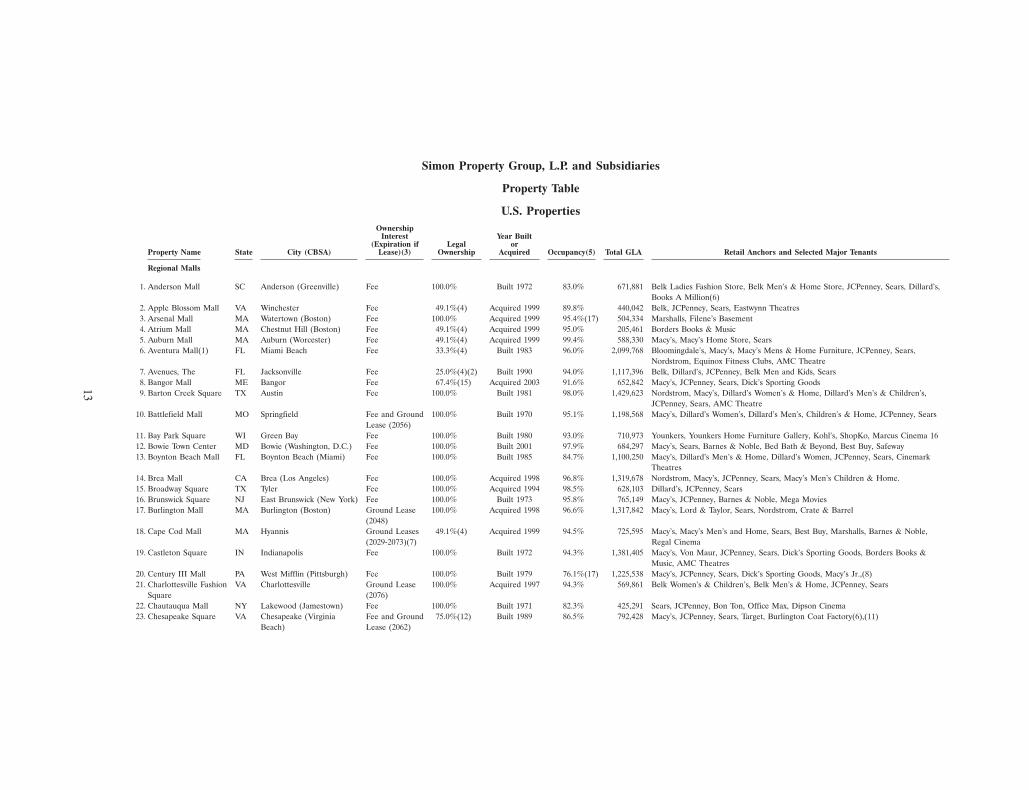
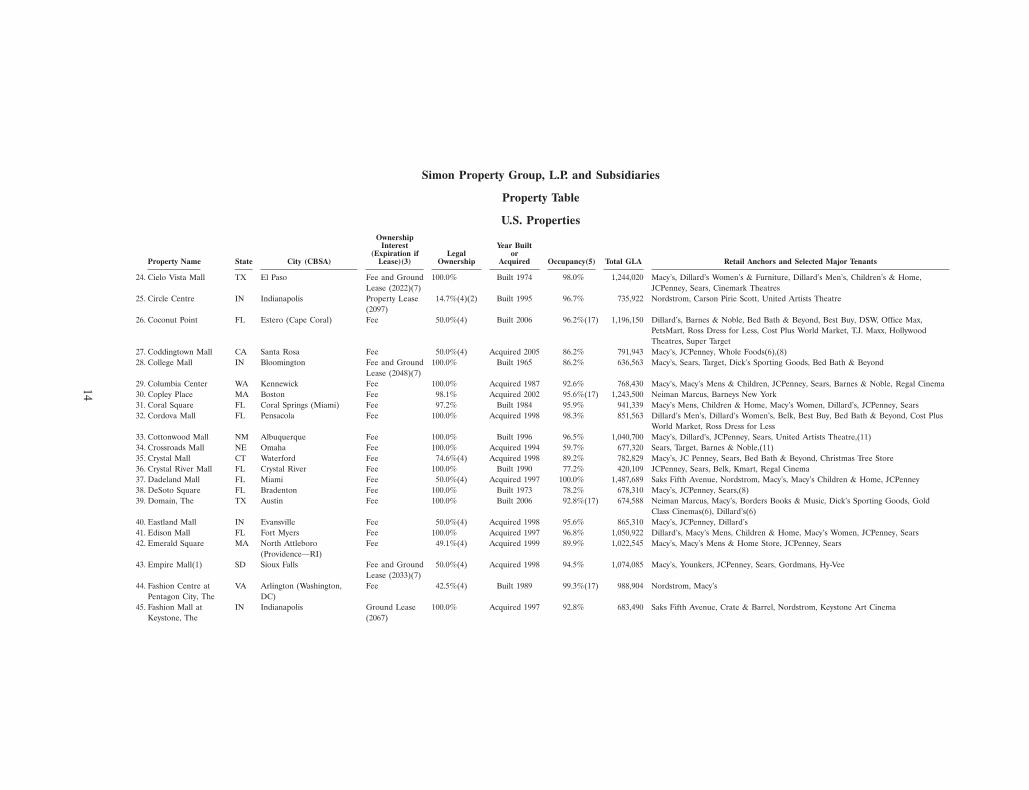
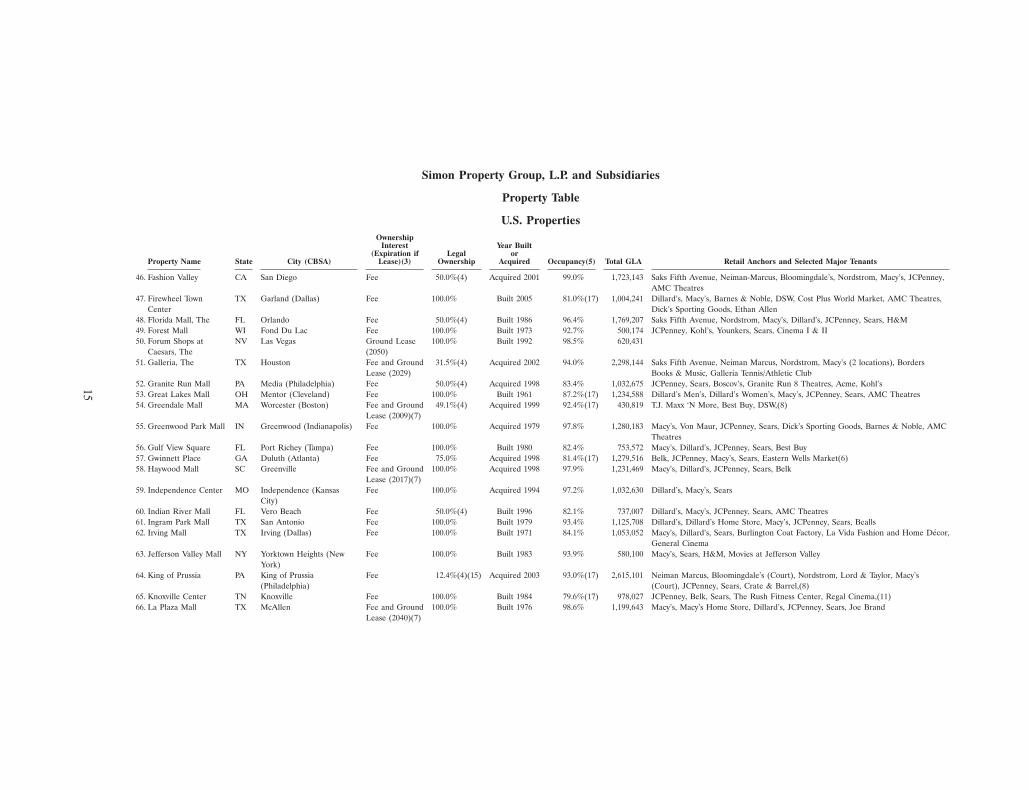
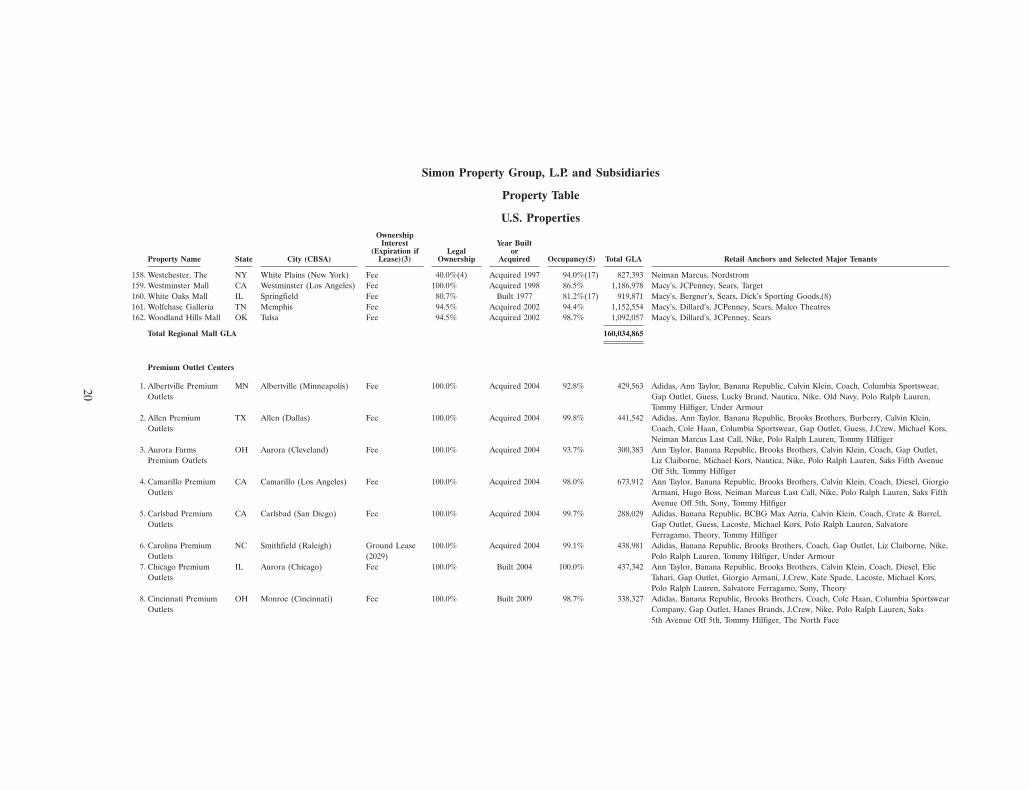
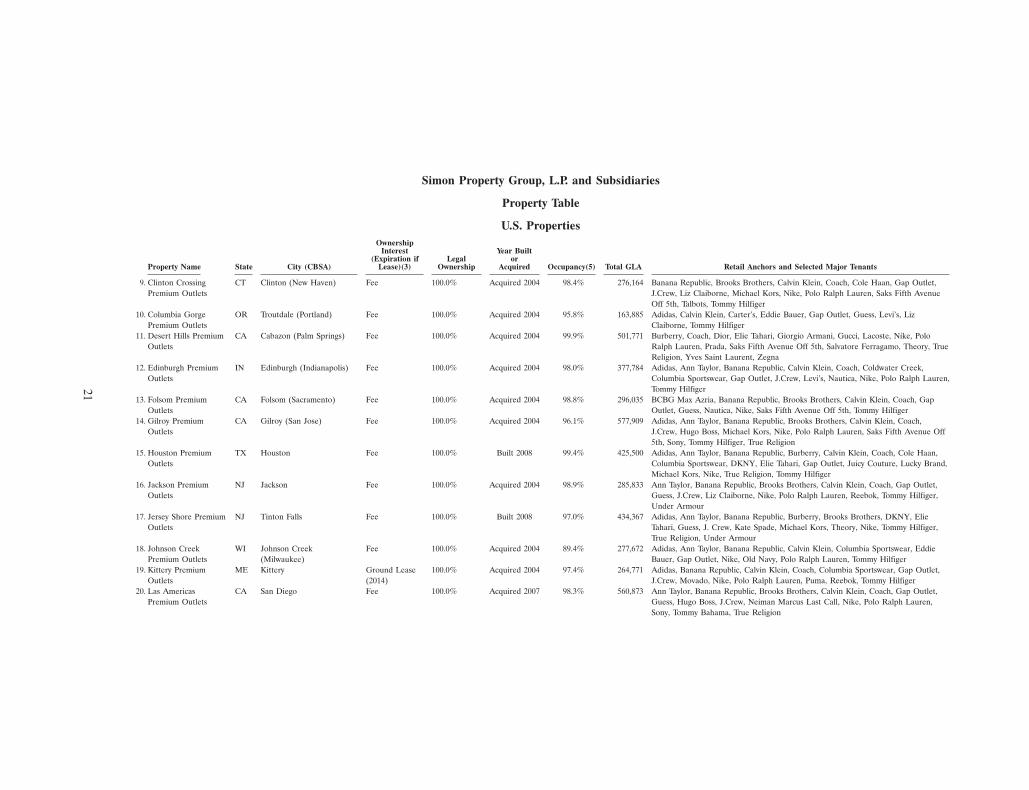
Item 2. Properties
United States Properties
Our U.S. properties primarily consist of regional malls, Premium Outlet Centers, The Mills, community/lifestylecenters, and other properties. These properties contain an aggregate of approximately 244.8 million square feet ofgross leasable area, or GLA, of which we own approximately 152.3 million square feet. Total estimated retail sales atthe properties in 2009 were approximately $58 billion.
11

Regional malls typically contain at least one traditional department store anchor or a combination of anchorsand big box retailers with a wide variety of smaller stores connecting the anchors. Additional stores are usually locatedalong the perimeter of the parking area. Our 162 regional malls are generally enclosed centers and range in size fromapproximately 400,000 to 2.3 million square feet of GLA. Our regional malls contain in the aggregate more than18,600 occupied stores, including approximately 710 anchors, which are mostly national retailers. For comparativepurposes, we separate the information in this section on the 16 regional malls acquired from The Mills Corporation in2007, or the Mills Regional Malls, from the information on our other regional malls.
Premium Outlet Centers generally contain a wide variety of designer and manufacturer stores located in anopen-air center. Our 41 Premium Outlet Centers range in size from approximately 200,000 to 850,000 square feet ofGLA. The Premium Outlet Centers are generally located near major metropolitan areas and tourist destinationsincluding New York City, Los Angeles, Boston, Palm Springs, Orlando, Las Vegas, and Honolulu.
The Mills generally range in size from 1.0 million to 2.3 million square feet of GLA and are located in majormetropolitan areas. They have a combination of traditional mall, outlet center, and big box retailers and entertainmentuses. The Mills Regional Malls typically range in size from 700,000 to 1.3 million square feet of GLA and contain awide variety of national retailers.
Community/lifestyle centers are generally unenclosed and smaller than our regional malls. Our 67 community/lifestyle centers generally range in size from approximately 100,000 to 900,000 square feet of GLA. Community/lifestyle centers are designed to serve a larger trade area and typically contain anchor stores and other national retailtenants, which occupy a significant portion of the GLA of the center. We also own traditional community shoppingcenters that focus primarily on value-oriented and convenience goods and services. These centers are usually anchoredby a supermarket, discount retailer, or drugstore and are designed to service a neighborhood area. Finally, we ownopen-air centers adjacent to our regional malls designed to take advantage of the drawing power of the mall.
We also have interests in 15 other shopping centers or outlet centers. These properties range in size fromapproximately 85,000 to 1.0 million square feet of GLA, are considered non-core to our business model, and in totalrepresent less than 1% of our total operating income before depreciation.
The following table provides representative data for our U.S. properties on a gross basis as of December 31,2009:
Mills PortfolioPremium (including The Community/
Regional Outlet Mills and Mills Lifestyle OtherMalls Centers Regional Malls) Centers Properties
% of total property annualized base rent . . . . . . 62.7% 15.2% 16.2% 5.1% 0.8%% of total property GLA . . . . . . . . . . . . . . . . . 65.4% 7.0% 16.8% 8.3% 2.5%% of owned property GLA . . . . . . . . . . . . . . . . 57.7% 11.1% 19.5% 9.1% 2.6%
As of December 31, 2009, approximately 92.1% of the owned GLA in regional malls and the retail space of theother properties was leased, approximately 97.9% of owned GLA in the Premium Outlet Centers was leased,approximately 93.9% of the owned GLA for The Mills and 89.3% of owned GLA for the Mills Regional Malls wasleased, and approximately 90.7% of owned GLA in the community/lifestyle centers was leased.
We hold a 100% interest in 200 of our properties, effectively control 18 properties in which we have a jointventure interest, and hold the remaining 103 properties through unconsolidated joint venture interests. We are themanaging or co-managing general partner or member of 311 properties. Substantially all of our joint ventureproperties are subject to rights of first refusal, buy-sell provisions, or other sale rights for all partners which arecustomary in real estate partnership agreements and the industry. Our partners in our joint ventures may initiate theseprovisions at any time, which will result in either the use of available cash or borrowings to acquire their partnershipinterest or the disposal of our partnership interest.
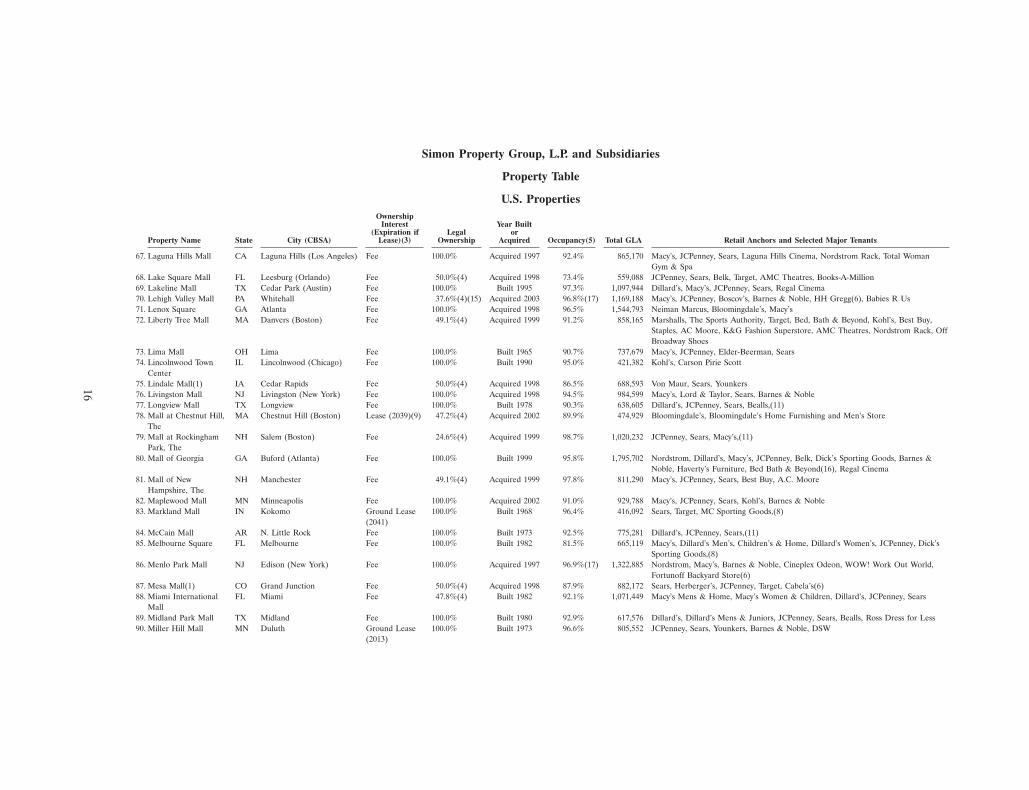
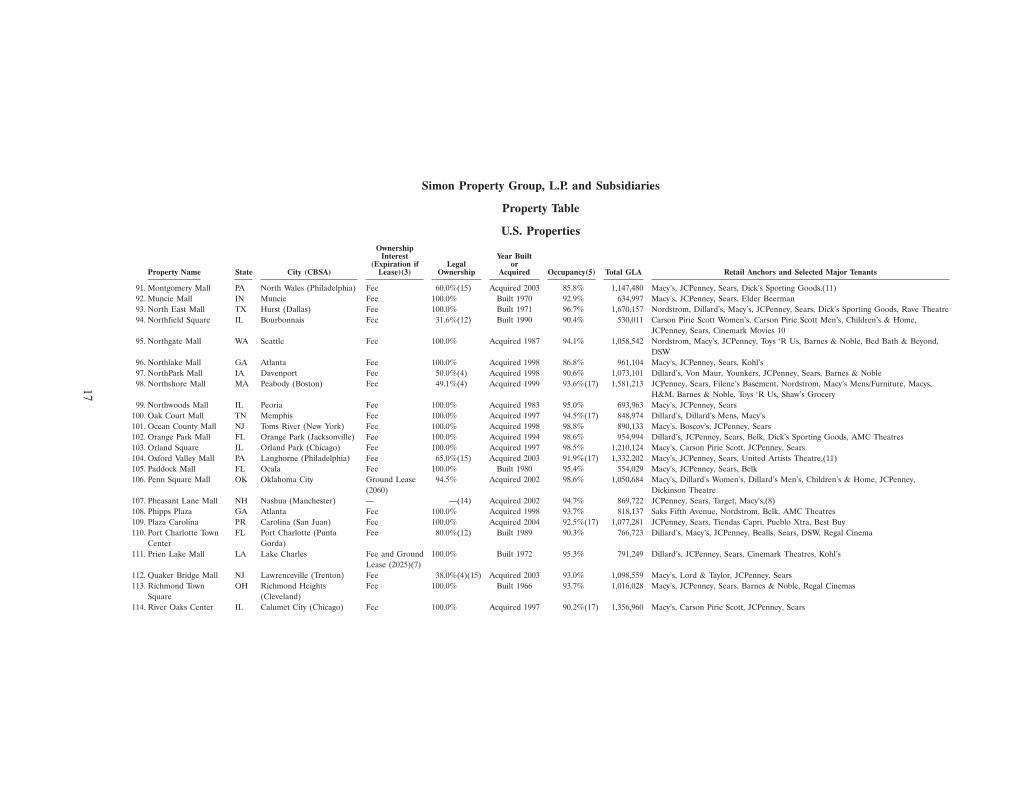
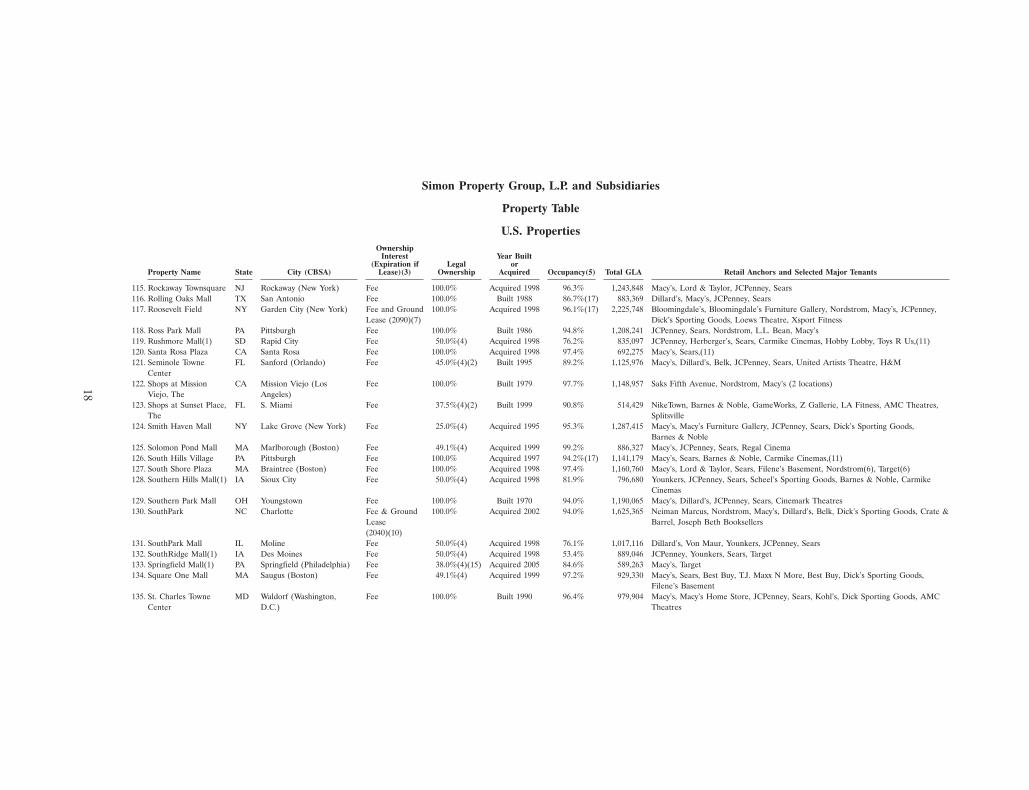
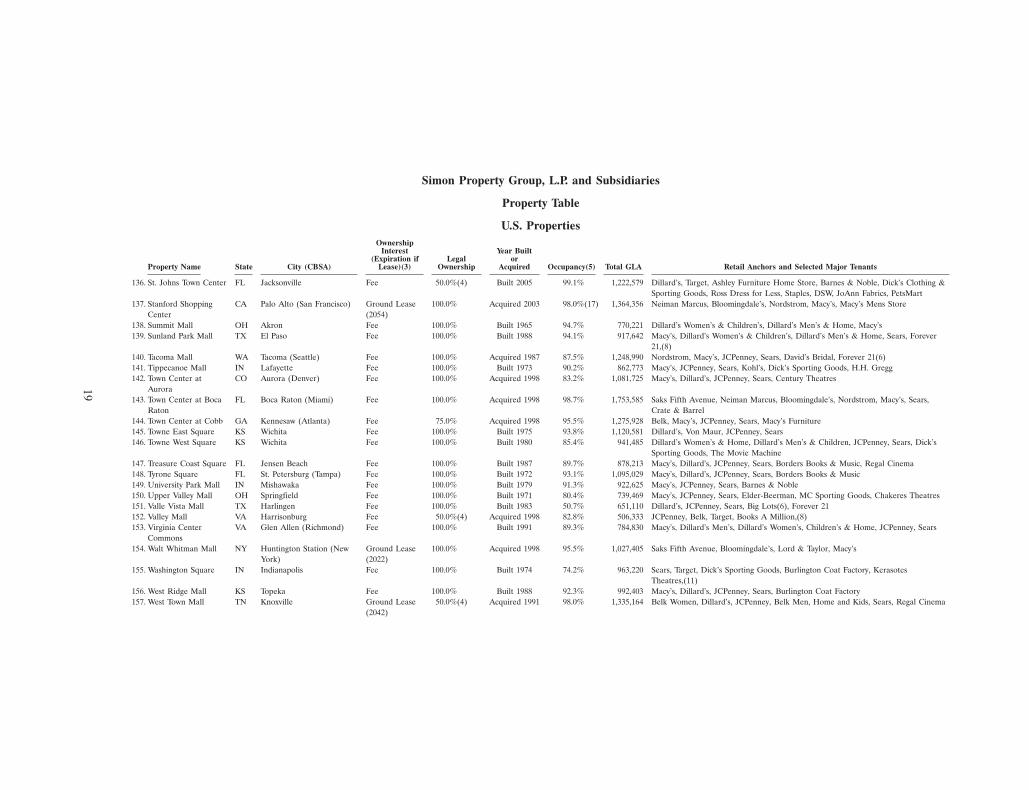
The following property table summarizes certain data for our regional malls, Premium Outlet Centers, TheMills, the Mills Regional Malls, and community/lifestyle centers located in the United States, including Puerto Rico, asof December 31, 2009.
12
13
Simon Property Group, L.P. and Subsidiaries
Property Table
U.S. PropertiesOwnership
Interest Year Built(Expiration if Legal or
Property Name State City (CBSA) Lease)(3) Ownership Acquired Occupancy(5) Total GLA Retail Anchors and Selected Major Tenants
Regional Malls
1. Anderson Mall SC Anderson (Greenville) Fee 100.0% Built 1972 83.0% 671,881 Belk Ladies Fashion Store, Belk Men’s & Home Store, JCPenney, Sears, Dillard’s,Books A Million(6)
2. Apple Blossom Mall VA Winchester Fee 49.1%(4) Acquired 1999 89.8% 440,042 Belk, JCPenney, Sears, Eastwynn Theatres3. Arsenal Mall MA Watertown (Boston) Fee 100.0% Acquired 1999 95.4%(17) 504,334 Marshalls, Filene’s Basement4. Atrium Mall MA Chestnut Hill (Boston) Fee 49.1%(4) Acquired 1999 95.0% 205,461 Borders Books & Music5. Auburn Mall MA Auburn (Worcester) Fee 49.1%(4) Acquired 1999 99.4% 588,330 Macy’s, Macy’s Home Store, Sears6. Aventura Mall(1) FL Miami Beach Fee 33.3%(4) Built 1983 96.0% 2,099,768 Bloomingdale’s, Macy’s, Macy’s Mens & Home Furniture, JCPenney, Sears,
Nordstrom, Equinox Fitness Clubs, AMC Theatre7. Avenues, The FL Jacksonville Fee 25.0%(4)(2) Built 1990 94.0% 1,117,396 Belk, Dillard’s, JCPenney, Belk Men and Kids, Sears8. Bangor Mall ME Bangor Fee 67.4%(15) Acquired 2003 91.6% 652,842 Macy’s, JCPenney, Sears, Dick’s Sporting Goods9. Barton Creek Square TX Austin Fee 100.0% Built 1981 98.0% 1,429,623 Nordstrom, Macy’s, Dillard’s Women’s & Home, Dillard’s Men’s & Children’s,
JCPenney, Sears, AMC Theatre10. Battlefield Mall MO Springfield Fee and Ground 100.0% Built 1970 95.1% 1,198,568 Macy’s, Dillard’s Women’s, Dillard’s Men’s, Children’s & Home, JCPenney, Sears
Lease (2056)11. Bay Park Square WI Green Bay Fee 100.0% Built 1980 93.0% 710,973 Younkers, Younkers Home Furniture Gallery, Kohl’s, ShopKo, Marcus Cinema 1612. Bowie Town Center MD Bowie (Washington, D.C.) Fee 100.0% Built 2001 97.9% 684,297 Macy’s, Sears, Barnes & Noble, Bed Bath & Beyond, Best Buy, Safeway13. Boynton Beach Mall FL Boynton Beach (Miami) Fee 100.0% Built 1985 84.7% 1,100,250 Macy’s, Dillard’s Men’s & Home, Dillard’s Women, JCPenney, Sears, Cinemark
Theatres14. Brea Mall CA Brea (Los Angeles) Fee 100.0% Acquired 1998 96.8% 1,319,678 Nordstrom, Macy’s, JCPenney, Sears, Macy’s Men’s Children & Home.15. Broadway Square TX Tyler Fee 100.0% Acquired 1994 98.5% 628,103 Dillard’s, JCPenney, Sears16. Brunswick Square NJ East Brunswick (New York) Fee 100.0% Built 1973 95.8% 765,149 Macy’s, JCPenney, Barnes & Noble, Mega Movies17. Burlington Mall MA Burlington (Boston) Ground Lease 100.0% Acquired 1998 96.6% 1,317,842 Macy’s, Lord & Taylor, Sears, Nordstrom, Crate & Barrel
(2048)18. Cape Cod Mall MA Hyannis Ground Leases 49.1%(4) Acquired 1999 94.5% 725,595 Macy’s, Macy’s Men’s and Home, Sears, Best Buy, Marshalls, Barnes & Noble,
(2029-2073)(7) Regal Cinema19. Castleton Square IN Indianapolis Fee 100.0% Built 1972 94.3% 1,381,405 Macy’s, Von Maur, JCPenney, Sears, Dick’s Sporting Goods, Borders Books &
Music, AMC Theatres20. Century III Mall PA West Mifflin (Pittsburgh) Fee 100.0% Built 1979 76.1%(17) 1,225,538 Macy’s, JCPenney, Sears, Dick’s Sporting Goods, Macy’s Jr.,(8)21. Charlottesville Fashion VA Charlottesville Ground Lease 100.0% Acquired 1997 94.3% 569,861 Belk Women’s & Children’s, Belk Men’s & Home, JCPenney, Sears
Square (2076)22. Chautauqua Mall NY Lakewood (Jamestown) Fee 100.0% Built 1971 82.3% 425,291 Sears, JCPenney, Bon Ton, Office Max, Dipson Cinema23. Chesapeake Square VA Chesapeake (Virginia Fee and Ground 75.0%(12) Built 1989 86.5% 792,428 Macy’s, JCPenney, Sears, Target, Burlington Coat Factory(6),(11)
Beach) Lease (2062)
14
Simon Property Group, L.P. and Subsidiaries
Property Table
U.S. PropertiesOwnership
Interest Year Built(Expiration if Legal or
Property Name State City (CBSA) Lease)(3) Ownership Acquired Occupancy(5) Total GLA Retail Anchors and Selected Major Tenants
24. Cielo Vista Mall TX El Paso Fee and Ground 100.0% Built 1974 98.0% 1,244,020 Macy’s, Dillard’s Women’s & Furniture, Dillard’s Men’s, Children’s & Home,Lease (2022)(7) JCPenney, Sears, Cinemark Theatres
25. Circle Centre IN Indianapolis Property Lease 14.7%(4)(2) Built 1995 96.7% 735,922 Nordstrom, Carson Pirie Scott, United Artists Theatre(2097)
26. Coconut Point FL Estero (Cape Coral) Fee 50.0%(4) Built 2006 96.2%(17) 1,196,150 Dillard’s, Barnes & Noble, Bed Bath & Beyond, Best Buy, DSW, Office Max,PetsMart, Ross Dress for Less, Cost Plus World Market, T.J. Maxx, HollywoodTheatres, Super Target
27. Coddingtown Mall CA Santa Rosa Fee 50.0%(4) Acquired 2005 86.2% 791,943 Macy’s, JCPenney, Whole Foods(6),(8)28. College Mall IN Bloomington Fee and Ground 100.0% Built 1965 86.2% 636,563 Macy’s, Sears, Target, Dick’s Sporting Goods, Bed Bath & Beyond
Lease (2048)(7)29. Columbia Center WA Kennewick Fee 100.0% Acquired 1987 92.6% 768,430 Macy’s, Macy’s Mens & Children, JCPenney, Sears, Barnes & Noble, Regal Cinema30. Copley Place MA Boston Fee 98.1% Acquired 2002 95.6%(17) 1,243,500 Neiman Marcus, Barneys New York31. Coral Square FL Coral Springs (Miami) Fee 97.2% Built 1984 95.9% 941,339 Macy’s Mens, Children & Home, Macy’s Women, Dillard’s, JCPenney, Sears32. Cordova Mall FL Pensacola Fee 100.0% Acquired 1998 98.3% 851,563 Dillard’s Men’s, Dillard’s Women’s, Belk, Best Buy, Bed Bath & Beyond, Cost Plus
World Market, Ross Dress for Less33. Cottonwood Mall NM Albuquerque Fee 100.0% Built 1996 96.5% 1,040,700 Macy’s, Dillard’s, JCPenney, Sears, United Artists Theatre,(11)34. Crossroads Mall NE Omaha Fee 100.0% Acquired 1994 59.7% 677,320 Sears, Target, Barnes & Noble,(11)35. Crystal Mall CT Waterford Fee 74.6%(4) Acquired 1998 89.2% 782,829 Macy’s, JC Penney, Sears, Bed Bath & Beyond, Christmas Tree Store36. Crystal River Mall FL Crystal River Fee 100.0% Built 1990 77.2% 420,109 JCPenney, Sears, Belk, Kmart, Regal Cinema37. Dadeland Mall FL Miami Fee 50.0%(4) Acquired 1997 100.0% 1,487,689 Saks Fifth Avenue, Nordstrom, Macy’s, Macy’s Children & Home, JCPenney38. DeSoto Square FL Bradenton Fee 100.0% Built 1973 78.2% 678,310 Macy’s, JCPenney, Sears,(8)39. Domain, The TX Austin Fee 100.0% Built 2006 92.8%(17) 674,588 Neiman Marcus, Macy’s, Borders Books & Music, Dick’s Sporting Goods, Gold
Class Cinemas(6), Dillard’s(6)40. Eastland Mall IN Evansville Fee 50.0%(4) Acquired 1998 95.6% 865,310 Macy’s, JCPenney, Dillard’s41. Edison Mall FL Fort Myers Fee 100.0% Acquired 1997 96.8% 1,050,922 Dillard’s, Macy’s Mens, Children & Home, Macy’s Women, JCPenney, Sears42. Emerald Square MA North Attleboro Fee 49.1%(4) Acquired 1999 89.9% 1,022,545 Macy’s, Macy’s Mens & Home Store, JCPenney, Sears
(Providence—RI)43. Empire Mall(1) SD Sioux Falls Fee and Ground 50.0%(4) Acquired 1998 94.5% 1,074,085 Macy’s, Younkers, JCPenney, Sears, Gordmans, Hy-Vee
Lease (2033)(7)44. Fashion Centre at VA Arlington (Washington, Fee 42.5%(4) Built 1989 99.3%(17) 988,904 Nordstrom, Macy’s
Pentagon City, The DC)45. Fashion Mall at IN Indianapolis Ground Lease 100.0% Acquired 1997 92.8% 683,490 Saks Fifth Avenue, Crate & Barrel, Nordstrom, Keystone Art Cinema
Keystone, The (2067)
15
Simon Property Group, L.P. and Subsidiaries
Property Table
U.S. PropertiesOwnership
Interest Year Built(Expiration if Legal or
Property Name State City (CBSA) Lease)(3) Ownership Acquired Occupancy(5) Total GLA Retail Anchors and Selected Major Tenants
46. Fashion Valley CA San Diego Fee 50.0%(4) Acquired 2001 99.0% 1,723,143 Saks Fifth Avenue, Neiman-Marcus, Bloomingdale’s, Nordstrom, Macy’s, JCPenney,AMC Theatres
47. Firewheel Town TX Garland (Dallas) Fee 100.0% Built 2005 81.0%(17) 1,004,241 Dillard’s, Macy’s, Barnes & Noble, DSW, Cost Plus World Market, AMC Theatres,Center Dick’s Sporting Goods, Ethan Allen
48. Florida Mall, The FL Orlando Fee 50.0%(4) Built 1986 96.4% 1,769,207 Saks Fifth Avenue, Nordstrom, Macy’s, Dillard’s, JCPenney, Sears, H&M49. Forest Mall WI Fond Du Lac Fee 100.0% Built 1973 92.7% 500,174 JCPenney, Kohl’s, Younkers, Sears, Cinema I & II50. Forum Shops at NV Las Vegas Ground Lease 100.0% Built 1992 98.5% 620,431
Caesars, The (2050)51. Galleria, The TX Houston Fee and Ground 31.5%(4) Acquired 2002 94.0% 2,298,144 Saks Fifth Avenue, Neiman Marcus, Nordstrom, Macy’s (2 locations), Borders
Lease (2029) Books & Music, Galleria Tennis/Athletic Club52. Granite Run Mall PA Media (Philadelphia) Fee 50.0%(4) Acquired 1998 83.4% 1,032,675 JCPenney, Sears, Boscov’s, Granite Run 8 Theatres, Acme, Kohl’s53. Great Lakes Mall OH Mentor (Cleveland) Fee 100.0% Built 1961 87.2%(17) 1,234,588 Dillard’s Men’s, Dillard’s Women’s, Macy’s, JCPenney, Sears, AMC Theatres54. Greendale Mall MA Worcester (Boston) Fee and Ground 49.1%(4) Acquired 1999 92.4%(17) 430,819 T.J. Maxx ‘N More, Best Buy, DSW,(8)
Lease (2009)(7)55. Greenwood Park Mall IN Greenwood (Indianapolis) Fee 100.0% Acquired 1979 97.8% 1,280,183 Macy’s, Von Maur, JCPenney, Sears, Dick’s Sporting Goods, Barnes & Noble, AMC
Theatres56. Gulf View Square FL Port Richey (Tampa) Fee 100.0% Built 1980 82.4% 753,572 Macy’s, Dillard’s, JCPenney, Sears, Best Buy57. Gwinnett Place GA Duluth (Atlanta) Fee 75.0% Acquired 1998 81.4%(17) 1,279,516 Belk, JCPenney, Macy’s, Sears, Eastern Wells Market(6)58. Haywood Mall SC Greenville Fee and Ground 100.0% Acquired 1998 97.9% 1,231,469 Macy’s, Dillard’s, JCPenney, Sears, Belk
Lease (2017)(7)59. Independence Center MO Independence (Kansas Fee 100.0% Acquired 1994 97.2% 1,032,630 Dillard’s, Macy’s, Sears
City)60. Indian River Mall FL Vero Beach Fee 50.0%(4) Built 1996 82.1% 737,007 Dillard’s, Macy’s, JCPenney, Sears, AMC Theatres61. Ingram Park Mall TX San Antonio Fee 100.0% Built 1979 93.4% 1,125,708 Dillard’s, Dillard’s Home Store, Macy’s, JCPenney, Sears, Bealls62. Irving Mall TX Irving (Dallas) Fee 100.0% Built 1971 84.1% 1,053,052 Macy’s, Dillard’s, Sears, Burlington Coat Factory, La Vida Fashion and Home Decor,
General Cinema63. Jefferson Valley Mall NY Yorktown Heights (New Fee 100.0% Built 1983 93.9% 580,100 Macy’s, Sears, H&M, Movies at Jefferson Valley
York)64. King of Prussia PA King of Prussia Fee 12.4%(4)(15) Acquired 2003 93.0%(17) 2,615,101 Neiman Marcus, Bloomingdale’s (Court), Nordstrom, Lord & Taylor, Macy’s
(Philadelphia) (Court), JCPenney, Sears, Crate & Barrel,(8)65. Knoxville Center TN Knoxville Fee 100.0% Built 1984 79.6%(17) 978,027 JCPenney, Belk, Sears, The Rush Fitness Center, Regal Cinema,(11)66. La Plaza Mall TX McAllen Fee and Ground 100.0% Built 1976 98.6% 1,199,643 Macy’s, Macy’s Home Store, Dillard’s, JCPenney, Sears, Joe Brand
Lease (2040)(7)
16
Simon Property Group, L.P. and Subsidiaries
Property Table
U.S. PropertiesOwnership
Interest Year Built(Expiration if Legal or
Property Name State City (CBSA) Lease)(3) Ownership Acquired Occupancy(5) Total GLA Retail Anchors and Selected Major Tenants
67. Laguna Hills Mall CA Laguna Hills (Los Angeles) Fee 100.0% Acquired 1997 92.4% 865,170 Macy’s, JCPenney, Sears, Laguna Hills Cinema, Nordstrom Rack, Total WomanGym & Spa
68. Lake Square Mall FL Leesburg (Orlando) Fee 50.0%(4) Acquired 1998 73.4% 559,088 JCPenney, Sears, Belk, Target, AMC Theatres, Books-A-Million69. Lakeline Mall TX Cedar Park (Austin) Fee 100.0% Built 1995 97.3% 1,097,944 Dillard’s, Macy’s, JCPenney, Sears, Regal Cinema70. Lehigh Valley Mall PA Whitehall Fee 37.6%(4)(15) Acquired 2003 96.8%(17) 1,169,188 Macy’s, JCPenney, Boscov’s, Barnes & Noble, HH Gregg(6), Babies R Us71. Lenox Square GA Atlanta Fee 100.0% Acquired 1998 96.5% 1,544,793 Neiman Marcus, Bloomingdale’s, Macy’s72. Liberty Tree Mall MA Danvers (Boston) Fee 49.1%(4) Acquired 1999 91.2% 858,165 Marshalls, The Sports Authority, Target, Bed, Bath & Beyond, Kohl’s, Best Buy,
Staples, AC Moore, K&G Fashion Superstore, AMC Theatres, Nordstrom Rack, OffBroadway Shoes
73. Lima Mall OH Lima Fee 100.0% Built 1965 90.7% 737,679 Macy’s, JCPenney, Elder-Beerman, Sears74. Lincolnwood Town IL Lincolnwood (Chicago) Fee 100.0% Built 1990 95.0% 421,382 Kohl’s, Carson Pirie Scott
Center75. Lindale Mall(1) IA Cedar Rapids Fee 50.0%(4) Acquired 1998 86.5% 688,593 Von Maur, Sears, Younkers76. Livingston Mall NJ Livingston (New York) Fee 100.0% Acquired 1998 94.5% 984,599 Macy’s, Lord & Taylor, Sears, Barnes & Noble77. Longview Mall TX Longview Fee 100.0% Built 1978 90.3% 638,605 Dillard’s, JCPenney, Sears, Bealls,(11)78. Mall at Chestnut Hill, MA Chestnut Hill (Boston) Lease (2039)(9) 47.2%(4) Acquired 2002 89.9% 474,929 Bloomingdale’s, Bloomingdale’s Home Furnishing and Men’s Store
The79. Mall at Rockingham NH Salem (Boston) Fee 24.6%(4) Acquired 1999 98.7% 1,020,232 JCPenney, Sears, Macy’s,(11)
Park, The80. Mall of Georgia GA Buford (Atlanta) Fee 100.0% Built 1999 95.8% 1,795,702 Nordstrom, Dillard’s, Macy’s, JCPenney, Belk, Dick’s Sporting Goods, Barnes &
Noble, Haverty’s Furniture, Bed Bath & Beyond(16), Regal Cinema81. Mall of New NH Manchester Fee 49.1%(4) Acquired 1999 97.8% 811,290 Macy’s, JCPenney, Sears, Best Buy, A.C. Moore
Hampshire, The82. Maplewood Mall MN Minneapolis Fee 100.0% Acquired 2002 91.0% 929,788 Macy’s, JCPenney, Sears, Kohl’s, Barnes & Noble83. Markland Mall IN Kokomo Ground Lease 100.0% Built 1968 96.4% 416,092 Sears, Target, MC Sporting Goods,(8)
(2041)84. McCain Mall AR N. Little Rock Fee 100.0% Built 1973 92.5% 775,281 Dillard’s, JCPenney, Sears,(11)85. Melbourne Square FL Melbourne Fee 100.0% Built 1982 81.5% 665,119 Macy’s, Dillard’s Men’s, Children’s & Home, Dillard’s Women’s, JCPenney, Dick’s
Sporting Goods,(8)86. Menlo Park Mall NJ Edison (New York) Fee 100.0% Acquired 1997 96.9%(17) 1,322,885 Nordstrom, Macy’s, Barnes & Noble, Cineplex Odeon, WOW! Work Out World,
Fortunoff Backyard Store(6)87. Mesa Mall(1) CO Grand Junction Fee 50.0%(4) Acquired 1998 87.9% 882,172 Sears, Herberger’s, JCPenney, Target, Cabela’s(6)88. Miami International FL Miami Fee 47.8%(4) Built 1982 92.1% 1,071,449 Macy’s Mens & Home, Macy’s Women & Children, Dillard’s, JCPenney, Sears
Mall89. Midland Park Mall TX Midland Fee 100.0% Built 1980 92.9% 617,576 Dillard’s, Dillard’s Mens & Juniors, JCPenney, Sears, Bealls, Ross Dress for Less90. Miller Hill Mall MN Duluth Ground Lease 100.0% Built 1973 96.6% 805,552 JCPenney, Sears, Younkers, Barnes & Noble, DSW
(2013)
17
Simon Property Group, L.P. and Subsidiaries
Property Table
U.S. PropertiesOwnership
Interest Year Built(Expiration if Legal or
Property Name State City (CBSA) Lease)(3) Ownership Acquired Occupancy(5) Total GLA Retail Anchors and Selected Major Tenants
91. Montgomery Mall PA North Wales (Philadelphia) Fee 60.0%(15) Acquired 2003 85.8% 1,147,480 Macy’s, JCPenney, Sears, Dick’s Sporting Goods,(11)92. Muncie Mall IN Muncie Fee 100.0% Built 1970 92.9% 634,997 Macy’s, JCPenney, Sears, Elder Beerman93. North East Mall TX Hurst (Dallas) Fee 100.0% Built 1971 96.7% 1,670,157 Nordstrom, Dillard’s, Macy’s, JCPenney, Sears, Dick’s Sporting Goods, Rave Theatre94. Northfield Square IL Bourbonnais Fee 31.6%(12) Built 1990 90.4% 530,011 Carson Pirie Scott Women’s, Carson Pirie Scott Men’s, Children’s & Home,
JCPenney, Sears, Cinemark Movies 1095. Northgate Mall WA Seattle Fee 100.0% Acquired 1987 94.1% 1,058,542 Nordstrom, Macy’s, JCPenney, Toys ‘R Us, Barnes & Noble, Bed Bath & Beyond,
DSW96. Northlake Mall GA Atlanta Fee 100.0% Acquired 1998 86.8% 961,104 Macy’s, JCPenney, Sears, Kohl’s97. NorthPark Mall IA Davenport Fee 50.0%(4) Acquired 1998 90.6% 1,073,101 Dillard’s, Von Maur, Younkers, JCPenney, Sears, Barnes & Noble98. Northshore Mall MA Peabody (Boston) Fee 49.1%(4) Acquired 1999 93.6%(17) 1,581,213 JCPenney, Sears, Filene’s Basement, Nordstrom, Macy’s Mens/Furniture, Macys,
H&M, Barnes & Noble, Toys ‘R Us, Shaw’s Grocery99. Northwoods Mall IL Peoria Fee 100.0% Acquired 1983 95.0% 693,963 Macy’s, JCPenney, Sears
100. Oak Court Mall TN Memphis Fee 100.0% Acquired 1997 94.5%(17) 848,974 Dillard’s, Dillard’s Mens, Macy’s101. Ocean County Mall NJ Toms River (New York) Fee 100.0% Acquired 1998 98.8% 890,133 Macy’s, Boscov’s, JCPenney, Sears102. Orange Park Mall FL Orange Park (Jacksonville) Fee 100.0% Acquired 1994 98.6% 954,994 Dillard’s, JCPenney, Sears, Belk, Dick’s Sporting Goods, AMC Theatres103. Orland Square IL Orland Park (Chicago) Fee 100.0% Acquired 1997 98.5% 1,210,124 Macy’s, Carson Pirie Scott, JCPenney, Sears104. Oxford Valley Mall PA Langhorne (Philadelphia) Fee 65.0%(15) Acquired 2003 91.9%(17) 1,332,202 Macy’s, JCPenney, Sears, United Artists Theatre,(11)105. Paddock Mall FL Ocala Fee 100.0% Built 1980 95.4% 554,029 Macy’s, JCPenney, Sears, Belk106. Penn Square Mall OK Oklahoma City Ground Lease 94.5% Acquired 2002 98.6% 1,050,684 Macy’s, Dillard’s Women’s, Dillard’s Men’s, Children’s & Home, JCPenney,
(2060) Dickinson Theatre107. Pheasant Lane Mall NH Nashua (Manchester) — —(14) Acquired 2002 94.7% 869,722 JCPenney, Sears, Target, Macy’s,(8)108. Phipps Plaza GA Atlanta Fee 100.0% Acquired 1998 93.7% 818,137 Saks Fifth Avenue, Nordstrom, Belk, AMC Theatres109. Plaza Carolina PR Carolina (San Juan) Fee 100.0% Acquired 2004 92.5%(17) 1,077,281 JCPenney, Sears, Tiendas Capri, Pueblo Xtra, Best Buy110. Port Charlotte Town FL Port Charlotte (Punta Fee 80.0%(12) Built 1989 90.3% 766,723 Dillard’s, Macy’s, JCPenney, Bealls, Sears, DSW, Regal Cinema
Center Gorda)111. Prien Lake Mall LA Lake Charles Fee and Ground 100.0% Built 1972 95.3% 791,249 Dillard’s, JCPenney, Sears, Cinemark Theatres, Kohl’s
Lease (2025)(7)112. Quaker Bridge Mall NJ Lawrenceville (Trenton) Fee 38.0%(4)(15) Acquired 2003 93.0% 1,098,559 Macy’s, Lord & Taylor, JCPenney, Sears113. Richmond Town OH Richmond Heights Fee 100.0% Built 1966 93.7% 1,016,028 Macy’s, JCPenney, Sears, Barnes & Noble, Regal Cinemas
Square (Cleveland)114. River Oaks Center IL Calumet City (Chicago) Fee 100.0% Acquired 1997 90.2%(17) 1,356,960 Macy’s, Carson Pirie Scott, JCPenney, Sears
18
Simon Property Group, L.P. and Subsidiaries
Property Table
U.S. PropertiesOwnership
Interest Year Built(Expiration if Legal or
Property Name State City (CBSA) Lease)(3) Ownership Acquired Occupancy(5) Total GLA Retail Anchors and Selected Major Tenants
115. Rockaway Townsquare NJ Rockaway (New York) Fee 100.0% Acquired 1998 96.3% 1,243,848 Macy’s, Lord & Taylor, JCPenney, Sears116. Rolling Oaks Mall TX San Antonio Fee 100.0% Built 1988 86.7%(17) 883,369 Dillard’s, Macy’s, JCPenney, Sears117. Roosevelt Field NY Garden City (New York) Fee and Ground 100.0% Acquired 1998 96.1%(17) 2,225,748 Bloomingdale’s, Bloomingdale’s Furniture Gallery, Nordstrom, Macy’s, JCPenney,
Lease (2090)(7) Dick’s Sporting Goods, Loews Theatre, Xsport Fitness118. Ross Park Mall PA Pittsburgh Fee 100.0% Built 1986 94.8% 1,208,241 JCPenney, Sears, Nordstrom, L.L. Bean, Macy’s119. Rushmore Mall(1) SD Rapid City Fee 50.0%(4) Acquired 1998 76.2% 835,097 JCPenney, Herberger’s, Sears, Carmike Cinemas, Hobby Lobby, Toys R Us,(11)120. Santa Rosa Plaza CA Santa Rosa Fee 100.0% Acquired 1998 97.4% 692,275 Macy’s, Sears,(11)121. Seminole Towne FL Sanford (Orlando) Fee 45.0%(4)(2) Built 1995 89.2% 1,125,976 Macy’s, Dillard’s, Belk, JCPenney, Sears, United Artists Theatre, H&M
Center122. Shops at Mission CA Mission Viejo (Los Fee 100.0% Built 1979 97.7% 1,148,957 Saks Fifth Avenue, Nordstrom, Macy’s (2 locations)
Viejo, The Angeles)123. Shops at Sunset Place, FL S. Miami Fee 37.5%(4)(2) Built 1999 90.8% 514,429 NikeTown, Barnes & Noble, GameWorks, Z Gallerie, LA Fitness, AMC Theatres,
The Splitsville124. Smith Haven Mall NY Lake Grove (New York) Fee 25.0%(4) Acquired 1995 95.3% 1,287,415 Macy’s, Macy’s Furniture Gallery, JCPenney, Sears, Dick’s Sporting Goods,
Barnes & Noble125. Solomon Pond Mall MA Marlborough (Boston) Fee 49.1%(4) Acquired 1999 99.2% 886,327 Macy’s, JCPenney, Sears, Regal Cinema126. South Hills Village PA Pittsburgh Fee 100.0% Acquired 1997 94.2%(17) 1,141,179 Macy’s, Sears, Barnes & Noble, Carmike Cinemas,(11)127. South Shore Plaza MA Braintree (Boston) Fee 100.0% Acquired 1998 97.4% 1,160,760 Macy’s, Lord & Taylor, Sears, Filene’s Basement, Nordstrom(6), Target(6)128. Southern Hills Mall(1) IA Sioux City Fee 50.0%(4) Acquired 1998 81.9% 796,680 Younkers, JCPenney, Sears, Scheel’s Sporting Goods, Barnes & Noble, Carmike
Cinemas129. Southern Park Mall OH Youngstown Fee 100.0% Built 1970 94.0% 1,190,065 Macy’s, Dillard’s, JCPenney, Sears, Cinemark Theatres130. SouthPark NC Charlotte Fee & Ground 100.0% Acquired 2002 94.0% 1,625,365 Neiman Marcus, Nordstrom, Macy’s, Dillard’s, Belk, Dick’s Sporting Goods, Crate &
Lease Barrel, Joseph Beth Booksellers(2040)(10)
131. SouthPark Mall IL Moline Fee 50.0%(4) Acquired 1998 76.1% 1,017,116 Dillard’s, Von Maur, Younkers, JCPenney, Sears132. SouthRidge Mall(1) IA Des Moines Fee 50.0%(4) Acquired 1998 53.4% 889,046 JCPenney, Younkers, Sears, Target133. Springfield Mall(1) PA Springfield (Philadelphia) Fee 38.0%(4)(15) Acquired 2005 84.6% 589,263 Macy’s, Target134. Square One Mall MA Saugus (Boston) Fee 49.1%(4) Acquired 1999 97.2% 929,330 Macy’s, Sears, Best Buy, T.J. Maxx N More, Best Buy, Dick’s Sporting Goods,
Filene’s Basement135. St. Charles Towne MD Waldorf (Washington, Fee 100.0% Built 1990 96.4% 979,904 Macy’s, Macy’s Home Store, JCPenney, Sears, Kohl’s, Dick Sporting Goods, AMC
Center D.C.) Theatres
19
Simon Property Group, L.P. and Subsidiaries
Property Table
U.S. PropertiesOwnership
Interest Year Built(Expiration if Legal or
Property Name State City (CBSA) Lease)(3) Ownership Acquired Occupancy(5) Total GLA Retail Anchors and Selected Major Tenants
136. St. Johns Town Center FL Jacksonville Fee 50.0%(4) Built 2005 99.1% 1,222,579 Dillard’s, Target, Ashley Furniture Home Store, Barnes & Noble, Dick’s Clothing &Sporting Goods, Ross Dress for Less, Staples, DSW, JoAnn Fabrics, PetsMart
137. Stanford Shopping CA Palo Alto (San Francisco) Ground Lease 100.0% Acquired 2003 98.0%(17) 1,364,356 Neiman Marcus, Bloomingdale’s, Nordstrom, Macy’s, Macy’s Mens StoreCenter (2054)
138. Summit Mall OH Akron Fee 100.0% Built 1965 94.7% 770,221 Dillard’s Women’s & Children’s, Dillard’s Men’s & Home, Macy’s139. Sunland Park Mall TX El Paso Fee 100.0% Built 1988 94.1% 917,642 Macy’s, Dillard’s Women’s & Children’s, Dillard’s Men’s & Home, Sears, Forever
21,(8)140. Tacoma Mall WA Tacoma (Seattle) Fee 100.0% Acquired 1987 87.5% 1,248,990 Nordstrom, Macy’s, JCPenney, Sears, David’s Bridal, Forever 21(6)141. Tippecanoe Mall IN Lafayette Fee 100.0% Built 1973 90.2% 862,773 Macy’s, JCPenney, Sears, Kohl’s, Dick’s Sporting Goods, H.H. Gregg142. Town Center at CO Aurora (Denver) Fee 100.0% Acquired 1998 83.2% 1,081,725 Macy’s, Dillard’s, JCPenney, Sears, Century Theatres
Aurora143. Town Center at Boca FL Boca Raton (Miami) Fee 100.0% Acquired 1998 98.7% 1,753,585 Saks Fifth Avenue, Neiman Marcus, Bloomingdale’s, Nordstrom, Macy’s, Sears,
Raton Crate & Barrel144. Town Center at Cobb GA Kennesaw (Atlanta) Fee 75.0% Acquired 1998 95.5% 1,275,928 Belk, Macy’s, JCPenney, Sears, Macy’s Furniture145. Towne East Square KS Wichita Fee 100.0% Built 1975 93.8% 1,120,581 Dillard’s, Von Maur, JCPenney, Sears146. Towne West Square KS Wichita Fee 100.0% Built 1980 85.4% 941,485 Dillard’s Women’s & Home, Dillard’s Men’s & Children, JCPenney, Sears, Dick’s
Sporting Goods, The Movie Machine147. Treasure Coast Square FL Jensen Beach Fee 100.0% Built 1987 89.7% 878,213 Macy’s, Dillard’s, JCPenney, Sears, Borders Books & Music, Regal Cinema148. Tyrone Square FL St. Petersburg (Tampa) Fee 100.0% Built 1972 93.1% 1,095,029 Macy’s, Dillard’s, JCPenney, Sears, Borders Books & Music149. University Park Mall IN Mishawaka Fee 100.0% Built 1979 91.3% 922,625 Macy’s, JCPenney, Sears, Barnes & Noble150. Upper Valley Mall OH Springfield Fee 100.0% Built 1971 80.4% 739,469 Macy’s, JCPenney, Sears, Elder-Beerman, MC Sporting Goods, Chakeres Theatres151. Valle Vista Mall TX Harlingen Fee 100.0% Built 1983 50.7% 651,110 Dillard’s, JCPenney, Sears, Big Lots(6), Forever 21152. Valley Mall VA Harrisonburg Fee 50.0%(4) Acquired 1998 82.8% 506,333 JCPenney, Belk, Target, Books A Million,(8)153. Virginia Center VA Glen Allen (Richmond) Fee 100.0% Built 1991 89.3% 784,830 Macy’s, Dillard’s Men’s, Dillard’s Women’s, Children’s & Home, JCPenney, Sears
Commons154. Walt Whitman Mall NY Huntington Station (New Ground Lease 100.0% Acquired 1998 95.5% 1,027,405 Saks Fifth Avenue, Bloomingdale’s, Lord & Taylor, Macy’s
York) (2022)155. Washington Square IN Indianapolis Fee 100.0% Built 1974 74.2% 963,220 Sears, Target, Dick’s Sporting Goods, Burlington Coat Factory, Kerasotes
Theatres,(11)156. West Ridge Mall KS Topeka Fee 100.0% Built 1988 92.3% 992,403 Macy’s, Dillard’s, JCPenney, Sears, Burlington Coat Factory157. West Town Mall TN Knoxville Ground Lease 50.0%(4) Acquired 1991 98.0% 1,335,164 Belk Women, Dillard’s, JCPenney, Belk Men, Home and Kids, Sears, Regal Cinema
(2042)
20
Simon Property Group, L.P. and Subsidiaries
Property Table
U.S. PropertiesOwnership
Interest Year Built(Expiration if Legal or
Property Name State City (CBSA) Lease)(3) Ownership Acquired Occupancy(5) Total GLA Retail Anchors and Selected Major Tenants
158. Westchester, The NY White Plains (New York) Fee 40.0%(4) Acquired 1997 94.0%(17) 827,393 Neiman Marcus, Nordstrom159. Westminster Mall CA Westminster (Los Angeles) Fee 100.0% Acquired 1998 86.5% 1,186,978 Macy’s, JCPenney, Sears, Target160. White Oaks Mall IL Springfield Fee 80.7% Built 1977 81.2%(17) 919,871 Macy’s, Bergner’s, Sears, Dick’s Sporting Goods,(8)161. Wolfchase Galleria TN Memphis Fee 94.5% Acquired 2002 94.4% 1,152,554 Macy’s, Dillard’s, JCPenney, Sears, Malco Theatres162. Woodland Hills Mall OK Tulsa Fee 94.5% Acquired 2002 98.7% 1,092,057 Macy’s, Dillard’s, JCPenney, Sears
Total Regional Mall GLA 160,034,865
Premium Outlet Centers
1. Albertville Premium MN Albertville (Minneapolis) Fee 100.0% Acquired 2004 92.8% 429,563 Adidas, Ann Taylor, Banana Republic, Calvin Klein, Coach, Columbia Sportswear,Outlets Gap Outlet, Guess, Lucky Brand, Nautica, Nike, Old Navy, Polo Ralph Lauren,
Tommy Hilfiger, Under Armour2. Allen Premium TX Allen (Dallas) Fee 100.0% Acquired 2004 99.8% 441,542 Adidas, Ann Taylor, Banana Republic, Brooks Brothers, Burberry, Calvin Klein,
Outlets Coach, Cole Haan, Columbia Sportswear, Gap Outlet, Guess, J.Crew, Michael Kors,Neiman Marcus Last Call, Nike, Polo Ralph Lauren, Tommy Hilfiger
3. Aurora Farms OH Aurora (Cleveland) Fee 100.0% Acquired 2004 93.7% 300,383 Ann Taylor, Banana Republic, Brooks Brothers, Calvin Klein, Coach, Gap Outlet,Premium Outlets Liz Claiborne, Michael Kors, Nautica, Nike, Polo Ralph Lauren, Saks Fifth Avenue
Off 5th, Tommy Hilfiger4. Camarillo Premium CA Camarillo (Los Angeles) Fee 100.0% Acquired 2004 98.0% 673,912 Ann Taylor, Banana Republic, Brooks Brothers, Calvin Klein, Coach, Diesel, Giorgio
Outlets Armani, Hugo Boss, Neiman Marcus Last Call, Nike, Polo Ralph Lauren, Saks FifthAvenue Off 5th, Sony, Tommy Hilfiger
5. Carlsbad Premium CA Carlsbad (San Diego) Fee 100.0% Acquired 2004 99.7% 288,029 Adidas, Banana Republic, BCBG Max Azria, Calvin Klein, Coach, Crate & Barrel,Outlets Gap Outlet, Guess, Lacoste, Michael Kors, Polo Ralph Lauren, Salvatore
Ferragamo, Theory, Tommy Hilfiger6. Carolina Premium NC Smithfield (Raleigh) Ground Lease 100.0% Acquired 2004 99.1% 438,981 Adidas, Banana Republic, Brooks Brothers, Coach, Gap Outlet, Liz Claiborne, Nike,
Outlets (2029) Polo Ralph Lauren, Tommy Hilfiger, Under Armour7. Chicago Premium IL Aurora (Chicago) Fee 100.0% Built 2004 100.0% 437,342 Ann Taylor, Banana Republic, Brooks Brothers, Calvin Klein, Coach, Diesel, Elie
Outlets Tahari, Gap Outlet, Giorgio Armani, J.Crew, Kate Spade, Lacoste, Michael Kors,Polo Ralph Lauren, Salvatore Ferragamo, Sony, Theory
8. Cincinnati Premium OH Monroe (Cincinnati) Fee 100.0% Built 2009 98.7% 338,327 Adidas, Banana Republic, Brooks Brothers, Coach, Cole Haan, Columbia SportswearOutlets Company, Gap Outlet, Hanes Brands, J.Crew, Nike, Polo Ralph Lauren, Saks
5th Avenue Off 5th, Tommy Hilfiger, The North Face
21
Simon Property Group, L.P. and Subsidiaries
Property Table
U.S. PropertiesOwnership
Interest Year Built(Expiration if Legal or
Property Name State City (CBSA) Lease)(3) Ownership Acquired Occupancy(5) Total GLA Retail Anchors and Selected Major Tenants
9. Clinton Crossing CT Clinton (New Haven) Fee 100.0% Acquired 2004 98.4% 276,164 Banana Republic, Brooks Brothers, Calvin Klein, Coach, Cole Haan, Gap Outlet,Premium Outlets J.Crew, Liz Claiborne, Michael Kors, Nike, Polo Ralph Lauren, Saks Fifth Avenue
Off 5th, Talbots, Tommy Hilfiger10. Columbia Gorge OR Troutdale (Portland) Fee 100.0% Acquired 2004 95.8% 163,885 Adidas, Calvin Klein, Carter’s, Eddie Bauer, Gap Outlet, Guess, Levi’s, Liz
Premium Outlets Claiborne, Tommy Hilfiger11. Desert Hills Premium CA Cabazon (Palm Springs) Fee 100.0% Acquired 2004 99.9% 501,771 Burberry, Coach, Dior, Elie Tahari, Giorgio Armani, Gucci, Lacoste, Nike, Polo
Outlets Ralph Lauren, Prada, Saks Fifth Avenue Off 5th, Salvatore Ferragamo, Theory, TrueReligion, Yves Saint Laurent, Zegna
12. Edinburgh Premium IN Edinburgh (Indianapolis) Fee 100.0% Acquired 2004 98.0% 377,784 Adidas, Ann Taylor, Banana Republic, Calvin Klein, Coach, Coldwater Creek,Outlets Columbia Sportswear, Gap Outlet, J.Crew, Levi’s, Nautica, Nike, Polo Ralph Lauren,
Tommy Hilfiger13. Folsom Premium CA Folsom (Sacramento) Fee 100.0% Acquired 2004 98.8% 296,035 BCBG Max Azria, Banana Republic, Brooks Brothers, Calvin Klein, Coach, Gap
Outlets Outlet, Guess, Nautica, Nike, Saks Fifth Avenue Off 5th, Tommy Hilfiger14. Gilroy Premium CA Gilroy (San Jose) Fee 100.0% Acquired 2004 96.1% 577,909 Adidas, Ann Taylor, Banana Republic, Brooks Brothers, Calvin Klein, Coach,
Outlets J.Crew, Hugo Boss, Michael Kors, Nike, Polo Ralph Lauren, Saks Fifth Avenue Off5th, Sony, Tommy Hilfiger, True Religion
15. Houston Premium TX Houston Fee 100.0% Built 2008 99.4% 425,500 Adidas, Ann Taylor, Banana Republic, Burberry, Calvin Klein, Coach, Cole Haan,Outlets Columbia Sportswear, DKNY, Elie Tahari, Gap Outlet, Juicy Couture, Lucky Brand,
Michael Kors, Nike, True Religion, Tommy Hilfiger16. Jackson Premium NJ Jackson Fee 100.0% Acquired 2004 98.9% 285,833 Ann Taylor, Banana Republic, Brooks Brothers, Calvin Klein, Coach, Gap Outlet,
Outlets Guess, J.Crew, Liz Claiborne, Nike, Polo Ralph Lauren, Reebok, Tommy Hilfiger,Under Armour
17. Jersey Shore Premium NJ Tinton Falls Fee 100.0% Built 2008 97.0% 434,367 Adidas, Ann Taylor, Banana Republic, Burberry, Brooks Brothers, DKNY, ElieOutlets Tahari, Guess, J. Crew, Kate Spade, Michael Kors, Theory, Nike, Tommy Hilfiger,
True Religion, Under Armour18. Johnson Creek WI Johnson Creek Fee 100.0% Acquired 2004 89.4% 277,672 Adidas, Ann Taylor, Banana Republic, Calvin Klein, Columbia Sportswear, Eddie
Premium Outlets (Milwaukee) Bauer, Gap Outlet, Nike, Old Navy, Polo Ralph Lauren, Tommy Hilfiger19. Kittery Premium ME Kittery Ground Lease 100.0% Acquired 2004 97.4% 264,771 Adidas, Banana Republic, Calvin Klein, Coach, Columbia Sportswear, Gap Outlet,
Outlets (2014) J.Crew, Movado, Nike, Polo Ralph Lauren, Puma, Reebok, Tommy Hilfiger20. Las Americas CA San Diego Fee 100.0% Acquired 2007 98.3% 560,873 Ann Taylor, Banana Republic, Brooks Brothers, Calvin Klein, Coach, Gap Outlet,
Premium Outlets Guess, Hugo Boss, J.Crew, Neiman Marcus Last Call, Nike, Polo Ralph Lauren,Sony, Tommy Bahama, True Religion
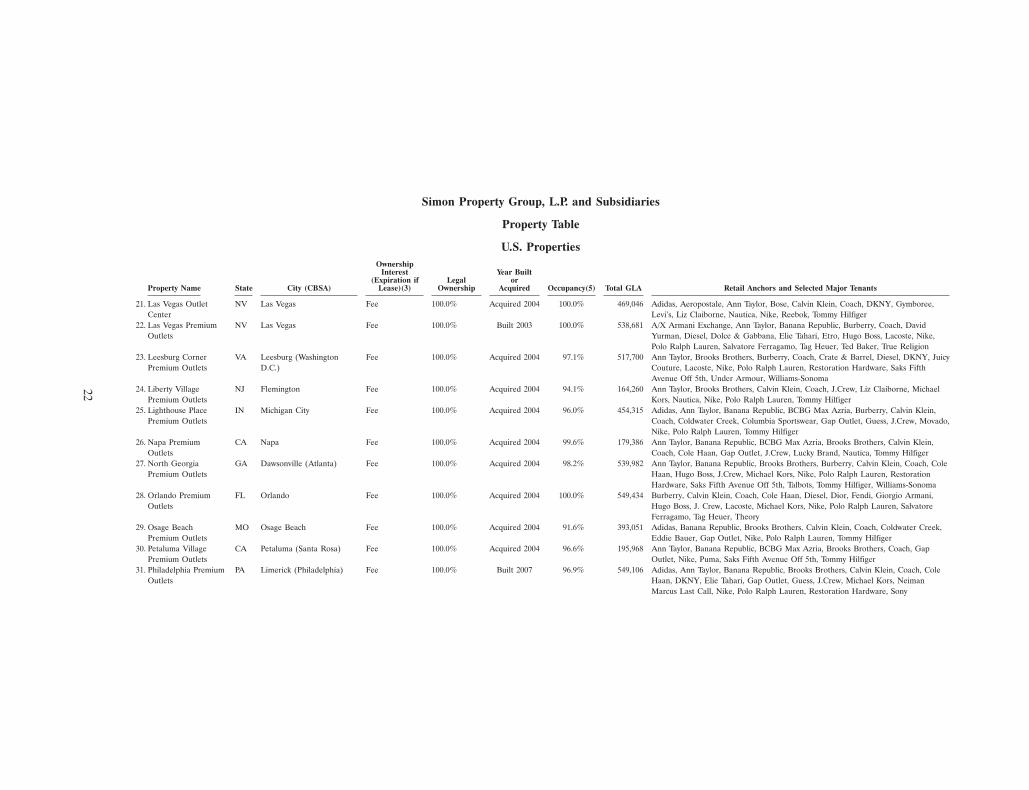
22
Simon Property Group, L.P. and Subsidiaries
Property Table
U.S. PropertiesOwnership
Interest Year Built(Expiration if Legal or
Property Name State City (CBSA) Lease)(3) Ownership Acquired Occupancy(5) Total GLA Retail Anchors and Selected Major Tenants
21. Las Vegas Outlet NV Las Vegas Fee 100.0% Acquired 2004 100.0% 469,046 Adidas, Aeropostale, Ann Taylor, Bose, Calvin Klein, Coach, DKNY, Gymboree,Center Levi’s, Liz Claiborne, Nautica, Nike, Reebok, Tommy Hilfiger
22. Las Vegas Premium NV Las Vegas Fee 100.0% Built 2003 100.0% 538,681 A/X Armani Exchange, Ann Taylor, Banana Republic, Burberry, Coach, DavidOutlets Yurman, Diesel, Dolce & Gabbana, Elie Tahari, Etro, Hugo Boss, Lacoste, Nike,
Polo Ralph Lauren, Salvatore Ferragamo, Tag Heuer, Ted Baker, True Religion23. Leesburg Corner VA Leesburg (Washington Fee 100.0% Acquired 2004 97.1% 517,700 Ann Taylor, Brooks Brothers, Burberry, Coach, Crate & Barrel, Diesel, DKNY, Juicy
Premium Outlets D.C.) Couture, Lacoste, Nike, Polo Ralph Lauren, Restoration Hardware, Saks FifthAvenue Off 5th, Under Armour, Williams-Sonoma
24. Liberty Village NJ Flemington Fee 100.0% Acquired 2004 94.1% 164,260 Ann Taylor, Brooks Brothers, Calvin Klein, Coach, J.Crew, Liz Claiborne, MichaelPremium Outlets Kors, Nautica, Nike, Polo Ralph Lauren, Tommy Hilfiger
25. Lighthouse Place IN Michigan City Fee 100.0% Acquired 2004 96.0% 454,315 Adidas, Ann Taylor, Banana Republic, BCBG Max Azria, Burberry, Calvin Klein,Premium Outlets Coach, Coldwater Creek, Columbia Sportswear, Gap Outlet, Guess, J.Crew, Movado,
Nike, Polo Ralph Lauren, Tommy Hilfiger26. Napa Premium CA Napa Fee 100.0% Acquired 2004 99.6% 179,386 Ann Taylor, Banana Republic, BCBG Max Azria, Brooks Brothers, Calvin Klein,
Outlets Coach, Cole Haan, Gap Outlet, J.Crew, Lucky Brand, Nautica, Tommy Hilfiger27. North Georgia GA Dawsonville (Atlanta) Fee 100.0% Acquired 2004 98.2% 539,982 Ann Taylor, Banana Republic, Brooks Brothers, Burberry, Calvin Klein, Coach, Cole
Premium Outlets Haan, Hugo Boss, J.Crew, Michael Kors, Nike, Polo Ralph Lauren, RestorationHardware, Saks Fifth Avenue Off 5th, Talbots, Tommy Hilfiger, Williams-Sonoma
28. Orlando Premium FL Orlando Fee 100.0% Acquired 2004 100.0% 549,434 Burberry, Calvin Klein, Coach, Cole Haan, Diesel, Dior, Fendi, Giorgio Armani,Outlets Hugo Boss, J. Crew, Lacoste, Michael Kors, Nike, Polo Ralph Lauren, Salvatore
Ferragamo, Tag Heuer, Theory29. Osage Beach MO Osage Beach Fee 100.0% Acquired 2004 91.6% 393,051 Adidas, Banana Republic, Brooks Brothers, Calvin Klein, Coach, Coldwater Creek,
Premium Outlets Eddie Bauer, Gap Outlet, Nike, Polo Ralph Lauren, Tommy Hilfiger30. Petaluma Village CA Petaluma (Santa Rosa) Fee 100.0% Acquired 2004 96.6% 195,968 Ann Taylor, Banana Republic, BCBG Max Azria, Brooks Brothers, Coach, Gap
Premium Outlets Outlet, Nike, Puma, Saks Fifth Avenue Off 5th, Tommy Hilfiger31. Philadelphia Premium PA Limerick (Philadelphia) Fee 100.0% Built 2007 96.9% 549,106 Adidas, Ann Taylor, Banana Republic, Brooks Brothers, Calvin Klein, Coach, Cole
Outlets Haan, DKNY, Elie Tahari, Gap Outlet, Guess, J.Crew, Michael Kors, NeimanMarcus Last Call, Nike, Polo Ralph Lauren, Restoration Hardware, Sony
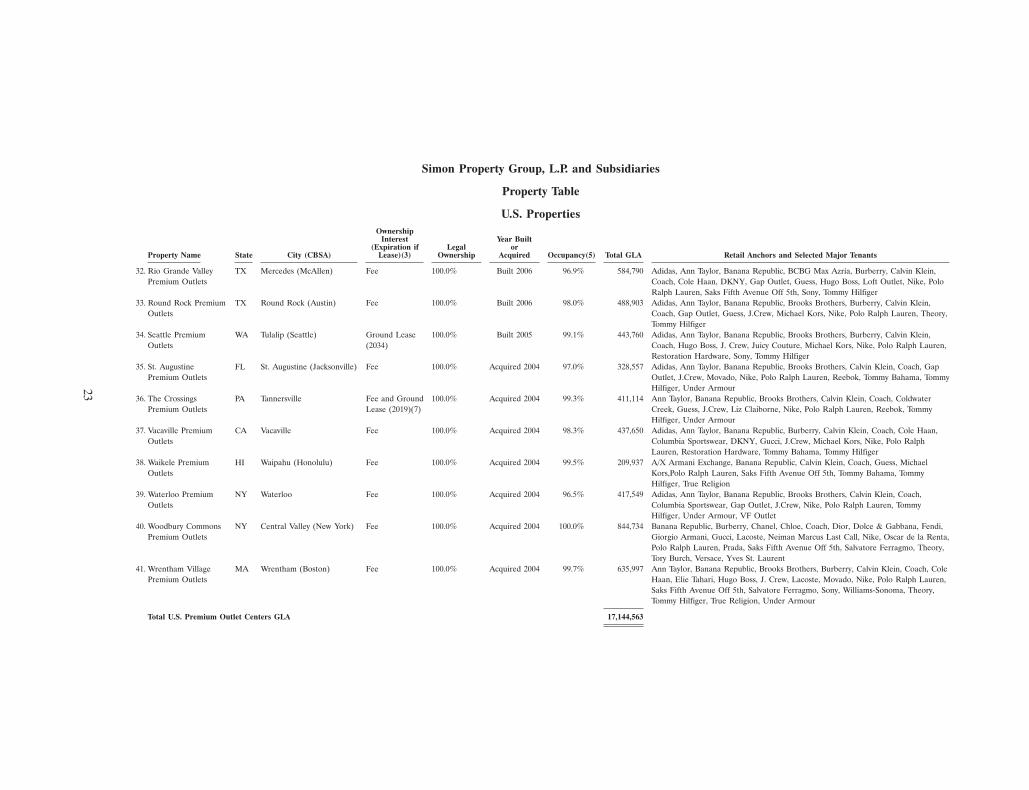
23
Simon Property Group, L.P. and Subsidiaries
Property Table
U.S. PropertiesOwnership
Interest Year Built(Expiration if Legal or
Property Name State City (CBSA) Lease)(3) Ownership Acquired Occupancy(5) Total GLA Retail Anchors and Selected Major Tenants
32. Rio Grande Valley TX Mercedes (McAllen) Fee 100.0% Built 2006 96.9% 584,790 Adidas, Ann Taylor, Banana Republic, BCBG Max Azria, Burberry, Calvin Klein,Premium Outlets Coach, Cole Haan, DKNY, Gap Outlet, Guess, Hugo Boss, Loft Outlet, Nike, Polo
Ralph Lauren, Saks Fifth Avenue Off 5th, Sony, Tommy Hilfiger33. Round Rock Premium TX Round Rock (Austin) Fee 100.0% Built 2006 98.0% 488,903 Adidas, Ann Taylor, Banana Republic, Brooks Brothers, Burberry, Calvin Klein,
Outlets Coach, Gap Outlet, Guess, J.Crew, Michael Kors, Nike, Polo Ralph Lauren, Theory,Tommy Hilfiger
34. Seattle Premium WA Tulalip (Seattle) Ground Lease 100.0% Built 2005 99.1% 443,760 Adidas, Ann Taylor, Banana Republic, Brooks Brothers, Burberry, Calvin Klein,Outlets (2034) Coach, Hugo Boss, J. Crew, Juicy Couture, Michael Kors, Nike, Polo Ralph Lauren,
Restoration Hardware, Sony, Tommy Hilfiger35. St. Augustine FL St. Augustine (Jacksonville) Fee 100.0% Acquired 2004 97.0% 328,557 Adidas, Ann Taylor, Banana Republic, Brooks Brothers, Calvin Klein, Coach, Gap
Premium Outlets Outlet, J.Crew, Movado, Nike, Polo Ralph Lauren, Reebok, Tommy Bahama, TommyHilfiger, Under Armour
36. The Crossings PA Tannersville Fee and Ground 100.0% Acquired 2004 99.3% 411,114 Ann Taylor, Banana Republic, Brooks Brothers, Calvin Klein, Coach, ColdwaterPremium Outlets Lease (2019)(7) Creek, Guess, J.Crew, Liz Claiborne, Nike, Polo Ralph Lauren, Reebok, Tommy
Hilfiger, Under Armour37. Vacaville Premium CA Vacaville Fee 100.0% Acquired 2004 98.3% 437,650 Adidas, Ann Taylor, Banana Republic, Burberry, Calvin Klein, Coach, Cole Haan,
Outlets Columbia Sportswear, DKNY, Gucci, J.Crew, Michael Kors, Nike, Polo RalphLauren, Restoration Hardware, Tommy Bahama, Tommy Hilfiger
38. Waikele Premium HI Waipahu (Honolulu) Fee 100.0% Acquired 2004 99.5% 209,937 A/X Armani Exchange, Banana Republic, Calvin Klein, Coach, Guess, MichaelOutlets Kors,Polo Ralph Lauren, Saks Fifth Avenue Off 5th, Tommy Bahama, Tommy
Hilfiger, True Religion39. Waterloo Premium NY Waterloo Fee 100.0% Acquired 2004 96.5% 417,549 Adidas, Ann Taylor, Banana Republic, Brooks Brothers, Calvin Klein, Coach,
Outlets Columbia Sportswear, Gap Outlet, J.Crew, Nike, Polo Ralph Lauren, TommyHilfiger, Under Armour, VF Outlet
40. Woodbury Commons NY Central Valley (New York) Fee 100.0% Acquired 2004 100.0% 844,734 Banana Republic, Burberry, Chanel, Chloe, Coach, Dior, Dolce & Gabbana, Fendi,Premium Outlets Giorgio Armani, Gucci, Lacoste, Neiman Marcus Last Call, Nike, Oscar de la Renta,
Polo Ralph Lauren, Prada, Saks Fifth Avenue Off 5th, Salvatore Ferragmo, Theory,Tory Burch, Versace, Yves St. Laurent
41. Wrentham Village MA Wrentham (Boston) Fee 100.0% Acquired 2004 99.7% 635,997 Ann Taylor, Banana Republic, Brooks Brothers, Burberry, Calvin Klein, Coach, ColePremium Outlets Haan, Elie Tahari, Hugo Boss, J. Crew, Lacoste, Movado, Nike, Polo Ralph Lauren,
Saks Fifth Avenue Off 5th, Salvatore Ferragmo, Sony, Williams-Sonoma, Theory,Tommy Hilfiger, True Religion, Under Armour
Total U.S. Premium Outlet Centers GLA 17,144,563
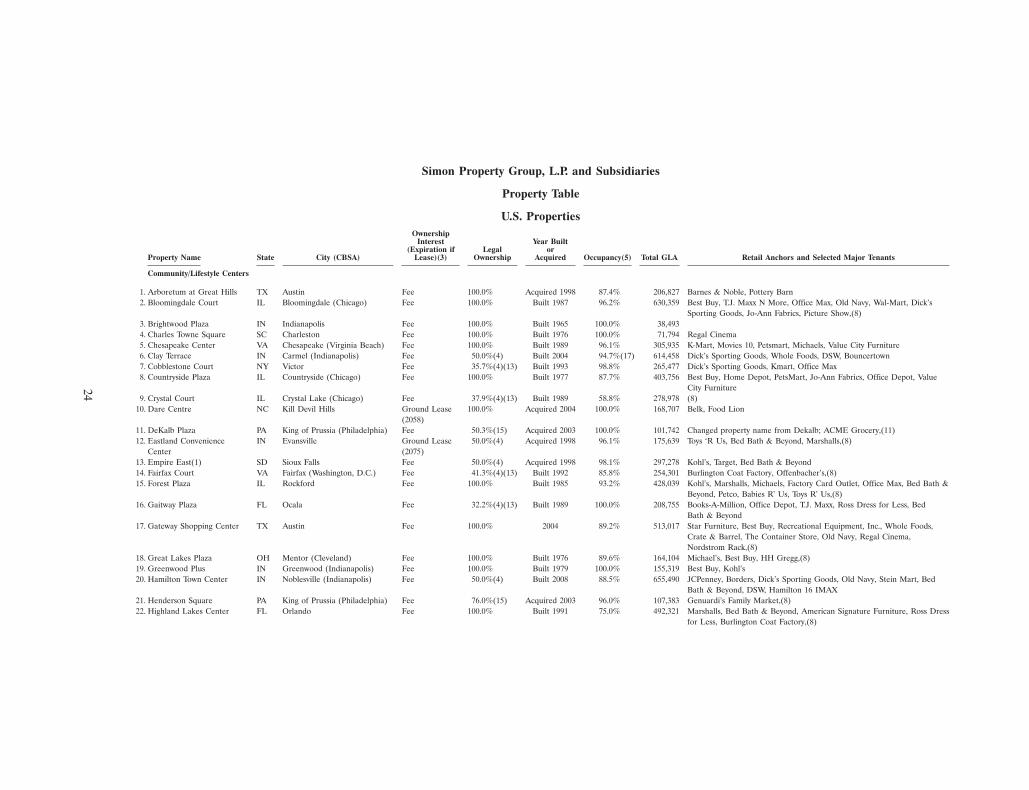
24
Simon Property Group, L.P. and Subsidiaries
Property Table
U.S. PropertiesOwnership
Interest Year Built(Expiration if Legal or
Property Name State City (CBSA) Lease)(3) Ownership Acquired Occupancy(5) Total GLA Retail Anchors and Selected Major Tenants
Community/Lifestyle Centers
1. Arboretum at Great Hills TX Austin Fee 100.0% Acquired 1998 87.4% 206,827 Barnes & Noble, Pottery Barn2. Bloomingdale Court IL Bloomingdale (Chicago) Fee 100.0% Built 1987 96.2% 630,359 Best Buy, T.J. Maxx N More, Office Max, Old Navy, Wal-Mart, Dick’s
Sporting Goods, Jo-Ann Fabrics, Picture Show,(8)3. Brightwood Plaza IN Indianapolis Fee 100.0% Built 1965 100.0% 38,4934. Charles Towne Square SC Charleston Fee 100.0% Built 1976 100.0% 71,794 Regal Cinema5. Chesapeake Center VA Chesapeake (Virginia Beach) Fee 100.0% Built 1989 96.1% 305,935 K-Mart, Movies 10, Petsmart, Michaels, Value City Furniture6. Clay Terrace IN Carmel (Indianapolis) Fee 50.0%(4) Built 2004 94.7%(17) 614,458 Dick’s Sporting Goods, Whole Foods, DSW, Bouncertown7. Cobblestone Court NY Victor Fee 35.7%(4)(13) Built 1993 98.8% 265,477 Dick’s Sporting Goods, Kmart, Office Max8. Countryside Plaza IL Countryside (Chicago) Fee 100.0% Built 1977 87.7% 403,756 Best Buy, Home Depot, PetsMart, Jo-Ann Fabrics, Office Depot, Value
City Furniture9. Crystal Court IL Crystal Lake (Chicago) Fee 37.9%(4)(13) Built 1989 58.8% 278,978 (8)
10. Dare Centre NC Kill Devil Hills Ground Lease 100.0% Acquired 2004 100.0% 168,707 Belk, Food Lion(2058)
11. DeKalb Plaza PA King of Prussia (Philadelphia) Fee 50.3%(15) Acquired 2003 100.0% 101,742 Changed property name from Dekalb; ACME Grocery,(11)12. Eastland Convenience IN Evansville Ground Lease 50.0%(4) Acquired 1998 96.1% 175,639 Toys ‘R Us, Bed Bath & Beyond, Marshalls,(8)
Center (2075)13. Empire East(1) SD Sioux Falls Fee 50.0%(4) Acquired 1998 98.1% 297,278 Kohl’s, Target, Bed Bath & Beyond14. Fairfax Court VA Fairfax (Washington, D.C.) Fee 41.3%(4)(13) Built 1992 85.8% 254,301 Burlington Coat Factory, Offenbacher’s,(8)15. Forest Plaza IL Rockford Fee 100.0% Built 1985 93.2% 428,039 Kohl’s, Marshalls, Michaels, Factory Card Outlet, Office Max, Bed Bath &
Beyond, Petco, Babies R’ Us, Toys R’ Us,(8)16. Gaitway Plaza FL Ocala Fee 32.2%(4)(13) Built 1989 100.0% 208,755 Books-A-Million, Office Depot, T.J. Maxx, Ross Dress for Less, Bed
Bath & Beyond17. Gateway Shopping Center TX Austin Fee 100.0% 2004 89.2% 513,017 Star Furniture, Best Buy, Recreational Equipment, Inc., Whole Foods,
Crate & Barrel, The Container Store, Old Navy, Regal Cinema,Nordstrom Rack,(8)
18. Great Lakes Plaza OH Mentor (Cleveland) Fee 100.0% Built 1976 89.6% 164,104 Michael’s, Best Buy, HH Gregg,(8)19. Greenwood Plus IN Greenwood (Indianapolis) Fee 100.0% Built 1979 100.0% 155,319 Best Buy, Kohl’s20. Hamilton Town Center IN Noblesville (Indianapolis) Fee 50.0%(4) Built 2008 88.5% 655,490 JCPenney, Borders, Dick’s Sporting Goods, Old Navy, Stein Mart, Bed
Bath & Beyond, DSW, Hamilton 16 IMAX21. Henderson Square PA King of Prussia (Philadelphia) Fee 76.0%(15) Acquired 2003 96.0% 107,383 Genuardi’s Family Market,(8)22. Highland Lakes Center FL Orlando Fee 100.0% Built 1991 75.0% 492,321 Marshalls, Bed Bath & Beyond, American Signature Furniture, Ross Dress
for Less, Burlington Coat Factory,(8)
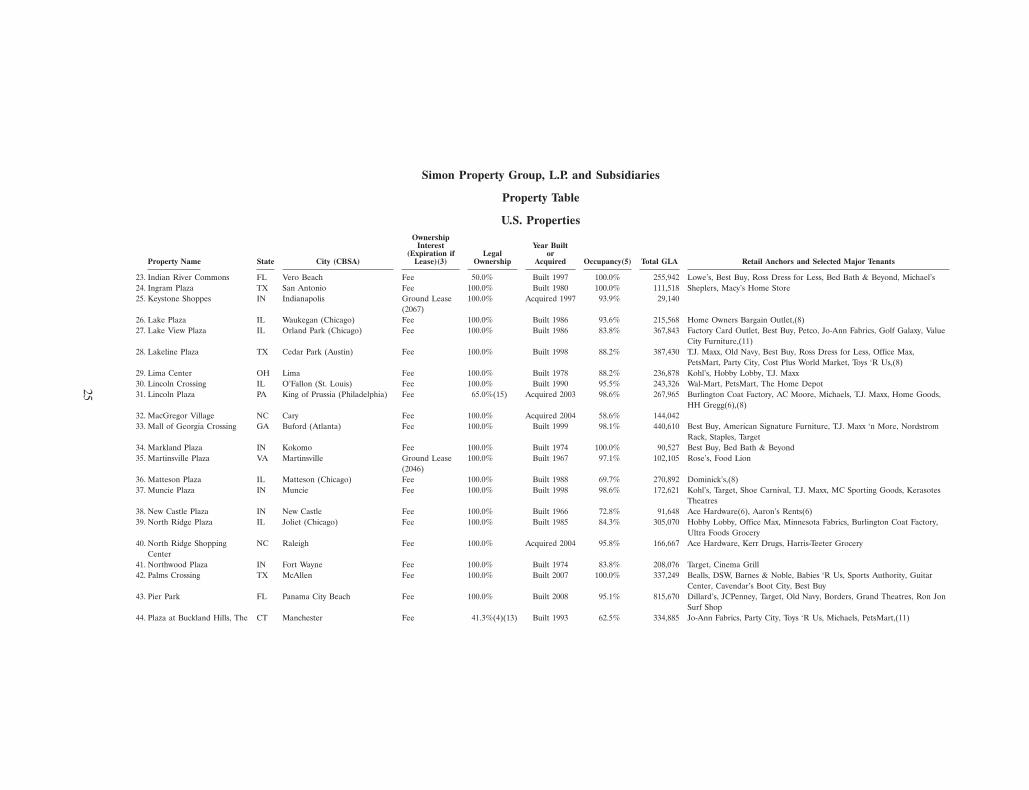
25
Simon Property Group, L.P. and Subsidiaries
Property Table
U.S. PropertiesOwnership
Interest Year Built(Expiration if Legal or
Property Name State City (CBSA) Lease)(3) Ownership Acquired Occupancy(5) Total GLA Retail Anchors and Selected Major Tenants
23. Indian River Commons FL Vero Beach Fee 50.0% Built 1997 100.0% 255,942 Lowe’s, Best Buy, Ross Dress for Less, Bed Bath & Beyond, Michael’s24. Ingram Plaza TX San Antonio Fee 100.0% Built 1980 100.0% 111,518 Sheplers, Macy’s Home Store25. Keystone Shoppes IN Indianapolis Ground Lease 100.0% Acquired 1997 93.9% 29,140
(2067)26. Lake Plaza IL Waukegan (Chicago) Fee 100.0% Built 1986 93.6% 215,568 Home Owners Bargain Outlet,(8)27. Lake View Plaza IL Orland Park (Chicago) Fee 100.0% Built 1986 83.8% 367,843 Factory Card Outlet, Best Buy, Petco, Jo-Ann Fabrics, Golf Galaxy, Value
City Furniture,(11)28. Lakeline Plaza TX Cedar Park (Austin) Fee 100.0% Built 1998 88.2% 387,430 T.J. Maxx, Old Navy, Best Buy, Ross Dress for Less, Office Max,
PetsMart, Party City, Cost Plus World Market, Toys ‘R Us,(8)29. Lima Center OH Lima Fee 100.0% Built 1978 88.2% 236,878 Kohl’s, Hobby Lobby, T.J. Maxx30. Lincoln Crossing IL O’Fallon (St. Louis) Fee 100.0% Built 1990 95.5% 243,326 Wal-Mart, PetsMart, The Home Depot31. Lincoln Plaza PA King of Prussia (Philadelphia) Fee 65.0%(15) Acquired 2003 98.6% 267,965 Burlington Coat Factory, AC Moore, Michaels, T.J. Maxx, Home Goods,
HH Gregg(6),(8)32. MacGregor Village NC Cary Fee 100.0% Acquired 2004 58.6% 144,04233. Mall of Georgia Crossing GA Buford (Atlanta) Fee 100.0% Built 1999 98.1% 440,610 Best Buy, American Signature Furniture, T.J. Maxx ‘n More, Nordstrom
Rack, Staples, Target34. Markland Plaza IN Kokomo Fee 100.0% Built 1974 100.0% 90,527 Best Buy, Bed Bath & Beyond35. Martinsville Plaza VA Martinsville Ground Lease 100.0% Built 1967 97.1% 102,105 Rose’s, Food Lion
(2046)36. Matteson Plaza IL Matteson (Chicago) Fee 100.0% Built 1988 69.7% 270,892 Dominick’s,(8)37. Muncie Plaza IN Muncie Fee 100.0% Built 1998 98.6% 172,621 Kohl’s, Target, Shoe Carnival, T.J. Maxx, MC Sporting Goods, Kerasotes
Theatres38. New Castle Plaza IN New Castle Fee 100.0% Built 1966 72.8% 91,648 Ace Hardware(6), Aaron’s Rents(6)39. North Ridge Plaza IL Joliet (Chicago) Fee 100.0% Built 1985 84.3% 305,070 Hobby Lobby, Office Max, Minnesota Fabrics, Burlington Coat Factory,
Ultra Foods Grocery40. North Ridge Shopping NC Raleigh Fee 100.0% Acquired 2004 95.8% 166,667 Ace Hardware, Kerr Drugs, Harris-Teeter Grocery
Center41. Northwood Plaza IN Fort Wayne Fee 100.0% Built 1974 83.8% 208,076 Target, Cinema Grill42. Palms Crossing TX McAllen Fee 100.0% Built 2007 100.0% 337,249 Bealls, DSW, Barnes & Noble, Babies ‘R Us, Sports Authority, Guitar
Center, Cavendar’s Boot City, Best Buy43. Pier Park FL Panama City Beach Fee 100.0% Built 2008 95.1% 815,670 Dillard’s, JCPenney, Target, Old Navy, Borders, Grand Theatres, Ron Jon
Surf Shop44. Plaza at Buckland Hills, The CT Manchester Fee 41.3%(4)(13) Built 1993 62.5% 334,885 Jo-Ann Fabrics, Party City, Toys ‘R Us, Michaels, PetsMart,(11)
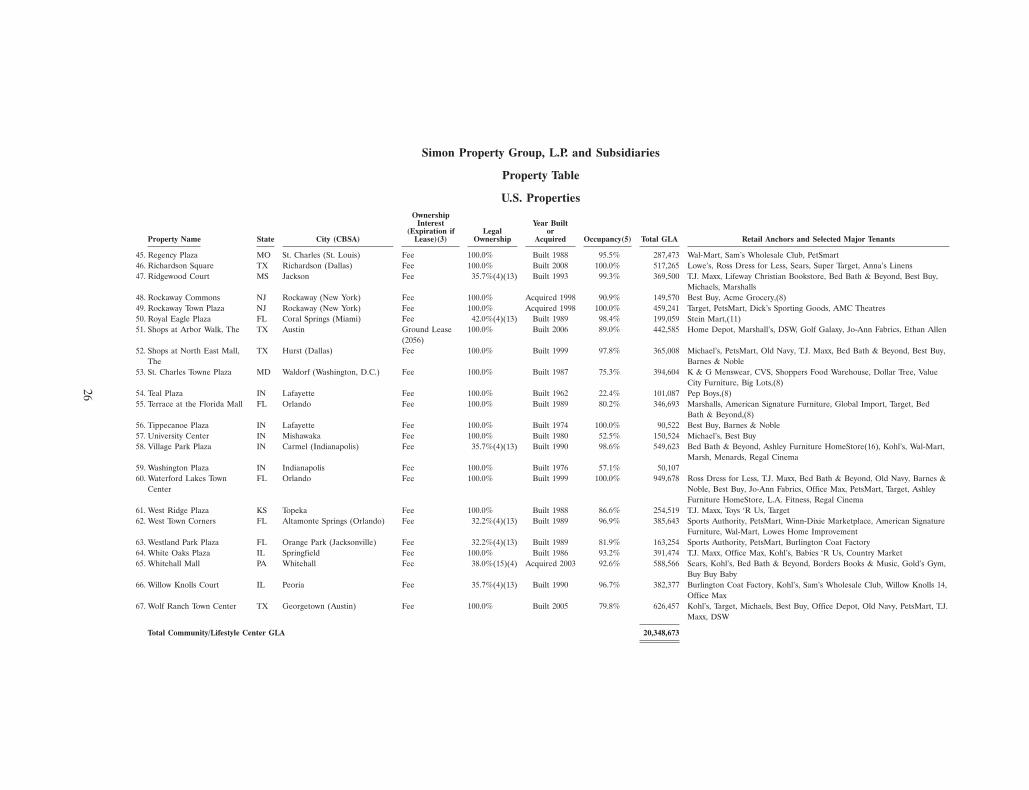
26
Simon Property Group, L.P. and Subsidiaries
Property Table
U.S. PropertiesOwnership
Interest Year Built(Expiration if Legal or
Property Name State City (CBSA) Lease)(3) Ownership Acquired Occupancy(5) Total GLA Retail Anchors and Selected Major Tenants
45. Regency Plaza MO St. Charles (St. Louis) Fee 100.0% Built 1988 95.5% 287,473 Wal-Mart, Sam’s Wholesale Club, PetSmart46. Richardson Square TX Richardson (Dallas) Fee 100.0% Built 2008 100.0% 517,265 Lowe’s, Ross Dress for Less, Sears, Super Target, Anna’s Linens47. Ridgewood Court MS Jackson Fee 35.7%(4)(13) Built 1993 99.3% 369,500 T.J. Maxx, Lifeway Christian Bookstore, Bed Bath & Beyond, Best Buy,
Michaels, Marshalls48. Rockaway Commons NJ Rockaway (New York) Fee 100.0% Acquired 1998 90.9% 149,570 Best Buy, Acme Grocery,(8)49. Rockaway Town Plaza NJ Rockaway (New York) Fee 100.0% Acquired 1998 100.0% 459,241 Target, PetsMart, Dick’s Sporting Goods, AMC Theatres50. Royal Eagle Plaza FL Coral Springs (Miami) Fee 42.0%(4)(13) Built 1989 98.4% 199,059 Stein Mart,(11)51. Shops at Arbor Walk, The TX Austin Ground Lease 100.0% Built 2006 89.0% 442,585 Home Depot, Marshall’s, DSW, Golf Galaxy, Jo-Ann Fabrics, Ethan Allen
(2056)52. Shops at North East Mall, TX Hurst (Dallas) Fee 100.0% Built 1999 97.8% 365,008 Michael’s, PetsMart, Old Navy, T.J. Maxx, Bed Bath & Beyond, Best Buy,
The Barnes & Noble53. St. Charles Towne Plaza MD Waldorf (Washington, D.C.) Fee 100.0% Built 1987 75.3% 394,604 K & G Menswear, CVS, Shoppers Food Warehouse, Dollar Tree, Value
City Furniture, Big Lots,(8)54. Teal Plaza IN Lafayette Fee 100.0% Built 1962 22.4% 101,087 Pep Boys,(8)55. Terrace at the Florida Mall FL Orlando Fee 100.0% Built 1989 80.2% 346,693 Marshalls, American Signature Furniture, Global Import, Target, Bed
Bath & Beyond,(8)56. Tippecanoe Plaza IN Lafayette Fee 100.0% Built 1974 100.0% 90,522 Best Buy, Barnes & Noble57. University Center IN Mishawaka Fee 100.0% Built 1980 52.5% 150,524 Michael’s, Best Buy58. Village Park Plaza IN Carmel (Indianapolis) Fee 35.7%(4)(13) Built 1990 98.6% 549,623 Bed Bath & Beyond, Ashley Furniture HomeStore(16), Kohl’s, Wal-Mart,
Marsh, Menards, Regal Cinema59. Washington Plaza IN Indianapolis Fee 100.0% Built 1976 57.1% 50,10760. Waterford Lakes Town FL Orlando Fee 100.0% Built 1999 100.0% 949,678 Ross Dress for Less, T.J. Maxx, Bed Bath & Beyond, Old Navy, Barnes &
Center Noble, Best Buy, Jo-Ann Fabrics, Office Max, PetsMart, Target, AshleyFurniture HomeStore, L.A. Fitness, Regal Cinema
61. West Ridge Plaza KS Topeka Fee 100.0% Built 1988 86.6% 254,519 T.J. Maxx, Toys ‘R Us, Target62. West Town Corners FL Altamonte Springs (Orlando) Fee 32.2%(4)(13) Built 1989 96.9% 385,643 Sports Authority, PetsMart, Winn-Dixie Marketplace, American Signature
Furniture, Wal-Mart, Lowes Home Improvement63. Westland Park Plaza FL Orange Park (Jacksonville) Fee 32.2%(4)(13) Built 1989 81.9% 163,254 Sports Authority, PetsMart, Burlington Coat Factory64. White Oaks Plaza IL Springfield Fee 100.0% Built 1986 93.2% 391,474 T.J. Maxx, Office Max, Kohl’s, Babies ‘R Us, Country Market65. Whitehall Mall PA Whitehall Fee 38.0%(15)(4) Acquired 2003 92.6% 588,566 Sears, Kohl’s, Bed Bath & Beyond, Borders Books & Music, Gold’s Gym,
Buy Buy Baby66. Willow Knolls Court IL Peoria Fee 35.7%(4)(13) Built 1990 96.7% 382,377 Burlington Coat Factory, Kohl’s, Sam’s Wholesale Club, Willow Knolls 14,
Office Max67. Wolf Ranch Town Center TX Georgetown (Austin) Fee 100.0% Built 2005 79.8% 626,457 Kohl’s, Target, Michaels, Best Buy, Office Depot, Old Navy, PetsMart, T.J.
Maxx, DSW
Total Community/Lifestyle Center GLA 20,348,673
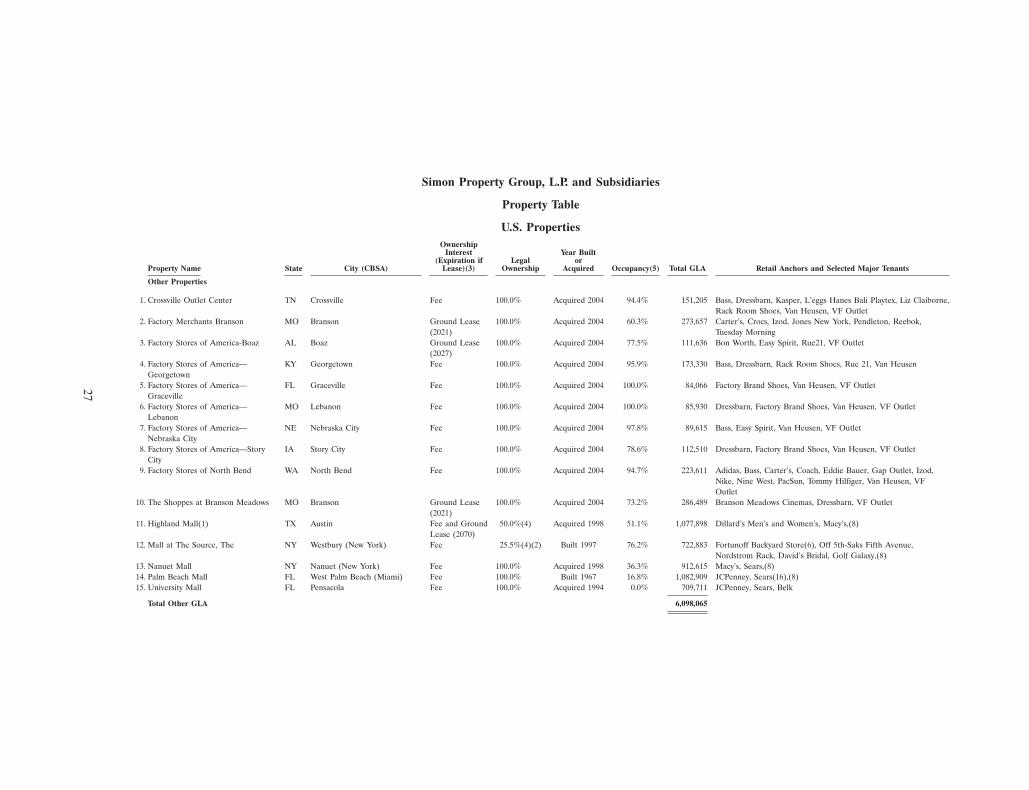
27
Simon Property Group, L.P. and Subsidiaries
Property Table
U.S. PropertiesOwnership
Interest Year Built(Expiration if Legal or
Property Name State City (CBSA) Lease)(3) Ownership Acquired Occupancy(5) Total GLA Retail Anchors and Selected Major Tenants
Other Properties
1. Crossville Outlet Center TN Crossville Fee 100.0% Acquired 2004 94.4% 151,205 Bass, Dressbarn, Kasper, L’eggs Hanes Bali Playtex, Liz Claiborne,Rack Room Shoes, Van Heusen, VF Outlet
2. Factory Merchants Branson MO Branson Ground Lease 100.0% Acquired 2004 60.3% 273,657 Carter’s, Crocs, Izod, Jones New York, Pendleton, Reebok,(2021) Tuesday Morning
3. Factory Stores of America-Boaz AL Boaz Ground Lease 100.0% Acquired 2004 77.5% 111,636 Bon Worth, Easy Spirit, Rue21, VF Outlet(2027)
4. Factory Stores of America— KY Georgetown Fee 100.0% Acquired 2004 95.9% 173,330 Bass, Dressbarn, Rack Room Shoes, Rue 21, Van HeusenGeorgetown
5. Factory Stores of America— FL Graceville Fee 100.0% Acquired 2004 100.0% 84,066 Factory Brand Shoes, Van Heusen, VF OutletGraceville
6. Factory Stores of America— MO Lebanon Fee 100.0% Acquired 2004 100.0% 85,930 Dressbarn, Factory Brand Shoes, Van Heusen, VF OutletLebanon
7. Factory Stores of America— NE Nebraska City Fee 100.0% Acquired 2004 97.8% 89,615 Bass, Easy Spirit, Van Heusen, VF OutletNebraska City
8. Factory Stores of America—Story IA Story City Fee 100.0% Acquired 2004 78.6% 112,510 Dressbarn, Factory Brand Shoes, Van Heusen, VF OutletCity
9. Factory Stores of North Bend WA North Bend Fee 100.0% Acquired 2004 94.7% 223,611 Adidas, Bass, Carter’s, Coach, Eddie Bauer, Gap Outlet, Izod,Nike, Nine West, PacSun, Tommy Hilfiger, Van Heusen, VFOutlet
10. The Shoppes at Branson Meadows MO Branson Ground Lease 100.0% Acquired 2004 73.2% 286,489 Branson Meadows Cinemas, Dressbarn, VF Outlet(2021)
11. Highland Mall(1) TX Austin Fee and Ground 50.0%(4) Acquired 1998 51.1% 1,077,898 Dillard’s Men’s and Women’s, Macy’s,(8)Lease (2070)
12. Mall at The Source, The NY Westbury (New York) Fee 25.5%(4)(2) Built 1997 76.2% 722,883 Fortunoff Backyard Store(6), Off 5th-Saks Fifth Avenue,Nordstrom Rack, David’s Bridal, Golf Galaxy,(8)
13. Nanuet Mall NY Nanuet (New York) Fee 100.0% Acquired 1998 36.3% 912,615 Macy’s, Sears,(8)14. Palm Beach Mall FL West Palm Beach (Miami) Fee 100.0% Built 1967 16.8% 1,082,909 JCPenney, Sears(16),(8)15. University Mall FL Pensacola Fee 100.0% Acquired 1994 0.0% 709,711 JCPenney, Sears, Belk
Total Other GLA 6,098,065
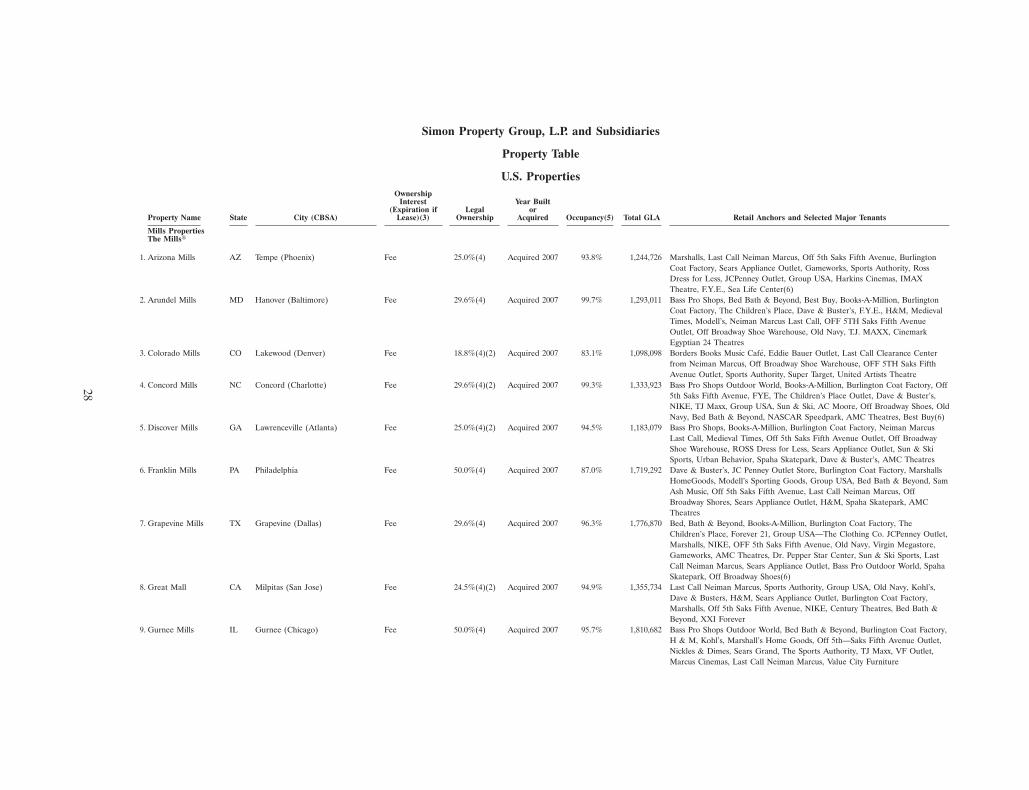
28
Simon Property Group, L.P. and Subsidiaries
Property Table
U.S. PropertiesOwnership
Interest Year Built(Expiration if Legal or
Property Name State City (CBSA) Lease)(3) Ownership Acquired Occupancy(5) Total GLA Retail Anchors and Selected Major Tenants
Mills PropertiesThe Mills�
1. Arizona Mills AZ Tempe (Phoenix) Fee 25.0%(4) Acquired 2007 93.8% 1,244,726 Marshalls, Last Call Neiman Marcus, Off 5th Saks Fifth Avenue, BurlingtonCoat Factory, Sears Appliance Outlet, Gameworks, Sports Authority, RossDress for Less, JCPenney Outlet, Group USA, Harkins Cinemas, IMAXTheatre, F.Y.E., Sea Life Center(6)
2. Arundel Mills MD Hanover (Baltimore) Fee 29.6%(4) Acquired 2007 99.7% 1,293,011 Bass Pro Shops, Bed Bath & Beyond, Best Buy, Books-A-Million, BurlingtonCoat Factory, The Children’s Place, Dave & Buster’s, F.Y.E., H&M, MedievalTimes, Modell’s, Neiman Marcus Last Call, OFF 5TH Saks Fifth AvenueOutlet, Off Broadway Shoe Warehouse, Old Navy, T.J. MAXX, CinemarkEgyptian 24 Theatres
3. Colorado Mills CO Lakewood (Denver) Fee 18.8%(4)(2) Acquired 2007 83.1% 1,098,098 Borders Books Music Cafe, Eddie Bauer Outlet, Last Call Clearance Centerfrom Neiman Marcus, Off Broadway Shoe Warehouse, OFF 5TH Saks FifthAvenue Outlet, Sports Authority, Super Target, United Artists Theatre
4. Concord Mills NC Concord (Charlotte) Fee 29.6%(4)(2) Acquired 2007 99.3% 1,333,923 Bass Pro Shops Outdoor World, Books-A-Million, Burlington Coat Factory, Off5th Saks Fifth Avenue, FYE, The Children’s Place Outlet, Dave & Buster’s,NIKE, TJ Maxx, Group USA, Sun & Ski, AC Moore, Off Broadway Shoes, OldNavy, Bed Bath & Beyond, NASCAR Speedpark, AMC Theatres, Best Buy(6)
5. Discover Mills GA Lawrenceville (Atlanta) Fee 25.0%(4)(2) Acquired 2007 94.5% 1,183,079 Bass Pro Shops, Books-A-Million, Burlington Coat Factory, Neiman MarcusLast Call, Medieval Times, Off 5th Saks Fifth Avenue Outlet, Off BroadwayShoe Warehouse, ROSS Dress for Less, Sears Appliance Outlet, Sun & SkiSports, Urban Behavior, Spaha Skatepark, Dave & Buster’s, AMC Theatres
6. Franklin Mills PA Philadelphia Fee 50.0%(4) Acquired 2007 87.0% 1,719,292 Dave & Buster’s, JC Penney Outlet Store, Burlington Coat Factory, MarshallsHomeGoods, Modell’s Sporting Goods, Group USA, Bed Bath & Beyond, SamAsh Music, Off 5th Saks Fifth Avenue, Last Call Neiman Marcus, OffBroadway Shores, Sears Appliance Outlet, H&M, Spaha Skatepark, AMCTheatres
7. Grapevine Mills TX Grapevine (Dallas) Fee 29.6%(4) Acquired 2007 96.3% 1,776,870 Bed, Bath & Beyond, Books-A-Million, Burlington Coat Factory, TheChildren’s Place, Forever 21, Group USA—The Clothing Co. JCPenney Outlet,Marshalls, NIKE, OFF 5th Saks Fifth Avenue, Old Navy, Virgin Megastore,Gameworks, AMC Theatres, Dr. Pepper Star Center, Sun & Ski Sports, LastCall Neiman Marcus, Sears Appliance Outlet, Bass Pro Outdoor World, SpahaSkatepark, Off Broadway Shoes(6)
8. Great Mall CA Milpitas (San Jose) Fee 24.5%(4)(2) Acquired 2007 94.9% 1,355,734 Last Call Neiman Marcus, Sports Authority, Group USA, Old Navy, Kohl’s,Dave & Busters, H&M, Sears Appliance Outlet, Burlington Coat Factory,Marshalls, Off 5th Saks Fifth Avenue, NIKE, Century Theatres, Bed Bath &Beyond, XXI Forever
9. Gurnee Mills IL Gurnee (Chicago) Fee 50.0%(4) Acquired 2007 95.7% 1,810,682 Bass Pro Shops Outdoor World, Bed Bath & Beyond, Burlington Coat Factory,H & M, Kohl’s, Marshall’s Home Goods, Off 5th—Saks Fifth Avenue Outlet,Nickles & Dimes, Sears Grand, The Sports Authority, TJ Maxx, VF Outlet,Marcus Cinemas, Last Call Neiman Marcus, Value City Furniture
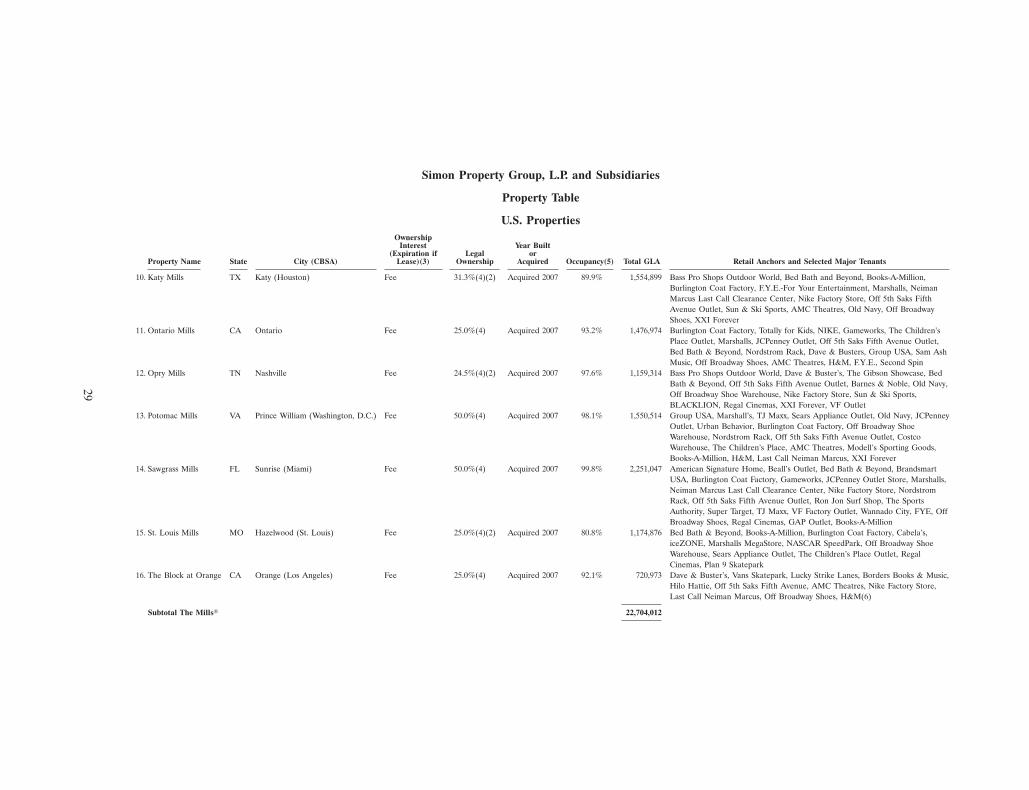
29
Simon Property Group, L.P. and Subsidiaries
Property Table
U.S. PropertiesOwnership
Interest Year Built(Expiration if Legal or
Property Name State City (CBSA) Lease)(3) Ownership Acquired Occupancy(5) Total GLA Retail Anchors and Selected Major Tenants
10. Katy Mills TX Katy (Houston) Fee 31.3%(4)(2) Acquired 2007 89.9% 1,554,899 Bass Pro Shops Outdoor World, Bed Bath and Beyond, Books-A-Million,Burlington Coat Factory, F.Y.E.-For Your Entertainment, Marshalls, NeimanMarcus Last Call Clearance Center, Nike Factory Store, Off 5th Saks FifthAvenue Outlet, Sun & Ski Sports, AMC Theatres, Old Navy, Off BroadwayShoes, XXI Forever
11. Ontario Mills CA Ontario Fee 25.0%(4) Acquired 2007 93.2% 1,476,974 Burlington Coat Factory, Totally for Kids, NIKE, Gameworks, The Children’sPlace Outlet, Marshalls, JCPenney Outlet, Off 5th Saks Fifth Avenue Outlet,Bed Bath & Beyond, Nordstrom Rack, Dave & Busters, Group USA, Sam AshMusic, Off Broadway Shoes, AMC Theatres, H&M, F.Y.E., Second Spin
12. Opry Mills TN Nashville Fee 24.5%(4)(2) Acquired 2007 97.6% 1,159,314 Bass Pro Shops Outdoor World, Dave & Buster’s, The Gibson Showcase, BedBath & Beyond, Off 5th Saks Fifth Avenue Outlet, Barnes & Noble, Old Navy,Off Broadway Shoe Warehouse, Nike Factory Store, Sun & Ski Sports,BLACKLION, Regal Cinemas, XXI Forever, VF Outlet
13. Potomac Mills VA Prince William (Washington, D.C.) Fee 50.0%(4) Acquired 2007 98.1% 1,550,514 Group USA, Marshall’s, TJ Maxx, Sears Appliance Outlet, Old Navy, JCPenneyOutlet, Urban Behavior, Burlington Coat Factory, Off Broadway ShoeWarehouse, Nordstrom Rack, Off 5th Saks Fifth Avenue Outlet, CostcoWarehouse, The Children’s Place, AMC Theatres, Modell’s Sporting Goods,Books-A-Million, H&M, Last Call Neiman Marcus, XXI Forever
14. Sawgrass Mills FL Sunrise (Miami) Fee 50.0%(4) Acquired 2007 99.8% 2,251,047 American Signature Home, Beall’s Outlet, Bed Bath & Beyond, BrandsmartUSA, Burlington Coat Factory, Gameworks, JCPenney Outlet Store, Marshalls,Neiman Marcus Last Call Clearance Center, Nike Factory Store, NordstromRack, Off 5th Saks Fifth Avenue Outlet, Ron Jon Surf Shop, The SportsAuthority, Super Target, TJ Maxx, VF Factory Outlet, Wannado City, FYE, OffBroadway Shoes, Regal Cinemas, GAP Outlet, Books-A-Million
15. St. Louis Mills MO Hazelwood (St. Louis) Fee 25.0%(4)(2) Acquired 2007 80.8% 1,174,876 Bed Bath & Beyond, Books-A-Million, Burlington Coat Factory, Cabela’s,iceZONE, Marshalls MegaStore, NASCAR SpeedPark, Off Broadway ShoeWarehouse, Sears Appliance Outlet, The Children’s Place Outlet, RegalCinemas, Plan 9 Skatepark
16. The Block at Orange CA Orange (Los Angeles) Fee 25.0%(4) Acquired 2007 92.1% 720,973 Dave & Buster’s, Vans Skatepark, Lucky Strike Lanes, Borders Books & Music,Hilo Hattie, Off 5th Saks Fifth Avenue, AMC Theatres, Nike Factory Store,Last Call Neiman Marcus, Off Broadway Shoes, H&M(6)
Subtotal The Mills� 22,704,012
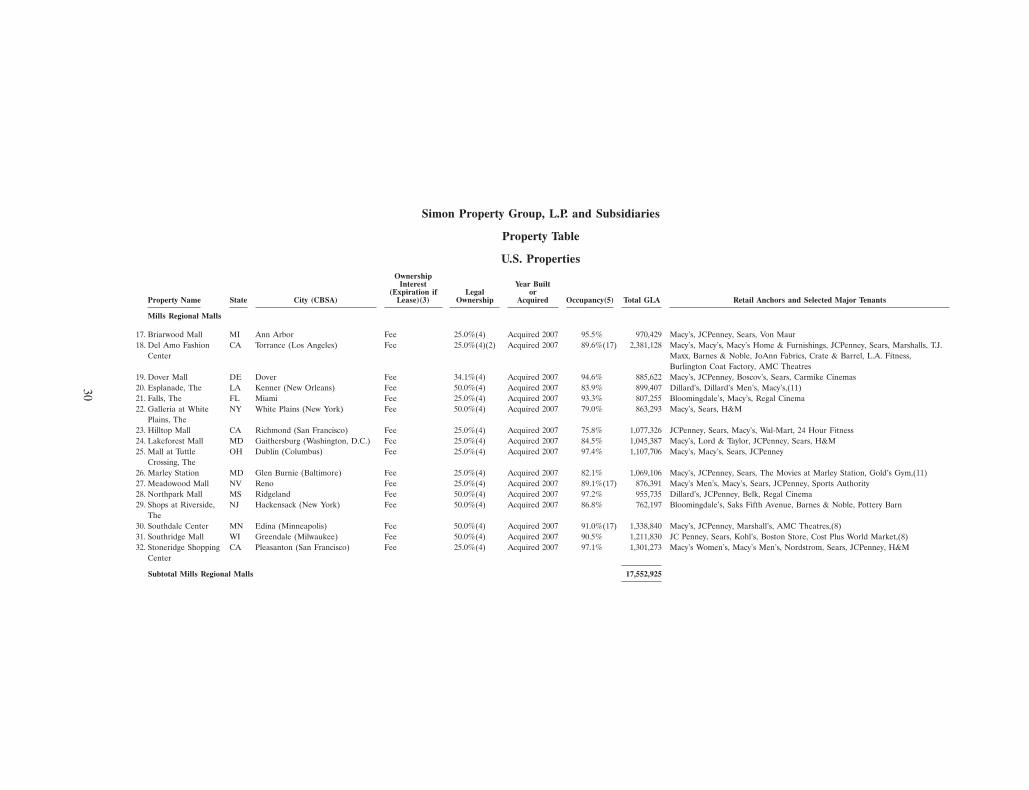
30
Simon Property Group, L.P. and Subsidiaries
Property Table
U.S. PropertiesOwnership
Interest Year Built(Expiration if Legal or
Property Name State City (CBSA) Lease)(3) Ownership Acquired Occupancy(5) Total GLA Retail Anchors and Selected Major Tenants
Mills Regional Malls
17. Briarwood Mall MI Ann Arbor Fee 25.0%(4) Acquired 2007 95.5% 970,429 Macy’s, JCPenney, Sears, Von Maur18. Del Amo Fashion CA Torrance (Los Angeles) Fee 25.0%(4)(2) Acquired 2007 89.6%(17) 2,381,128 Macy’s, Macy’s, Macy’s Home & Furnishings, JCPenney, Sears, Marshalls, T.J.
Center Maxx, Barnes & Noble, JoAnn Fabrics, Crate & Barrel, L.A. Fitness,Burlington Coat Factory, AMC Theatres
19. Dover Mall DE Dover Fee 34.1%(4) Acquired 2007 94.6% 885,622 Macy’s, JCPenney, Boscov’s, Sears, Carmike Cinemas20. Esplanade, The LA Kenner (New Orleans) Fee 50.0%(4) Acquired 2007 83.9% 899,407 Dillard’s, Dillard’s Men’s, Macy’s,(11)21. Falls, The FL Miami Fee 25.0%(4) Acquired 2007 93.3% 807,255 Bloomingdale’s, Macy’s, Regal Cinema22. Galleria at White NY White Plains (New York) Fee 50.0%(4) Acquired 2007 79.0% 863,293 Macy’s, Sears, H&M
Plains, The23. Hilltop Mall CA Richmond (San Francisco) Fee 25.0%(4) Acquired 2007 75.8% 1,077,326 JCPenney, Sears, Macy’s, Wal-Mart, 24 Hour Fitness24. Lakeforest Mall MD Gaithersburg (Washington, D.C.) Fee 25.0%(4) Acquired 2007 84.5% 1,045,387 Macy’s, Lord & Taylor, JCPenney, Sears, H&M25. Mall at Tuttle OH Dublin (Columbus) Fee 25.0%(4) Acquired 2007 97.4% 1,107,706 Macy’s, Macy’s, Sears, JCPenney
Crossing, The26. Marley Station MD Glen Burnie (Baltimore) Fee 25.0%(4) Acquired 2007 82.1% 1,069,106 Macy’s, JCPenney, Sears, The Movies at Marley Station, Gold’s Gym,(11)27. Meadowood Mall NV Reno Fee 25.0%(4) Acquired 2007 89.1%(17) 876,391 Macy’s Men’s, Macy’s, Sears, JCPenney, Sports Authority28. Northpark Mall MS Ridgeland Fee 50.0%(4) Acquired 2007 97.2% 955,735 Dillard’s, JCPenney, Belk, Regal Cinema29. Shops at Riverside, NJ Hackensack (New York) Fee 50.0%(4) Acquired 2007 86.8% 762,197 Bloomingdale’s, Saks Fifth Avenue, Barnes & Noble, Pottery Barn
The30. Southdale Center MN Edina (Minneapolis) Fee 50.0%(4) Acquired 2007 91.0%(17) 1,338,840 Macy’s, JCPenney, Marshall’s, AMC Theatres,(8)31. Southridge Mall WI Greendale (Milwaukee) Fee 50.0%(4) Acquired 2007 90.5% 1,211,830 JC Penney, Sears, Kohl’s, Boston Store, Cost Plus World Market,(8)32. Stoneridge Shopping CA Pleasanton (San Francisco) Fee 25.0%(4) Acquired 2007 97.1% 1,301,273 Macy’s Women’s, Macy’s Men’s, Nordstrom, Sears, JCPenney, H&M
Center
Subtotal Mills Regional Malls 17,552,925
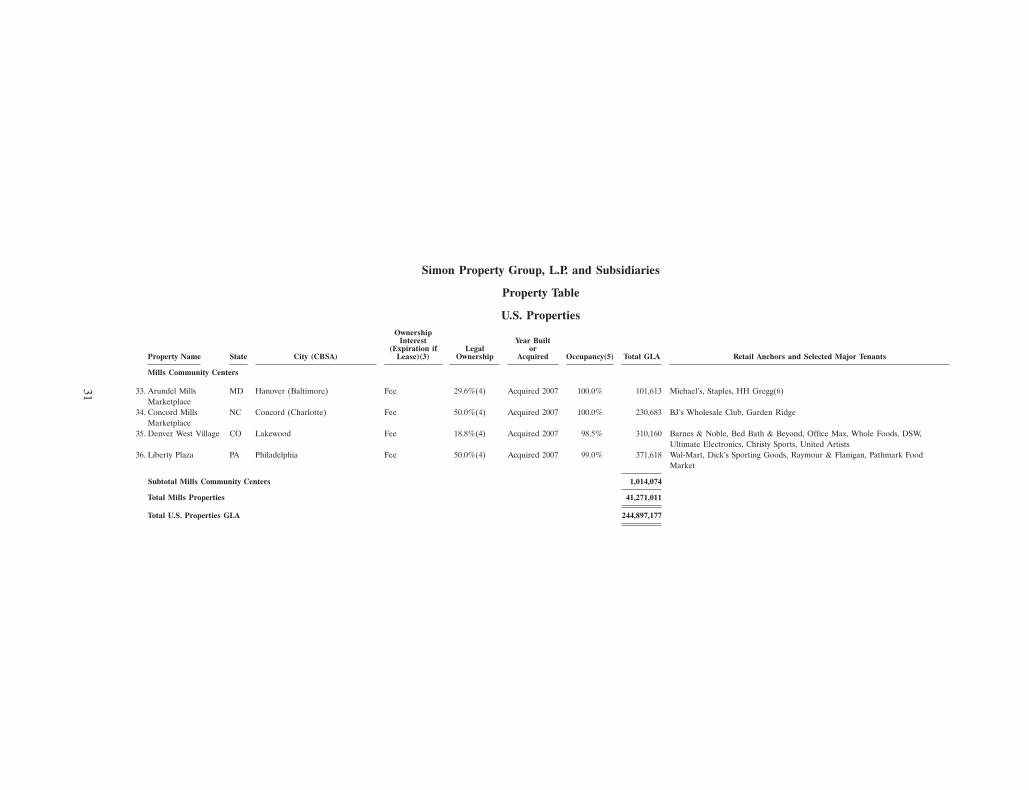
31
Simon Property Group, L.P. and Subsidiaries
Property Table
U.S. PropertiesOwnership
Interest Year Built(Expiration if Legal or
Property Name State City (CBSA) Lease)(3) Ownership Acquired Occupancy(5) Total GLA Retail Anchors and Selected Major Tenants
Mills Community Centers
33. Arundel Mills MD Hanover (Baltimore) Fee 29.6%(4) Acquired 2007 100.0% 101,613 Michael’s, Staples, HH Gregg(6)Marketplace
34. Concord Mills NC Concord (Charlotte) Fee 50.0%(4) Acquired 2007 100.0% 230,683 BJ’s Wholesale Club, Garden RidgeMarketplace
35. Denver West Village CO Lakewood Fee 18.8%(4) Acquired 2007 98.5% 310,160 Barnes & Noble, Bed Bath & Beyond, Office Max, Whole Foods, DSW,Ultimate Electronics, Christy Sports, United Artists
36. Liberty Plaza PA Philadelphia Fee 50.0%(4) Acquired 2007 99.0% 371,618 Wal-Mart, Dick’s Sporting Goods, Raymour & Flanigan, Pathmark FoodMarket
Subtotal Mills Community Centers 1,014,074
Total Mills Properties 41,271,011
Total U.S. Properties GLA 244,897,177

32
FOOTNOTES:
(1) This property is managed by a third party.
(2) Our direct and indirect interests in some of the properties held as joint venture interests are subject to preferences on distributions in favor of other partners or us.
(3) The date listed is the expiration date of the last renewal option available to the operating entity under the ground lease. In a majority of the ground leases, we have a right of first refusal or the right to purchase the lessor’s interest.Unless otherwise indicated, each ground lease listed in this column covers at least 50% of its respective property.
(4) Joint venture properties accounted for under the equity method.
(5) Regional Malls—Executed leases for all company-owned GLA in mall stores, excluding majors. Premium Outlet Centers—Executed leases for all company-owned GLA (or total center GLA). Community/Lifestyle Centers —Executed leases for all company-owned GLA including majors and mall stores.
(6) Indicates anchor or major that is currently under development.
(7) Indicates ground lease covers less than 50% of the acreage of this property.
(8) Indicates vacant anchor space(s).
(9) The lease at the Mall at Chestnut Hill includes the entire premises including land and building.
(10) Indicates ground lease covers outparcel only.
(11) Indicates vacant anchor owned by another company, but we still collect rent and/or fees under an agreement.
(12) We receive substantially all the economic benefit of the property due to a preference or advance.
(13) Outside partner receives substantially all of the economic benefit due to a partner preference.
(14) We own a mortgage note that encumbers Pheasant Lane Mall that entitles us to 100% of the economics of this property.
(15) Our indirect ownership interest is through an approximately 76% ownership interest in Kravco Simon Investments.
(16) Indicates anchor has announced its intent to close this location.
(17) Mall & Freestanding GLA includes office space as follows:
Arsenal Mall—107,188 sq. ft. Northshore Mall—12,367 sq. ft.Century III Mall—30,032 sq. ft. Oak Court Mall—126,583 sq. ft.Coconut Point—1,325 sq. ft. Oxford Valley Mall—110,324 sq. ft.Clay Terrace—110,754 sq. ft. Plaza Carolina—28,436 sq. ft.The Domain—92,954 sq. ft. River Oaks Center—116,912 sq. ft.Copley Place—867,601 sq. ft. Rolling Oaks Mall—6,383 sq. ft.Fashion Centre at Pentagon City, The—169,089 sq. ft. Roosevelt Field—1,610 sq. ft.Firewheel Town Center—74,999 sq. ft. South Hills Village—4,361 sq. ft.Great Lakes Mall—2,051 sq. ft. Stanford Shopping Center—5,748 sq. ft.Greendale Mall—119,860 sq. ft. The Westchester—820 sq. ft.Gwinnett Place—32,603 sq. ft. White Oaks Mall—7,807 sq. ft.King of Prussia Mall—13,100 sq. ft. Del Amo Fashion Center—114,413 sq. ft.Knoxville Center—1,455 sq. ft. Meadowood Mall—6,013 sq. ft.Lehigh Valley Mall—11,754 sq. ft. Southdale Center—20,295 sq. ft.Menlo Park Mall—52,424 sq. ft.

International Properties
Our ownership interests in properties outside the United States are primarily owned through joint venturearrangements. However, we have a direct minority investment in Liberty International, PLC, or Liberty, as furtherdescribed below.
European Investments
The following summarizes our joint venture investments in Europe and the underlying countries in which thesejoint ventures own and operate real estate properties as of December 31, 2009:
PropertiesOwnership open and Countries of
Joint Venture Investment Interest operating Operation
Gallerie Commerciali Italia, S.p.A., or GCI 49.0% 44 ItalySimon Ivanhoe 50.0% 7 France, Poland
In addition, we jointly hold with a third party an interest in one parcel of land for development near Paris,France outside of these two joint ventures. Simon Ivanhoe and GCI are fully integrated European retail real estatedevelopers, owners and managers.
Our properties in Europe consist primarily of hypermarket-anchored shopping centers. Substantially all of ourEuropean properties are anchored by either the hypermarket retailer Auchan, primarily in Italy, who is also ourpartner in GCI, or are anchored by the hypermarket Carrefour in France and Poland. Certain of the properties in Italyare subject to leaseholds whereby GCI leases all or a portion of the premises from a third party who is entitled toreceive substantially all the economic benefits of that portion of the properties. Auchan and Carrefour are the twolargest hypermarket operators in Europe. These centers comprise over 13.4 million square feet of GLA and were95.9% leased as of December 31, 2009.
On February 4, 2010, we and our partner in Simon Ivanhoe, Ivanhoe Cambridge Inc., or Ivanhoe Cambridge,entered into a definitive agreement to sell all of the interests in Simon Ivanhoe which owns seven shopping centerslocated in France and Poland to Unibail-Rodamco. The joint venture partners will receive consideration ofA715 million for their interests, subject to certain post-closing adjustments. We expect our share of the gain on sale ofour interests in Simon Ivanhoe to be approximately $300 million. The transaction is scheduled to close during the firsthalf of 2010, subject to customary closing conditions and regulatory approvals.
We and Ivanhoe Cambridge have the right to participate with Unibail-Rodamco in the potential developmentof up to five new retail projects in the Simon Ivanhoe pipeline, subject to customary approval rights. We will own a25% interest in any of these projects in which we agree to participate.
Other International Investments
We also hold real estate interests in eight joint venture properties in Japan, one joint venture property inMexico, and one joint venture property in Korea. The eight Japanese Premium Outlet Centers operate in various citiesthroughout Japan and are held in a joint venture with Mitsubishi Estate Co., Ltd. These centers comprise over2.4 million square feet of GLA and were 99.6% leased as of December 31, 2009.
The following summarizes our holdings in these international joint ventures and the underlying countries inwhich these joint ventures own and operate real estate properties as of December 31, 2009:
PropertiesOwnership open and
Holdings Interest operating Countries of Operation
Chelsea Japan Co. Ltd. 40.0% 8 JapanPremium Outlets Punta Norte (Mexico City) 50.0% 1 MexicoYeoju Premium Outlets (Seoul) 50.0% 1 South Korea
In 2009, we completed construction and opened Ami Premium Outlets, a 224,500 square foot center locatedoutside Tokyo, Japan. We have a 40% interest in this property consistent with the ownership structure of our otherJapanese investments. We also completed construction and opened a 171,800 square foot expansion at Kobe-Sanda
33
Premium Outlets in Hyougo-ken, Japan. Also in December 2009, we recognized a loss on our joint venture interests inour shopping centers in China. We sold our interests to affiliates of our Chinese partner for approximately $29 million,resulting in a loss of approximately $20 million.
We hold a minority interest in Liberty which is a U.K. Real Estate Investment Trust that operates regionalshopping centers and owns other prime retail assets throughout the U.K. Liberty is a U.K. FTSE 100 listed company,with shareholders’ funds of £3.2 billion and property investments of £6.1 billion, of which its U.K. regional shoppingcenters comprise 70%. Assets of the group under control by or joint control with Liberty amount to £9.3 billion. Ourinterest in Liberty is less than 6% of its outstanding shares. We adjust the carrying value of this investment quarterlyusing quoted market prices, including a related foreign exchange component.
The following property table summarizes certain data for our properties located in Europe, Japan, Mexico, andKorea at December 31, 2009.
34

35
Simon Property Group, L.P. and SubsidiariesInternational Property Table
SPGOwnership Effective Year Total Gross Retail Anchors and
COUNTRY/Property Name City (Metropolitan area) Interest Ownership Built Leasable Area Major Tenants
FRANCE1. Bay 2 Torcy (Paris) Fee 50.0% 2003 576,800 Carrefour, Leroy Merlin2. Bay 1 Torcy (Paris) Fee 50.0% 2004 348,900 Conforama, Go Sport3. Bel’Est Bagnolet (Paris) Fee 17.5% 1992 173,100 Auchan4. Villabe A6 Villabe (Paris) Fee 7.5% 1992 284,300 Carrefour5. Wasquehal Wasquehal (Lille) Fee 50.0% 2006 254,700 Carrefour
Subtotal France 1,637,800ITALY
6. Ancona — Senigallia Senigallia (Ancona) Fee 49.0% 1995 82,800 Cityper7. Ascoli Piceno — Grottammare Grottammare (Ascoli Piceno) Fee 49.0% 1995 94,800 Cityper8. Ascoli Piceno — Porto Sant’Elpidio Porto Sant’Elpidio (Ascoli Fee 49.0% 1999 162,300 Cityper
Piceno)9. Bari — Casamassima Casamassima (Bari) Fee 49.0% 1995 547,800 Auchan, Coin, Eldo, Bata, Leroy Merlin, Decathlon10. Bari — Modugno Modugno (Bari) Fee 49.0% 2004 143,500 Auchan, euronics, Decathlon11. Brescia — Mazzano Mazzano (Brescia) Fee / Leasehold (2) 49.0%(2) 1994 230,700 Auchan, Bricocenter12. Brindisi-Mesagne Mesagne (Brindisi) Fee 49.0% 2003 228,600 Auchan, Leroy Merlin, Piazza Italia, Euronics13. Cagliari — Santa Gilla Cagliari Fee / Leasehold (2) 49.0%(2) 1992 190,700 Auchan, Bricocenter14. Catania — La Rena Catania Fee 49.0% 1998 146,200 Auchan15. Cinisello Cinisello (Milano) Fee 49.0% 2007 375,600 Auchan, Darty, Scarpe & Scarpe, H&M, Piazza Italia, Conbipel16. Cuneo Cuneo (Torino) Fee 49.0% 2004 282,200 Auchan, Bricocenter, Decathlon, Euronics17. Giugliano Giugliano (Napoli) Fee 49.0%(5) 2006 754,500 Auchan, Leroy Merlin, Decathlon, Conbipel, Scarpe & Scarpe, Euronics,
Eldo18. Milano — Rescaldina Rescaldina (Milano) Fee 49.0% 2000 377,100 Auchan, Bricocenter, Decathlon, Media World19. Milano — Vimodrone Vimodrone (Milano) Fee 49.0% 1989 190,600 Auchan, Bricocenter20. Napoli — Pompei Pompei (Napoli) Fee 49.0% 1990 91,400 Auchan21. Nola — Volcano Buono Nola (Napoli) Fee 22.1% 2007 876,000 Auchan, Coin, Holiday Inn, Media World, Piazza Italia, H&M, Cisalfa,
Zara22. Padova Padova Fee 49.0% 1989 105,800 Auchan23. Palermo Palermo Fee 49.0% 1990 82,900 Auchan24. Pesaro — Fano Fano (Pesaro) Fee 49.0% 1994 112,300 Auchan25. Pescara Pescara Fee 49.0% 1998 161,500 Auchan, Euronics26. Pescara — Cepagatti Cepagatti (Pescara) Fee 49.0% 2001 269,800 Auchan, Bata27. Piacenza — San Rocco al Porto San Rocco al Porto (Piacenza) Fee 49.0% 1992 179,200 Auchan, Darty28. Porta Di Roma Roma Fee 19.6% 2007 1,255,400 Auchan, Leroy Merlin, UGC Theatres, Ikea, Media World, Decathlon,
H&M, Zara29. Roma — Collatina Collatina (Roma) Fee 49.0% 1999 63,600 Auchan30. Sassari — Predda Niedda Predda Niedda (Sassari) Fee / Leasehold (2) 49.0%(2) 1990 233,700 Auchan, Bricocenter, Media World31. Taranto Taranto Fee 49.0% 1997 201,700 Auchan, Bricocenter32. Torino Torino Fee 49.0% 1989 171,800 Auchan33. Torino — Venaria Venaria (Torino) Fee 49.0% 1982 165,600 Auchan, Bricocenter34. Venezia — Mestre Mestre (Venezia) Fee 49.0% 1995 246,700 Auchan
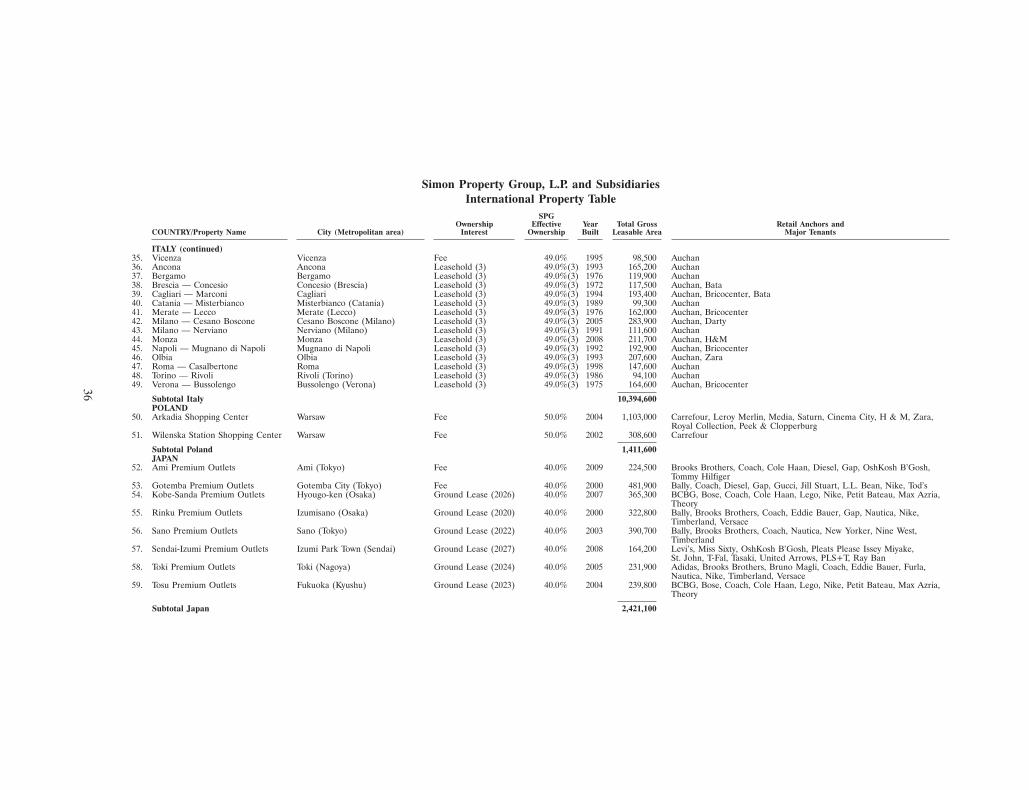
36
Simon Property Group, L.P. and SubsidiariesInternational Property Table
SPGOwnership Effective Year Total Gross Retail Anchors and
COUNTRY/Property Name City (Metropolitan area) Interest Ownership Built Leasable Area Major Tenants
ITALY (continued)35. Vicenza Vicenza Fee 49.0% 1995 98,500 Auchan36. Ancona Ancona Leasehold (3) 49.0%(3) 1993 165,200 Auchan37. Bergamo Bergamo Leasehold (3) 49.0%(3) 1976 119,900 Auchan38. Brescia — Concesio Concesio (Brescia) Leasehold (3) 49.0%(3) 1972 117,500 Auchan, Bata39. Cagliari — Marconi Cagliari Leasehold (3) 49.0%(3) 1994 193,400 Auchan, Bricocenter, Bata40. Catania — Misterbianco Misterbianco (Catania) Leasehold (3) 49.0%(3) 1989 99,300 Auchan41. Merate — Lecco Merate (Lecco) Leasehold (3) 49.0%(3) 1976 162,000 Auchan, Bricocenter42. Milano — Cesano Boscone Cesano Boscone (Milano) Leasehold (3) 49.0%(3) 2005 283,900 Auchan, Darty43. Milano — Nerviano Nerviano (Milano) Leasehold (3) 49.0%(3) 1991 111,600 Auchan44. Monza Monza Leasehold (3) 49.0%(3) 2008 211,700 Auchan, H&M45. Napoli — Mugnano di Napoli Mugnano di Napoli Leasehold (3) 49.0%(3) 1992 192,900 Auchan, Bricocenter46. Olbia Olbia Leasehold (3) 49.0%(3) 1993 207,600 Auchan, Zara47. Roma — Casalbertone Roma Leasehold (3) 49.0%(3) 1998 147,600 Auchan48. Torino — Rivoli Rivoli (Torino) Leasehold (3) 49.0%(3) 1986 94,100 Auchan49. Verona — Bussolengo Bussolengo (Verona) Leasehold (3) 49.0%(3) 1975 164,600 Auchan, Bricocenter
Subtotal Italy 10,394,600POLAND
50. Arkadia Shopping Center Warsaw Fee 50.0% 2004 1,103,000 Carrefour, Leroy Merlin, Media, Saturn, Cinema City, H & M, Zara,Royal Collection, Peek & Clopperburg
51. Wilenska Station Shopping Center Warsaw Fee 50.0% 2002 308,600 Carrefour
Subtotal Poland 1,411,600JAPAN
52. Ami Premium Outlets Ami (Tokyo) Fee 40.0% 2009 224,500 Brooks Brothers, Coach, Cole Haan, Diesel, Gap, OshKosh B’Gosh,Tommy Hilfiger
53. Gotemba Premium Outlets Gotemba City (Tokyo) Fee 40.0% 2000 481,900 Bally, Coach, Diesel, Gap, Gucci, Jill Stuart, L.L. Bean, Nike, Tod’s54. Kobe-Sanda Premium Outlets Hyougo-ken (Osaka) Ground Lease (2026) 40.0% 2007 365,300 BCBG, Bose, Coach, Cole Haan, Lego, Nike, Petit Bateau, Max Azria,
Theory55. Rinku Premium Outlets Izumisano (Osaka) Ground Lease (2020) 40.0% 2000 322,800 Bally, Brooks Brothers, Coach, Eddie Bauer, Gap, Nautica, Nike,
Timberland, Versace56. Sano Premium Outlets Sano (Tokyo) Ground Lease (2022) 40.0% 2003 390,700 Bally, Brooks Brothers, Coach, Nautica, New Yorker, Nine West,
Timberland57. Sendai-Izumi Premium Outlets Izumi Park Town (Sendai) Ground Lease (2027) 40.0% 2008 164,200 Levi’s, Miss Sixty, OshKosh B’Gosh, Pleats Please Issey Miyake,
St. John, T-Fal, Tasaki, United Arrows, PLS+T, Ray Ban58. Toki Premium Outlets Toki (Nagoya) Ground Lease (2024) 40.0% 2005 231,900 Adidas, Brooks Brothers, Bruno Magli, Coach, Eddie Bauer, Furla,
Nautica, Nike, Timberland, Versace59. Tosu Premium Outlets Fukuoka (Kyushu) Ground Lease (2023) 40.0% 2004 239,800 BCBG, Bose, Coach, Cole Haan, Lego, Nike, Petit Bateau, Max Azria,
Theory
Subtotal Japan 2,421,100
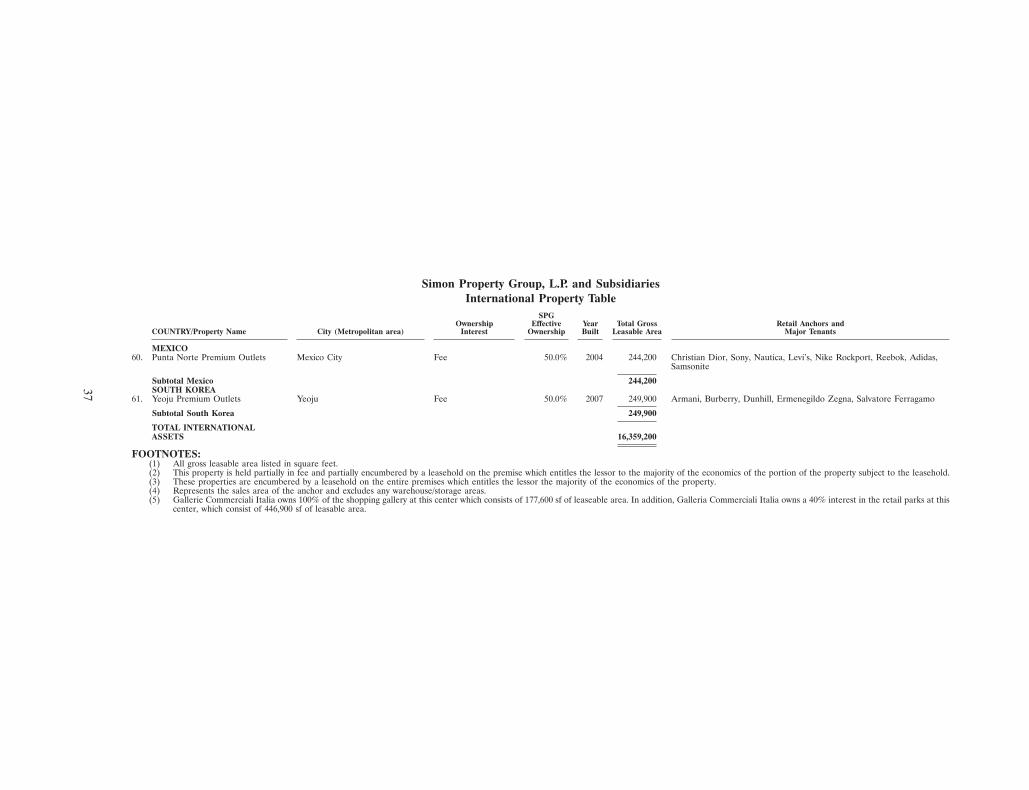
37
Simon Property Group, L.P. and SubsidiariesInternational Property Table
SPGOwnership Effective Year Total Gross Retail Anchors and
COUNTRY/Property Name City (Metropolitan area) Interest Ownership Built Leasable Area Major Tenants
MEXICO60. Punta Norte Premium Outlets Mexico City Fee 50.0% 2004 244,200 Christian Dior, Sony, Nautica, Levi’s, Nike Rockport, Reebok, Adidas,
Samsonite
Subtotal Mexico 244,200SOUTH KOREA
61. Yeoju Premium Outlets Yeoju Fee 50.0% 2007 249,900 Armani, Burberry, Dunhill, Ermenegildo Zegna, Salvatore Ferragamo
Subtotal South Korea 249,900
TOTAL INTERNATIONALASSETS 16,359,200
FOOTNOTES:(1) All gross leasable area listed in square feet.(2) This property is held partially in fee and partially encumbered by a leasehold on the premise which entitles the lessor to the majority of the economics of the portion of the property subject to the leasehold.(3) These properties are encumbered by a leasehold on the entire premises which entitles the lessor the majority of the economics of the property.(4) Represents the sales area of the anchor and excludes any warehouse/storage areas.(5) Gallerie Commerciali Italia owns 100% of the shopping gallery at this center which consists of 177,600 sf of leaseable area. In addition, Galleria Commerciali Italia owns a 40% interest in the retail parks at this
center, which consist of 446,900 sf of leasable area.

Land
We have direct or indirect ownership interests in approximately 700 acres of land held in the United States forfuture development.
Sustainability and Energy Efficiency
Due to the size of our portfolio, we focus on energy efficiency as a core sustainability strategy. Through thecontinued use of energy conservation practices, energy efficiency projects, and continuous monitoring and reporting,we have reduced our energy consumption at comparable properties every year since 2003. As a result, excluding newdevelopments and expansions, we reduced the electricity usage over which we have direct control by 238 million kWhssince 2003. This represents a 17% percent reduction in electricity usage across a portfolio of comparable propertiesand reflects an annual value of over $27.5 million in avoided operating costs. Our documented reduction in greenhousegas emissions resulting from our energy management efforts is 140,000 metric tons CO2e.
Simon Property was awarded NAREIT’s Leader in the Light Award for the fifth year in a row and is the onlycompany to have achieved the Leader in the Light distinction every single year since NAREIT launched the programin 2005. Simon Property was also included in the 2009 Carbon Disclosure Project’s Global 500 Carbon DisclosureLeadership Index. The 2009 Carbon Disclosure Leadership Index highlights 50 companies worldwide that havedisplayed the most professional approach to corporate governance with respect to climate change disclosure practices.Simon Property was the only real estate company to be recognized.
Mortgage Financing on Properties
The following table sets forth certain information regarding the mortgages and other indebtednessencumbering our properties, and the properties held by our domestic and international joint venture arrangements,and also our unsecured corporate debt. Substantially all of the mortgage and property related debt is nonrecourse tous.
38

MORTGAGE AND OTHER DEBT ON PORTFOLIO PROPERTIESAs of December 31, 2009
(Dollars in thousands)
Interest Face Annual Debt MaturityProperty Name Rate Amount Service Date
Consolidated Indebtedness:
Secured Indebtedness:Simon Property Group, LP:Anderson Mall . . . . . . . . . . . . . . . . . . . . . . . . . . 6.20% $ 27,270 $ 2,216 10/10/12Arsenal Mall HCHP Office . . . . . . . . . . . . . . . . . . 8.20% 973 202 05/05/16Bangor Mall . . . . . . . . . . . . . . . . . . . . . . . . . . . . 6.15% 80,000 4,918 (2) 10/01/17Battlefield Mall . . . . . . . . . . . . . . . . . . . . . . . . . . 4.60% 92,750 6,154 07/01/13Bloomingdale Court . . . . . . . . . . . . . . . . . . . . . . . 8.15% 26,573 2,376 11/01/15Brunswick Square . . . . . . . . . . . . . . . . . . . . . . . . 5.65% 82,244 5,957 08/11/14Carolina Premium Outlets — Smithfield . . . . . . . . . 9.10% 19,386 (6) 2,114 03/10/13 (25)Century III Mall . . . . . . . . . . . . . . . . . . . . . . . . . 6.20% 80,498 (9) 6,541 10/10/12Chesapeake Square . . . . . . . . . . . . . . . . . . . . . . . 5.84% 69,849 5,162 08/01/14Copley Place . . . . . . . . . . . . . . . . . . . . . . . . . . . 0.88% (1) 200,000 1,762 (2) 08/01/10 (3)Coral Square . . . . . . . . . . . . . . . . . . . . . . . . . . . 8.00% 81,667 8,065 10/01/10The Crossings Premium Outlets . . . . . . . . . . . . . . . 5.85% 52,505 4,649 03/13/13Crossroads Mall . . . . . . . . . . . . . . . . . . . . . . . . . 6.20% 40,617 3,285 10/10/12Crystal River . . . . . . . . . . . . . . . . . . . . . . . . . . . 7.63% 14,676 1,385 11/11/10 (25)Dare Centre . . . . . . . . . . . . . . . . . . . . . . . . . . . . 9.10% 1,614 (6) 176 03/10/13 (25)DeKalb Plaza . . . . . . . . . . . . . . . . . . . . . . . . . . . 5.28% 2,946 233 01/01/15Desoto Square . . . . . . . . . . . . . . . . . . . . . . . . . . 5.89% 63,799 4,561 07/01/14The Factory Shoppes at Branson Meadows . . . . . . . . 9.10% 9,016 (6) 983 03/10/13 (25)Factory Stores of America . . . . . . . . . . . . . . . . . . . 9.10% 15,579 (6) 1,699 03/10/13 (25)Forest Mall . . . . . . . . . . . . . . . . . . . . . . . . . . . . 6.20% 16,190 (10) 1,316 10/10/12Forest Plaza . . . . . . . . . . . . . . . . . . . . . . . . . . . . 7.50% 18,957 1,685 10/10/19Forum Shops at Caesars, The . . . . . . . . . . . . . . . . 4.78% 515,335 34,564 12/01/10Gateway Shopping Center . . . . . . . . . . . . . . . . . . . 5.89% 87,000 5,124 (2) 10/01/11Greenwood Park Mall . . . . . . . . . . . . . . . . . . . . . 8.00% 79,756 (37) 7,044 08/01/16Gwinnett Place . . . . . . . . . . . . . . . . . . . . . . . . . . 5.68% 115,000 6,532 (2) 06/08/12Henderson Square . . . . . . . . . . . . . . . . . . . . . . . . 6.94% 14,367 1,270 07/01/11Highland Lakes Center . . . . . . . . . . . . . . . . . . . . 6.20% 14,924 (9) 1,213 10/10/12Independence Center . . . . . . . . . . . . . . . . . . . . . . 5.94% 200,000 11,886 (2) 07/10/17Ingram Park Mall . . . . . . . . . . . . . . . . . . . . . . . . 6.99% 75,884 (20) 6,724 08/11/11Kittery Premium Outlets . . . . . . . . . . . . . . . . . . . . 5.39% (11) 43,556 (7) 2,347 (2) 07/10/13 (3)Knoxville Center . . . . . . . . . . . . . . . . . . . . . . . . . 6.99% 57,464 (20) 5,092 08/11/11Lake View Plaza . . . . . . . . . . . . . . . . . . . . . . . . . 8.00% 16,000 1,409 01/01/15Lakeline Plaza . . . . . . . . . . . . . . . . . . . . . . . . . . 7.50% 17,759 1,578 10/10/19Las Americas Premium Outlets . . . . . . . . . . . . . . . 5.84% 180,000 10,511 (2) 06/11/16Lighthouse Place Premium Outlets . . . . . . . . . . . . . 5.39% (11) 88,623 (7) 4,775 (2) 07/10/13 (3)Longview Mall . . . . . . . . . . . . . . . . . . . . . . . . . . 6.20% 30,300 (9) 2,462 10/10/12MacGregor Village . . . . . . . . . . . . . . . . . . . . . . . 9.10% 6,492 (6) 708 03/10/13 (25)Mall of Georgia . . . . . . . . . . . . . . . . . . . . . . . . . 7.09% 181,606 (32) 16,649 07/01/10Markland Mall . . . . . . . . . . . . . . . . . . . . . . . . . . 6.20% 21,437 (10) 1,742 10/10/12Midland Park Mall . . . . . . . . . . . . . . . . . . . . . . . 6.20% 31,295 (10) 2,543 10/10/12Montgomery Mall . . . . . . . . . . . . . . . . . . . . . . . . 5.17% 87,806 6,307 05/11/14 (25)Muncie Plaza . . . . . . . . . . . . . . . . . . . . . . . . . . . 7.50% 7,383 656 10/10/19Northfield Square . . . . . . . . . . . . . . . . . . . . . . . . 6.05% 28,344 2,485 02/11/14Northlake Mall . . . . . . . . . . . . . . . . . . . . . . . . . . 6.99% 66,290 (20) 5,874 08/11/11North Ridge Shopping Center . . . . . . . . . . . . . . . . 9.10% 7,929 (6) 865 03/10/13 (25)Oxford Valley Mall . . . . . . . . . . . . . . . . . . . . . . . 6.76% 71,975 7,801 01/10/11
39
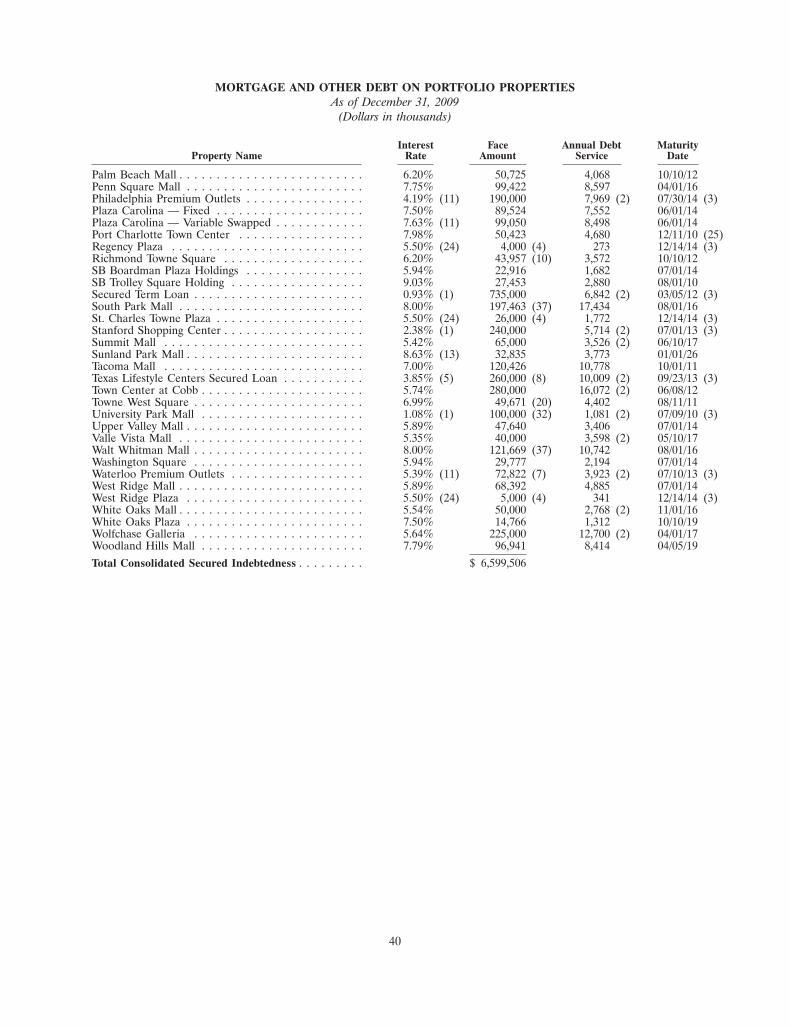
MORTGAGE AND OTHER DEBT ON PORTFOLIO PROPERTIESAs of December 31, 2009
(Dollars in thousands)
Interest Face Annual Debt MaturityProperty Name Rate Amount Service Date
Palm Beach Mall . . . . . . . . . . . . . . . . . . . . . . . . . 6.20% 50,725 4,068 10/10/12Penn Square Mall . . . . . . . . . . . . . . . . . . . . . . . . 7.75% 99,422 8,597 04/01/16Philadelphia Premium Outlets . . . . . . . . . . . . . . . . 4.19% (11) 190,000 7,969 (2) 07/30/14 (3)Plaza Carolina — Fixed . . . . . . . . . . . . . . . . . . . . 7.50% 89,524 7,552 06/01/14Plaza Carolina — Variable Swapped . . . . . . . . . . . . 7.63% (11) 99,050 8,498 06/01/14Port Charlotte Town Center . . . . . . . . . . . . . . . . . 7.98% 50,423 4,680 12/11/10 (25)Regency Plaza . . . . . . . . . . . . . . . . . . . . . . . . . . 5.50% (24) 4,000 (4) 273 12/14/14 (3)Richmond Towne Square . . . . . . . . . . . . . . . . . . . 6.20% 43,957 (10) 3,572 10/10/12SB Boardman Plaza Holdings . . . . . . . . . . . . . . . . 5.94% 22,916 1,682 07/01/14SB Trolley Square Holding . . . . . . . . . . . . . . . . . . 9.03% 27,453 2,880 08/01/10Secured Term Loan . . . . . . . . . . . . . . . . . . . . . . . 0.93% (1) 735,000 6,842 (2) 03/05/12 (3)South Park Mall . . . . . . . . . . . . . . . . . . . . . . . . . 8.00% 197,463 (37) 17,434 08/01/16St. Charles Towne Plaza . . . . . . . . . . . . . . . . . . . . 5.50% (24) 26,000 (4) 1,772 12/14/14 (3)Stanford Shopping Center . . . . . . . . . . . . . . . . . . . 2.38% (1) 240,000 5,714 (2) 07/01/13 (3)Summit Mall . . . . . . . . . . . . . . . . . . . . . . . . . . . 5.42% 65,000 3,526 (2) 06/10/17Sunland Park Mall . . . . . . . . . . . . . . . . . . . . . . . . 8.63% (13) 32,835 3,773 01/01/26Tacoma Mall . . . . . . . . . . . . . . . . . . . . . . . . . . . 7.00% 120,426 10,778 10/01/11Texas Lifestyle Centers Secured Loan . . . . . . . . . . . 3.85% (5) 260,000 (8) 10,009 (2) 09/23/13 (3)Town Center at Cobb . . . . . . . . . . . . . . . . . . . . . . 5.74% 280,000 16,072 (2) 06/08/12Towne West Square . . . . . . . . . . . . . . . . . . . . . . . 6.99% 49,671 (20) 4,402 08/11/11University Park Mall . . . . . . . . . . . . . . . . . . . . . . 1.08% (1) 100,000 (32) 1,081 (2) 07/09/10 (3)Upper Valley Mall . . . . . . . . . . . . . . . . . . . . . . . . 5.89% 47,640 3,406 07/01/14Valle Vista Mall . . . . . . . . . . . . . . . . . . . . . . . . . 5.35% 40,000 3,598 (2) 05/10/17Walt Whitman Mall . . . . . . . . . . . . . . . . . . . . . . . 8.00% 121,669 (37) 10,742 08/01/16Washington Square . . . . . . . . . . . . . . . . . . . . . . . 5.94% 29,777 2,194 07/01/14Waterloo Premium Outlets . . . . . . . . . . . . . . . . . . 5.39% (11) 72,822 (7) 3,923 (2) 07/10/13 (3)West Ridge Mall . . . . . . . . . . . . . . . . . . . . . . . . . 5.89% 68,392 4,885 07/01/14West Ridge Plaza . . . . . . . . . . . . . . . . . . . . . . . . 5.50% (24) 5,000 (4) 341 12/14/14 (3)White Oaks Mall . . . . . . . . . . . . . . . . . . . . . . . . . 5.54% 50,000 2,768 (2) 11/01/16White Oaks Plaza . . . . . . . . . . . . . . . . . . . . . . . . 7.50% 14,766 1,312 10/10/19Wolfchase Galleria . . . . . . . . . . . . . . . . . . . . . . . 5.64% 225,000 12,700 (2) 04/01/17Woodland Hills Mall . . . . . . . . . . . . . . . . . . . . . . 7.79% 96,941 8,414 04/05/19
Total Consolidated Secured Indebtedness . . . . . . . . . $ 6,599,506
40
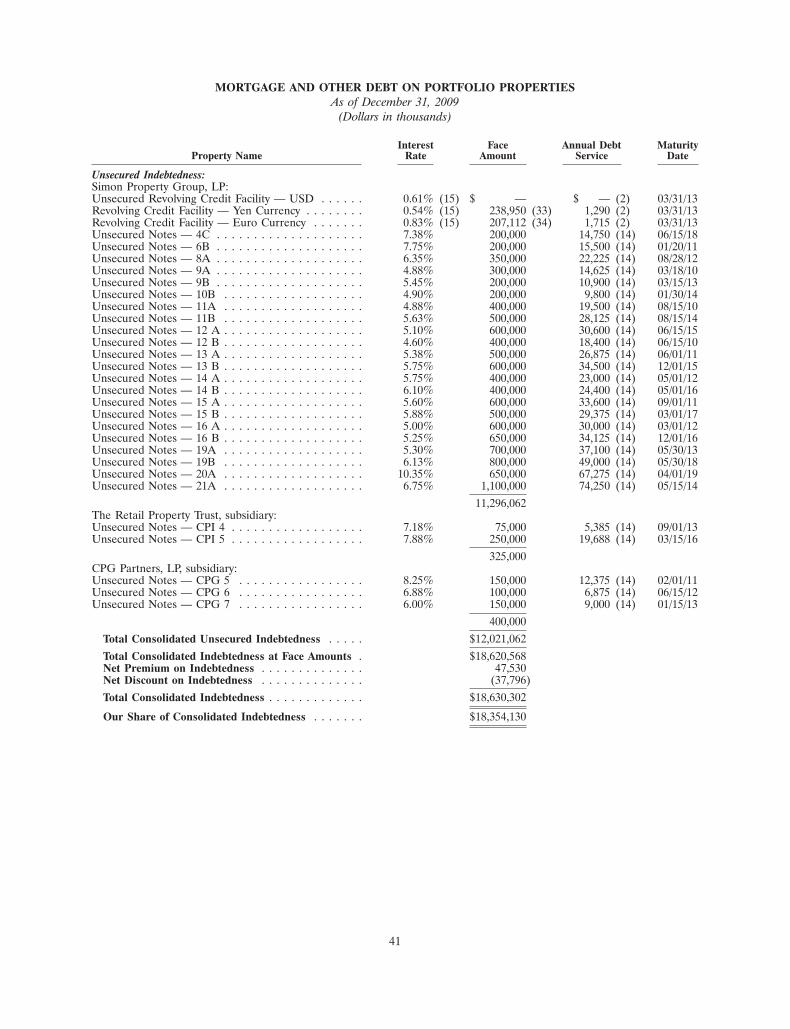
MORTGAGE AND OTHER DEBT ON PORTFOLIO PROPERTIESAs of December 31, 2009
(Dollars in thousands)
Interest Face Annual Debt MaturityProperty Name Rate Amount Service Date
Unsecured Indebtedness:Simon Property Group, LP:Unsecured Revolving Credit Facility — USD . . . . . . 0.61% (15) $ — $ — (2) 03/31/13Revolving Credit Facility — Yen Currency . . . . . . . . 0.54% (15) 238,950 (33) 1,290 (2) 03/31/13Revolving Credit Facility — Euro Currency . . . . . . . 0.83% (15) 207,112 (34) 1,715 (2) 03/31/13Unsecured Notes — 4C . . . . . . . . . . . . . . . . . . . . 7.38% 200,000 14,750 (14) 06/15/18Unsecured Notes — 6B . . . . . . . . . . . . . . . . . . . . 7.75% 200,000 15,500 (14) 01/20/11Unsecured Notes — 8A . . . . . . . . . . . . . . . . . . . . 6.35% 350,000 22,225 (14) 08/28/12Unsecured Notes — 9A . . . . . . . . . . . . . . . . . . . . 4.88% 300,000 14,625 (14) 03/18/10Unsecured Notes — 9B . . . . . . . . . . . . . . . . . . . . 5.45% 200,000 10,900 (14) 03/15/13Unsecured Notes — 10B . . . . . . . . . . . . . . . . . . . 4.90% 200,000 9,800 (14) 01/30/14Unsecured Notes — 11A . . . . . . . . . . . . . . . . . . . 4.88% 400,000 19,500 (14) 08/15/10Unsecured Notes — 11B . . . . . . . . . . . . . . . . . . . 5.63% 500,000 28,125 (14) 08/15/14Unsecured Notes — 12 A . . . . . . . . . . . . . . . . . . . 5.10% 600,000 30,600 (14) 06/15/15Unsecured Notes — 12 B . . . . . . . . . . . . . . . . . . . 4.60% 400,000 18,400 (14) 06/15/10Unsecured Notes — 13 A . . . . . . . . . . . . . . . . . . . 5.38% 500,000 26,875 (14) 06/01/11Unsecured Notes — 13 B . . . . . . . . . . . . . . . . . . . 5.75% 600,000 34,500 (14) 12/01/15Unsecured Notes — 14 A . . . . . . . . . . . . . . . . . . . 5.75% 400,000 23,000 (14) 05/01/12Unsecured Notes — 14 B . . . . . . . . . . . . . . . . . . . 6.10% 400,000 24,400 (14) 05/01/16Unsecured Notes — 15 A . . . . . . . . . . . . . . . . . . . 5.60% 600,000 33,600 (14) 09/01/11Unsecured Notes — 15 B . . . . . . . . . . . . . . . . . . . 5.88% 500,000 29,375 (14) 03/01/17Unsecured Notes — 16 A . . . . . . . . . . . . . . . . . . . 5.00% 600,000 30,000 (14) 03/01/12Unsecured Notes — 16 B . . . . . . . . . . . . . . . . . . . 5.25% 650,000 34,125 (14) 12/01/16Unsecured Notes — 19A . . . . . . . . . . . . . . . . . . . 5.30% 700,000 37,100 (14) 05/30/13Unsecured Notes — 19B . . . . . . . . . . . . . . . . . . . 6.13% 800,000 49,000 (14) 05/30/18Unsecured Notes — 20A . . . . . . . . . . . . . . . . . . . 10.35% 650,000 67,275 (14) 04/01/19Unsecured Notes — 21A . . . . . . . . . . . . . . . . . . . 6.75% 1,100,000 74,250 (14) 05/15/14
11,296,062The Retail Property Trust, subsidiary:Unsecured Notes — CPI 4 . . . . . . . . . . . . . . . . . . 7.18% 75,000 5,385 (14) 09/01/13Unsecured Notes — CPI 5 . . . . . . . . . . . . . . . . . . 7.88% 250,000 19,688 (14) 03/15/16
325,000CPG Partners, LP, subsidiary:Unsecured Notes — CPG 5 . . . . . . . . . . . . . . . . . 8.25% 150,000 12,375 (14) 02/01/11Unsecured Notes — CPG 6 . . . . . . . . . . . . . . . . . 6.88% 100,000 6,875 (14) 06/15/12Unsecured Notes — CPG 7 . . . . . . . . . . . . . . . . . 6.00% 150,000 9,000 (14) 01/15/13
400,000
Total Consolidated Unsecured Indebtedness . . . . . $12,021,062
Total Consolidated Indebtedness at Face Amounts . $18,620,568Net Premium on Indebtedness . . . . . . . . . . . . . . 47,530Net Discount on Indebtedness . . . . . . . . . . . . . . (37,796)
Total Consolidated Indebtedness . . . . . . . . . . . . . $18,630,302
Our Share of Consolidated Indebtedness . . . . . . . $18,354,130
41
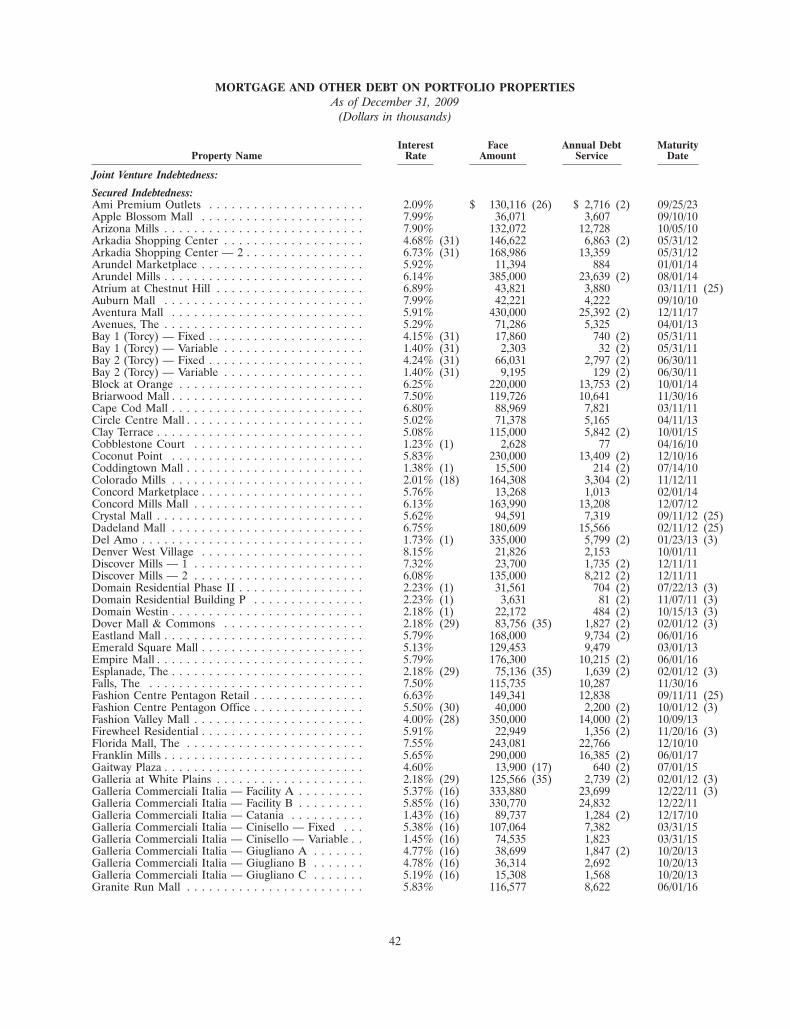
MORTGAGE AND OTHER DEBT ON PORTFOLIO PROPERTIESAs of December 31, 2009
(Dollars in thousands)
Interest Face Annual Debt MaturityProperty Name Rate Amount Service Date
Joint Venture Indebtedness:
Secured Indebtedness:Ami Premium Outlets . . . . . . . . . . . . . . . . . . . . . 2.09% $ 130,116 (26) $ 2,716 (2) 09/25/23Apple Blossom Mall . . . . . . . . . . . . . . . . . . . . . . 7.99% 36,071 3,607 09/10/10Arizona Mills . . . . . . . . . . . . . . . . . . . . . . . . . . . 7.90% 132,072 12,728 10/05/10Arkadia Shopping Center . . . . . . . . . . . . . . . . . . . 4.68% (31) 146,622 6,863 (2) 05/31/12Arkadia Shopping Center — 2 . . . . . . . . . . . . . . . . 6.73% (31) 168,986 13,359 05/31/12Arundel Marketplace . . . . . . . . . . . . . . . . . . . . . . 5.92% 11,394 884 01/01/14Arundel Mills . . . . . . . . . . . . . . . . . . . . . . . . . . . 6.14% 385,000 23,639 (2) 08/01/14Atrium at Chestnut Hill . . . . . . . . . . . . . . . . . . . . 6.89% 43,821 3,880 03/11/11 (25)Auburn Mall . . . . . . . . . . . . . . . . . . . . . . . . . . . 7.99% 42,221 4,222 09/10/10Aventura Mall . . . . . . . . . . . . . . . . . . . . . . . . . . 5.91% 430,000 25,392 (2) 12/11/17Avenues, The . . . . . . . . . . . . . . . . . . . . . . . . . . . 5.29% 71,286 5,325 04/01/13Bay 1 (Torcy) — Fixed . . . . . . . . . . . . . . . . . . . . . 4.15% (31) 17,860 740 (2) 05/31/11Bay 1 (Torcy) — Variable . . . . . . . . . . . . . . . . . . . 1.40% (31) 2,303 32 (2) 05/31/11Bay 2 (Torcy) — Fixed . . . . . . . . . . . . . . . . . . . . . 4.24% (31) 66,031 2,797 (2) 06/30/11Bay 2 (Torcy) — Variable . . . . . . . . . . . . . . . . . . . 1.40% (31) 9,195 129 (2) 06/30/11Block at Orange . . . . . . . . . . . . . . . . . . . . . . . . . 6.25% 220,000 13,753 (2) 10/01/14Briarwood Mall . . . . . . . . . . . . . . . . . . . . . . . . . . 7.50% 119,726 10,641 11/30/16Cape Cod Mall . . . . . . . . . . . . . . . . . . . . . . . . . . 6.80% 88,969 7,821 03/11/11Circle Centre Mall . . . . . . . . . . . . . . . . . . . . . . . . 5.02% 71,378 5,165 04/11/13Clay Terrace . . . . . . . . . . . . . . . . . . . . . . . . . . . . 5.08% 115,000 5,842 (2) 10/01/15Cobblestone Court . . . . . . . . . . . . . . . . . . . . . . . 1.23% (1) 2,628 77 04/16/10Coconut Point . . . . . . . . . . . . . . . . . . . . . . . . . . 5.83% 230,000 13,409 (2) 12/10/16Coddingtown Mall . . . . . . . . . . . . . . . . . . . . . . . . 1.38% (1) 15,500 214 (2) 07/14/10Colorado Mills . . . . . . . . . . . . . . . . . . . . . . . . . . 2.01% (18) 164,308 3,304 (2) 11/12/11Concord Marketplace . . . . . . . . . . . . . . . . . . . . . . 5.76% 13,268 1,013 02/01/14Concord Mills Mall . . . . . . . . . . . . . . . . . . . . . . . 6.13% 163,990 13,208 12/07/12Crystal Mall . . . . . . . . . . . . . . . . . . . . . . . . . . . . 5.62% 94,591 7,319 09/11/12 (25)Dadeland Mall . . . . . . . . . . . . . . . . . . . . . . . . . . 6.75% 180,609 15,566 02/11/12 (25)Del Amo . . . . . . . . . . . . . . . . . . . . . . . . . . . . . . 1.73% (1) 335,000 5,799 (2) 01/23/13 (3)Denver West Village . . . . . . . . . . . . . . . . . . . . . . 8.15% 21,826 2,153 10/01/11Discover Mills — 1 . . . . . . . . . . . . . . . . . . . . . . . 7.32% 23,700 1,735 (2) 12/11/11Discover Mills — 2 . . . . . . . . . . . . . . . . . . . . . . . 6.08% 135,000 8,212 (2) 12/11/11Domain Residential Phase II . . . . . . . . . . . . . . . . . 2.23% (1) 31,561 704 (2) 07/22/13 (3)Domain Residential Building P . . . . . . . . . . . . . . . 2.23% (1) 3,631 81 (2) 11/07/11 (3)Domain Westin . . . . . . . . . . . . . . . . . . . . . . . . . . 2.18% (1) 22,172 484 (2) 10/15/13 (3)Dover Mall & Commons . . . . . . . . . . . . . . . . . . . 2.18% (29) 83,756 (35) 1,827 (2) 02/01/12 (3)Eastland Mall . . . . . . . . . . . . . . . . . . . . . . . . . . . 5.79% 168,000 9,734 (2) 06/01/16Emerald Square Mall . . . . . . . . . . . . . . . . . . . . . . 5.13% 129,453 9,479 03/01/13Empire Mall . . . . . . . . . . . . . . . . . . . . . . . . . . . . 5.79% 176,300 10,215 (2) 06/01/16Esplanade, The . . . . . . . . . . . . . . . . . . . . . . . . . . 2.18% (29) 75,136 (35) 1,639 (2) 02/01/12 (3)Falls, The . . . . . . . . . . . . . . . . . . . . . . . . . . . . . 7.50% 115,735 10,287 11/30/16Fashion Centre Pentagon Retail . . . . . . . . . . . . . . . 6.63% 149,341 12,838 09/11/11 (25)Fashion Centre Pentagon Office . . . . . . . . . . . . . . . 5.50% (30) 40,000 2,200 (2) 10/01/12 (3)Fashion Valley Mall . . . . . . . . . . . . . . . . . . . . . . . 4.00% (28) 350,000 14,000 (2) 10/09/13Firewheel Residential . . . . . . . . . . . . . . . . . . . . . . 5.91% 22,949 1,356 (2) 11/20/16 (3)Florida Mall, The . . . . . . . . . . . . . . . . . . . . . . . . 7.55% 243,081 22,766 12/10/10Franklin Mills . . . . . . . . . . . . . . . . . . . . . . . . . . . 5.65% 290,000 16,385 (2) 06/01/17Gaitway Plaza . . . . . . . . . . . . . . . . . . . . . . . . . . . 4.60% 13,900 (17) 640 (2) 07/01/15Galleria at White Plains . . . . . . . . . . . . . . . . . . . . 2.18% (29) 125,566 (35) 2,739 (2) 02/01/12 (3)Galleria Commerciali Italia — Facility A . . . . . . . . . 5.37% (16) 333,880 23,699 12/22/11 (3)Galleria Commerciali Italia — Facility B . . . . . . . . . 5.85% (16) 330,770 24,832 12/22/11Galleria Commerciali Italia — Catania . . . . . . . . . . 1.43% (16) 89,737 1,284 (2) 12/17/10Galleria Commerciali Italia — Cinisello — Fixed . . . 5.38% (16) 107,064 7,382 03/31/15Galleria Commerciali Italia — Cinisello — Variable . . 1.45% (16) 74,535 1,823 03/31/15Galleria Commerciali Italia — Giugliano A . . . . . . . 4.77% (16) 38,699 1,847 (2) 10/20/13Galleria Commerciali Italia — Giugliano B . . . . . . . 4.78% (16) 36,314 2,692 10/20/13Galleria Commerciali Italia — Giugliano C . . . . . . . 5.19% (16) 15,308 1,568 10/20/13Granite Run Mall . . . . . . . . . . . . . . . . . . . . . . . . 5.83% 116,577 8,622 06/01/16
42
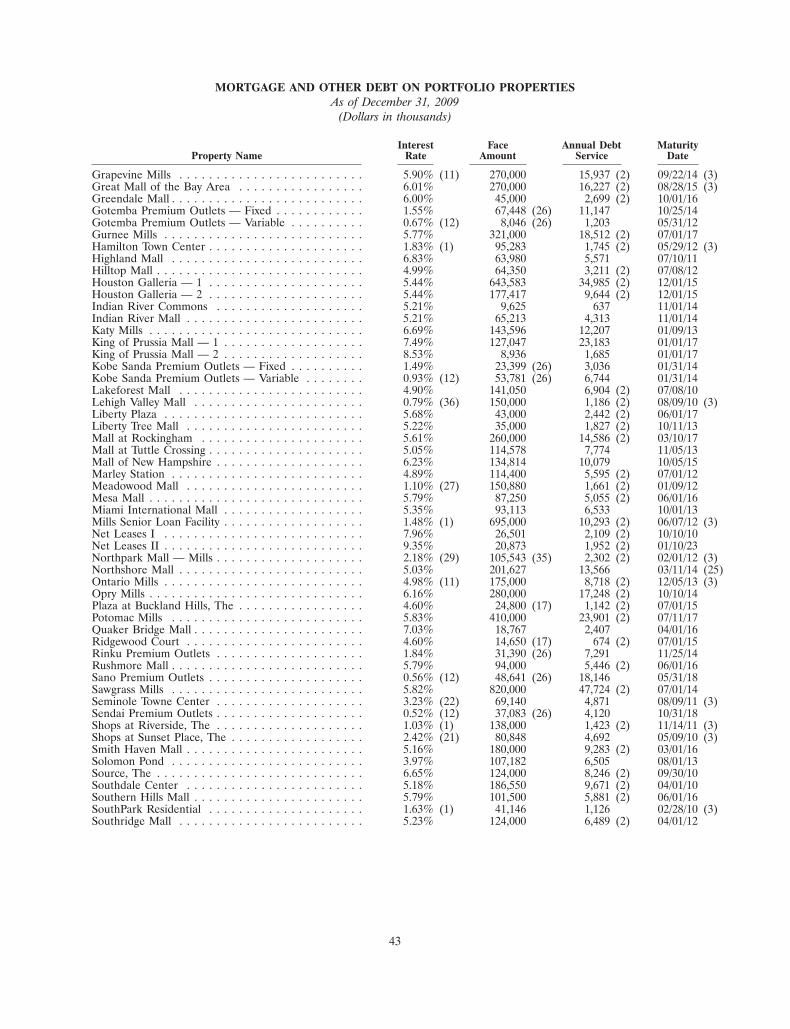
MORTGAGE AND OTHER DEBT ON PORTFOLIO PROPERTIESAs of December 31, 2009
(Dollars in thousands)
Interest Face Annual Debt MaturityProperty Name Rate Amount Service Date
Grapevine Mills . . . . . . . . . . . . . . . . . . . . . . . . . 5.90% (11) 270,000 15,937 (2) 09/22/14 (3)Great Mall of the Bay Area . . . . . . . . . . . . . . . . . 6.01% 270,000 16,227 (2) 08/28/15 (3)Greendale Mall . . . . . . . . . . . . . . . . . . . . . . . . . . 6.00% 45,000 2,699 (2) 10/01/16Gotemba Premium Outlets — Fixed . . . . . . . . . . . . 1.55% 67,448 (26) 11,147 10/25/14Gotemba Premium Outlets — Variable . . . . . . . . . . 0.67% (12) 8,046 (26) 1,203 05/31/12Gurnee Mills . . . . . . . . . . . . . . . . . . . . . . . . . . . 5.77% 321,000 18,512 (2) 07/01/17Hamilton Town Center . . . . . . . . . . . . . . . . . . . . . 1.83% (1) 95,283 1,745 (2) 05/29/12 (3)Highland Mall . . . . . . . . . . . . . . . . . . . . . . . . . . 6.83% 63,980 5,571 07/10/11Hilltop Mall . . . . . . . . . . . . . . . . . . . . . . . . . . . . 4.99% 64,350 3,211 (2) 07/08/12Houston Galleria — 1 . . . . . . . . . . . . . . . . . . . . . 5.44% 643,583 34,985 (2) 12/01/15Houston Galleria — 2 . . . . . . . . . . . . . . . . . . . . . 5.44% 177,417 9,644 (2) 12/01/15Indian River Commons . . . . . . . . . . . . . . . . . . . . 5.21% 9,625 637 11/01/14Indian River Mall . . . . . . . . . . . . . . . . . . . . . . . . 5.21% 65,213 4,313 11/01/14Katy Mills . . . . . . . . . . . . . . . . . . . . . . . . . . . . . 6.69% 143,596 12,207 01/09/13King of Prussia Mall — 1 . . . . . . . . . . . . . . . . . . . 7.49% 127,047 23,183 01/01/17King of Prussia Mall — 2 . . . . . . . . . . . . . . . . . . . 8.53% 8,936 1,685 01/01/17Kobe Sanda Premium Outlets — Fixed . . . . . . . . . . 1.49% 23,399 (26) 3,036 01/31/14Kobe Sanda Premium Outlets — Variable . . . . . . . . 0.93% (12) 53,781 (26) 6,744 01/31/14Lakeforest Mall . . . . . . . . . . . . . . . . . . . . . . . . . 4.90% 141,050 6,904 (2) 07/08/10Lehigh Valley Mall . . . . . . . . . . . . . . . . . . . . . . . 0.79% (36) 150,000 1,186 (2) 08/09/10 (3)Liberty Plaza . . . . . . . . . . . . . . . . . . . . . . . . . . . 5.68% 43,000 2,442 (2) 06/01/17Liberty Tree Mall . . . . . . . . . . . . . . . . . . . . . . . . 5.22% 35,000 1,827 (2) 10/11/13Mall at Rockingham . . . . . . . . . . . . . . . . . . . . . . 5.61% 260,000 14,586 (2) 03/10/17Mall at Tuttle Crossing . . . . . . . . . . . . . . . . . . . . . 5.05% 114,578 7,774 11/05/13Mall of New Hampshire . . . . . . . . . . . . . . . . . . . . 6.23% 134,814 10,079 10/05/15Marley Station . . . . . . . . . . . . . . . . . . . . . . . . . . 4.89% 114,400 5,595 (2) 07/01/12Meadowood Mall . . . . . . . . . . . . . . . . . . . . . . . . 1.10% (27) 150,880 1,661 (2) 01/09/12Mesa Mall . . . . . . . . . . . . . . . . . . . . . . . . . . . . . 5.79% 87,250 5,055 (2) 06/01/16Miami International Mall . . . . . . . . . . . . . . . . . . . 5.35% 93,113 6,533 10/01/13Mills Senior Loan Facility . . . . . . . . . . . . . . . . . . . 1.48% (1) 695,000 10,293 (2) 06/07/12 (3)Net Leases I . . . . . . . . . . . . . . . . . . . . . . . . . . . 7.96% 26,501 2,109 (2) 10/10/10Net Leases II . . . . . . . . . . . . . . . . . . . . . . . . . . . 9.35% 20,873 1,952 (2) 01/10/23Northpark Mall — Mills . . . . . . . . . . . . . . . . . . . . 2.18% (29) 105,543 (35) 2,302 (2) 02/01/12 (3)Northshore Mall . . . . . . . . . . . . . . . . . . . . . . . . . 5.03% 201,627 13,566 03/11/14 (25)Ontario Mills . . . . . . . . . . . . . . . . . . . . . . . . . . . 4.98% (11) 175,000 8,718 (2) 12/05/13 (3)Opry Mills . . . . . . . . . . . . . . . . . . . . . . . . . . . . . 6.16% 280,000 17,248 (2) 10/10/14Plaza at Buckland Hills, The . . . . . . . . . . . . . . . . . 4.60% 24,800 (17) 1,142 (2) 07/01/15Potomac Mills . . . . . . . . . . . . . . . . . . . . . . . . . . 5.83% 410,000 23,901 (2) 07/11/17Quaker Bridge Mall . . . . . . . . . . . . . . . . . . . . . . . 7.03% 18,767 2,407 04/01/16Ridgewood Court . . . . . . . . . . . . . . . . . . . . . . . . 4.60% 14,650 (17) 674 (2) 07/01/15Rinku Premium Outlets . . . . . . . . . . . . . . . . . . . . 1.84% 31,390 (26) 7,291 11/25/14Rushmore Mall . . . . . . . . . . . . . . . . . . . . . . . . . . 5.79% 94,000 5,446 (2) 06/01/16Sano Premium Outlets . . . . . . . . . . . . . . . . . . . . . 0.56% (12) 48,641 (26) 18,146 05/31/18Sawgrass Mills . . . . . . . . . . . . . . . . . . . . . . . . . . 5.82% 820,000 47,724 (2) 07/01/14Seminole Towne Center . . . . . . . . . . . . . . . . . . . . 3.23% (22) 69,140 4,871 08/09/11 (3)Sendai Premium Outlets . . . . . . . . . . . . . . . . . . . . 0.52% (12) 37,083 (26) 4,120 10/31/18Shops at Riverside, The . . . . . . . . . . . . . . . . . . . . 1.03% (1) 138,000 1,423 (2) 11/14/11 (3)Shops at Sunset Place, The . . . . . . . . . . . . . . . . . . 2.42% (21) 80,848 4,692 05/09/10 (3)Smith Haven Mall . . . . . . . . . . . . . . . . . . . . . . . . 5.16% 180,000 9,283 (2) 03/01/16Solomon Pond . . . . . . . . . . . . . . . . . . . . . . . . . . 3.97% 107,182 6,505 08/01/13Source, The . . . . . . . . . . . . . . . . . . . . . . . . . . . . 6.65% 124,000 8,246 (2) 09/30/10Southdale Center . . . . . . . . . . . . . . . . . . . . . . . . 5.18% 186,550 9,671 (2) 04/01/10Southern Hills Mall . . . . . . . . . . . . . . . . . . . . . . . 5.79% 101,500 5,881 (2) 06/01/16SouthPark Residential . . . . . . . . . . . . . . . . . . . . . 1.63% (1) 41,146 1,126 02/28/10 (3)Southridge Mall . . . . . . . . . . . . . . . . . . . . . . . . . 5.23% 124,000 6,489 (2) 04/01/12
43
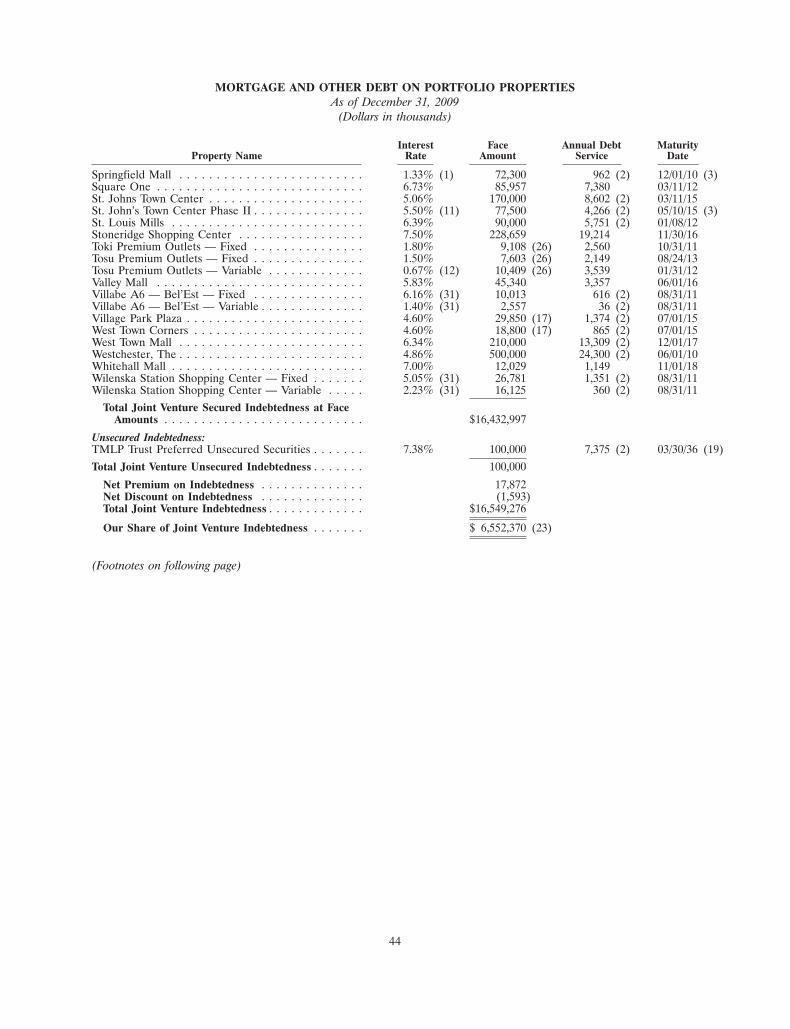
MORTGAGE AND OTHER DEBT ON PORTFOLIO PROPERTIESAs of December 31, 2009
(Dollars in thousands)
Interest Face Annual Debt MaturityProperty Name Rate Amount Service Date
Springfield Mall . . . . . . . . . . . . . . . . . . . . . . . . . 1.33% (1) 72,300 962 (2) 12/01/10 (3)Square One . . . . . . . . . . . . . . . . . . . . . . . . . . . . 6.73% 85,957 7,380 03/11/12St. Johns Town Center . . . . . . . . . . . . . . . . . . . . . 5.06% 170,000 8,602 (2) 03/11/15St. John’s Town Center Phase II . . . . . . . . . . . . . . . 5.50% (11) 77,500 4,266 (2) 05/10/15 (3)St. Louis Mills . . . . . . . . . . . . . . . . . . . . . . . . . . 6.39% 90,000 5,751 (2) 01/08/12Stoneridge Shopping Center . . . . . . . . . . . . . . . . . 7.50% 228,659 19,214 11/30/16Toki Premium Outlets — Fixed . . . . . . . . . . . . . . . 1.80% 9,108 (26) 2,560 10/31/11Tosu Premium Outlets — Fixed . . . . . . . . . . . . . . . 1.50% 7,603 (26) 2,149 08/24/13Tosu Premium Outlets — Variable . . . . . . . . . . . . . 0.67% (12) 10,409 (26) 3,539 01/31/12Valley Mall . . . . . . . . . . . . . . . . . . . . . . . . . . . . 5.83% 45,340 3,357 06/01/16Villabe A6 — Bel’Est — Fixed . . . . . . . . . . . . . . . 6.16% (31) 10,013 616 (2) 08/31/11Villabe A6 — Bel’Est — Variable . . . . . . . . . . . . . . 1.40% (31) 2,557 36 (2) 08/31/11Village Park Plaza . . . . . . . . . . . . . . . . . . . . . . . . 4.60% 29,850 (17) 1,374 (2) 07/01/15West Town Corners . . . . . . . . . . . . . . . . . . . . . . . 4.60% 18,800 (17) 865 (2) 07/01/15West Town Mall . . . . . . . . . . . . . . . . . . . . . . . . . 6.34% 210,000 13,309 (2) 12/01/17Westchester, The . . . . . . . . . . . . . . . . . . . . . . . . . 4.86% 500,000 24,300 (2) 06/01/10Whitehall Mall . . . . . . . . . . . . . . . . . . . . . . . . . . 7.00% 12,029 1,149 11/01/18Wilenska Station Shopping Center — Fixed . . . . . . . 5.05% (31) 26,781 1,351 (2) 08/31/11Wilenska Station Shopping Center — Variable . . . . . 2.23% (31) 16,125 360 (2) 08/31/11
Total Joint Venture Secured Indebtedness at FaceAmounts . . . . . . . . . . . . . . . . . . . . . . . . . . . $16,432,997
Unsecured Indebtedness:TMLP Trust Preferred Unsecured Securities . . . . . . . 7.38% 100,000 7,375 (2) 03/30/36 (19)
Total Joint Venture Unsecured Indebtedness . . . . . . . 100,000
Net Premium on Indebtedness . . . . . . . . . . . . . . 17,872Net Discount on Indebtedness . . . . . . . . . . . . . . (1,593)Total Joint Venture Indebtedness . . . . . . . . . . . . . $16,549,276
Our Share of Joint Venture Indebtedness . . . . . . . $ 6,552,370 (23)
(Footnotes on following page)
44
(Footnotes for preceding pages)
(1) Variable rate loans based on LIBOR plus interest rate spreads ranging from 56 bps to 450 bps. LIBOR as ofDecember 31, 2009 was 0.23%.
(2) Requires monthly payment of interest only.
(3) Includes applicable extension available at the Operating Partnership’s option.
(4) Loans secured by these three Properties are cross-collateralized and cross-defaulted.
(5) We have executed a swap agreement that fixes the interest rate on $200 million of this loan at 4.35%.
(6) Loans secured by these Properties are cross-collateralized and cross-defaulted. Factory Stores of America includes Boaz,Georgetown, Graceville, Lebanon, Nebraska City and Story City.
(7) Loans secured by these three Properties are cross-collateralized and cross-defaulted.
(8) Loan is secured by The Domain Shopping Center, Palms Crossing, and Shops at Arbor Walk and is cross-collateralizedand cross-defaulted.
(9) Loans secured by these three Properties are cross-collateralized.
(10) Loans secured by these four Properties are cross-collateralized.
(11) Associated with these loans are interest rate swap agreements that effectively fix the interest rate of the loans at the all-inrate presented.
(12) Variable rate loans based on Yen LIBOR plus interest rate spreads ranging from 35 bps to 187.5 bps. Yen LIBOR as ofDecember 31, 2009 was 0.1650%.
(13) Lender also participates in a percentage of certain gross receipts above a specified base. This threshold was met andadditional interest was paid in 2009.
(14) Requires semi-annual payments of interest only.
(15) On December 8, 2009, we entered into a new unsecured revolving corporate credit facility providing an initial borrowingcapacity of $3.565 billion. The new facility contains an accordian feature up to $4.0 billion and will mature on March 31,2013. The base interest on the credit facility is LIBOR plus 210 basis points. The balance as of December 31, 2009reflects interest at LIBOR plus 37.5 basis points as the borrowings on the new facility were not drawn until January 5,2010. As of December 31, 2009, $3.1 billion was available after outstanding borrowings and letter of credits.
(16) Amounts shown in USD equivalent. Euro equivalent is 716.0 million. Associated with these loans are interest rate swapagreements with a total combined Euro 601.4 million notional amount that effectively fixes Facility A and B, Giugliano,and a portion of Cinisello at 5.50%.
(17) Loans secured by these five Properties are cross-collateralized and cross-defaulted.
(18) LIBOR + 1.780%, with LIBOR capped at 4.000%.
(19) Redeemable beginning 3/30/11, pricing re-sets every 5 years based on an index of LIBOR + 2.375%.
(20) Loans secured by these four Properties are cross-collateralized and cross-defaulted.
(21) Interest rate spread uses weighted average spread payable on the loan. As of 12/31/09, the spread was 2.189%, withLIBOR capped at 7.50%.
(22) LIBOR + 3.000%, with LIBOR capped at 8.500%.
(23) Our share of indebtedness for joint ventures excludes our share of indebtedness of $145.9 million in joint venture entitiesin which Gallerie Commerciali Italia holds a non-controlling interest.
(24) Through an interest rate floor agreement, the LIBOR rate is currently fixed at 1.50%.
(25) The maturity date shown represents the Anticipated Maturity Date of the loan which is typically 10-20 years earlier thanthe stated Maturity Date of the loan. Should the loan not be repaid at the Anticipated Repayment Date the applicableinterest rate shall increase as specified in the loan agreement.
(26) Amounts shown in US Dollar Equivalent. Yen equivalent 39,382.5 million
(27) LIBOR + 0.870%, with LIBOR capped at 4.000%.
(28) Through an interest rate floor agreement, the LIBOR rate is currently fixed at 1.00%.
(29) LIBOR + 1.950%, with LIBOR capped at 6.00%.
(30) LIBOR + 4.500%, with LIBOR capped at 8.250%. Through an interest rate floor agreement, the LIBOR rate iscurrently fixed at 1.50%.
45

(31) Amounts shown in USD equivalent. Euro equivalent is 325.5 million. Associated with these loans are interest rate swapagreements with a total combined Euro 304.4 million notional amount that effectively fixed these loans at a combined5.44%.
(32) Loan was paid off after 12/31/09.
(33) Amounts shown in US Dollar Equivalent. Balances include borrowings on multi-currency tranche of Yen22,125.0 million.
(34) Amounts shown in US Dollar Equivalent. Balances include borrowings on multi-currency tranche of Euro 144.5 million.
(35) Loans secured by these four Properties are cross-collateralized and cross-defaulted.
(36) LIBOR + 0.560%, with LIBOR capped at 7.00%.
(37) Loans secured by these three Properties are cross-collateralized.
The changes in consolidated mortgages and other indebtedness for the years ended December 31, 2009, 2008, 2007 are asfollows:
2009 2008 2007
Balance, Beginning of Year . . . . . . . . . . . . . . . . . . . . . . . . $18,042,532 $17,218,674 $15,394,489Additions during period:
New Loan Originations . . . . . . . . . . . . . . . . . . . . . . . . 2,073,874 1,833,677 3,362,732Loans assumed in acquisitions and consolidations . . . . . . . — — 399,545Net Premium . . . . . . . . . . . . . . . . . . . . . . . . . . . . . . 3,162 (7,192) (1,669)
Deductions during period:Loan Retirements . . . . . . . . . . . . . . . . . . . . . . . . . . . (1,427,858) (930,818) (1,862,145)Amortization of Net Premiums . . . . . . . . . . . . . . . . . . . (10,627) (14,611) (13,661)Scheduled Principal Amortization . . . . . . . . . . . . . . . . . (50,781) (57,198) (60,617)
Balance, End of Year . . . . . . . . . . . . . . . . . . . . . . . . . . . . $18,630,302 $18,042,532 $17,218,674
Item 3. Legal Proceedings
We are involved in various legal proceedings that arise in the ordinary course of our business. We believe thatsuch litigation, claims and administrative proceedings will not have a material adverse impact on our financial positionor our results of operations. We record a liability when a loss is considered probable and the amount can be reasonablyestimated.
Item 4. Reserved
46

Part II
Item 5. Market for the Registrant’s Common Equity, Related Stockholder Matters, and Issuer Purchases ofEquity Securities
Market Information
There is no established trading market for our units or preferred units. The following table sets forth for theperiods indicated, the distributions declared on our units:
DeclaredDistributions
20081st Quarter $0.902nd Quarter 0.903rd Quarter 0.904th Quarter 0.90
20091st Quarter $0.902nd Quarter 0.603rd Quarter 0.604th Quarter 0.60
Holders
The number of holders of record of units was 254 as of February 25, 2010.
Distributions
We make distributions to our limited and general partners in order to maintain Simon Property’s qualificationas a REIT. Simon Property is required each year to distribute to its stockholders at least 90% of its taxable incomeafter certain adjustments. Future distributions will be determined at the discretion of Simon Property’s Board ofDirectors based on actual results of operations, cash available for distribution, and what may be required to maintainSimon Property’s status as a REIT.
On February 2, 2010, Simon Property’s Board of Directors approved a quarterly common stock dividend of$0.60 per share, payable all in cash. The distribution rate on our units is equal to the dividend rate on Simon Property’scommon stock. Distributions during 2009 aggregated $2.70 per unit and were paid in a combination of cash and units.Distributions during 2008, which aggregated to $3.60 per unit, were paid entirely in cash.
Unregistered Sales of Equity Securities
We did not issue any equity securities that were not required to be registered under the Securities Act of 1933,as amended, during the fourth quarter of 2009.
Temporary Equity
During 2009, holders of Series I preferred units were not eligible to convert their preferred units into units asthe triggering price of $75.34 was not met. As of December 31, 2009, the conversion trigger price of $74.18 had beenmet and each Series I preferred unit became convertible into 0.847495 of a unit through March 31, 2010.
47
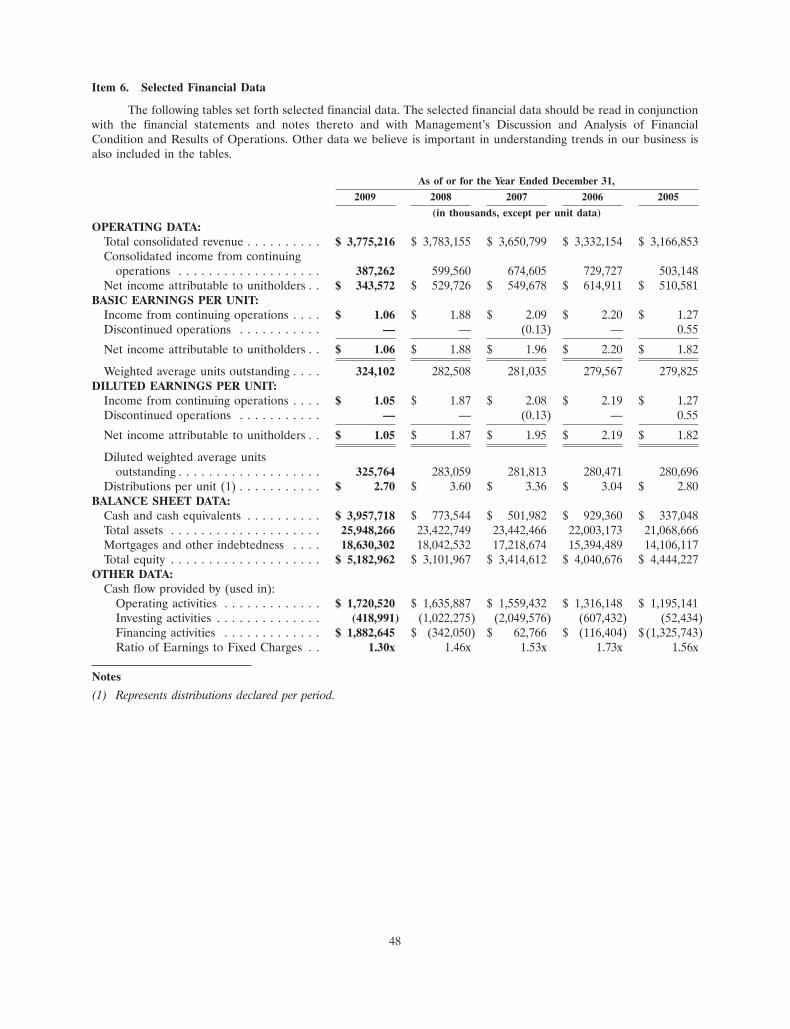
Item 6. Selected Financial Data
The following tables set forth selected financial data. The selected financial data should be read in conjunctionwith the financial statements and notes thereto and with Management’s Discussion and Analysis of FinancialCondition and Results of Operations. Other data we believe is important in understanding trends in our business isalso included in the tables.
As of or for the Year Ended December 31,
2009 2008 2007 2006 2005
(in thousands, except per unit data)OPERATING DATA:
Total consolidated revenue . . . . . . . . . . $ 3,775,216 $ 3,783,155 $ 3,650,799 $ 3,332,154 $ 3,166,853Consolidated income from continuing
operations . . . . . . . . . . . . . . . . . . . 387,262 599,560 674,605 729,727 503,148Net income attributable to unitholders . . $ 343,572 $ 529,726 $ 549,678 $ 614,911 $ 510,581
BASIC EARNINGS PER UNIT:Income from continuing operations . . . . $ 1.06 $ 1.88 $ 2.09 $ 2.20 $ 1.27Discontinued operations . . . . . . . . . . . — — (0.13) — 0.55
Net income attributable to unitholders . . $ 1.06 $ 1.88 $ 1.96 $ 2.20 $ 1.82
Weighted average units outstanding . . . . 324,102 282,508 281,035 279,567 279,825DILUTED EARNINGS PER UNIT:
Income from continuing operations . . . . $ 1.05 $ 1.87 $ 2.08 $ 2.19 $ 1.27Discontinued operations . . . . . . . . . . . — — (0.13) — 0.55
Net income attributable to unitholders . . $ 1.05 $ 1.87 $ 1.95 $ 2.19 $ 1.82
Diluted weighted average unitsoutstanding . . . . . . . . . . . . . . . . . . . 325,764 283,059 281,813 280,471 280,696
Distributions per unit (1) . . . . . . . . . . . $ 2.70 $ 3.60 $ 3.36 $ 3.04 $ 2.80BALANCE SHEET DATA:
Cash and cash equivalents . . . . . . . . . . $ 3,957,718 $ 773,544 $ 501,982 $ 929,360 $ 337,048Total assets . . . . . . . . . . . . . . . . . . . . 25,948,266 23,422,749 23,442,466 22,003,173 21,068,666Mortgages and other indebtedness . . . . 18,630,302 18,042,532 17,218,674 15,394,489 14,106,117Total equity . . . . . . . . . . . . . . . . . . . . $ 5,182,962 $ 3,101,967 $ 3,414,612 $ 4,040,676 $ 4,444,227
OTHER DATA:Cash flow provided by (used in):
Operating activities . . . . . . . . . . . . . $ 1,720,520 $ 1,635,887 $ 1,559,432 $ 1,316,148 $ 1,195,141Investing activities . . . . . . . . . . . . . . (418,991) (1,022,275) (2,049,576) (607,432) (52,434)Financing activities . . . . . . . . . . . . . $ 1,882,645 $ (342,050) $ 62,766 $ (116,404) $(1,325,743)Ratio of Earnings to Fixed Charges . . 1.30x 1.46x 1.53x 1.73x 1.56x
Notes
(1) Represents distributions declared per period.
48
Item 7. Management’s Discussion and Analysis of Financial Condition and Results of Operations
You should read the following discussion in conjunction with the consolidated financial statements and notesthereto that are included in this report.
Overview
Simon Property Group, L.P., is a Delaware limited partnership and the majority-owned subsidiary of SimonProperty Group, Inc. In this discussion, the terms ‘‘Operating Partnership’’, ‘‘we’’, ‘‘us’’ and ‘‘our’’ refer to SimonProperty Group, L.P. and its subsidiaries and the term ‘‘Simon Property’’ refers specifically to Simon PropertyGroup, Inc.
We own, develop and manage retail real estate properties, which consist primarily of regional malls, PremiumOutlet� centers, The Mills�, and community/lifestyle centers. As of December 31, 2009, we owned or held an interestin 321 income-producing properties in the United States, which consisted of 162 regional malls, 41 Premium Outletcenters, 67 community/lifestyle centers, 36 properties acquired in the 2007 acquisition of The Mills Corporation, or theMills acquisition, and 15 other shopping centers or outlet centers in 41 states and Puerto Rico. Of the 36 propertiesacquired in the Mills portfolio, 16 of these properties are The Mills, 16 are regional malls, and four are communitycenters. Internationally, as of December 31, 2009, we had ownership interests in 51 European shopping centers(France, Italy and Poland), eight Premium Outlet centers in Japan, one Premium Outlet center in Mexico, and onePremium Outlet center in South Korea. Also, through joint venture arrangements we have a 24% interest in twoshopping centers in Italy currently under development. During 2009, we recognized a loss on the sale of four of ourU.S. properties and all of our shopping centers in operation or under development in China. We also agreed topurchase a portfolio of 22 outlet shopping centers. The purchase is expected to close in the first half of 2010. In early2010, we and our joint venture partner agreed to sell our interests in seven shopping centers in France and Poland.
We generate the majority of our revenues from leases with retail tenants including:
• Base minimum rents,
• Overage and percentage rents based on tenants’ sales volume, and
• Recoveries of substantially all of our recoverable expenditures, which consist of property operating, realestate taxes, repair and maintenance, and advertising and promotional expenditures.
Revenues of our management company, after intercompany eliminations, consist primarily of management feesthat are typically based upon the revenues of the property being managed.
We seek growth in earnings, funds from operations, or FFO, and cash flows by enhancing the profitability andoperation of our properties and investments. We seek to accomplish this growth through the following:
• Focusing on leasing to increase revenues and utilizing economies of scale to reduce operating expenses,
• Expanding and re-tenanting existing franchise locations at competitive market rates,
• Adding mixed-use elements to properties,
• Selectively acquiring high quality real estate assets or portfolios of assets, and
• Selling non-core assets.
We also grow by generating supplemental revenue from the following activities:
• Establishing our malls as leading market resource providers for retailers and other businesses and consumer-focused corporate alliances, including: payment systems (such as handling fees relating to the sales ofbank-issued prepaid cards), national marketing alliances, static and digital media initiatives, businessdevelopment, sponsorship, and events,
• Offering property operating services to our tenants and others, including waste handling and facility services,and the sale of energy,
• Selling or leasing land adjacent to our shopping center properties, commonly referred to as ‘‘outlots’’ or‘‘outparcels,’’ and
49
• Generating interest income on cash deposits and loans made to related entities.
We focus on high quality real estate across the retail real estate spectrum. We expand or renovate to enhanceexisting assets’ profitability and market share when we believe the investment of our capital meets our risk-rewardcriteria. We selectively develop new properties in metropolitan areas that exhibit strong population and economicgrowth.
We routinely review and evaluate acquisition opportunities based on their ability to complement our portfolio.Our international strategy includes partnering with established real estate companies and financing internationalinvestments with local currency to minimize foreign exchange risk.
To support our growth, we employ a three-fold capital strategy:
• Provide the capital necessary to fund growth,
• Maintain sufficient flexibility to access capital in many forms, both public and private, and
• Manage our overall financial structure in a fashion that preserves our investment grade credit ratings.
Results Overview
Diluted earnings per unit of limited partnership interest, or units, decreased $0.82 during 2009, or 43.9%, to$1.05 from $1.87 for 2008. The decrease is primarily due to losses on asset sales and impairment charges. Theseincluded a $140.5 million, or $0.44 per unit, other-than-temporary impairment charge related to our investment inLiberty International, PLC, or Liberty, a U.K. REIT. We recorded the other-than-temporary charge in the secondquarter of 2009 due to the significance and duration of the decline in quoted fair value, including the related currencyexchange component, below the carrying value of the securities. In the fourth quarter of 2009, we also recordedadjustments in the carrying values of three underperforming assets, including one consolidated operating property andtwo joint venture assets, the write-off of certain predevelopment costs related to projects that we no longer plan topursue due to economic conditions, and adjustments to carrying values for certain parcels of land, amounting to$88.1 million, or $0.27 per unit, net of related tax benefit and noncontrolling interest share. We also recorded netlosses related to the sale of assets and interests in unconsolidated entities of $30.1 million, or $0.09 per unit. For 2009,earnings per unit were diluted by approximately $0.21 per unit as a result of Simon Property’s two equity offerings andfrom the units we issued in the quarterly distributions. For 2008, we recorded a $20.3 million, or $0.07 per diluted unit,loss on extinguishment of debt related to our redemption of the 7% MandatOry Par Put Remarked Securities, orMOPPRS. In addition, we recorded impairment charges of $21.2 million, or $0.07 per diluted unit, during 2008.
In the United States, our business fundamentals were relatively stable, except for tenant sales psf which weredown across the portfolio, and were dependent upon asset type, geographic location, and mix of specialty and luxurytenants. Average base rents for the regional mall and domestic Premium Outlet portfolios were relatively stable for2009. The regional malls average base rent ended the year at $40.04 psf, or an increase of 1.4% over 2008. Thedomestic Premium Outlets average base rent ended the year at $33.45 psf, or an increase of 21.0%. The stability of theoccupancy, rent psf, and releasing rental spread fundamentals contributed to the growth in our operating resultsdespite the adverse economic conditions affecting our tenants and retail consumers.
Internationally, in 2009, we and our joint venture partners opened one additional center and expanded oneexisting Premium Outlet Center in Japan which added an aggregate 396,300 square feet of retail space to theinternational portfolio. Also in December 2009, we recognized a loss on our joint venture interests in our shoppingcenters in China. We sold our interests to affiliates of our Chinese partner for approximately $29 million, resulting in aloss of approximately $20 million.
On February 4, 2010, we and our partner in Simon Ivanhoe S.a.r.l , or Simon Ivanhoe, Ivanhoe Cambridge Inc. ,or Ivanhoe Cambridge, entered into a definitive agreement to sell all of the interests in Simon Ivanhoe which ownsseven shopping centers located in France and Poland to Unibail-Rodamco. The joint venture partners will receiveconsideration of A715 million for their interests, subject to certain post-closing adjustments. We expect our share of thegain on sale of our interests in Simon Ivanhoe to be approximately $300 million. The transaction is scheduled to closeduring the first half of 2010, subject to customary closing conditions and regulatory approvals.
We and Ivanhoe Cambridge have the right to participate with Unibail-Rodamco in the potential developmentof up to five new retail projects in the Simon Ivanhoe pipeline, subject to customary approval rights. We will own a25% interest in any of these projects in which we agree to participate.
50
Our effective overall borrowing rate at December 31, 2009 increased 50 basis points to 5.62% as compared to5.12% at December 31, 2008. This increase was primarily due to a $1.4 billion increase in our portfolio of relativelyhigher rate fixed rate debt. Our financing activities for the year ended December 31, 2009, included:
• decreasing borrowings on our $3.5 billion unsecured revolving credit facility, or the Credit Facility, toapproximately $446.1 million as of December 31, 2009. The ending balance on this facility was entirelycomprised of the U.S. dollar equivalent of Euro and Yen-denominated borrowings. On December 8, 2009, weentered into a new unsecured revolving corporate credit facility providing an initial borrowing capacity of$3.565 billion. The new credit facility contains an accordion feature allowing the maximum borrowingcapacity to expand to $4.0 billion. The new credit facility matures on March 31, 2013. Borrowings on the newcredit facility were not drawn until January 5, 2010 when the Euro and Yen-denominated borrowings on theCredit Facility were transitioned to the new credit facility.
• issuing $650.0 million in 10.35% senior unsecured notes due 2019. We used the proceeds of the offering toreduce borrowings on the Credit Facility.
• issuing $1.1 billion in 6.75% senior unsecured notes due 2014. We used the proceeds of the offering forgeneral corporate purposes.
• redeeming five series of maturing unsecured notes totaling $900.0 million which had fixed rates ranging from3.50% to 8.63%.
• borrowing $400.0 million on a loan which matures on August 1, 2016 and bears interest at a fixed rate of8.00%. This loan is secured by cross-collateralized, cross-defaulted mortgages on Greenwood Park Mall,South Park Mall, and Walt Whitman Mall.
On January 12, 2010, we commenced a cash tender offer for any and all senior unsecured notes of tenoutstanding series with maturity dates ranging from 2011 to March 2013. The total principal amount of the notesaccepted for purchase on January 26, 2010 was approximately $2.3 billion, with a weighted average duration of2.0 years and a weighted coupon of 5.76%. We purchased the tendered notes with cash on hand and the proceeds froman offering of $2.25 billion of senior unsecured notes that closed on January 25, 2010. The senior notes offering wascomprised of $400.0 million of 4.20% notes due 2015, $1.25 billion of 5.65% notes due 2020 and $600.0 million of6.75% notes due 2040. We will report a $165.6 million charge to earnings in the first quarter of 2010 as a result of thetender offer.
51
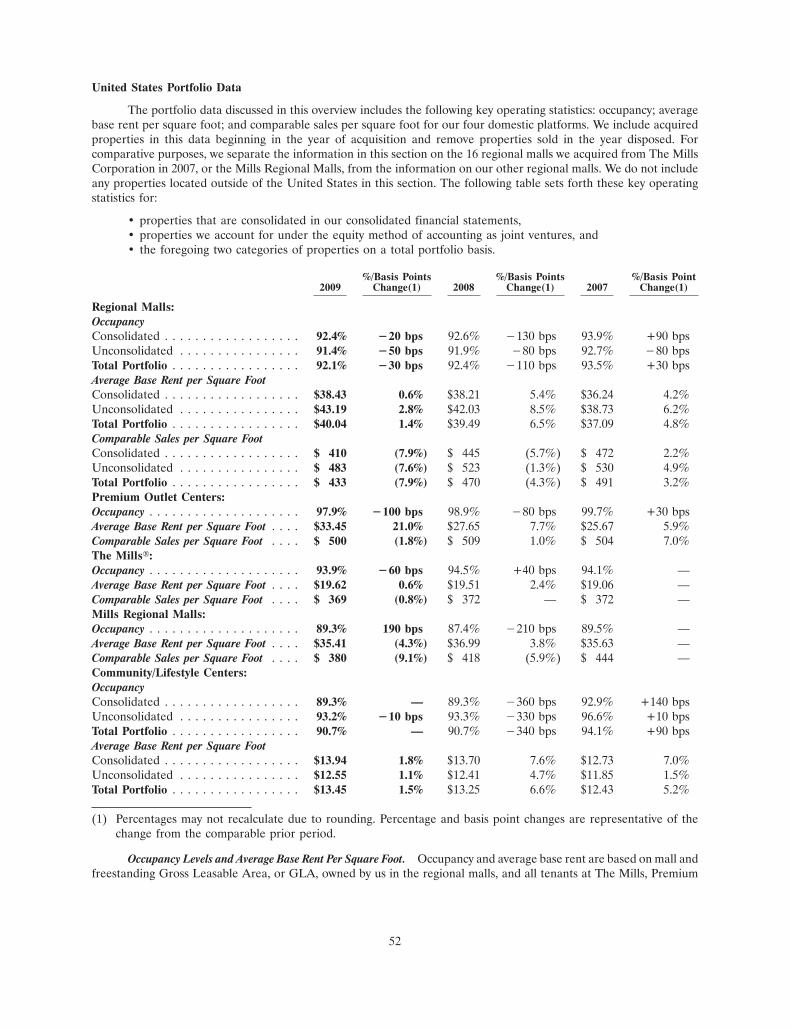
United States Portfolio Data
The portfolio data discussed in this overview includes the following key operating statistics: occupancy; averagebase rent per square foot; and comparable sales per square foot for our four domestic platforms. We include acquiredproperties in this data beginning in the year of acquisition and remove properties sold in the year disposed. Forcomparative purposes, we separate the information in this section on the 16 regional malls we acquired from The MillsCorporation in 2007, or the Mills Regional Malls, from the information on our other regional malls. We do not includeany properties located outside of the United States in this section. The following table sets forth these key operatingstatistics for:
• properties that are consolidated in our consolidated financial statements,• properties we account for under the equity method of accounting as joint ventures, and• the foregoing two categories of properties on a total portfolio basis.
%/Basis Points %/Basis Points %/Basis Point2009 Change(1) 2008 Change(1) 2007 Change(1)
Regional Malls:OccupancyConsolidated . . . . . . . . . . . . . . . . . . 92.4% �20 bps 92.6% �130 bps 93.9% +90 bpsUnconsolidated . . . . . . . . . . . . . . . . 91.4% �50 bps 91.9% �80 bps 92.7% �80 bpsTotal Portfolio . . . . . . . . . . . . . . . . . 92.1% �30 bps 92.4% �110 bps 93.5% +30 bpsAverage Base Rent per Square FootConsolidated . . . . . . . . . . . . . . . . . . $38.43 0.6% $38.21 5.4% $36.24 4.2%Unconsolidated . . . . . . . . . . . . . . . . $43.19 2.8% $42.03 8.5% $38.73 6.2%Total Portfolio . . . . . . . . . . . . . . . . . $40.04 1.4% $39.49 6.5% $37.09 4.8%Comparable Sales per Square FootConsolidated . . . . . . . . . . . . . . . . . . $ 410 (7.9%) $ 445 (5.7%) $ 472 2.2%Unconsolidated . . . . . . . . . . . . . . . . $ 483 (7.6%) $ 523 (1.3%) $ 530 4.9%Total Portfolio . . . . . . . . . . . . . . . . . $ 433 (7.9%) $ 470 (4.3%) $ 491 3.2%Premium Outlet Centers:Occupancy . . . . . . . . . . . . . . . . . . . . 97.9% �100 bps 98.9% �80 bps 99.7% +30 bpsAverage Base Rent per Square Foot . . . . $33.45 21.0% $27.65 7.7% $25.67 5.9%Comparable Sales per Square Foot . . . . $ 500 (1.8%) $ 509 1.0% $ 504 7.0%The Mills�:Occupancy . . . . . . . . . . . . . . . . . . . . 93.9% �60 bps 94.5% +40 bps 94.1% —Average Base Rent per Square Foot . . . . $19.62 0.6% $19.51 2.4% $19.06 —Comparable Sales per Square Foot . . . . $ 369 (0.8%) $ 372 — $ 372 —Mills Regional Malls:Occupancy . . . . . . . . . . . . . . . . . . . . 89.3% 190 bps 87.4% �210 bps 89.5% —Average Base Rent per Square Foot . . . . $35.41 (4.3%) $36.99 3.8% $35.63 —Comparable Sales per Square Foot . . . . $ 380 (9.1%) $ 418 (5.9%) $ 444 —Community/Lifestyle Centers:OccupancyConsolidated . . . . . . . . . . . . . . . . . . 89.3% — 89.3% �360 bps 92.9% +140 bpsUnconsolidated . . . . . . . . . . . . . . . . 93.2% �10 bps 93.3% �330 bps 96.6% +10 bpsTotal Portfolio . . . . . . . . . . . . . . . . . 90.7% — 90.7% �340 bps 94.1% +90 bpsAverage Base Rent per Square FootConsolidated . . . . . . . . . . . . . . . . . . $13.94 1.8% $13.70 7.6% $12.73 7.0%Unconsolidated . . . . . . . . . . . . . . . . $12.55 1.1% $12.41 4.7% $11.85 1.5%Total Portfolio . . . . . . . . . . . . . . . . . $13.45 1.5% $13.25 6.6% $12.43 5.2%
(1) Percentages may not recalculate due to rounding. Percentage and basis point changes are representative of thechange from the comparable prior period.
Occupancy Levels and Average Base Rent Per Square Foot. Occupancy and average base rent are based on mall andfreestanding Gross Leasable Area, or GLA, owned by us in the regional malls, and all tenants at The Mills, Premium
52

Outlet Centers, and community/lifestyle centers. Our portfolio has maintained relatively stable occupancy andincreased the aggregate average base rents despite continuing economic difficulties.
Comparable Sales Per Square Foot. Comparable sales include total reported retail tenant sales at owned GLA(for mall and freestanding stores with less than 10,000 square feet) in the regional malls, and all reporting tenants atThe Mills and the Premium Outlet Centers and community/lifestyle centers. Retail sales at owned GLA affect revenueand profitability levels because sales determine the amount of minimum rent that can be charged, the percentage rentrealized, and the recoverable expenses (common area maintenance, real estate taxes, etc.) that tenants can afford topay.
International Property Data
The following are selected key operating statistics for certain of our international properties.
2009 % Change 2008 % Change 2007
European Shopping CentersOccupancy . . . . . . . . . . . . . . . . . . . . . . . . . . . . . . . . . . 95.9% 98.4% 98.7%Comparable sales per square foot . . . . . . . . . . . . . . . . . . . E400 (2.7%) A411 (2.4%) A421Average rent per square foot . . . . . . . . . . . . . . . . . . . . . . E31.41 4.3% A30.11 1.8% A29.58
International Premium Outlet Centers(1)Occupancy . . . . . . . . . . . . . . . . . . . . . . . . . . . . . . . . . . 99.6% 99.9% 100%Comparable sales per square foot . . . . . . . . . . . . . . . . . . . ¥94,468 2.7% ¥92,000 (1.3%) ¥93,169Average rent per square foot . . . . . . . . . . . . . . . . . . . . . . ¥4,714 0.6% ¥4,685 1.3% ¥4,626
(1) Does not include one center in Mexico (Premium Outlets Punta Norte) and one center in Korea (Yeoju PremiumOutlets).
Critical Accounting Policies
The preparation of financial statements in conformity with accounting principles generally accepted in theUnited States of America, or GAAP, requires management to use judgment in the application of accounting policies,including making estimates and assumptions. We base our estimates on historical experience and on various otherassumptions believed to be reasonable under the circumstances. These judgments affect the reported amounts ofassets and liabilities, disclosure of contingent assets and liabilities at the dates of the financial statements and thereported amounts of revenue, and expenses during the reporting periods. If our judgment or interpretation of the factsand circumstances relating to various transactions had been different, it is possible that different accounting policieswould have been applied resulting in a different presentation of our financial statements. From time to time, weevaluate our estimates and assumptions. In the event estimates or assumptions prove to be different from actualresults, adjustments are made in subsequent periods to reflect more current information. Below is a discussion ofaccounting policies that we consider critical in that they may require complex judgment in their application or requireestimates about matters that are inherently uncertain. For a summary of our significant accounting policies, see Note 3of the Notes to Consolidated Financial Statements.
• We, as a lessor, retain substantially all of the risks and benefits of ownership of the investment properties andaccount for our leases as operating leases. We accrue minimum rents on a straight-line basis over the terms oftheir respective leases. Substantially all of our retail tenants are also required to pay overage rents based onsales over a stated base amount during the lease year. We recognize overage rents only when each tenant’ssales exceed its sales threshold.
• We review investment properties for impairment on a property-by-property basis whenever events or changesin circumstances indicate that the carrying value of investment properties may not be recoverable. Thesecircumstances include, but are not limited to, declines in cash flows, occupancy and comparable sales persquare foot at the property. We measure any impairment of investment property when the estimatedundiscounted operating income before depreciation and amortization plus its residual value is less than thecarrying value of the property. To the extent impairment has occurred, we charge to income the excess ofcarrying value of the property over its estimated fair value. We may decide to sell properties that are held foruse and the sale prices of these properties may differ from their carrying values. We also review our
53
investments including investments in unconsolidated entities if events or circumstances change indicating thatthe carrying amount of our investments may not be recoverable. We will record an impairment charge if wedetermine that a decline in the fair value of the investments below carrying value is other-than-temporary.
• To maintain Simon Property’s qualification as a REIT under the Internal Revenue Code, Simon Property isrequired to distribute at least 90% of its taxable income in any given year and meet certain asset and incometests. Simon Property monitors its business and transactions that may potentially impact its REIT status. Inthe unlikely event that Simon Property fails to maintain its REIT status, and available relief provisions do notapply, then it would be required to pay federal income taxes at regular corporate income tax rates during theperiod it did not qualify as a REIT. If Simon Property lost its REIT status, it could not elect to be taxed as aREIT for four years unless its failure was due to reasonable cause and certain other conditions were met. Asa result, failing to maintain REIT status would result in a significant increase in the income tax expenserecorded during those periods. This could adversely impact our ability to sell our debt securities and SimonProperty’s ability to sell its securities in the capital markets. We make distributions to our unitholdersincluding Simon Property so that Simon Property can meet the REIT qualification requirements.
• We make estimates as part of our allocation of the purchase price of acquisitions to the various componentsof the acquisition based upon the fair value of each component. The most significant components of ourallocations are typically the allocation of fair value to the buildings as-if-vacant, land and market value ofin-place leases. In the case of the fair value of buildings and the allocation of value to land and otherintangibles, our estimates of the values of these components will affect the amount of depreciation we recordover the estimated useful life of the property acquired or the remaining lease term. In the case of the marketvalue of in-place leases, we make our best estimates of the tenants’ ability to pay rents based upon thetenants’ operating performance at the property, including the competitive position of the property in itsmarket as well as sales psf, rents psf, and overall occupancy cost for the tenants in place at the acquisitiondate. Our assumptions affect the amount of future revenue that we will recognize over the remaining leaseterm for the acquired in-place leases.
• A variety of costs are incurred in the development and leasing of properties. After determination is made tocapitalize a cost, it is allocated to the specific component of a project that is benefited. Determination ofwhen a development project is substantially complete and capitalization must cease involves a degree ofjudgment. The costs of land and buildings under development include specifically identifiable costs. Thecapitalized costs include pre-construction costs essential to the development of the property, developmentcosts, construction costs, interest costs, real estate taxes, salaries and related costs and other costs incurredduring the period of development. We consider a construction project as substantially completed and heldavailable for occupancy and cease capitalization of costs upon opening.
Results of Operations
In addition to the activity discussed above in ‘‘Results Overview,’’ the following acquisitions, property openings,and other activity significantly affected our consolidated results from continuing operations in the comparativeperiods:
• During 2009, we sold four consolidated properties described below.• During 2009, we recognized a loss on our joint venture interests in our shopping centers in China. We sold
our interests to affiliates of our Chinese partner for approximately $29 million resulting in a loss ofapproximately $20 million.
• On August 6, 2009, we opened Cincinnati Premium Outlets, a 400,000 square foot outlet center located inWarren County, Ohio, north of Cincinnati.
• On April 23, 2009, we opened The Promenade at Camarillo Premium Outlets, a 220,000 square footexpansion located in Ventura County, north of Los Angeles.
• On November 13, 2008, we opened Jersey Shore Premium Outlets, a 435,000 square foot outlet center with120 designer and name-brand outlet stores located in Tinton Falls, New Jersey.
• On November 6, 2008, we opened the second phase of Orlando Premium Outlets, a 114,000 square footexpansion that is 100% leased and adds 40 new merchants, located in Orlando, Florida.
• On May 1, 2008, we opened Pier Park, a 900,000 square foot, open-air retail center located in Panama City,Florida.
• On March 27, 2008, we opened Houston Premium Outlets, a 427,000 square foot outlet center locatedapproximately 30 miles west of Houston in Cypress, Texas.
54
• On November 15, 2007, we opened Palms Crossing, a 396,000 square foot community center, locatedadjacent to the new McAllen Convention Center in McAllen, Texas.
• On November 8, 2007, we opened Philadelphia Premium Outlets, a 425,000 square foot outlet center located35 miles northwest of Philadelphia in Limerick, Pennsylvania.
• On August 23, 2007, we acquired Las Americas Premium Outlets, a 560,000 square foot upscale outlet centerlocated in San Diego, California, for $283.5 million, including the assumption of its $180.0 million mortgage.
• On March 29, 2007, we acquired an additional 25% interest in two regional malls (Town Center at Cobb andGwinnett Place) in the Mills acquisition and now consolidate those properties.
• On March 28, 2007, we acquired a 100% interest in The Maine Outlet, a 112,000 square foot outlet centerlocated in Kittery, Maine for a purchase price of $45.2 million.
• On March 9, 2007, we opened The Domain, in Austin, Texas, which combines 700,000 square feet of luxuryfashion and restaurant space, 75,000 square feet of Class A office space and 390 apartments.
In addition to the activities discussed above and in ‘‘Results Overview’’, the following acquisitions, dispositions,and property openings affected our income from unconsolidated entities in the comparative periods:
• On September 28, 2009, we opened Suzhou In City Plaza, a 750,000 square foot center located in Suzhou,China. We held a 32.5% ownership interest in this center which was sold as part of the disposition of ourinterests in China.
• On September 25, 2009, we opened Zhengzhou In City Plaza, a 465,000 square foot center located inZhengzhou, China. We held a 32.5% ownership interest in this center which was sold as part of thedisposition of our interests in China.
• On July 9, 2009, Chelsea Japan Company, Ltd., or Chelsea Japan, the joint venture which operates theJapanese Premium Outlet Centers in which we have a 40% ownership interest, opened Ami Premium Outletslocated in Ami, Japan.
• On December 30, 2008, Cincinnati Mills, one of the properties we acquired in the Mills acquisition, was sold.We held a 50% interest the shopping center.
• On October 16, 2008, Chelsea Japan, opened Sendai-Izumi Premium Outlets located in Izumi Park Town,Japan. We hold a 40% ownership interest in Chelsea Japan.
• On August 25, 2008, Gallerie Commerciali Italia, or GCI, one of our European joint ventures in which wehold a 49% ownership interest, opened Monza, a 211,600 square foot shopping center in Monza, Italy.
• On June 5, 2008, we opened Changshu In City Plaza, a 487,000 square foot retail center located in Changshu,China. We held a 32.5% ownership interest in this center which was sold as part of the disposition of ourinterests in China.
• On May 2, 2008, we opened Hamilton Town Center, a 950,000 square foot open-air retail center inNoblesville, Indiana. We hold a 50% ownership interest in this center.
• On December 6, 2007, GCI opened Nola, a 876,000 square foot shopping center in Naples, Italy.• On October 17, 2007, we acquired an 18.75% interest in Denver West Village in Lakewood, Colorado
through our 50% ownership in SPG-FCM.• On September 27, 2007, GCI opened Cinisello, located in Milan, Italy.• On July 5, 2007, Simon Ivanhoe sold its interest in five assets located in Poland, for which we recorded our
share of the gain of $90.6 million.• On July 5, 2007, Chelsea Japan opened the 195,000 square foot first phase of Kobe-Sanda Premium Outlets,
located just north of downtown Kobe, Japan.• On June 1, 2007, Chelsea Japan opened Yeoju Premium Outlets, a 250,000 square foot center in Korea.• On February 16, 2007, SPG-FCM Ventures, LLC, or SPG-FCM, an entity in which a subsidiary of ours holds
a 50% interest, entered into a definitive agreement to acquire The Mills Corporation, or Mills. The Millsacquisition added 36 properties and over 42 million square feet of gross leasable area to our portfolio. Theproperties are generally located in major metropolitan areas and consist of a combination of traditionalanchor tenants, local and national retailers, and a number of larger ‘‘big box’’ tenants. We made an equityinvestment of $650.0 million and provided loans to SPG-FCM and Mills in various amounts throughout 2007to acquire Mills’ remaining common and preferred equity, and to pay various costs of the transaction. Weserve as manager of the properties acquired in this transaction, which is more fully discussed in the ‘‘Liquidityand Capital Resources’’ section.
For the purposes of the following comparisons between the years ended December 31, 2009 and 2008 and theyears ended December 31, 2008 and 2007, the above transactions are referred to as the property transactions. In the
55
following discussions of our results of operations, ‘‘comparable’’ refers to properties open and operating throughoutboth the current and prior year.
During 2009, we sold four consolidated properties that had an aggregate book value of $13.7 million foraggregate sales proceeds of $3.9 million, resulting in a net loss on sale of $9.8 million. The loss on sale of these assetsrecognized in the consolidated statements of operations and the operating results of the properties that we sold ordisposed of during 2009 were not significant to our consolidated results of operations. The following is a list of theconsolidated properties we sold and the date of disposition:
Property Date of Disposition
Knoxville Commons November 2, 2009Park Plaza November 2, 2009Eastland Plaza October 30, 2009Raleigh Springs Mall October 15, 2009
In 2008 we had no consolidated property dispositions.
During 2007, we disposed of five consolidated properties that had an aggregate book value of $91.6 million foraggregate sales proceeds of $56.4 million, resulting in a net loss on sale of approximately $35.3 million. The loss on saleof these assets has been reported as discontinued operations in the consolidated statements of operations. Theoperating results of the properties that we sold or disposed of during 2007 were not significant to our consolidatedresults of operations. The following is a list of consolidated property dispositions and the date of disposition for whichwe have reported the results of sale within discontinued operations:
Property Date of Disposition
Lafayette Square December 27, 2007University Mall September 28, 2007Boardman Plaza September 28, 2007Griffith Park Plaza September 20, 2007Alton Square August 2, 2007
Year Ended December 31, 2009 vs. Year Ended December 31, 2008
Minimum rents increased $24.9 million in 2009, of which the property transactions accounted for $27.3 millionof the increase, offset by a decrease in comparable minimum rents of $2.4 million, or 0.1%. The decrease incomparable minimum rents was primarily attributable to a $15.4 million decline in the fair market value of in-placelease amortization and a $12.6 million decrease in straight-line rents, offset by an increase in minimum rents of$22.8 million and an increase in comparable rents from carts, kiosks, and other temporary tenants of $2.8 million.Overage rents decreased $15.3 million or 15.3%, as a result of a reduction in tenant sales for the period as compared tothe prior year.
Tenant reimbursements decreased $3.7 million, due to a $14.8 million, or 1.4%, decrease in the comparableproperties as a result of a decrease in expenditures allocable to tenants paying common area maintenance on aproportionate basis, offset by an $11.1 million increase attributable to the property transactions.
Management fees and other revenues decreased $8.4 million principally as a result of decreased earnedpremiums of our wholly-owned captive insurance entities and lower fee revenue due to the reduction in development,leasing and joint venture property refinancing activity.
Total other income decreased $5.4 million, and was principally the result of the following:
• a $15.4 million decrease in interest income primarily due to lower reinvestment rates and the lower rateapplicable to our variable rate loan facility with SPG-FCM,
• a $2.3 million decrease in net other activity, and
These decreases were offset in part by a $6.5 million increase in land sale activity primarily related to a land sale in thefourth quarter of 2009 and a $5.8 million increase in lease settlement income.
Property operating expenses decreased $30.2 million, or 6.6%, primarily related to lower utility costs resultingfrom our cost control and cost reduction initiatives.
56

Depreciation and amortization expense increased $28.1 million due to the impact of prior year openings andexpansion activity and acceleration of depreciation for certain properties scheduled for redevelopment.
Repairs and maintenance decreased $16.1 million due to our cost savings efforts.
Home and regional office expense decreased $34.8 million primarily due to decreased personnel costsattributable to our cost control initiatives and lower incentive compensation levels.
During 2009, we recognized a non-cash charge of $140.5 million representing an other-than-temporaryimpairment in the fair value below the carrying value of our minority investment in Liberty. We recorded the charge toearnings due to the significance and duration of the decline in the total share price, including currency revaluations. Inaddition, we recorded impairment charges in 2009 of $56.9 million related to one regional mall, certain parcels of landand certain predevelopment costs related to projects no longer being pursued. In 2008, we recognized an impairmentof $16.5 million primarily representing the write-down of a mall property to its estimated net realizable value and thewrite-off of predevelopment costs for various development opportunities which we no longer plan to pursue.
During 2009, we recorded $5.7 million in transaction expenses related to costs associated with significantacquisition related activities. In accordance with the required adoption of a new accounting pronouncement effectiveJanuary 1, 2009, all transaction costs are expensed as incurred and are no longer capitalized as a component ofacquisition cost as prior accounting guidance permitted.
Interest expense increased $44.9 million primarily related to our issuance of $500 million of senior unsecurednotes on August 11, 2009, $600 million senior unsecured notes on May 15, 2009 and $650 million senior unsecurednotes on March 25, 2009, offset by decreased interest expense on our Credit Facility due to the payoff of the U.S.tranche and other property debt refinancings.
The 2008 period included a loss on extinguishment of debt of $20.3 million in the second quarter of 2008related to the redemption of $200 million in remarketable debt securities. We extinguished the debt because theremarketing reset base rate was above the rate for 30-year U.S. Treasury securities at the date of redemption.
Income tax expense of taxable REIT subsidiaries decreased $8.8 million due to the recognition of a $5.8 milliontax benefit in 2009 related to the adjustment of the carrying value of our investment in an unconsolidated non-retailreal estate entity.
Income from unconsolidated entities increased $8.0 million as a result of our 2008 joint venture openings andexpansion activity, interest rate savings from favorable interest rates and debt refinancings, and additional depreciationprovisions related to the finalization of purchase accounting on asset basis step-ups in the 2008 period associated withthe acquisition of Mills, offset by the gain recognized in 2008 from our disposition of an investment holding ofnon-retail real estate adjacent to one of our regional mall operating properties.
In 2009, we recognized a $42.7 million impairment charge representing our share of impairment chargesrecorded by unconsolidated entities and also impairment charges on our investment in certain unconsolidated entitiesfor which we deemed the declines in value below our carrying amount other-than-temporary.
The loss on sale of assets and interests in unconsolidated entities of $30.1 million in 2009 was the result of thesale of one regional mall, three community centers, and our 32.5% joint venture interests in our shopping centersoperating or under development in China.
Preferred unit distribution requirements decreased $20.5 million as a result of the conversion of preferred unitsto units during 2008.
Year Ended December 31, 2008 vs. Year Ended December 31, 2007
Minimum rents increased $137.2 million in 2008, of which the property transactions accounted for $64.6 millionof the increase. Comparable rents increased $72.6 million, or 3.6%. This was primarily due to an increase in minimumrents of $82.1 million and an $8.5 million increase in straight-line rents, offset by a $16.4 million decrease incomparable property activity, primarily attributable to lower amounts of fair market value of in-place leaseamortization. Overage rents decreased $9.8 million or 8.9%, as a result of a reduction in tenant sales for the period ascompared to the prior year.
57
Tenant reimbursements increased $42.8 million, due to a $26.9 million increase attributable to the propertytransactions and a $15.9 million, or 1.6%, increase in the comparable properties due to our ongoing initiative toconvert leases to a fixed reimbursement methodology for common area maintenance costs.
Management fees and other revenues increased $18.7 million principally as a result of the full year of additionalmanagement fees derived from managing the properties acquired in the Mills acquisition, and additional leasing anddevelopment fees as a result of incremental joint venture property activity.
Total other income decreased $56.6 million principally as a result of the following:
• a $26.7 million decrease in interest income primarily due to the repayment of loans made to SPG-FCM andMills, and lower interest rates attributable to this loan facility, combined with decreased interest earnings oninvestments due to lower excess cash balances and interest rates earned in 2008 as compared to 2007,
• an $18.7 million decrease in lease settlement income as a result of significant lease settlements received fromtwo department stores in 2007, and
• a $14.3 million decrease in loan financing fees related to Mills-related loan activity during 2007 which did notrecur in 2008.
These decreases were offset in part by a $3.1 million increase in net other activity.
Depreciation and amortization expense increased $63.8 million in 2008 primarily due to our acquisition,expansion and renovation activity and the accelerated depreciation of tenant improvements for tenant leasesterminated during the period and for properties scheduled for redevelopment.
Real estate taxes increased $21.3 million from the prior period, $9.0 million of which is related to the propertytransactions, and $12.3 million from our comparable properties due to the effect of increases resulting fromreassessments, higher tax rates, and the effect of expansion and renovation activities.
Repairs and maintenance decreased $12.3 million due to our cost savings efforts.
Provision for credit losses increased $14.5 million primarily due to an increase in tenant bankruptcies andtenant delinquencies. This was reflected in total square footage lost to tenant bankruptcies of 1,104,000 during 2008 ascompared to only 69,000 square feet in 2007.
Home and regional office expense increased $8.3 million primarily due to increased personnel costs, primarilythe result of the Mills acquisition, and the increased expense from certain incentive compensation plans.
Other expenses increased $6.1 million due to increased consulting and professional fees, including legal feesand related costs.
In 2008, we recognized impairment charges of $16.5 million primarily representing the write-down of a mallproperty to its estimated net realizable value and the write-off of predevelopment costs for various developmentopportunities that we no longer plan to pursue.
Interest expense increased marginally by $1.3 million despite an $823.9 million increase in consolidatedborrowings to fund our development and redevelopment activities, and the full year impact of our borrowings to fundthe Mills-related loans, due to a 55 basis point decline in our weighted average borrowing rates. This decrease inweighted average borrowing rates was driven primarily by a decline in the applicable LIBOR rate for a majority of ourconsolidated floating rate debt instruments, including the Credit Facility.
We recognized a loss on extinguishment of debt of $20.3 million in the second quarter of 2008 related to theredemption of $200 million in remarketable debt securities. We extinguished the debt because the remarketing resetbase rate was above the rate for 30-year U.S. Treasury securities at the date of redemption.
Income tax expense of taxable REIT subsidiaries increased $14.9 million due primarily to a $19.5 million taxbenefit recognized in 2007 related to the impairment charge resulting from of the write-off of our investment in a landjoint venture in Phoenix, Arizona.
Income from unconsolidated entities decreased $5.9 million, due primarily to the impact of the Mills acquisition(net of eliminations). On a net basis, our share of loss from SPG-FCM increased $4.7 million from the prior perioddue to a full year of SPG-FCM activity in 2008 as compared to only nine months of activity in 2007. The loss was drivenby depreciation and amortization expense on asset basis step-ups in purchase accounting.
58
In 2007, we recognized an impairment charge of $55.1 million related to a land joint venture in Phoenix,Arizona.
The gain on sale of assets and interests in unconsolidated entities of $92.0 million in 2007 was primarily theresult of Simon Ivanhoe selling its interest in certain assets located in Poland.
In 2007, the loss on sale of discontinued operations of $35.3 million represents the net loss upon disposition offive non-core properties consisting of three regional malls and two community/lifestyle centers.
Preferred unit distribution requirements decreased $17.9 million as a result of the conversion or exchange ofpreferred units to units and the redemption of the Series G preferred units in the fourth quarter of 2007.
Liquidity and Capital Resources
Because we generate revenues primarily from long-term leases, our financing strategy relies primarily onlong-term fixed rate debt. We manage our floating rate debt to be at or below 15-25% of total outstandingindebtedness by negotiating interest rates for each financing or refinancing based on current market conditions.Floating rate debt currently comprises approximately 12% of our total consolidated debt at December 31, 2009. Wealso enter into interest rate protection agreements as appropriate to assist in managing our interest rate risk. We derivemost of our liquidity from leases that generate positive net cash flow from operations and distributions of capital fromunconsolidated entities that totaled $1.9 billion during 2009. In addition, the new credit facility provides an alternativesource of liquidity as our cash needs vary from time to time.
Our balance of cash and cash equivalents increased $3.2 billion during 2009 to $4.0 billion as of December 31,2009. December 31, 2009 and 2008 balances include $38.1 million and $29.8 million, respectively, related to ourco-branded gift card programs, which we do not consider available for general working capital purposes.
On December 31, 2009, we had available borrowing capacity of approximately $3.1 billion under the CreditFacility, net of outstanding borrowings of $446.1 million and letters of credit of $5.7 million. During 2009, themaximum amount outstanding under the Credit Facility was $1.6 billion and the weighted average amount outstandingwas $669.8 million. The weighted average interest rate was 0.94% for the year ended December 31, 2009. OnDecember 8, 2009, we entered into a new unsecured revolving corporate credit facility providing an initial borrowingcapacity of $3.565 billion. The new credit facility contains an accordion feature allowing the maximum borrowingcapacity to expand to $4.0 billion. The new credit facility matures on March 31, 2013. Borrowings on the new facilitywere not drawn until January 5, 2010 when the Euro and Yen-denominated borrowings on the Credit Facility weretransitioned to the new credit facility.
We and/or Simon Property also have access to public equity and long term unsecured debt markets and accessto private equity from institutional investors at the property level.
Our business model requires us to regularly access the debt and equity capital markets to raise funds foracquisition and development activity, redevelopment capital, and to refinance maturing debt. The turmoil in thecapital markets that began in 2008 and which now shows signs of abating had an impact on many businesses’, includingours, ability to access debt and equity capital. We raised approximately $3.4 billion in the public capital markets in2009; however, there is no assurance we will be able to continue to do so in future periods or on similar terms orconditions. We believe we have sufficient cash on hand and availability under the new credit facility to address our debtmaturities and capital needs through 2010.
As discussed further in Financing and Debt below, on January 12, 2010, we commenced a tender offer topurchase ten outstanding series of notes. We subsequently purchased $2.285 billion of notes on January 26, 2010. Thepurchase of the notes was primarily funded with proceeds from the sale of $2.25 billion of senior unsecured notesissued on January 25, 2010.
On February 16, 2010, Simon Property announced a written offer made to acquire General GrowthProperties, Inc., or General Growth, in a transaction valued at more than $10 billion, including approximately$9 billion in cash. Of this consideration, approximately $7 billion will be paid to unsecured creditors, representing parvalue plus accrued and unpaid dividends and interest. The transaction would not be subject to a financing conditionand would be financed through cash on hand, asset sales and through equity co-investments in acquired properties bystrategic institutional investors, with the balance coming from our new credit facility. The offer indicated a willingnessto discuss consideration consisting in whole or in part of equity in lieu of the cash portion of the consideration to
59
General Growth’s stockholders, and perhaps certain of its unsecured creditors, for those who would prefer to receiveequity. The offer is subject to confirmatory due diligence and the negotiation and execution of a definitive transactionagreement, as well as required bankruptcy court and creditor approvals. As of the filing of this report, there is noagreement for such a transaction.
Acquisition of The Mills Corporation by SPG-FCM
On February 16, 2007, SPG-FCM, a 50/50 joint venture between one of our affiliates and funds managed byFarallon Capital Management, L.L.C., or Farallon, entered into a definitive merger agreement to acquire all of theoutstanding common stock of Mills for $25.25 per common share in cash. The acquisition of Mills and its interests inthe 36 properties that remain at December 31, 2009 was completed in April 2007. As of December 31, 2009, we andFarallon had each funded $650.0 million into SPG-FCM to acquire all of the common stock of Mills. As part of thetransaction, we also made loans to SPG-FCM and Mills primarily at rates of LIBOR plus 270-275 basis points. Thesefunds were used by SPG-FCM and Mills to repay loans and other obligations of Mills, including the redemption ofpreferred stock, during 2007. As of December 31, 2009, the outstanding balance of our loan to SPG-FCM was$632.0 million, and the average outstanding balance during the twelve month period ended December 31, 2009 of allloans made to SPG-FCM and Mills was approximately $589.5 million. During 2009, 2008 and 2007, we recordedapproximately $9.3 million, $15.3 million and $39.1 million in interest income (net of inter-entity eliminations) relatedto these loans, respectively. We also recorded fee income, including fee income amortization related to up-front feeson loans made to SPG-FCM and Mills, during 2009, 2008 and 2007 of approximately $3.7 million, $3.1 million and$17.4 million (net of inter-entity eliminations), respectively, for providing refinancing services to Mills’ properties andSPG-FCM. The existing loan facility to SPG-FCM bears a rate of LIBOR plus 275 basis points and matures on June 7,2010, with two available one-year extensions. Fees charged on loans made to SPG-FCM and Mills are amortized on astraight-line basis over the life of the loan.
The Mills acquisition involved the purchase of all Mills’ outstanding shares of common stock and common unitsfor approximately $1.7 billion (at $25.25 per share or unit), the assumption of $954.9 million of preferred stock, theassumption of a proportionate share of property-level mortgage debt, of which SPG-FCM’s share approximated$3.8 billion, the assumption of $1.2 billion in unsecured loans provided by us, costs to effect the acquisition, and certainliabilities and contingencies, including an ongoing investigation by the Securities and Exchange Commission, for anaggregate purchase price of approximately $8 billion. SPG-FCM has completed its purchase price allocations for theMills acquisition using valuations developed with the assistance of a third-party professional appraisal firm.
In conjunction with the Mills acquisition, we acquired a majority interest in two properties in which wepreviously held a 50% ownership interest (Town Center at Cobb and Gwinnett Place) and as a result we haveconsolidated these two properties at the date of acquisition.
In addition to the loans provided to SPG-FCM, we also provide management services to substantially all of theproperties in which SPG-FCM holds an interest.
Cash Flows
Our net cash flow from operating activities and distributions of capital from unconsolidated entities totaled$1.9 billion during 2009. In addition, we received net proceeds from our debt financing and repayment activities in2009 of $542.1 million. These activities are further discussed below in ‘‘Financing and Debt’’. Also during 2009, we:
• paid unitholder distributions of $147.8 million in cash and $754.2 million in units,• issued 40,250,000 units to Simon Property in exchange for the $1.6 billion of proceeds from two separate
public offerings of Simon Property common stock,• paid preferred unit distributions totaling $38.2 million,• redeemed $85.1 million aggregate liquidation preference of 7.75%/8% cumulative redeemable preferred
units,• funded consolidated capital expenditures of $376.3 million (includes development and other costs of
$160.4 million, renovation and expansion costs of $159.0 million, and tenant costs and other operationalcapital expenditures of $56.9 million), and
• funded investments in unconsolidated entities of $107.2 million.
In general, we anticipate that cash generated from operations will be sufficient to meet operating expenses,monthly debt service, recurring capital expenditures, and distributions to partners necessary to maintain Simon
60
Property’s REIT qualification on a long-term basis. In addition, we expect to be able to obtain capital for nonrecurringcapital expenditures, such as acquisitions, major building renovations and expansions, as well as for scheduled principalmaturities on outstanding indebtedness, from:
• excess cash generated from operating performance and working capital reserves,• borrowings on our new credit facility,• additional secured or unsecured debt financing, or• additional equity raised in the public or private markets.
We expect to generate positive cash flow from operations in 2010, and we consider these projected cash flows inour sources and uses of cash. These cash flows are principally derived from retail tenants, many of whom continue toexperience considerable financial distress. A significant deterioration in projected cash flows from operations couldcause us to increase our reliance on available funds from the new credit facility, curtail planned capital expenditures,or seek other additional sources of financing as discussed above.
Financing and Debt
Unsecured Debt
Our unsecured debt at December 31, 2009 consisted of approximately $11.6 billion of our senior unsecurednotes and $446.1 million outstanding under the Credit Facility. The total outstanding balance of the Credit Facility asof December 31, 2009 was comprised of the U.S. dollar equivalent of Euro and Yen-denominated borrowings whichexpired on January 11, 2010. The balance as of December 31, 2009 reflects interest at LIBOR plus 37.5 basis pointsand an additional facility fee of 12.5 basis points as these borrowings were made under the Credit Facility. OnDecember 8, 2009, we entered into a new unsecured revolving corporate credit facility providing an initial borrowingcapacity of $3.565 billion. The new credit facility contains an accordion feature allowing the maximum borrowingcapacity to expand to $4.0 billion. The new credit facility matures on March 31, 2013. The base interest on the newcredit facility is LIBOR plus 210 basis points and includes a facility fee of 40 basis points. Borrowings on the new creditfacility were not drawn until January 5, 2010 when the Euro and Yen-denominated borrowings on the Credit Facilitywere transitioned to the new credit facility.
During the year ended December 31, 2009, we drew amounts from the Credit Facility to fund the redemption of$600.0 million of maturing senior unsecured notes. We repaid a total of $1.2 billion on the Credit Facility during theyear ended December 31, 2009. The maximum outstanding balance during the year ended December 31, 2009 wasapproximately $1.6 billion. During the year ended December 31, 2009, the weighted average outstanding balance ofthe Credit Facility was approximately $669.8 million.
On March 25, 2009, we issued $650.0 million of senior unsecured notes at a fixed interest rate of 10.35%. Theproceeds from the offering were used to reduce borrowings on the Credit Facility and for general business purposes.
On May 15, 2009, we issued $600.0 million of senior unsecured notes at a fixed interest rate of 6.75%. Theproceeds from the offering were used for general business purposes. The notes were re-opened on August 11, 2009,and an additional $500.0 million of senior unsecured notes were issued. We used the proceeds from the offering forgeneral business purposes.
On January 12, 2010, we commenced a cash tender offer for any and all senior unsecured notes of tenoutstanding series with maturity dates ranging from 2011 to March 2013. The total principal amount of the notesaccepted for purchase on January 26, 2010 was approximately $2.3 billion, with a weighted average duration of2.0 years and a weighted coupon of 5.76%. We purchased the tendered notes with cash on hand and the proceeds froman offering of $2.25 billion of senior unsecured notes that closed on January 25, 2010. The senior notes offering wascomprised of $400.0 million of 4.20% notes due 2015, $1.25 billion of 5.65% notes due 2020 and $600.0 million of6.75% notes due 2040. We will report a $165.6 million charge to earnings in the first quarter of 2010 as a result of thetender offer.
Secured Debt
Total secured indebtedness was $6.6 billion and $6.3 billion at December 31, 2009 and 2008, respectively.
61
On July 30, 2009, we borrowed $400.0 million on a mortgage that is secured by Greenwood Park Mall,Southpark Mall, and Walt Whitman Mall, which matures on August 1, 2016 and bears interest at a fixed rate of 8.00%.This is a cross-collateralized and cross-defaulted loan as it pertains to these properties.
Summary of Financing
Our consolidated debt, adjusted to reflect outstanding derivative instruments, and the effective weightedaverage interest rates as of December 31, 2009, and 2008, consisted of the following (dollars in thousands):
Adjusted Balance Effective Adjusted Balance Effectiveas of Weighted as of Weighted
December 31, Average December 31, AverageDebt Subject to 2009 Interest Rate 2008 Interest Rate
Fixed Rate $16,814,240 6.10% $15,424,318 5.76%Variable Rate 1,816,062 1.19% 2,618,214 1.31%
$18,630,302 5.62% $18,042,532 5.12%
As of December 31, 2009, we had $694.2 million of notional amount fixed rate swap agreements that have aweighted average fixed pay rate of 2.79% and a weighted average variable receive rate of 0.60%. As of December 31,2009, the net effect of these agreements effectively converted $694.2 million of variable rate debt to fixed rate debt.
Contractual Obligations and Off-balance Sheet Arrangements: The following table summarizes the materialaspects of our future obligations as of December 31, 2009 (dollars in thousands):
2011 to 2013 to2010 2012 2015 After 2015 Total
Long Term DebtConsolidated(1) $2,311,705 $4,965,828 $6,424,036 $4,918,999 $18,620,568
Pro Rata Share Of Long Term Debt:Consolidated(2) $2,292,867 $4,835,957 $6,355,112 $4,860,737 $18,344,673Joint Ventures(2) 788,956 1,931,365 2,190,793 1,633,423 6,544,537
Total Pro Rata Share Of Long Term Debt 3,081,823 6,767,322 8,545,905 6,494,160 24,889,210Consolidated Capital Expenditure
Commitments(3) 27,938 357 — — 28,295Joint Venture Capital Expenditure
Commitments(3) 6,115 3,779 — — 9,894Consolidated Ground Lease Commitments(4) 16,782 33,760 51,974 630,654 733,170
Total $3,132,658 $6,805,218 $8,597,879 $7,124,814 $25,660,569
(1) Represents principal maturities only and therefore, excludes net premiums and discounts of $9,734 and allrequired interest payments. We incurred interest expense during 2009 of $992.1 million, net of capitalized interestof $14.5 million.
(2) Represents our pro rata share of principal maturities and excludes net premiums and discounts.
(3) Represents our pro rata share of capital expenditure commitments.
(4) Represents only the minimum non-cancellable lease period, excluding applicable lease extension and renewaloptions.
Our off-balance sheet arrangements consist primarily of our investments in real estate joint ventures which arecommon in the real estate industry and are described in Note 7 of the notes to the accompanying financial statements.Joint venture debt is the liability of the joint venture, is typically secured by the joint venture property, and isnon-recourse to us. As of December 31, 2009, we had loan guarantee obligations to support $47.2 million to supportour total $6.5 billion share of joint venture mortgage and other indebtedness presented in the table above.
62
Preferred Unit Activity
During 2009, the holders of 500,891 Series I preferred units exercised their rights to exchange the preferredunits for shares of Simon Property’s Series I preferred stock.
Acquisitions and Dispositions
Buy-sell provisions are common in real estate partnership agreements. Most of our partners are institutionalinvestors who have a history of direct investment in retail real estate. Our partners in our joint venture properties mayinitiate these provisions at any time. If we determine it is in our unitholders’ best interests for us to purchase the jointventure interest and we believe we have adequate liquidity to execute the purchase without hindering our cash flows,then we may initiate these provisions or elect to buy. If we decide to sell any of our joint venture interests, we expect touse the net proceeds to reduce outstanding indebtedness or to reinvest in development, redevelopment, or expansionopportunities.
Acquisitions. Although the acquisition of high quality individual properties or portfolios of properties remainsan integral component of our growth strategies, we did not acquire any properties during 2009.
We entered into a definitive agreement in December 2009 to acquire all of the outlet shopping centers currentlyowned by Prime Outlets Acquisition Company and certain of its affiliated entities, or the ‘Prime Outlets’, subject toPrime Outlets’ existing fixed rate indebtedness and preferred stock. The Prime Outlets consist of 22 high quality outletcenters located in major metropolitan markets. We will pay consideration (consisting of cash and units of theOperating Partnership) of approximately $0.7 billion for the owners’ interests in the Prime Outlets. The acquisition issubject to several closing conditions relating to certain financing arrangements of the Prime Outlets. Assuming allclosing conditions are satisfied on a timely basis, we expect the transaction will close in the second quarter of 2010.
Dispositions. We continue to pursue the sale of properties that no longer meet our strategic criteria or that arenot the primary retail venue within their trade area. In 2009, we sold the following wholly-owned properties: RaleighSprings, a regional mall located in Memphis, Tennessee; Eastland Plaza, a community center located in Tulsa,Oklahoma; Knoxville Commons, a community center located in Knoxville, Tennessee; and Park Plaza, a communitycenter located in Hopkinsville, Kentucky. We received net proceeds of $3.9 million on the U.S. property dispositionsand recorded a net loss on these dispositions of $9.8 million. Also in December 2009, we recognized a loss on our jointventure interests in our shopping centers operating and under development in China. We sold our interests to affiliatesof our Chinese partner for approximately $29 million, resulting in a loss of approximately $20 million. The loss on salesof these wholly owned entities and our joint venture interests in China is included in ‘‘(Loss) gain on sale of assets andinterests in unconsolidated entities’’ in the 2009 consolidated statements of operations and comprehensive income.
On February 4, 2010, we and our partner in Simon Ivanhoe, Ivanhoe Cambridge, entered into a definitiveagreement to sell all of the interests in Simon Ivanhoe which owns seven shopping centers located in France andPoland to Unibail-Rodamco. The joint venture partners will receive consideration of A715 million for the assets,subject to certain post-closing adjustments. We expect our share of the gain on sale of our interests in Simon Ivanhoeto be approximately $300 million. The transaction is scheduled to close during the first half of 2010, subject tocustomary closing conditions and regulatory approvals.
We do not believe the sale of these properties and joint venture interests will have a material impact on ourfuture results of operations or cash flows. We believe the disposition of these assets will enhance the average overallquality of our portfolio.
Development Activity
New Domestic Developments. Given the significant downturn in the economy, we have substantially reduced ourdevelopment spending. On August 6, 2009, we opened Cincinnati Premium Outlets, a 400,000 square foot upscalemanufacturers’ outlet center located in Monroe, OH. The total cost to complete this project was approximately$93.0 million, which was funded with available cash from operations. Also included in development projects is a600,000 square foot Phase II expansion at The Domain, which is expected to open in the first half of 2010. Other thanthese projects, our share of other 2009 new developments was not significant.
Strategic Domestic Expansions and Renovations. In addition to new development, we incur costs related toconstruction for significant renovation and expansion projects at our properties. On April 23, 2009, we opened The
63
Promenade at Camarillo Premium Outlets, a 220,000 square foot expansion of an existing center. The total cost tocomplete this project was approximately $73.0 million and was funded with available cash from operations. Included inour renovation and expansion projects is the addition of Nordstrom at South Shore Plaza, which is expected to open inthe first half of 2010. We expect to fund this capital project with cash flow from operations. Our share of the cost ofrenovation or expansion projects that we expect to initiate or complete in 2010 is approximately $40.0 million.
Capital Expenditures on Consolidated Properties.
The following table summarizes total capital expenditures on consolidated properties on a cash basis:
2009 2008 2007
New Developments and Other $160 $327 $ 432Renovations and Expansions 159 432 349Tenant Allowances 43 72 106Operational Capital Expenditures 14 43 130
Total $376 $874 $1,017
International Development Activity. We typically reinvest net cash flow from our international investments to fundfuture international development activity. We believe this strategy mitigates some of the risk of our initial investmentand our exposure to changes in foreign currencies. We have also funded our European investments withEuro-denominated borrowings that act as a natural hedge against local currency fluctuations. This has also been thecase with our Premium Outlet Centers in Japan and Mexico where we use Yen and Peso denominated financing,respectively. Currently, our consolidated net income exposure to changes in the volatility of the Euro, Yen, Peso andother foreign currencies is not material. We expect our share of international development costs for 2010 will beapproximately $65.0 million.
The carrying amount of our total combined investment in Simon Ivanhoe and GCI, as of December 31, 2009,including all related components of other comprehensive income, was $298.8 million. On December 14, 2009, we madean additional capital contribution to GCI of $79.4 million which was used to fund certain liabilities of the joint venture.The contribution increased our investment in GCI but did not impact our ownership percentage of the venture. Ourinvestments in Simon Ivanhoe and GCI are accounted for using the equity method of accounting. Currently, twoEuropean developments are under construction which will add approximately 942,000 square feet of GLA for a totalnet cost of approximately A221 million, of which our share is approximately A53 million, or $76.0 million based oncurrent Euro:USD exchange rates. Although we agreed to sell our joint venture interest in Simon Ivanhoe in 2010, weand Ivanhoe Cambridge have the right to participate with Unibail-Rodamco in the potential development of up to fivenew retail projects in the Simon Ivanhoe pipeline, subject to customary approval rights. We will own a 25% interest inany of these projects in which we agree to participate.
As of December 31, 2009, the carrying amount of our 40% joint venture investment in the eight JapanesePremium Outlet Centers including all related components of other comprehensive income was $302.2 million. In 2009,we completed construction and opened Ami Premium Outlets, a 224,500 square foot center located outside Tokyo,Japan. The project’s total projected net cost is JPY 15.4 billion, of which our share is approximately JPY 6.2 billion, or$66.8 million based on applicable Yen:USD exchange rates. We also completed construction and opened a 171,800square foot expansion at Kobe-Sanda Premium Outlets in Hyougo-ken, Japan. The project’s total projected net cost isJPY 7.6 billion, of which our share is approximately JPY 3.0 billion, or $33.0 million based on applicable Yen:USDexchange rates. Currently, Toki Premium Outlets Phase III and Tosu Premium Outlets Phase III are underconstruction in Japan. Toki Premium Outlets Phase III is a 62,000 square foot expansion to the Toki Premium OutletCenter located in Toki, Japan. The project’s total projected net cost is JPY 2.2 billion, of which our share isapproximately JPY 864 million, or $9.4 million based on applicable Yen:USD exchange rates. Tosu Premium OutletsPhase III is a 52,000 square foot expansion to the Tosu Premium Outlet Center located in Fukuoka, Japan. Theproject’s total projected net cost is JPY 3.2 billion, of which our share is approximately JPY 1.3 billion, or $13.7 millionbased on applicable Yen:USD exchange rates.
We hold a minority interest in Liberty which is a U.K. Real Estate Investment Trust that operates regionalshopping centers and owns other prime retail assets throughout the U.K. Liberty is a U.K. FTSE 100 listed company,with shareholders’ funds of £3.2 billion and property investments of £6.1 billion, of which its U.K. regional shoppingcenters comprise 70%. Assets of the group under control or joint control amount to £9.3 billion. Our interest in Liberty
64
is less than 6% of its outstanding shares. We adjust the carrying value of this investment quarterly using quoted marketprices, including a related foreign exchange component.
Distributions and Stock Repurchase Program
Distributions during 2009 aggregated $2.70 per unit and were paid in a combination of cash and units.Distributions during 2008 aggregated $3.60 per unit and were paid entirely in cash. We must pay a minimum amount ofdistributions to maintain Simon Property’s status as a REIT. Our distributions typically exceed our consolidated netincome generated in any given year primarily because of depreciation, which is a ‘‘non-cash’’ expense. Futuredistributions will be determined by the Simon Property Board of Directors based on actual results of operations, cashavailable for distributions, and what may be required to maintain Simon Property’s status as a REIT.
Simon Property’s Board of Directors had authorized the repurchase of up to $1.0 billion of common stockthrough July 2009. No purchases were made as part of this program in 2009. The program was not renewed and hasnow expired.
Forward-Looking Statements
Certain statements made in this section or elsewhere in this report may be deemed ‘‘forward-lookingstatements’’ within the meaning of the Private Securities Litigation Reform Act of 1995. Although we believe theexpectations reflected in any forward-looking statements are based on reasonable assumptions, we can give noassurance that our expectations will be attained, and it is possible that our actual results may differ materially fromthose indicated by these forward-looking statements due to a variety of risks, uncertainties and other factors. Suchfactors include, but are not limited to: the impact of a prolonged recession, our ability to meet debt servicerequirements, the availability and terms of financing, changes in our credit rating, changes in market rates of interestand foreign exchange rates for foreign currencies, the ability to hedge interest rate risk, risks associated with theacquisition, development and expansion of properties, general risks related to retail real estate, the liquidity of realestate investments, environmental liabilities, changes in market rental rates, trends in the retail industry, relationshipswith anchor tenants, the inability to collect rent due to the bankruptcy or insolvency of tenants or otherwise, risksrelating to joint venture properties, competitive market forces, risks related to international activities, insurance costsand coverage, terrorist activities, and maintenance of our status as a real estate investment trust. We discuss these andother risks and uncertainties under the heading ‘‘Risk Factors’’ in our most recent Annual Report on Form 10-K. Wemay update that discussion in subsequent Quarterly Reports on Form 10-Q, but otherwise we undertake no duty orobligation to update or revise these forward-looking statements, whether as a result of new information, futuredevelopments, or otherwise.
Item 7A. Qualitative and Quantitative Disclosure About Market Risk
Please refer to the Management’s Discussion and Analysis of Financial Condition and Results of Operationsincluded in Item 7 under the caption Liquidity and Capital Resources.
Item 8. Financial Statements and Supplementary Data
Reference is made to the Index to Financial Statements contained in Item 15.
Item 9. Changes in and Disagreements with Accountants on Accounting and Financial Disclosure
None.
Item 9A. Controls and Procedures
Evaluation of Disclosure Controls and Procedures. We carried out an evaluation under the supervision andwith participation of management, including our chief executive officer and chief financial officer, of the effectivenessof the design and operation of our disclosure controls and procedures as of the end of the period covered by thisAnnual Report on Form 10-K pursuant to Exchange Act Rule 13a-15. Based upon that evaluation, our management,including the chief executive officer and chief financial officer, concluded that our disclosure controls and procedureswere effective as of December 31, 2009.
65
Changes in Internal Control Over Financial Reporting. There was no change in our internal control overfinancial reporting (as defined in Rule 13a-15(f)) that occurred during the fourth quarter of 2009 that has materiallyaffected, or is reasonably likely to materially affect, our internal control over financial reporting.
Management’s Report on Internal Control over Financial Reporting. We are responsible for establishing andmaintaining adequate internal control over financial reporting. Internal control over financial reporting is defined inRule 13a-15(f) or 15d-15(f) promulgated under the Securities Exchange Act of 1934 as a process designed by, or underthe supervision of, Simon Property’s Board of Directors, principal executive and principal financial officers andeffected by Simon Property’s management and other personnel, to provide reasonable assurance regarding thereliability of financial reporting and the preparation of financial statements for external purposes in accordance withU.S. generally accepted accounting principles and includes those policies and procedures that:
• Pertain to the maintenance of records that in reasonable detail accurately and fairly reflect our transactionsand disposition of assets;
• Provide reasonable assurance that transactions are recorded as necessary to permit preparation of financialstatements in accordance with U.S. generally accepted accounting principles, and that our receipts andexpenditures are being made only in accordance with authorizations of our management and directors; and
• Provide reasonable assurance regarding prevention or timely detection of unauthorized acquisition, use ordisposition of our assets that could have a material effect on the financial statements.
Because of its inherent limitations, internal control over financial reporting may not prevent or detectmisstatements. Projections of any evaluation of effectiveness to future periods are subject to the risk that controls maybecome inadequate because of changes in conditions, or that the degree of compliance with the policies or proceduresmay deteriorate.
We assessed the effectiveness of our internal control over financial reporting as of December 31, 2009. Inmaking this assessment, we used the criteria set forth by the Committee of Sponsoring Organizations of the TreadwayCommission (COSO) in Internal Control-Integrated Framework.
Based on that assessment, we believe that, as of December 31, 2009, our internal control over financialreporting is effective based on those criteria. Our independent registered public accounting firm has issued an auditreport on their assessment of our internal control over financial reporting. Their report is included within Item 9A ofthis Form 10-K.
66
Report of Independent Registered Public Accounting Firm
The Board of Directors of Simon Property Group, Inc.and The Partners of Simon Property Group, L.P.:
We have audited Simon Property Group, L.P. and Subsidiaries’ internal control over financial reporting as ofDecember 31, 2009 based on criteria established in Internal Control — Integrated Framework issued by theCommittee of Sponsoring Organizations of the Treadway Commission (the COSO criteria). Simon PropertyGroup, L.P. and Subsidiaries’ management is responsible for maintaining effective internal control over financialreporting, and for its assessment of the effectiveness of internal control over financial reporting included in theaccompanying Management’s Report on Internal Control Over Financial Reporting. Our responsibility is to express anopinion on the Partnership’s internal control over financial reporting based on our audit.
We conducted our audit in accordance with the standards of the Public Company Accounting Oversight Board(United States). Those standards require that we plan and perform the audit to obtain reasonable assurance aboutwhether effective internal control over financial reporting was maintained in all material respects. Our audit includedobtaining an understanding of internal control over financial reporting, assessing the risk that a material weaknessexists, testing and evaluating the design and operating effectiveness of internal control based on the assessed risk, andperforming such other procedures as we considered necessary in the circumstances. We believe that our audit providesa reasonable basis for our opinion.
A company’s internal control over financial reporting is a process designed to provide reasonable assuranceregarding the reliability of financial reporting and the preparation of financial statements for external purposes inaccordance with generally accepted accounting principles. A company’s internal control over financial reportingincludes those policies and procedures that (1) pertain to the maintenance of records that, in reasonable detail,accurately and fairly reflect the transactions and dispositions of the assets of the company; (2) provide reasonableassurance that transactions are recorded as necessary to permit preparation of financial statements in accordance withgenerally accepted accounting principles, and that receipts and expenditures of the company are being made only inaccordance with authorizations of management and directors of the company; and (3) provide reasonable assuranceregarding prevention or timely detection of unauthorized acquisition, use, or disposition of the company’s assets thatcould have a material effect on the financial statements.
Because of its inherent limitations, internal control over financial reporting may not prevent or detectmisstatements. Also, projections of any evaluation of effectiveness to future periods are subject to the risk that controlsmay become inadequate because of changes in conditions, or that the degree of compliance with the policies orprocedures may deteriorate.
In our opinion, Simon Property Group, L.P. and Subsidiaries maintained, in all material respects, effectiveinternal control over financial reporting as of December 31, 2009, based on the COSO criteria.
We also have audited, in accordance with the standards of the Public Company Accounting Oversight Board(United States), the consolidated balance sheets of Simon Property Group, L.P. and Subsidiaries as of December 31,2009 and 2008, and the related consolidated statements of operations and comprehensive income, equity and cashflows for each of the three years in the period ended December 31, 2009 of Simon Property Group, L.P. andSubsidiaries, and the financial statement schedule listed in the Index at Item 15, and our report dated March 12, 2010expressed an unqualified opinion thereon.
/s/ ERNST & YOUNG LLP
Indianapolis, IndianaMarch 12, 2010
Item 9B. Other Information
During the fourth quarter of the year covered by this report, the Audit Committee of Simon PropertyGroup, Inc.’s Board of Directors approved certain non-audit tax compliance services to be provided by Ernst &Young, LLP, Simon Property’s independent registered public accounting firm. This disclosure is made pursuant toSection 10A(i)(2) of the Securities Exchange Act of 1934, as added by Section 202 of the Sarbanes-Oxley Act of 2002.
67

Part III
Item 10. Directors, Executive Officers and Corporate Governance
We are a limited partnership and Simon Property is our sole general partner. We do not have any directors orexecutive officers or any equity securities registered under the Securities Exchange Act of 1934. Comparableinformation for Simon Property can be found in its periodic reports and proxy statements it files with the Securitiesand Exchange Commission.
Item 11. Executive Compensation
We are a limited partnership and Simon Property is our sole general partner. We do not have any directors orexecutive officers or any equity securities registered under the Securities Exchange Act of 1934. Comparableinformation for Simon Property can be found in its periodic reports and proxy statements it files with the Securitiesand Exchange Commission.
Item 12. Security Ownership of Certain Beneficial Owners and Management and Related Stockholder Matters
We are a limited partnership and Simon Property is our sole general partner. We do not have any directors orexecutive officers or any equity securities registered under the Securities Exchange Act of 1934. Comparableinformation for Simon Property can be found in its periodic reports and proxy statements it files with the Securitiesand Exchange Commission.
Item 13. Certain Relationships and Related Transactions and Director Independence
We are a limited partnership and Simon Property is our sole general partner. We do not have any directors orexecutive officers or any equity securities registered under the Securities Exchange Act of 1934. Comparableinformation for Simon Property can be found in its periodic reports and proxy statements it files with the Securitiesand Exchange Commission.
Item 14. Principal Accountant Fees and Services
The Audit Committee of Simon Property’s Board of Directors pre-approves all audit and permissible non-auditservices to be provided by Ernst & Young LLP, our independent registered public accounting firm, prior tocommencement of services. The Audit Committee has delegated to the Chairman of the Audit Committee theauthority to pre-approve specific services up to specified individual and aggregate fee amounts. These pre-approvaldecisions are presented to the full Audit Committee at the next scheduled meeting after such approvals are made. Wehave incurred fees as shown below for services from Ernst & Young as our independent registered public accountingfirm. Ernst & Young has advised us that it has billed or will bill these indicated amounts for the following categories ofservices for the years ended December 31, 2009 and 2008, respectively:
2009 2008
Audit Fees (1) . . . . . . . . . . . . . . . . . . . . . . . . . . . . . . . . . . . . . . . . . . . . . . . . . . . $2,853,000 $2,776,000Audit-Related Fees (2) . . . . . . . . . . . . . . . . . . . . . . . . . . . . . . . . . . . . . . . . . . . . . 5,119,000 5,254,000Tax Fees (3) . . . . . . . . . . . . . . . . . . . . . . . . . . . . . . . . . . . . . . . . . . . . . . . . . . . . 777,000 1,144,000All Other Fees . . . . . . . . . . . . . . . . . . . . . . . . . . . . . . . . . . . . . . . . . . . . . . . . . . . — —
(1) Audit Fees include fees for the audit of the financial statements and the effectiveness of internal control overfinancial reporting for us, Simon Property, and certain of our subsidiaries and services associated with Securitiesand Exchange Commission registration statements, periodic reports, and other documents issued in connectionwith securities offerings.
(2) Audit-Related Fees include audits of individual properties and schedules of recoverable common areamaintenance costs to comply with lender, joint venture partner or tenant requirements and accountingconsultation and due diligence services. Our share of these Audit-Related Fees for the years ended 2009 and 2008are approximately 46% and 51%, respectively.
(3) Tax Fees include fees for international and other tax consulting services. Tax Fees also include return complianceservices associates with the tax returns for The Mills Corporation and related subsidiaries and joint ventures. Ourshare of these fees for 2009 and 2008 is approximately 75% and 35%, respectively.
68
Part IV
Item 15. Exhibits and Financial Statement Schedules
Page No.
(1) Financial Statements
Report of Independent Registered Public Accounting Firm 70Consolidated Balance Sheets as of December 31, 2009 and 2008 71Consolidated Statements of Operations for the years ended December 31, 2009, 2008 and 2007 72Consolidated Statements of Cash Flow for the years ended December 31, 2009, 2008 and 2007 73Consolidated Statements of Equity for the years ended December 31, 2009, 2008 and 2007 74Notes to Consolidated Financial Statements 75
(2) Financial Statement Schedule
Simon Property Group, L.P. and Subsidiaries Schedule III — Schedule of Real Estate andAccumulated Depreciation 111
Notes to Schedule III 118
(3) Exhibits
The Exhibit Index attached hereto is hereby incorporated by reference to this Item. 119
69
Report of Independent Registered Public Accounting Firm
The Board of Directors of Simon Property Group, Inc.and The Partners of Simon Property Group, L.P.:
We have audited the accompanying consolidated balance sheets of Simon Property Group, L.P. and Subsidiariesas of December 31, 2009 and 2008, and the related consolidated statements of operations and comprehensive income,equity and cash flows for each of the three years in the period ended December 31, 2009. Our audit also included thefinancial statement schedule listed in the Index at Item 15. These financial statements and schedule are theresponsibility of the Partnership’s management. Our responsibility is to express an opinion on these financialstatements and schedule based on our audits.
We conducted our audits in accordance with the standards of the Public Company Accounting Oversight Board(United States). Those standards require that we plan and perform the audit to obtain reasonable assurance aboutwhether the financial statements are free of material misstatement. An audit includes examining, on a test basis,evidence supporting the amounts and disclosures in the financial statements. An audit also includes assessing theaccounting principles used and significant estimates made by management, as well as evaluating the overall financialstatement presentation. We believe that our audits provide a reasonable basis for our opinion.
In our opinion, the financial statements referred to above present fairly, in all material respects, theconsolidated financial position of Simon Property Group, L.P. and Subsidiaries at December 31, 2009 and 2008, andthe consolidated results of their operations and their cash flows for each of the three years in the period endedDecember 31, 2009, in conformity with U.S. generally accepted accounting principles. Also, in our opinion, the relatedfinancial statement schedule, when considered in relation to the basic financial statements taken as a whole, presentsfairly in all material respects the information set forth therein.
We also have audited, in accordance with the standards of the Public Company Accounting Oversight Board(United States), Simon Property Group, L.P. and Subsidiaries’ internal control over financial reporting as ofDecember 31, 2009, based on criteria established in Internal Control — Integrated Framework issued by theCommittee of Sponsoring Organizations of the Treadway Commission and our report dated March 12, 2010, expressedan unqualified opinion thereon.
/s/ ERNST & YOUNG LLP
Indianapolis, IndianaMarch 12, 2010
70
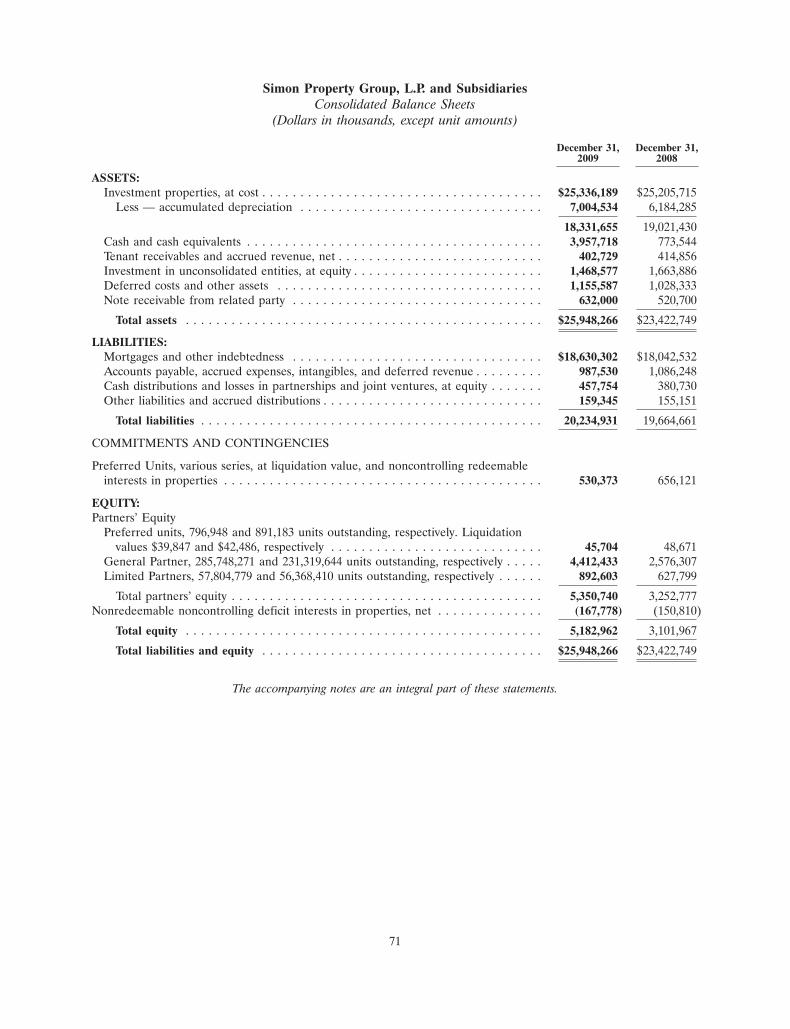
Simon Property Group, L.P. and SubsidiariesConsolidated Balance Sheets
(Dollars in thousands, except unit amounts)
December 31, December 31,2009 2008
ASSETS:Investment properties, at cost . . . . . . . . . . . . . . . . . . . . . . . . . . . . . . . . . . . . . $25,336,189 $25,205,715
Less — accumulated depreciation . . . . . . . . . . . . . . . . . . . . . . . . . . . . . . . . 7,004,534 6,184,285
18,331,655 19,021,430Cash and cash equivalents . . . . . . . . . . . . . . . . . . . . . . . . . . . . . . . . . . . . . . . 3,957,718 773,544Tenant receivables and accrued revenue, net . . . . . . . . . . . . . . . . . . . . . . . . . . . 402,729 414,856Investment in unconsolidated entities, at equity . . . . . . . . . . . . . . . . . . . . . . . . . 1,468,577 1,663,886Deferred costs and other assets . . . . . . . . . . . . . . . . . . . . . . . . . . . . . . . . . . . 1,155,587 1,028,333Note receivable from related party . . . . . . . . . . . . . . . . . . . . . . . . . . . . . . . . . 632,000 520,700
Total assets . . . . . . . . . . . . . . . . . . . . . . . . . . . . . . . . . . . . . . . . . . . . . . . $25,948,266 $23,422,749
LIABILITIES:Mortgages and other indebtedness . . . . . . . . . . . . . . . . . . . . . . . . . . . . . . . . . $18,630,302 $18,042,532Accounts payable, accrued expenses, intangibles, and deferred revenue . . . . . . . . . 987,530 1,086,248Cash distributions and losses in partnerships and joint ventures, at equity . . . . . . . 457,754 380,730Other liabilities and accrued distributions . . . . . . . . . . . . . . . . . . . . . . . . . . . . . 159,345 155,151
Total liabilities . . . . . . . . . . . . . . . . . . . . . . . . . . . . . . . . . . . . . . . . . . . . . 20,234,931 19,664,661
COMMITMENTS AND CONTINGENCIES
Preferred Units, various series, at liquidation value, and noncontrolling redeemableinterests in properties . . . . . . . . . . . . . . . . . . . . . . . . . . . . . . . . . . . . . . . . . . 530,373 656,121
EQUITY:Partners’ Equity
Preferred units, 796,948 and 891,183 units outstanding, respectively. Liquidationvalues $39,847 and $42,486, respectively . . . . . . . . . . . . . . . . . . . . . . . . . . . . 45,704 48,671
General Partner, 285,748,271 and 231,319,644 units outstanding, respectively . . . . . 4,412,433 2,576,307Limited Partners, 57,804,779 and 56,368,410 units outstanding, respectively . . . . . . 892,603 627,799
Total partners’ equity . . . . . . . . . . . . . . . . . . . . . . . . . . . . . . . . . . . . . . . . . 5,350,740 3,252,777Nonredeemable noncontrolling deficit interests in properties, net . . . . . . . . . . . . . . (167,778) (150,810)
Total equity . . . . . . . . . . . . . . . . . . . . . . . . . . . . . . . . . . . . . . . . . . . . . . . 5,182,962 3,101,967
Total liabilities and equity . . . . . . . . . . . . . . . . . . . . . . . . . . . . . . . . . . . . . $25,948,266 $23,422,749
The accompanying notes are an integral part of these statements.
71
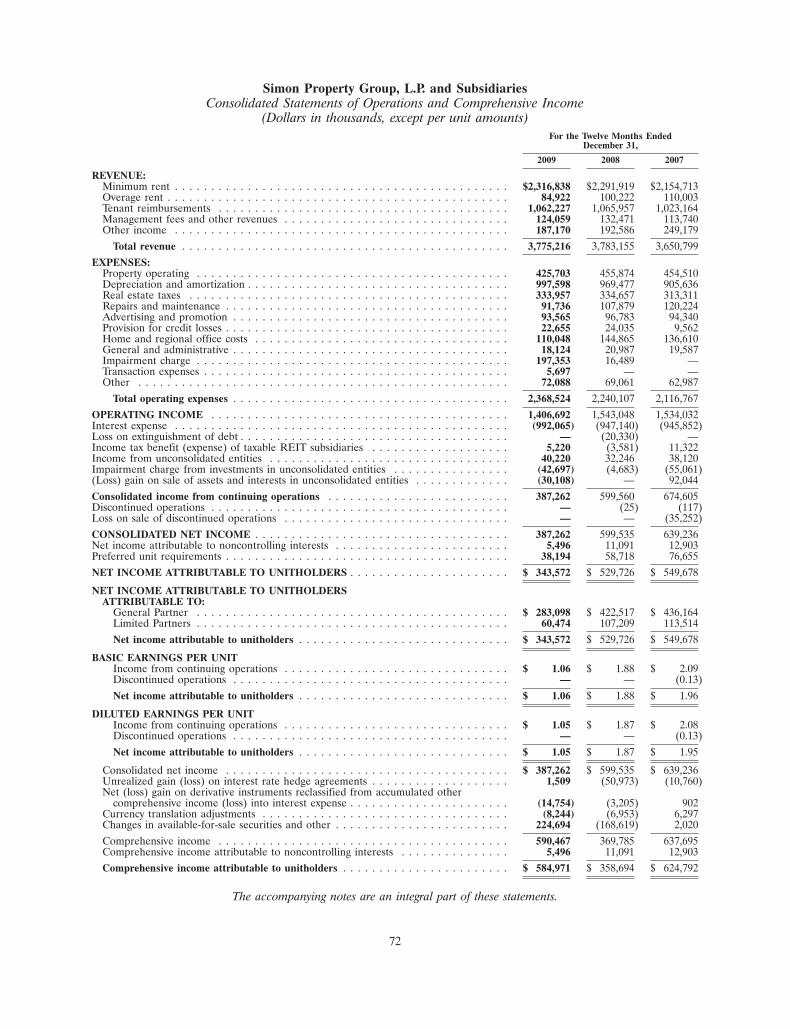
Simon Property Group, L.P. and SubsidiariesConsolidated Statements of Operations and Comprehensive Income
(Dollars in thousands, except per unit amounts)For the Twelve Months Ended
December 31,
2009 2008 2007
REVENUE:Minimum rent . . . . . . . . . . . . . . . . . . . . . . . . . . . . . . . . . . . . . . . . . . . . . . $2,316,838 $2,291,919 $2,154,713Overage rent . . . . . . . . . . . . . . . . . . . . . . . . . . . . . . . . . . . . . . . . . . . . . . . 84,922 100,222 110,003Tenant reimbursements . . . . . . . . . . . . . . . . . . . . . . . . . . . . . . . . . . . . . . . . 1,062,227 1,065,957 1,023,164Management fees and other revenues . . . . . . . . . . . . . . . . . . . . . . . . . . . . . . . 124,059 132,471 113,740Other income . . . . . . . . . . . . . . . . . . . . . . . . . . . . . . . . . . . . . . . . . . . . . . 187,170 192,586 249,179
Total revenue . . . . . . . . . . . . . . . . . . . . . . . . . . . . . . . . . . . . . . . . . . . . . 3,775,216 3,783,155 3,650,799
EXPENSES:Property operating . . . . . . . . . . . . . . . . . . . . . . . . . . . . . . . . . . . . . . . . . . . 425,703 455,874 454,510Depreciation and amortization . . . . . . . . . . . . . . . . . . . . . . . . . . . . . . . . . . . . 997,598 969,477 905,636Real estate taxes . . . . . . . . . . . . . . . . . . . . . . . . . . . . . . . . . . . . . . . . . . . . 333,957 334,657 313,311Repairs and maintenance . . . . . . . . . . . . . . . . . . . . . . . . . . . . . . . . . . . . . . . 91,736 107,879 120,224Advertising and promotion . . . . . . . . . . . . . . . . . . . . . . . . . . . . . . . . . . . . . . 93,565 96,783 94,340Provision for credit losses . . . . . . . . . . . . . . . . . . . . . . . . . . . . . . . . . . . . . . . 22,655 24,035 9,562Home and regional office costs . . . . . . . . . . . . . . . . . . . . . . . . . . . . . . . . . . . 110,048 144,865 136,610General and administrative . . . . . . . . . . . . . . . . . . . . . . . . . . . . . . . . . . . . . . 18,124 20,987 19,587Impairment charge . . . . . . . . . . . . . . . . . . . . . . . . . . . . . . . . . . . . . . . . . . . 197,353 16,489 —Transaction expenses . . . . . . . . . . . . . . . . . . . . . . . . . . . . . . . . . . . . . . . . . . 5,697 — —Other . . . . . . . . . . . . . . . . . . . . . . . . . . . . . . . . . . . . . . . . . . . . . . . . . . . 72,088 69,061 62,987
Total operating expenses . . . . . . . . . . . . . . . . . . . . . . . . . . . . . . . . . . . . . . 2,368,524 2,240,107 2,116,767
OPERATING INCOME . . . . . . . . . . . . . . . . . . . . . . . . . . . . . . . . . . . . . . . . . 1,406,692 1,543,048 1,534,032Interest expense . . . . . . . . . . . . . . . . . . . . . . . . . . . . . . . . . . . . . . . . . . . . . . (992,065) (947,140) (945,852)Loss on extinguishment of debt . . . . . . . . . . . . . . . . . . . . . . . . . . . . . . . . . . . . . — (20,330) —Income tax benefit (expense) of taxable REIT subsidiaries . . . . . . . . . . . . . . . . . . . 5,220 (3,581) 11,322Income from unconsolidated entities . . . . . . . . . . . . . . . . . . . . . . . . . . . . . . . . . 40,220 32,246 38,120Impairment charge from investments in unconsolidated entities . . . . . . . . . . . . . . . . (42,697) (4,683) (55,061)(Loss) gain on sale of assets and interests in unconsolidated entities . . . . . . . . . . . . . (30,108) — 92,044
Consolidated income from continuing operations . . . . . . . . . . . . . . . . . . . . . . . . . 387,262 599,560 674,605Discontinued operations . . . . . . . . . . . . . . . . . . . . . . . . . . . . . . . . . . . . . . . . . — (25) (117)Loss on sale of discontinued operations . . . . . . . . . . . . . . . . . . . . . . . . . . . . . . . — — (35,252)
CONSOLIDATED NET INCOME . . . . . . . . . . . . . . . . . . . . . . . . . . . . . . . . . . . 387,262 599,535 639,236Net income attributable to noncontrolling interests . . . . . . . . . . . . . . . . . . . . . . . . 5,496 11,091 12,903Preferred unit requirements . . . . . . . . . . . . . . . . . . . . . . . . . . . . . . . . . . . . . . . 38,194 58,718 76,655
NET INCOME ATTRIBUTABLE TO UNITHOLDERS . . . . . . . . . . . . . . . . . . . . . . $ 343,572 $ 529,726 $ 549,678
NET INCOME ATTRIBUTABLE TO UNITHOLDERSATTRIBUTABLE TO:
General Partner . . . . . . . . . . . . . . . . . . . . . . . . . . . . . . . . . . . . . . . . . . . $ 283,098 $ 422,517 $ 436,164Limited Partners . . . . . . . . . . . . . . . . . . . . . . . . . . . . . . . . . . . . . . . . . . . 60,474 107,209 113,514
Net income attributable to unitholders . . . . . . . . . . . . . . . . . . . . . . . . . . . . . $ 343,572 $ 529,726 $ 549,678
BASIC EARNINGS PER UNITIncome from continuing operations . . . . . . . . . . . . . . . . . . . . . . . . . . . . . . . $ 1.06 $ 1.88 $ 2.09Discontinued operations . . . . . . . . . . . . . . . . . . . . . . . . . . . . . . . . . . . . . . — — (0.13)
Net income attributable to unitholders . . . . . . . . . . . . . . . . . . . . . . . . . . . . . $ 1.06 $ 1.88 $ 1.96
DILUTED EARNINGS PER UNITIncome from continuing operations . . . . . . . . . . . . . . . . . . . . . . . . . . . . . . . $ 1.05 $ 1.87 $ 2.08Discontinued operations . . . . . . . . . . . . . . . . . . . . . . . . . . . . . . . . . . . . . . — — (0.13)
Net income attributable to unitholders . . . . . . . . . . . . . . . . . . . . . . . . . . . . . $ 1.05 $ 1.87 $ 1.95
Consolidated net income . . . . . . . . . . . . . . . . . . . . . . . . . . . . . . . . . . . . . . . $ 387,262 $ 599,535 $ 639,236Unrealized gain (loss) on interest rate hedge agreements . . . . . . . . . . . . . . . . . . . 1,509 (50,973) (10,760)Net (loss) gain on derivative instruments reclassified from accumulated other
comprehensive income (loss) into interest expense . . . . . . . . . . . . . . . . . . . . . . (14,754) (3,205) 902Currency translation adjustments . . . . . . . . . . . . . . . . . . . . . . . . . . . . . . . . . . (8,244) (6,953) 6,297Changes in available-for-sale securities and other . . . . . . . . . . . . . . . . . . . . . . . . 224,694 (168,619) 2,020
Comprehensive income . . . . . . . . . . . . . . . . . . . . . . . . . . . . . . . . . . . . . . . . 590,467 369,785 637,695Comprehensive income attributable to noncontrolling interests . . . . . . . . . . . . . . . 5,496 11,091 12,903Comprehensive income attributable to unitholders . . . . . . . . . . . . . . . . . . . . . . . $ 584,971 $ 358,694 $ 624,792
The accompanying notes are an integral part of these statements.
72

Simon Property Group, L.P. and SubsidiariesConsolidated Statements of Cash Flows
(Dollars in thousands)
For the Twelve Months EndedDecember 31,
2009 2008 2007
CASH FLOWS FROM OPERATING ACTIVITIES:Consolidated net income . . . . . . . . . . . . . . . . . . . . . . . . . . . . . . . . . . $ 387,262 $ 599,535 $ 639,236
Adjustments to reconcile net income to net cash provided by operatingactivities —Depreciation and amortization . . . . . . . . . . . . . . . . . . . . . . . . . . . . 1,009,490 956,827 875,284Impairment charges . . . . . . . . . . . . . . . . . . . . . . . . . . . . . . . . . . . 240,050 21,172 55,061Loss (gain) on sale of assets and interests in unconsolidated entities . . . 30,108 — (92,044)Loss on sale of discontinued operations . . . . . . . . . . . . . . . . . . . . . . — — 35,252Straight-line rent . . . . . . . . . . . . . . . . . . . . . . . . . . . . . . . . . . . . . (24,653) (33,672) (20,907)Equity in income of unconsolidated entities . . . . . . . . . . . . . . . . . . . (40,220) (32,246) (38,120)Distributions of income from unconsolidated entities . . . . . . . . . . . . . 105,318 118,665 101,998
Changes in assets and liabilities —Tenant receivables and accrued revenue, net . . . . . . . . . . . . . . . . . . . 37,465 (14,312) (40,976)Deferred costs and other assets . . . . . . . . . . . . . . . . . . . . . . . . . . . (28,089) (21,295) (70,138)Accounts payable, accrued expenses, intangibles, deferred revenues and
other liabilities . . . . . . . . . . . . . . . . . . . . . . . . . . . . . . . . . . . . 3,789 41,213 114,786
Net cash provided by operating activities . . . . . . . . . . . . . . . . . . . 1,720,520 1,635,887 1,559,432
CASH FLOWS FROM INVESTING ACTIVITIES:Acquisitions . . . . . . . . . . . . . . . . . . . . . . . . . . . . . . . . . . . . . . . . . — — (263,098)Funding of loans to related parties . . . . . . . . . . . . . . . . . . . . . . . . . . (120,000) (8,000) (2,752,400)Repayments of loans from related parties . . . . . . . . . . . . . . . . . . . . . . 8,700 35,300 2,204,400Capital expenditures, net . . . . . . . . . . . . . . . . . . . . . . . . . . . . . . . . . (376,275) (874,286) (1,017,472)Cash impact from the consolidation and de-consolidation of properties . . . — — 6,117Net proceeds from sale of partnership interest, other assets and
discontinued operations . . . . . . . . . . . . . . . . . . . . . . . . . . . . . . . . 33,106 — 56,374Investments in unconsolidated entities . . . . . . . . . . . . . . . . . . . . . . . . (107,204) (137,509) (687,327)Purchase of marketable and non-marketable securities . . . . . . . . . . . . . (132,984) (355,994) (29,644)Sale of marketable securities . . . . . . . . . . . . . . . . . . . . . . . . . . . . . . 74,116 8,997 16,989Distributions of capital from unconsolidated entities and other . . . . . . . . 201,550 309,217 416,485
Net cash used in investing activities . . . . . . . . . . . . . . . . . . . . . . (418,991) (1,022,275) (2,049,576)
CASH FLOWS FROM FINANCING ACTIVITIES:Issuance of units . . . . . . . . . . . . . . . . . . . . . . . . . . . . . . . . . . . . . . 1,642,228 11,106 156,710Purchase of preferred units and partnership units . . . . . . . . . . . . . . . . . — (16,009) (83,993)Preferred unit redemptions . . . . . . . . . . . . . . . . . . . . . . . . . . . . . . . (87,689) (1,845) (300,468)Distributions to noncontrolling interest holders in properties . . . . . . . . . (30,706) (28,251) (91,032)Contributions from noncontrolling interest holders in properties . . . . . . . 2,795 4,005 2,903Partnership distributions . . . . . . . . . . . . . . . . . . . . . . . . . . . . . . . . . (186,050) (1,075,895) (1,020,674)Mortgage and other indebtedness proceeds, net of transaction costs . . . . . 3,220,706 4,456,975 5,577,083Mortgage and other indebtedness principal payments . . . . . . . . . . . . . . (2,678,639) (3,692,136) (4,177,763)
Net cash provided by (used in) financing activities . . . . . . . . . . . . . 1,882,645 (342,050) 62,766
INCREASE (DECREASE) IN CASH AND CASH EQUIVALENTS . . . . . . . . . 3,184,174 271,562 (427,378)
CASH AND CASH EQUIVALENTS, beginning of year . . . . . . . . . . . . . . . . 773,544 501,982 929,360
CASH AND CASH EQUIVALENTS, end of year . . . . . . . . . . . . . . . . . . . . . $ 3,957,718 $ 773,544 $ 501,982
The accompanying notes are an integral part of these statements.
73
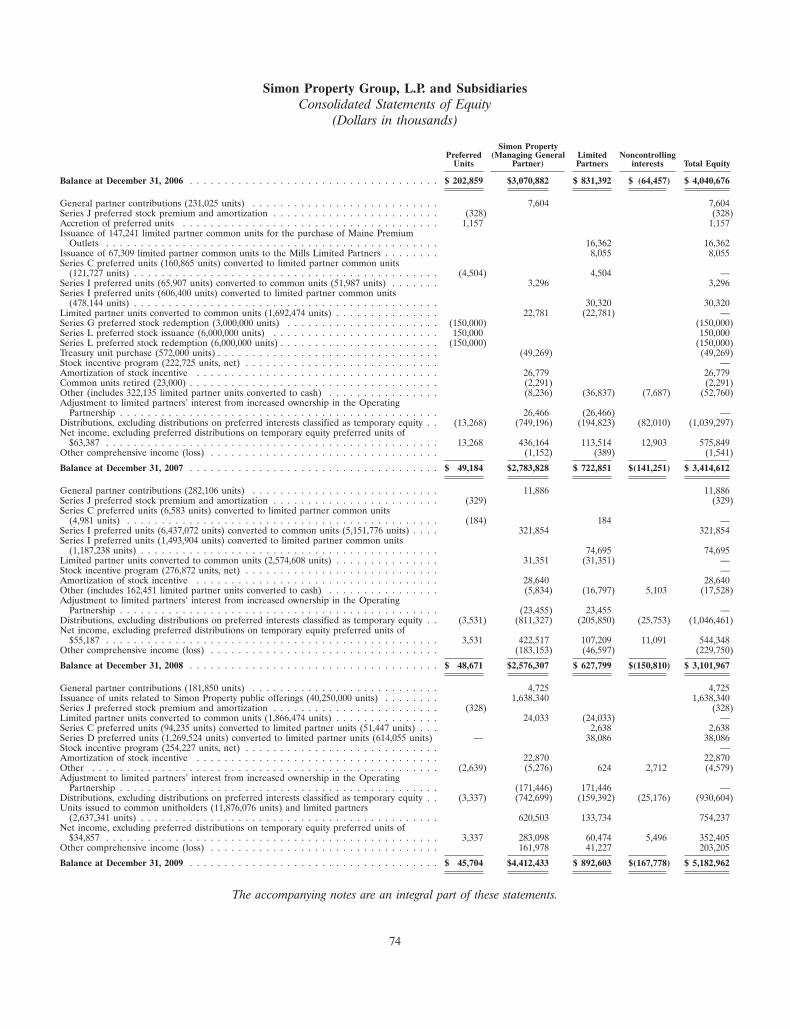
Simon Property Group, L.P. and SubsidiariesConsolidated Statements of Equity
(Dollars in thousands)
Simon PropertyPreferred (Managing General Limited Noncontrolling
Units Partner) Partners interests Total Equity
Balance at December 31, 2006 . . . . . . . . . . . . . . . . . . . . . . . . . . . . . . . . . . . . $ 202,859 $3,070,882 $ 831,392 $ (64,457) $ 4,040,676
General partner contributions (231,025 units) . . . . . . . . . . . . . . . . . . . . . . . . . . . 7,604 7,604Series J preferred stock premium and amortization . . . . . . . . . . . . . . . . . . . . . . . . (328) (328)Accretion of preferred units . . . . . . . . . . . . . . . . . . . . . . . . . . . . . . . . . . . . . 1,157 1,157Issuance of 147,241 limited partner common units for the purchase of Maine Premium
Outlets . . . . . . . . . . . . . . . . . . . . . . . . . . . . . . . . . . . . . . . . . . . . . . . . 16,362 16,362Issuance of 67,309 limited partner common units to the Mills Limited Partners . . . . . . . . 8,055 8,055Series C preferred units (160,865 units) converted to limited partner common units
(121,727 units) . . . . . . . . . . . . . . . . . . . . . . . . . . . . . . . . . . . . . . . . . . . . (4,504) 4,504 —Series I preferred units (65,907 units) converted to common units (51,987 units) . . . . . . . 3,296 3,296Series I preferred units (606,400 units) converted to limited partner common units
(478,144 units) . . . . . . . . . . . . . . . . . . . . . . . . . . . . . . . . . . . . . . . . . . . . 30,320 30,320Limited partner units converted to common units (1,692,474 units) . . . . . . . . . . . . . . . 22,781 (22,781) —Series G preferred stock redemption (3,000,000 units) . . . . . . . . . . . . . . . . . . . . . . (150,000) (150,000)Series L preferred stock issuance (6,000,000 units) . . . . . . . . . . . . . . . . . . . . . . . . 150,000 150,000Series L preferred stock redemption (6,000,000 units) . . . . . . . . . . . . . . . . . . . . . . . (150,000) (150,000)Treasury unit purchase (572,000 units) . . . . . . . . . . . . . . . . . . . . . . . . . . . . . . . . (49,269) (49,269)Stock incentive program (222,725 units, net) . . . . . . . . . . . . . . . . . . . . . . . . . . . . —Amortization of stock incentive . . . . . . . . . . . . . . . . . . . . . . . . . . . . . . . . . . . 26,779 26,779Common units retired (23,000) . . . . . . . . . . . . . . . . . . . . . . . . . . . . . . . . . . . . (2,291) (2,291)Other (includes 322,135 limited partner units converted to cash) . . . . . . . . . . . . . . . . (8,236) (36,837) (7,687) (52,760)Adjustment to limited partners’ interest from increased ownership in the Operating
Partnership . . . . . . . . . . . . . . . . . . . . . . . . . . . . . . . . . . . . . . . . . . . . . . 26,466 (26,466) —Distributions, excluding distributions on preferred interests classified as temporary equity . . (13,268) (749,196) (194,823) (82,010) (1,039,297)Net income, excluding preferred distributions on temporary equity preferred units of
$63,387 . . . . . . . . . . . . . . . . . . . . . . . . . . . . . . . . . . . . . . . . . . . . . . . . 13,268 436,164 113,514 12,903 575,849Other comprehensive income (loss) . . . . . . . . . . . . . . . . . . . . . . . . . . . . . . . . . (1,152) (389) (1,541)
Balance at December 31, 2007 . . . . . . . . . . . . . . . . . . . . . . . . . . . . . . . . . . . . $ 49,184 $2,783,828 $ 722,851 $(141,251) $ 3,414,612
General partner contributions (282,106 units) . . . . . . . . . . . . . . . . . . . . . . . . . . . 11,886 11,886Series J preferred stock premium and amortization . . . . . . . . . . . . . . . . . . . . . . . . (329) (329)Series C preferred units (6,583 units) converted to limited partner common units
(4,981 units) . . . . . . . . . . . . . . . . . . . . . . . . . . . . . . . . . . . . . . . . . . . . . (184) 184 —Series I preferred units (6,437,072 units) converted to common units (5,151,776 units) . . . . 321,854 321,854Series I preferred units (1,493,904 units) converted to limited partner common units
(1,187,238 units) . . . . . . . . . . . . . . . . . . . . . . . . . . . . . . . . . . . . . . . . . . . 74,695 74,695Limited partner units converted to common units (2,574,608 units) . . . . . . . . . . . . . . . 31,351 (31,351) —Stock incentive program (276,872 units, net) . . . . . . . . . . . . . . . . . . . . . . . . . . . . —Amortization of stock incentive . . . . . . . . . . . . . . . . . . . . . . . . . . . . . . . . . . . 28,640 28,640Other (includes 162,451 limited partner units converted to cash) . . . . . . . . . . . . . . . . (5,834) (16,797) 5,103 (17,528)Adjustment to limited partners’ interest from increased ownership in the Operating
Partnership . . . . . . . . . . . . . . . . . . . . . . . . . . . . . . . . . . . . . . . . . . . . . . (23,455) 23,455 —Distributions, excluding distributions on preferred interests classified as temporary equity . . (3,531) (811,327) (205,850) (25,753) (1,046,461)Net income, excluding preferred distributions on temporary equity preferred units of
$55,187 . . . . . . . . . . . . . . . . . . . . . . . . . . . . . . . . . . . . . . . . . . . . . . . . 3,531 422,517 107,209 11,091 544,348Other comprehensive income (loss) . . . . . . . . . . . . . . . . . . . . . . . . . . . . . . . . . (183,153) (46,597) (229,750)
Balance at December 31, 2008 . . . . . . . . . . . . . . . . . . . . . . . . . . . . . . . . . . . . $ 48,671 $2,576,307 $ 627,799 $(150,810) $ 3,101,967
General partner contributions (181,850 units) . . . . . . . . . . . . . . . . . . . . . . . . . . . 4,725 4,725Issuance of units related to Simon Property public offerings (40,250,000 units) . . . . . . . . 1,638,340 1,638,340Series J preferred stock premium and amortization . . . . . . . . . . . . . . . . . . . . . . . . (328) (328)Limited partner units converted to common units (1,866,474 units) . . . . . . . . . . . . . . . 24,033 (24,033) —Series C preferred units (94,235 units) converted to limited partner units (51,447 units) . . . 2,638 2,638Series D preferred units (1,269,524 units) converted to limited partner units (614,055 units) — 38,086 38,086Stock incentive program (254,227 units, net) . . . . . . . . . . . . . . . . . . . . . . . . . . . . —Amortization of stock incentive . . . . . . . . . . . . . . . . . . . . . . . . . . . . . . . . . . . 22,870 22,870Other . . . . . . . . . . . . . . . . . . . . . . . . . . . . . . . . . . . . . . . . . . . . . . . . . . (2,639) (5,276) 624 2,712 (4,579)Adjustment to limited partners’ interest from increased ownership in the Operating
Partnership . . . . . . . . . . . . . . . . . . . . . . . . . . . . . . . . . . . . . . . . . . . . . . (171,446) 171,446 —Distributions, excluding distributions on preferred interests classified as temporary equity . . (3,337) (742,699) (159,392) (25,176) (930,604)Units issued to common unitholders (11,876,076 units) and limited partners
(2,637,341 units) . . . . . . . . . . . . . . . . . . . . . . . . . . . . . . . . . . . . . . . . . . . 620,503 133,734 754,237Net income, excluding preferred distributions on temporary equity preferred units of
$34,857 . . . . . . . . . . . . . . . . . . . . . . . . . . . . . . . . . . . . . . . . . . . . . . . . 3,337 283,098 60,474 5,496 352,405Other comprehensive income (loss) . . . . . . . . . . . . . . . . . . . . . . . . . . . . . . . . . 161,978 41,227 203,205
Balance at December 31, 2009 . . . . . . . . . . . . . . . . . . . . . . . . . . . . . . . . . . . . $ 45,704 $4,412,433 $ 892,603 $(167,778) $ 5,182,962
The accompanying notes are an integral part of these statements.
74
Simon Property Group, L.P. and Subsidiaries
Notes to Consolidated Financial Statements
(Dollars in thousands, except unit and per unit amounts and where indicated as in millions or billions)
1. Organization
Simon Property Group, L.P. is a Delaware limited partnership and the majority-owned subsidiary of SimonProperty Group, Inc. In these notes to consolidated financial statements, the terms ‘‘Operating Partnership’’, ‘‘we’’,‘‘us’’ and ‘‘our’’ refer to Simon Property Group, L.P., and its subsidiaries and the term ‘‘Simon Property’’ refers toSimon Property Group, Inc. Simon Property is a self-administered and self-managed real estate investment trust(‘‘REIT’’) under the Internal Revenue Code of 1986, as amended (the ‘‘Code’’). Pursuant to our partnershipagreement, we are required to pay all expenses of Simon Property.
We own, develop and manage retail real estate properties, which consist primarily of regional malls, PremiumOutlet� centers, The Mills�, and community/lifestyle centers. As of December 31, 2009, we owned or held an interestin 321 income-producing properties in the United States, which consisted of 162 regional malls, 41 Premium Outletcenters, 67 community/lifestyle centers, 36 properties acquired in the 2007 acquisition of The Mills Corporation, or theMills acquisition, and 15 other shopping centers or outlet centers in 41 states and Puerto Rico. Of the 36 propertiesacquired in the Mills portfolio, 16 of these properties are The Mills, 16 are regional malls, and four are communitycenters. We also own an interest in one parcel of land held in the United States for future development.Internationally, as of December 31, 2009, we had ownership interests in 51 European shopping centers (France, Italyand Poland), eight Premium Outlet centers in Japan, one Premium Outlet center in Mexico, and one Premium Outletcenter in South Korea. Also, through joint venture arrangements we have a 24% interest in two shopping centers inItaly currently under development.
We generate the majority of our revenues from leases with retail tenants including:
• Base minimum rents,• Overage and percentage rents based on tenants’ sales volume, and• Recoveries of substantially all of our recoverable expenditures, which consist of property operating, real
estate tax, repairs and maintenance, and advertising and promotional expenditures.
Revenues of our management company, after intercompany eliminations, consist primarily of management feesthat are typically based upon the revenues of the property being managed.
We also generate supplemental revenue from the following activities:
• Establishing our malls as leading market resource providers for retailers and other businesses and consumer-focused corporate alliances including payment systems (such as handling fees relating to the sales ofbank-issued prepaid cards), national marketing alliances, static and digital media initiatives, businessdevelopment, sponsorship, and events,
• Offering property operating services for major capital expenditures such as roofing, parking lots and energysystems,
• Selling or leasing land adjacent to our shopping center properties, commonly referred to as ‘‘outlots’’ or‘‘outparcels,’’ and
• Generating interest income on cash deposits and loans made to related entities.
2. Basis of Presentation and Consolidation
The accompanying consolidated financial statements include the accounts of all majority-owned subsidiaries,and all significant intercompany amounts have been eliminated.
We consolidate properties that are wholly owned or properties that we own less than 100% but we control.Control of a property is demonstrated by, among other factors, our ability to:
• manage day-to-day operations,• refinance debt and sell the property without the consent of any other partner or owner, and• the inability of any other partner or owner to replace us.
75
Simon Property Group, L.P. and Subsidiaries
Notes to Consolidated Financial Statements (Continued)
(Dollars in thousands, except unit and per unit amounts and where indicated as in millions or billions)
2. Basis of Presentation and Consolidation (Continued)
We also consolidate a variable interest entity, or VIE, when we are determined to be the primary beneficiary.Our determination of the primary beneficiary of a VIE considers all relationships between us and the VIE, includingmanagement agreements and other contractual arrangements, when determining the party obligated to absorb themajority of the expected losses, as defined, by accounting standards. There have been no changes during 2009 inconclusions about whether an entity qualifies as a VIE or whether we are the primary beneficiary of any previouslyidentified VIE. During 2009, we did not provide financial or other support to a previously identified VIE that we werenot previously contractually obligated to provide.
Investments in partnerships and joint ventures represent our noncontrolling ownership interests in properties.We account for these investments using the equity method of accounting. We initially record these investments at costand we subsequently adjust for net equity in income or loss, which we allocate in accordance with the provisions of theapplicable partnership or joint venture agreement, and cash contributions and distributions. The allocation provisionsin the partnership or joint venture agreements are not always consistent with the legal ownership interests held by eachgeneral or limited partner or joint venture investee primarily due to partner preferences. We separately reportinvestments in joint ventures for which accumulated distributions have exceeded investments in and our share of netincome of the joint ventures within ‘‘Cash distributions and losses in partnerships and joint ventures, at equity’’ in theconsolidated balance sheets. The net equity of certain joint ventures is less than zero because of financing or operatingdistributions that are usually greater than net income, as net income includes non-cash charges for depreciation andamortization.
As of December 31, 2009, we consolidated 200 wholly-owned properties and 18 additional properties that areless than wholly-owned, but which we control or for which we are the primary beneficiary. We account for theremaining 164 properties using the equity method of accounting (joint venture properties). We manage the day-to-dayoperations of 93 of the 164 joint venture properties but have determined that our partner or partners have substantiveparticipating rights in regards to the assets and operations of these joint venture properties. Our investments in jointventures in Europe, Japan, Mexico and Korea comprise 61 of the remaining 71 properties. The internationalproperties are managed by joint ventures in which we share oversight responsibility with our partner. Additionally, weaccount for our investment in SPG-FCM Ventures, LLC, or SPG-FCM, which acquired The Mills Corporation and itsmajority-owned subsidiary, The Mills Limited Partnership, or collectively Mills, in April 2007, using the equity methodof accounting. We have determined that SPG-FCM is not a VIE and that Farallon Capital Management, L.L.C., orFarallon, our joint venture partner, has substantive participating rights with respect to the assets and operations ofSPG-FCM pursuant to the applicable partnership agreements.
We allocate our net operating results after preferred distributions based on our partners’ respective ownership.In addition, Simon Property owns series of our preferred units that have terms comparable to outstanding shares ofSimon Property preferred stock. Simon Property’s weighted average ownership interest in us was as follows:
For the Year EndedDecember 31,
2009 2008 2007
Weighted average ownership interest 82.4% 79.8% 79.4%
As of December 31, 2009 and 2008, Simon Property’s ownership interest was 83.2% and 80.4%, respectively.We adjust the limited partners’ interest at the end of each period to reflect their ownership interest.
Reclassifications
We made certain reclassifications of prior period amounts in the consolidated financial statements to conformto the 2009 presentation. These reclassifications had no impact on previously reported net income available tocommon unitholders or earnings per unit.
76
Simon Property Group, L.P. and Subsidiaries
Notes to Consolidated Financial Statements (Continued)
(Dollars in thousands, except unit and per unit amounts and where indicated as in millions or billions)
3. Summary of Significant Accounting Policies
Investment Properties
We record investment properties at cost. Investment properties include costs of acquisitions; development,predevelopment, and construction (including allocable salaries and related benefits); tenant allowances andimprovements; and interest and real estate taxes incurred during construction. We capitalize improvements andreplacements from repair and maintenance when the repair and maintenance extends the useful life, increasescapacity, or improves the efficiency of the asset. All other repair and maintenance items are expensed as incurred. Wecapitalize interest on projects during periods of construction until the projects are ready for their intended purposebased on interest rates in place during the construction period. The amount of interest capitalized during each year isas follows:
For the Year EndedDecember 31,
2009 2008 2007
Capitalized interest $14,502 $27,847 $35,793
We record depreciation on buildings and improvements utilizing the straight-line method over an estimatedoriginal useful life, which is generally 10 to 40 years. We review depreciable lives of investment properties periodicallyand we make adjustments when necessary to reflect a shorter economic life. We amortize tenant allowances, tenantinducements and tenant improvements utilizing the straight-line method over the term of the related lease oroccupancy term of the tenant, if shorter. We record depreciation on equipment and fixtures utilizing the straight-linemethod over seven to ten years.
We review investment properties for impairment on a property-by-property basis whenever events or changes incircumstances indicate that the carrying value of investment properties may not be recoverable. These circumstancesinclude, but are not limited to, declines in cash flows, occupancy and comparable sales per square foot at the property.We measure any impairment of investment property when the estimated undiscounted operating income beforedepreciation and amortization plus its residual value is less than the carrying value of the property. To the extentimpairment has occurred, we charge to income the excess of carrying value of the property over its estimated fairvalue. We estimate fair value using unobservable market data such as operating income, estimated capitalization rates,or multiples, leasing prospects and local market information. We may decide to sell properties that are held for use andthe sale prices of these properties may differ from their carrying values. We also review our investments includinginvestments in unconsolidated entities if events or circumstances change indicating that the carrying amount of ourinvestments may not be recoverable. We will record an impairment charge if we determine that a decline in the fairvalue of the investments is other-than-temporary.
Certain of our real estate assets contain asbestos. The asbestos is appropriately contained, in accordance withcurrent environmental regulations, and we have no current plans to remove the asbestos. If these properties weredemolished, certain environmental regulations are in place which specify the manner in which the asbestos must behandled and disposed. Because the obligation to remove the asbestos has an indeterminable settlement date, we arenot able to reasonably estimate the fair value of this obligation.
Purchase Accounting Allocation
We allocate the purchase price of acquisitions to the various components of the acquisition based upon the fairvalue of each component which may be derived from various observable or unobservable inputs and assumptions. Also,we may utilize third party valuation specialists. These components typically include buildings, land and intangiblesrelated to in-place leases and we estimate:
• the fair value of land and related improvements and buildings on an as-if-vacant basis.
77
Simon Property Group, L.P. and Subsidiaries
Notes to Consolidated Financial Statements (Continued)
(Dollars in thousands, except unit and per unit amounts and where indicated as in millions or billions)
3. Summary of Significant Accounting Policies (Continued)
• the market value of in-place leases based upon our best estimate of current market rents and amortize theresulting market rent adjustment into revenues.
• the value of costs to obtain tenants, including tenant allowances and improvements and leasing commissions.• the value of revenue and recovery of costs foregone during a reasonable lease-up period, as if the space was
vacant.
Amounts allocated to building are depreciated over the estimated remaining life of the acquired building orrelated improvements. We amortize amounts allocated to tenant improvements, in-place lease assets and other lease-related intangibles over the remaining life of the underlying leases. We also estimate the value of other acquiredintangible assets, if any, which are amortized over the remaining life of the underlying related leases or intangibles.
Discontinued Operations
We reclassify any material operations and gains or losses on disposal related to consolidated properties soldduring the period to discontinued operations. During 2007, we reported the net loss upon sale on five consolidatedassets sold in ‘‘Loss on sale of discontinued operations’’ in the consolidated statements of operations andcomprehensive income. The operating results of the assets disposed of in 2007 were not significant to our consolidatedresults of operations. There were no consolidated assets sold during 2008. During 2009, we reported the net loss ofapproximately $9.8 million upon the sale of four consolidated assets in ‘‘(Loss) gain on sales of assets and interests inunconsolidated entities’’ in the consolidated statements of operations and comprehensive income. The loss on theseassets and the operating results were not significant to our consolidated results of operations.
Cash and Cash Equivalents
We consider all highly liquid investments purchased with an original maturity of 90 days or less to be cash andcash equivalents. Cash equivalents are carried at cost, which approximates fair value. Cash equivalents generallyconsist of commercial paper, bankers acceptances, Eurodollars, repurchase agreements, and money markets. Our giftcard programs are administered by banks. We collect gift card funds at the point of sale and then remit those funds tothe banks for further processing. As a result, cash and cash equivalents, as of December 31, 2009 and 2008, includes abalance of $38.1 million and $29.8 million, respectively, related to these gift card programs which we do not consideravailable for general working capital purposes. Financial instruments that potentially subject us to concentrations ofcredit risk include our cash and cash equivalents and our trade accounts receivable. We place our cash and cashequivalents with institutions with high credit quality. However, at certain times, such cash and cash equivalents may bein excess of FDIC and SIPC insurance limits. See Notes 4, 8, and 10 for disclosures about non-cash investing andfinancing transactions.
Marketable and Non-Marketable Securities
Marketable securities consist primarily of the investments of our captive insurance subsidiaries, our investmentin shares of stock of Liberty International PLC, or Liberty, our deferred compensation plan investments, and certaininvestments held to fund the debt service requirements of debt previously secured by investment properties that havebeen sold.
The types of securities included in the investment portfolio of our captive insurance subsidiaries typicallyinclude U.S. Treasury or other U.S. government securities as well as corporate debt securities with maturities rangingfrom less than 1 to 10 years. These securities are classified as available-for-sale and are valued based upon quotedmarket prices or other observable inputs when quoted market prices are not available. The amortized cost of debtsecurities, which approximates fair value, held by our captive insurance subsidiaries is adjusted for amortization ofpremiums and accretion of discounts to maturity. Our investment in Liberty is also accounted for as anavailable-for-sale security. Liberty operates regional shopping centers and is the owner of other retail assetsthroughout the United Kingdom, as well as certain real estate assets in the U.S. Our interest in Liberty is adjusted to
78
Simon Property Group, L.P. and Subsidiaries
Notes to Consolidated Financial Statements (Continued)
(Dollars in thousands, except unit and per unit amounts and where indicated as in millions or billions)
3. Summary of Significant Accounting Policies (Continued)
their quoted market price, including a related foreign exchange component. Changes in the values of these securitiesare recognized in accumulated other comprehensive loss until the gain or loss is realized or until any unrealized loss isdeemed to be other-than-temporary. We review any declines in value of these securities for other-than-temporaryimpairment and consider the severity and duration of any decline in value. To the extent an other-than-temporaryimpairment is deemed to have occurred, an impairment charge is recorded and a new cost basis is established.Subsequent changes are then recognized through other comprehensive income unless another other-than-temporaryimpairment is deemed to have occurred.
During 2009, we recognized a non-cash charge of $140.5 million, or $0.44 per diluted unit, representing another-than-temporary impairment in fair value below the carrying value of our investment in Liberty. At June 30 andDecember 31, 2009, we owned 35.4 million shares at a weighted average original cost per share of £5.74. As of June 30and December 31, 2009, Liberty’s quoted market price was £3.97 and £5.15 per share, respectively. As a result of thesignificance and duration of the decline in the total share price at June 30, 2009, including currency revaluations, wedeemed the decline in value as other-than-temporary impairment establishing a new cost basis of our investment inLiberty. As a result, changes in available-for-sale securities and other in the 2009 consolidated statement of operationsand comprehensive income include the reclassification of $140.5 million from accumulated other comprehensive lossto earnings related to this non-cash charge. Prior to the quarter ending June 30, 2009, the changes in value of ourLiberty investment were reflected in other comprehensive income. Effective July 1, 2009, we resumed marking tomarket our Liberty investment through other comprehensive income. The resulting mark-to-market adjustment atDecember 31, 2009 was an increase in the carrying value of Liberty of $58.2 million with a corresponding adjustment inother comprehensive income.
Our insurance subsidiaries are required to maintain statutory minimum capital and surplus as well as maintain aminimum liquidity ratio. Therefore, our access to these securities may be limited. Our deferred compensation planinvestments are classified as trading securities and are valued based upon quoted market prices. The investments havea matching liability recorded as the amounts are fully payable to the employees that earned the compensation.Changes in the values of these securities and changes to the matching liability to employees are both recognized inearnings and as a result the impact to consolidated net income is zero. As of December 31, 2009 and 2008, we haveinvestments of $51.7 million and $53.4 million, respectively, which must be used to fund the debt service requirementsof debt related to investment properties sold. These investments are classified as held-to-maturity and are recorded atamortized cost as we have the ability and intent to hold these investments to maturity.
During 2008, we made an investment of $70 million in a non-marketable security that we account for under thecost method. To the extent an other-than-temporary decline in fair value is deemed to have occurred, we would adjustthis investment to its estimated fair value.
Net unrealized gains as of December 31, 2009 were approximately $59.4 million and represented the valuationand related currency adjustments for our marketable securities. As of December 31, 2009, other than the adjustmentrelated to our investment in Liberty recorded during the second quarter, we do not consider any decline in value of anyof our other marketable and non-marketable securities to be an other-than-temporary impairment, as these marketvalue declines, if any, are not significant, have existed for a short period of time, and, in the case of debt securities, wehave the ability and intent to hold these securities to maturity.
Fair Value Measurements
We hold marketable securities that total $464.1 million at December 31, 2009, and are considered to haveLevel 1 fair value inputs. In addition, we have derivative instruments which are classified as having Level 2 inputswhich consist primarily of interest rate swap agreements with a gross liability balance of $13.0 million and a gross assetbalance of $0.3 million and interest rate cap agreements with a minimal asset value. Level 1 fair value inputs arequoted prices for identical items in active, liquid and visible markets such as stock exchanges. Level 2 fair value inputsare observable information for similar items in active or inactive markets, and appropriately consider counterparty
79
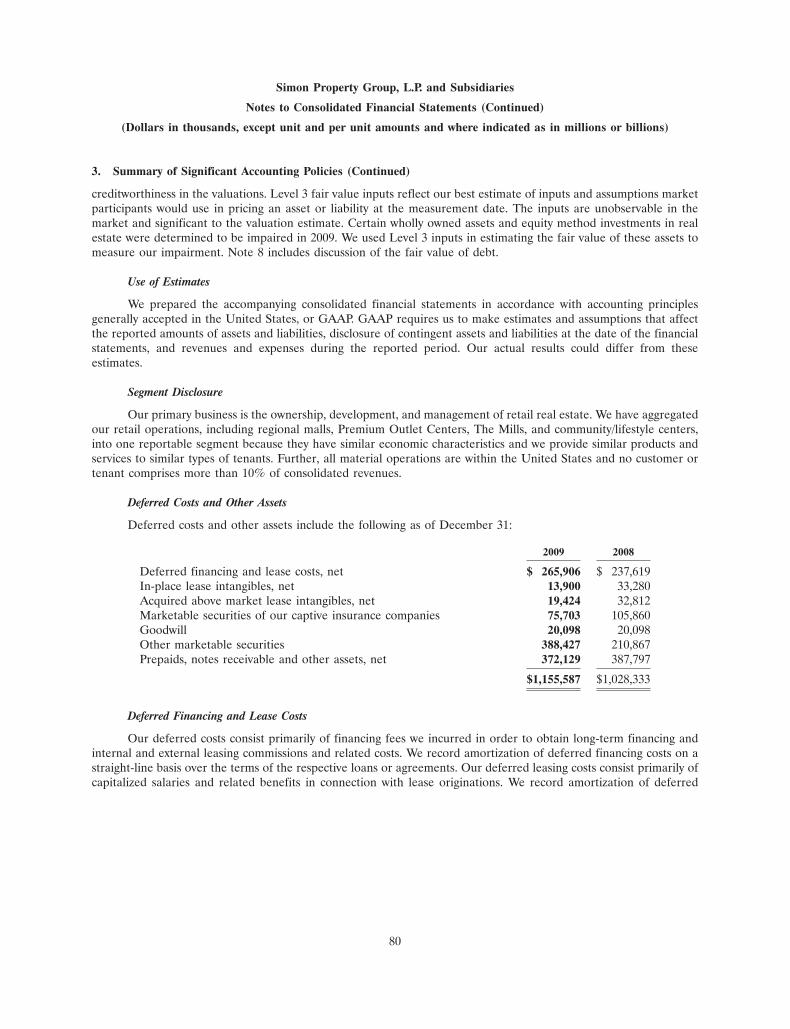
Simon Property Group, L.P. and Subsidiaries
Notes to Consolidated Financial Statements (Continued)
(Dollars in thousands, except unit and per unit amounts and where indicated as in millions or billions)
3. Summary of Significant Accounting Policies (Continued)
creditworthiness in the valuations. Level 3 fair value inputs reflect our best estimate of inputs and assumptions marketparticipants would use in pricing an asset or liability at the measurement date. The inputs are unobservable in themarket and significant to the valuation estimate. Certain wholly owned assets and equity method investments in realestate were determined to be impaired in 2009. We used Level 3 inputs in estimating the fair value of these assets tomeasure our impairment. Note 8 includes discussion of the fair value of debt.
Use of Estimates
We prepared the accompanying consolidated financial statements in accordance with accounting principlesgenerally accepted in the United States, or GAAP. GAAP requires us to make estimates and assumptions that affectthe reported amounts of assets and liabilities, disclosure of contingent assets and liabilities at the date of the financialstatements, and revenues and expenses during the reported period. Our actual results could differ from theseestimates.
Segment Disclosure
Our primary business is the ownership, development, and management of retail real estate. We have aggregatedour retail operations, including regional malls, Premium Outlet Centers, The Mills, and community/lifestyle centers,into one reportable segment because they have similar economic characteristics and we provide similar products andservices to similar types of tenants. Further, all material operations are within the United States and no customer ortenant comprises more than 10% of consolidated revenues.
Deferred Costs and Other Assets
Deferred costs and other assets include the following as of December 31:
2009 2008
Deferred financing and lease costs, net $ 265,906 $ 237,619In-place lease intangibles, net 13,900 33,280Acquired above market lease intangibles, net 19,424 32,812Marketable securities of our captive insurance companies 75,703 105,860Goodwill 20,098 20,098Other marketable securities 388,427 210,867Prepaids, notes receivable and other assets, net 372,129 387,797
$1,155,587 $1,028,333
Deferred Financing and Lease Costs
Our deferred costs consist primarily of financing fees we incurred in order to obtain long-term financing andinternal and external leasing commissions and related costs. We record amortization of deferred financing costs on astraight-line basis over the terms of the respective loans or agreements. Our deferred leasing costs consist primarily ofcapitalized salaries and related benefits in connection with lease originations. We record amortization of deferred
80
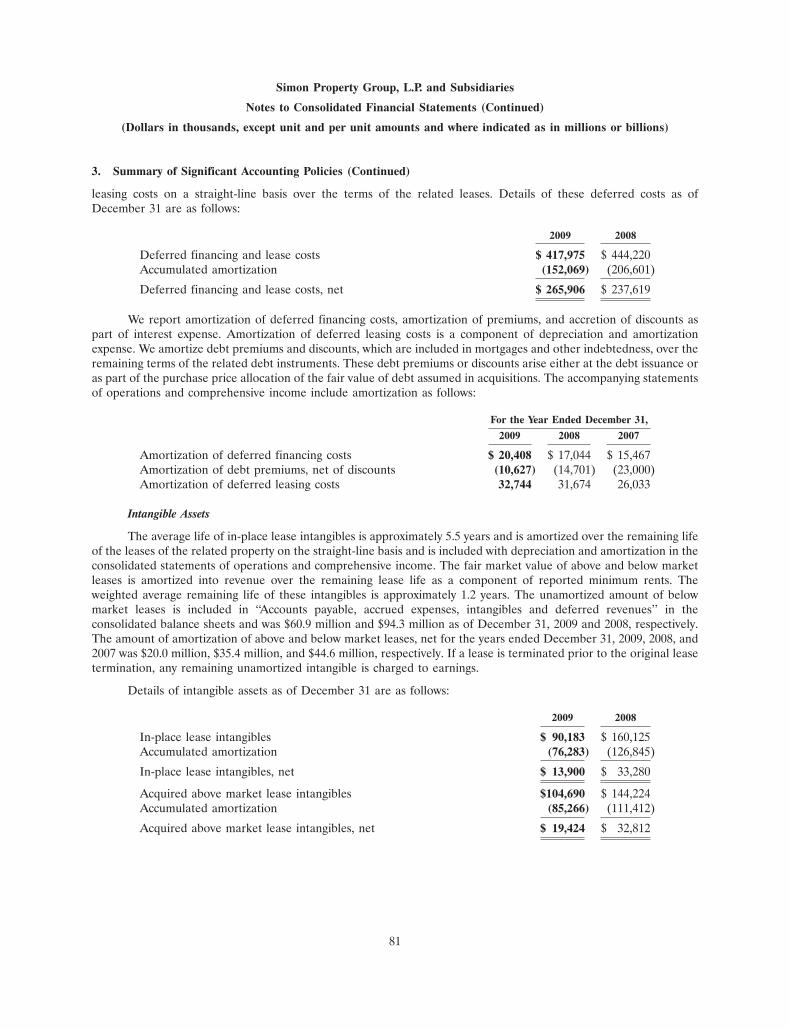
Simon Property Group, L.P. and Subsidiaries
Notes to Consolidated Financial Statements (Continued)
(Dollars in thousands, except unit and per unit amounts and where indicated as in millions or billions)
3. Summary of Significant Accounting Policies (Continued)
leasing costs on a straight-line basis over the terms of the related leases. Details of these deferred costs as ofDecember 31 are as follows:
2009 2008
Deferred financing and lease costs $ 417,975 $ 444,220Accumulated amortization (152,069) (206,601)
Deferred financing and lease costs, net $ 265,906 $ 237,619
We report amortization of deferred financing costs, amortization of premiums, and accretion of discounts aspart of interest expense. Amortization of deferred leasing costs is a component of depreciation and amortizationexpense. We amortize debt premiums and discounts, which are included in mortgages and other indebtedness, over theremaining terms of the related debt instruments. These debt premiums or discounts arise either at the debt issuance oras part of the purchase price allocation of the fair value of debt assumed in acquisitions. The accompanying statementsof operations and comprehensive income include amortization as follows:
For the Year Ended December 31,
2009 2008 2007
Amortization of deferred financing costs $ 20,408 $ 17,044 $ 15,467Amortization of debt premiums, net of discounts (10,627) (14,701) (23,000)Amortization of deferred leasing costs 32,744 31,674 26,033
Intangible Assets
The average life of in-place lease intangibles is approximately 5.5 years and is amortized over the remaining lifeof the leases of the related property on the straight-line basis and is included with depreciation and amortization in theconsolidated statements of operations and comprehensive income. The fair market value of above and below marketleases is amortized into revenue over the remaining lease life as a component of reported minimum rents. Theweighted average remaining life of these intangibles is approximately 1.2 years. The unamortized amount of belowmarket leases is included in ‘‘Accounts payable, accrued expenses, intangibles and deferred revenues’’ in theconsolidated balance sheets and was $60.9 million and $94.3 million as of December 31, 2009 and 2008, respectively.The amount of amortization of above and below market leases, net for the years ended December 31, 2009, 2008, and2007 was $20.0 million, $35.4 million, and $44.6 million, respectively. If a lease is terminated prior to the original leasetermination, any remaining unamortized intangible is charged to earnings.
Details of intangible assets as of December 31 are as follows:
2009 2008
In-place lease intangibles $ 90,183 $ 160,125Accumulated amortization (76,283) (126,845)
In-place lease intangibles, net $ 13,900 $ 33,280
Acquired above market lease intangibles $104,690 $ 144,224Accumulated amortization (85,266) (111,412)
Acquired above market lease intangibles, net $ 19,424 $ 32,812
81
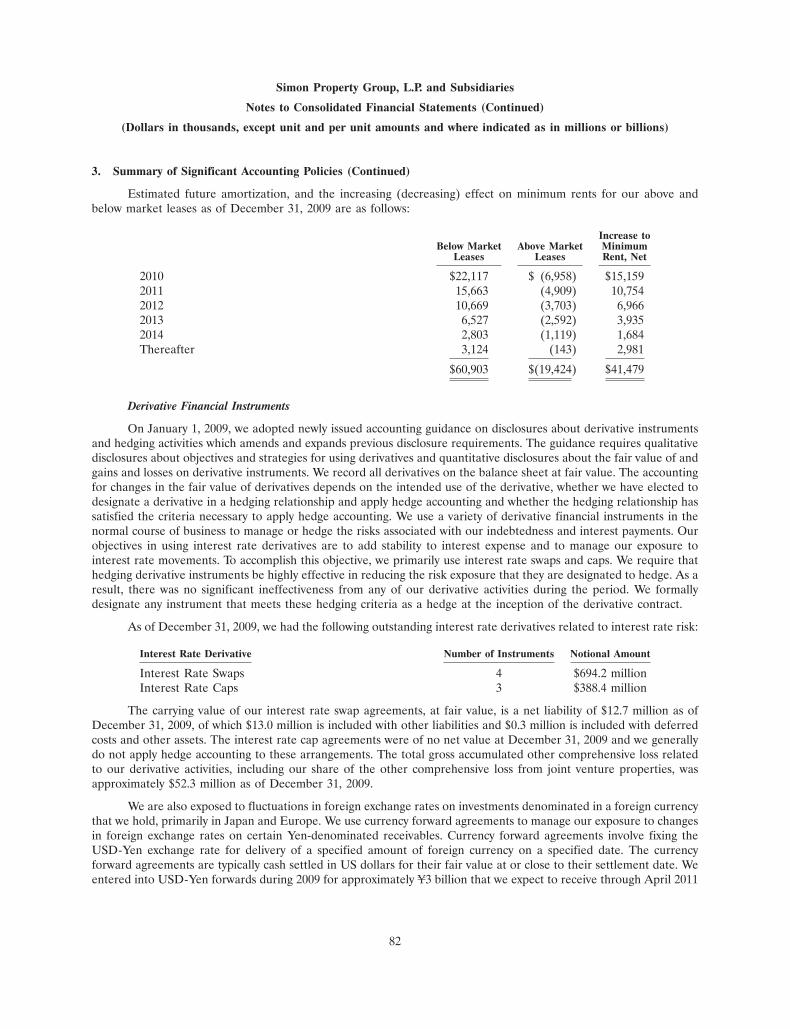
Simon Property Group, L.P. and Subsidiaries
Notes to Consolidated Financial Statements (Continued)
(Dollars in thousands, except unit and per unit amounts and where indicated as in millions or billions)
3. Summary of Significant Accounting Policies (Continued)
Estimated future amortization, and the increasing (decreasing) effect on minimum rents for our above andbelow market leases as of December 31, 2009 are as follows:
Increase toBelow Market Above Market Minimum
Leases Leases Rent, Net
2010 $22,117 $ (6,958) $15,1592011 15,663 (4,909) 10,7542012 10,669 (3,703) 6,9662013 6,527 (2,592) 3,9352014 2,803 (1,119) 1,684Thereafter 3,124 (143) 2,981
$60,903 $(19,424) $41,479
Derivative Financial Instruments
On January 1, 2009, we adopted newly issued accounting guidance on disclosures about derivative instrumentsand hedging activities which amends and expands previous disclosure requirements. The guidance requires qualitativedisclosures about objectives and strategies for using derivatives and quantitative disclosures about the fair value of andgains and losses on derivative instruments. We record all derivatives on the balance sheet at fair value. The accountingfor changes in the fair value of derivatives depends on the intended use of the derivative, whether we have elected todesignate a derivative in a hedging relationship and apply hedge accounting and whether the hedging relationship hassatisfied the criteria necessary to apply hedge accounting. We use a variety of derivative financial instruments in thenormal course of business to manage or hedge the risks associated with our indebtedness and interest payments. Ourobjectives in using interest rate derivatives are to add stability to interest expense and to manage our exposure tointerest rate movements. To accomplish this objective, we primarily use interest rate swaps and caps. We require thathedging derivative instruments be highly effective in reducing the risk exposure that they are designated to hedge. As aresult, there was no significant ineffectiveness from any of our derivative activities during the period. We formallydesignate any instrument that meets these hedging criteria as a hedge at the inception of the derivative contract.
As of December 31, 2009, we had the following outstanding interest rate derivatives related to interest rate risk:
Interest Rate Derivative Number of Instruments Notional Amount
Interest Rate Swaps 4 $694.2 millionInterest Rate Caps 3 $388.4 million
The carrying value of our interest rate swap agreements, at fair value, is a net liability of $12.7 million as ofDecember 31, 2009, of which $13.0 million is included with other liabilities and $0.3 million is included with deferredcosts and other assets. The interest rate cap agreements were of no net value at December 31, 2009 and we generallydo not apply hedge accounting to these arrangements. The total gross accumulated other comprehensive loss relatedto our derivative activities, including our share of the other comprehensive loss from joint venture properties, wasapproximately $52.3 million as of December 31, 2009.
We are also exposed to fluctuations in foreign exchange rates on investments denominated in a foreign currencythat we hold, primarily in Japan and Europe. We use currency forward agreements to manage our exposure to changesin foreign exchange rates on certain Yen-denominated receivables. Currency forward agreements involve fixing theUSD-Yen exchange rate for delivery of a specified amount of foreign currency on a specified date. The currencyforward agreements are typically cash settled in US dollars for their fair value at or close to their settlement date. Weentered into USD-Yen forwards during 2009 for approximately ¥3 billion that we expect to receive through April 2011
82
Simon Property Group, L.P. and Subsidiaries
Notes to Consolidated Financial Statements (Continued)
(Dollars in thousands, except unit and per unit amounts and where indicated as in millions or billions)
3. Summary of Significant Accounting Policies (Continued)
at an average exchange rate of 97.1 USD:Yen, of which approximately ¥1.6 billion remains as of December 31, 2009.The December 31, 2009 liability balance related to these forwards was $0.7 million and is included in other liabilities.We have reflected the changes in fair value for these forward contracts in earnings. The underlying currencyadjustments on the foreign-denominated receivables are also reflected in income and generally offset the amounts inearnings for these forward contracts.
We have no credit-risk-related hedging or derivative activities.
Noncontrolling Interests and Temporary Equity
Effective January 1, 2009, we adopted a newly issued accounting standard for noncontrolling interests, whichrequires a noncontrolling interest in a subsidiary to be reported as equity and the amount of consolidated net incomespecifically attributable to the noncontrolling interest to be included within consolidated net income. This standardalso requires consistency in the manner of reporting changes in the parent’s ownership interest and requires fair valuemeasurement of any noncontrolling equity investment retained in a deconsolidation. In connection with our adoption,which was fully reflected in our December 31, 2008 Form 10-K/A, we also reviewed and retrospectively adopted themeasurement and classification provisions for redeemable securities as further discussed below. As a result, we adjustthe carrying amounts of noncontrolling redeemable interests held by third parties in certain of our properties toredemption values at each reporting date. Because holders of the noncontrolling redeemable interests in propertiescan require us to redeem these interests for cash, we classify these noncontrolling redeemable interests outside ofpermanent equity. Adjustments to the carrying amounts of these noncontrolling redeemable interests in properties, toreflect the change in redemption value at the end of each reporting period, are recorded to partners’ equity.
We classify our 6% Series I Convertible Perpetual Preferred Units, or Series I preferred units, our Series D 8%Cumulative Redeemable Preferred Units, or Series D preferred units, and our 7.5% Cumulative RedeemablePreferred Units, or 7.5% preferred units, in temporary equity due to the possibility that we could be required toredeem the securities for cash. For the Series I preferred units, the holders have the ability to redeem this series ofpreferred units for cash upon the occurrence of a change in control event, which would include a change in themajority of the directors on Simon Property Group’s Board of Directors, or the Board, that occurs over a two yearperiod. Such a change in Board composition could be deemed outside of our control. For the Series D preferred unitsand 7.5% preferred units, the redemption of these series of preferred units requires the delivery of fully registeredshares of Simon Property common stock. The previous and current carrying amount of all of these series of preferredunits is equal to their liquidation value, which is the amount payable upon the occurrence of any event that couldpotentially result in cash settlement.
Our evaluation of the appropriateness of classifying the units held by Simon Property and limited partnerswithin permanent equity considered several significant factors in determining the appropriate classification of thoseunits in the consolidated balance sheets. First, as a limited partnership, all routine decisions relating to our operationsand distributions are made by Simon Property, acting as our sole General Partner. The decisions of the GeneralPartner are made by the Board and Simon Property’s management. We have no other governance structure. Secondly,the sole asset of Simon Property is its interest in us. As a result, a share of Simon Property common stock (if owned byus) is best characterized as being similar to a treasury share and thus not an asset of the Operating Partnership.
Limited partners have the right under our partnership agreement to exchange their units for shares of SimonProperty common stock or cash as selected by the General Partner. Accordingly, we classify limited partner units inpermanent equity because we have the unrestricted ability to issue shares of Simon Property common stock to limitedpartners exercising their exchange rights rather than using cash or other assets. Under our partnership agreement, weare required to redeem units held by Simon Property only when Simon Property has redeemed shares of its commonstock. We classify units held by Simon Property in permanent equity because the decision to redeem those units wouldbe made through our governance structure, with Simon Property making the decision on our behalf.
83
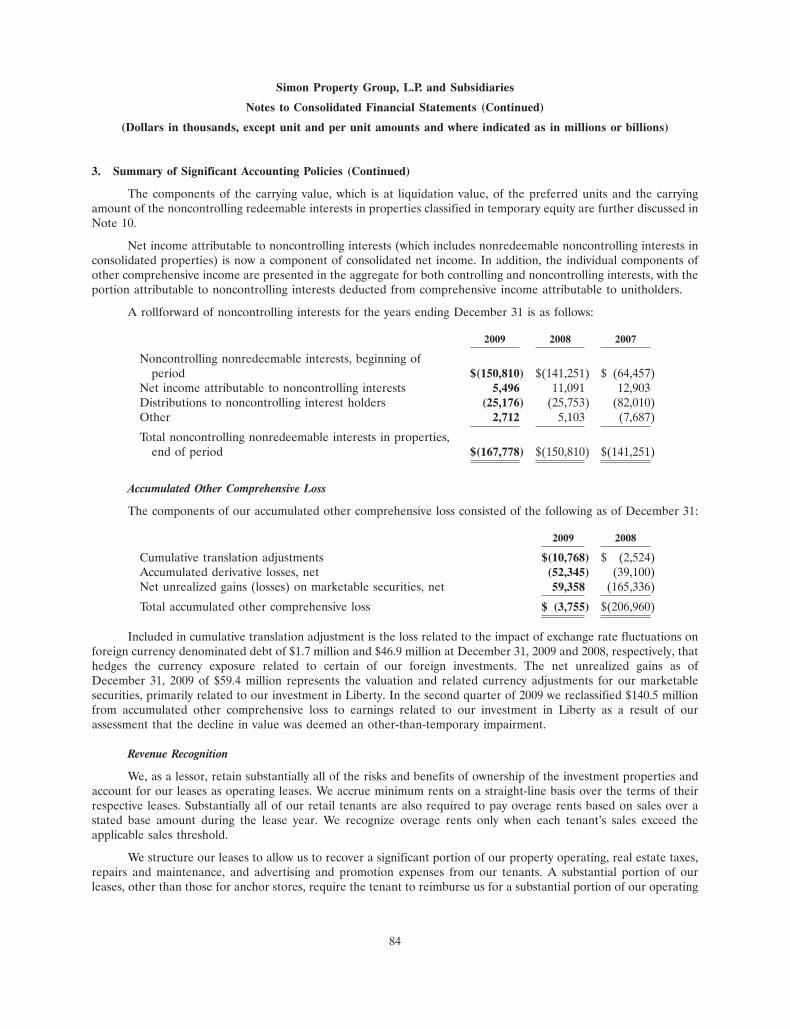
Simon Property Group, L.P. and Subsidiaries
Notes to Consolidated Financial Statements (Continued)
(Dollars in thousands, except unit and per unit amounts and where indicated as in millions or billions)
3. Summary of Significant Accounting Policies (Continued)
The components of the carrying value, which is at liquidation value, of the preferred units and the carryingamount of the noncontrolling redeemable interests in properties classified in temporary equity are further discussed inNote 10.
Net income attributable to noncontrolling interests (which includes nonredeemable noncontrolling interests inconsolidated properties) is now a component of consolidated net income. In addition, the individual components ofother comprehensive income are presented in the aggregate for both controlling and noncontrolling interests, with theportion attributable to noncontrolling interests deducted from comprehensive income attributable to unitholders.
A rollforward of noncontrolling interests for the years ending December 31 is as follows:
2009 2008 2007
Noncontrolling nonredeemable interests, beginning ofperiod $(150,810) $(141,251) $ (64,457)
Net income attributable to noncontrolling interests 5,496 11,091 12,903Distributions to noncontrolling interest holders (25,176) (25,753) (82,010)Other 2,712 5,103 (7,687)
Total noncontrolling nonredeemable interests in properties,end of period $(167,778) $(150,810) $(141,251)
Accumulated Other Comprehensive Loss
The components of our accumulated other comprehensive loss consisted of the following as of December 31:
2009 2008
Cumulative translation adjustments $(10,768) $ (2,524)Accumulated derivative losses, net (52,345) (39,100)Net unrealized gains (losses) on marketable securities, net 59,358 (165,336)
Total accumulated other comprehensive loss $ (3,755) $(206,960)
Included in cumulative translation adjustment is the loss related to the impact of exchange rate fluctuations onforeign currency denominated debt of $1.7 million and $46.9 million at December 31, 2009 and 2008, respectively, thathedges the currency exposure related to certain of our foreign investments. The net unrealized gains as ofDecember 31, 2009 of $59.4 million represents the valuation and related currency adjustments for our marketablesecurities, primarily related to our investment in Liberty. In the second quarter of 2009 we reclassified $140.5 millionfrom accumulated other comprehensive loss to earnings related to our investment in Liberty as a result of ourassessment that the decline in value was deemed an other-than-temporary impairment.
Revenue Recognition
We, as a lessor, retain substantially all of the risks and benefits of ownership of the investment properties andaccount for our leases as operating leases. We accrue minimum rents on a straight-line basis over the terms of theirrespective leases. Substantially all of our retail tenants are also required to pay overage rents based on sales over astated base amount during the lease year. We recognize overage rents only when each tenant’s sales exceed theapplicable sales threshold.
We structure our leases to allow us to recover a significant portion of our property operating, real estate taxes,repairs and maintenance, and advertising and promotion expenses from our tenants. A substantial portion of ourleases, other than those for anchor stores, require the tenant to reimburse us for a substantial portion of our operating
84
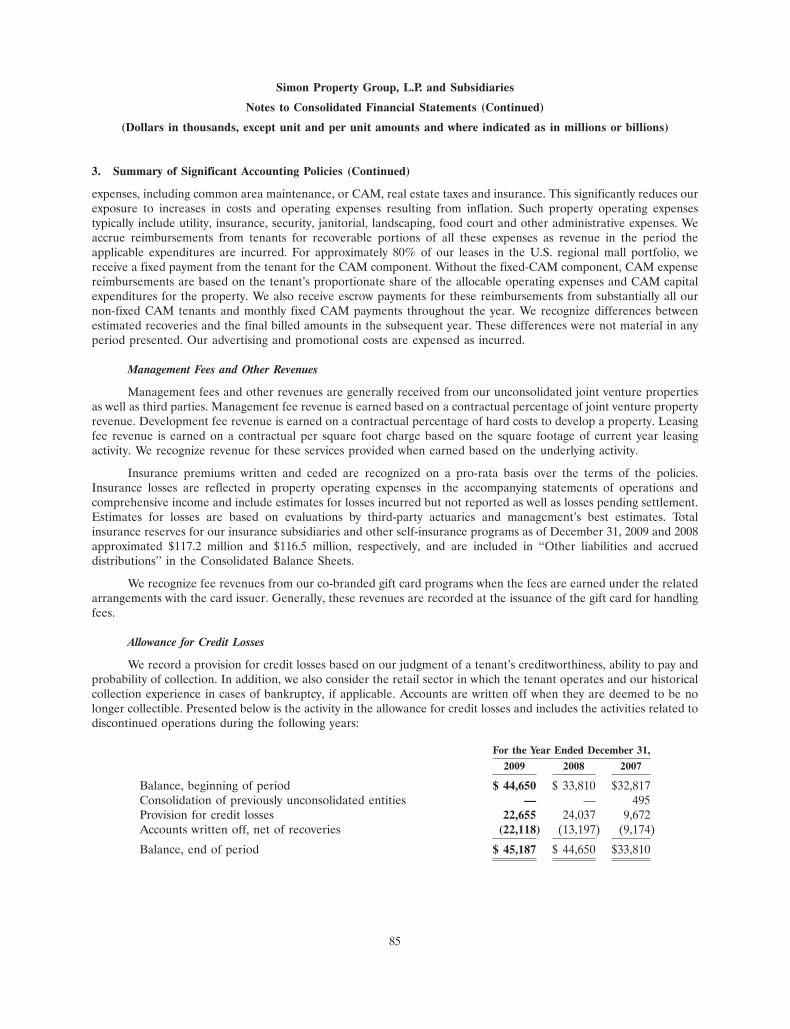
Simon Property Group, L.P. and Subsidiaries
Notes to Consolidated Financial Statements (Continued)
(Dollars in thousands, except unit and per unit amounts and where indicated as in millions or billions)
3. Summary of Significant Accounting Policies (Continued)
expenses, including common area maintenance, or CAM, real estate taxes and insurance. This significantly reduces ourexposure to increases in costs and operating expenses resulting from inflation. Such property operating expensestypically include utility, insurance, security, janitorial, landscaping, food court and other administrative expenses. Weaccrue reimbursements from tenants for recoverable portions of all these expenses as revenue in the period theapplicable expenditures are incurred. For approximately 80% of our leases in the U.S. regional mall portfolio, wereceive a fixed payment from the tenant for the CAM component. Without the fixed-CAM component, CAM expensereimbursements are based on the tenant’s proportionate share of the allocable operating expenses and CAM capitalexpenditures for the property. We also receive escrow payments for these reimbursements from substantially all ournon-fixed CAM tenants and monthly fixed CAM payments throughout the year. We recognize differences betweenestimated recoveries and the final billed amounts in the subsequent year. These differences were not material in anyperiod presented. Our advertising and promotional costs are expensed as incurred.
Management Fees and Other Revenues
Management fees and other revenues are generally received from our unconsolidated joint venture propertiesas well as third parties. Management fee revenue is earned based on a contractual percentage of joint venture propertyrevenue. Development fee revenue is earned on a contractual percentage of hard costs to develop a property. Leasingfee revenue is earned on a contractual per square foot charge based on the square footage of current year leasingactivity. We recognize revenue for these services provided when earned based on the underlying activity.
Insurance premiums written and ceded are recognized on a pro-rata basis over the terms of the policies.Insurance losses are reflected in property operating expenses in the accompanying statements of operations andcomprehensive income and include estimates for losses incurred but not reported as well as losses pending settlement.Estimates for losses are based on evaluations by third-party actuaries and management’s best estimates. Totalinsurance reserves for our insurance subsidiaries and other self-insurance programs as of December 31, 2009 and 2008approximated $117.2 million and $116.5 million, respectively, and are included in ‘‘Other liabilities and accrueddistributions’’ in the Consolidated Balance Sheets.
We recognize fee revenues from our co-branded gift card programs when the fees are earned under the relatedarrangements with the card issuer. Generally, these revenues are recorded at the issuance of the gift card for handlingfees.
Allowance for Credit Losses
We record a provision for credit losses based on our judgment of a tenant’s creditworthiness, ability to pay andprobability of collection. In addition, we also consider the retail sector in which the tenant operates and our historicalcollection experience in cases of bankruptcy, if applicable. Accounts are written off when they are deemed to be nolonger collectible. Presented below is the activity in the allowance for credit losses and includes the activities related todiscontinued operations during the following years:
For the Year Ended December 31,
2009 2008 2007
Balance, beginning of period $ 44,650 $ 33,810 $32,817Consolidation of previously unconsolidated entities — — 495Provision for credit losses 22,655 24,037 9,672Accounts written off, net of recoveries (22,118) (13,197) (9,174)
Balance, end of period $ 45,187 $ 44,650 $33,810
85
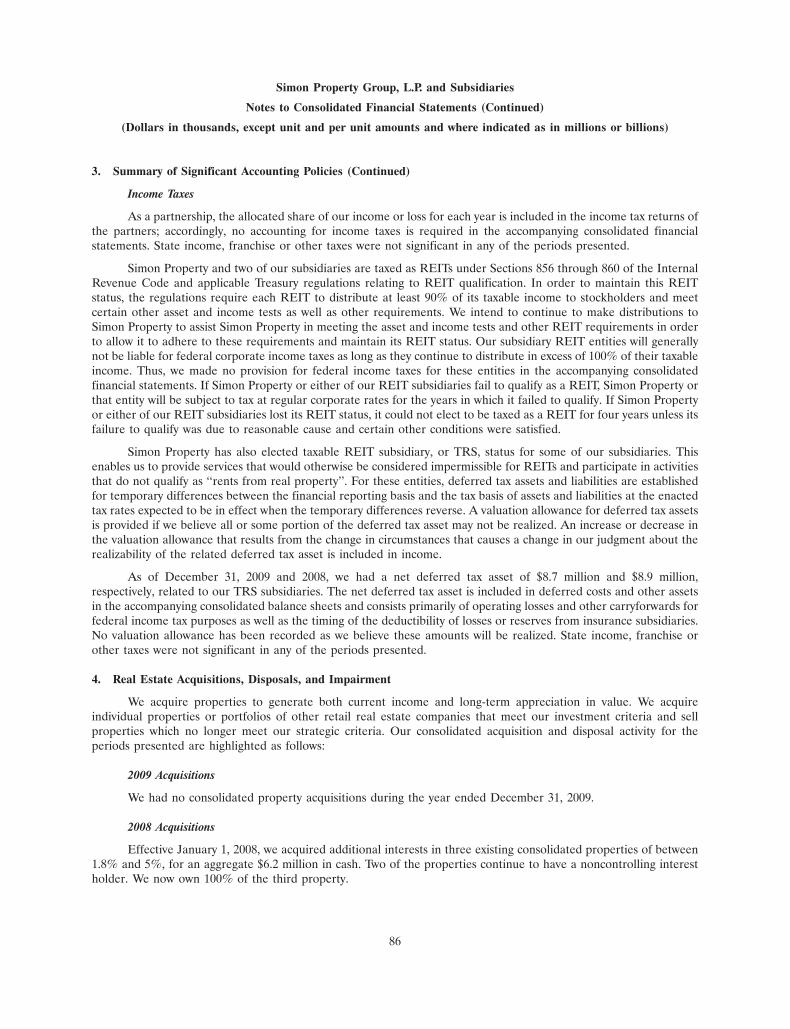
Simon Property Group, L.P. and Subsidiaries
Notes to Consolidated Financial Statements (Continued)
(Dollars in thousands, except unit and per unit amounts and where indicated as in millions or billions)
3. Summary of Significant Accounting Policies (Continued)
Income Taxes
As a partnership, the allocated share of our income or loss for each year is included in the income tax returns ofthe partners; accordingly, no accounting for income taxes is required in the accompanying consolidated financialstatements. State income, franchise or other taxes were not significant in any of the periods presented.
Simon Property and two of our subsidiaries are taxed as REITs under Sections 856 through 860 of the InternalRevenue Code and applicable Treasury regulations relating to REIT qualification. In order to maintain this REITstatus, the regulations require each REIT to distribute at least 90% of its taxable income to stockholders and meetcertain other asset and income tests as well as other requirements. We intend to continue to make distributions toSimon Property to assist Simon Property in meeting the asset and income tests and other REIT requirements in orderto allow it to adhere to these requirements and maintain its REIT status. Our subsidiary REIT entities will generallynot be liable for federal corporate income taxes as long as they continue to distribute in excess of 100% of their taxableincome. Thus, we made no provision for federal income taxes for these entities in the accompanying consolidatedfinancial statements. If Simon Property or either of our REIT subsidiaries fail to qualify as a REIT, Simon Property orthat entity will be subject to tax at regular corporate rates for the years in which it failed to qualify. If Simon Propertyor either of our REIT subsidiaries lost its REIT status, it could not elect to be taxed as a REIT for four years unless itsfailure to qualify was due to reasonable cause and certain other conditions were satisfied.
Simon Property has also elected taxable REIT subsidiary, or TRS, status for some of our subsidiaries. Thisenables us to provide services that would otherwise be considered impermissible for REITs and participate in activitiesthat do not qualify as ‘‘rents from real property’’. For these entities, deferred tax assets and liabilities are establishedfor temporary differences between the financial reporting basis and the tax basis of assets and liabilities at the enactedtax rates expected to be in effect when the temporary differences reverse. A valuation allowance for deferred tax assetsis provided if we believe all or some portion of the deferred tax asset may not be realized. An increase or decrease inthe valuation allowance that results from the change in circumstances that causes a change in our judgment about therealizability of the related deferred tax asset is included in income.
As of December 31, 2009 and 2008, we had a net deferred tax asset of $8.7 million and $8.9 million,respectively, related to our TRS subsidiaries. The net deferred tax asset is included in deferred costs and other assetsin the accompanying consolidated balance sheets and consists primarily of operating losses and other carryforwards forfederal income tax purposes as well as the timing of the deductibility of losses or reserves from insurance subsidiaries.No valuation allowance has been recorded as we believe these amounts will be realized. State income, franchise orother taxes were not significant in any of the periods presented.
4. Real Estate Acquisitions, Disposals, and Impairment
We acquire properties to generate both current income and long-term appreciation in value. We acquireindividual properties or portfolios of other retail real estate companies that meet our investment criteria and sellproperties which no longer meet our strategic criteria. Our consolidated acquisition and disposal activity for theperiods presented are highlighted as follows:
2009 Acquisitions
We had no consolidated property acquisitions during the year ended December 31, 2009.
2008 Acquisitions
Effective January 1, 2008, we acquired additional interests in three existing consolidated properties of between1.8% and 5%, for an aggregate $6.2 million in cash. Two of the properties continue to have a noncontrolling interestholder. We now own 100% of the third property.
86
Simon Property Group, L.P. and Subsidiaries
Notes to Consolidated Financial Statements (Continued)
(Dollars in thousands, except unit and per unit amounts and where indicated as in millions or billions)
4. Real Estate Acquisitions, Disposals, and Impairment (Continued)
2007 Acquisitions
As a result of the Mills acquisition which is more fully discussed in Note 7, we consolidated two regional mallproperties, Town Center at Cobb and Gwinnett Place. In addition to the Mills acquisition, on March 1, 2007, weacquired the remaining 40% interest in both University Park Mall and University Center located in Mishawaka,Indiana from our partner and as a result, we now own 100% of these properties. On March 28, 2007, we acquired TheMaine Outlet, a 112,000 square foot outlet center located in Kittery, Maine, adjacent to our Kittery Premium Outletsproperty. On August 23, 2007, we acquired Las Americas Premium Outlets, a 560,000 square foot upscale outlet centerlocated in San Diego, California. We also purchased an additional 1% interest in Bangor Mall on July 13, 2007, and anadditional 6.5% interest in Montgomery Mall on November 1, 2007. The aggregate purchase price of the consolidatedassets acquired during 2007, excluding Town Center at Cobb and Gwinnett Place, was approximately $394.2 million,including the assumption of our share of debt of the properties acquired.
2009 Dispositions
During the year ended December 31, 2009, we sold four consolidated properties for which we received netproceeds of $3.9 million. The loss on disposal (net) totaled $9.8 million and is included in ‘‘(Loss) gain on sale of assetsand interests in unconsolidated entities’’ in the consolidated statements of operations and comprehensive income.
2008 Dispositions
We had no consolidated property dispositions during the year ended December 31, 2008.
2007 Dispositions
During the year ended December 31, 2007, we sold five consolidated properties for which we received netproceeds of $56.4 million. The loss on disposal (net) totaled $35.2 million and is included in ‘‘Loss on sale ofdiscontinued operations’’ in the consolidated statements of operations and comprehensive income.
2009 Impairment
In 2009, we recorded non-cash impairment charges of $240.1 million ($228.6 million, net of a tax benefit of$5.8 million and noncontrolling interest holders’ share of $5.7 million). As discussed in Note 3, this non-cash chargeincludes a $140.5 million other-than-temporary impairment of our investment in Liberty. In addition, the total chargeincludes adjustments recorded in the fourth quarter in the carrying value of one wholly-owned and one joint ventureregional mall, a write-down of five land parcels and two joint venture non-retail real estate assets, and certainpredevelopment costs related to projects no longer being pursued.
2008 Impairment
In 2008, we recorded impairment charges of $21.2 million ($19.4 million, net of tax benefit), which resultedprimarily from a $10.5 million reduction in the carrying value of a regional mall to its estimated net realizable valueand the write-off of predevelopment costs related to various projects that we no longer plan to pursue.
5. Per Unit Data
We determine basic earnings per unit based on the weighted average number of units outstanding during theperiod. We determine diluted earnings per unit based on the weighted average number of units outstanding combinedwith the incremental weighted average units that would have been outstanding assuming all dilutive potential common
87
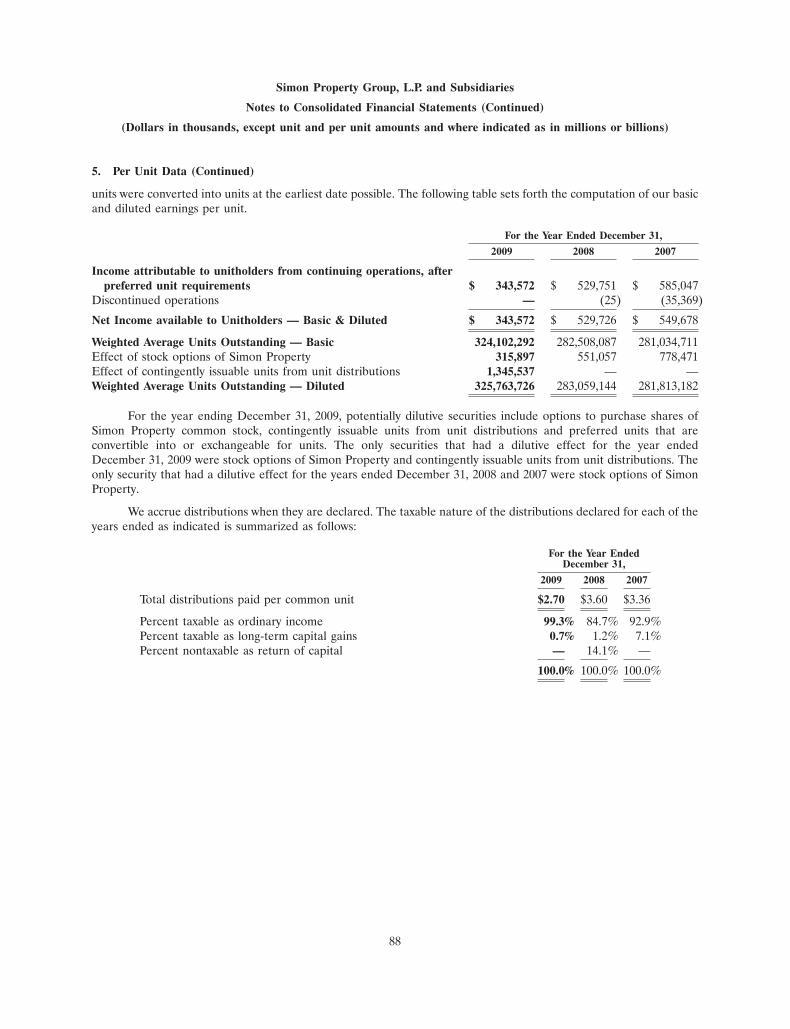
Simon Property Group, L.P. and Subsidiaries
Notes to Consolidated Financial Statements (Continued)
(Dollars in thousands, except unit and per unit amounts and where indicated as in millions or billions)
5. Per Unit Data (Continued)
units were converted into units at the earliest date possible. The following table sets forth the computation of our basicand diluted earnings per unit.
For the Year Ended December 31,
2009 2008 2007
Income attributable to unitholders from continuing operations, afterpreferred unit requirements $ 343,572 $ 529,751 $ 585,047
Discontinued operations — (25) (35,369)
Net Income available to Unitholders — Basic & Diluted $ 343,572 $ 529,726 $ 549,678
Weighted Average Units Outstanding — Basic 324,102,292 282,508,087 281,034,711Effect of stock options of Simon Property 315,897 551,057 778,471Effect of contingently issuable units from unit distributions 1,345,537 — —Weighted Average Units Outstanding — Diluted 325,763,726 283,059,144 281,813,182
For the year ending December 31, 2009, potentially dilutive securities include options to purchase shares ofSimon Property common stock, contingently issuable units from unit distributions and preferred units that areconvertible into or exchangeable for units. The only securities that had a dilutive effect for the year endedDecember 31, 2009 were stock options of Simon Property and contingently issuable units from unit distributions. Theonly security that had a dilutive effect for the years ended December 31, 2008 and 2007 were stock options of SimonProperty.
We accrue distributions when they are declared. The taxable nature of the distributions declared for each of theyears ended as indicated is summarized as follows:
For the Year EndedDecember 31,
2009 2008 2007
Total distributions paid per common unit $2.70 $3.60 $3.36
Percent taxable as ordinary income 99.3% 84.7% 92.9%Percent taxable as long-term capital gains 0.7% 1.2% 7.1%Percent nontaxable as return of capital — 14.1% —
100.0% 100.0% 100.0%
88

Simon Property Group, L.P. and Subsidiaries
Notes to Consolidated Financial Statements (Continued)
(Dollars in thousands, except unit and per unit amounts and where indicated as in millions or billions)
6. Investment Properties
Investment properties consist of the following as of December 31:
2009 2008
Land $ 2,757,994 $ 2,795,026Buildings and improvements 22,265,721 22,112,944
Total land, buildings and improvements 25,023,715 24,907,970Furniture, fixtures and equipment 312,474 297,745
Investment properties at cost 25,336,189 25,205,715Less — accumulated depreciation 7,004,534 6,184,285
Investment properties at cost, net $18,331,655 $19,021,430
Construction in progress included above $ 281,683 $ 358,254
7. Investments in Unconsolidated Entities
Joint ventures are common in the real estate industry. We use joint ventures to finance properties, develop newproperties, and diversify our risk in a particular property or portfolio. We held joint venture ownership interests in 103properties in the U.S. as of December 31, 2009. We also held interests in two joint ventures which owned 51 Europeanshopping centers as of December 31, 2009 and 52 as of December 31, 2008. We also held interests in eight jointventure properties under operation in Japan, one joint venture property in Mexico, and one joint venture property inKorea. We account for these joint venture properties using the equity method of accounting.
Substantially all of our joint venture properties are subject to rights of first refusal, buy-sell provisions, or othersale or marketing rights for partners which are customary in real estate joint venture agreements and the industry. Ourpartners in these joint ventures may initiate these provisions at any time (subject to any applicable lock up or similarrestrictions), which could result in either the sale of our interest or the use of available cash or borrowings to acquirethe joint venture interest from our partner.
Acquisition of The Mills Corporation by SPG-FCM
On February 16, 2007, SPG-FCM, a 50/50 joint venture between one of our affiliates and funds managed byFarallon Capital Management, L.L.C., or Farallon, entered into a definitive merger agreement to acquire all of theoutstanding common stock of Mills for $25.25 per common share in cash. The acquisition of Mills and its interests inthe 36 properties that remain at December 31, 2009 was completed in April 2007. As of December 31, 2009, we andFarallon had each funded $650.0 million into SPG-FCM to acquire all of the common stock of Mills. As part of thetransaction, we also made loans to SPG-FCM and Mills at rates of LIBOR plus 270-275 basis points. These funds wereused by SPG-FCM and Mills to repay loans and other obligations of Mills, including the redemption of preferredstock, during 2007. As of December 31, 2009, the outstanding balance of our loan to SPG-FCM was $632.0 million,and the average outstanding balance during the year ended December 31, 2009 of all loans made to SPG-FCM andMills was approximately $589.5 million. During 2009, 2008 and 2007, we recorded approximately $9.3 million,$15.3 million and $39.1 million in interest income (net of inter-entity eliminations) related to these loans, respectively.We also recorded fee income, including fee income amortization related to up-front fees on loans made to SPG-FCMand Mills, during 2009, 2008 and 2007 of approximately $3.7 million, $3.1 million and $17.4 million (net of inter-entityeliminations), respectively, for providing refinancing services to Mills’ properties and SPG-FCM. The existing loanfacility to SPG-FCM bears a rate of LIBOR plus 275 basis points and matures on June 7, 2010, with two availableone-year extensions. Fees charged on loans made to SPG-FCM and Mills are amortized on a straight-line basis overthe life of the loan.
89
Simon Property Group, L.P. and Subsidiaries
Notes to Consolidated Financial Statements (Continued)
(Dollars in thousands, except unit and per unit amounts and where indicated as in millions or billions)
7. Investments in Unconsolidated Entities (Continued)
As a result of the change in control of Mills, holders of Mills’ Series F convertible cumulative redeemablepreferred stock had the right to require the repurchase of their shares for cash equal to the liquidation preference pershare plus accrued and unpaid dividends. During the second quarter of 2007, all of the holders of Mills’ Series Fpreferred stock exercised this right, and Mills redeemed this series of preferred stock for approximately $333.2 million,including accrued dividends. Further, as of August 1, 2007, The Mills Corporation was liquidated and the holders ofthe remaining series’ of Mills preferred stock were paid a liquidation preference of approximately $693.0 million,including accrued dividends.
During the third quarter of 2007, the holders of less than 5,000 common units in the Mills’ operatingpartnership, or Mills units, received $25.25 in cash, and those holding 5,000 or more Mills units had the option toexchange for cash of $25.25, or our units, based on a fixed exchange ratio of 0.211 of a unit for each Mills unit. Thatoption expired on August 1, 2007. Holders electing to exchange received 66,036 of our units for their Mills units. Theremaining Mills units were exchanged for cash.
Effective July 1, 2007, we or an affiliate of ours began serving as the manager for substantially all of theproperties in which SPG-FCM holds an interest. In conjunction with the Mills acquisition, we acquired a majorityinterest in two properties in which we previously held a 50% ownership interest (Town Center at Cobb and GwinnettPlace) and as a result we have consolidated these two properties at the date of acquisition. We have reclassified theresults of these properties in the Joint Venture Statements of Operations into ‘‘Income from consolidated joint ventureinterests.’’
The Mills acquisition involved the purchase of all of Mills’ outstanding shares of common stock and commonunits for approximately $1.7 billion (at $25.25 per share or unit), the assumption of $954.9 million of preferred stock,the assumption of a proportionate share of property-level mortgage debt, of which SPG-FCM’s share approximated$3.8 billion, the assumption of $1.2 billion in unsecured loans provided by us, costs to effect the acquisition, and certainliabilities and contingencies, including an ongoing investigation by the Securities and Exchange Commission, for anaggregate purchase price of approximately $8 billion. The valuations were developed with the assistance of a third-party professional appraisal firm.
We subsequently sold our interest in Cincinnati Mills and Broward and Westland Malls, which we acquiredthrough the Mills acquisition, and recognized no gain or loss on these dispositions.
90
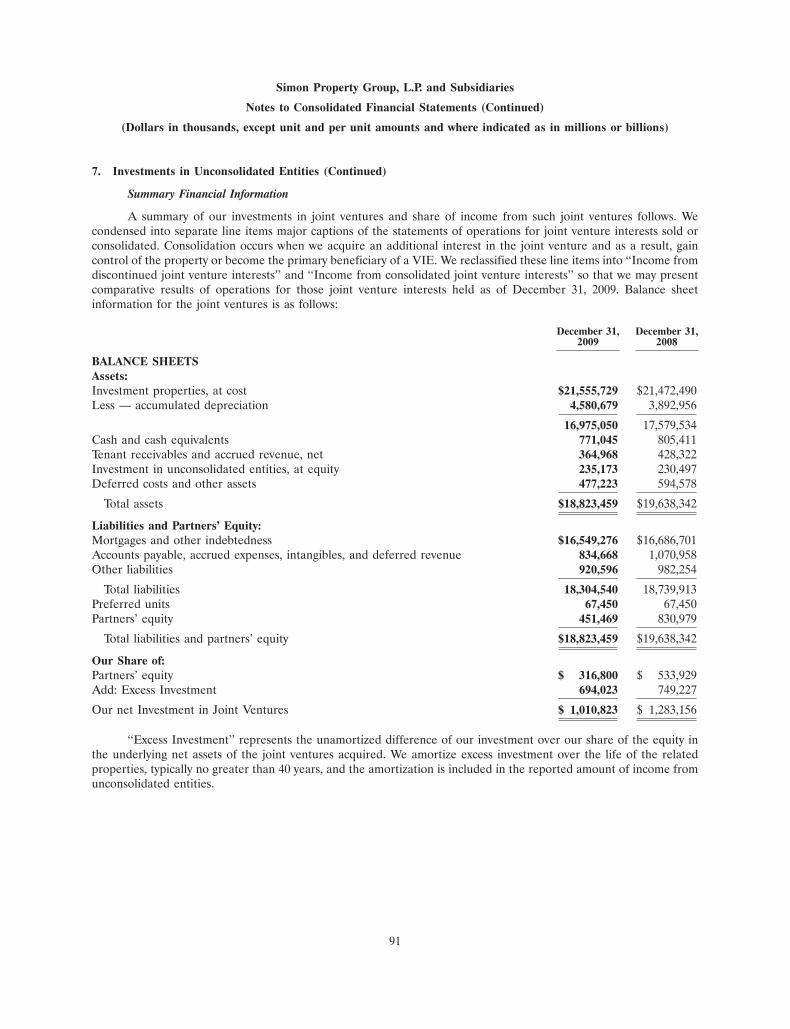
Simon Property Group, L.P. and Subsidiaries
Notes to Consolidated Financial Statements (Continued)
(Dollars in thousands, except unit and per unit amounts and where indicated as in millions or billions)
7. Investments in Unconsolidated Entities (Continued)
Summary Financial Information
A summary of our investments in joint ventures and share of income from such joint ventures follows. Wecondensed into separate line items major captions of the statements of operations for joint venture interests sold orconsolidated. Consolidation occurs when we acquire an additional interest in the joint venture and as a result, gaincontrol of the property or become the primary beneficiary of a VIE. We reclassified these line items into ‘‘Income fromdiscontinued joint venture interests’’ and ‘‘Income from consolidated joint venture interests’’ so that we may presentcomparative results of operations for those joint venture interests held as of December 31, 2009. Balance sheetinformation for the joint ventures is as follows:
December 31, December 31,2009 2008
BALANCE SHEETSAssets:Investment properties, at cost $21,555,729 $21,472,490Less — accumulated depreciation 4,580,679 3,892,956
16,975,050 17,579,534Cash and cash equivalents 771,045 805,411Tenant receivables and accrued revenue, net 364,968 428,322Investment in unconsolidated entities, at equity 235,173 230,497Deferred costs and other assets 477,223 594,578
Total assets $18,823,459 $19,638,342
Liabilities and Partners’ Equity:Mortgages and other indebtedness $16,549,276 $16,686,701Accounts payable, accrued expenses, intangibles, and deferred revenue 834,668 1,070,958Other liabilities 920,596 982,254
Total liabilities 18,304,540 18,739,913Preferred units 67,450 67,450Partners’ equity 451,469 830,979
Total liabilities and partners’ equity $18,823,459 $19,638,342
Our Share of:Partners’ equity $ 316,800 $ 533,929Add: Excess Investment 694,023 749,227
Our net Investment in Joint Ventures $ 1,010,823 $ 1,283,156
‘‘Excess Investment’’ represents the unamortized difference of our investment over our share of the equity inthe underlying net assets of the joint ventures acquired. We amortize excess investment over the life of the relatedproperties, typically no greater than 40 years, and the amortization is included in the reported amount of income fromunconsolidated entities.
91
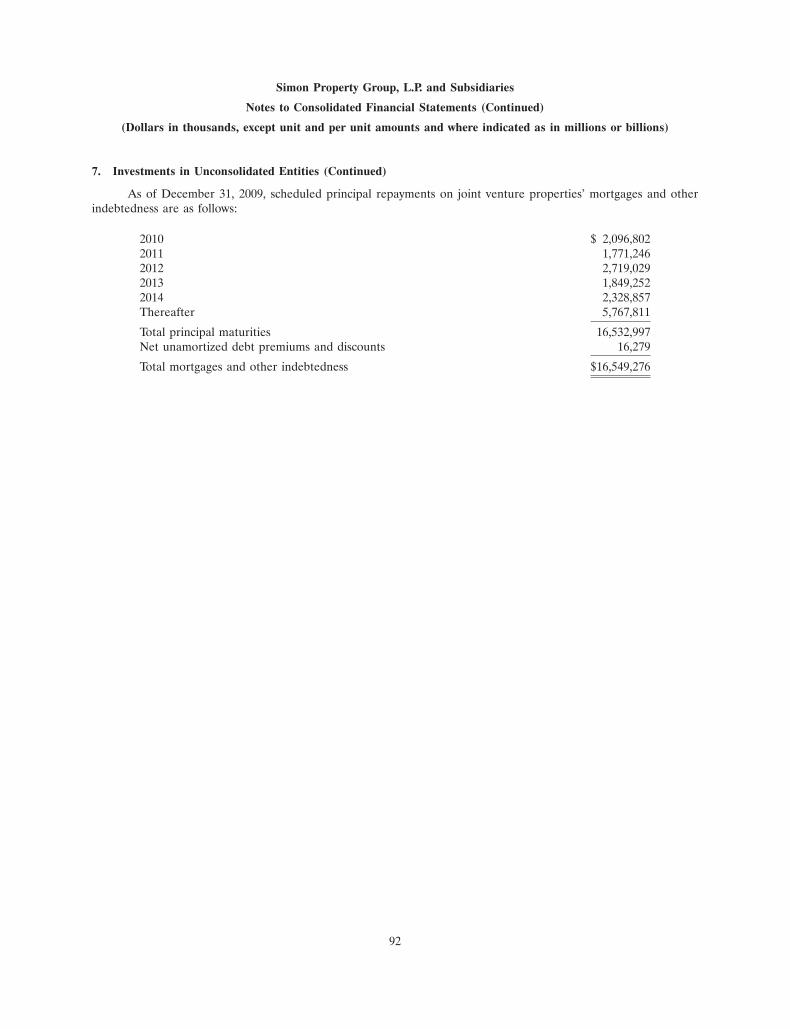
Simon Property Group, L.P. and Subsidiaries
Notes to Consolidated Financial Statements (Continued)
(Dollars in thousands, except unit and per unit amounts and where indicated as in millions or billions)
7. Investments in Unconsolidated Entities (Continued)
As of December 31, 2009, scheduled principal repayments on joint venture properties’ mortgages and otherindebtedness are as follows:
2010 $ 2,096,8022011 1,771,2462012 2,719,0292013 1,849,2522014 2,328,857Thereafter 5,767,811
Total principal maturities 16,532,997Net unamortized debt premiums and discounts 16,279
Total mortgages and other indebtedness $16,549,276
92
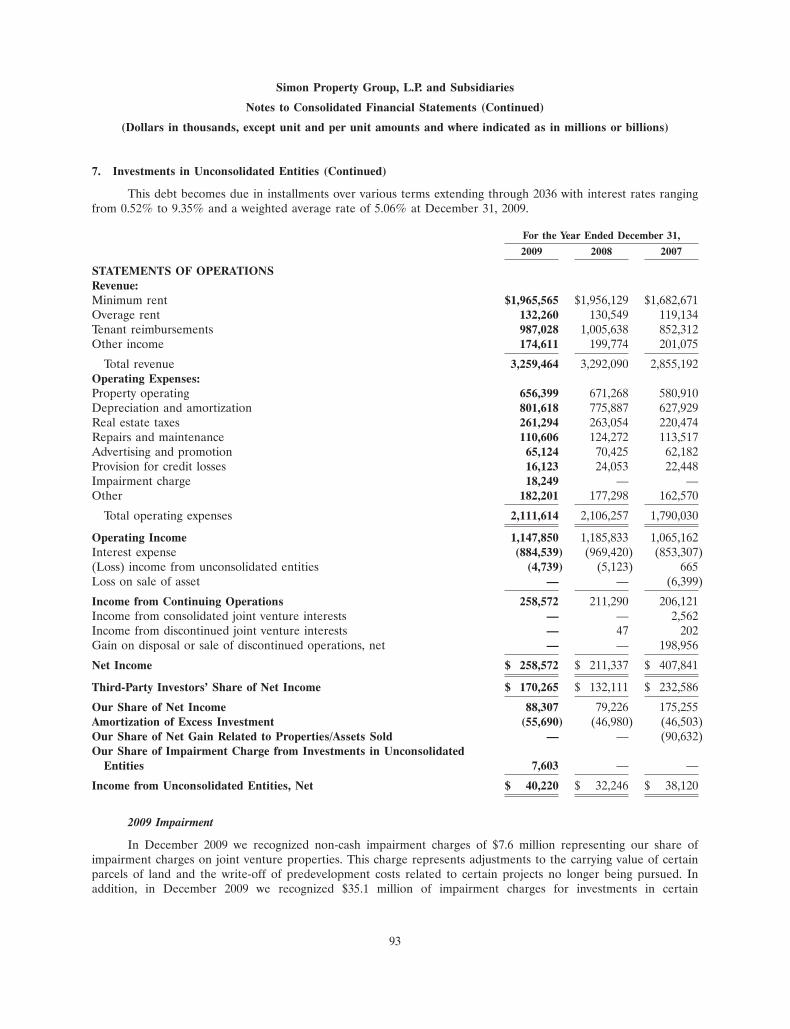
Simon Property Group, L.P. and Subsidiaries
Notes to Consolidated Financial Statements (Continued)
(Dollars in thousands, except unit and per unit amounts and where indicated as in millions or billions)
7. Investments in Unconsolidated Entities (Continued)
This debt becomes due in installments over various terms extending through 2036 with interest rates rangingfrom 0.52% to 9.35% and a weighted average rate of 5.06% at December 31, 2009.
For the Year Ended December 31,
2009 2008 2007
STATEMENTS OF OPERATIONSRevenue:Minimum rent $1,965,565 $1,956,129 $1,682,671Overage rent 132,260 130,549 119,134Tenant reimbursements 987,028 1,005,638 852,312Other income 174,611 199,774 201,075
Total revenue 3,259,464 3,292,090 2,855,192Operating Expenses:Property operating 656,399 671,268 580,910Depreciation and amortization 801,618 775,887 627,929Real estate taxes 261,294 263,054 220,474Repairs and maintenance 110,606 124,272 113,517Advertising and promotion 65,124 70,425 62,182Provision for credit losses 16,123 24,053 22,448Impairment charge 18,249 — —Other 182,201 177,298 162,570
Total operating expenses 2,111,614 2,106,257 1,790,030
Operating Income 1,147,850 1,185,833 1,065,162Interest expense (884,539) (969,420) (853,307)(Loss) income from unconsolidated entities (4,739) (5,123) 665Loss on sale of asset — — (6,399)
Income from Continuing Operations 258,572 211,290 206,121Income from consolidated joint venture interests — — 2,562Income from discontinued joint venture interests — 47 202Gain on disposal or sale of discontinued operations, net — — 198,956
Net Income $ 258,572 $ 211,337 $ 407,841
Third-Party Investors’ Share of Net Income $ 170,265 $ 132,111 $ 232,586
Our Share of Net Income 88,307 79,226 175,255Amortization of Excess Investment (55,690) (46,980) (46,503)Our Share of Net Gain Related to Properties/Assets Sold — — (90,632)Our Share of Impairment Charge from Investments in Unconsolidated
Entities 7,603 — —
Income from Unconsolidated Entities, Net $ 40,220 $ 32,246 $ 38,120
2009 Impairment
In December 2009 we recognized non-cash impairment charges of $7.6 million representing our share ofimpairment charges on joint venture properties. This charge represents adjustments to the carrying value of certainparcels of land and the write-off of predevelopment costs related to certain projects no longer being pursued. Inaddition, in December 2009 we recognized $35.1 million of impairment charges for investments in certain
93
Simon Property Group, L.P. and Subsidiaries
Notes to Consolidated Financial Statements (Continued)
(Dollars in thousands, except unit and per unit amounts and where indicated as in millions or billions)
7. Investments in Unconsolidated Entities (Continued)
unconsolidated entities including one regional mall and two non-retail real estate assets for which declines in valuebelow our carrying amount were deemed other-than-temporary.
2007 Impairment
During the fourth quarter of 2007, we recorded an impairment charge of $55.1 million, $36.5 million net of taxbenefit, representing our entire equity investment in a joint venture, including interest capitalized on our investedequity, which had invested in a parcel of land.
International Joint Venture Investments
European Joint Ventures. We conduct our international operations in Europe through our two European jointventure investment entities; Simon Ivanhoe S.a.r.l., or Simon Ivanhoe, and Gallerie Commerciali Italia, or GCI. Thecarrying amount of our total combined investment in these two joint venture investments is $298.8 million and$224.2 million as of December 31, 2009 and 2008, respectively, including all related components of othercomprehensive income. We have a 50% ownership in Simon Ivanhoe and a 49% ownership in GCI as of December 31,2009. On December 14, 2009, we made an additional capital contribution to GCI of $79.4 million which was used tofund certain liabilities of the joint venture. The contribution increased our investment in GCI but did not impact ourownership percentage of the venture.
On July 5, 2007, Simon Ivanhoe completed the sale of five non-core assets in Poland and we presented ourshare of the gain upon this disposition in ‘‘(Loss) gain on sale of assets and interests in unconsolidated entities’’ in theconsolidated statement of operations and comprehensive income.
Asian Joint Ventures. We conduct our international Premium Outlet operations in Japan through joint ventureswith Mitsubishi Estate Co., Ltd. The carrying amount of our investment in these Premium Outlet joint ventures inJapan is $302.2 million and $312.6 million as of December 31, 2009 and 2008, respectively, including all relatedcomponents of other comprehensive income. We have a 40% ownership in these Japan Premium Outlet Centersthrough a joint venture arrangement. During 2007, we completed construction and opened our first Premium Outlet inKorea. As of December 31, 2009 and 2008 respectively, our investment in our Premium Outlet in Korea, for which wehold a 50% ownership interest, approximated $26.1 million and $18.0 million including all related components of othercomprehensive income.
In December 2009, we recognized a loss on our 32.5% interests in our shopping centers operating or underdevelopment in China. The interests were sold to affiliates of our Chinese partner for approximately $29 million,resulting in a loss of approximately $20 million which is included in ‘‘(Loss) gain on sale of assets and interests inunconsolidated entities’’ in the 2009 consolidated statement of operations and comprehensive income.
94
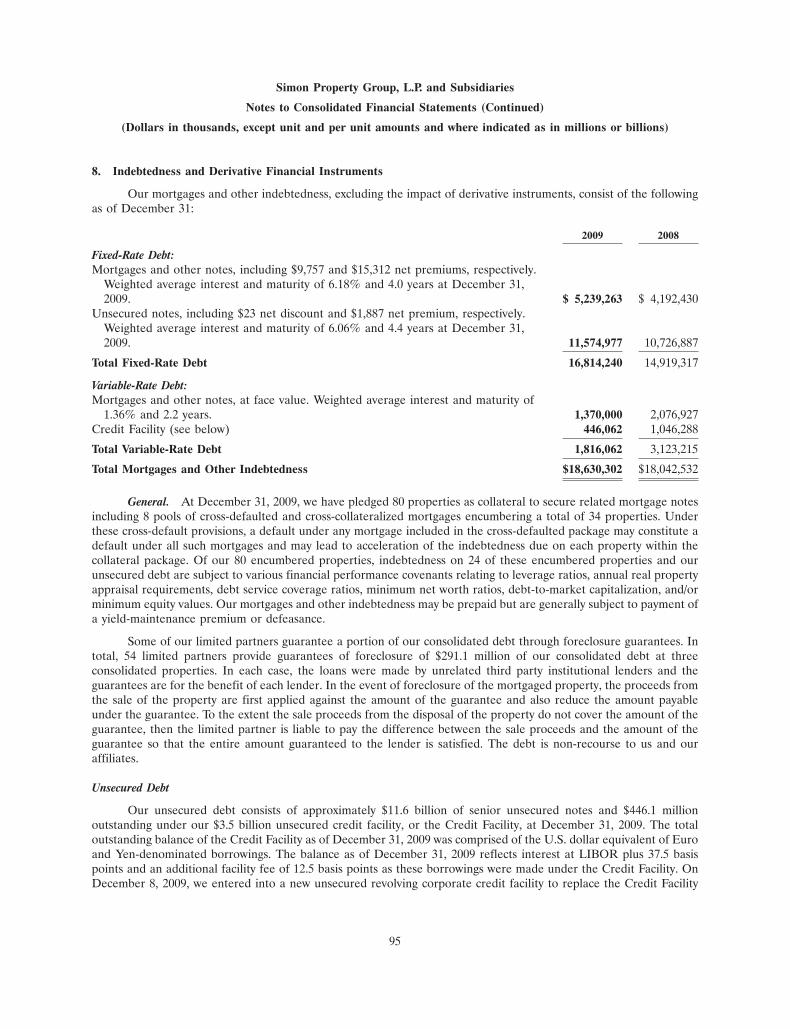
Simon Property Group, L.P. and Subsidiaries
Notes to Consolidated Financial Statements (Continued)
(Dollars in thousands, except unit and per unit amounts and where indicated as in millions or billions)
8. Indebtedness and Derivative Financial Instruments
Our mortgages and other indebtedness, excluding the impact of derivative instruments, consist of the followingas of December 31:
2009 2008
Fixed-Rate Debt:Mortgages and other notes, including $9,757 and $15,312 net premiums, respectively.
Weighted average interest and maturity of 6.18% and 4.0 years at December 31,2009. $ 5,239,263 $ 4,192,430
Unsecured notes, including $23 net discount and $1,887 net premium, respectively.Weighted average interest and maturity of 6.06% and 4.4 years at December 31,2009. 11,574,977 10,726,887
Total Fixed-Rate Debt 16,814,240 14,919,317
Variable-Rate Debt:Mortgages and other notes, at face value. Weighted average interest and maturity of
1.36% and 2.2 years. 1,370,000 2,076,927Credit Facility (see below) 446,062 1,046,288
Total Variable-Rate Debt 1,816,062 3,123,215
Total Mortgages and Other Indebtedness $18,630,302 $18,042,532
General. At December 31, 2009, we have pledged 80 properties as collateral to secure related mortgage notesincluding 8 pools of cross-defaulted and cross-collateralized mortgages encumbering a total of 34 properties. Underthese cross-default provisions, a default under any mortgage included in the cross-defaulted package may constitute adefault under all such mortgages and may lead to acceleration of the indebtedness due on each property within thecollateral package. Of our 80 encumbered properties, indebtedness on 24 of these encumbered properties and ourunsecured debt are subject to various financial performance covenants relating to leverage ratios, annual real propertyappraisal requirements, debt service coverage ratios, minimum net worth ratios, debt-to-market capitalization, and/orminimum equity values. Our mortgages and other indebtedness may be prepaid but are generally subject to payment ofa yield-maintenance premium or defeasance.
Some of our limited partners guarantee a portion of our consolidated debt through foreclosure guarantees. Intotal, 54 limited partners provide guarantees of foreclosure of $291.1 million of our consolidated debt at threeconsolidated properties. In each case, the loans were made by unrelated third party institutional lenders and theguarantees are for the benefit of each lender. In the event of foreclosure of the mortgaged property, the proceeds fromthe sale of the property are first applied against the amount of the guarantee and also reduce the amount payableunder the guarantee. To the extent the sale proceeds from the disposal of the property do not cover the amount of theguarantee, then the limited partner is liable to pay the difference between the sale proceeds and the amount of theguarantee so that the entire amount guaranteed to the lender is satisfied. The debt is non-recourse to us and ouraffiliates.
Unsecured Debt
Our unsecured debt consists of approximately $11.6 billion of senior unsecured notes and $446.1 millionoutstanding under our $3.5 billion unsecured credit facility, or the Credit Facility, at December 31, 2009. The totaloutstanding balance of the Credit Facility as of December 31, 2009 was comprised of the U.S. dollar equivalent of Euroand Yen-denominated borrowings. The balance as of December 31, 2009 reflects interest at LIBOR plus 37.5 basispoints and an additional facility fee of 12.5 basis points as these borrowings were made under the Credit Facility. OnDecember 8, 2009, we entered into a new unsecured revolving corporate credit facility to replace the Credit Facility
95
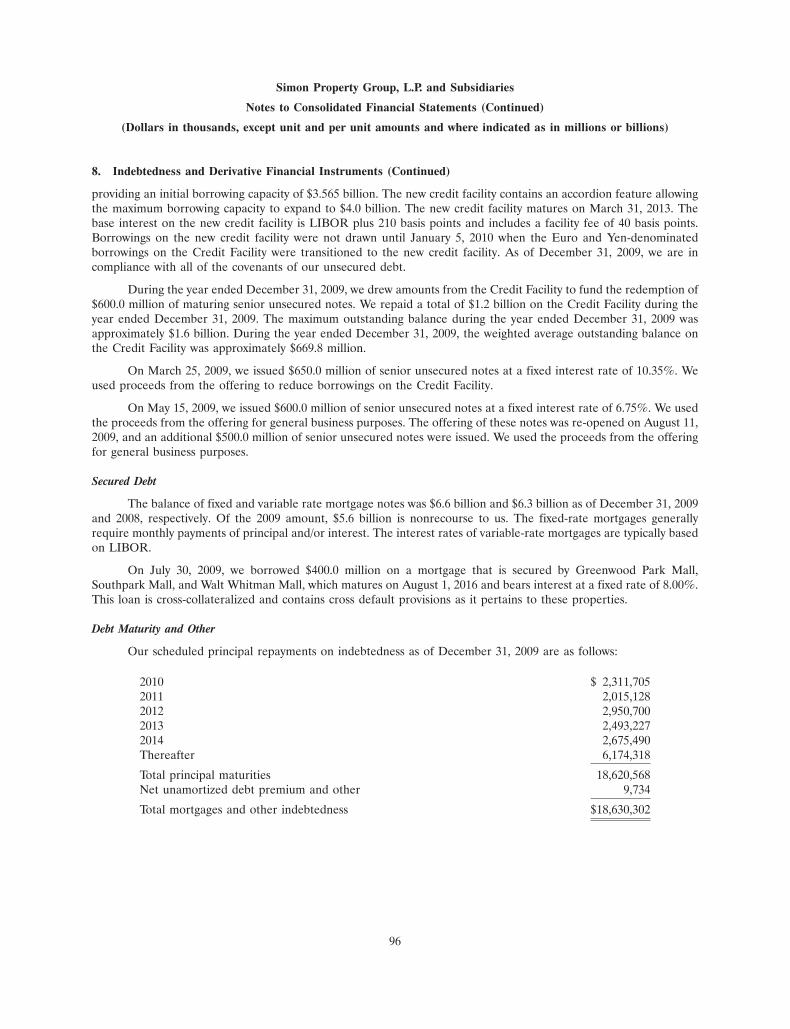
Simon Property Group, L.P. and Subsidiaries
Notes to Consolidated Financial Statements (Continued)
(Dollars in thousands, except unit and per unit amounts and where indicated as in millions or billions)
8. Indebtedness and Derivative Financial Instruments (Continued)
providing an initial borrowing capacity of $3.565 billion. The new credit facility contains an accordion feature allowingthe maximum borrowing capacity to expand to $4.0 billion. The new credit facility matures on March 31, 2013. Thebase interest on the new credit facility is LIBOR plus 210 basis points and includes a facility fee of 40 basis points.Borrowings on the new credit facility were not drawn until January 5, 2010 when the Euro and Yen-denominatedborrowings on the Credit Facility were transitioned to the new credit facility. As of December 31, 2009, we are incompliance with all of the covenants of our unsecured debt.
During the year ended December 31, 2009, we drew amounts from the Credit Facility to fund the redemption of$600.0 million of maturing senior unsecured notes. We repaid a total of $1.2 billion on the Credit Facility during theyear ended December 31, 2009. The maximum outstanding balance during the year ended December 31, 2009 wasapproximately $1.6 billion. During the year ended December 31, 2009, the weighted average outstanding balance onthe Credit Facility was approximately $669.8 million.
On March 25, 2009, we issued $650.0 million of senior unsecured notes at a fixed interest rate of 10.35%. Weused proceeds from the offering to reduce borrowings on the Credit Facility.
On May 15, 2009, we issued $600.0 million of senior unsecured notes at a fixed interest rate of 6.75%. We usedthe proceeds from the offering for general business purposes. The offering of these notes was re-opened on August 11,2009, and an additional $500.0 million of senior unsecured notes were issued. We used the proceeds from the offeringfor general business purposes.
Secured Debt
The balance of fixed and variable rate mortgage notes was $6.6 billion and $6.3 billion as of December 31, 2009and 2008, respectively. Of the 2009 amount, $5.6 billion is nonrecourse to us. The fixed-rate mortgages generallyrequire monthly payments of principal and/or interest. The interest rates of variable-rate mortgages are typically basedon LIBOR.
On July 30, 2009, we borrowed $400.0 million on a mortgage that is secured by Greenwood Park Mall,Southpark Mall, and Walt Whitman Mall, which matures on August 1, 2016 and bears interest at a fixed rate of 8.00%.This loan is cross-collateralized and contains cross default provisions as it pertains to these properties.
Debt Maturity and Other
Our scheduled principal repayments on indebtedness as of December 31, 2009 are as follows:
2010 $ 2,311,7052011 2,015,1282012 2,950,7002013 2,493,2272014 2,675,490Thereafter 6,174,318
Total principal maturities 18,620,568Net unamortized debt premium and other 9,734
Total mortgages and other indebtedness $18,630,302
96
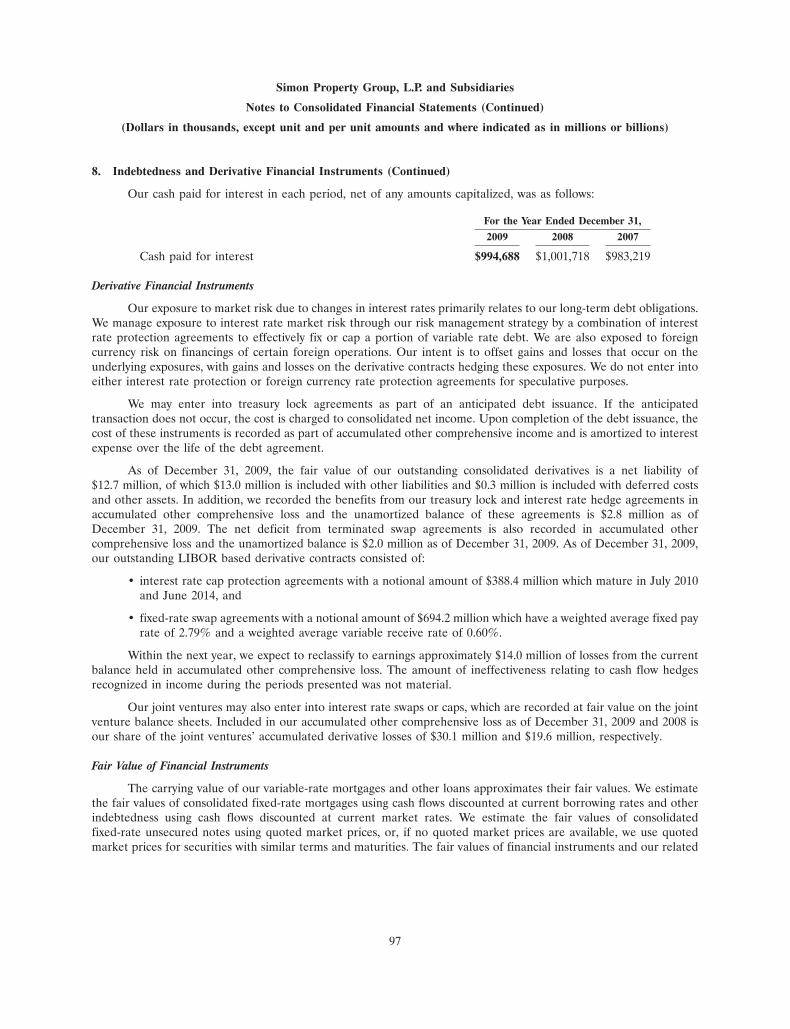
Simon Property Group, L.P. and Subsidiaries
Notes to Consolidated Financial Statements (Continued)
(Dollars in thousands, except unit and per unit amounts and where indicated as in millions or billions)
8. Indebtedness and Derivative Financial Instruments (Continued)
Our cash paid for interest in each period, net of any amounts capitalized, was as follows:
For the Year Ended December 31,
2009 2008 2007
Cash paid for interest $994,688 $1,001,718 $983,219
Derivative Financial Instruments
Our exposure to market risk due to changes in interest rates primarily relates to our long-term debt obligations.We manage exposure to interest rate market risk through our risk management strategy by a combination of interestrate protection agreements to effectively fix or cap a portion of variable rate debt. We are also exposed to foreigncurrency risk on financings of certain foreign operations. Our intent is to offset gains and losses that occur on theunderlying exposures, with gains and losses on the derivative contracts hedging these exposures. We do not enter intoeither interest rate protection or foreign currency rate protection agreements for speculative purposes.
We may enter into treasury lock agreements as part of an anticipated debt issuance. If the anticipatedtransaction does not occur, the cost is charged to consolidated net income. Upon completion of the debt issuance, thecost of these instruments is recorded as part of accumulated other comprehensive income and is amortized to interestexpense over the life of the debt agreement.
As of December 31, 2009, the fair value of our outstanding consolidated derivatives is a net liability of$12.7 million, of which $13.0 million is included with other liabilities and $0.3 million is included with deferred costsand other assets. In addition, we recorded the benefits from our treasury lock and interest rate hedge agreements inaccumulated other comprehensive loss and the unamortized balance of these agreements is $2.8 million as ofDecember 31, 2009. The net deficit from terminated swap agreements is also recorded in accumulated othercomprehensive loss and the unamortized balance is $2.0 million as of December 31, 2009. As of December 31, 2009,our outstanding LIBOR based derivative contracts consisted of:
• interest rate cap protection agreements with a notional amount of $388.4 million which mature in July 2010and June 2014, and
• fixed-rate swap agreements with a notional amount of $694.2 million which have a weighted average fixed payrate of 2.79% and a weighted average variable receive rate of 0.60%.
Within the next year, we expect to reclassify to earnings approximately $14.0 million of losses from the currentbalance held in accumulated other comprehensive loss. The amount of ineffectiveness relating to cash flow hedgesrecognized in income during the periods presented was not material.
Our joint ventures may also enter into interest rate swaps or caps, which are recorded at fair value on the jointventure balance sheets. Included in our accumulated other comprehensive loss as of December 31, 2009 and 2008 isour share of the joint ventures’ accumulated derivative losses of $30.1 million and $19.6 million, respectively.
Fair Value of Financial Instruments
The carrying value of our variable-rate mortgages and other loans approximates their fair values. We estimatethe fair values of consolidated fixed-rate mortgages using cash flows discounted at current borrowing rates and otherindebtedness using cash flows discounted at current market rates. We estimate the fair values of consolidatedfixed-rate unsecured notes using quoted market prices, or, if no quoted market prices are available, we use quotedmarket prices for securities with similar terms and maturities. The fair values of financial instruments and our related
97
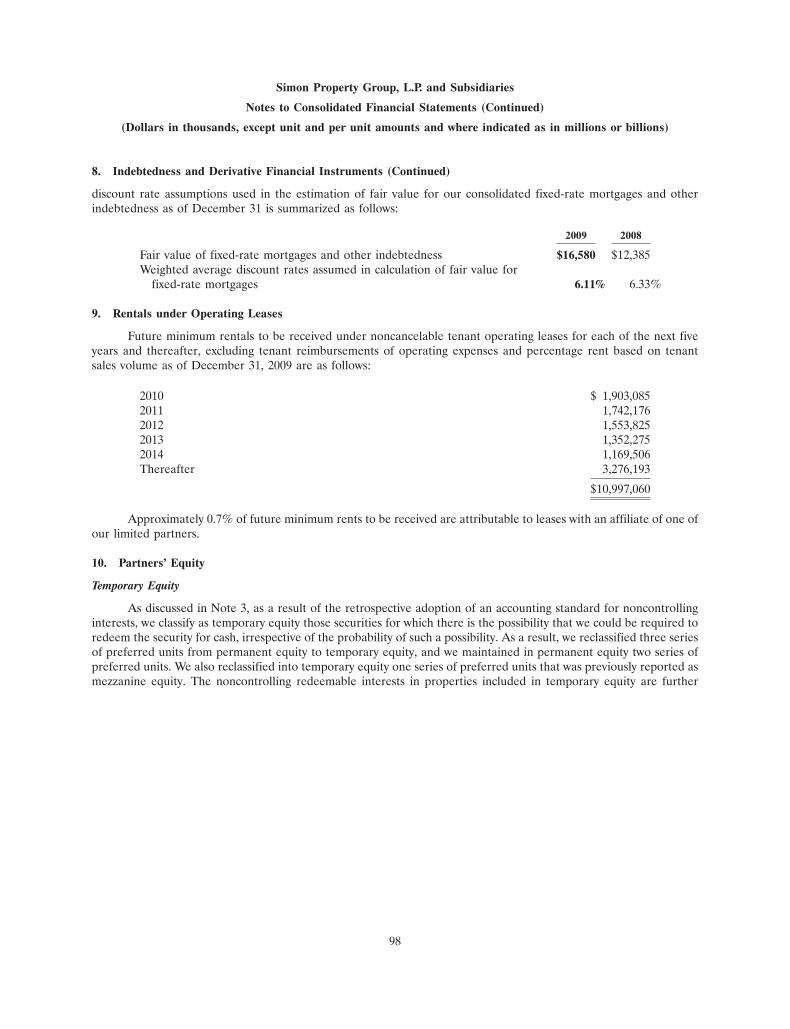
Simon Property Group, L.P. and Subsidiaries
Notes to Consolidated Financial Statements (Continued)
(Dollars in thousands, except unit and per unit amounts and where indicated as in millions or billions)
8. Indebtedness and Derivative Financial Instruments (Continued)
discount rate assumptions used in the estimation of fair value for our consolidated fixed-rate mortgages and otherindebtedness as of December 31 is summarized as follows:
2009 2008
Fair value of fixed-rate mortgages and other indebtedness $16,580 $12,385Weighted average discount rates assumed in calculation of fair value for
fixed-rate mortgages 6.11% 6.33%
9. Rentals under Operating Leases
Future minimum rentals to be received under noncancelable tenant operating leases for each of the next fiveyears and thereafter, excluding tenant reimbursements of operating expenses and percentage rent based on tenantsales volume as of December 31, 2009 are as follows:
2010 $ 1,903,0852011 1,742,1762012 1,553,8252013 1,352,2752014 1,169,506Thereafter 3,276,193
$10,997,060
Approximately 0.7% of future minimum rents to be received are attributable to leases with an affiliate of one ofour limited partners.
10. Partners’ Equity
Temporary Equity
As discussed in Note 3, as a result of the retrospective adoption of an accounting standard for noncontrollinginterests, we classify as temporary equity those securities for which there is the possibility that we could be required toredeem the security for cash, irrespective of the probability of such a possibility. As a result, we reclassified three seriesof preferred units from permanent equity to temporary equity, and we maintained in permanent equity two series ofpreferred units. We also reclassified into temporary equity one series of preferred units that was previously reported asmezzanine equity. The noncontrolling redeemable interests in properties included in temporary equity are further
98
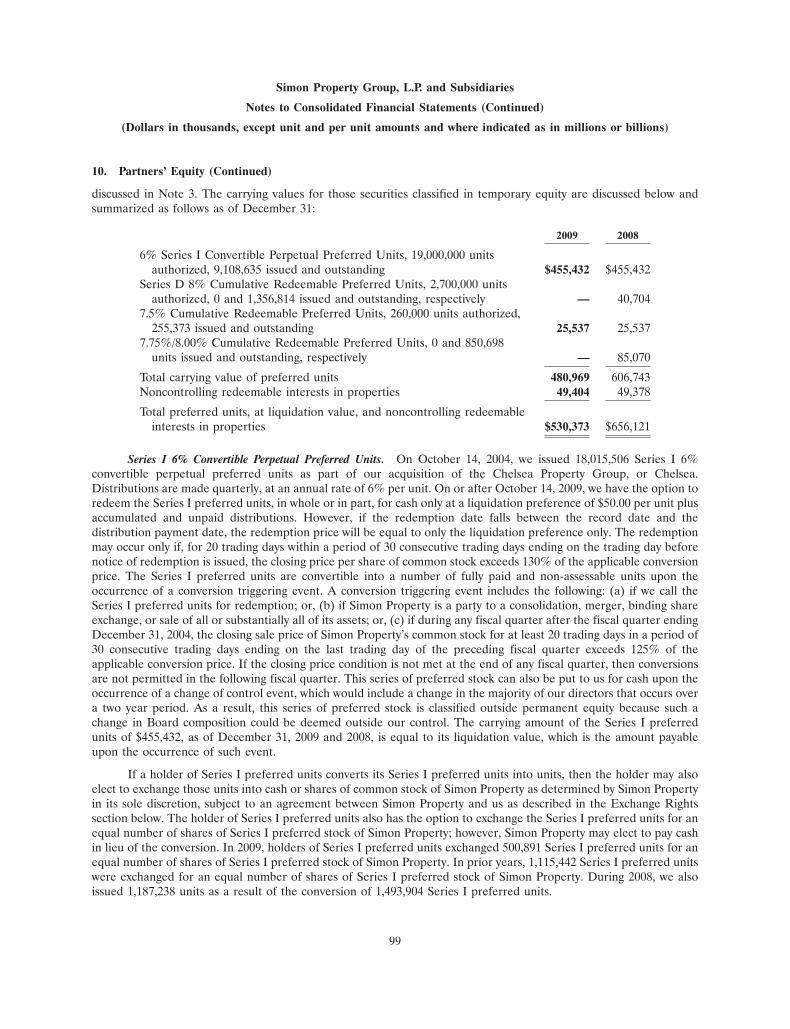
Simon Property Group, L.P. and Subsidiaries
Notes to Consolidated Financial Statements (Continued)
(Dollars in thousands, except unit and per unit amounts and where indicated as in millions or billions)
10. Partners’ Equity (Continued)
discussed in Note 3. The carrying values for those securities classified in temporary equity are discussed below andsummarized as follows as of December 31:
2009 2008
6% Series I Convertible Perpetual Preferred Units, 19,000,000 unitsauthorized, 9,108,635 issued and outstanding $455,432 $455,432
Series D 8% Cumulative Redeemable Preferred Units, 2,700,000 unitsauthorized, 0 and 1,356,814 issued and outstanding, respectively — 40,704
7.5% Cumulative Redeemable Preferred Units, 260,000 units authorized,255,373 issued and outstanding 25,537 25,537
7.75%/8.00% Cumulative Redeemable Preferred Units, 0 and 850,698units issued and outstanding, respectively — 85,070
Total carrying value of preferred units 480,969 606,743Noncontrolling redeemable interests in properties 49,404 49,378
Total preferred units, at liquidation value, and noncontrolling redeemableinterests in properties $530,373 $656,121
Series I 6% Convertible Perpetual Preferred Units. On October 14, 2004, we issued 18,015,506 Series I 6%convertible perpetual preferred units as part of our acquisition of the Chelsea Property Group, or Chelsea.Distributions are made quarterly, at an annual rate of 6% per unit. On or after October 14, 2009, we have the option toredeem the Series I preferred units, in whole or in part, for cash only at a liquidation preference of $50.00 per unit plusaccumulated and unpaid distributions. However, if the redemption date falls between the record date and thedistribution payment date, the redemption price will be equal to only the liquidation preference only. The redemptionmay occur only if, for 20 trading days within a period of 30 consecutive trading days ending on the trading day beforenotice of redemption is issued, the closing price per share of common stock exceeds 130% of the applicable conversionprice. The Series I preferred units are convertible into a number of fully paid and non-assessable units upon theoccurrence of a conversion triggering event. A conversion triggering event includes the following: (a) if we call theSeries I preferred units for redemption; or, (b) if Simon Property is a party to a consolidation, merger, binding shareexchange, or sale of all or substantially all of its assets; or, (c) if during any fiscal quarter after the fiscal quarter endingDecember 31, 2004, the closing sale price of Simon Property’s common stock for at least 20 trading days in a period of30 consecutive trading days ending on the last trading day of the preceding fiscal quarter exceeds 125% of theapplicable conversion price. If the closing price condition is not met at the end of any fiscal quarter, then conversionsare not permitted in the following fiscal quarter. This series of preferred stock can also be put to us for cash upon theoccurrence of a change of control event, which would include a change in the majority of our directors that occurs overa two year period. As a result, this series of preferred stock is classified outside permanent equity because such achange in Board composition could be deemed outside our control. The carrying amount of the Series I preferredunits of $455,432, as of December 31, 2009 and 2008, is equal to its liquidation value, which is the amount payableupon the occurrence of such event.
If a holder of Series I preferred units converts its Series I preferred units into units, then the holder may alsoelect to exchange those units into cash or shares of common stock of Simon Property as determined by Simon Propertyin its sole discretion, subject to an agreement between Simon Property and us as described in the Exchange Rightssection below. The holder of Series I preferred units also has the option to exchange the Series I preferred units for anequal number of shares of Series I preferred stock of Simon Property; however, Simon Property may elect to pay cashin lieu of the conversion. In 2009, holders of Series I preferred units exchanged 500,891 Series I preferred units for anequal number of shares of Series I preferred stock of Simon Property. In prior years, 1,115,442 Series I preferred unitswere exchanged for an equal number of shares of Series I preferred stock of Simon Property. During 2008, we alsoissued 1,187,238 units as a result of the conversion of 1,493,904 Series I preferred units.
99
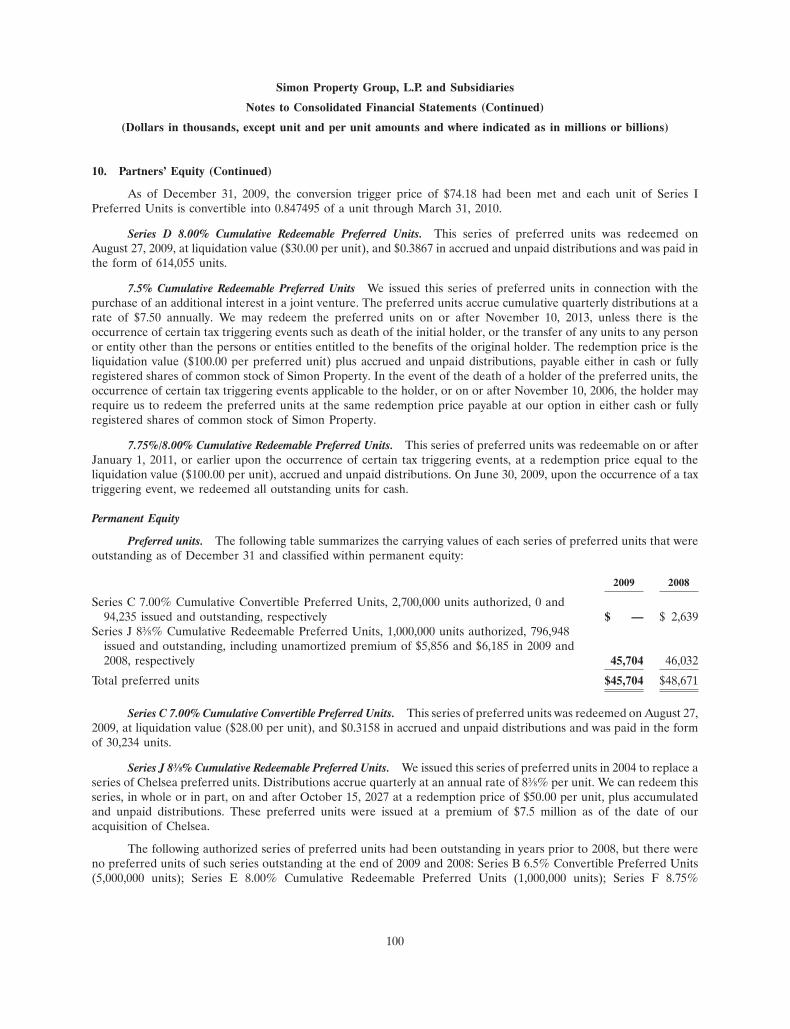
Simon Property Group, L.P. and Subsidiaries
Notes to Consolidated Financial Statements (Continued)
(Dollars in thousands, except unit and per unit amounts and where indicated as in millions or billions)
10. Partners’ Equity (Continued)
As of December 31, 2009, the conversion trigger price of $74.18 had been met and each unit of Series IPreferred Units is convertible into 0.847495 of a unit through March 31, 2010.
Series D 8.00% Cumulative Redeemable Preferred Units. This series of preferred units was redeemed onAugust 27, 2009, at liquidation value ($30.00 per unit), and $0.3867 in accrued and unpaid distributions and was paid inthe form of 614,055 units.
7.5% Cumulative Redeemable Preferred Units We issued this series of preferred units in connection with thepurchase of an additional interest in a joint venture. The preferred units accrue cumulative quarterly distributions at arate of $7.50 annually. We may redeem the preferred units on or after November 10, 2013, unless there is theoccurrence of certain tax triggering events such as death of the initial holder, or the transfer of any units to any personor entity other than the persons or entities entitled to the benefits of the original holder. The redemption price is theliquidation value ($100.00 per preferred unit) plus accrued and unpaid distributions, payable either in cash or fullyregistered shares of common stock of Simon Property. In the event of the death of a holder of the preferred units, theoccurrence of certain tax triggering events applicable to the holder, or on or after November 10, 2006, the holder mayrequire us to redeem the preferred units at the same redemption price payable at our option in either cash or fullyregistered shares of common stock of Simon Property.
7.75%/8.00% Cumulative Redeemable Preferred Units. This series of preferred units was redeemable on or afterJanuary 1, 2011, or earlier upon the occurrence of certain tax triggering events, at a redemption price equal to theliquidation value ($100.00 per unit), accrued and unpaid distributions. On June 30, 2009, upon the occurrence of a taxtriggering event, we redeemed all outstanding units for cash.
Permanent Equity
Preferred units. The following table summarizes the carrying values of each series of preferred units that wereoutstanding as of December 31 and classified within permanent equity:
2009 2008
Series C 7.00% Cumulative Convertible Preferred Units, 2,700,000 units authorized, 0 and94,235 issued and outstanding, respectively $ — $ 2,639
Series J 83⁄8% Cumulative Redeemable Preferred Units, 1,000,000 units authorized, 796,948issued and outstanding, including unamortized premium of $5,856 and $6,185 in 2009 and2008, respectively 45,704 46,032
Total preferred units $45,704 $48,671
Series C 7.00% Cumulative Convertible Preferred Units. This series of preferred units was redeemed on August 27,2009, at liquidation value ($28.00 per unit), and $0.3158 in accrued and unpaid distributions and was paid in the formof 30,234 units.
Series J 83⁄8% Cumulative Redeemable Preferred Units. We issued this series of preferred units in 2004 to replace aseries of Chelsea preferred units. Distributions accrue quarterly at an annual rate of 83⁄8% per unit. We can redeem thisseries, in whole or in part, on and after October 15, 2027 at a redemption price of $50.00 per unit, plus accumulatedand unpaid distributions. These preferred units were issued at a premium of $7.5 million as of the date of ouracquisition of Chelsea.
The following authorized series of preferred units had been outstanding in years prior to 2008, but there wereno preferred units of such series outstanding at the end of 2009 and 2008: Series B 6.5% Convertible Preferred Units(5,000,000 units); Series E 8.00% Cumulative Redeemable Preferred Units (1,000,000 units); Series F 8.75%
100
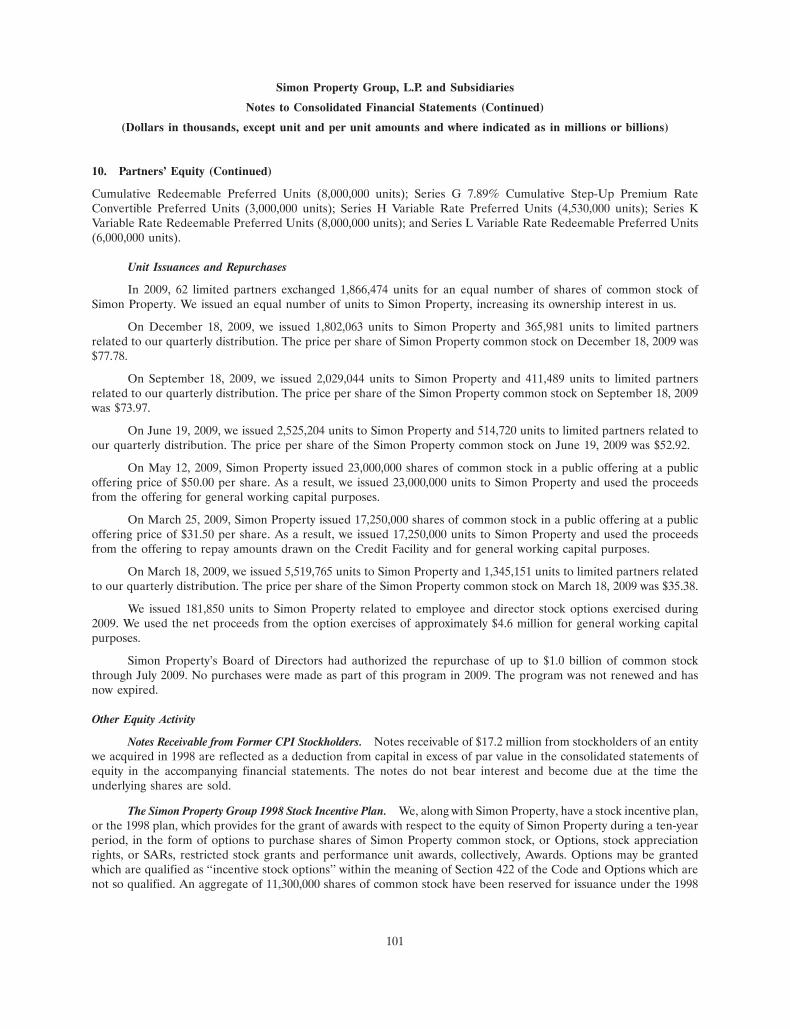
Simon Property Group, L.P. and Subsidiaries
Notes to Consolidated Financial Statements (Continued)
(Dollars in thousands, except unit and per unit amounts and where indicated as in millions or billions)
10. Partners’ Equity (Continued)
Cumulative Redeemable Preferred Units (8,000,000 units); Series G 7.89% Cumulative Step-Up Premium RateConvertible Preferred Units (3,000,000 units); Series H Variable Rate Preferred Units (4,530,000 units); Series KVariable Rate Redeemable Preferred Units (8,000,000 units); and Series L Variable Rate Redeemable Preferred Units(6,000,000 units).
Unit Issuances and Repurchases
In 2009, 62 limited partners exchanged 1,866,474 units for an equal number of shares of common stock ofSimon Property. We issued an equal number of units to Simon Property, increasing its ownership interest in us.
On December 18, 2009, we issued 1,802,063 units to Simon Property and 365,981 units to limited partnersrelated to our quarterly distribution. The price per share of Simon Property common stock on December 18, 2009 was$77.78.
On September 18, 2009, we issued 2,029,044 units to Simon Property and 411,489 units to limited partnersrelated to our quarterly distribution. The price per share of the Simon Property common stock on September 18, 2009was $73.97.
On June 19, 2009, we issued 2,525,204 units to Simon Property and 514,720 units to limited partners related toour quarterly distribution. The price per share of the Simon Property common stock on June 19, 2009 was $52.92.
On May 12, 2009, Simon Property issued 23,000,000 shares of common stock in a public offering at a publicoffering price of $50.00 per share. As a result, we issued 23,000,000 units to Simon Property and used the proceedsfrom the offering for general working capital purposes.
On March 25, 2009, Simon Property issued 17,250,000 shares of common stock in a public offering at a publicoffering price of $31.50 per share. As a result, we issued 17,250,000 units to Simon Property and used the proceedsfrom the offering to repay amounts drawn on the Credit Facility and for general working capital purposes.
On March 18, 2009, we issued 5,519,765 units to Simon Property and 1,345,151 units to limited partners relatedto our quarterly distribution. The price per share of the Simon Property common stock on March 18, 2009 was $35.38.
We issued 181,850 units to Simon Property related to employee and director stock options exercised during2009. We used the net proceeds from the option exercises of approximately $4.6 million for general working capitalpurposes.
Simon Property’s Board of Directors had authorized the repurchase of up to $1.0 billion of common stockthrough July 2009. No purchases were made as part of this program in 2009. The program was not renewed and hasnow expired.
Other Equity Activity
Notes Receivable from Former CPI Stockholders. Notes receivable of $17.2 million from stockholders of an entitywe acquired in 1998 are reflected as a deduction from capital in excess of par value in the consolidated statements ofequity in the accompanying financial statements. The notes do not bear interest and become due at the time theunderlying shares are sold.
The Simon Property Group 1998 Stock Incentive Plan. We, along with Simon Property, have a stock incentive plan,or the 1998 plan, which provides for the grant of awards with respect to the equity of Simon Property during a ten-yearperiod, in the form of options to purchase shares of Simon Property common stock, or Options, stock appreciationrights, or SARs, restricted stock grants and performance unit awards, collectively, Awards. Options may be grantedwhich are qualified as ‘‘incentive stock options’’ within the meaning of Section 422 of the Code and Options which arenot so qualified. An aggregate of 11,300,000 shares of common stock have been reserved for issuance under the 1998
101

Simon Property Group, L.P. and Subsidiaries
Notes to Consolidated Financial Statements (Continued)
(Dollars in thousands, except unit and per unit amounts and where indicated as in millions or billions)
10. Partners’ Equity (Continued)
plan. Additionally, the partnership agreement requires Simon Property to sell shares to us, at fair value, sufficient tosatisfy the exercising of any stock options, and for Simon Property to purchase units for cash in an amount equal to thefair market value of such shares issued on the exercise of stock options.
Administration. The 1998 plan is administered by the Simon Property’s Compensation Committee of theBoard of Directors. The committee determines which eligible individuals may participate and the type, extent andterms of the awards to be granted to them. In addition, the committee interprets the 1998 plan and makes all otherdeterminations deemed advisable for its administration. Options granted to employees become exercisable over theperiod determined by the committee. The exercise price of an employee option may not be less than the fair marketvalue of the shares on the date of grant. Employee options generally vest over a three-year period and expire ten yearsfrom the date of grant. Since 2001, Simon Property have not granted any options to employees, except for a series ofreload options we assumed as part of a prior business combination.
Automatic Awards For Eligible Directors. Directors of Simon Property who are not employees or employees ofaffiliates of Simon Property, or Eligible Directors, receive automatic awards under the 1998 plan. Until 2003, theseawards took the form of stock options. Since then, the awards have been shares of restricted stock of Simon Property.
Each eligible director receives on the first day of the first calendar month following his or her initial election anaward of restricted stock with a value of $82,500 (pro-rated for partial years of service). Thereafter, as of the date ofeach annual meeting of stockholders, eligible directors who are re-elected receive an award of restricted stock having avalue of $82,500. In addition, eligible directors who serve as chairpersons of the standing committees (excluding theExecutive Committee) receive an additional annual award of restricted stock having a value of $10,000 (in the case ofthe Audit Committee) or $7,500 (in the case of all other standing committees). The Lead Director also receives anannual restricted stock award having a value of $12,500. The restricted stock vests in full after one year.
Once vested, the delivery of the shares of restricted stock (including reinvested dividends) is deferred under ourDirector Deferred Compensation Plan until the director retires, dies or becomes disabled or otherwise no longerserves as a director. The directors may vote and are entitled to receive dividends on the underlying shares; however,any dividends on the shares of restricted stock must be reinvested in shares of common stock and held in the deferredcompensation plan until the shares of restricted stock are delivered to the former director. The committee successivelyapproved annual stock incentive programs each year from 2001 until 2009 when no program was established.
In addition to automatic awards, eligible directors may be granted discretionary awards under the 1998 plan.
Restricted Stock. The 1998 plan also provides for shares of restricted common stock of Simon Property to begranted to certain employees at no cost to those employees, subject to achievement of certain financial and return-based performance measures established by the committee related to the most recent year’s performance. Oncegranted, the shares of restricted stock then vest annually over a four-year period (25% each year) beginning onJanuary 1 of each year. The cost of restricted stock grants, which is based upon the stock’s fair market value on thegrant date, is charged to earnings ratably over the vesting period. Through December 31, 2009 a total of 4,992,636shares of restricted stock, net of forfeitures, have been awarded under the plan. Information regarding restricted stockawards is summarized in the following table for each of the years presented:
For the Year EndedDecember 31,
2009 2008 2007
Restricted stock shares awarded during the year, net offorfeitures 254,227 276,872 222,725
Weighted average fair value of shares granted during the year $ 29.44 $ 85.77 $120.55Amortization expense $22,870 $28,640 $26,779
102
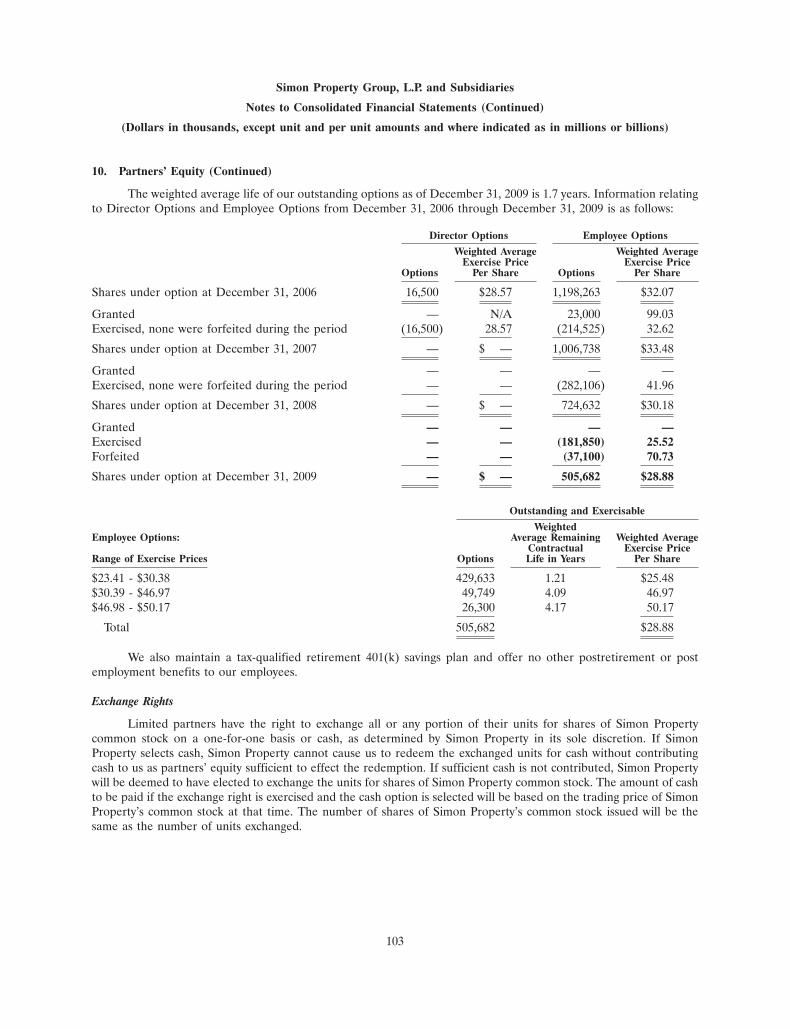
Simon Property Group, L.P. and Subsidiaries
Notes to Consolidated Financial Statements (Continued)
(Dollars in thousands, except unit and per unit amounts and where indicated as in millions or billions)
10. Partners’ Equity (Continued)
The weighted average life of our outstanding options as of December 31, 2009 is 1.7 years. Information relatingto Director Options and Employee Options from December 31, 2006 through December 31, 2009 is as follows:
Director Options Employee Options
Weighted Average Weighted AverageExercise Price Exercise Price
Options Per Share Options Per Share
Shares under option at December 31, 2006 16,500 $28.57 1,198,263 $32.07
Granted — N/A 23,000 99.03Exercised, none were forfeited during the period (16,500) 28.57 (214,525) 32.62
Shares under option at December 31, 2007 — $ — 1,006,738 $33.48
Granted — — — —Exercised, none were forfeited during the period — — (282,106) 41.96
Shares under option at December 31, 2008 — $ — 724,632 $30.18
Granted — — — —Exercised — — (181,850) 25.52Forfeited — — (37,100) 70.73
Shares under option at December 31, 2009 — $ — 505,682 $28.88
Outstanding and Exercisable
WeightedEmployee Options: Average Remaining Weighted Average
Contractual Exercise PriceRange of Exercise Prices Options Life in Years Per Share
$23.41 - $30.38 429,633 1.21 $25.48$30.39 - $46.97 49,749 4.09 46.97$46.98 - $50.17 26,300 4.17 50.17
Total 505,682 $28.88
We also maintain a tax-qualified retirement 401(k) savings plan and offer no other postretirement or postemployment benefits to our employees.
Exchange Rights
Limited partners have the right to exchange all or any portion of their units for shares of Simon Propertycommon stock on a one-for-one basis or cash, as determined by Simon Property in its sole discretion. If SimonProperty selects cash, Simon Property cannot cause us to redeem the exchanged units for cash without contributingcash to us as partners’ equity sufficient to effect the redemption. If sufficient cash is not contributed, Simon Propertywill be deemed to have elected to exchange the units for shares of Simon Property common stock. The amount of cashto be paid if the exchange right is exercised and the cash option is selected will be based on the trading price of SimonProperty’s common stock at that time. The number of shares of Simon Property’s common stock issued will be thesame as the number of units exchanged.
103

Simon Property Group, L.P. and Subsidiaries
Notes to Consolidated Financial Statements (Continued)
(Dollars in thousands, except unit and per unit amounts and where indicated as in millions or billions)
11. Commitments and Contingencies
Litigation
We are involved in various legal proceedings that arise in the ordinary course of our business. We believe thatsuch litigation, claims and administrative proceedings will not have a material adverse impact on our financial positionor our results of operations. We record a liability when a loss is considered probable and the amount can be reasonablyestimated.
Lease Commitments
As of December 31, 2009, a total of 29 of the consolidated properties are subject to ground leases. Thetermination dates of these ground leases range from 2012 to 2090. These ground leases generally require us to makefixed annual rental payments, or a fixed annual rental plus a percentage rent component based upon the revenues ortotal sales of the property. Some of these leases also include escalation clauses and renewal options. We incurredground lease expense included in other expense as follows:
For the Year EndedDecember 31,
2009 2008 2007
Ground lease expense $32,086 $30,681 $30,499
Future minimum lease payments due under these ground leases for years ending December 31, excludingapplicable extension options, are as follows:
2010 $ 16,7822011 16,8232012 16,9372013 17,1842014 17,084Thereafter 648,360
$733,170
Insurance
We maintain commercial general liability, fire, flood, extended coverage and rental loss insurance on all of ourproperties in the United States through wholly-owned captive insurance entities and other self-insurance mechanisms.Rosewood Indemnity, Ltd. and Bridgewood Insurance Company, Ltd. are our wholly-owned captive insurancesubsidiaries, and have agreed to indemnify our general liability carrier for a specific layer of losses for the propertiesthat are covered under these arrangements. The carrier has, in turn, agreed to provide evidence of coverage for thislayer of losses under the terms and conditions of the carrier’s policy. A similar policy written through these captiveinsurance entities also provides initial coverage for property insurance and certain windstorm risks at the propertieslocated in coastal windstorm locations.
We currently maintain insurance coverage against acts of terrorism on all of our properties in the United Stateson an ‘‘all risk’’ basis in the amount of up to $1 billion per occurrence for certified foreign acts of terrorism and$500 million per occurrence for non-certified domestic acts of terrorism. The current federal laws which provide thiscoverage are expected to operate through 2014. Despite the existence of this insurance coverage, any threatened oractual terrorist attacks in high profile markets could adversely affect our property values, revenues, consumer trafficand tenant sales.
104
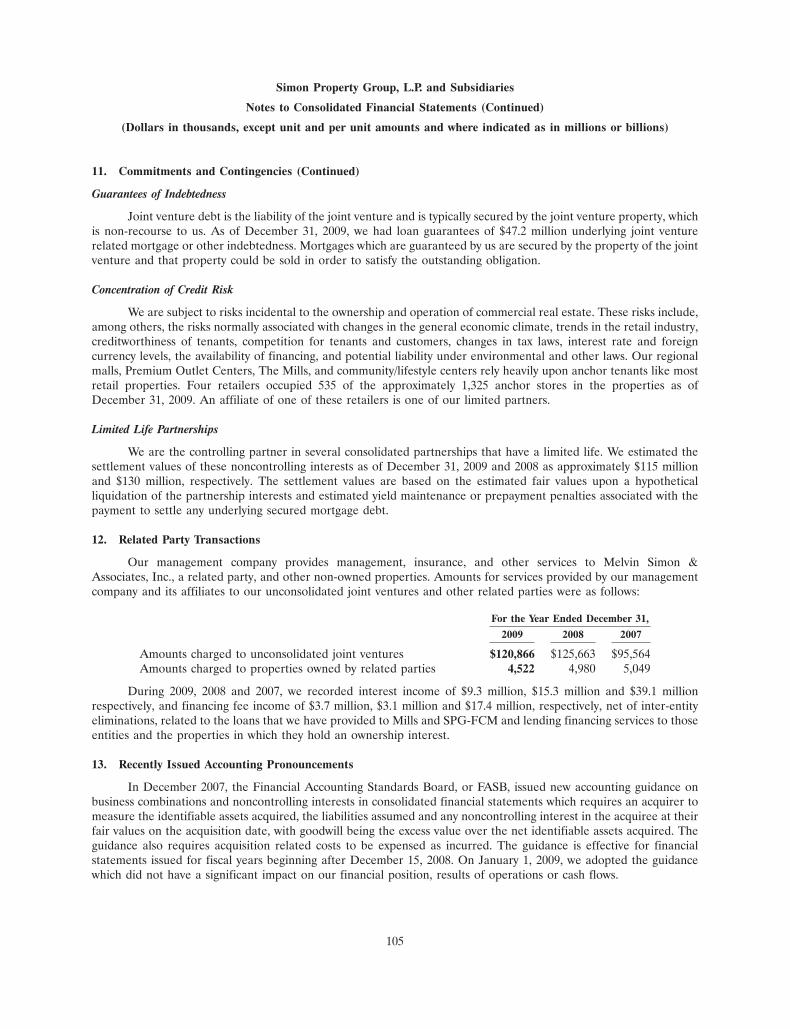
Simon Property Group, L.P. and Subsidiaries
Notes to Consolidated Financial Statements (Continued)
(Dollars in thousands, except unit and per unit amounts and where indicated as in millions or billions)
11. Commitments and Contingencies (Continued)
Guarantees of Indebtedness
Joint venture debt is the liability of the joint venture and is typically secured by the joint venture property, whichis non-recourse to us. As of December 31, 2009, we had loan guarantees of $47.2 million underlying joint venturerelated mortgage or other indebtedness. Mortgages which are guaranteed by us are secured by the property of the jointventure and that property could be sold in order to satisfy the outstanding obligation.
Concentration of Credit Risk
We are subject to risks incidental to the ownership and operation of commercial real estate. These risks include,among others, the risks normally associated with changes in the general economic climate, trends in the retail industry,creditworthiness of tenants, competition for tenants and customers, changes in tax laws, interest rate and foreigncurrency levels, the availability of financing, and potential liability under environmental and other laws. Our regionalmalls, Premium Outlet Centers, The Mills, and community/lifestyle centers rely heavily upon anchor tenants like mostretail properties. Four retailers occupied 535 of the approximately 1,325 anchor stores in the properties as ofDecember 31, 2009. An affiliate of one of these retailers is one of our limited partners.
Limited Life Partnerships
We are the controlling partner in several consolidated partnerships that have a limited life. We estimated thesettlement values of these noncontrolling interests as of December 31, 2009 and 2008 as approximately $115 millionand $130 million, respectively. The settlement values are based on the estimated fair values upon a hypotheticalliquidation of the partnership interests and estimated yield maintenance or prepayment penalties associated with thepayment to settle any underlying secured mortgage debt.
12. Related Party Transactions
Our management company provides management, insurance, and other services to Melvin Simon &Associates, Inc., a related party, and other non-owned properties. Amounts for services provided by our managementcompany and its affiliates to our unconsolidated joint ventures and other related parties were as follows:
For the Year Ended December 31,
2009 2008 2007
Amounts charged to unconsolidated joint ventures $120,866 $125,663 $95,564Amounts charged to properties owned by related parties 4,522 4,980 5,049
During 2009, 2008 and 2007, we recorded interest income of $9.3 million, $15.3 million and $39.1 millionrespectively, and financing fee income of $3.7 million, $3.1 million and $17.4 million, respectively, net of inter-entityeliminations, related to the loans that we have provided to Mills and SPG-FCM and lending financing services to thoseentities and the properties in which they hold an ownership interest.
13. Recently Issued Accounting Pronouncements
In December 2007, the Financial Accounting Standards Board, or FASB, issued new accounting guidance onbusiness combinations and noncontrolling interests in consolidated financial statements which requires an acquirer tomeasure the identifiable assets acquired, the liabilities assumed and any noncontrolling interest in the acquiree at theirfair values on the acquisition date, with goodwill being the excess value over the net identifiable assets acquired. Theguidance also requires acquisition related costs to be expensed as incurred. The guidance is effective for financialstatements issued for fiscal years beginning after December 15, 2008. On January 1, 2009, we adopted the guidancewhich did not have a significant impact on our financial position, results of operations or cash flows.
105

Simon Property Group, L.P. and Subsidiaries
Notes to Consolidated Financial Statements (Continued)
(Dollars in thousands, except unit and per unit amounts and where indicated as in millions or billions)
13. Recently Issued Accounting Pronouncements (Continued)
In February 2008, the FASB issued a staff position which permitted a one-year deferral for the implementationof previously issued guidance related to fair value measurements with regard to nonfinancial assets and liabilities thatare not recognized or disclosed at fair value in the financial statements on a recurring basis (at least annually). OnJanuary 1, 2009, we adopted the fair value measurement guidance as it relates to nonfinancial assets and nonfinancialliabilities that are not recognized or disclosed at fair value in the financial statements on at least an annual basis. Theadoption had no impact on our financial position, results of operations or cash flows. The provisions of the guidanceare applied at such time as a fair value measurement of a nonfinancial asset or nonfinancial liability is required, whichmay result in a fair value that is materially different than would have been calculated prior to adoption.
In June 2008, the FASB ratified guidance which provides an entity use a two step approach to evaluate whetheran equity-linked financial instrument (or embedded feature) is indexed to its own stock, including evaluating theinstrument’s contingent exercise and settlement provisions. We adopted the guidance on January 1, 2009 which had noimpact on our financial position, results of operations or cash flows.
On January 1, 2009, we adopted guidance on determining whether instruments granted in share-based paymenttransactions are participating securities. Under this guidance, unvested share-based payment awards that containnonforfeitable rights to dividends or dividend equivalents (whether paid or unpaid) are participating securities and areincluded in the computation of earnings per unit pursuant to the two-class method. The adoption of the guidance didnot have a significant impact on reported earnings per unit.
In May 2009, the FASB issued guidance which established general standards of accounting for and disclosure ofevents that occur after the balance sheet date but before financial statements are issued or are available to be issued.The statement introduces new terminology but is based on the same principles that previously existed in the accountingstandards. The guidance requires disclosure of the date through which management has evaluated subsequent eventsand whether that date represents the date the financial statements were issued or the date the financial statementswere available to be issued. The guidance was effective for interim and annual periods ending after June 15, 2009. Theadoption of this statement did not have any impact on our financial position, results of operations or cash flows.
In June 2009, the FASB issued the FASB Accounting Standards Codification, or Codification, which is effectivefor interim and annual periods ending after September 15, 2009. The Codification defines a new hierarchy forU.S. GAAP and establishes the Codification as the sole source for authoritative guidance to be applied bynongovernmental entities. The adoption of the Codification changed the manner in which U.S. GAAP guidance isreferenced, but did not have any impact on our financial position, results of operations or cash flows.
In June 2009, the FASB also issued an amendment to the accounting and disclosure requirements for theconsolidation of variable interest entities, or VIEs. This amendment requires an enterprise to perform a qualitativeanalysis when determining whether or not it must consolidate a VIE. The amendment also requires an enterprise tocontinuously reassess whether it must consolidate a VIE. Additionally, the amendment requires enhanced disclosuresabout an enterprise’s involvement with VIEs and any significant change in risk exposure due to that involvement, aswell as how its involvement with VIEs impacts the enterprise’s financial statements. Finally, an enterprise will berequired to disclose significant judgments and assumptions used to determine whether or not to consolidate a VIE.This amendment is effective for financial statements issued for fiscal years beginning after November 15, 2009.Management is in the process of determining the impact of adopting this amendment.
106
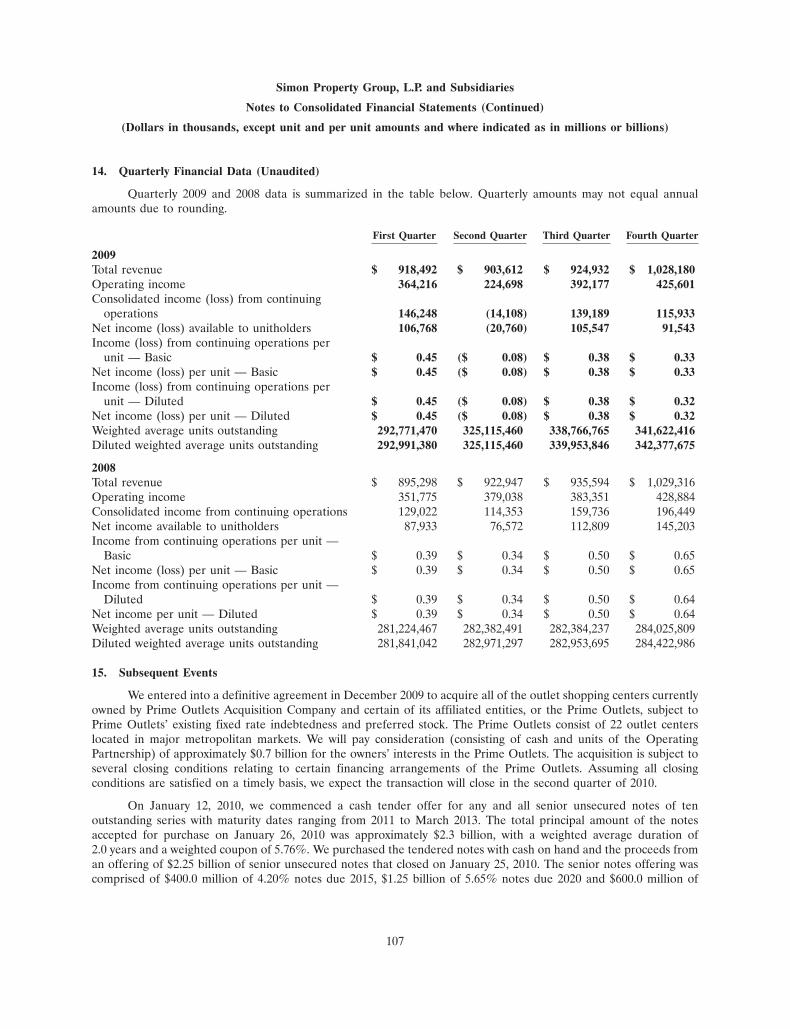
Simon Property Group, L.P. and Subsidiaries
Notes to Consolidated Financial Statements (Continued)
(Dollars in thousands, except unit and per unit amounts and where indicated as in millions or billions)
14. Quarterly Financial Data (Unaudited)
Quarterly 2009 and 2008 data is summarized in the table below. Quarterly amounts may not equal annualamounts due to rounding.
First Quarter Second Quarter Third Quarter Fourth Quarter
2009Total revenue $ 918,492 $ 903,612 $ 924,932 $ 1,028,180Operating income 364,216 224,698 392,177 425,601Consolidated income (loss) from continuing
operations 146,248 (14,108) 139,189 115,933Net income (loss) available to unitholders 106,768 (20,760) 105,547 91,543Income (loss) from continuing operations per
unit — Basic $ 0.45 ($ 0.08) $ 0.38 $ 0.33Net income (loss) per unit — Basic $ 0.45 ($ 0.08) $ 0.38 $ 0.33Income (loss) from continuing operations per
unit — Diluted $ 0.45 ($ 0.08) $ 0.38 $ 0.32Net income (loss) per unit — Diluted $ 0.45 ($ 0.08) $ 0.38 $ 0.32Weighted average units outstanding 292,771,470 325,115,460 338,766,765 341,622,416Diluted weighted average units outstanding 292,991,380 325,115,460 339,953,846 342,377,675
2008Total revenue $ 895,298 $ 922,947 $ 935,594 $ 1,029,316Operating income 351,775 379,038 383,351 428,884Consolidated income from continuing operations 129,022 114,353 159,736 196,449Net income available to unitholders 87,933 76,572 112,809 145,203Income from continuing operations per unit —
Basic $ 0.39 $ 0.34 $ 0.50 $ 0.65Net income (loss) per unit — Basic $ 0.39 $ 0.34 $ 0.50 $ 0.65Income from continuing operations per unit —
Diluted $ 0.39 $ 0.34 $ 0.50 $ 0.64Net income per unit — Diluted $ 0.39 $ 0.34 $ 0.50 $ 0.64Weighted average units outstanding 281,224,467 282,382,491 282,384,237 284,025,809Diluted weighted average units outstanding 281,841,042 282,971,297 282,953,695 284,422,986
15. Subsequent Events
We entered into a definitive agreement in December 2009 to acquire all of the outlet shopping centers currentlyowned by Prime Outlets Acquisition Company and certain of its affiliated entities, or the Prime Outlets, subject toPrime Outlets’ existing fixed rate indebtedness and preferred stock. The Prime Outlets consist of 22 outlet centerslocated in major metropolitan markets. We will pay consideration (consisting of cash and units of the OperatingPartnership) of approximately $0.7 billion for the owners’ interests in the Prime Outlets. The acquisition is subject toseveral closing conditions relating to certain financing arrangements of the Prime Outlets. Assuming all closingconditions are satisfied on a timely basis, we expect the transaction will close in the second quarter of 2010.
On January 12, 2010, we commenced a cash tender offer for any and all senior unsecured notes of tenoutstanding series with maturity dates ranging from 2011 to March 2013. The total principal amount of the notesaccepted for purchase on January 26, 2010 was approximately $2.3 billion, with a weighted average duration of2.0 years and a weighted coupon of 5.76%. We purchased the tendered notes with cash on hand and the proceeds froman offering of $2.25 billion of senior unsecured notes that closed on January 25, 2010. The senior notes offering wascomprised of $400.0 million of 4.20% notes due 2015, $1.25 billion of 5.65% notes due 2020 and $600.0 million of
107

Simon Property Group, L.P. and Subsidiaries
Notes to Consolidated Financial Statements (Continued)
(Dollars in thousands, except unit and per unit amounts and where indicated as in millions or billions)
15. Subsequent Events (Continued)
6.75% notes due 2040. We will report a $165.6 million charge to earnings in the first quarter of 2010 as a result of thetender offer.
On February 4, 2010, we and our partner in Simon Ivanhoe, Ivanhoe Cambridge Inc., or Ivanhoe Cambridge,entered into a definitive agreement to sell all of the interests in Simon Ivanhoe which owns seven shopping centerslocated in France and Poland to Unibail-Rodamco. The joint venture partners will receive consideration ofA715 million for the interests, subject to certain post-closing adjustments. We expect our share of the gain on sale ofour interests in Simon Ivanhoe to be approximately $300 million. The transaction is scheduled to close during the firsthalf of 2010, subject to customary closing conditions and regulatory approvals.
On February 16, 2010, Simon Property announced a written offer made to acquire General GrowthProperties, Inc., or General Growth, in a transaction valued at more than $10 billion, including approximately$9 billion in cash. Of this consideration, approximately $7 billion will be paid to unsecured creditors, representing parvalue plus accrued and unpaid dividends and interest. The transaction would not be subject to a financing conditionand would be financed through cash on hand, asset sales and through equity co-investments in acquired properties bystrategic institutional investors, with the balance coming from our new credit facility. The offer indicated a willingnessto discuss consideration consisting in whole or in part of equity in lieu of the cash portion of the consideration toGeneral Growth’s stockholders, and perhaps certain of its unsecured creditors, for those who would prefer to receiveequity. The offer is subject to confirmatory due diligence and the negotiation and execution of a definitive transactionagreement, as well as required bankruptcy court and creditor approvals. As of the filing of this report, there is noagreement for such a transaction.
108
SIGNATURESPursuant to the requirements of Section 13 or 15 (d) of the Securities Exchange Act of 1934, the Registrant has
duly caused this report to be signed on its behalf by the undersigned, thereunto duly authorized.
SIMON PROPERTY GROUP, L.P.
By /s/ DAVID SIMON
David SimonChairman of the Board of Directorsand Chief Executive Officer ofSimon Property Group, Inc., General Partner
March 12, 2010
Pursuant to the requirements of the Securities Exchange Act of 1934, this report has been signed below by thefollowing persons on behalf of the Registrant and in the capacities and on the dates indicated.
Signature Capacity Date
Chairman of the Board of Directors/s/ DAVID SIMON and Chief Executive Officer of
March 12, 2010Simon Property Group, Inc., General PartnerDavid Simon(Principal Executive Officer)
/s/ HERBERT SIMONChairman Emeritus and Director March 12, 2010
Herbert Simon
President, Chief Operating Officer of/s/ RICHARD S. SOKOLOVSimon Property Group, Inc., General Partner March 12, 2010
Richard S. Sokolov and Director
/s/ MELVYN E. BERGSTEINDirector March 12, 2010
Melvyn E. Bergstein
/s/ LINDA WALKER BYNOEDirector March 12, 2010
Linda Walker Bynoe
/s/ REUBEN S. LEIBOWITZDirector March 12, 2010
Reuben S. Leibowitz
/s/ J. ALBERT SMITH, JR.Director March 12, 2010
J. Albert Smith, Jr.
109
Signature Capacity Date
/s/ KAREN N. HORNDirector March 12, 2010
Karen N. Horn
/s/ ALLAN HUBBARDDirector March 12, 2010
Allan Hubbard
/s/ DANIEL C. SMITHDirector March 12, 2010
Daniel C. Smith
Executive Vice President/s/ STEPHEN E. STERRETT and Chief Financial Officer of
March 12, 2010Simon Property Group, Inc., General PartnerStephen E. Sterrett(Principal Financial Officer)
Senior Vice President/s/ STEVEN K. BROADWATER and Chief Accounting Officer of
March 12, 2010Simon Property Group, Inc., General PartnerSteven K. Broadwater(Principal Accounting Officer)
110

111
SCHEDULE III
Simon Property Group, L.P. and SubsidiariesReal Estate and Accumulated Depreciation
December 31, 2009(Dollars in thousands)
Cost CapitalizedSubsequent to Gross Amounts At Which
Initial Cost (Note 3) Acquisition (Note 3) Carried At Close of Period
Buildings and Buildings and Buildings and Accumulated Date ofName, Location Encumbrances Land Improvements Land Improvements Land Improvements Total (1) Depreciation (2) Construction
Regional MallsAnderson Mall, Anderson, SC . . . . . . . . . . . $ 27,270 $ 1,712 $ 15,227 $ 1,363 $ 20,347 $ 3,075 $ 35,574 $ 38,649 $ 13,198 1972Arsenal Mall, Watertown, MA . . . . . . . . . . 974 15,505 47,680 — 9,603 15,505 57,283 72,788 16,281 1999 (Note 4)Bangor Mall, Bangor, ME . . . . . . . . . . . . . 80,000 5,478 59,740 — 8,439 5,478 68,179 73,657 19,068 2004 (Note 5)Barton Creek Square, Austin, TX . . . . . . . . — 2,903 20,929 7,983 60,813 10,886 81,742 92,628 40,201 1981Battlefield Mall, Springfield, MO . . . . . . . . . 92,749 3,919 27,231 3,000 61,932 6,919 89,163 96,082 48,410 1970Bay Park Square, Green Bay, WI . . . . . . . . . — 6,358 25,623 4,133 23,301 10,491 48,924 59,415 19,918 1980Bowie Town Center, Bowie, MD . . . . . . . . . — 2,710 65,044 235 5,022 2,945 70,066 73,011 22,804 2001Boynton Beach Mall, Boynton Beach, FL . . . . — 22,240 78,804 4,666 25,329 26,906 104,133 131,039 36,361 1985Brea Mall, Brea, CA . . . . . . . . . . . . . . . . — 39,500 209,202 — 24,419 39,500 233,621 273,121 75,793 1998 (Note 4)Broadway Square, Tyler, TX . . . . . . . . . . . . — 11,470 32,431 — 21,888 11,470 54,319 65,789 21,642 1994 (Note 4)Brunswick Square, East Brunswick, NJ . . . . . 82,244 8,436 55,838 — 27,888 8,436 83,726 92,162 34,463 1973Burlington Mall, Burlington, MA . . . . . . . . . — 46,600 303,618 19,600 89,107 66,200 392,725 458,925 109,314 1998 (Note 4)Castleton Square, Indianapolis, IN . . . . . . . . — 26,250 98,287 7,434 70,202 33,684 168,489 202,173 57,429 1972Century III Mall, West Mifflin, PA . . . . . . . . 80,498 17,380 102,364 10 8,379 17,390 110,743 128,133 67,765 1979Charlottesville Fashion Square, Charlottesville,
VA . . . . . . . . . . . . . . . . . . . . . . . . . . — — 54,738 — 13,767 — 68,505 68,505 24,847 1997 (Note 4)Chautauqua Mall, Lakewood, NY . . . . . . . . — 3,257 9,641 — 16,238 3,257 25,879 29,136 12,020 1971Chesapeake Square, Chesapeake, VA . . . . . . 69,852 11,534 70,461 — 7,652 11,534 78,113 89,647 38,695 1989Cielo Vista Mall, El Paso, TX . . . . . . . . . . . — 1,005 15,262 608 43,751 1,613 59,013 60,626 32,839 1974College Mall, Bloomington, IN . . . . . . . . . . — 1,003 16,245 720 43,466 1,723 59,711 61,434 27,524 1965Columbia Center, Kennewick, WA . . . . . . . . — 17,441 66,580 — 21,593 17,441 88,173 105,614 31,141 1987Copley Place, Boston, MA . . . . . . . . . . . . . 200,000 — 378,045 — 82,083 — 460,128 460,128 100,206 2002 (Note 4)Coral Square, Coral Springs, FL . . . . . . . . . 81,666 13,556 93,630 — 14,346 13,556 107,976 121,532 49,864 1984Cordova Mall, Pensacola, FL . . . . . . . . . . . — 18,626 73,091 7,321 43,912 25,947 117,003 142,950 32,959 1998 (Note 4)Cottonwood Mall, Albuquerque, NM . . . . . . — 10,122 69,958 — 3,528 10,122 73,486 83,608 33,010 1996Crossroads Mall, Omaha, NE . . . . . . . . . . . 40,616 639 30,658 409 35,857 1,048 66,515 67,563 28,955 1994 (Note 4)Crystal River Mall, Crystal River, FL . . . . . . 14,677 5,393 20,241 — 4,718 5,393 24,959 30,352 9,701 1990DeSoto Square, Bradenton, FL . . . . . . . . . . 63,800 9,011 52,675 — 8,036 9,011 60,711 69,722 24,080 1973Domain, The, Austin, TX (Note 6) . . . . . . . . — 45,152 197,010 — 116,395 45,152 313,405 358,557 23,272 2005Edison Mall, Fort Myers, FL . . . . . . . . . . . — 11,529 107,350 — 28,453 11,529 135,803 147,332 44,774 1997 (Note 4)Fashion Mall at Keystone, The, Indianapolis,
IN . . . . . . . . . . . . . . . . . . . . . . . . . . — — 120,579 — 47,063 — 167,642 167,642 55,893 1997 (Note 4)Firewheel Town Center, Garland, TX . . . . . . — 8,636 82,716 — 24,714 8,636 107,430 116,066 19,242 2004Forest Mall, Fond Du Lac, WI . . . . . . . . . . 16,190 721 4,491 — 8,795 721 13,286 14,007 7,628 1973Forum Shops at Caesars, The, Las Vegas, NV . 515,335 — 276,567 — 205,817 — 482,384 482,384 125,792 1992
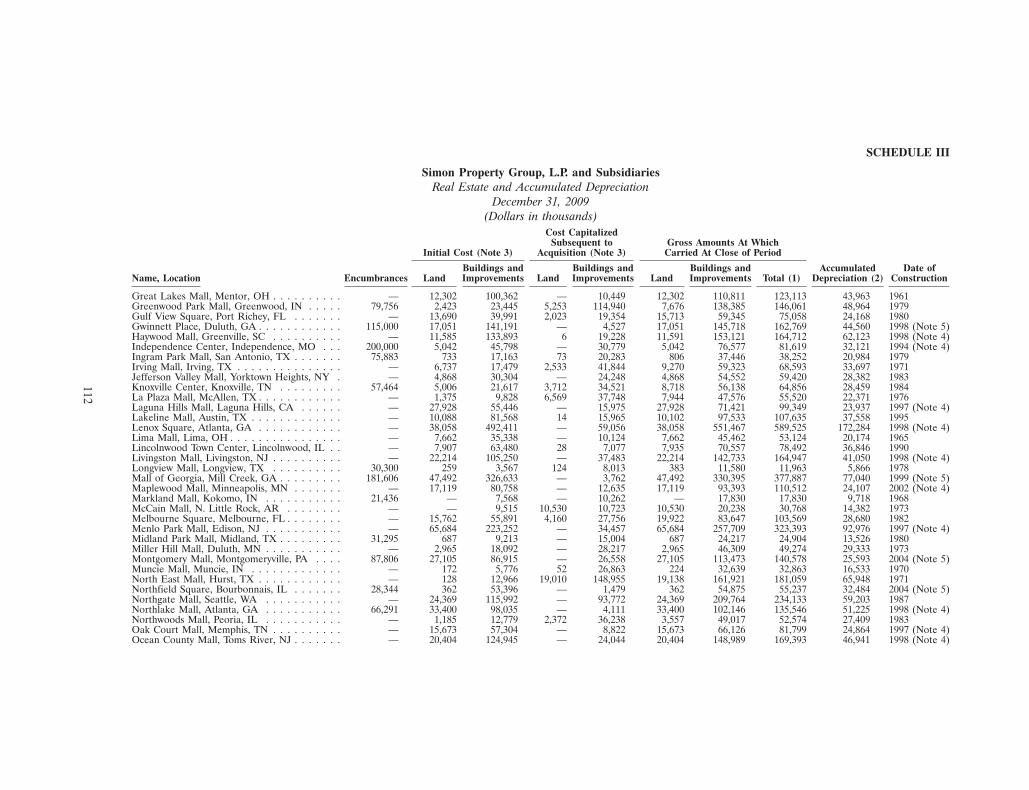
112
SCHEDULE III
Simon Property Group, L.P. and SubsidiariesReal Estate and Accumulated Depreciation
December 31, 2009(Dollars in thousands)
Cost CapitalizedSubsequent to Gross Amounts At Which
Initial Cost (Note 3) Acquisition (Note 3) Carried At Close of Period
Buildings and Buildings and Buildings and Accumulated Date ofName, Location Encumbrances Land Improvements Land Improvements Land Improvements Total (1) Depreciation (2) Construction
Great Lakes Mall, Mentor, OH . . . . . . . . . . — 12,302 100,362 — 10,449 12,302 110,811 123,113 43,963 1961Greenwood Park Mall, Greenwood, IN . . . . . 79,756 2,423 23,445 5,253 114,940 7,676 138,385 146,061 48,964 1979Gulf View Square, Port Richey, FL . . . . . . . — 13,690 39,991 2,023 19,354 15,713 59,345 75,058 24,168 1980Gwinnett Place, Duluth, GA . . . . . . . . . . . . 115,000 17,051 141,191 — 4,527 17,051 145,718 162,769 44,560 1998 (Note 5)Haywood Mall, Greenville, SC . . . . . . . . . . — 11,585 133,893 6 19,228 11,591 153,121 164,712 62,123 1998 (Note 4)Independence Center, Independence, MO . . . 200,000 5,042 45,798 — 30,779 5,042 76,577 81,619 32,121 1994 (Note 4)Ingram Park Mall, San Antonio, TX . . . . . . . 75,883 733 17,163 73 20,283 806 37,446 38,252 20,984 1979Irving Mall, Irving, TX . . . . . . . . . . . . . . . — 6,737 17,479 2,533 41,844 9,270 59,323 68,593 33,697 1971Jefferson Valley Mall, Yorktown Heights, NY . — 4,868 30,304 — 24,248 4,868 54,552 59,420 28,382 1983Knoxville Center, Knoxville, TN . . . . . . . . . 57,464 5,006 21,617 3,712 34,521 8,718 56,138 64,856 28,459 1984La Plaza Mall, McAllen, TX . . . . . . . . . . . . — 1,375 9,828 6,569 37,748 7,944 47,576 55,520 22,371 1976Laguna Hills Mall, Laguna Hills, CA . . . . . . — 27,928 55,446 — 15,975 27,928 71,421 99,349 23,937 1997 (Note 4)Lakeline Mall, Austin, TX . . . . . . . . . . . . . — 10,088 81,568 14 15,965 10,102 97,533 107,635 37,558 1995Lenox Square, Atlanta, GA . . . . . . . . . . . . — 38,058 492,411 — 59,056 38,058 551,467 589,525 172,284 1998 (Note 4)Lima Mall, Lima, OH . . . . . . . . . . . . . . . . — 7,662 35,338 — 10,124 7,662 45,462 53,124 20,174 1965Lincolnwood Town Center, Lincolnwood, IL . . — 7,907 63,480 28 7,077 7,935 70,557 78,492 36,846 1990Livingston Mall, Livingston, NJ . . . . . . . . . . — 22,214 105,250 — 37,483 22,214 142,733 164,947 41,050 1998 (Note 4)Longview Mall, Longview, TX . . . . . . . . . . 30,300 259 3,567 124 8,013 383 11,580 11,963 5,866 1978Mall of Georgia, Mill Creek, GA . . . . . . . . . 181,606 47,492 326,633 — 3,762 47,492 330,395 377,887 77,040 1999 (Note 5)Maplewood Mall, Minneapolis, MN . . . . . . . — 17,119 80,758 — 12,635 17,119 93,393 110,512 24,107 2002 (Note 4)Markland Mall, Kokomo, IN . . . . . . . . . . . 21,436 — 7,568 — 10,262 — 17,830 17,830 9,718 1968McCain Mall, N. Little Rock, AR . . . . . . . . — — 9,515 10,530 10,723 10,530 20,238 30,768 14,382 1973Melbourne Square, Melbourne, FL . . . . . . . . — 15,762 55,891 4,160 27,756 19,922 83,647 103,569 28,680 1982Menlo Park Mall, Edison, NJ . . . . . . . . . . . — 65,684 223,252 — 34,457 65,684 257,709 323,393 92,976 1997 (Note 4)Midland Park Mall, Midland, TX . . . . . . . . . 31,295 687 9,213 — 15,004 687 24,217 24,904 13,526 1980Miller Hill Mall, Duluth, MN . . . . . . . . . . . — 2,965 18,092 — 28,217 2,965 46,309 49,274 29,333 1973Montgomery Mall, Montgomeryville, PA . . . . 87,806 27,105 86,915 — 26,558 27,105 113,473 140,578 25,593 2004 (Note 5)Muncie Mall, Muncie, IN . . . . . . . . . . . . . — 172 5,776 52 26,863 224 32,639 32,863 16,533 1970North East Mall, Hurst, TX . . . . . . . . . . . . — 128 12,966 19,010 148,955 19,138 161,921 181,059 65,948 1971Northfield Square, Bourbonnais, IL . . . . . . . 28,344 362 53,396 — 1,479 362 54,875 55,237 32,484 2004 (Note 5)Northgate Mall, Seattle, WA . . . . . . . . . . . — 24,369 115,992 — 93,772 24,369 209,764 234,133 59,203 1987Northlake Mall, Atlanta, GA . . . . . . . . . . . 66,291 33,400 98,035 — 4,111 33,400 102,146 135,546 51,225 1998 (Note 4)Northwoods Mall, Peoria, IL . . . . . . . . . . . — 1,185 12,779 2,372 36,238 3,557 49,017 52,574 27,409 1983Oak Court Mall, Memphis, TN . . . . . . . . . . — 15,673 57,304 — 8,822 15,673 66,126 81,799 24,864 1997 (Note 4)Ocean County Mall, Toms River, NJ . . . . . . . — 20,404 124,945 — 24,044 20,404 148,989 169,393 46,941 1998 (Note 4)
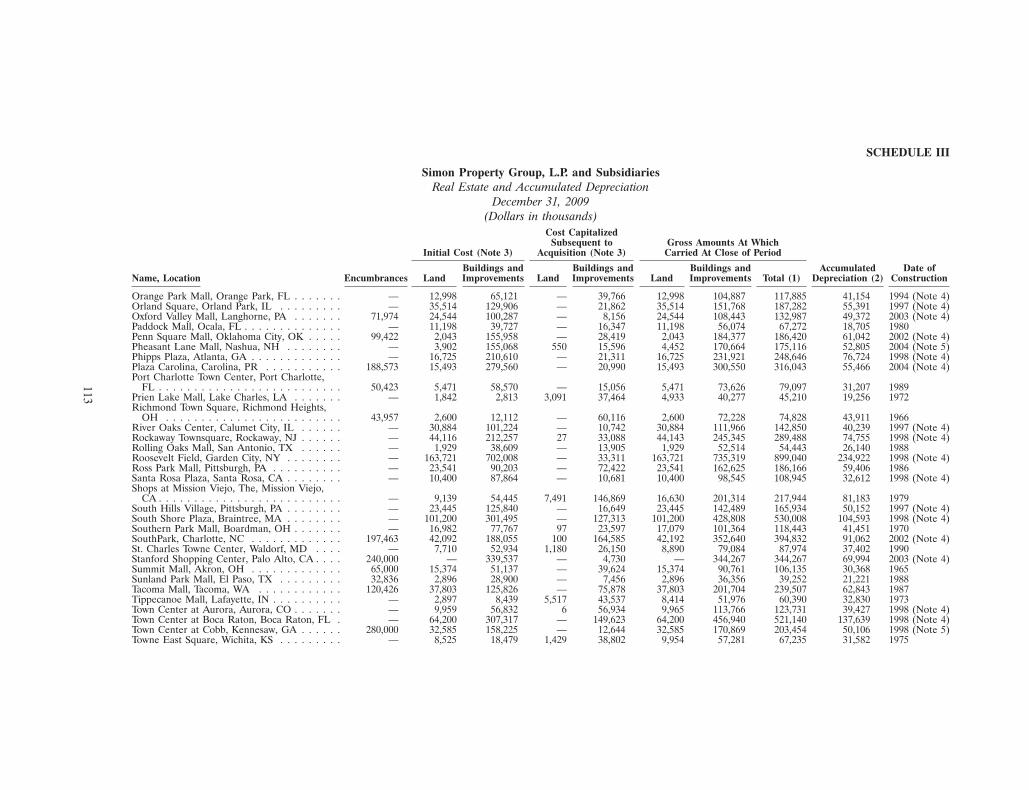
113
SCHEDULE III
Simon Property Group, L.P. and SubsidiariesReal Estate and Accumulated Depreciation
December 31, 2009(Dollars in thousands)
Cost CapitalizedSubsequent to Gross Amounts At Which
Initial Cost (Note 3) Acquisition (Note 3) Carried At Close of Period
Buildings and Buildings and Buildings and Accumulated Date ofName, Location Encumbrances Land Improvements Land Improvements Land Improvements Total (1) Depreciation (2) Construction
Orange Park Mall, Orange Park, FL . . . . . . . — 12,998 65,121 — 39,766 12,998 104,887 117,885 41,154 1994 (Note 4)Orland Square, Orland Park, IL . . . . . . . . . — 35,514 129,906 — 21,862 35,514 151,768 187,282 55,391 1997 (Note 4)Oxford Valley Mall, Langhorne, PA . . . . . . . 71,974 24,544 100,287 — 8,156 24,544 108,443 132,987 49,372 2003 (Note 4)Paddock Mall, Ocala, FL . . . . . . . . . . . . . . — 11,198 39,727 — 16,347 11,198 56,074 67,272 18,705 1980Penn Square Mall, Oklahoma City, OK . . . . . 99,422 2,043 155,958 — 28,419 2,043 184,377 186,420 61,042 2002 (Note 4)Pheasant Lane Mall, Nashua, NH . . . . . . . . — 3,902 155,068 550 15,596 4,452 170,664 175,116 52,805 2004 (Note 5)Phipps Plaza, Atlanta, GA . . . . . . . . . . . . . — 16,725 210,610 — 21,311 16,725 231,921 248,646 76,724 1998 (Note 4)Plaza Carolina, Carolina, PR . . . . . . . . . . . 188,573 15,493 279,560 — 20,990 15,493 300,550 316,043 55,466 2004 (Note 4)Port Charlotte Town Center, Port Charlotte,
FL . . . . . . . . . . . . . . . . . . . . . . . . . . 50,423 5,471 58,570 — 15,056 5,471 73,626 79,097 31,207 1989Prien Lake Mall, Lake Charles, LA . . . . . . . — 1,842 2,813 3,091 37,464 4,933 40,277 45,210 19,256 1972Richmond Town Square, Richmond Heights,
OH . . . . . . . . . . . . . . . . . . . . . . . . . 43,957 2,600 12,112 — 60,116 2,600 72,228 74,828 43,911 1966River Oaks Center, Calumet City, IL . . . . . . — 30,884 101,224 — 10,742 30,884 111,966 142,850 40,239 1997 (Note 4)Rockaway Townsquare, Rockaway, NJ . . . . . . — 44,116 212,257 27 33,088 44,143 245,345 289,488 74,755 1998 (Note 4)Rolling Oaks Mall, San Antonio, TX . . . . . . — 1,929 38,609 — 13,905 1,929 52,514 54,443 26,140 1988Roosevelt Field, Garden City, NY . . . . . . . . — 163,721 702,008 — 33,311 163,721 735,319 899,040 234,922 1998 (Note 4)Ross Park Mall, Pittsburgh, PA . . . . . . . . . . — 23,541 90,203 — 72,422 23,541 162,625 186,166 59,406 1986Santa Rosa Plaza, Santa Rosa, CA . . . . . . . . — 10,400 87,864 — 10,681 10,400 98,545 108,945 32,612 1998 (Note 4)Shops at Mission Viejo, The, Mission Viejo,
CA . . . . . . . . . . . . . . . . . . . . . . . . . . — 9,139 54,445 7,491 146,869 16,630 201,314 217,944 81,183 1979South Hills Village, Pittsburgh, PA . . . . . . . . — 23,445 125,840 — 16,649 23,445 142,489 165,934 50,152 1997 (Note 4)South Shore Plaza, Braintree, MA . . . . . . . . — 101,200 301,495 — 127,313 101,200 428,808 530,008 104,593 1998 (Note 4)Southern Park Mall, Boardman, OH . . . . . . . — 16,982 77,767 97 23,597 17,079 101,364 118,443 41,451 1970SouthPark, Charlotte, NC . . . . . . . . . . . . . 197,463 42,092 188,055 100 164,585 42,192 352,640 394,832 91,062 2002 (Note 4)St. Charles Towne Center, Waldorf, MD . . . . — 7,710 52,934 1,180 26,150 8,890 79,084 87,974 37,402 1990Stanford Shopping Center, Palo Alto, CA . . . . 240,000 — 339,537 — 4,730 — 344,267 344,267 69,994 2003 (Note 4)Summit Mall, Akron, OH . . . . . . . . . . . . . 65,000 15,374 51,137 — 39,624 15,374 90,761 106,135 30,368 1965Sunland Park Mall, El Paso, TX . . . . . . . . . 32,836 2,896 28,900 — 7,456 2,896 36,356 39,252 21,221 1988Tacoma Mall, Tacoma, WA . . . . . . . . . . . . 120,426 37,803 125,826 — 75,878 37,803 201,704 239,507 62,843 1987Tippecanoe Mall, Lafayette, IN . . . . . . . . . . — 2,897 8,439 5,517 43,537 8,414 51,976 60,390 32,830 1973Town Center at Aurora, Aurora, CO . . . . . . . — 9,959 56,832 6 56,934 9,965 113,766 123,731 39,427 1998 (Note 4)Town Center at Boca Raton, Boca Raton, FL . — 64,200 307,317 — 149,623 64,200 456,940 521,140 137,639 1998 (Note 4)Town Center at Cobb, Kennesaw, GA . . . . . . 280,000 32,585 158,225 — 12,644 32,585 170,869 203,454 50,106 1998 (Note 5)Towne East Square, Wichita, KS . . . . . . . . . — 8,525 18,479 1,429 38,802 9,954 57,281 67,235 31,582 1975
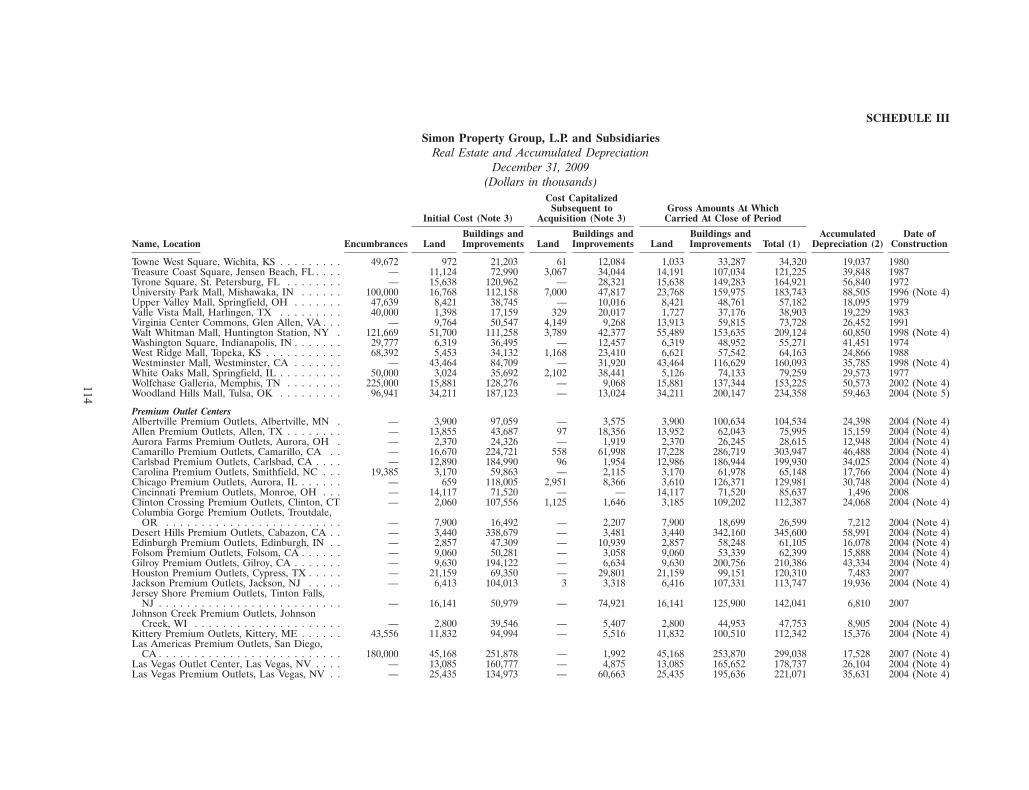
114
SCHEDULE III
Simon Property Group, L.P. and SubsidiariesReal Estate and Accumulated Depreciation
December 31, 2009(Dollars in thousands)
Cost CapitalizedSubsequent to Gross Amounts At Which
Initial Cost (Note 3) Acquisition (Note 3) Carried At Close of Period
Buildings and Buildings and Buildings and Accumulated Date ofName, Location Encumbrances Land Improvements Land Improvements Land Improvements Total (1) Depreciation (2) Construction
Towne West Square, Wichita, KS . . . . . . . . . 49,672 972 21,203 61 12,084 1,033 33,287 34,320 19,037 1980Treasure Coast Square, Jensen Beach, FL . . . . — 11,124 72,990 3,067 34,044 14,191 107,034 121,225 39,848 1987Tyrone Square, St. Petersburg, FL . . . . . . . . — 15,638 120,962 — 28,321 15,638 149,283 164,921 56,840 1972University Park Mall, Mishawaka, IN . . . . . . 100,000 16,768 112,158 7,000 47,817 23,768 159,975 183,743 88,505 1996 (Note 4)Upper Valley Mall, Springfield, OH . . . . . . . 47,639 8,421 38,745 — 10,016 8,421 48,761 57,182 18,095 1979Valle Vista Mall, Harlingen, TX . . . . . . . . . 40,000 1,398 17,159 329 20,017 1,727 37,176 38,903 19,229 1983Virginia Center Commons, Glen Allen, VA . . . — 9,764 50,547 4,149 9,268 13,913 59,815 73,728 26,452 1991Walt Whitman Mall, Huntington Station, NY . 121,669 51,700 111,258 3,789 42,377 55,489 153,635 209,124 60,850 1998 (Note 4)Washington Square, Indianapolis, IN . . . . . . . 29,777 6,319 36,495 — 12,457 6,319 48,952 55,271 41,451 1974West Ridge Mall, Topeka, KS . . . . . . . . . . . 68,392 5,453 34,132 1,168 23,410 6,621 57,542 64,163 24,866 1988Westminster Mall, Westminster, CA . . . . . . . — 43,464 84,709 — 31,920 43,464 116,629 160,093 35,785 1998 (Note 4)White Oaks Mall, Springfield, IL . . . . . . . . . 50,000 3,024 35,692 2,102 38,441 5,126 74,133 79,259 29,573 1977Wolfchase Galleria, Memphis, TN . . . . . . . . 225,000 15,881 128,276 — 9,068 15,881 137,344 153,225 50,573 2002 (Note 4)Woodland Hills Mall, Tulsa, OK . . . . . . . . . 96,941 34,211 187,123 — 13,024 34,211 200,147 234,358 59,463 2004 (Note 5)
Premium Outlet CentersAlbertville Premium Outlets, Albertville, MN . — 3,900 97,059 — 3,575 3,900 100,634 104,534 24,398 2004 (Note 4)Allen Premium Outlets, Allen, TX . . . . . . . . — 13,855 43,687 97 18,356 13,952 62,043 75,995 15,159 2004 (Note 4)Aurora Farms Premium Outlets, Aurora, OH . — 2,370 24,326 — 1,919 2,370 26,245 28,615 12,948 2004 (Note 4)Camarillo Premium Outlets, Camarillo, CA . . — 16,670 224,721 558 61,998 17,228 286,719 303,947 46,488 2004 (Note 4)Carlsbad Premium Outlets, Carlsbad, CA . . . . — 12,890 184,990 96 1,954 12,986 186,944 199,930 34,025 2004 (Note 4)Carolina Premium Outlets, Smithfield, NC . . . 19,385 3,170 59,863 — 2,115 3,170 61,978 65,148 17,766 2004 (Note 4)Chicago Premium Outlets, Aurora, IL . . . . . . — 659 118,005 2,951 8,366 3,610 126,371 129,981 30,748 2004 (Note 4)Cincinnati Premium Outlets, Monroe, OH . . . — 14,117 71,520 — — 14,117 71,520 85,637 1,496 2008Clinton Crossing Premium Outlets, Clinton, CT — 2,060 107,556 1,125 1,646 3,185 109,202 112,387 24,068 2004 (Note 4)Columbia Gorge Premium Outlets, Troutdale,
OR . . . . . . . . . . . . . . . . . . . . . . . . . — 7,900 16,492 — 2,207 7,900 18,699 26,599 7,212 2004 (Note 4)Desert Hills Premium Outlets, Cabazon, CA . . — 3,440 338,679 — 3,481 3,440 342,160 345,600 58,991 2004 (Note 4)Edinburgh Premium Outlets, Edinburgh, IN . . — 2,857 47,309 — 10,939 2,857 58,248 61,105 16,078 2004 (Note 4)Folsom Premium Outlets, Folsom, CA . . . . . . — 9,060 50,281 — 3,058 9,060 53,339 62,399 15,888 2004 (Note 4)Gilroy Premium Outlets, Gilroy, CA . . . . . . . — 9,630 194,122 — 6,634 9,630 200,756 210,386 43,334 2004 (Note 4)Houston Premium Outlets, Cypress, TX . . . . . — 21,159 69,350 — 29,801 21,159 99,151 120,310 7,483 2007Jackson Premium Outlets, Jackson, NJ . . . . . — 6,413 104,013 3 3,318 6,416 107,331 113,747 19,936 2004 (Note 4)Jersey Shore Premium Outlets, Tinton Falls,
NJ . . . . . . . . . . . . . . . . . . . . . . . . . . — 16,141 50,979 — 74,921 16,141 125,900 142,041 6,810 2007Johnson Creek Premium Outlets, Johnson
Creek, WI . . . . . . . . . . . . . . . . . . . . . — 2,800 39,546 — 5,407 2,800 44,953 47,753 8,905 2004 (Note 4)Kittery Premium Outlets, Kittery, ME . . . . . . 43,556 11,832 94,994 — 5,516 11,832 100,510 112,342 15,376 2004 (Note 4)Las Americas Premium Outlets, San Diego,
CA . . . . . . . . . . . . . . . . . . . . . . . . . . 180,000 45,168 251,878 — 1,992 45,168 253,870 299,038 17,528 2007 (Note 4)Las Vegas Outlet Center, Las Vegas, NV . . . . — 13,085 160,777 — 4,875 13,085 165,652 178,737 26,104 2004 (Note 4)Las Vegas Premium Outlets, Las Vegas, NV . . — 25,435 134,973 — 60,663 25,435 195,636 221,071 35,631 2004 (Note 4)
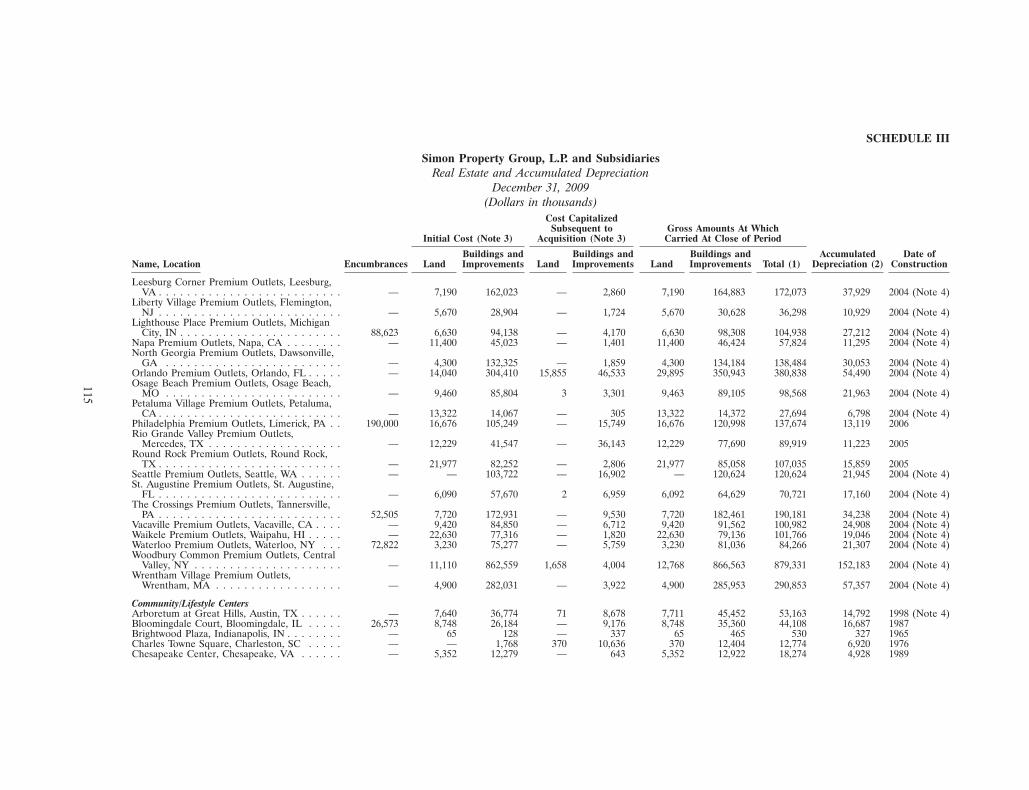
115
SCHEDULE III
Simon Property Group, L.P. and SubsidiariesReal Estate and Accumulated Depreciation
December 31, 2009(Dollars in thousands)
Cost CapitalizedSubsequent to Gross Amounts At Which
Initial Cost (Note 3) Acquisition (Note 3) Carried At Close of Period
Buildings and Buildings and Buildings and Accumulated Date ofName, Location Encumbrances Land Improvements Land Improvements Land Improvements Total (1) Depreciation (2) Construction
Leesburg Corner Premium Outlets, Leesburg,VA . . . . . . . . . . . . . . . . . . . . . . . . . . — 7,190 162,023 — 2,860 7,190 164,883 172,073 37,929 2004 (Note 4)
Liberty Village Premium Outlets, Flemington,NJ . . . . . . . . . . . . . . . . . . . . . . . . . . — 5,670 28,904 — 1,724 5,670 30,628 36,298 10,929 2004 (Note 4)
Lighthouse Place Premium Outlets, MichiganCity, IN . . . . . . . . . . . . . . . . . . . . . . . 88,623 6,630 94,138 — 4,170 6,630 98,308 104,938 27,212 2004 (Note 4)
Napa Premium Outlets, Napa, CA . . . . . . . . — 11,400 45,023 — 1,401 11,400 46,424 57,824 11,295 2004 (Note 4)North Georgia Premium Outlets, Dawsonville,
GA . . . . . . . . . . . . . . . . . . . . . . . . . — 4,300 132,325 — 1,859 4,300 134,184 138,484 30,053 2004 (Note 4)Orlando Premium Outlets, Orlando, FL . . . . . — 14,040 304,410 15,855 46,533 29,895 350,943 380,838 54,490 2004 (Note 4)Osage Beach Premium Outlets, Osage Beach,
MO . . . . . . . . . . . . . . . . . . . . . . . . . — 9,460 85,804 3 3,301 9,463 89,105 98,568 21,963 2004 (Note 4)Petaluma Village Premium Outlets, Petaluma,
CA . . . . . . . . . . . . . . . . . . . . . . . . . . — 13,322 14,067 — 305 13,322 14,372 27,694 6,798 2004 (Note 4)Philadelphia Premium Outlets, Limerick, PA . . 190,000 16,676 105,249 — 15,749 16,676 120,998 137,674 13,119 2006Rio Grande Valley Premium Outlets,
Mercedes, TX . . . . . . . . . . . . . . . . . . . — 12,229 41,547 — 36,143 12,229 77,690 89,919 11,223 2005Round Rock Premium Outlets, Round Rock,
TX . . . . . . . . . . . . . . . . . . . . . . . . . . — 21,977 82,252 — 2,806 21,977 85,058 107,035 15,859 2005Seattle Premium Outlets, Seattle, WA . . . . . . — — 103,722 — 16,902 — 120,624 120,624 21,945 2004 (Note 4)St. Augustine Premium Outlets, St. Augustine,
FL . . . . . . . . . . . . . . . . . . . . . . . . . . — 6,090 57,670 2 6,959 6,092 64,629 70,721 17,160 2004 (Note 4)The Crossings Premium Outlets, Tannersville,
PA . . . . . . . . . . . . . . . . . . . . . . . . . . 52,505 7,720 172,931 — 9,530 7,720 182,461 190,181 34,238 2004 (Note 4)Vacaville Premium Outlets, Vacaville, CA . . . . — 9,420 84,850 — 6,712 9,420 91,562 100,982 24,908 2004 (Note 4)Waikele Premium Outlets, Waipahu, HI . . . . . — 22,630 77,316 — 1,820 22,630 79,136 101,766 19,046 2004 (Note 4)Waterloo Premium Outlets, Waterloo, NY . . . 72,822 3,230 75,277 — 5,759 3,230 81,036 84,266 21,307 2004 (Note 4)Woodbury Common Premium Outlets, Central
Valley, NY . . . . . . . . . . . . . . . . . . . . . — 11,110 862,559 1,658 4,004 12,768 866,563 879,331 152,183 2004 (Note 4)Wrentham Village Premium Outlets,
Wrentham, MA . . . . . . . . . . . . . . . . . . — 4,900 282,031 — 3,922 4,900 285,953 290,853 57,357 2004 (Note 4)
Community/Lifestyle CentersArboretum at Great Hills, Austin, TX . . . . . . — 7,640 36,774 71 8,678 7,711 45,452 53,163 14,792 1998 (Note 4)Bloomingdale Court, Bloomingdale, IL . . . . . 26,573 8,748 26,184 — 9,176 8,748 35,360 44,108 16,687 1987Brightwood Plaza, Indianapolis, IN . . . . . . . . — 65 128 — 337 65 465 530 327 1965Charles Towne Square, Charleston, SC . . . . . — — 1,768 370 10,636 370 12,404 12,774 6,920 1976Chesapeake Center, Chesapeake, VA . . . . . . — 5,352 12,279 — 643 5,352 12,922 18,274 4,928 1989
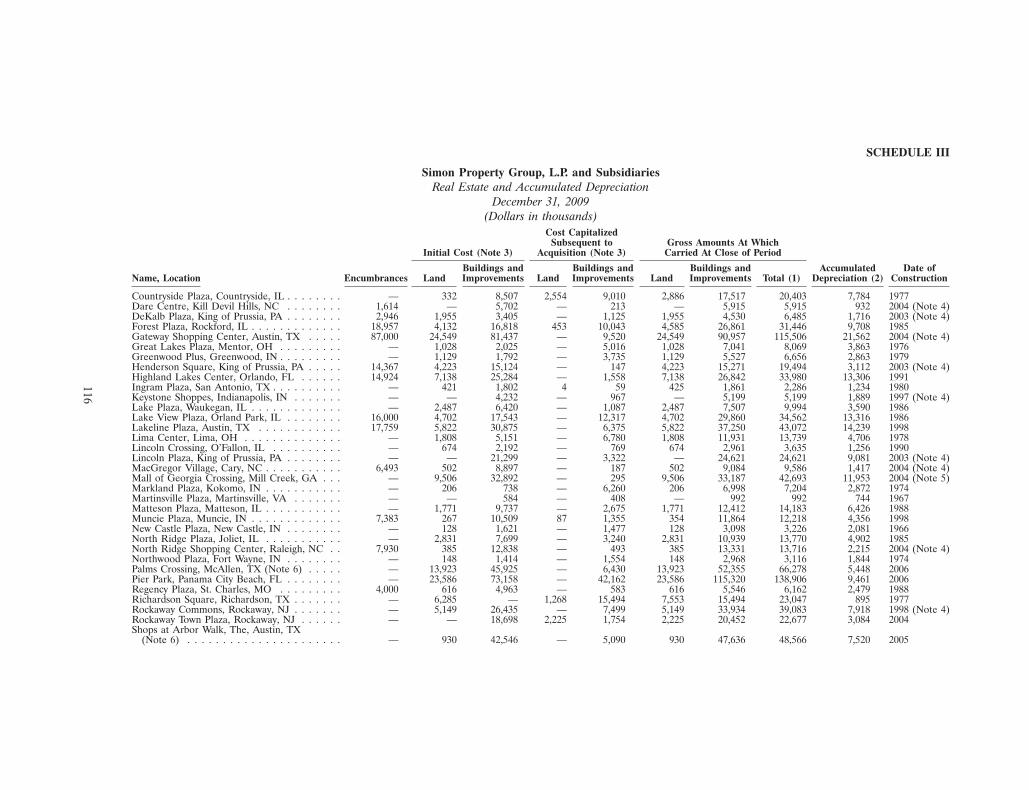
116
SCHEDULE III
Simon Property Group, L.P. and SubsidiariesReal Estate and Accumulated Depreciation
December 31, 2009(Dollars in thousands)
Cost CapitalizedSubsequent to Gross Amounts At Which
Initial Cost (Note 3) Acquisition (Note 3) Carried At Close of Period
Buildings and Buildings and Buildings and Accumulated Date ofName, Location Encumbrances Land Improvements Land Improvements Land Improvements Total (1) Depreciation (2) Construction
Countryside Plaza, Countryside, IL . . . . . . . . — 332 8,507 2,554 9,010 2,886 17,517 20,403 7,784 1977Dare Centre, Kill Devil Hills, NC . . . . . . . . 1,614 — 5,702 — 213 — 5,915 5,915 932 2004 (Note 4)DeKalb Plaza, King of Prussia, PA . . . . . . . . 2,946 1,955 3,405 — 1,125 1,955 4,530 6,485 1,716 2003 (Note 4)Forest Plaza, Rockford, IL . . . . . . . . . . . . . 18,957 4,132 16,818 453 10,043 4,585 26,861 31,446 9,708 1985Gateway Shopping Center, Austin, TX . . . . . 87,000 24,549 81,437 — 9,520 24,549 90,957 115,506 21,562 2004 (Note 4)Great Lakes Plaza, Mentor, OH . . . . . . . . . — 1,028 2,025 — 5,016 1,028 7,041 8,069 3,863 1976Greenwood Plus, Greenwood, IN . . . . . . . . . — 1,129 1,792 — 3,735 1,129 5,527 6,656 2,863 1979Henderson Square, King of Prussia, PA . . . . . 14,367 4,223 15,124 — 147 4,223 15,271 19,494 3,112 2003 (Note 4)Highland Lakes Center, Orlando, FL . . . . . . 14,924 7,138 25,284 — 1,558 7,138 26,842 33,980 13,306 1991Ingram Plaza, San Antonio, TX . . . . . . . . . . — 421 1,802 4 59 425 1,861 2,286 1,234 1980Keystone Shoppes, Indianapolis, IN . . . . . . . — — 4,232 — 967 — 5,199 5,199 1,889 1997 (Note 4)Lake Plaza, Waukegan, IL . . . . . . . . . . . . . — 2,487 6,420 — 1,087 2,487 7,507 9,994 3,590 1986Lake View Plaza, Orland Park, IL . . . . . . . . 16,000 4,702 17,543 — 12,317 4,702 29,860 34,562 13,316 1986Lakeline Plaza, Austin, TX . . . . . . . . . . . . 17,759 5,822 30,875 — 6,375 5,822 37,250 43,072 14,239 1998Lima Center, Lima, OH . . . . . . . . . . . . . . — 1,808 5,151 — 6,780 1,808 11,931 13,739 4,706 1978Lincoln Crossing, O’Fallon, IL . . . . . . . . . . — 674 2,192 — 769 674 2,961 3,635 1,256 1990Lincoln Plaza, King of Prussia, PA . . . . . . . . — — 21,299 — 3,322 — 24,621 24,621 9,081 2003 (Note 4)MacGregor Village, Cary, NC . . . . . . . . . . . 6,493 502 8,897 — 187 502 9,084 9,586 1,417 2004 (Note 4)Mall of Georgia Crossing, Mill Creek, GA . . . — 9,506 32,892 — 295 9,506 33,187 42,693 11,953 2004 (Note 5)Markland Plaza, Kokomo, IN . . . . . . . . . . . — 206 738 — 6,260 206 6,998 7,204 2,872 1974Martinsville Plaza, Martinsville, VA . . . . . . . — — 584 — 408 — 992 992 744 1967Matteson Plaza, Matteson, IL . . . . . . . . . . . — 1,771 9,737 — 2,675 1,771 12,412 14,183 6,426 1988Muncie Plaza, Muncie, IN . . . . . . . . . . . . . 7,383 267 10,509 87 1,355 354 11,864 12,218 4,356 1998New Castle Plaza, New Castle, IN . . . . . . . . — 128 1,621 — 1,477 128 3,098 3,226 2,081 1966North Ridge Plaza, Joliet, IL . . . . . . . . . . . — 2,831 7,699 — 3,240 2,831 10,939 13,770 4,902 1985North Ridge Shopping Center, Raleigh, NC . . 7,930 385 12,838 — 493 385 13,331 13,716 2,215 2004 (Note 4)Northwood Plaza, Fort Wayne, IN . . . . . . . . — 148 1,414 — 1,554 148 2,968 3,116 1,844 1974Palms Crossing, McAllen, TX (Note 6) . . . . . — 13,923 45,925 — 6,430 13,923 52,355 66,278 5,448 2006Pier Park, Panama City Beach, FL . . . . . . . . — 23,586 73,158 — 42,162 23,586 115,320 138,906 9,461 2006Regency Plaza, St. Charles, MO . . . . . . . . . 4,000 616 4,963 — 583 616 5,546 6,162 2,479 1988Richardson Square, Richardson, TX . . . . . . . — 6,285 — 1,268 15,494 7,553 15,494 23,047 895 1977Rockaway Commons, Rockaway, NJ . . . . . . . — 5,149 26,435 — 7,499 5,149 33,934 39,083 7,918 1998 (Note 4)Rockaway Town Plaza, Rockaway, NJ . . . . . . — — 18,698 2,225 1,754 2,225 20,452 22,677 3,084 2004Shops at Arbor Walk, The, Austin, TX
(Note 6) . . . . . . . . . . . . . . . . . . . . . . — 930 42,546 — 5,090 930 47,636 48,566 7,520 2005
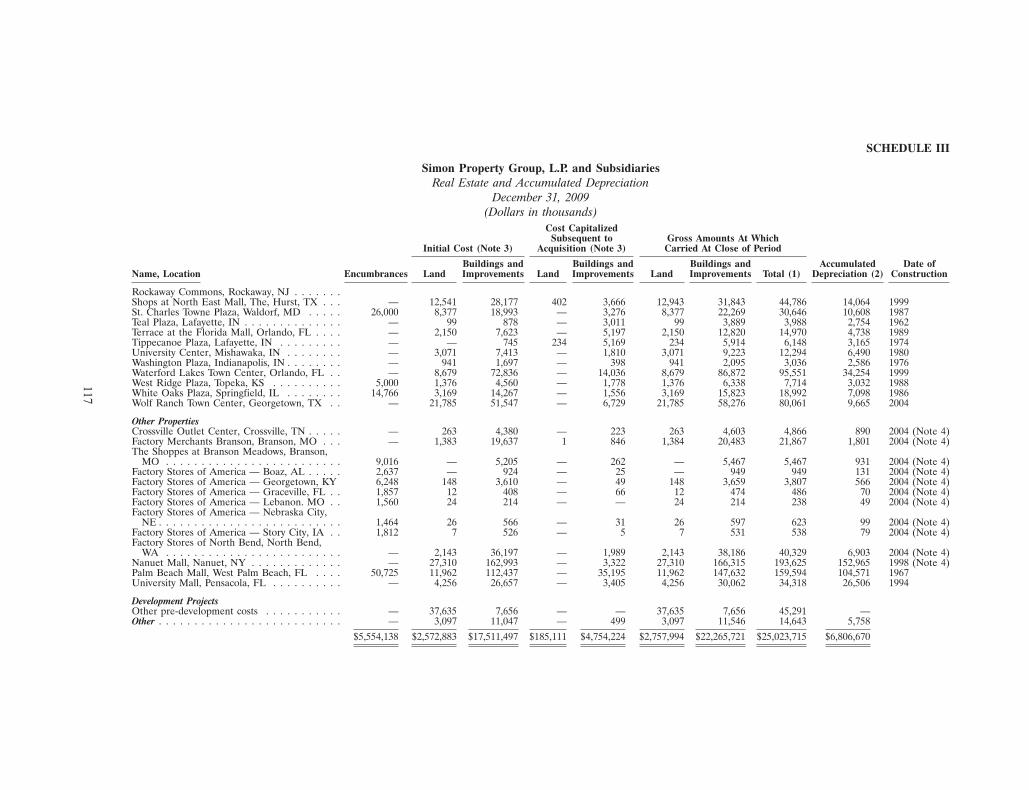
117
SCHEDULE III
Simon Property Group, L.P. and SubsidiariesReal Estate and Accumulated Depreciation
December 31, 2009(Dollars in thousands)
Cost CapitalizedSubsequent to Gross Amounts At Which
Initial Cost (Note 3) Acquisition (Note 3) Carried At Close of Period
Buildings and Buildings and Buildings and Accumulated Date ofName, Location Encumbrances Land Improvements Land Improvements Land Improvements Total (1) Depreciation (2) Construction
Rockaway Commons, Rockaway, NJ . . . . . . .Shops at North East Mall, The, Hurst, TX . . . — 12,541 28,177 402 3,666 12,943 31,843 44,786 14,064 1999St. Charles Towne Plaza, Waldorf, MD . . . . . 26,000 8,377 18,993 — 3,276 8,377 22,269 30,646 10,608 1987Teal Plaza, Lafayette, IN . . . . . . . . . . . . . . — 99 878 — 3,011 99 3,889 3,988 2,754 1962Terrace at the Florida Mall, Orlando, FL . . . . — 2,150 7,623 — 5,197 2,150 12,820 14,970 4,738 1989Tippecanoe Plaza, Lafayette, IN . . . . . . . . . — — 745 234 5,169 234 5,914 6,148 3,165 1974University Center, Mishawaka, IN . . . . . . . . — 3,071 7,413 — 1,810 3,071 9,223 12,294 6,490 1980Washington Plaza, Indianapolis, IN . . . . . . . . — 941 1,697 — 398 941 2,095 3,036 2,586 1976Waterford Lakes Town Center, Orlando, FL . . — 8,679 72,836 — 14,036 8,679 86,872 95,551 34,254 1999West Ridge Plaza, Topeka, KS . . . . . . . . . . 5,000 1,376 4,560 — 1,778 1,376 6,338 7,714 3,032 1988White Oaks Plaza, Springfield, IL . . . . . . . . 14,766 3,169 14,267 — 1,556 3,169 15,823 18,992 7,098 1986Wolf Ranch Town Center, Georgetown, TX . . — 21,785 51,547 — 6,729 21,785 58,276 80,061 9,665 2004
Other PropertiesCrossville Outlet Center, Crossville, TN . . . . . — 263 4,380 — 223 263 4,603 4,866 890 2004 (Note 4)Factory Merchants Branson, Branson, MO . . . — 1,383 19,637 1 846 1,384 20,483 21,867 1,801 2004 (Note 4)The Shoppes at Branson Meadows, Branson,
MO . . . . . . . . . . . . . . . . . . . . . . . . . 9,016 — 5,205 — 262 — 5,467 5,467 931 2004 (Note 4)Factory Stores of America — Boaz, AL . . . . . 2,637 — 924 — 25 — 949 949 131 2004 (Note 4)Factory Stores of America — Georgetown, KY 6,248 148 3,610 — 49 148 3,659 3,807 566 2004 (Note 4)Factory Stores of America — Graceville, FL . . 1,857 12 408 — 66 12 474 486 70 2004 (Note 4)Factory Stores of America — Lebanon. MO . . 1,560 24 214 — — 24 214 238 49 2004 (Note 4)Factory Stores of America — Nebraska City,
NE . . . . . . . . . . . . . . . . . . . . . . . . . . 1,464 26 566 — 31 26 597 623 99 2004 (Note 4)Factory Stores of America — Story City, IA . . 1,812 7 526 — 5 7 531 538 79 2004 (Note 4)Factory Stores of North Bend, North Bend,
WA . . . . . . . . . . . . . . . . . . . . . . . . . — 2,143 36,197 — 1,989 2,143 38,186 40,329 6,903 2004 (Note 4)Nanuet Mall, Nanuet, NY . . . . . . . . . . . . . — 27,310 162,993 — 3,322 27,310 166,315 193,625 152,965 1998 (Note 4)Palm Beach Mall, West Palm Beach, FL . . . . 50,725 11,962 112,437 — 35,195 11,962 147,632 159,594 104,571 1967University Mall, Pensacola, FL . . . . . . . . . . — 4,256 26,657 — 3,405 4,256 30,062 34,318 26,506 1994
Development ProjectsOther pre-development costs . . . . . . . . . . . — 37,635 7,656 — — 37,635 7,656 45,291 —Other . . . . . . . . . . . . . . . . . . . . . . . . . . — 3,097 11,047 — 499 3,097 11,546 14,643 5,758
$5,554,138 $2,572,883 $17,511,497 $185,111 $4,754,224 $2,757,994 $22,265,721 $25,023,715 $6,806,670
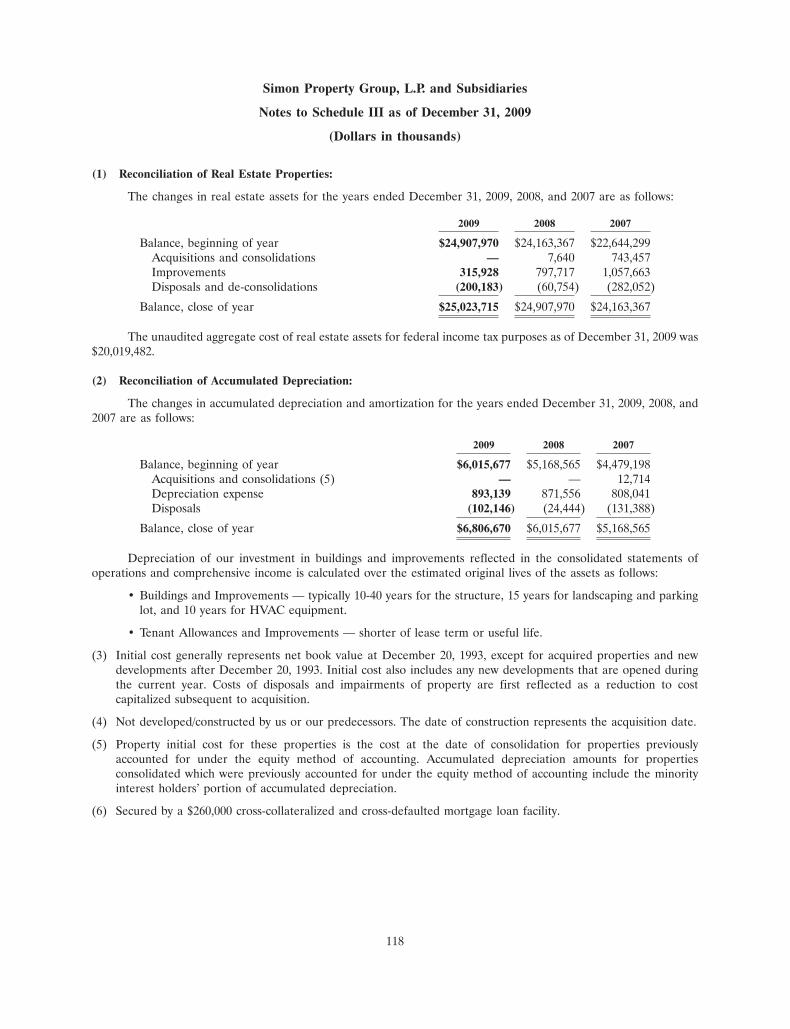
Simon Property Group, L.P. and Subsidiaries
Notes to Schedule III as of December 31, 2009
(Dollars in thousands)
(1) Reconciliation of Real Estate Properties:
The changes in real estate assets for the years ended December 31, 2009, 2008, and 2007 are as follows:
2009 2008 2007
Balance, beginning of year $24,907,970 $24,163,367 $22,644,299Acquisitions and consolidations — 7,640 743,457Improvements 315,928 797,717 1,057,663Disposals and de-consolidations (200,183) (60,754) (282,052)
Balance, close of year $25,023,715 $24,907,970 $24,163,367
The unaudited aggregate cost of real estate assets for federal income tax purposes as of December 31, 2009 was$20,019,482.
(2) Reconciliation of Accumulated Depreciation:
The changes in accumulated depreciation and amortization for the years ended December 31, 2009, 2008, and2007 are as follows:
2009 2008 2007
Balance, beginning of year $6,015,677 $5,168,565 $4,479,198Acquisitions and consolidations (5) — — 12,714Depreciation expense 893,139 871,556 808,041Disposals (102,146) (24,444) (131,388)
Balance, close of year $6,806,670 $6,015,677 $5,168,565
Depreciation of our investment in buildings and improvements reflected in the consolidated statements ofoperations and comprehensive income is calculated over the estimated original lives of the assets as follows:
• Buildings and Improvements — typically 10-40 years for the structure, 15 years for landscaping and parkinglot, and 10 years for HVAC equipment.
• Tenant Allowances and Improvements — shorter of lease term or useful life.
(3) Initial cost generally represents net book value at December 20, 1993, except for acquired properties and newdevelopments after December 20, 1993. Initial cost also includes any new developments that are opened duringthe current year. Costs of disposals and impairments of property are first reflected as a reduction to costcapitalized subsequent to acquisition.
(4) Not developed/constructed by us or our predecessors. The date of construction represents the acquisition date.
(5) Property initial cost for these properties is the cost at the date of consolidation for properties previouslyaccounted for under the equity method of accounting. Accumulated depreciation amounts for propertiesconsolidated which were previously accounted for under the equity method of accounting include the minorityinterest holders’ portion of accumulated depreciation.
(6) Secured by a $260,000 cross-collateralized and cross-defaulted mortgage loan facility.
118
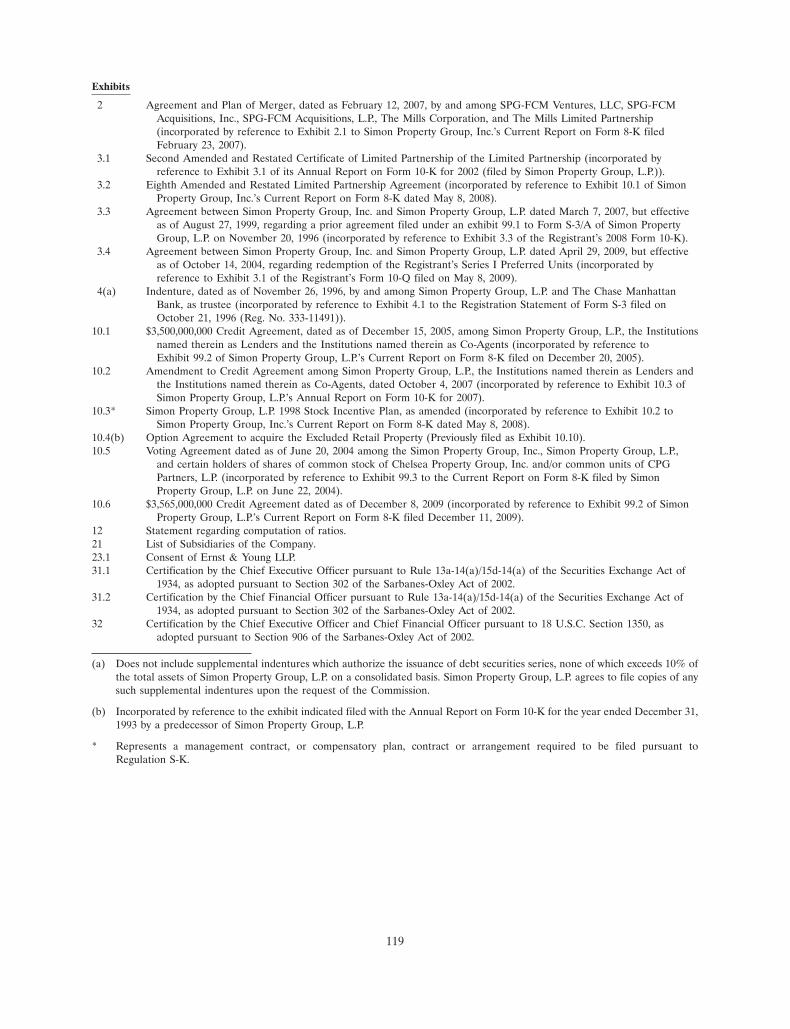
Exhibits
2 Agreement and Plan of Merger, dated as February 12, 2007, by and among SPG-FCM Ventures, LLC, SPG-FCMAcquisitions, Inc., SPG-FCM Acquisitions, L.P., The Mills Corporation, and The Mills Limited Partnership(incorporated by reference to Exhibit 2.1 to Simon Property Group, Inc.’s Current Report on Form 8-K filedFebruary 23, 2007).
3.1 Second Amended and Restated Certificate of Limited Partnership of the Limited Partnership (incorporated byreference to Exhibit 3.1 of its Annual Report on Form 10-K for 2002 (filed by Simon Property Group, L.P.)).
3.2 Eighth Amended and Restated Limited Partnership Agreement (incorporated by reference to Exhibit 10.1 of SimonProperty Group, Inc.’s Current Report on Form 8-K dated May 8, 2008).
3.3 Agreement between Simon Property Group, Inc. and Simon Property Group, L.P. dated March 7, 2007, but effectiveas of August 27, 1999, regarding a prior agreement filed under an exhibit 99.1 to Form S-3/A of Simon PropertyGroup, L.P. on November 20, 1996 (incorporated by reference to Exhibit 3.3 of the Registrant’s 2008 Form 10-K).
3.4 Agreement between Simon Property Group, Inc. and Simon Property Group, L.P. dated April 29, 2009, but effectiveas of October 14, 2004, regarding redemption of the Registrant’s Series I Preferred Units (incorporated byreference to Exhibit 3.1 of the Registrant’s Form 10-Q filed on May 8, 2009).
4(a) Indenture, dated as of November 26, 1996, by and among Simon Property Group, L.P. and The Chase ManhattanBank, as trustee (incorporated by reference to Exhibit 4.1 to the Registration Statement of Form S-3 filed onOctober 21, 1996 (Reg. No. 333-11491)).
10.1 $3,500,000,000 Credit Agreement, dated as of December 15, 2005, among Simon Property Group, L.P., the Institutionsnamed therein as Lenders and the Institutions named therein as Co-Agents (incorporated by reference toExhibit 99.2 of Simon Property Group, L.P.’s Current Report on Form 8-K filed on December 20, 2005).
10.2 Amendment to Credit Agreement among Simon Property Group, L.P., the Institutions named therein as Lenders andthe Institutions named therein as Co-Agents, dated October 4, 2007 (incorporated by reference to Exhibit 10.3 ofSimon Property Group, L.P.’s Annual Report on Form 10-K for 2007).
10.3* Simon Property Group, L.P. 1998 Stock Incentive Plan, as amended (incorporated by reference to Exhibit 10.2 toSimon Property Group, Inc.’s Current Report on Form 8-K dated May 8, 2008).
10.4(b) Option Agreement to acquire the Excluded Retail Property (Previously filed as Exhibit 10.10).10.5 Voting Agreement dated as of June 20, 2004 among the Simon Property Group, Inc., Simon Property Group, L.P.,
and certain holders of shares of common stock of Chelsea Property Group, Inc. and/or common units of CPGPartners, L.P. (incorporated by reference to Exhibit 99.3 to the Current Report on Form 8-K filed by SimonProperty Group, L.P. on June 22, 2004).
10.6 $3,565,000,000 Credit Agreement dated as of December 8, 2009 (incorporated by reference to Exhibit 99.2 of SimonProperty Group, L.P.’s Current Report on Form 8-K filed December 11, 2009).
12 Statement regarding computation of ratios.21 List of Subsidiaries of the Company.23.1 Consent of Ernst & Young LLP.31.1 Certification by the Chief Executive Officer pursuant to Rule 13a-14(a)/15d-14(a) of the Securities Exchange Act of
1934, as adopted pursuant to Section 302 of the Sarbanes-Oxley Act of 2002.31.2 Certification by the Chief Financial Officer pursuant to Rule 13a-14(a)/15d-14(a) of the Securities Exchange Act of
1934, as adopted pursuant to Section 302 of the Sarbanes-Oxley Act of 2002.32 Certification by the Chief Executive Officer and Chief Financial Officer pursuant to 18 U.S.C. Section 1350, as
adopted pursuant to Section 906 of the Sarbanes-Oxley Act of 2002.
(a) Does not include supplemental indentures which authorize the issuance of debt securities series, none of which exceeds 10% ofthe total assets of Simon Property Group, L.P. on a consolidated basis. Simon Property Group, L.P. agrees to file copies of anysuch supplemental indentures upon the request of the Commission.
(b) Incorporated by reference to the exhibit indicated filed with the Annual Report on Form 10-K for the year ended December 31,1993 by a predecessor of Simon Property Group, L.P.
* Represents a management contract, or compensatory plan, contract or arrangement required to be filed pursuant toRegulation S-K.
119