simbio virtual labs®: evobeaker® how the guppy got its...
TRANSCRIPT

©2013,SimBio.AllRightsReserved. 1
SimBioVirtualLabs®:EvoBeaker®
How the Guppy Got Its Spots
Introduction
Why Do Male Guppies Look Different in Different Streams?With his theory of evolution by natural selection, Darwin proposed a mechanism for descent with
modification. If a population of organisms has variation, inheritance, and differential reproductive
success, then the composition of the population changes from one generation to the next.
Just because a theory works on paper, however, doesn’t mean that it works in the real world. This lab
will challenge you to design a study that would allow you to document evolution by natural selection
in nature. The EvoBeaker simulations you will use are based on a classic study by John Endler (1980)
of natural selection in guppies. After you have designed and run your own experiments, you will have
a chance to analyze some of Endler’s experiments and results.
Color Variation in GuppiesMost of us know guppies only as dramatically patterned aquarium fish
(right). But the domesticated guppies we see in fish tanks are descended
from wild ancestors. Wild guppies, Poecilia reticulata, live in mountain
streams in the tropical forests of northeastern Venezuela, Margarita
Island, Trinidad, and Tobago (below).

SimBioVirtualLabs®|How the Guppy Got Its Spots
©2013,SimBio.AllRightsReserved. 2
Wild female guppies, like their domesticated cousins, are silvery gray and inconspicuous (below,
left). Wild males, while not so extravagantly ornamented as the males on this page, are nonetheless
impressively showy (below, right). They wear stripes, spots, and splashes of color that can be orange,
yellow, black, blue, or iridescent. No two males are exactly alike.
In this lab, your first task in conducting field research on wild guppies will be to assess the variation
among males in several populations.
Color diversity in wild guppies Females in wild populations are silvery gray (left). Males are brightly colored and highly variable (center and right). (Photos: Cara Gibson and Katie McGhee; provided by Helen Rodd.)

SimBioVirtualLabs®|How the Guppy Got Its Spots
©2013,SimBio.AllRightsReserved. 3
Exercise 1: Assessing Color Variation Among Males in Guppy Populations
[1] Launch SimBio Virtual Labs. Select How The Guppy Got Its Spots from the Evobeaker Labs options.
[2] On the right you should see a map of your fieldsite.Youwillbestudyingguppypopulationsintwostreams,WestStreamandEastStream.Bothstreamshave waterfalls that guppies cannot cross, dividingeach stream into upper and lower sections. EastStream also has a tributary, Meir Creek.Thus thereare fiveplacesto look forguppies. Inaddition,youhavethreefishtankssetupinafieldstationnearthestreams,whereyouwillconductyourexperiments.
[3] When the lab starts you are looking at the UpperWestStreamintheFishPoolviewonthe left-handsideofthescreen.(NotethattheUpperWestStreamishighlightedonthemap.)ClickondifferentareasofthemaptoseethedifferentpoolsappearintheFishPoolview.
When viewing different zones in the Fish Pool view, you will be able to see several species offish. Some of the guppies may look different from the others, but you won’t be able to clearlysee differences in their coloring until you catch them.You will also see some larger fish. Thesearepredatoryspeciesknowntoeatguppies.Thesmallbluerectanglesyouwillseerepresentthevariousthingsthatguppieseat,suchasplantmatteranddetritus.
The guppies at your field site have a maximum life span of around 120 days.The predatory fishhavemuchlongerlifespans.
[4] Thefirstthingyouneedtodoisexaminehowcolorfultheguppiesareineachpool.ClickagainonUpper West StreaminthemaptomakethatzoneappearintheFish Pool.
To catch a guppy, double-click or CTRL-click (z click on a Mac) on it. This will open a windowcontainingapictureoftheguppy,andalsoincludesdatatellingyoutheguppy’sgenderandSpot Brightness.Spot brightness isameasureofhowmanyspotsaguppyhasandhowcolorfultheguppyis.
[5] If your first guppy is female, throw it back into the stream by closing the pop up window. Keepcatchingguppiesuntilyougetamale.Countyourmaleguppy’sspots.
[6] Examineseveralmalesandseeifyoucanconfirmthatmaleswithmorespotstendtohavehigherspotbrightnessscores.

SimBioVirtualLabs®|How the Guppy Got Its Spots
©2013,SimBio.AllRightsReserved. 4
[ 6.1 ] Now catch 15-20 male guppies and record their spot brightness on the table below.
MALE # SPOT BRIGHTNESS MALE # SPOT BRIGHTNESS
1 11
2 12
3 13
4 14
5 15
6 16
7 17
8 18
9 19
10 20
[ 6.2 ] In the space below, record any other observations you think might be important, such as what other species you find living in the pool along with the guppies:
NOTES ON UPPER WEST STREAM:
[ 6.3 ] On the grid below, plot a histogram showing the variation in spot brightness among the male guppies in Upper West Stream:

SimBioVirtualLabs®|How the Guppy Got Its Spots
©2013,SimBio.AllRightsReserved. 5
[7] NowthatyouknowhowmuchvariationthereisamongthemalesinUpperWestStream,youneedto characterize the variation among the males in each of the other pools.You will have alreadynoticed that sampling guppies can get tedious after a while, so you can‘hire’ an assistant to doitforyou.Todoso,gototheEXPERIMENTmenuandselectHIRE ASSISTANT.Youwillseethesameviewasbefore,butonthelowerrightissomethingnew:ahistogramshowingthevariationinspotbrightnessamongthemaleguppiesinthecurrentlyselectedresearchsite.
[8] Youcancopyorprintyourassistant’shistogramforyour records.Tocopy thehistogram,mouseoverthecenterofyourhistogramandright-click(Windows)orControl-Click(OSX).Choose“CopyViewtoClipboard.” Thenopenadocument inawordprocessingprogramwhereyoucanpastethepictureandusethePASTEcommandtoplacethescreenshot in thedocument. Besuretoindicatewhatthehistogramis(i.e.,“HistogramofUpperWestStreambeforeanymanipulations”)andincludeimportantnotesonthatpoolasinstep6.2.
[ 8.1 ] How does your assistant’s graph (which includes all the males in the pool) compare to yours from page 3 (which includes a smaller sample of males from the pool)?
[ 8.2 ] Visit Lower West Stream, Upper East Stream, and Lower East Stream by clicking on each pool on the Map. For each stream, COPY or PRINT your assistant’s histogram. Write the stream name and take notes on features of the stream and the other species that live there. Finally, visit Meir Creek to see what lives there.
[ 8.3 ] Before moving on to the next section, write a short description of the natural history information you’ve found so far in your studies, including any differences between the pools. This should include your observations, but NOT hypotheses for what you saw—don’t try to explain anything yet, just summarize the facts:

SimBioVirtualLabs®|How the Guppy Got Its Spots
©2013,SimBio.AllRightsReserved. 6
Exercise 2: Why Are Males From Different Locations Different?
You have discovered that male guppies from some locations are showier than the males from other
locations. The question you must answer now is: Why? You will answer this question in two steps.
Exercise 2a: Generating Hypotheses and Designing Experiments[1] The first step in determining why the male guppies from some locations are showier than the
malesfromotherlocationsistobrainstormseveralhypotheses.
[ 1.1 ] Write down at least two hypotheses for what might be causing the differences in male showiness between the pools. Think about things other than the guppies themselves that were different between the pools:
[ 1.2 ] Now you must design an experiment (or a series of experiments) that will distinguish between your hypotheses or that will eliminate one of them as an explanation. In planning your experiment(s), be aware that you have three fish tanks at your disposal for conducting your research (Tank 1, Tank 2, and Tank 3 on the map). Click on the tanks to see that the background in each tank is a different color.
In conducting your experiments, EvoBeaker will allow you to do the following (instructions for doing each are given below):
– Youcanmoveaguppy,orotherfish,fromplacetoplacewithinapoolortank.
– Youcanmoveguppiesfromonepooltoanother.
– Youcanmoveguppiestoatank.
– Youcanmoveindividualsofotherspeciesbetweenpoolsorintooneofthetanks.
– Youcanremoveguppiesorotherspeciesfromapoolortank.
– Youcanrearguppies(withorwithoutotherspecies)inatankforasmanygenerationsasyouchoose.
– Youcanallowtimetopassinapoolforaslongasyouchoose.Recallthatthemaximumguppylifespanisaround120days.

SimBioVirtualLabs®|How the Guppy Got Its Spots
©2013,SimBio.AllRightsReserved. 7
[ 1.3 ] Describe the logic of your experiment(s) in the space below. What species will you use? What will you do with them? How long will your experiment(s) have to run before you can collect data? What data will you collect? What graphs will you draw to analyze the data? Sketch what your graphs will look like if each hypothesis is correct, and also what they will look like if each hypothesis is wrong.
Describe your experiment(s) here:
SimBioVirtualLabs®|How the Guppy Got Its Spots
©2013,SimBio.AllRightsReserved. 8
Exercise 2b: Conducting Experiments[1] The next step is to design and conduct experiments to test your hypotheses. Use EVOBEAKER
tocarryoutyourexperiments.Besuretorecorddataandtakenotesasyougo.Astimepermits,continue refining your hypotheses—or generating new ones—and testing them until you feelconfidentthatyouknowthereasonwhythemaleguppieslookdifferentindifferentpools.
Thefollowingareinstructionsyoumayfindusefulwhileconductingyourexperiments:
How To Add Fish or Fish FoodIfyouwanttoaddafishorsomefishfooddirectlytoatankorpool,dothefollowing:
– Onthemap,clickonanytankorpool.
– ClickontheADD CRITTERtool.(Itwilllooklikeafemaleguppyatfirst.)
– Selecttheiconofwhatyouwouldliketoaddtoyourtankorpoolfromthemenu.
– EitherclickonetimeintheFishPooltoaddonecritterorclickanddragtodrawaboxtoaddmanycrittersatonce.
How to Transplant FishIfyouwanttotransplantguppiesorindividualsofotherspeciesfromapooltoatankorfromonepooltoanother,dothefollowing:
– ClickontheSELECTtool(thearrowbutton).
– Select a single fish by clicking on it.You can select multiple individuals by dragging arectanglearoundthem,orbyholdingdowntheshiftkeyandclickingseparatelyoneachindividualyouwanttoselect.
– Moveyourselectedfishbyclickingonit(orbyclickingononeofyourgroupofselectedfish).Whileholdingthemousebuttondown,dragthecursortotheplaceyouwantthefishtogo(thiscanincludedraggingthemtoanotherpoolortooneofthetanks),thenreleasethemousebutton.
How to Remove Fish– Totemporarilyremoveafishfromapoolortank,youcantransplantthefishtotheCooler.
Thecooler isaholdingtank.Fishstored in thecoolerwillnotmovearoundor interactwitheachother.
– To permanently remove a fish, select the DELETE tool (the trash-can button). Click ontheindividualyouwanttoremove,ordragarectanglearoundagroupoffishyouwantto remove. Be careful with the DELETE tool; fish of species other than guppies do notreproduceinoursimulation.

SimBioVirtualLabs®|How the Guppy Got Its Spots
©2013,SimBio.AllRightsReserved. 9
� NOTE:Don’tforgettoswitchbacktotheSELECTtool(thearrowbutton)whenyouaredonetoavoidaccidentallykillinginnocentbystanders.
How to Run ExperimentsEachpoolortankcanrunindependentlyoftheothers,soyoucandoanexperimentinonewithoutworryingaboutwhat’shappeninginothers.Toallowtimetoadvanceinoneofthepoolsortanks:
– Onthemap,clickonthepoolortank(forexample,‘Tank2’).
– Beforeyoustart,writedownthetimedenotedontheDAYSclockshownatthebottomof the window.Writing down the start time will help you keep track of how long theexperimenthasbeenrunning.Recallthatguppiesliveforabout120days.
– Torun thesimulation,click theGObutton.Youwill see the fishswimaround,andyouwillseetheDaysadvanceontheclock.Remember:Guppies liveforaround120days—you will want to run your experiments for long enough to have several generations ofguppiesliveanddiebeforerecordingyourresults.Bepatient,evolutionisaslowprocess!
– Tostopthesimulation,clicktheSTOPbutton.
– If,instead,youwishtimetoadvanceonedayatatime,usetheSTEPbutton.
– If you want to clear a tank, you can do so by moving all its inhabitants to the Cooler(see instructions above for transplanting fish).You can also simply kill all of the tank’sinhabitants.
– UsetheRESETbuttononlyifyouwanttorestoreallsites(alltanksandstreams)totheiroriginalstates—astheywerewhenyoufirstloadedtheguppylab.
A Friendly Warning Before You Continue:ThecontrolpanelatthebottomofthescreenincludesaRESETbutton.ClickingtheRESETbuttonwill restore theentiresimulationtostartingconditions, includingall fivestreams,all three tanks,andthecooler.Remember,donotpresstheRESETbuttonunlessyoureallywanttostartover.
[ 1.1 ] When you have a hypothesis that you feel is supported by your experimental results, summarize these results in a short paper (~2 pages). Use graphs and statistical analyses that allow you to demonstrate and support your conclusions.
Record your notes, observations, and data from your experiments below and on the following pages:

SimBioVirtualLabs®|How the Guppy Got Its Spots
©2013,SimBio.AllRightsReserved. 10
Notes, observations, and data from your experiments (continued):

SimBioVirtualLabs®|How the Guppy Got Its Spots
©2013,SimBio.AllRightsReserved. 11
Notes, observations, and data from your experiments (continued):

SimBioVirtualLabs®|How the Guppy Got Its Spots
©2013,SimBio.AllRightsReserved. 12
John Endler’s Experiments
In 1980 John Endler published the results of two experiments on guppies that are now considered
classics. Endler had examined numerous guppies from each of several natural streams. He found that
the males in some locations had many more spots, on average, than the males in other populations.
Endler’s hypothesis was that predators are responsible for much of this variation among populations.
He had noticed that guppies sharing their stream with predatory cichlids had fewer spots than guppies
living with Rivulus. Cichlids are ravenous predators of adult guppies. Rivulus eat only juvenile guppies.
In his first experiment, Endler collected guppies from 18 locations in 11 different streams. He moved
these fish into artificial ponds in a greenhouse, and let them grow for about 6 months—long enough
for several generations of fish to grow up, reproduce, and die.
Endler then divided his guppy population among 10 greenhouse ponds. To four ponds he added a
single cichlid. To four other ponds he added half a dozen Rivulus. The remaining two ponds he left
without predators as controls. Five months later, and again 14 months later, Endler sampled male
guppies from his ten populations and counted their spots.
[1] Endler’sactualresultsappearbelow.ExamineEndler’sgraph.
[ 1.1 ] How do Endler’s results compare with your EvoBeaker results? Was Endler’s hypothesis correct?
Results from Endlers’ greenhouse experimentEndler established his guppy population at month zero. At month six, he divided his guppies among ten ponds with different predators. The graph shows the average number of spots per male in the founding population, the Rivulus ponds, the Cichlid ponds, and the predator-free ponds at 0, 6, 10 and 20 months. (Source: Re-rendered from Figure 1 in Endler 1980.)
SimBioVirtualLabs®|How the Guppy Got Its Spots
©2013,SimBio.AllRightsReserved. 13
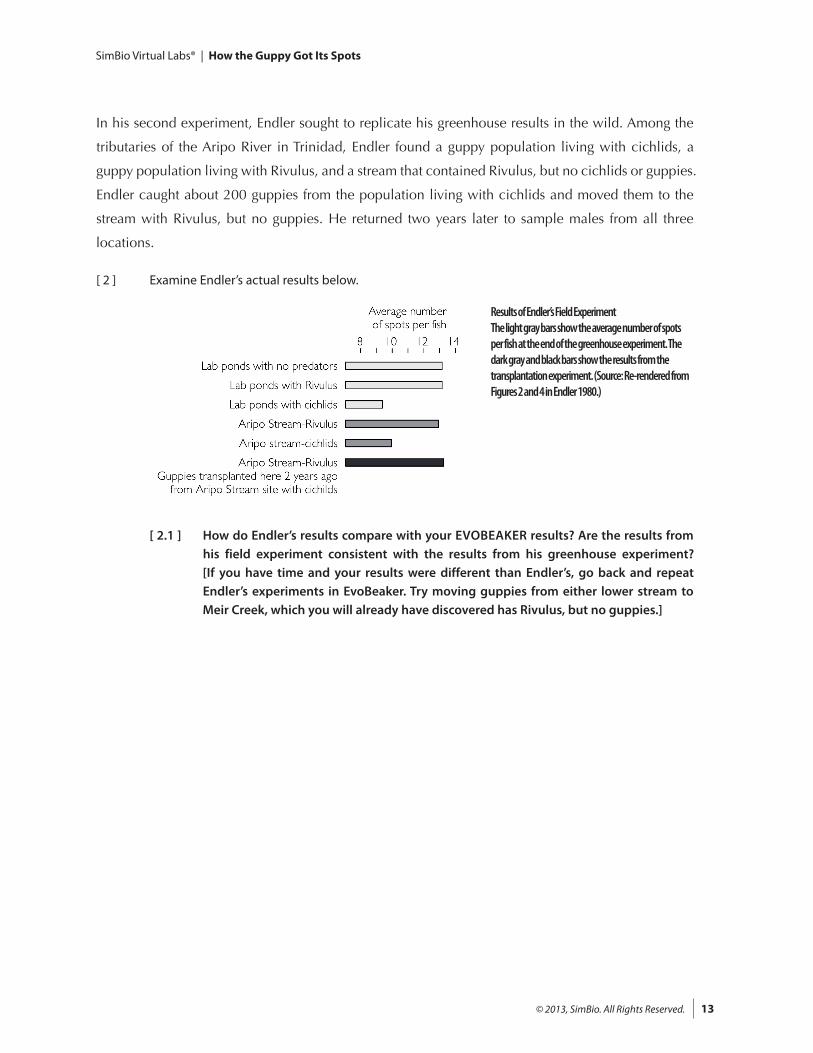
In his second experiment, Endler sought to replicate his greenhouse results in the wild. Among the
tributaries of the Aripo River in Trinidad, Endler found a guppy population living with cichlids, a
guppy population living with Rivulus, and a stream that contained Rivulus, but no cichlids or guppies.
Endler caught about 200 guppies from the population living with cichlids and moved them to the
stream with Rivulus, but no guppies. He returned two years later to sample males from all three
locations.
[2] ExamineEndler’sactualresultsbelow.
[ 2.1 ] How do Endler’s results compare with your EVOBEAKER results? Are the results from his field experiment consistent with the results from his greenhouse experiment? [If you have time and your results were different than Endler’s, go back and repeat Endler’s experiments in EvoBeaker. Try moving guppies from either lower stream to Meir Creek, which you will already have discovered has Rivulus, but no guppies.]
Results of Endler’s Field Experiment The light gray bars show the average number of spots per fish at the end of the greenhouse experiment. The dark gray and black bars show the results from the transplantation experiment. (Source: Re-rendered from Figures 2 and 4 in Endler 1980.)

SimBioVirtualLabs®|How the Guppy Got Its Spots
©2013,SimBio.AllRightsReserved. 14
Literature CitedEndler, John A. 1980. Natural selection on color patterns in Poecilia reticulata. Evolution 34: 76-91.