silverlake axis axis_initiation_mb... · june 20, 2014 2 silverlake axis our thesis in charts ....
TRANSCRIPT

June 20, 2014
Init
iati
on
COM
PAN
Y RE
SEA
RCH
|
SEE PAGE 24 FOR IMPORTANT DISCLOSURES AND ANALYST CERTIFICATIONS Co. Reg No: 198700034E MICA (P) : 099/03/2012
Silverlake Axis (SILV SP)
Monetizing the banks Initiate at BUY with a DCF-based TP of SGD1.40. At our TP,
the implied FY6/15E P/E is 26.6x.
Entrenched position in growing market with solid expansion in recurring income stream.
Strong capital management potential with a net cash position of MYR300m.
Initiate at BUY with TP of SGD1.40 Our DCF-based (WACC= 9.3%, terminal g= 3.0%) TP of SGD1.40 implies a 21% upside. Despite the strong 32% share price performance YTD, we expect the solid 16% FY6/14E-17E EPS CAGR to sustain its re-rating. Furthermore, the highly cash generative nature of its business should support rising dividends.
Reasons to be optimistic Entrenched position in the huge addressable Asia-Pacific banking market. Ranked fifth in Asia Pacific and top 2 in Southeast Asia, we expect SAL to benefit from growing IT spending by banks (five-year CAGR= 6.8%). The ongoing drive to upgrade ageing core banking systems will continue to drive sales of its flagship product and allow it to monetize the large installed base of its products.
Strong momentum in software licencing: leading indicator for recurring income. Software licencing sales increased by 15% YoY in 9MFY6/14 and we expect this to translate into growing recurring income (FY6/14E: 43% of group revenue) over the next few years.
Strong capital management potential. With an ungeared balance sheet and sizeable war chest of more than MYR300m in cash, SAL could optimize their capital structure by announcing a special dividend or initiating a share buyback program.
Catalysts: Acquisitions by existing customers, new customers. Risks: Key personnel departure, loss of customers, curb in IT spending by banks and removal of tax incentives.
Key Data
Share Price Performance
Maybank vs Market
80
120
160
200
240
280
320
360
400
440
0.30
0.40
0.50
0.60
0.70
0.80
0.90
1.00
1.10
1.20
Jun-12 Oct-12 Feb-13 Jun-13 Oct-13 Feb-14 Jun-14
Silverlake - (LHS, SGD) Silverlake / Straits Times Index - (RHS, %)
1 Mth 3 Mth 12 Mth
Absolute(%) 27.2 31.6 48.7
Relative to index (%) 27.0 24.0 46.2
Positive Neutral Negative
Market Recs 4 0 0
Maybank Consensus % +/-
Target Price (SGD) 1.40 0.99 41.1
'15 PATMI (MYRm) 304 266 14.5
'16 PATMI (MYRm) 336 310 8.1
Source: FactSet; Maybank
FYE Jun (MYR m) FY13A FY14A FY15E FY16E FY17ERevenue 398.6 487.0 599.5 634.2 702.0EBITDA 219.1 268.4 329.0 358.4 399.0Core net profit 196.0 240.3 304.3 335.5 375.0Core EPS (sen) 9.3 10.7 13.6 15.0 16.7Core EPS growth (%) 19.8 15.7 26.6 10.3 11.8Net DPS (sen) 8.0 10.2 12.9 14.2 15.9Core P/E (x) 31.8 27.5 21.7 19.7 17.6P/BV (x) 11.3 10.9 9.9 9.4 8.8Net dividend yield (%) 2.7 3.5 4.4 4.8 5.4ROAE (%) 44.3 40.2 47.7 48.8 51.4ROAA (%) 34.3 32.2 39.0 40.5 42.9EV/EBITDA (x) 16.4 23.7 19.0 17.4 15.5Net debt/equity (%) net cash net cash net cash net cash net cash
Derrick Heng(65) 6432 [email protected]
Share Price: SGD1.16 MCap (USD): 2.1B Singapore Target Price: SGD1.40(+21%) ADTV (USD): 2M Technology (New) BUY
52w high/low (SGD) 3m avg turnover (USDm) Free float (%) Issued shares (m) Market capitalization Major shareholders: -GOH PENG OOI 67.6%
1.15/0.71
2,244 28.8
SGD2.6B
2.0
FY14E

June 20, 2014 2
Silverlake Axis
Our thesis in charts
Figure 1: Robust growth in IT spending for the Asia-Pacific banking market projected over the next five years
Source: IDC Financial Insights
Figure 2: With 40% of leading Southeast Asian banks as customers, SAL will benefit from this positive development
Source: Maybank KE estimates
Figure 3: Scalable nature of its business implies that the growing revenue base will quickly be converted to FCF
Source: Maybank KE estimates
Figure 4: Strong sales momentum in software licencing: leading indicator for recurring income
Source: Maybank KE estimates
Figure 5: DPS to rise on strong cash generation FY6/14E-17E FCF CAGR of 11%
Source: Maybank KE estimates
Figure 6: Solid earnings delivery to sustain the re-rating FY6/14E-17E EPS CAGR of 16%
Source: Maybank KE estimates
5.0
6.8
2.7
8.5
4.2
0
2
4
6
8
10
Global Asia Pacific Europe ROW NorthAmerica
IT Spending by banking sector - five-year CAGR(%)
0
100
200
300
400
500
600
700
800
FY09
FY10
FY11
FY12
FY13
FY14E
FY15E
FY16E
FY17E
Group revenueMaintenance revenue
(MYR m)
0
100
200
300
400
500
600
700
800
FY09
FY10
FY11
FY12
FY13
FY14E
FY15E
FY16E
FY17E
Group revenue
FCF
(MYR m)
0
5
10
15
20
25
30
35
40
45
1QFY11
2QFY11
3QFY11
4QFY11
1QFY12
2QFY12
3QFY12
4QFY12
1QFY13
2QFY13
3QFY13
4QFY13
1QFY14
2QFY14
3QFY14
Software licencing sales
(MYR m)
0.019 0.031 0.039 0.050 0.055 0.062 0.00
0.01
0.02
0.03
0.04
0.05
0.06
0.07
100
150
200
250
300
350
400
FY12
FY13
FY14E
FY15E
FY16E
FY17E
DPS (RHS) FCF (LHS)(MYR m) (SGD)
TP SGD1.40
0.20
0.40
0.60
0.80
1.00
1.20
1.40
1.60
Jun-10Sep-10D
ec-10M
ar-11Jun-11Sep-11D
ec-11M
ar-12Jun-12Sep-12D
ec-12M
ar-13Jun-13Sep-13D
ec-13M
ar-14Jun-14Sep-14D
ec-14M
ar-15Jun-15Sep-15D
ec-15M
ar-16Jun-16
(SGD)
25x
15x
20x
10x

June 20, 2014 3
Silverlake Axis
Investment thesis
Initiate at BUY with TP of SGD1.40 Our DCF-based (WACC= 9.3%, terminal g= 3.0%) TP of SGD1.40 implies a 21% upside. Despite the strong 32% share price performance YTD, we expect the solid 16% FY6/14E-17E EPS CAGR to sustain its re-rating. Furthermore, the highly cash generative nature of its business should support rising dividends.
Reasons to be optimistic Entrenched position in growing market. According to IDC Financial Insights, IT spending for the Asia-Pacific banking market is expected to expand at a robust annual rate of 6.8% over the next five years, outpacing global growth of 5.0%. With its entrenched market position in the Asia-Pacific banking market, SAL will benefit from this positive development. Inntron, an IT consultant for banking software solutions, ranks it fifth in the region. Within this region, the company boasts a strong presence in Southeast Asia where 40% of the leading banks are its customers and it holds the top two positions in the key banking markets of Malaysia, Singapore, Thailand and Indonesia. The ongoing drive to upgrade ageing core banking systems will continue to drive sales of its flagship product and allow it to monetize the large installed base of its products.
Key reasons to core banking system upgrade:
1) Evolution of banking business drives growing data volumes;
2) Heightened regulatory requirements drive the need for more robust data quality; and
3) Banks are moving from being product centric to customer centric.
Strong momentum in software licencing: leading indicator for recurring income. Sales momentum for software licencing remains strong which should translate into sustained growth in recurring income over the next few years. Our projected 13% pa organic revenue growth from FY6/14E to FY6/17E will be secured by this growing stream of recurring income (FY6/14E: 43% of group revenue).
Strong capital management potential. With a sizeable net cash position of MYR300m, capital management potential is strong. SAL could optimize its capital structure via a special dividend or a share buyback program. The latter is a move recently announced by its closest peer, Temenos.
June 20, 2014 4
Silverlake Axis
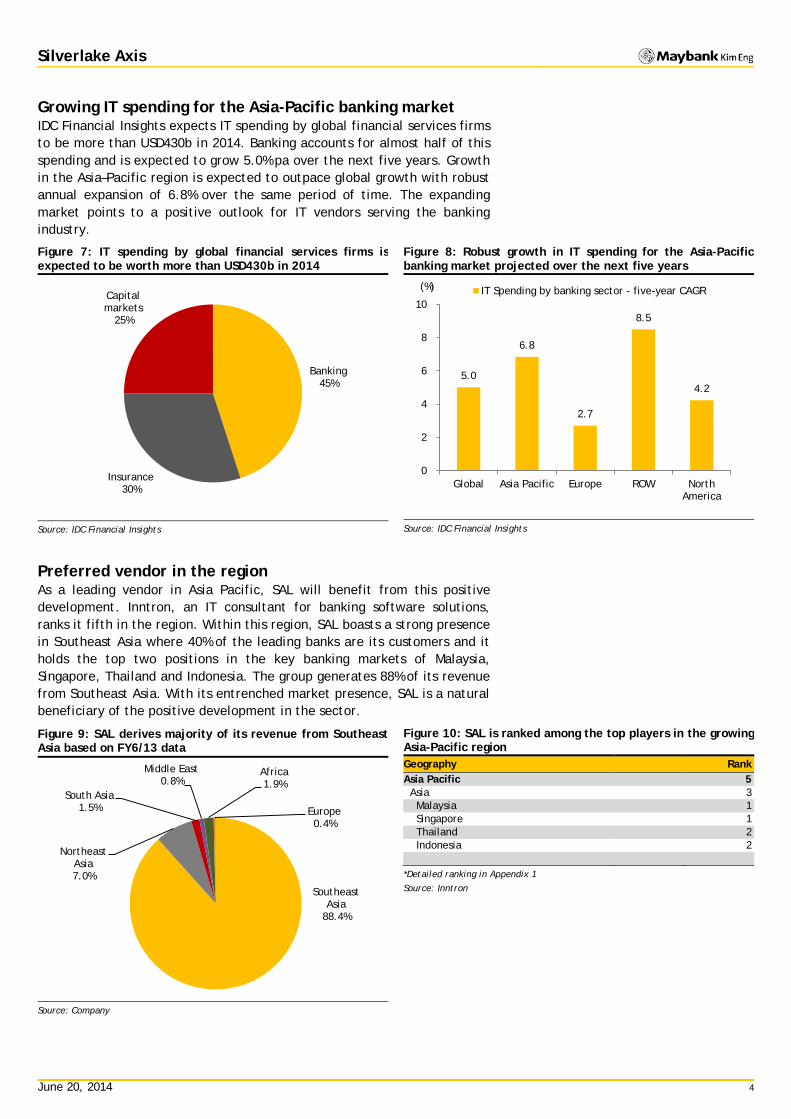
Growing IT spending for the Asia-Pacific banking market IDC Financial Insights expects IT spending by global financial services firms to be more than USD430b in 2014. Banking accounts for almost half of this spending and is expected to grow 5.0% pa over the next five years. Growth in the Asia–Pacific region is expected to outpace global growth with robust annual expansion of 6.8% over the same period of time. The expanding market points to a positive outlook for IT vendors serving the banking industry.
Figure 7: IT spending by global financial services firms is expected to be worth more than USD430b in 2014
Source: IDC Financial Insights
Figure 8: Robust growth in IT spending for the Asia-Pacific banking market projected over the next five years
Source: IDC Financial Insights
Preferred vendor in the region As a leading vendor in Asia Pacific, SAL will benefit from this positive development. Inntron, an IT consultant for banking software solutions, ranks it fifth in the region. Within this region, SAL boasts a strong presence in Southeast Asia where 40% of the leading banks are its customers and it holds the top two positions in the key banking markets of Malaysia, Singapore, Thailand and Indonesia. The group generates 88% of its revenue from Southeast Asia. With its entrenched market presence, SAL is a natural beneficiary of the positive development in the sector.
Figure 9: SAL derives majority of its revenue from Southeast Asia based on FY6/13 data
Source: Company
Figure 10: SAL is ranked among the top players in the growing Asia-Pacific region Geography Rank Asia Pacific 5 Asia 3 Malaysia 1 Singapore 1 Thailand 2 Indonesia 2
*Detailed ranking in Appendix 1
Source: Inntron
Banking 45%
Insurance 30%
Capital markets
25%
5.0
6.8
2.7
8.5
4.2
0
2
4
6
8
10
Global Asia Pacific Europe ROW NorthAmerica
IT Spending by banking sector - five-year CAGR(%)
Southeast Asia
88.4%
Northeast Asia 7.0%
South Asia 1.5%
Middle East 0.8%
Africa 1.9%
Europe 0.4%

June 20, 2014 5
Silverlake Axis
Huge addressable market Based on estimates by Temenos, SAL’s closest listed peer, third-party work currently accounts for only 22% of total spending by banks. This implies a huge addressable market for third-party vendors such as SAL should banks increase their adoption of third-party work in the future. This trend could take hold as banks appreciate third-party vendors’ economies of scale and reallocate resources to focus on their main banking business. This adds another dimension of growth to the expanding market as explained earlier.
Figure 11: Low penetration of third-party work implies a huge addressable market for vendors, such as SAL
*Refers to licence and maintenance spending on core banking, wealth, business intelligence, channels and payments. Source: Temenos
Supportive underlying trends for flagship product Legacy core banking systems built in the past struggle to support current business needs that continue to evolve at a rapid pace. This supports the case to refresh and upgrade these ageing systems. As SAL derives a majority of its revenue from its flagship core banking product, Silverlake Axis Integrated Banking Solution (SIBS), the company is thus highly exposed to the favourable sector trends.
Key reasons to upgrade core banking systems:
Evolution of banking business drives growing data volumes. Banks have been adapting to the changing market landscape as business needs evolve. New banking channels such as internet and mobile banking are gradually taking over the role of traditional retail branches. These channels generate huge volumes of data as client interactions multiply and drive the need for improved and more robust IT systems.
Heightened regulatory requirements drive the need for better data quality. The regulatory environment for banks has changed significantly since the global financial crisis. With increasing emphasis on stronger risk management, new regulatory requirements such as Basel III are being implemented in phases across the region. Under these new rules, banks are required to hold adequate levels of capital and provide timely information on firm-wide leverage ratios. This drives the need to upgrade their IT systems to ensure data integrity.
7.0
32.0
0
5
10
15
20
25
30
35
Spend with third parties Total spend on banking software
(USD b)
June 20, 2014 6
Silverlake Axis
Moving from being product centric to customer centric. Legacy core banking systems were built to revolve around product development. The growing number of customer touch points implies that data and IT systems will need to be better integrated to enhance customer experience. Hence, IT systems would again need to be upgraded to shift from being product centric to being customer centric.
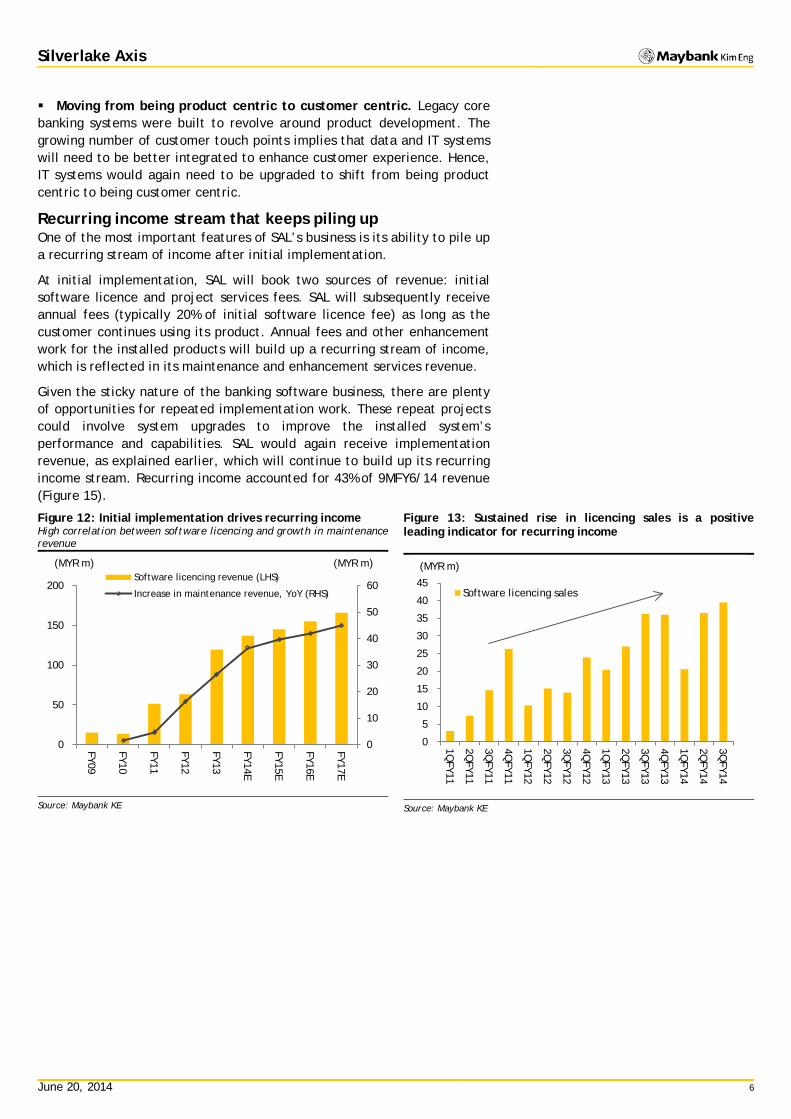
Recurring income stream that keeps piling up One of the most important features of SAL’s business is its ability to pile up a recurring stream of income after initial implementation.
At initial implementation, SAL will book two sources of revenue: initial software licence and project services fees. SAL will subsequently receive annual fees (typically 20% of initial software licence fee) as long as the customer continues using its product. Annual fees and other enhancement work for the installed products will build up a recurring stream of income, which is reflected in its maintenance and enhancement services revenue.
Given the sticky nature of the banking software business, there are plenty of opportunities for repeated implementation work. These repeat projects could involve system upgrades to improve the installed system’s performance and capabilities. SAL would again receive implementation revenue, as explained earlier, which will continue to build up its recurring income stream. Recurring income accounted for 43% of 9MFY6/14 revenue (Figure 15).
Figure 12: Initial implementation drives recurring income High correlation between software licencing and growth in maintenance revenue
Source: Maybank KE
Figure 13: Sustained rise in licencing sales is a positive leading indicator for recurring income
Source: Maybank KE
0
10
20
30
40
50
60
0
50
100
150
200
FY09
FY10
FY11
FY12
FY13
FY14E
FY15E
FY16E
FY17E
Software licencing revenue (LHS)
Increase in maintenance revenue, YoY (RHS)
(MYR m) (MYR m)
0
5
10
15
20
25
30
35
40
45
1QFY11
2QFY11
3QFY11
4QFY11
1QFY12
2QFY12
3QFY12
4QFY12
1QFY13
2QFY13
3QFY13
4QFY13
1QFY14
2QFY14
3QFY14
Software licencing sales
(MYR m)

June 20, 2014 7
Silverlake Axis
Figure 14: Stickiness of its software allows SAL to enjoy recurring workload
Source: Company
Figure 15: Recurring income (Maintenance and enhancement services) comprised 43% of revenue in 9MFY6/14
Source: Company, Maybank KE
Figure 16: We project a sustained rise in recurring income
Source: Company, Maybank KE
Software licencing
27%
Software project services
15%
Maint. and enhancement services
43%
Sale of software
and hardware products
8%
Credit card processing
3%
Insurance processing
4%
0
5
10
15
20
25
100
150
200
250
300
350
FY09
FY10
FY11
FY12
FY13
FY14E
FY15E
FY16E
FY17E
Maintenance and enhancement services
YoY
(MYR m) (%)

June 20, 2014 8
Silverlake Axis
Forecasts – 16% FY6/14E-17E EPS CAGR We project a 13% pa organic revenue growth to FY6/17E. The scalable nature of its business implies that profitability would improve as margins expand off a fixed cost base. Consequently, we project a faster, 16% pa EPS growth over the same period. Given the highly cash generative nature of its business, we forecast an 11% FY6/14E-17E FCF CAGR that should support growing DPS in our forecast years.
Revenue drivers Licencing and project services. Sales for these two segments are lumpy in nature and driven by its order book recognition. In a recent discussion after the release of its 3QFY6/14 results, management highlighted that its order book is currently worth approximately MYR250m. This translates to slightly over one times its typical sales for this segment. Historical EBITDA margin for the licencing business is high at above 94% and driven by the licencing of its proprietary core banking software, SIBS. Profitability for project services varies depending on the nature of work.
Maintenance and enhancement services. As shown in Figures 12 and 14, revenue growth for this segment is highly correlated to software licencing sales at initial implementation. Given the stickiness of banking software, we expect high retention rates and see the sustained rise in licencing revenue as a positive leading indicator for continued expansion in maintenance income.
Sale of software and hardware products, credit card and insurance processing. SAL generates relatively small profit contribution from the sale of various hardware and software products related to its software implementation work. It also records similarly small profit contributions from its credit card business in Japan (Silverlake Japan) and insurance products from the Merimen Group that was acquired in Apr 2013.
Cost drivers Profitability to improve on scalability of business. SAL’s business is highly scalable due to its ability to repeatedly sell its software products. After all, the company only needs to incur software development costs once. This means there is tremendous potential for profit growth as margins expand off a fixed cost base.
Cost structure. SAL has a fairly even split between fixed (staff, software amortisation, overheads & others) and variable (software subscription and hardware) cost items, according to our estimates. At close to 40% of cost, staff-related expenses are the largest fixed cost for the group. Its fixed cost base was relatively stable over the past three years. Historically, software subscription cost is highly correlated to project services sales.

June 20, 2014 9
Silverlake Axis
Figure 17: Cost structure – even split between fixed and variable items Key operating cost items for FY6/13 (MYR m)
Source: Maybank KE estimates
Figure 18: Relatively stable fixed cost base
Source: Maybank KE estimates
EBITDA margin trend. The group’s EBITDA margin varies depending on the product mix in the year. In particular, sale of software and hardware products can have an outsize impact on group EBITDA margin. For the key software licencing and maintenance and enhancement services, EBITDA margins have historically been stable at 95% and 60%, respectively. Profitability of software project services varies depending on the nature of projects executed in the year.
Low tax rate. SAL’s historical tax rates vary according to the geographical distribution of its profits. However, effective tax rates (FY6/13: 8.1%) are typically lower than the corporate tax rates in these countries. This is because SAL enjoys tax incentives for various business units in Malaysia and Thailand. Tax exemptions in Malaysia are typically for five years, but have historically been extended upon expiry. Privileged status for its unit in Thailand will expire at end-2017.
Staff, 73.0 , 39%
Software amortisation,
7.2 , 4%
Overheads, 7.2 , 4%
Software subscription,
83.6 , 44%
Hardware, 4.2 , 2%
Others, 13.0 , 7%
85.4 91.0 100.3
77.8
131.0 87.7
0
50
100
150
200
250
FY11 FY12 FY13
Variable Fixed
(MYR m)

June 20, 2014 10
Silverlake Axis
Figure 19: Key earnings drivers FYE 30 Jun FY12 FY13 FY14E FY15E FY16E FY17E (MYR m) Revenue 400 399 487 599 634 702
Software licencing 63 120 137 145 155 166 Software project services 139 77 70 150 130 139 Maintenance and enhancement services 147 174 210 249 291 336 Sale of software and hardware products 33 7 35 15 16 17 Credit card processing 17 17 16 18 19 20 Insurance processing 0 5 19 22 23 24
Revenue change (absolute) 95 (1) 88 112 35 68
Software licencing 12 56 17 8 10 11 Software project services 41 (62) (7) 80 (20) 9 Maintenance and enhancement services 16 26 36 39 42 45 Sale of software and hardware products 25 (27) 28 (20) 1 1 Credit card processing 1 (1) (1) 2 1 1 Insurance processing 0 5 14 3 1 1
Revenue change (%) 31 (0) 22 23 6 11
Software licencing 23 89 15 6 7 7 Software project services 41 (44) (10) 114 7 7 Maintenance and enhancement services 12 18 21 19 17 15 Sale of software and hardware products 316 (80) 428 (57) 5 5 Credit card processing 4 (3) (4) 13 5 5 Insurance processing 0 0 305 16 5 5
EBITDA 189 219 268 329 358 399
Software licencing 60 113 129 138 147 158 Software project services 58 21 20 45 39 42 Maintenance and enhancement services 89 103 126 150 175 202 Sale of software and hardware products 3 2 4 3 4 4 Credit card processing 5 5 5 6 6 6 Insurance processing 0 4 16 18 19 20 Corporate overheads (26) (30) (30) (31) (31) (32)
Blended EBITDA margin (%) 47 55 55 55 57 57
Software licencing 94 95 94 95 95 95 Software project services 41 28 28 30 30 30 Maintenance and enhancement services 61 59 60 60 60 60 Sale of software and hardware products 9 35 10 23 23 23 Credit card processing 28 31 31 31 31 31 Insurance processing 0 82 82 82 82 82
EBITDA growth (%) 21.6 16.1 22.5 22.6 8.9 11.3
Depreciation & amortisation (11) (9) (14) (12) (10) (9)
EBIT 178 210 254 317 348 390 Net interest income/(expense) 0 0 1 8 11 11 Results of associates & JVs 1 2 7 7 7 8
Pre-tax profit 180 213 262 332 366 409 Taxation (18) (17) (22) (28) (30) (34) Minority interest 0 (0) 0 0 0 0
Net income 162 196 240 304 336 375
Source: Maybank KE estimates
June 20, 2014 11
Silverlake Axis
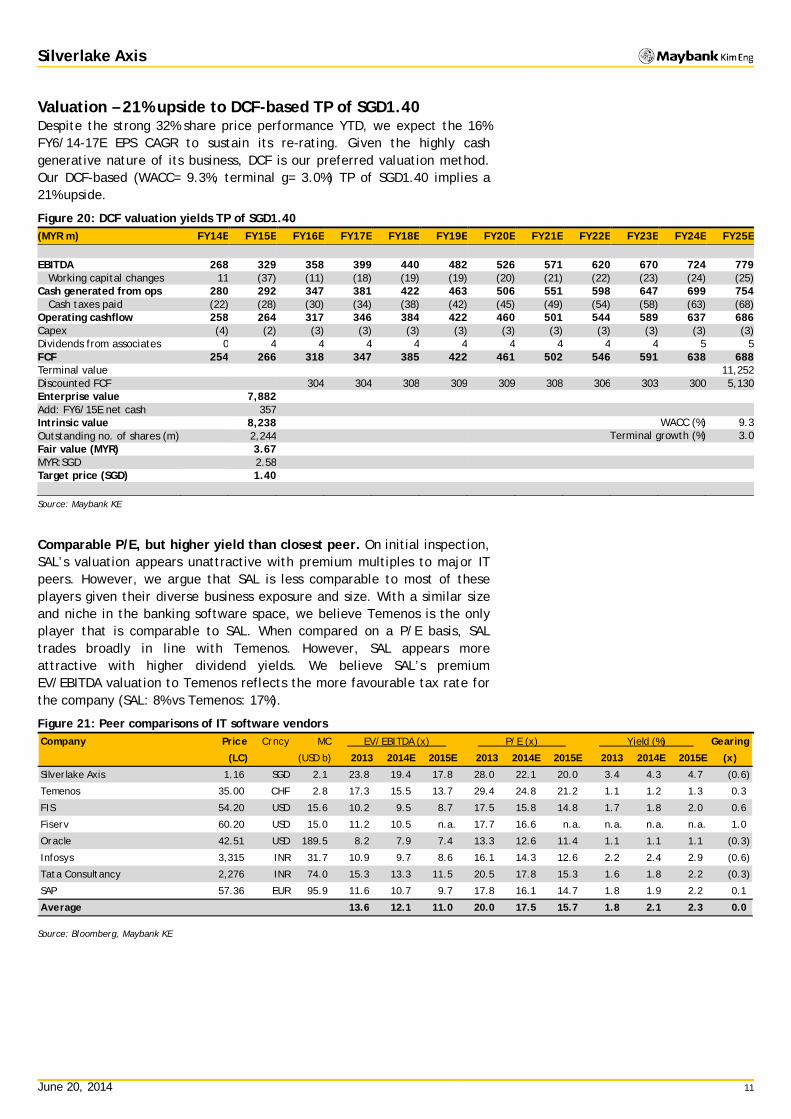
Valuation – 21% upside to DCF-based TP of SGD1.40 Despite the strong 32% share price performance YTD, we expect the 16% FY6/14-17E EPS CAGR to sustain its re-rating. Given the highly cash generative nature of its business, DCF is our preferred valuation method. Our DCF-based (WACC= 9.3%, terminal g= 3.0%) TP of SGD1.40 implies a 21% upside.
Figure 20: DCF valuation yields TP of SGD1.40 (MYR m) FY14E FY15E FY16E FY17E FY18E FY19E FY20E FY21E FY22E FY23E FY24E FY25E EBITDA 268 329 358 399 440 482 526 571 620 670 724 779
Working capital changes 11 (37) (11) (18) (19) (19) (20) (21) (22) (23) (24) (25) Cash generated from ops 280 292 347 381 422 463 506 551 598 647 699 754
Cash taxes paid (22) (28) (30) (34) (38) (42) (45) (49) (54) (58) (63) (68) Operating cashflow 258 264 317 346 384 422 460 501 544 589 637 686 Capex (4) (2) (3) (3) (3) (3) (3) (3) (3) (3) (3) (3) Dividends from associates 0 4 4 4 4 4 4 4 4 4 5 5 FCF 254 266 318 347 385 422 461 502 546 591 638 688 Terminal value 11,252 Discounted FCF 304 304 308 309 309 308 306 303 300 5,130 Enterprise value 7,882 Add: FY6/15E net cash 357 Intrinsic value 8,238 WACC (%) 9.3 Outstanding no. of shares (m) 2,244 Terminal growth (%) 3.0 Fair value (MYR) 3.67 MYR:SGD 2.58 Target price (SGD) 1.40
Source: Maybank KE
Comparable P/E, but higher yield than closest peer. On initial inspection, SAL’s valuation appears unattractive with premium multiples to major IT peers. However, we argue that SAL is less comparable to most of these players given their diverse business exposure and size. With a similar size and niche in the banking software space, we believe Temenos is the only player that is comparable to SAL. When compared on a P/E basis, SAL trades broadly in line with Temenos. However, SAL appears more attractive with higher dividend yields. We believe SAL’s premium EV/EBITDA valuation to Temenos reflects the more favourable tax rate for the company (SAL: 8% vs Temenos: 17%).
Figure 21: Peer comparisons of IT software vendors
Source: Bloomberg, Maybank KE
Company Price Crncy MC EV/EBITDA (x) P/E (x) Yield (%)
(LC) (USD b) 2013 2014E 2015E 2013 2014E 2015E 2013 2014E 2015E
Silverlake Axis 1.16 SGD 2.1 23.8 19.4 17.8 28.0 22.1 20.0 3.4 4.3 4.7 (0.6)
Temenos 35.00 CHF 2.8 17.3 15.5 13.7 29.4 24.8 21.2 1.1 1.2 1.3 0.3
FIS 54.20 USD 15.6 10.2 9.5 8.7 17.5 15.8 14.8 1.7 1.8 2.0 0.6
Fiserv 60.20 USD 15.0 11.2 10.5 n.a. 17.7 16.6 n.a. n.a. n.a. n.a. 1.0
Oracle 42.51 USD 189.5 8.2 7.9 7.4 13.3 12.6 11.4 1.1 1.1 1.1 (0.3)
Infosys 3,315 INR 31.7 10.9 9.7 8.6 16.1 14.3 12.6 2.2 2.4 2.9 (0.6)
Tata Consultancy 2,276 INR 74.0 15.3 13.3 11.5 20.5 17.8 15.3 1.6 1.8 2.2 (0.3)
SAP 57.36 EUR 95.9 11.6 10.7 9.7 17.8 16.1 14.7 1.8 1.9 2.2 0.1
Average 13.6 12.1 11.0 20.0 17.5 15.7 1.8 2.1 2.3 0.0
Gearing
(x)

June 20, 2014 12
Silverlake Axis
Figure 22: Current and TP implied valuations
Source: Maybank KE
Historical perspective – continued re-rating on supportive earnings and yield. SAL currently trades at the upper end of its historical trading band. We believe the continued re-rating is well supported by strong earnings delivery in recent years. Net income almost quadrupled over the past four years (FY6/10: MYR63.5m vs FY6/14E: MYR240.3m). Furthermore, the strong cash generative ability of the business has allowed SAL to raise its dividend payout, increasing its appeal as a yield stock.
Figure 23: Rising earnings to support stock re-rating Forward P/E band
Source: Bloomberg, Maybank KE
Figure 24: Forward P/E trend
Source: Bloomberg, Maybank KE
FY14E FY15E FY16E FY17E
At current price 1.16
P/E (x) 28.0 22.1 20.0 17.9
EV/EBITDA (x) 23.8 19.4 17.8 16.0
Dividend yield (%) 3.4 4.3 4.7 5.3
At target price 1.40
P/E (x) 33.7 26.6 24.2 21.6
EV/EBITDA (x) 28.9 23.6 21.6 19.4
Dividend yield (%) 2.8 3.6 3.9 4.4
Key financials
FY6/14E-17E EPS CAGR 16.0
Current market cap. (SGD b) 2.6
TP SGD1.40
0.20
0.40
0.60
0.80
1.00
1.20
1.40
1.60
Jun-10
Jun-11
Jun-12
Jun-13
Jun-14
Jun-15
Jun-16
(SGD) 25x
15x
20x
10x
5
10
15
20
25
Jun-10
Jun-11
Jun-12
Jun-13
Jun-14
Jun-15
(x)
+1SD = 17.2x
Mean = 13.8x
-1SD = 10.5x
June 20, 2014 13
Silverlake Axis
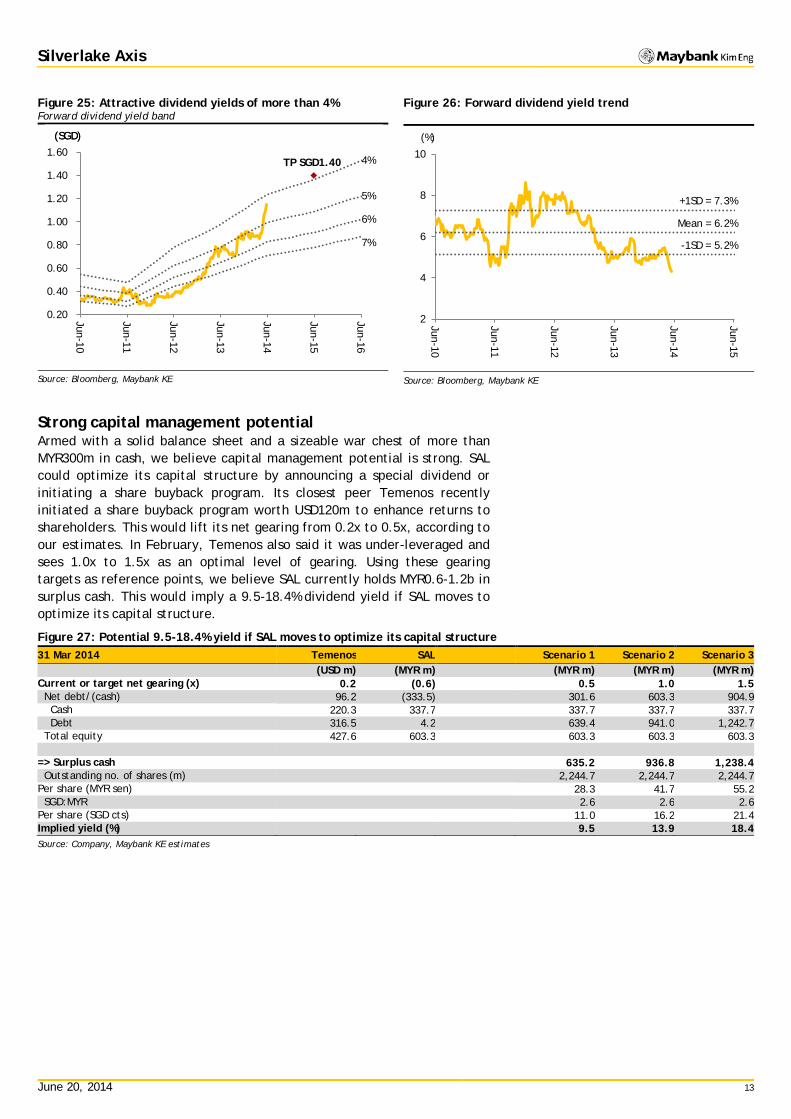
Figure 25: Attractive dividend yields of more than 4% Forward dividend yield band
Source: Bloomberg, Maybank KE
Figure 26: Forward dividend yield trend
Source: Bloomberg, Maybank KE
Strong capital management potential Armed with a solid balance sheet and a sizeable war chest of more than MYR300m in cash, we believe capital management potential is strong. SAL could optimize its capital structure by announcing a special dividend or initiating a share buyback program. Its closest peer Temenos recently initiated a share buyback program worth USD120m to enhance returns to shareholders. This would lift its net gearing from 0.2x to 0.5x, according to our estimates. In February, Temenos also said it was under-leveraged and sees 1.0x to 1.5x as an optimal level of gearing. Using these gearing targets as reference points, we believe SAL currently holds MYR0.6-1.2b in surplus cash. This would imply a 9.5-18.4% dividend yield if SAL moves to optimize its capital structure.
Figure 27: Potential 9.5-18.4% yield if SAL moves to optimize its capital structure 31 Mar 2014 Temenos SAL Scenario 1 Scenario 2 Scenario 3 (USD m) (MYR m) (MYR m) (MYR m) (MYR m) Current or target net gearing (x) 0.2 (0.6) 0.5 1.0 1.5 Net debt/(cash) 96.2 (333.5) 301.6 603.3 904.9 Cash 220.3 337.7 337.7 337.7 337.7 Debt 316.5 4.2 639.4 941.0 1,242.7 Total equity 427.6 603.3 603.3 603.3 603.3 => Surplus cash 635.2 936.8 1,238.4 Outstanding no. of shares (m) 2,244.7 2,244.7 2,244.7 Per share (MYR sen) 28.3 41.7 55.2 SGD:MYR 2.6 2.6 2.6 Per share (SGD cts) 11.0 16.2 21.4 Implied yield (%) 9.5 13.9 18.4
Source: Company, Maybank KE estimates
TP SGD1.40
0.20
0.40
0.60
0.80
1.00
1.20
1.40
1.60
Jun-10
Jun-11
Jun-12
Jun-13
Jun-14
Jun-15
Jun-16
(SGD)
4%
6%
5%
7%
(SGD)
2
4
6
8
10
Jun-10
Jun-11
Jun-12
Jun-13
Jun-14
Jun-15
(%)
+1SD = 7.3%
Mean = 6.2%
-1SD = 5.2%

June 20, 2014 14
Silverlake Axis
Catalysts Acquisitions by existing customers. Banks would need to integrate
their IT systems after mergers and acquisitions. For example, SAL’s post-merger integration projects for Thanachart-Siam City Bank (acquired in Oct 2011) and Hong Leong-EON Bank (acquired in May 2011) led to record levels of project revenue in FY6/12. Hence, we believe potential acquisitions by its customers will be a key earnings driver. Within SAL’s existing clientele, OCBC’s impending acquisition of Wing Hang bank could drive demand for post-merger integration work.
New customers. Given the sticky nature of its business, the chance of losing a customer is fairly low. However, we think it is just as challenging to win over new ones. Looking at developments across its major competitors, we note that Infosys (SELL, TP INR2,773), a key core banking service provider, is currently facing internal headwinds as highlighted by our analyst Urmil Shah (note). Triggered by the recent departures of its president and board member, B G Srinivas, Urmil sees potential for significant senior management turnover at Infosys. Given the importance of core banking system to a bank, we believe a potential escalation of internal issues at Infosys could prompt its existing customers to look elsewhere for other service providers. DBS currently runs on Finacle, the core banking product from Infosys, and the spectre of escalation of issues at Infosys could present an opportunity for SAL to win over a major client. The other two major Singapore banks, UOB and OCBC, are existing customers of SAL.
Risks Key management departure. We think the risk is low as majority of the
senior management personnel has been with the group for many years. In particular, Dr. Kwong Yong Sin (Managing Director) has been with the company for more than 10 years. The group’s Executive Chairman, Mr Goh Peng Ooi, is the founder and majority shareholder of the group.
Loss of customers. Mergers and acquisitions present opportunities, but also threats. While SAL could win integration work when existing clients make acquisitions, it could also lose clients when they are acquired as they migrate to a competing platform.
Curb in IT spending by banks. Banks could scale back part of their discretionary IT spending during an economic slowdown. As a case in point, SAL’s sales declined by more than 60% in FY6/09 when banks deferred IT spending during the global financial crisis. However, it is interesting to note that even with the sharp fall in sales, SAL managed to stay profitable during that year. We believe its current exposure to discretionary IT spending is further mitigated by a larger recurring base it now has.
Removal of tax incentives. SAL enjoys a relatively low tax rate of 8% as it benefits from various tax incentive schemes in Malaysia and Thailand. Hence, we expect non-renewal of these schemes to have a material impact to its profitability. However, we think this risk is low as history suggests that these tax incentives are typically extended upon expiry.
June 20, 2014 15
Silverlake Axis
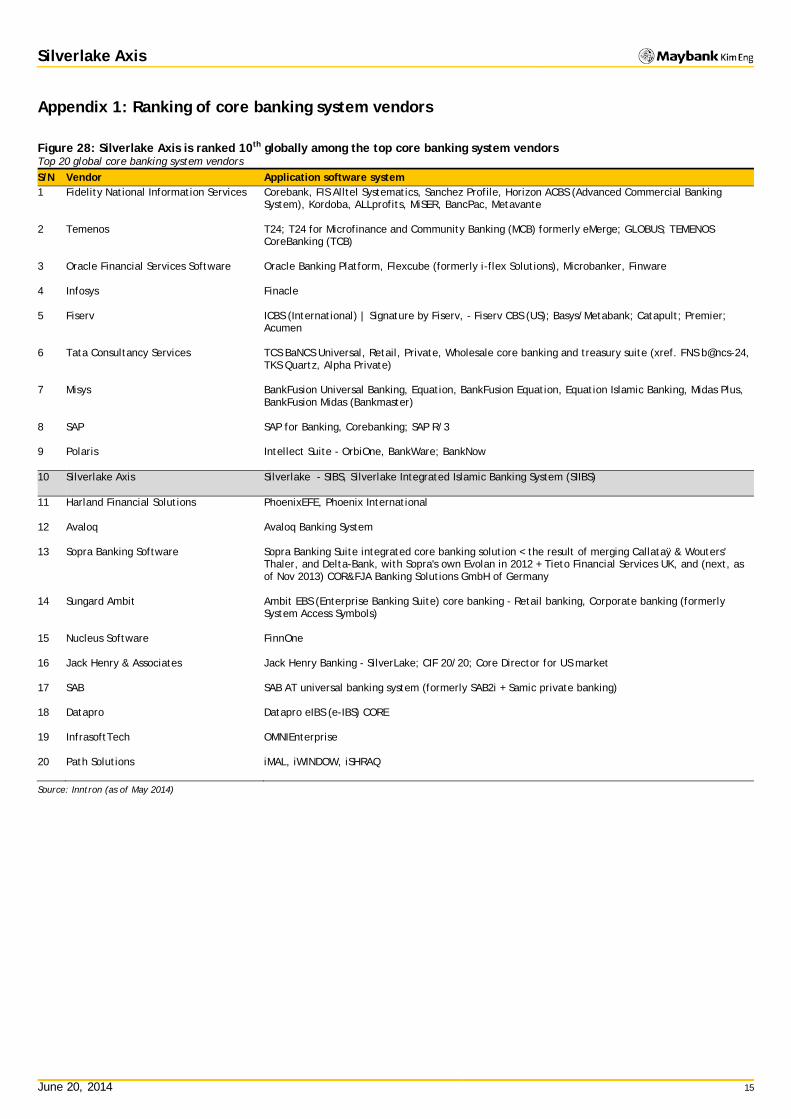
Appendix 1: Ranking of core banking system vendors
Figure 28: Silverlake Axis is ranked 10th globally among the top core banking system vendors Top 20 global core banking system vendors S/N Vendor Application software system 1 Fidelity National Information Services Corebank, FIS Alltel Systematics, Sanchez Profile, Horizon ACBS (Advanced Commercial Banking
System), Kordoba, ALLprofits, MiSER, BancPac, Metavante
2 Temenos T24; T24 for Microfinance and Community Banking (MCB) formerly eMerge; GLOBUS; TEMENOS CoreBanking (TCB)
3 Oracle Financial Services Software Oracle Banking Platform, Flexcube (formerly i-flex Solutions), Microbanker, Finware
4 Infosys Finacle
5 Fiserv ICBS (International) | Signature by Fiserv, - Fiserv CBS (US); Basys/Metabank; Catapult; Premier; Acumen
6 Tata Consultancy Services TCS BaNCS Universal, Retail, Private, Wholesale core banking and treasury suite (xref. FNS b@ncs-24, TKS Quartz, Alpha Private)
7 Misys BankFusion Universal Banking, Equation, BankFusion Equation, Equation Islamic Banking, Midas Plus, BankFusion Midas (Bankmaster)
8 SAP SAP for Banking, Corebanking; SAP R/3
9 Polaris Intellect Suite - OrbiOne, BankWare; BankNow
10 Silverlake Axis Silverlake - SIBS, Silverlake Integrated Islamic Banking System (SIIBS)
11 Harland Financial Solutions PhoenixEFE, Phoenix International
12 Avaloq Avaloq Banking System
13 Sopra Banking Software Sopra Banking Suite integrated core banking solution < the result of merging Callataÿ & Wouters' Thaler, and Delta-Bank, with Sopra's own Evolan in 2012 + Tieto Financial Services UK, and (next, as of Nov 2013) COR&FJA Banking Solutions GmbH of Germany
14 Sungard Ambit Ambit EBS (Enterprise Banking Suite) core banking - Retail banking, Corporate banking (formerly System Access Symbols)
15 Nucleus Software FinnOne
16 Jack Henry & Associates Jack Henry Banking - SilverLake; CIF 20/20; Core Director for US market
17 SAB SAB AT universal banking system (formerly SAB2i + Samic private banking)
18 Datapro Datapro eIBS (e-IBS) CORE
19 InfrasoftTech OMNIEnterprise
20 Path Solutions iMAL, iWINDOW, iSHRAQ
Source: Inntron (as of May 2014)
June 20, 2014 16
Silverlake Axis
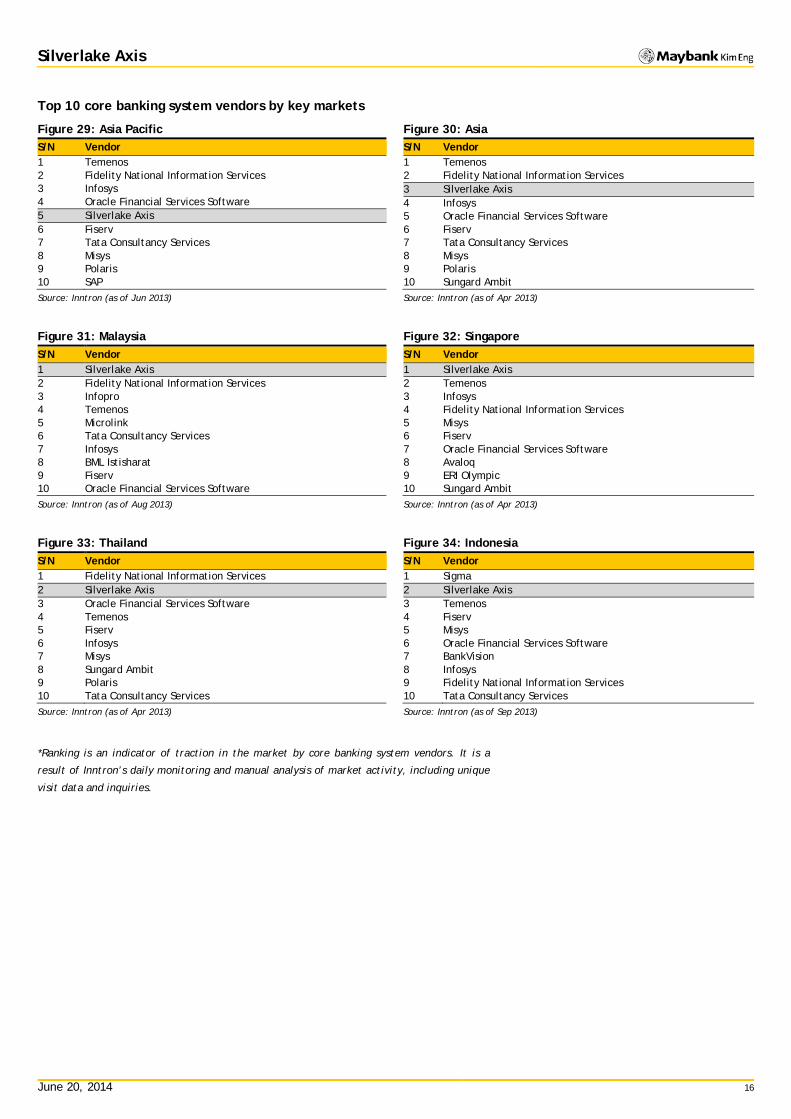
Top 10 core banking system vendors by key markets
Figure 29: Asia Pacific S/N Vendor 1 Temenos 2 Fidelity National Information Services 3 Infosys 4 Oracle Financial Services Software 5 Silverlake Axis 6 Fiserv 7 Tata Consultancy Services 8 Misys 9 Polaris 10 SAP
Source: Inntron (as of Jun 2013)
Figure 30: Asia S/N Vendor 1 Temenos 2 Fidelity National Information Services 3 Silverlake Axis 4 Infosys 5 Oracle Financial Services Software 6 Fiserv 7 Tata Consultancy Services 8 Misys 9 Polaris 10 Sungard Ambit
Source: Inntron (as of Apr 2013)
Figure 31: Malaysia S/N Vendor 1 Silverlake Axis 2 Fidelity National Information Services 3 Infopro 4 Temenos 5 Microlink 6 Tata Consultancy Services 7 Infosys 8 BML Istisharat 9 Fiserv 10 Oracle Financial Services Software
Source: Inntron (as of Aug 2013)
Figure 32: Singapore S/N Vendor 1 Silverlake Axis 2 Temenos 3 Infosys 4 Fidelity National Information Services 5 Misys 6 Fiserv 7 Oracle Financial Services Software 8 Avaloq 9 ERI Olympic 10 Sungard Ambit
Source: Inntron (as of Apr 2013)
Figure 33: Thailand S/N Vendor 1 Fidelity National Information Services 2 Silverlake Axis 3 Oracle Financial Services Software 4 Temenos 5 Fiserv 6 Infosys 7 Misys 8 Sungard Ambit 9 Polaris 10 Tata Consultancy Services
Source: Inntron (as of Apr 2013)
Figure 34: Indonesia S/N Vendor 1 Sigma 2 Silverlake Axis 3 Temenos 4 Fiserv 5 Misys 6 Oracle Financial Services Software 7 BankVision 8 Infosys 9 Fidelity National Information Services 10 Tata Consultancy Services
Source: Inntron (as of Sep 2013)
*Ranking is an indicator of traction in the market by core banking system vendors. It is a
result of Inntron’s daily monitoring and manual analysis of market activity, including unique
visit data and inquiries.

June 20, 2014 17
Silverlake Axis
Appendix 2: Key customers
Figure 35: Key customers in the region Malaysia Singapore Thailand Indonesia Maybank Maybank CIMB Maybank CIMB CIMB Islamic Bank of Thailand (IBT) CIMB Group UOB UOB Siam Life UOB OCBC OCBC Thanachart Bank OCBC Hong Leong Bank Group (Regional) Siam City Bank (merged with Thanachart) Bank Mandiri Indonesia EON Bank (merged with Hong Leong) Bank Rakyat Indonesia Affin Bank Bank ICB Bumiputera Agrobank Bank Syariah Mega Indonesia Alliance Bank Tabungan Negara (BTN) Bank Islam Malaysia (BIMB) Malaysia Building Society Bhd
Source: Inntron

June 20, 2014 18
Silverlake Axis
Appendix 3: Corporate history SAL was initially listed on the Singapore Exchange as Axis Systems Ltd in 2003. During the initial years of its listing, the group focused mainly on banking software for branch delivery systems. The group reached a major milestone in 2006 when the group chairman Mr. Goh Peng Ooi injected the flagship core banking product, Silverlake Axis Integrated Banking Systems, into the listed entity. Subsequently, the group acquired another two entities (Silverlake Solutions and QR Technology) from the chairman in 2010, which expanded its product offerings to include maintenance services and retail solutions. Over the past three years, the group acquired other businesses to increase its portfolio of products. These businesses include Isis International (2011, Enterprise Payment and Integration Platform), Merimen Group (2013, Insurance Claims and Policies Processing) and Cyber Village (2013, Mobile and Internet Solutions).
Figure 36: Evolution of the business
Source: Company
Figure 37: Core banking software product
Source: Company

June 20, 2014 19
Silverlake Axis
Figure 38: Rising sales and profits through history of acquisitions
Source: Company, Maybank KE
50
100
150
200
250
300
350
400
450
500
100
200
300
400
500
600
700
800
900
FY09 FY10 FY11 FY12 FY13 FY14E FY15E FY16E FY17E
Sales Net income (RHS)(MYR m) (MYR m)
Oct 2009: Remaining 75% of Silverlake JapanMar 2011: 100% of Isis International
Mar 2013: 80% of Merimen GroupMay 2013: 100% of Cyber Village

June 20, 2014 20
Silverlake Axis
Appendix 4: Directors and key management profile
Figure 39: Directors and key management profile Name Designation Year of appointment Experience Board of directors Goh Peng Ooi Group Executive
Chairman 2006 - Non-Executive Chairman since 2002.
- Founder of Silverlake Group in 1989. - Previously with IBM Malaysia.
Dr. Kwong Yong Sin Group Managing Director 2004 - Managing Director of Silverlake Corporation from 2001 to 2005. - Previously Partner and Senior Vice President of Ernst & Young and Cap Gemini E&Y Consulting.
Ong Kian Min Independent Non-Executive Director
2003 - Currently a consultant with Drew & Napier LLC and Senior Adviser with Alpha Advisory Pte Ltd.
Y Bhg. Tan Sri Dato' Dr. Lin See-Yan Independent Non-Executive Director
2003 - Currently an independent strategic and financial consultant. - Previously Chairman and CEO of Pacific Bank Group, Deputy Governor of Bank Negara Malaysia.
Lim Kok Min Independent Non-Executive Director
2006 - Currently Chairman of Gas Supply Pte Ltd. - Previously Chairman of the Singapore Institute of Directors, Building & Construction Authority and Senoko Power Ltd.
Y Bhg. Datuk Sulaiman bin Daud Non-Executive Director 2003 - Previously Director and Chairman of AGRO Bank (formerly known as Agricultural Bank of Malaysia).
Key management Lau Siow Ling Senior EVP, Structured
Service Management and Operations
2010 - More than 27 years of experience in the IT industry. - Joined Silverlake in 2001. - Previously with IBM Malaysia.
Wong Yok Koon Senior EVP, SIBS Core and Integration Product Development & Solutions
2006 - More than 20 years of experience in the banking software industry. - Previously with Silverlake System Sdn Bhd.
Yau Siew Moi Senior EVP, SIBS Core and Integration Product Development & Solutions
2006 - More than 22 years of experience in the banking software industry. - Previously with Silverlake System Sdn Bhd.
Sanjeev Dhar Senior EVP, Digital Economy and Payment Solutions
2011 - SVP at Isis since 1996.
Trevor Lok Theng Hey CEO of Merimen Group 2002 - Joined Merimen Group in 2002.
Andrew Ooi Su Jin CTO of Merimen Group 2000 - Joined Merimen Group in 2000.
Hoong Lai Ling Senior EVP, Adminstration and Finance
2002 - Joined the group in 2002. - Previously with PricewaterhouseCoopers Malaysia.
Hidetoshi Neda Managing Director of Silverlake Japan
2009 - More than 22 years of experience in the Credit Card and Retail Banking industries.
Lee Cheen Siong EVP, SIBS Channel Product Development & Solutions
2000 - More than 18 years of experience in the banking software industry.
Source: Company
June 20, 2014 21
Silverlake Axis
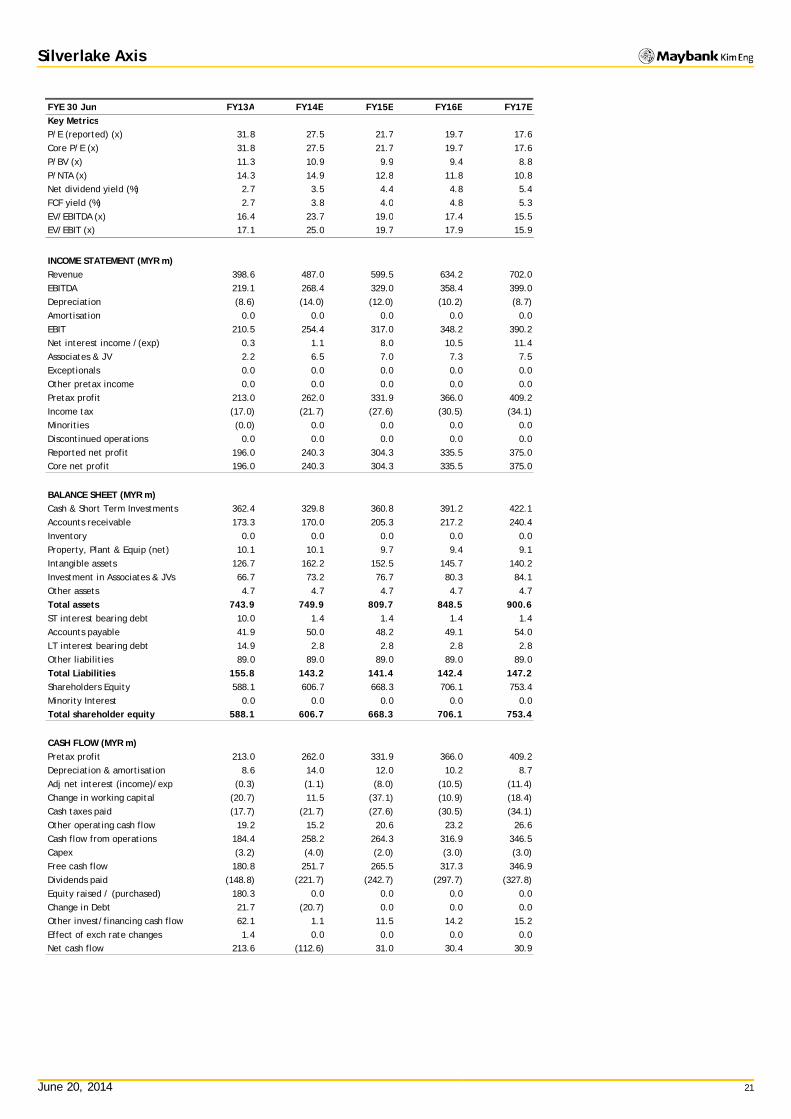
INCOME STATEMENT (MYR m)Revenue 398.6 487.0 599.5 634.2 702.0EBITDA 219.1 268.4 329.0 358.4 399.0Depreciation (8.6) (14.0) (12.0) (10.2) (8.7)Amortisation 0.0 0.0 0.0 0.0 0.0EBIT 210.5 254.4 317.0 348.2 390.2Net interest income /(exp) 0.3 1.1 8.0 10.5 11.4Associates & JV 2.2 6.5 7.0 7.3 7.5Exceptionals 0.0 0.0 0.0 0.0 0.0Other pretax income 0.0 0.0 0.0 0.0 0.0Pretax profit 213.0 262.0 331.9 366.0 409.2Income tax (17.0) (21.7) (27.6) (30.5) (34.1)Minorities (0.0) 0.0 0.0 0.0 0.0Discontinued operations 0.0 0.0 0.0 0.0 0.0Reported net profit 196.0 240.3 304.3 335.5 375.0Core net profit 196.0 240.3 304.3 335.5 375.0
BALANCE SHEET (MYR m)Cash & Short Term Investments 362.4 329.8 360.8 391.2 422.1Accounts receivable 173.3 170.0 205.3 217.2 240.4Inventory 0.0 0.0 0.0 0.0 0.0Property, Plant & Equip (net) 10.1 10.1 9.7 9.4 9.1Intangible assets 126.7 162.2 152.5 145.7 140.2Investment in Associates & JVs 66.7 73.2 76.7 80.3 84.1Other assets 4.7 4.7 4.7 4.7 4.7Total assets 743.9 749.9 809.7 848.5 900.6ST interest bearing debt 10.0 1.4 1.4 1.4 1.4Accounts payable 41.9 50.0 48.2 49.1 54.0LT interest bearing debt 14.9 2.8 2.8 2.8 2.8Other liabilities 89.0 89.0 89.0 89.0 89.0Total Liabilities 155.8 143.2 141.4 142.4 147.2Shareholders Equity 588.1 606.7 668.3 706.1 753.4Minority Interest 0.0 0.0 0.0 0.0 0.0Total shareholder equity 588.1 606.7 668.3 706.1 753.4
CASH FLOW (MYR m)Pretax profit 213.0 262.0 331.9 366.0 409.2Depreciation & amortisation 8.6 14.0 12.0 10.2 8.7Adj net interest (income)/exp (0.3) (1.1) (8.0) (10.5) (11.4)Change in working capital (20.7) 11.5 (37.1) (10.9) (18.4)Cash taxes paid (17.7) (21.7) (27.6) (30.5) (34.1)Other operating cash flow 19.2 15.2 20.6 23.2 26.6Cash flow from operations 184.4 258.2 264.3 316.9 346.5Capex (3.2) (4.0) (2.0) (3.0) (3.0)Free cash flow 180.8 251.7 265.5 317.3 346.9Dividends paid (148.8) (221.7) (242.7) (297.7) (327.8)Equity raised / (purchased) 180.3 0.0 0.0 0.0 0.0Change in Debt 21.7 (20.7) 0.0 0.0 0.0Other invest/financing cash flow 62.1 1.1 11.5 14.2 15.2Effect of exch rate changes 1.4 0.0 0.0 0.0 0.0Net cash flow 213.6 (112.6) 31.0 30.4 30.9
FYE 30 Jun FY13A FY14E FY15E FY16E FY17E Key Metrics P/E (reported) (x) 31.8 27.5 21.7 19.7 17.6 Core P/E (x) 31.8 27.5 21.7 19.7 17.6 P/BV (x) 11.3 10.9 9.9 9.4 8.8 P/NTA (x) 14.3 14.9 12.8 11.8 10.8 Net dividend yield (%) 2.7 3.5 4.4 4.8 5.4 FCF yield (%) 2.7 3.8 4.0 4.8 5.3 EV/EBITDA (x) 16.4 23.7 19.0 17.4 15.5 EV/EBIT (x) 17.1 25.0 19.7 17.9 15.9

June 20, 2014 22
Silverlake Axis
Profitability ratios (%)EBITDA margin 55.0 55.1 54.9 56.5 56.8EBIT margin 52.8 52.2 52.9 54.9 55.6Pretax profit margin 53.4 53.8 55.4 57.7 58.3Payout ratio 86.0 95.0 95.0 95.0 95.0
DuPont analysisNet profit margin (%) 49.2 49.3 50.8 52.9 53.4Revenue/Assets (x) 0.5 0.6 0.7 0.7 0.8Assets/Equity (x) 1.3 1.2 1.2 1.2 1.2ROAE (%) 44.3 40.2 47.7 48.8 51.4ROAA (%) 34.3 32.2 39.0 40.5 42.9
Liquidity & EfficiencyCash conversion cycle nm nm nm nm nmDays receivable outstanding 147.1 126.9 112.7 119.9 117.3Days inventory outstanding nm nm nm nm nmDays payables outstanding nm nm nm nm nmDividend cover (x) 1.2 1.1 1.1 1.1 1.1Current ratio (x) 5.2 4.9 5.6 6.0 6.2
Leverage & Expense AnalysisAsset/Liability (x) 4.8 5.2 5.7 6.0 6.1Net debt/equity (%) net cash net cash net cash net cash net cashNet interest cover (x) na na na na naDebt/EBITDA (x) 0.1 0.0 0.0 0.0 0.0Capex/revenue (%) 0.8 0.8 0.3 0.5 0.4Net debt/ (net cash) (337.5) (325.6) (356.6) (387.0) (417.9)
FYE 30 Jun FY13A FY14E FY15E FY16E FY17E Key Ratios Growth ratios (%) Revenue growth (0.4) 22.2 23.1 5.8 10.7 EBITDA growth 16.1 22.5 22.6 8.9 11.3 EBIT growth 18.2 20.9 24.6 9.9 12.1 Pretax growth 18.4 23.0 26.7 10.3 11.8 Reported net profit growth 20.8 22.6 26.6 10.3 11.8 Core net profit growth 20.8 22.6 26.6 10.3 11.8

June 20, 2014 23
Silverlake Axis
Research Offices
REGIONAL
WONG Chew Hann, CA Regional Head of Institutional Research (603) 2297 8686 [email protected]
ONG Seng Yeow Regional Head of Retail Research (65) 6432 1453 [email protected]
Alexander GARTHOFF Institutional Product Manager (852) 2268 0638 [email protected]
ECONOMICS
Suhaimi ILIAS Chief Economist Singapore | Malaysia (603) 2297 8682 [email protected]
Luz LORENZO Philippines (63) 2 849 8836 [email protected]
Tim LEELAHAPHAN Thailand (662) 658 1420 [email protected]
JUNIMAN Chief Economist, BII Indonesia (62) 21 29228888 ext 29682 [email protected]
Josua PARDEDE Economist / Industry Analyst, BII Indonesia (62) 21 29228888 ext 29695 [email protected]
MALAYSIA
WONG Chew Hann, CA Head of Research (603) 2297 8686 [email protected] • Strategy • Construction & Infrastructure
Desmond CH’NG, ACA (603) 2297 8680 [email protected] • Banking & Finance
LIAW Thong Jung (603) 2297 8688 [email protected] • Oil & Gas - Regional • Shipping
ONG Chee Ting, CA (603) 2297 8678 [email protected] • Plantations - Regional
Mohshin AZIZ (603) 2297 8692 [email protected] • Aviation - Regional • Petrochem
YIN Shao Yang, CPA (603) 2297 8916 [email protected] • Gaming – Regional • Media
TAN Chi Wei, CFA (603) 2297 8690 [email protected] • Power • Telcos
WONG Wei Sum, CFA (603) 2297 8679 [email protected] • Property & REITs
LEE Yen Ling (603) 2297 8691 [email protected] • Building Materials • Glove Producers
CHAI Li Shin (603) 2297 8684 [email protected] • Plantation • Construction & Infrastructure
KANG Chun Ee (603) 2297 8675 [email protected] • Consumer
Ivan YAP (603) 2297 8612 [email protected] • Automotive
LEE Cheng Hooi Regional Chartist (603) 2297 8694 [email protected]
Tee Sze Chiah Head of Retail Research (603) 2297 6858 [email protected]
HONG KONG / CHINA
Howard WONG Head of Research (852) 2268 0648 [email protected] • Oil & Gas - Regional
Alexander LATZER (852) 2268 0647 [email protected] • Metals & Mining - Regional
Jacqueline KO, CFA (852) 2268 0633 [email protected] • Consumer
Karen KWAN (852) 2268 0640 [email protected] • Property & REITs
Osbert TK TANG, CFA (86) 21 5096 8370 [email protected] • Transport & Industrials
Ricky WK NG, CFA (852) 2268 0689 [email protected] • Utilities & Renewable Energy
Simon QIAN, CFA (852) 2268 0634 [email protected] • Telecom & Internet
Steven ST CHAN (852) 2268 0645 [email protected] • Banking & Financials - Regional
Warren LAU (852) 2268 0644 [email protected] • Technology – Regional
William YANG (852) 2268 0675 [email protected] • Technology – Regional
INDIA
Jigar SHAH Head of Research (91) 22 6623 2601 [email protected] • Oil & Gas • Automobile • Cement
Anubhav GUPTA (91) 22 6623 2605 [email protected] • Metal & Mining • Capital Goods • Property
Urmil SHAH (91) 22 6623 2606 [email protected] • Technology • Media
SINGAPORE
NG Wee Siang Head of Research (65) 6432 1467 [email protected] • Banking & Finance
Gregory YAP (65) 6432 1450 [email protected] • SMID Caps – Regional • Technology & Manufacturing • Telcos
Wilson LIEW (65) 6432 1454 [email protected] • Property Developers
ONG Kian Lin (65) 6432 1470 [email protected] • S-REITs
James KOH (65) 6432 1431 [email protected] • Consumer - Regional
YEAK Chee Keong, CFA (65) 6432 1460 [email protected] • Offshore & Marine
Derrick HENG (65) 6432 1446 [email protected] • Transport (Land, Shipping & Aviation)
WEI Bin (65) 6432 1455 [email protected] • Commodity • Logistics • S-chips
John CHEONG (65) 6432 1461 [email protected] • Small & Mid Caps • Healthcare
TRUONG Thanh Hang (65) 6432 1451 [email protected] • Small & Mid Caps
INDONESIA
Wilianto IE Head of Research (62) 21 2557 1125 [email protected] • Strategy
Rahmi MARINA (62) 21 2557 1128 [email protected] • Banking & Finance
Aurellia SETIABUDI (62) 21 2953 0785 [email protected] • Property
Anthony YUNUS (62) 21 2557 1136 [email protected] • Consumer • Poultry
Isnaputra ISKANDAR (62) 21 2557 1129 [email protected] • Metals & Mining • Cement
Pandu ANUGRAH (62) 21 2557 1137 [email protected] • Infrastructure • Construction • Transport
Janni ASMAN (62) 21 2953 0784 [email protected] • Cigarette • Healthcare • Retail
PHILIPPINES
Luz LORENZO Head of Research (63) 2 849 8836 [email protected] • Strategy
Laura DY-LIACCO (63) 2 849 8840 [email protected] • Utilities • Conglomerates • Telcos
Lovell SARREAL (63) 2 849 8841 [email protected] • Consumer • Media • Cement
Rommel RODRIGO (63) 2 849 8839 [email protected] • Conglomerates • Property • Gaming • Ports/ Logistics
Katherine TAN (63) 2 849 8843 [email protected] • Banks • Construction
Ramon ADVIENTO (63) 2 849 8845 [email protected] • Mining
THAILAND
Maria LAPIZ Head of Institutional Research Dir (66) 2257 0250 | (66) 2658 6300 ext 1399 [email protected] • Consumer / Materials
Jesada TECHAHUSDIN, CFA (66) 2658 6300 ext 1394 [email protected] • Financial Services
Kittisorn PRUITIPAT, CFA, FRM (66) 2658 6300 ext 1395 [email protected] • Real Estate
Sittichai DUANGRATTANACHAYA (66) 2658 6300 ext 1393 [email protected] • Services Sector
Sukit UDOMSIRIKUL Head of Retail Research (66) 2658 6300 ext 5090 [email protected]
Mayuree CHOWVIKRAN (66) 2658 6300 ext 1440 [email protected] • Strategy
Padon VANNARAT (66) 2658 6300 ext 1450 [email protected] • Strategy
Surachai PRAMUALCHAROENKIT (66) 2658 6300 ext 1470 [email protected] • Auto • Conmat • Contractor • Steel
Suttatip PEERASUB (66) 2658 6300 ext 1430 [email protected] • Media • Commerce
Sutthichai KUMWORACHAI (66) 2658 6300 ext 1400 [email protected] • Energy • Petrochem
Termporn TANTIVIVAT (66) 2658 6300 ext 1520 [email protected] • Property
Woraphon WIROONSRI (66) 2658 6300 ext 1560 [email protected] • Banking & Finance
Jaroonpan WATTANAWONG (66) 2658 6300 ext 1404 [email protected] • Transportation • Small cap
Chatchai JINDARAT (66) 2658 6300 ext 1401 [email protected] • Electronics VIETNAM LE Hong Lien, ACCA Head of Institutional Research (84) 844 55 58 88 x 8181 [email protected] • Strategy • Consumer • Diversified • Utilities
THAI Quang Trung, CFA, Deputy Manager, Institutional Research (84) 844 55 58 88 x 8180 [email protected] • Real Estate • Construction • Materials
Le Nguyen Nhat Chuyen (84) 844 55 58 88 x 8082 [email protected] • Oil & Gas NGUYEN Thi Ngan Tuyen, Head of Retail Research (84) 8 44 555 888 x 8081 [email protected] • Food & Beverage • Oil&Gas • Banking
NGUYEN Trung Hoa, Dy Head of Retail Research (84) 8 44 555 888 x 8088 [email protected] • Macro • Steel • Real estate
TRINH Thi Ngoc Diep (84) 4 44 555 888 x 8208 [email protected] • Technology • Utilities • Construction
TRUONG Quang Binh (84) 4 44 555 888 x 8087 [email protected] • Rubber plantation • Tyres and Tubes • Oil&Gas
PHAM Nhat Bich (84) 8 44 555 888 x 8083 [email protected] • Consumer • Manufacturing • Fishery
NGUYEN Thi Sony Tra Mi (84) 8 44 555 888 x 8084 [email protected] • Port operation • Pharmaceutical • Food & Beverage

June 20, 2014 24
Silverlake Axis
APPENDIX I: TERMS FOR PROVISION OF REPORT, DISCLAIMERS AND DISCLOSURES
DISCLAIMERS
This research report is prepared for general circulation and for information purposes only and under no circumstances should it be considered or intended as an offer to sell or a solicitation of an offer to buy the securities referred to herein. Investors should note that values of such securities, if any, may fluctuate and that each security’s price or value may rise or fall. Opinions or recommendations contained herein are in form of technical ratings and fundamental ratings. Technical ratings may differ from fundamental ratings as technical valuations apply different methodologies and are purely based on price and volume-related information extracted from the relevant jurisdiction’s stock exchange in the equity analysis. Accordingly, investors’ returns may be less than the original sum invested. Past performance is not necessarily a guide to future performance. This report is not intended to provide personal investment advice and does not take into account the specific investment objectives, the financial situation and the particular needs of persons who may receive or read this report. Investors should therefore seek financial, legal and other advice regarding the appropriateness of investing in any securities or the investment strategies discussed or recommended in this report.
The information contained herein has been obtained from sources believed to be reliable but such sources have not been independently verified by Maybank Investment Bank Berhad, its subsidiary and affiliates (collectively, “MKE”) and consequently no representation is made as to the accuracy or completeness of this report by MKE and it should not be relied upon as such. Accordingly, MKE and its officers, directors, associates, connected parties and/or employees (collectively, “Representatives”) shall not be liable for any direct, indirect or consequential losses or damages that may arise from the use or reliance of this report. Any information, opinions or recommendations contained herein are subject to change at any time, without prior notice.
This report may contain forward looking statements which are often but not always identified by the use of words such as “anticipate”, “believe”, “estimate”, “intend”, “plan”, “expect”, “forecast”, “predict” and “project” and statements that an event or result “may”, “will”, “can”, “should”, “could” or “might” occur or be achieved and other similar expressions. Such forward looking statements are based on assumptions made and information currently available to us and are subject to certain risks and uncertainties that could cause the actual results to differ materially from those expressed in any forward looking statements. Readers are cautioned not to place undue relevance on these forward-looking statements. MKE expressly disclaims any obligation to update or revise any such forward looking statements to reflect new information, events or circumstances after the date of this publication or to reflect the occurrence of unanticipated events.
MKE and its officers, directors and employees, including persons involved in the preparation or issuance of this report, may, to the extent permitted by law, from time to time participate or invest in financing transactions with the issuer(s) of the securities mentioned in this report, perform services for or solicit business from such issuers, and/or have a position or holding, or other material interest, or effect transactions, in such securities or options thereon, or other investments related thereto. In addition, it may make markets in the securities mentioned in the material presented in this report. MKE may, to the extent permitted by law, act upon or use the information presented herein, or the research or analysis on which they are based, before the material is published. One or more directors, officers and/or employees of MKE may be a director of the issuers of the securities mentioned in this report.
This report is prepared for the use of MKE’s clients and may not be reproduced, altered in any way, transmitted to, copied or distributed to any other party in whole or in part in any form or manner without the prior express written consent of MKE and MKE and its Representatives accepts no liability whatsoever for the actions of third parties in this respect.
This report is not directed to or intended for distribution to or use by any person or entity who is a citizen or resident of or located in any locality, state, country or other jurisdiction where such distribution, publication, availability or use would be contrary to law or regulation. This report is for distribution only under such circumstances as may be permitted by applicable law. The securities described herein may not be eligible for sale in all jurisdictions or to certain categories of investors. Without prejudice to the foregoing, the reader is to note that additional disclaimers, warnings or qualifications may apply based on geographical location of the person or entity receiving this report.
Malaysia
Opinions or recommendations contained herein are in the form of technical ratings and fundamental ratings. Technical ratings may differ from fundamental ratings as technical valuations apply different methodologies and are purely based on price and volume-related information extracted from Bursa Malaysia Securities Berhad in the equity analysis.
Singapore
This report has been produced as of the date hereof and the information herein may be subject to change. Maybank Kim Eng Research Pte. Ltd. (“Maybank KERPL”) in Singapore has no obligation to update such information for any recipient. For distribution in Singapore, recipients of this report are to contact Maybank KERPL in Singapore in respect of any matters arising from, or in connection with, this report. If the recipient of this report is not an accredited investor, expert investor or institutional investor (as defined under Section 4A of the Singapore Securities and Futures Act), Maybank KERPL shall be legally liable for the contents of this report, with such liability being limited to the extent (if any) as permitted by law.
Thailand
The disclosure of the survey result of the Thai Institute of Directors Association (“IOD”) regarding corporate governance is made pursuant to the policy of the Office of the Securities and Exchange Commission. The survey of the IOD is based on the information of a company listed on the Stock Exchange of Thailand and the market for Alternative Investment disclosed to the public and able to be accessed by a general public investor. The result, therefore, is from the perspective of a third party. It is not an evaluation of operation and is not based on inside information. The survey result is as of the date appearing in the Corporate Governance Report of Thai Listed Companies. As a result, the survey may be changed after that date. Maybank Kim Eng Securities (Thailand) Public Company Limited (“MBKET”) does not confirm nor certify the accuracy of such survey result.
Except as specifically permitted, no part of this presentation may be reproduced or distributed in any manner without the prior written permission of MBKET. MBKET accepts no liability whatsoever for the actions of third parties in this respect.
US
This research report prepared by MKE is distributed in the United States (“US”) to Major US Institutional Investors (as defined in Rule 15a-6 under the Securities Exchange Act of 1934, as amended) only by Maybank Kim Eng Securities USA Inc (“Maybank KESUSA”), a broker-dealer registered in the US (registered under Section 15 of the Securities Exchange Act of 1934, as amended). All responsibility for the distribution of this report by Maybank KESUSA in the US shall be borne by Maybank KESUSA. All resulting transactions by a US person or entity should be effected through a registered broker-dealer in the US. This report is not directed at you if MKE is prohibited or restricted by any legislation or regulation in any jurisdiction from making it available to you. You should satisfy yourself before reading it that Maybank KESUSA is permitted to provide research material concerning investments to you under relevant legislation and regulations.
UK
This document is being distributed by Maybank Kim Eng Securities (London) Ltd (“Maybank KESL”) which is authorized and regulated, by the Financial Services Authority and is for Informational Purposes only. This document is not intended for distribution to anyone defined as a Retail Client under the Financial Services and Markets Act 2000 within the UK. Any inclusion of a third party link is for the recipients convenience only, and that the firm does not take any responsibility for its comments or accuracy, and that access to such links is at the individuals own risk. Nothing in this report should be considered as constituting legal, accounting or tax advice, and that for accurate guidance recipients should consult with their own independent tax advisers.
June 20, 2014 25
Silverlake Axis
Disclosure of Interest Malaysia: MKE and its Representatives may from time to time have positions or be materially interested in the securities referred to herein and may further act as market maker or may have assumed an underwriting commitment or deal with such securities and may also perform or seek to perform investment banking services, advisory and other services for or relating to those companies.
Singapore: As of 20 June 2014, Maybank KERPL and the covering analyst do not have any interest in any companies recommended in this research report.
Thailand: MBKET may have a business relationship with or may possibly be an issuer of derivative warrants on the securities /companies mentioned in the research report. Therefore, Investors should exercise their own judgment before making any investment decisions. MBKET, its associates, directors, connected parties and/or employees may from time to time have interests and/or underwriting commitments in the securities mentioned in this report.
Hong Kong: KESHK may have financial interests in relation to an issuer or a new listing applicant referred to as defined by the requirements under Paragraph 16.5(a) of the Hong Kong Code of Conduct for Persons Licensed by or Registered with the Securities and Futures Commission.
As of 20 June 2014, KESHK and the authoring analyst do not have any interest in any companies recommended in this research report.
MKE may have, within the last three years, served as manager or co-manager of a public offering of securities for, or currently may make a primary market in issues of, any or all of the entities mentioned in this report or may be providing, or have provided within the previous 12 months, significant advice or investment services in relation to the investment concerned or a related investment and may receive compensation for the services provided from the companies covered in this report.
OTHERS Analyst Certification of Independence The views expressed in this research report accurately reflect the analyst’s personal views about any and all of the subject securities or issuers; and no part of the research analyst’s compensation was, is or will be, directly or indirectly, related to the specific recommendations or views expressed in the report.
Reminder Structured securities are complex instruments, typically involve a high degree of risk and are intended for sale only to sophisticated investors who are capable of understanding and assuming the risks involved. The market value of any structured security may be affected by changes in economic, financial and political factors (including, but not limited to, spot and forward interest and exchange rates), time to maturity, market conditions and volatility and the credit quality of any issuer or reference issuer. Any investor interested in purchasing a structured product should conduct its own analysis of the product and consult with its own professional advisers as to the risks involved in making such a purchase.
No part of this material may be copied, photocopied or duplicated in any form by any means or redistributed without the prior consent of MKE.
Ong Seng Yeow | Executive Director, Maybank Kim Eng Research
Definition of Ratings
Maybank Kim Eng Research uses the following rating system BUY Return is expected to be above 10% in the next 12 months (excluding dividends) HOLD Return is expected to be between - 10% to +10% in the next 12 months (excluding dividends) SELL Return is expected to be below -10% in the next 12 months (excluding dividends)
Applicability of Ratings
The respective analyst maintains a coverage universe of stocks, the list of which may be adjusted according to needs. Investment ratings are only applicable to the stocks which form part of the coverage universe. Reports on companies which are not part of the coverage do not carry investment ratings as we do not actively follow developments in these companies.
DISCLOSURES Legal Entities Disclosures Malaysia: This report is issued and distributed in Malaysia by Maybank Investment Bank Berhad (15938-H) which is a Participating Organization of Bursa Malaysia Berhad and a holder of Capital Markets and Services License issued by the Securities Commission in Malaysia. Singapore: This material is issued and distributed in Singapore by Maybank KERPL (Co. Reg No 197201256N) which is regulated by the Monetary Authority of Singapore. Indonesia: PT Kim Eng Securities (“PTKES”) (Reg. No. KEP-251/PM/1992) is a member of the Indonesia Stock Exchange and is regulated by the BAPEPAM LK. Thailand: MBKET (Reg. No.0107545000314) is a member of the Stock Exchange of Thailand and is regulated by the Ministry of Finance and the Securities and Exchange Commission. Philippines: Maybank ATRKES (Reg. No.01-2004-00019) is a member of the Philippines Stock Exchange and is regulated by the Securities and Exchange Commission. Vietnam: Maybank Kim Eng Securities JSC (License Number: 71/UBCK-GP) is licensed under the State Securities Commission of Vietnam.Hong Kong: KESHK (Central Entity No AAD284) is regulated by the Securities and Futures Commission. India: Kim Eng Securities India Private Limited (“KESI”) is a participant of the National Stock Exchange of India Limited (Reg No: INF/INB 231452435) and the Bombay Stock Exchange (Reg. No. INF/INB 011452431) and is regulated by Securities and Exchange Board of India. KESI is also registered with SEBI as Category 1 Merchant Banker (Reg. No. INM 000011708) US: Maybank KESUSA is a member of/ and is authorized and regulated by the FINRA – Broker ID 27861. UK: Maybank KESL (Reg No 2377538) is authorized and regulated by the Financial Services Authority.

June 20, 2014 26
Silverlake Axis
Malaysia Maybank Investment Bank Berhad (A Participating Organisation of Bursa Malaysia Securities Berhad) 33rd Floor, Menara Maybank, 100 Jalan Tun Perak, 50050 Kuala Lumpur Tel: (603) 2059 1888; Fax: (603) 2078 4194
Singapore Maybank Kim Eng Securities Pte Ltd Maybank Kim Eng Research Pte Ltd 9 Temasek Boulevard #39-00 Suntec Tower 2 Singapore 038989 Tel: (65) 6336 9090 Fax: (65) 6339 6003
London Maybank Kim Eng Securities (London) Ltd 5th Floor, Aldermary House 10-15 Queen Street London EC4N 1TX, UK Tel: (44) 20 7332 0221 Fax: (44) 20 7332 0302
New York Maybank Kim Eng Securities USA Inc 777 Third Avenue, 21st Floor New York, NY 10017, U.S.A. Tel: (212) 688 8886 Fax: (212) 688 3500
Stockbroking Business: Level 8, Tower C, Dataran Maybank, No.1, Jalan Maarof 59000 Kuala Lumpur Tel: (603) 2297 8888 Fax: (603) 2282 5136
Hong Kong Kim Eng Securities (HK) Ltd Level 30, Three Pacific Place, 1 Queen’s Road East, Hong Kong Tel: (852) 2268 0800 Fax: (852) 2877 0104
Indonesia PT Maybank Kim Eng Securities Plaza Bapindo Citibank Tower 17th Floor Jl Jend. Sudirman Kav. 54-55 Jakarta 12190, Indonesia Tel: (62) 21 2557 1188 Fax: (62) 21 2557 1189
India Kim Eng Securities India Pvt Ltd 2nd Floor, The International 16, Maharishi Karve Road, Churchgate Station, Mumbai City - 400 020, India Tel: (91).22.6623.2600 Fax: (91).22.6623.2604
Philippines Maybank ATR Kim Eng Securities Inc. 17/F, Tower One & Exchange Plaza Ayala Triangle, Ayala Avenue Makati City, Philippines 1200 Tel: (63) 2 849 8888 Fax: (63) 2 848 5738
Thailand Maybank Kim Eng Securities (Thailand) Public Company Limited 999/9 The Offices at Central World, 20th - 21st Floor, Rama 1 Road Pathumwan, Bangkok 10330, Thailand Tel: (66) 2 658 6817 (sales) Tel: (66) 2 658 6801 (research)
Vietnam Maybank Kim Eng Securities Limited 4A-15+16 Floor Vincom Center Dong Khoi, 72 Le Thanh Ton St. District 1 Ho Chi Minh City, Vietnam Tel : (84) 844 555 888 Fax : (84) 8 38 271 030
Saudi Arabia In association with Anfaal Capital Villa 47, Tujjar Jeddah Prince Mohammed bin Abdulaziz Street P.O. Box 126575 Jeddah 21352 Tel: (966) 2 6068686 Fax: (966) 26068787
South Asia Sales Trading Kevin FOY [email protected] Tel: (65) 6336-5157 US Toll Free: 1-866-406-7447
North Asia Sales Trading Alex TSUN [email protected] Tel: (852) 2268 0228 US Toll Free: 1 877 837 7635
www.maybank-ke.com | www.maybank-keresearch.com