sik-rapport nr 809 2010 pesticide use and glyphosate ...943716/fulltext01.pdf · soybean crop. for...
TRANSCRIPT
© SIK
SIK-Rapport Nr 809 2010
Pesticide use and glyphosate-resistant weeds – a case study of Brazilian soybean production
Daniel E. Meyer and Christel Cederberg

© SIK 2 (54)

© SIK 3 (54)
SIK-Rapport Nr 809
Pesticide use and glyphosate-resistant weeds – a case study of Brazilian soybean production Daniel E. Meyer and Christel Cederberg SIK-Rapport Nr 809 ISBN 978-91-7290-298-5
© SIK 4 (54)

© SIK 5 (54)
Summary
This study investigates how the use of pesticides in Brazilian soybeans has changed since 2003 when the cultivation of genetically engineered (GE) glyphosate-tolerant soybean cultivars (so-called Roundup Ready (RR) soybeans) started. Also included is an overview of the growing problem of glyphosate-resistant weeds in the world´s soybean fields and its consequences for weed management and herbicide use in present and future soybean production.
Data on pesticides were collected from Brazilian agencies and institutes, and completed with information from recently published scientific literature as well as contacts with Brazilian researchers in the fields of agriculture and environment. A field study was conducted in the state Rio Grande de Sul in June 2010 where farmers were interviewed on herbicide use, motives for choosing GE soybeans and their concerns for herbicide-resistant weeds.
Brazilian soybean production and GE soy
Brazil is the second largest producer and exporter of soybeans in the world. Planted areas with soybeans have had a strong growth during the last 20 years, from 11.5 million hectares in 1990 to 21.7 million hectares in 2009. Total production for 2009/2010 harvest is estimated at 65 million tons. Five states are responsible for 80% of Brazil´s soybean production: Rio Grande do Sul and Paraná in the south (older cultivation areas) and Mato Grosso, Goîas and Mato Grosso do Sul in the center-west (cerrado-region).
GE glyphosate-tolerant soybeans became legal and commercialized later in Brazil than in the U.S. and Argentina. In 2003, RR soybeans were allowed temporarily in the state Rio Grande do Sul and in 2005, the Biosafety Act was passed admitting planting and commercialization of RR soybeans all over Brazil. The technique has had a rapid and widespread adoption and in 2009, around 70% of soybean acreage was cultivated with GE glyphosate-tolerant soy cultivars.
Pesticide use
Sales and use of pesticides in Brazilian agriculture are large and growing; the expanding soybean crop is responsible for approximately 45 % of all pesticides sold. In 2008, close to 140 500 ton active ingredients (a.i.) were sold for the soybean crop, corresponding to a national average use of around 6.6 kg total pesticides as a.i. per hectare soybeans. The sales of these pesticides had a total value of a little more than 3 billion US dollar.
Between 2003 and 2008, average herbicide use increased from around 2.8 kg to 4.2 kg a.i. per hectare soybean (50% growth) and in 2008, approximately 1.5 kg herbicides was used to produce 1 ton soybean. In comparison with other major Brazilian crops, herbicide use in soybeans has had a larger growth in the period 2003 to 2008.
Average fungicide use in the soybean crop increased from 0.32 to 0.55 kg a.i. per hectare between 2004 and 2008 (70% growth). In 2008, 0.2 kg a.i. fungicides were used per ton soybean produce. Asian soybean rust is the main fungal disease affecting soybean production in Brazil and this disease, first identified in 2001, is most likely an important explanation to the growing use of fungicides.
The soybean crop contributes to a significant part of use and sales of insecticides, corresponding to around 45% of total. There is a trend towards increasing dependence of

© SIK 6 (54)
insecticides in the soybean crop; in 2004 the average rate was 0.6 kg a.i. per hectare increasing to around 1 kg a.i. per hectare in 2008. The average use of insecticides was 0.39 kg a.i. per ton soybean produce in 2008.
GE soy and glyphosate-resistant weeds
USA, Brazil and Argentina are responsible for close to 80% of world soybean production today and dominate the world exports of soybeans and soymeal. In 2009, 91%, 99% and 71% of total soybean acreage were grown with GE glyphosate-tolerant cultivars in the U.S., Argentina and Brazil respectively. This massive adoption has led to excessive reliance of glyphosate for weed control in world soybean production. Initially, growers adopted the new weed management technique with little reservation since it made weed control easy and cheap, and enabled earlier seeding and no-tillage. However, only three years after the introduction of RR soybean in the U.S., the first report came of a glyphosate-resistant weed species associated with RR soybeans. In 2010, reports on glyphosate-resistant weeds indicate 30 000 infested sites on up to around 4.6 Mha in the U.S. Recently, the U.S. House Committee on Oversight & Government Reform Subcommittee on Domestic Policy arranged hearings on the growing problems of glyphosate-resistant weeds in North-American agriculture. The development in Brazil and Argentina is less analysed than in the U.S.
Consequences of glyphosate-resistant weeds
Statistics on pesticide sales show that herbicide use in soybeans has increased after adopting the new weed management technique of GE glyphosate-tolerant crops in the U.S. and Brazil. A major cause for the increasing use of herbicides in soybeans is the rapid evolvement of glyphosate-resistant weeds in GE glyphosate-tolerant crops. Biotech seed makers are responding to the problem by developing new GE herbicide-tolerant crops, i.e. GE crops that are resistant to more herbicides than only glyphosate. Under development are GE crops with genes that confer resistance to herbicides with other mode of actions than glyphosate, for example 2,4-D and dicamba. Weed scientists in the U.S. estimate that these new multi-herbicide-tolerant GE soybeans can lead to a strong growth of herbicide use in the U.S. soybean crop in the coming years. Furthermore, since there has not been any development of new herbicides, a significant proportion of the projected increase will be of older, less environmentally friendly herbicides.
Also in Brazil, there are signs of increased use of older and more toxic herbicides in the soybean crop. For example, imports of the toxic herbicide paraquat have increased strongly the last years and there are reports of growing use of paraquat and 2,4-D in soybean regions.
Herbicide resistant weeds can evolve when there is insufficient diversity in weed management systems. Diversity in weed control methods includes herbicides of different mode of actions, some tillage operations, better crop rotations, use of cover crops etc. Present overall dominance of one single weed management technique in world soybean production – excessive use of glyphosate in GE glyphosate-tolerant cultivars combined with no- or low-tillage – is not beneficial for a diversity of cultivation techniques in soybean. This is a well-motivated argument for why alternative cropping systems also should be included in future soybean production.
© SIK 7 (54)
TABLE OF CONTENTS
Summary..................................................................................................................................... 5
Introduction ................................................................................................................................ 9
Background ............................................................................................................................... 11 Production and trade of soy products ......................................................................................................... 11 Genetically engineered GE soybeans .......................................................................................................... 12 Glyphosate‐resistant weeds ........................................................................................................................ 13
Soybean production in Brazil ..................................................................................................... 18 Development of soybean cultivation ........................................................................................................... 18 Cultivation practices .................................................................................................................................... 20 Genetically engineered soybean in Brazil .................................................................................................... 21 Pesticide use ................................................................................................................................................ 24
Trends in pesticide use .............................................................................................................. 26 Herbicides .................................................................................................................................................... 26 Fungicides .................................................................................................................................................... 31 Insecticides .................................................................................................................................................. 33 Comparison with the U.S. soybean crop ..................................................................................................... 34
Concluding remarks ................................................................................................................... 36
References ................................................................................................................................ 39
Appendix 1 Field study in Rio Grande do Sul, June 2010 ............................................................ 43
Appendix 2 Mode of actions in herbicides used in soybeans in the U.S. in 2006 ......................... 53
Appendix 3 Example of cost estimate in soybean ...................................................................... 54
© SIK 8 (54)
© SIK 9 (54)
Introduction
The growing demand for proteins to feed the global livestock is the major driver of the boom in soybean production. Close to 80% of the soybean is extracted as protein-rich soymeal and more than 97% of world soymeal production is used to feed livestock, primarily in the diets of pigs and poultry. In the mid-1980s and -90s, yearly global soymeal demand was around 60 and 80 million tons (Mtons) respectively, soaring to 130 Mtons in 2002 (Steinfeld et al., 2006). With the prospects of a continuing strong growth in world consumption of animal products and soymeal being the major protein source in livestock feed, soybean is a strategic crop for future food security.
Modern soybean production is very dependent on pesticides and especially weed management provides a constant challenge for the soybean farmers. Weeds are considered to have the ability to cause more potential production losses than either insects or diseases. Globally, weeds have been estimated to cause a potential 37% production loss, but the realized losses from weed can be reduced to only around 7-8% thanks to use of modern weed management strategies (CAST, 2009).
Weed management in soybeans has gone through a fundamental change over the last 15 year due to the development of genetically engineered (GE) glyphosate-tolerant soybean cultivars. In GE glyphosate-tolerant soybeans, the herbicide glyphosate (trade name Roundup) can be applied after the crop has emerged to remove weeds without causing crop damage. This new weed management technique enables glyphosate to be used as an in-crop selective herbicide and it provides easy, economical, efficient weed control along with other advantages such as earlier seeding and no-tillage (Powles, 2008).
GE glyphosate-tolerant soybeans were introduced in the U.S. in the mid-1990s and in 2008 they were grown on 91% of the U.S. soybean acreage (CAST, 2009). The penetration of this new weed management technique has been even more massive in Argentina where now 99% of production is based on glyphosate-tolerant soybean cultivars (Vila-Aiub et al., 2008). In Brazil, 16.2 million hectares (Mha) of glyphosate-tolerant soybeans were planted in 2009 corresponding to 71% of soybean acreage (James, 2009). The high adoption of GE glyphosate-tolerant soybean cultivars means a great reliance on only one single herbicide over very large areas of world´s soybean production, and as a consequence, glyphosate-resistant weed species have evolved over the last years. Since glyphosate is regarded as the world´s most important herbicide and essential for present and future food production, its use in a sustainability weed management is a global imperative (Powles, 2008).
The purpose of this study is to analyse how the use of pesticides in soybeans has changed in Brazil since 2003/2004 when the large-scale use of GE glyphosate-tolerant soybean cultivars (“Roundup Ready (RR) soy”) started. The study also includes an investigation of the growing problem of glyphosate-resistant weeds in the world´s soybean fields and what consequences this can have for weed management and herbicide use in soybean production in the coming years.
Data on pesticide use were collected from Brazilian agencies and institutes, and completed with information from recently published scientific literature as well as contacts with Brazilian researchers in the fields of agriculture and environment. Due to the lack of
© SIK 10 (54)
disaggregated data1 on the volumes of separate active ingredients used in Brazilian soybean fields, a field study was conducted in the state Rio Grande de Sul in June 2010 where farmers were interviewed on herbicide use, motives for choosing the specific weed strategy and their concerns for glyphosate-resistance weeds. The field study is presented in Appendix 1.
The evolving of glyphosate-resistant weeds following the fast and large-scale adoption of GE glyphosate-tolerant crops (foremost soybean, cotton and maize) has in a few years grown to a major problem in the U.S. agriculture and the same development is likely to happen in South America. The study includes a literature review of the latest development in the issue.
Several agencies and institutes in Brazil have provided with valuable assistance when collecting data and we are very grateful for this help. We are very thankful to Silceu Dalberto and Nelson Hammes, Cotrimaio Agro-Livestock Cooperative, Três de Maio in Rio Grande do Sul, Leticia Rodrigues da Silva, National Health Surveillance Agency and Célia Ferreira, Institute of Agricultural Economics.
1 Brazilian pesticide use statistics are given as a total sum of herbicides annually sold for soybean production and do not provide with detailed information on the amount of individual chemicals used in the crop(s).

© SIK 11 (54)
Background
Production and trade of soy products Soybean production and demand have increased significantly over the last two decades. In 2009, world soybean production was 216.8 Mtons which is almost a doubling since 1990. Today, almost 80% of world production takes place in the U.S., Brazil and Argentina (Soy Stats, 2010), see Figure 1. The growth of soybean production has mainly been driven by high profitability, government and agro-industrial support and the intensive demand of food, and animal feed from high-consuming countries.
Figure 1 2009 world production of soybeans (Soy Stats, 2010)
The U.S., Brazil and Argentina contribute to 92% of world soybean export with the U.S. and Brazil as the leading actors (Soy Stats, 2010). Argentina´s soybean production is to a great extent domestically processed and therefore, soymeal is the dominating soy-product exported, see Figure 2.
Figure 2 2009 world exports of soybeans and soymeal (Soy Stats, 2010)
0
50
100
150
200
250
Million tons
0102030405060708090
Million tons
Soybean export
Soymeal export
© SIK 12 (54)
The main importing region of soybeans is Asia, dominated by China, the world´s largest importer of soybeans, corresponding to 33 Mtons in 2007 (FAOSTAT, 2010). Also the EU-27 has a significant import, ~17 Mtons in 2007 (FAOSTAT, 2010). EU dominates among soymeal importers and the major part of Argentina and Brazilian soymeal export is destined Europe and its livestock (Gerber et al., 2010).
Genetically engineered GE soybeans During the 1990s Monsanto Company commercially introduced the genetically engineered (GE) soybean cultivar Roundup Ready (RR soy) which is tolerant to the herbicide glyphosate (commercial trade name Roundup). The mechanism of glyphosate is that it inhibits the enzyme 5-enolpyruvyl shikimate-3-phosphate (EPSP) synthase (EC 2.5.1.19), which is essential for the biosynthesis of aromatic compounds in plants, preventing the plant from developing essential amino acids for protein synthesis and secondary metabolites.
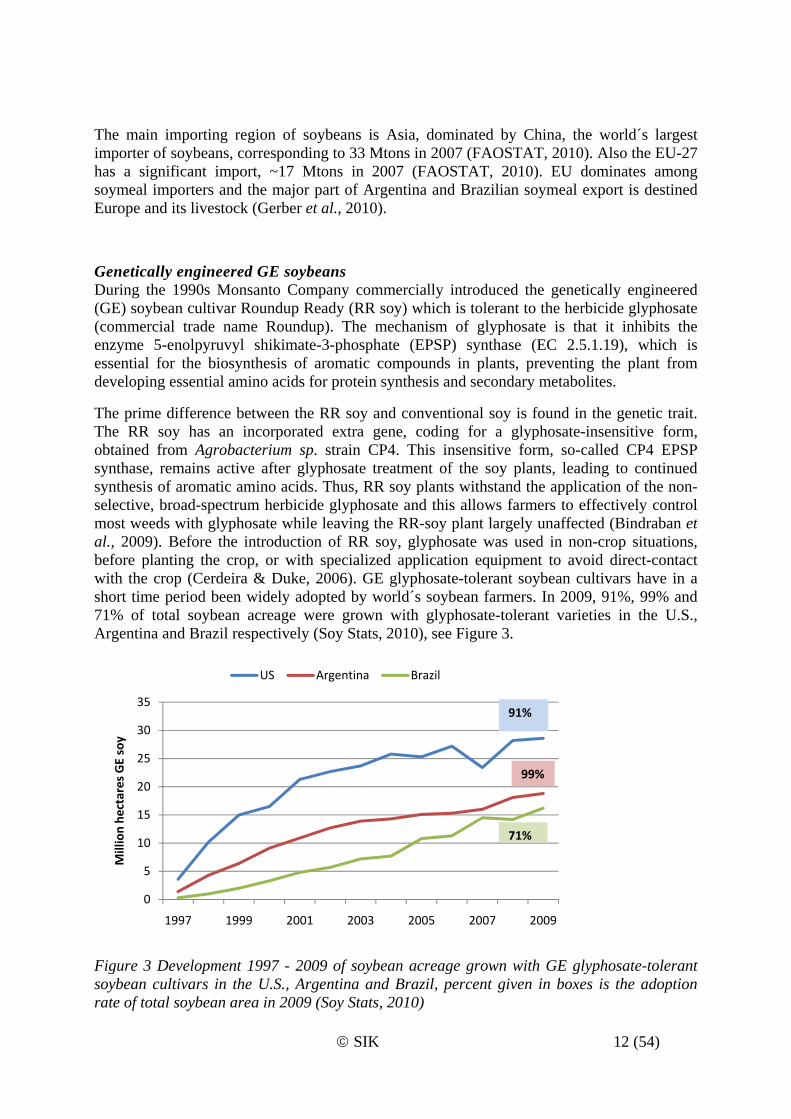
The prime difference between the RR soy and conventional soy is found in the genetic trait. The RR soy has an incorporated extra gene, coding for a glyphosate-insensitive form, obtained from Agrobacterium sp. strain CP4. This insensitive form, so-called CP4 EPSP synthase, remains active after glyphosate treatment of the soy plants, leading to continued synthesis of aromatic amino acids. Thus, RR soy plants withstand the application of the non-selective, broad-spectrum herbicide glyphosate and this allows farmers to effectively control most weeds with glyphosate while leaving the RR-soy plant largely unaffected (Bindraban et al., 2009). Before the introduction of RR soy, glyphosate was used in non-crop situations, before planting the crop, or with specialized application equipment to avoid direct-contact with the crop (Cerdeira & Duke, 2006). GE glyphosate-tolerant soybean cultivars have in a short time period been widely adopted by world´s soybean farmers. In 2009, 91%, 99% and 71% of total soybean acreage were grown with glyphosate-tolerant varieties in the U.S., Argentina and Brazil respectively (Soy Stats, 2010), see Figure 3.
Figure 3 Development 1997 - 2009 of soybean acreage grown with GE glyphosate-tolerant soybean cultivars in the U.S., Argentina and Brazil, percent given in boxes is the adoption rate of total soybean area in 2009 (Soy Stats, 2010)
0
5
10
15
20
25
30
35
1997 1999 2001 2003 2005 2007 2009
Million he
ctares GE soy
US Argentina Brazil
91%
99%
71%

© SIK 13 (54)
According to Monsanto Company (2010), the RR varieties allow efficiency and flexibility, and reduce the input costs (seeds and chemicals) in the soy cultivation system. Weed control in conventional soybean requires the use of more selective herbicides and/or non-chemical methods such as mechanical measures (Benbrook 2004; Bindraban et al., 2009). RR soybeans are therefore ideal for low- and/or no-tillage systems, which has been confirmed in the U.S. According to a survey by the American Soybean Association, 53% of the U.S. soybean farmers made an average of 1.8 fewer tillage passes per year through their soybean fields since glyphosate-tolerant soybeans were introduced, reducing cost on machinery, labor and fuel (Cerdeira & Duke 2006; GM soy Debate, 2009). However, there are few indications that RR soybeans increase yield in comparison with conventional varieties, reports from the U.S. and Argentina instead indicate similar average yields (GM Soy Debate, 2009).
Glyphosate-resistant weeds The massive adoption of GE glyphosate-tolerant crops has led to excessive reliance of glyphosate for weed control and initially, growers relied almost exclusively on glyphosate for weed control. In regions of the U.S. where GE glyphosate-tolerant crops dominate, there have now evolved glyphosate-resistant populations of economically damaging weed species and also in areas of GE glyphosate-tolerant crops in Argentina and Brazil, glyphosate-resistant weed populations have emerged (Powles, 2008).
The fast growing problem of evolving glyphosate-resistant weeds is under discussion in the U.S., where the GE technique was adopted first and most extensively. In summer and autumn 2010, The House Committee on Oversight & Government Reform Subcommittee on Domestic Policy arranged hearings on the problem of glyphosate-resistance weed in the U.S. agriculture; the extent, responsibility and cost of the problem and the consequences of alternatives for handling the problem2;3. The basic ground of the problem is that the adoption and widespread use of the GE crops has profoundly changed the methods for how farmers manage weeds and turned weed management to be exclusively reliant on glyphosate. This single-tactic method has resulted in a problem with great potential implications for weed management: a dramatic increase in the number of weed species that are resistant to glyphosate and a subsequent decline in the effectiveness of glyphosate as a weed management tool (Mortensen, 2010).
Glyphosate was first commercialized in 1974 and primarily used for non-selective burn-down weed control prior to crop seeding. There are few reports of resistant weeds when glyphosate is used in this situation, examples of evolved resistance is when there has been persistent glyphosate usages with few or no other weed control practices. Cases reported are when glyphosate is used repeatedly for weed control between row crops (e.g. fruit orchards, vine and nut crops) and for roadside weed control (Powles, 2008). The first glyphosate resistant weed species to evolve in a GE crop (soybean) occurred in 2000 in a population of horseweed in the U.S. and this was the first instance of a broadleaf weed evolving resistance to glyphosate. Within a 3-year period of using only glyphosate in no-tillage GE soybean, the selection of glyphosate-resistant horseweed biotypes occurred (CAST, 2009). The number of verified cases has accumulated in the last five years. In October 2010, 20 weedy plant species have evolved resistance to glyphosate world-wide; many of those known to be problematic
2http://oversight.house.gov/index.php?option=com_content&task=view&id=5054&Itemid=31 3 http://oversight.house.gov/index.php?option=com_content&view=article&id=5121:webcast-and-testimony-for-hearing-are-superweeds-an-outgrowth-of-usda-biotech-policy-part-ii&catid=66:hearings&Itemid=31
© SIK 14 (54)
weeds, e.g. Conyza spp, Amaranthus palmeri, Ambrosia trifida, Sorghum halepense (Weed Science, 2010)4.
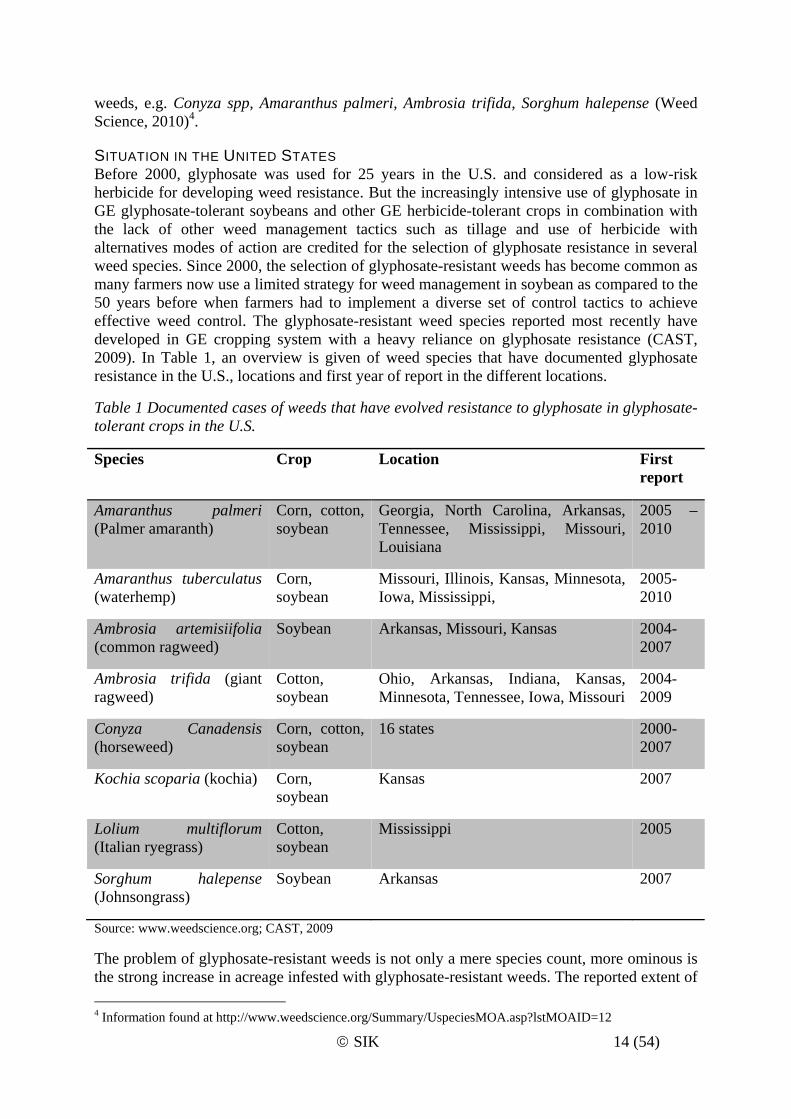
SITUATION IN THE UNITED STATES Before 2000, glyphosate was used for 25 years in the U.S. and considered as a low-risk herbicide for developing weed resistance. But the increasingly intensive use of glyphosate in GE glyphosate-tolerant soybeans and other GE herbicide-tolerant crops in combination with the lack of other weed management tactics such as tillage and use of herbicide with alternatives modes of action are credited for the selection of glyphosate resistance in several weed species. Since 2000, the selection of glyphosate-resistant weeds has become common as many farmers now use a limited strategy for weed management in soybean as compared to the 50 years before when farmers had to implement a diverse set of control tactics to achieve effective weed control. The glyphosate-resistant weed species reported most recently have developed in GE cropping system with a heavy reliance on glyphosate resistance (CAST, 2009). In Table 1, an overview is given of weed species that have documented glyphosate resistance in the U.S., locations and first year of report in the different locations.
Table 1 Documented cases of weeds that have evolved resistance to glyphosate in glyphosate- tolerant crops in the U.S.
Species Crop Location First report
Amaranthus palmeri (Palmer amaranth)
Corn, cotton, soybean
Georgia, North Carolina, Arkansas, Tennessee, Mississippi, Missouri, Louisiana
2005 – 2010
Amaranthus tuberculatus (waterhemp)
Corn, soybean
Missouri, Illinois, Kansas, Minnesota, Iowa, Mississippi,
2005-2010
Ambrosia artemisiifolia (common ragweed)
Soybean Arkansas, Missouri, Kansas 2004-2007
Ambrosia trifida (giant ragweed)
Cotton, soybean
Ohio, Arkansas, Indiana, Kansas, Minnesota, Tennessee, Iowa, Missouri
2004-2009
Conyza Canadensis (horseweed)
Corn, cotton, soybean
16 states 2000-2007
Kochia scoparia (kochia) Corn, soybean
Kansas 2007
Lolium multiflorum (Italian ryegrass)
Cotton, soybean
Mississippi 2005
Sorghum halepense (Johnsongrass)
Soybean Arkansas 2007
Source: www.weedscience.org; CAST, 2009
The problem of glyphosate-resistant weeds is not only a mere species count, more ominous is the strong increase in acreage infested with glyphosate-resistant weeds. The reported extent of 4 Information found at http://www.weedscience.org/Summary/UspeciesMOA.asp?lstMOAID=12
© SIK 15 (54)
infestation in the U.S. agriculture has increased dramatically in only three years: in 2007 glyphosate-resistant populations of eight weeds were reported on no more than 3 251 sites covering 2.4 million acres (~1 Mha). In the summer of 2009, glyphosate resistant weeds were reported at as many as 14 262 sites on up to 5.4 million acres (~2.2 Mha) and the most recent 2010 summary indicates 30 000 infested sites on up to 11.4 million acres (~4.6Mha). Since 2007, the number of reported sites infested by glyphosate-resistant weeds in the U.S. has increased nine-fold while the infested acreage has increased nearly five-fold (Mortensen, 2010).
In the U.S., there are herbicides used in soybeans representing 9 different modes of action, glyphosate has an overwhelming dominance; it was used on 92% of the acreage in 2006 while all other herbicides were applied only occasionally, see Appendix 2. Resistance to herbicides used in soybeans is however not only a glyphosate-related problem. In the U.S., herbicide-resistance was first documented in the 1970s and intensified in the early 1990s, that is before the large-scale use of GE Roundup Ready soybeans. One important herbicide group used in soybeans in the mid 1990s was the newly developed ALS-inhibitors (see Appendix 2) but some weed species evolved resistance to this herbicide group surprisingly fast and several cases of ALS-inhibitor-resistant waterhemp (Amaranthus spp) were discovered in the 1990s (CAST 2009; Weed Science, 2010). Some of these weed species have now also evolved glyphosate-resistance (Table 1) and thus have multi-resistance to herbicides.
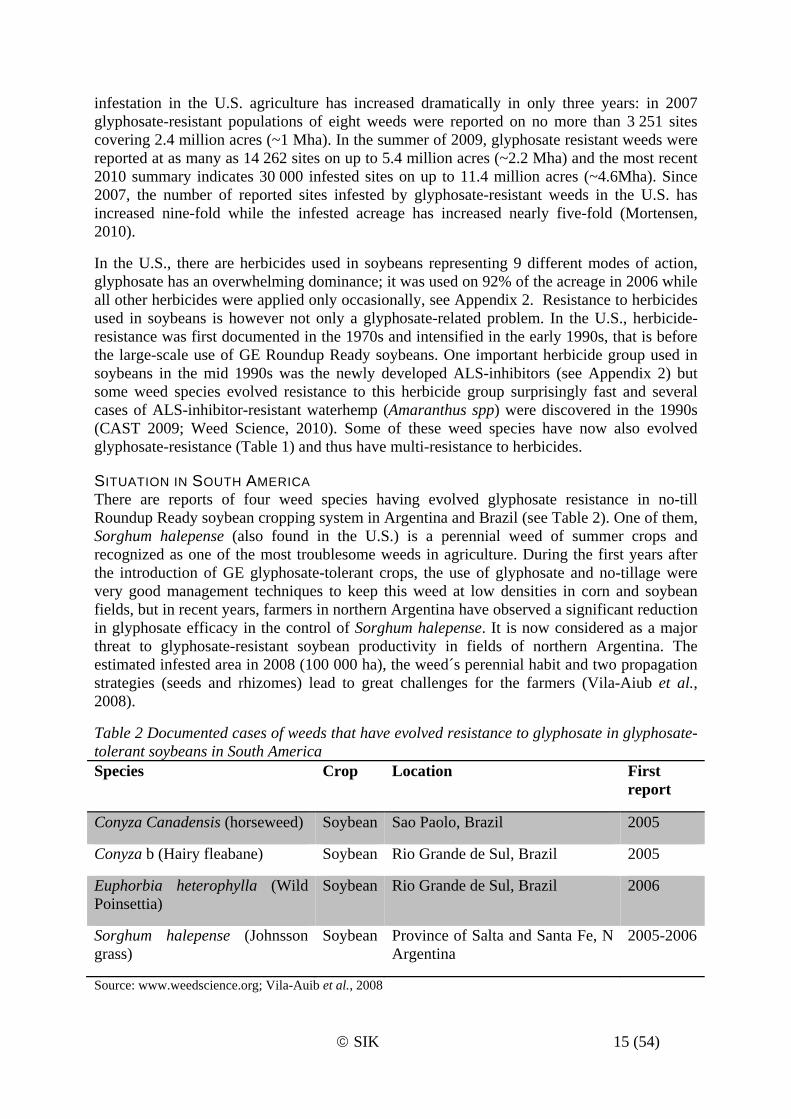
SITUATION IN SOUTH AMERICA There are reports of four weed species having evolved glyphosate resistance in no-till Roundup Ready soybean cropping system in Argentina and Brazil (see Table 2). One of them, Sorghum halepense (also found in the U.S.) is a perennial weed of summer crops and recognized as one of the most troublesome weeds in agriculture. During the first years after the introduction of GE glyphosate-tolerant crops, the use of glyphosate and no-tillage were very good management techniques to keep this weed at low densities in corn and soybean fields, but in recent years, farmers in northern Argentina have observed a significant reduction in glyphosate efficacy in the control of Sorghum halepense. It is now considered as a major threat to glyphosate-resistant soybean productivity in fields of northern Argentina. The estimated infested area in 2008 (100 000 ha), the weed´s perennial habit and two propagation strategies (seeds and rhizomes) lead to great challenges for the farmers (Vila-Aiub et al., 2008).
Table 2 Documented cases of weeds that have evolved resistance to glyphosate in glyphosate- tolerant soybeans in South America Species Crop Location First
report
Conyza Canadensis (horseweed) Soybean Sao Paolo, Brazil 2005
Conyza b (Hairy fleabane) Soybean Rio Grande de Sul, Brazil 2005
Euphorbia heterophylla (Wild Poinsettia)
Soybean Rio Grande de Sul, Brazil 2006
Sorghum halepense (Johnsson grass)
Soybean Province of Salta and Santa Fe, N Argentina
2005-2006
Source: www.weedscience.org; Vila-Auib et al., 2008
© SIK 16 (54)
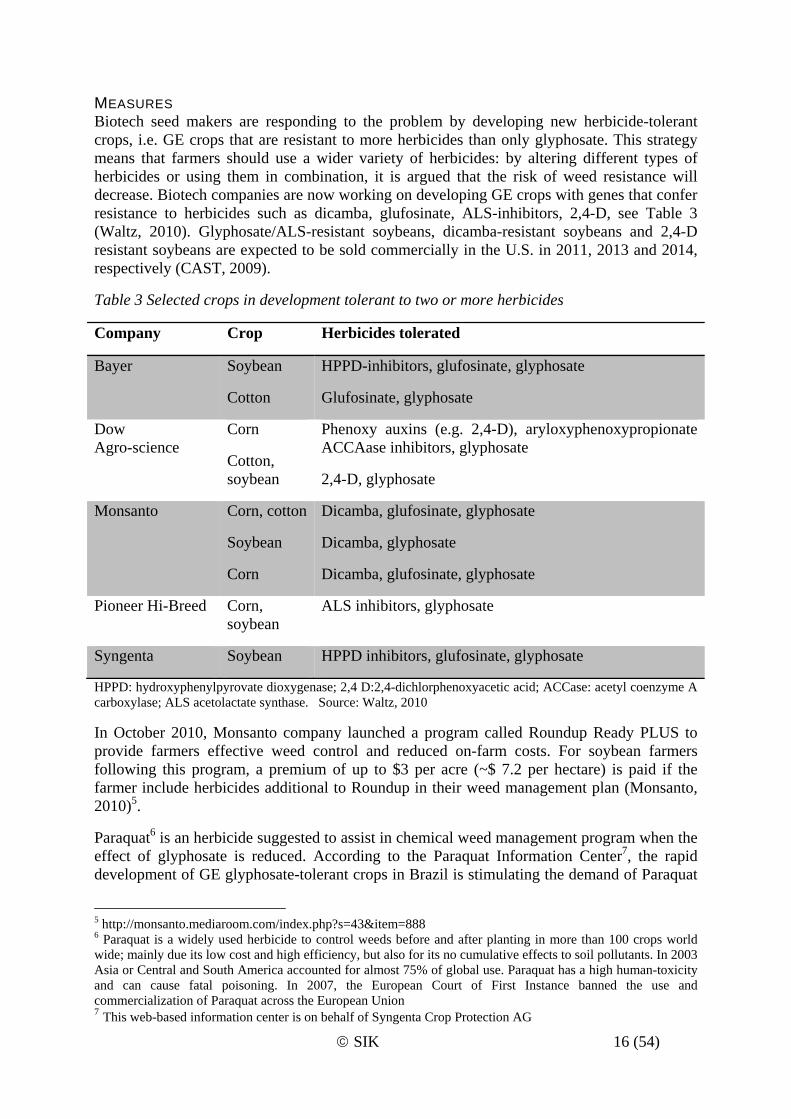
MEASURES Biotech seed makers are responding to the problem by developing new herbicide-tolerant crops, i.e. GE crops that are resistant to more herbicides than only glyphosate. This strategy means that farmers should use a wider variety of herbicides: by altering different types of herbicides or using them in combination, it is argued that the risk of weed resistance will decrease. Biotech companies are now working on developing GE crops with genes that confer resistance to herbicides such as dicamba, glufosinate, ALS-inhibitors, 2,4-D, see Table 3 (Waltz, 2010). Glyphosate/ALS-resistant soybeans, dicamba-resistant soybeans and 2,4-D resistant soybeans are expected to be sold commercially in the U.S. in 2011, 2013 and 2014, respectively (CAST, 2009).
Table 3 Selected crops in development tolerant to two or more herbicides
Company Crop Herbicides tolerated
Bayer Soybean
Cotton
HPPD-inhibitors, glufosinate, glyphosate
Glufosinate, glyphosate
Dow Agro-science
Corn
Cotton, soybean
Phenoxy auxins (e.g. 2,4-D), aryloxyphenoxypropionate ACCAase inhibitors, glyphosate
2,4-D, glyphosate
Monsanto Corn, cotton
Soybean
Corn
Dicamba, glufosinate, glyphosate
Dicamba, glyphosate
Dicamba, glufosinate, glyphosate
Pioneer Hi-Breed Corn, soybean
ALS inhibitors, glyphosate
Syngenta Soybean HPPD inhibitors, glufosinate, glyphosate
HPPD: hydroxyphenylpyrovate dioxygenase; 2,4 D:2,4-dichlorphenoxyacetic acid; ACCase: acetyl coenzyme A carboxylase; ALS acetolactate synthase. Source: Waltz, 2010
In October 2010, Monsanto company launched a program called Roundup Ready PLUS to provide farmers effective weed control and reduced on-farm costs. For soybean farmers following this program, a premium of up to $3 per acre (~$ 7.2 per hectare) is paid if the farmer include herbicides additional to Roundup in their weed management plan (Monsanto, 2010)5.
Paraquat6 is an herbicide suggested to assist in chemical weed management program when the effect of glyphosate is reduced. According to the Paraquat Information Center7, the rapid development of GE glyphosate-tolerant crops in Brazil is stimulating the demand of Paraquat
5 http://monsanto.mediaroom.com/index.php?s=43&item=888 6 Paraquat is a widely used herbicide to control weeds before and after planting in more than 100 crops world wide; mainly due its low cost and high efficiency, but also for its no cumulative effects to soil pollutants. In 2003 Asia or Central and South America accounted for almost 75% of global use. Paraquat has a high human-toxicity and can cause fatal poisoning. In 2007, the European Court of First Instance banned the use and commercialization of Paraquat across the European Union 7 This web-based information center is on behalf of Syngenta Crop Protection AG
© SIK 17 (54)
due to more evidence of glyphosate-resistant weeds (PIQ, 2010). Paraquat in combination with diuron has become an essential tool for Brazilian farmers to hamper the spread of resistant weeds8 (PIQ, 2010). In the field study we conducted in the state Rio Grande de Sul in June 2010 to investigate herbicide use in GE glyphosate-tolerant soybeans, several visited farms used paraquat-based herbicides immediately before soybean planting or after soybean harvest when Roundup application did not provide full effect (see Appendix 1).
Weed scientists call for more diversified weed management systems, such as applying herbicides with different mode of actions (not only relying to glyphosate), increased tillage, better crop rotations etc. Owen (2010) underscores the importance of sustainable weed-management programs to maintain the effectiveness of GE herbicide-tolerant crops. Also, growers must collectively adopt such diversified practices; individual farmer´s action will fail to prevent herbicide resistance to glyphosate because the resistant genes in weeds easily cross farm boundaries. However, according to a recent report from the U.S. National Academy of Science, farmers are reluctant to stop using glyphosate when facing signs of resistance in their fields. A 2009 survey sponsored by Monsanto found that >75% of farmers were aware of the potential of weeds to develop glyphosate-resistance but less than half of those farmers said they believed that rotating crops and alternating herbicides would be effective practices for minimizing weed resistance (Waltz, 2010).
The risk of developing multi-resistant weeds as a consequence of developing new GE herbicide-tolerant crops resistant to additional herbicides besides glyphosate is highlighted by several weed researchers (Waltz, 2010). In a statement before the House Committee on Oversight & Government Reform Subcommittee on Domestic Policy in July 2010, Mortensen (2010) calls for federal regulation in the U.S. including for example environmental market incentives to more diverse weed management methods and taxes on GE seed and associated herbicides. In his statement, Mortensen emphasizes the need for research and education aimed at developing ecologically-based integrated weed management methods.
8 http://paraquat.com/news-and-features/archives/paraquat-is-glyphosates-bodyguard

© SIK 18 (54)
Soybean production in Brazil Development of soybean cultivation Brazil is today the second largest producer and exporter of soybeans in the world. Its national production for 2009/2010 harvest is estimated at 65 Mtons, of which 25.9 Mtons are exported (CONAB, 2010). Planted areas with soybeans in Brazil have been constantly rising, from 11.5 Mha in 1990 to 21.3 Mha in 2008, see Figure 4.
Figure 4 Total soybean production (million tons, blue line) and land use (million hectares, red line) in Brazil 1990-2008 (IBGE, 2010)
The first soybean seeds were brought to the country in 1882 by professor Gustavo Dutra from the School of Agronomy of the Federal University of Bahia. At the beginning of the 20th century soy seeds started to circulate among farmers in the country, especially in the south, where the crop was benefited by weather patterns similar to the southern U.S., place of origin of the first Brazilian soybean genotypes (EMBRAPA, 2004). The southern region of Brazil was for a long time the only producing area; particularly the states of Paraná and Rio Grande do Sul, where double-cropping prevailed with wheat in the winter and soybeans in the summer (Vendrametto & Bonilla, 2009). It took more than half a century for the soy production to start its expansion and it was in the 1970s that soy established itself as the main crop in the country, increasing from 1.5 Mtons in 1970 to more than 15 Mtons in 1979. At this time, still more than 80% of the produced volume was concentrated in the south regions (EMBRAPA, 2004).
In the 1980s and 1990s farmers moving to the cerrado (the Brazilian tropical savanna), including the Center-West region, started to invest in soybeans. This transition was possible due to subventions, development of roads and infrastructure, as well as the areas flat topography, favorable for mechanization. Also, the improvement of suitable plant varieties and the introduction of new technologies and fertilization techniques contributed to the expansion (ibid). In 1970, less than 2% of the national production of soybean was harvested in the cerrado and Center-West. In 1990, the percentage had increased to 40% (IBGE, 2010).
The commercial growth is nowadays concentrated in the South and the Center-West regions of Brazil (Figure 5).
0
10
20
30
40
50
60
70
1990 1992 1994 1996 1998 2000 2002 2004 2006 2008
Million he
ctares and
million tons
MT
Mha

© SIK 19 (54)
Figure 5 Map illustrating soy producing states in Brazil, as well as the dominating Centre-West and Southern regions (dotted in black), Cerrado land area (shaded in green) and main exporting ports of soy (Flaskerud, 2003) During the last two decades total soybean production has more than three-fold reaching 65 Mtons in 2009/2010 with an average national yield of 2.8 ton/ha for 2009/2010 (CONAB, 2010). The intensification has been especially notable in the Center-West state of Mato Grosso - today’s largest soybean producer in Brazil with a total harvest of 17.2 Mtons in 2008, followed by the long-established southern states of Paraná (11.8 Mtons) and Rio Grande do Sul, (7.7 Mtons) (IBGE, 2010). Also the Center-West states of Goias, (6.6 Mtons), and Mato Grosso do Sul, (4.6 Mtons), are important for Brazilian soy production (Figure 6).
Figure 6 Yearly soybean production (million tons) in the five main producing states of Brazil 1990-2008 (IBGE, 2010)
As seen in Figure 6, soybean production decreased in main producing states in 2003/2004 and 2004/2005 mainly in the southern region. This was because of two consecutive summer droughts that mostly affected the state of Rio Grande do Sul. The largest deviation occurred in
0
2
4
6
8
10
12
14
16
18
20
1990 1992 1994 1996 1998 2000 2002 2004 2006 2008
Million tons
Mato Grosso
Goias
Mato Grosso do Sul
Paraná
Rio Grande do Sul

© SIK 20 (54)
the 2004/2005 harvest when there was severe drought throughout the month of January, which coincided with the stage of flowering to the grain filling stages which are most sensitive to water stress (Assad et al., 2007). This weather phenomenon occurred simultaneously to falling international prices and with changes in the valuation of the exchange rate, making the production drop dramatically in this state (Lazzari, 2006).
Areas planted with soybeans in Brazil have also been constantly rising, from 11.5 Mha in 1990 to 21.7 Mha at the end of 2009 (89%). Throughout this time, the Center-West region increased its land use by +5.7 Mha, with the state of Mato Grosso as leader. The northeast region (Amazon forest region) has increased by +1.2 Mha. However, area growth in the southern region, considered the most traditional for soybeans, has also been significant, totalling +2.0 Mha, with Paraná and Rio Grande do Sul occupying today around 7.7 Mha (IBGE, 2010). Five states contribute to around 80% of the Brazilian total soybean production and land use for soybeans, Figure 6 and 7.
Figure 7 Yearly land use (million hectares) for soybean in the five main producing states of Brazil 1990-2008 (IBGE, 2010)
Soybean production in the state Mato Grosso is characterized by the existence of a small number of actors, mostly large holdings, with high levels of mechanization, while the southern states base their production on a variety of small- and large-holder farms (Bertrand et al., 2005; Bindraban et al., 2009). The high specialization in one crop – soybean – in the Cerrado region can also be seen in the agricultural statistics; in 2006, 95% of the cropland area was planted with soybeans in the summer season in the states Mato Grosso and Mato Grosso de Sul, while the soybean share was around 60 % of cropland area in the summer season in the southern states Paraná and Rio Grande do Sul (IBGE, 2010).
Cultivation practices Planting of soybean usually take place between the end of October until beginning of January (spring and summer), and harvest concentration of soy takes place between the end of January until beginning of May (summer and autumn) (CONAB, 2010). The date ranges are wide
0
1
2
3
4
5
6
7
1990 1992 1994 1996 1998 2000 2002 2004 2006 2008
Million he
ctares Mato Grosso
Goias
Mato Grosso do Sul
Paraná
Rio Grande do Sul
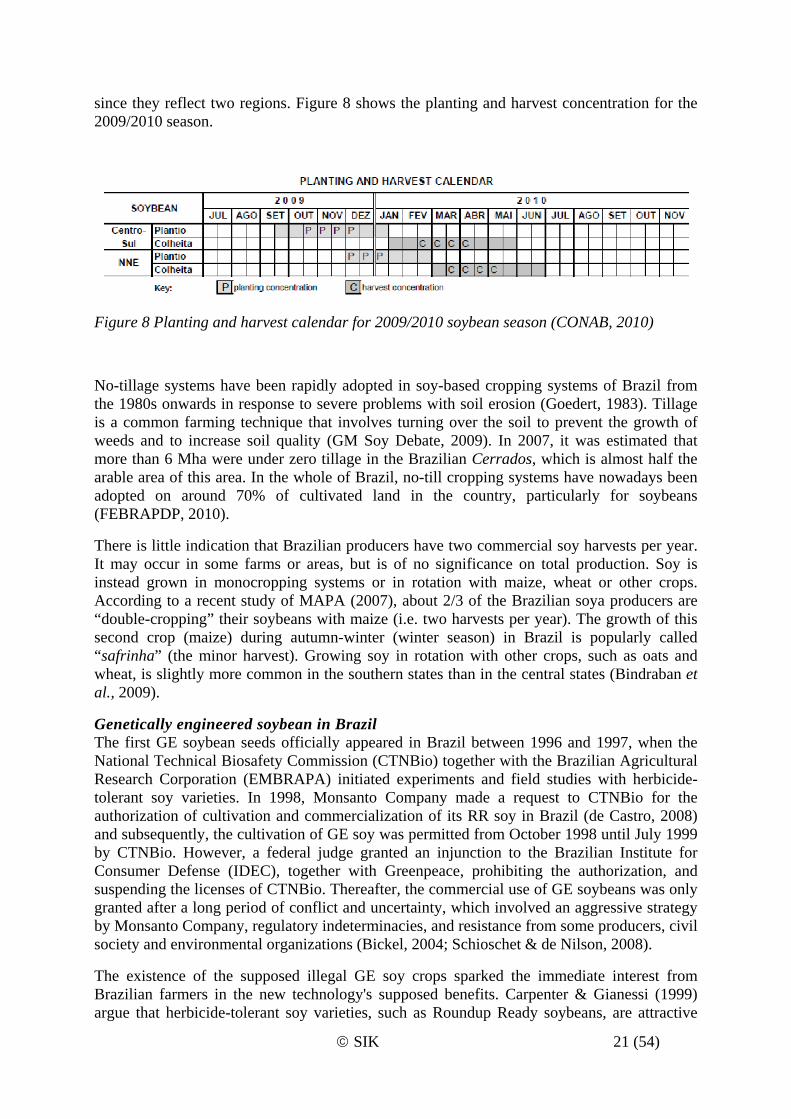
© SIK 21 (54)
since they reflect two regions. Figure 8 shows the planting and harvest concentration for the 2009/2010 season.
Figure 8 Planting and harvest calendar for 2009/2010 soybean season (CONAB, 2010)
No-tillage systems have been rapidly adopted in soy-based cropping systems of Brazil from the 1980s onwards in response to severe problems with soil erosion (Goedert, 1983). Tillage is a common farming technique that involves turning over the soil to prevent the growth of weeds and to increase soil quality (GM Soy Debate, 2009). In 2007, it was estimated that more than 6 Mha were under zero tillage in the Brazilian Cerrados, which is almost half the arable area of this area. In the whole of Brazil, no-till cropping systems have nowadays been adopted on around 70% of cultivated land in the country, particularly for soybeans (FEBRAPDP, 2010).
There is little indication that Brazilian producers have two commercial soy harvests per year. It may occur in some farms or areas, but is of no significance on total production. Soy is instead grown in monocropping systems or in rotation with maize, wheat or other crops. According to a recent study of MAPA (2007), about 2/3 of the Brazilian soya producers are “double-cropping” their soybeans with maize (i.e. two harvests per year). The growth of this second crop (maize) during autumn-winter (winter season) in Brazil is popularly called “safrinha” (the minor harvest). Growing soy in rotation with other crops, such as oats and wheat, is slightly more common in the southern states than in the central states (Bindraban et al., 2009).
Genetically engineered soybean in Brazil The first GE soybean seeds officially appeared in Brazil between 1996 and 1997, when the National Technical Biosafety Commission (CTNBio) together with the Brazilian Agricultural Research Corporation (EMBRAPA) initiated experiments and field studies with herbicide-tolerant soy varieties. In 1998, Monsanto Company made a request to CTNBio for the authorization of cultivation and commercialization of its RR soy in Brazil (de Castro, 2008) and subsequently, the cultivation of GE soy was permitted from October 1998 until July 1999 by CTNBio. However, a federal judge granted an injunction to the Brazilian Institute for Consumer Defense (IDEC), together with Greenpeace, prohibiting the authorization, and suspending the licenses of CTNBio. Thereafter, the commercial use of GE soybeans was only granted after a long period of conflict and uncertainty, which involved an aggressive strategy by Monsanto Company, regulatory indeterminacies, and resistance from some producers, civil society and environmental organizations (Bickel, 2004; Schioschet & de Nilson, 2008).
The existence of the supposed illegal GE soy crops sparked the immediate interest from Brazilian farmers in the new technology's supposed benefits. Carpenter & Gianessi (1999) argue that herbicide-tolerant soy varieties, such as Roundup Ready soybeans, are attractive
© SIK 22 (54)
and the technique was adopted rapidly by farmers not only because of its potential cost savings, but also due the simplicity and flexibility of a weed control program that relies on one herbicide to control a broad spectrum of weeds without crop injury or crop rotation restrictions. Thus, it is known today that many Brazilian farmers previous to the passing of the Biosafety Bill 2005 when the use of RR soybeans was officially approved, illegally cultivated these new soybean varieties. The first apprehension for illegal cultivation was made in October 1998, in a central region of the state Rio Grande do Sul. Those involved were charged by the federal authorities, but the process was suspended in 1999 after agreement between prosecutors and producers. Further RR soybean plantations were discovered during the years after, especially in the states Rio Grande do Sul and Paraná (de Castro, 2008; EMBRAPA, 2010).
To resolve the impasse created by the increased use of GE soy cultivations, the Federal Government, in March 2003, published the Provisional Measure 113/03, authorizing the sale of planted RR soybeans in the state Rio Grande do Sul, both for domestic and foreign markets, as well as for human and animal consumption. The Provisional Measure was only valid for the 2003/2004 harvest and the continued sale and multiplication of RR seeds was still prohibited (de Castro, 2008). In March 2005, eight years after the introduction of the first GE herbicide-tolerant soy seeds in Brazil, the Biosafety Act 11.105/05 paved the way to the clearing of planting and commercialization of GE soy varieties in Brazil (Schioschet & de Nilson, 2008).
Little accurate data exist on the production of GE glyphosate-tolerant soybeans for the period before the approval of the Biosafety Act. Until 2003 it has not been possible to draw an accurate map of RR soybean production and land use. De Castro (2008) argues that most GE glyphosate-tolerant soy cultivations in 2003 was found in the southern state of Rio Grande do Sul (this is also were most apprehensions of GE soybeans occurred during the banned period), probably arriving from neighboring Argentina where RR soybean varieties were commercially grown. The same author estimates that about 50% of the soybean production in Rio Grande do Sul in 2003 was based on RR soy. Estimates from EMBRAPA account for about 70% for the same year.
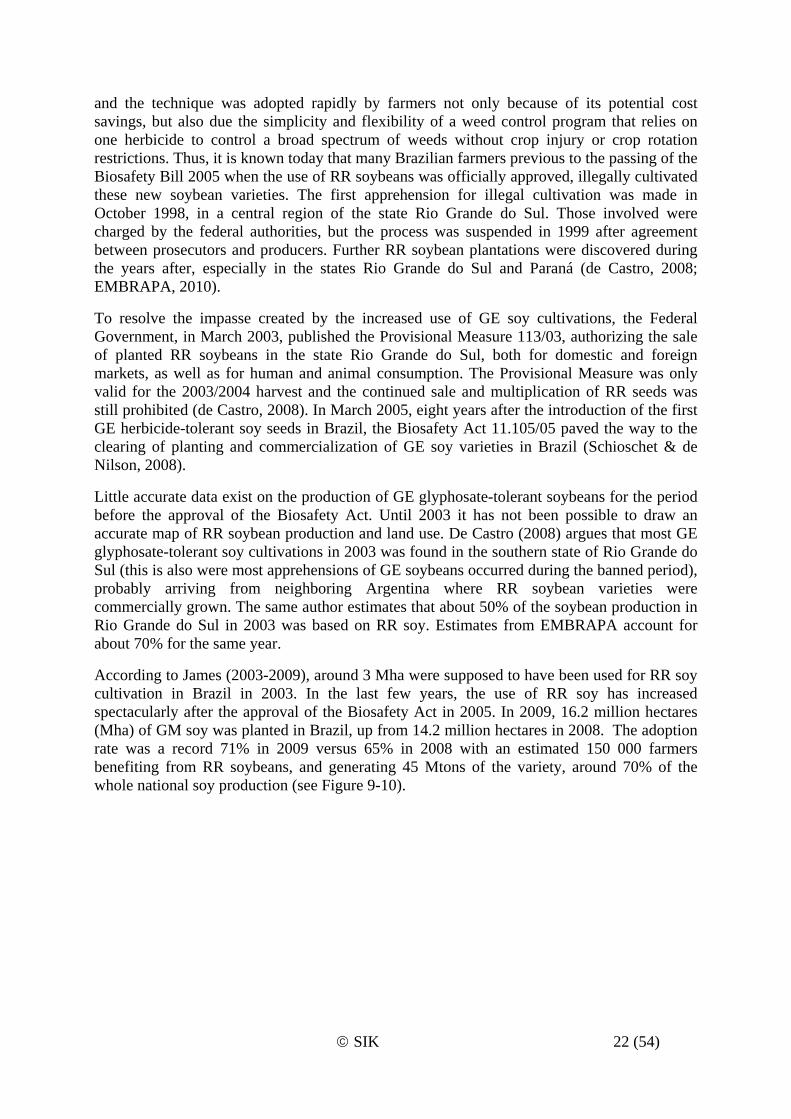
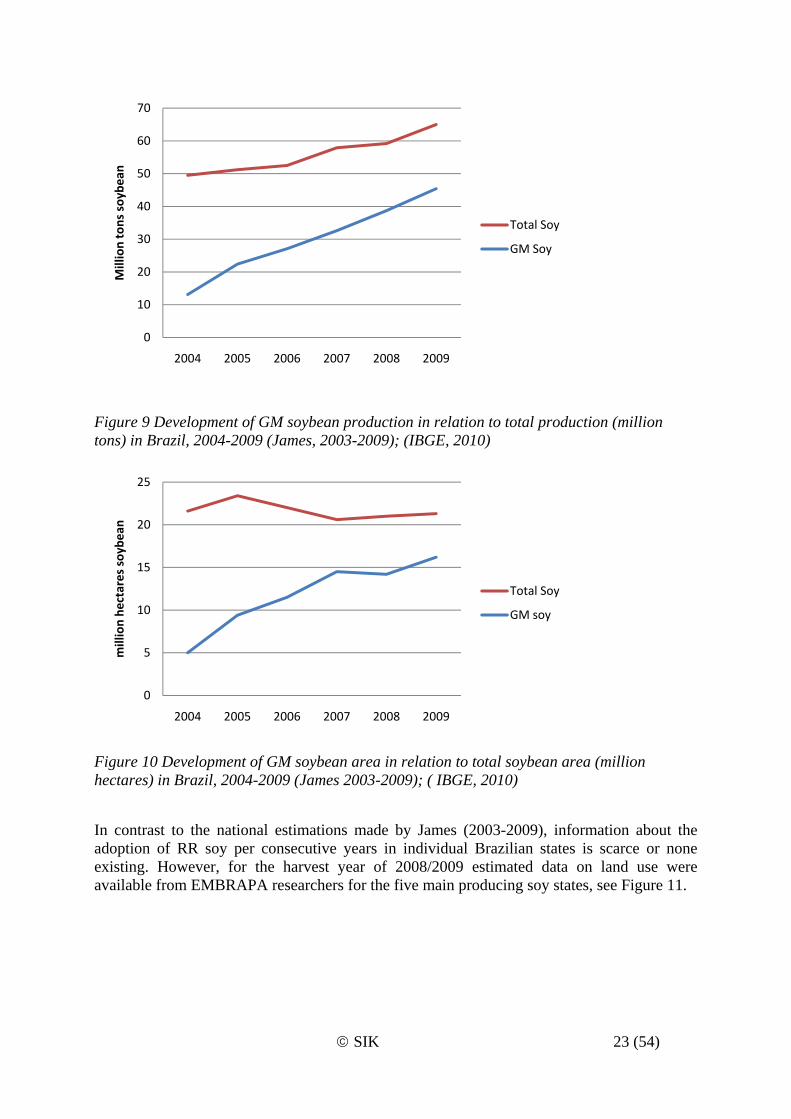
According to James (2003-2009), around 3 Mha were supposed to have been used for RR soy cultivation in Brazil in 2003. In the last few years, the use of RR soy has increased spectacularly after the approval of the Biosafety Act in 2005. In 2009, 16.2 million hectares (Mha) of GM soy was planted in Brazil, up from 14.2 million hectares in 2008. The adoption rate was a record 71% in 2009 versus 65% in 2008 with an estimated 150 000 farmers benefiting from RR soybeans, and generating 45 Mtons of the variety, around 70% of the whole national soy production (see Figure 9-10).
© SIK 23 (54)
Figure 9 Development of GM soybean production in relation to total production (million tons) in Brazil, 2004-2009 (James, 2003-2009); (IBGE, 2010)
Figure 10 Development of GM soybean area in relation to total soybean area (million hectares) in Brazil, 2004-2009 (James 2003-2009); ( IBGE, 2010)
In contrast to the national estimations made by James (2003-2009), information about the adoption of RR soy per consecutive years in individual Brazilian states is scarce or none existing. However, for the harvest year of 2008/2009 estimated data on land use were available from EMBRAPA researchers for the five main producing soy states, see Figure 11.
0
10
20
30
40
50
60
70
2004 2005 2006 2007 2008 2009
Million tons soybe
an
Total Soy
GM Soy
0
5
10
15
20
25
2004 2005 2006 2007 2008 2009
million he
ctares soybe
an
Total Soy
GM soy

© SIK 24 (54)
Figure 11 Land use (million hectares) of GM soybean and conventional soybeans in the five main producing states of Brazil, 2008/2009 harvest (EMBRAPA, 2010)
Pesticide use Pesticide use in Brazilian agriculture is large and growing, see Table 4; the expanding soybean crop is responsible for approximately 45 % of all pesticides sold. The increased use of pesticides, many of which have high toxicity for health as well as environment, has been the centre of attention of the Brazilian Health Surveillance Agency (ANVISA) and in 2008, ANVISA planned a review of 14 active ingredients9 used in agriculture. The re-evaluation of those 14 pesticides was stopped due to several court decisions. The Brazilian Consumer Defense Institute (IDEC)10 attributes the court actions to a series of law suits filed by pesticide manufacturers and their trade association, the National Association of the Agricultural Defense Products Industry (SINDAG). As a result of the court actions, Brazil continues to produce and import some pesticides with high toxicity, banned in many countries. In 2008, close to 140 500 ton active ingredients were sold for the soybean production, corresponding to around 6.6 kg total pesticides as active ingredients (a.i.), was used as a national average in soybean crop (calculated on a total area of 21.3 Mha soybeans).
9http://portal.anvisa.gov.br/wps/wcm/connect/977d25804067799b810eeb137b78f2dc/rdc+10+de+22+de+fevereiro+de+2008.PDF?MOD=AJPERES. The 14 active ingredients for review in 2008 were: Acephate, Abamectin, Carbofuran, Cihexatin, Endosulfan, Glyphosate, Lactofen, Methamidophos, Methyl Parathion, Paraquat, Phorate, Phosmet, Tiram and Triclorfon. (ANVISA, 2010). Available at: http://portal.anvisa.gov.br/wps/portal/anvisa/home/agrotoxicotoxicologia?tax=Agrotoxicos+e+Toxicologia&cat=Reavaliacoes+de+Produtos+Agrotoxicos&siteArea=Agrotoxicos+e+Toxicologia&pagedesign=Agrotoxico_Toxicologia_N2&WCM_GLOBAL_CONTEXT=/wps/wcm/connect/Anvisa/Anvisa/Inicio/Agrotoxicos+e+Toxicologia 10 http://www.temasactuales.com/temasblog/hazardous-substances/brazil-plans-to-ban-or-restrict-12-pesticides/
0
2
4
6
8
10
12
14
16
18
Mato Grosso
Paraná Rio Grande do Sul
Goias Mato Grosso do
Sul
TOTAL
GM Soy
Conventional Soy
Mha

© SIK 25 (54)
Table 4 Pesticide sale (ton active ingredients) in Brazil 2004-2008, total and soybeans Year Total, ton active ingredient Soybean crop, ton active ingredient
2004 214 725 96 554
2005 223 232 102 231
2006 238 766 97 605
2007 304 031 130 733
2008 312 637 140 489
Source: IEA, 2010
Around 40 – 45% of total sale value of the pesticide market in Brazil is due to the soybean crop (Table 5). In 2008, pesticides at a total value of a little more than 3 billion US dollar were sold for the soybean production. As a national average for the total soybean area of 21.3 Mha in 2008, this corresponds to a cost in soybean production of approximately 143 US$ per hectare.
Table 5 Value (US$ 1000) of pesticides sold in Brazil 2004-2008, total and for soybeans
Year Total, US$ 1000 Soybean crop, US$ 1000
2004 4 494 948 2 221 691
2005 4 243 748 1 872 575
2006 3 919 841 1 508 956
2007 5 371 965 2 152 029
2008 7 125 140 3 041 391
Source: IEA, 2010
According to statistics from CONAB (2010), the pesticide use and thereby cost vary between region, for example in 2008, pesticides costs were found in the range of approximately 200 – 500 R$11 per hectare soybean in five main soy-producing states. As an average, 15-20% of total cost for soybean is due to pesticides. Together with fertilisers, more than 40% of soybean cost in Brazil is due to application of fertilisers and chemicals on the soybean crop. In Appendix 3, an example of a cost estimate for soybean cultivation in the state Mato Grosso is shown.
11 Corresponding to 100-250 US$ per hectare in 2008 (approximately 2R$ per 1 US$ in 2008), i.e. in accordance with the IEA data on average pesticide sale value allocated for the whole soybean crop.
© SIK 26 (54)
Trends in pesticide use Statistics on pesticide use are mostly reported as sold pesticides in volumes active ingredients and differentiated between herbicides, fungicides and insecticides. The active ingredient (a.i.) is the chemical compound(s) in the pesticide product that is responsible for killing or otherwise controlling the target pests. Statistics on sales of pesticides are for example reported for Sweden (KemI, 2007), the EU (EU Commission 2007; 2009) and for Brazil by SINDAG, Sindicato Nacional da Indústria de Produtos para Defesa Agrícola12.
When reporting pesticide statistics, the indicator ”use of active ingredients” (based on sales statistics) is mostly use but is gives inadequate information. This is because pesticide products change over time and the active ingredients have different mode of actions and toxicity and are used in different doses. In recent years, low-dose herbicides (often applied in doses <100 gram a.i. per hectare), have been introduced and these pesticides are very effective at very low doses. As an example, low-dose herbicides, mostly from the group sulfonyl-urea, were used on more than 50% of the grain acreage in Sweden in 2006 as opposed to only 26% in 1988. This development has helped to reduce the total use of active ingredients for chemical weed control in Swedish agriculture but has almost not changed the share of total grain area treated with herbicides (Wivstad, 2010).
To improve pesticide statistics and indicators for monitoring ongoing work to lower the risks associated with pesticide use, different initiatives have been suggested. Example of this is in Germany, where the indicator Standardized Treatment Index (STI) has been introduced which is calculated by the factors 1) number of active ingredients per treatment; 2) used dose in relation to recommended dose and 3) share of treated acreage (in relation to total acreage of the crop studied). STI is not a perfect indicator since it does not include information on the toxicity nor the chemical/physical properties of the ingredients studied. However, it gives much more information than just the comparison of the use of active ingredients since this indicator reflects efforts made in a cropping system to reduce overall pesticide use in either reducing the dose per treatment, the number of treatments or the treated area (Sattler et al., 2007)
It was not possible to find statistics on treatment frequency of pesticides in Brazil where the pesticide statistics available are foremost based on sales statistics reported by SINDAG whose information is given as sold quantity (commercial product and active ingredient) and sales value. Statistics are divided into herbicides, fungicides and insecticides and reported for individual crops. We collected the pesticide statistics from IEA, Instituto de Economia Agricola in São Paulo, that compile and publish Brazilian pesticide statistics every year. From this pesticide statistics it is not possible to obtain information on the specified use of separate active ingredients in individual crops, e.g. how much glyphosate is used in the soybean crop.
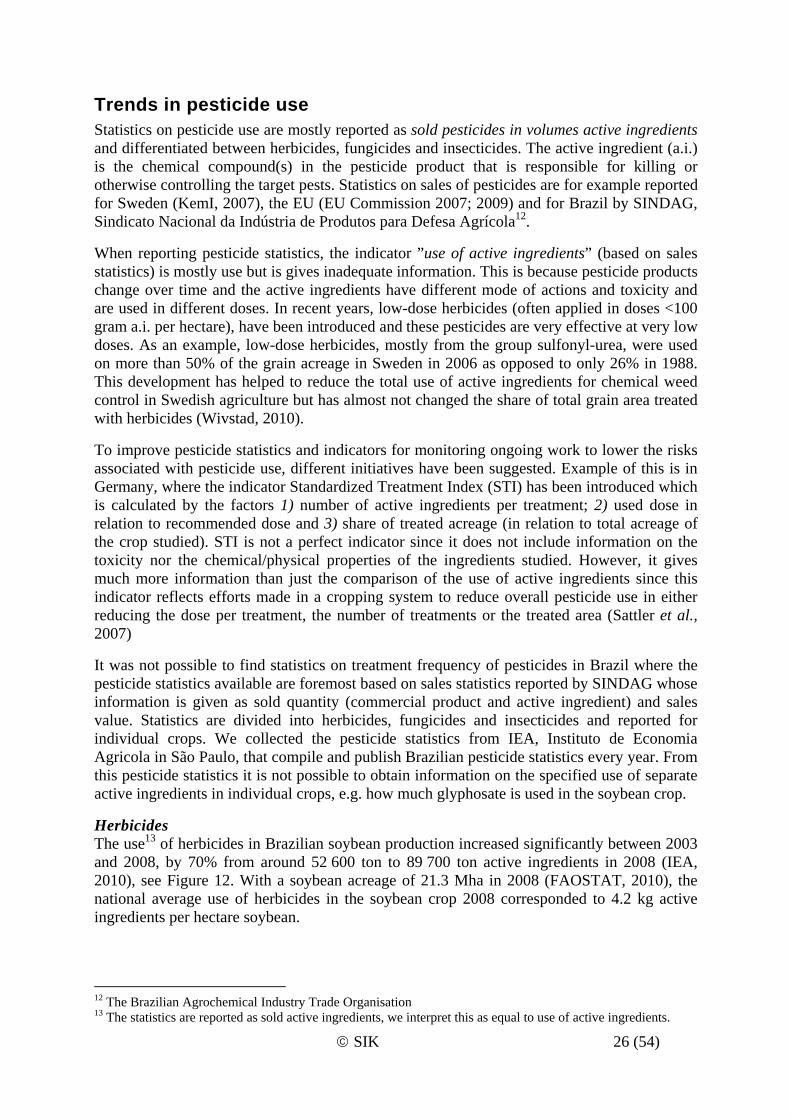
Herbicides The use13 of herbicides in Brazilian soybean production increased significantly between 2003 and 2008, by 70% from around 52 600 ton to 89 700 ton active ingredients in 2008 (IEA, 2010), see Figure 12. With a soybean acreage of 21.3 Mha in 2008 (FAOSTAT, 2010), the national average use of herbicides in the soybean crop 2008 corresponded to 4.2 kg active ingredients per hectare soybean.
12 The Brazilian Agrochemical Industry Trade Organisation 13 The statistics are reported as sold active ingredients, we interpret this as equal to use of active ingredients.
© SIK 27 (54)
Figure 12 Sales of herbicides (ton active ingredients) in Brazil 2003-2008, total and soybean crop (IEA, 2010)
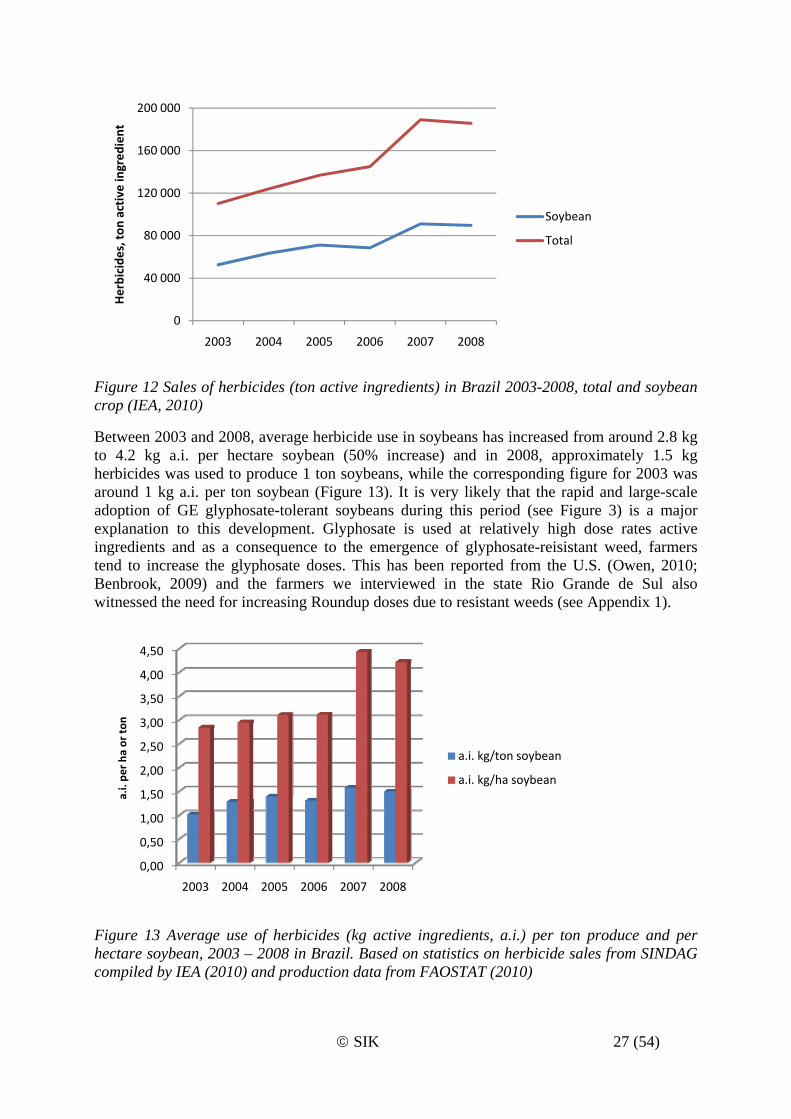
Between 2003 and 2008, average herbicide use in soybeans has increased from around 2.8 kg to 4.2 kg a.i. per hectare soybean (50% increase) and in 2008, approximately 1.5 kg herbicides was used to produce 1 ton soybeans, while the corresponding figure for 2003 was around 1 kg a.i. per ton soybean (Figure 13). It is very likely that the rapid and large-scale adoption of GE glyphosate-tolerant soybeans during this period (see Figure 3) is a major explanation to this development. Glyphosate is used at relatively high dose rates active ingredients and as a consequence to the emergence of glyphosate-reisistant weed, farmers tend to increase the glyphosate doses. This has been reported from the U.S. (Owen, 2010; Benbrook, 2009) and the farmers we interviewed in the state Rio Grande de Sul also witnessed the need for increasing Roundup doses due to resistant weeds (see Appendix 1).
Figure 13 Average use of herbicides (kg active ingredients, a.i.) per ton produce and per hectare soybean, 2003 – 2008 in Brazil. Based on statistics on herbicide sales from SINDAG compiled by IEA (2010) and production data from FAOSTAT (2010)
0
40 000
80 000
120 000
160 000
200 000
2003 2004 2005 2006 2007 2008
Herbicide
s, to
n active ingred
ient
Soybean
Total
0,00
0,50
1,00
1,50
2,00
2,50
3,00
3,50
4,00
4,50
2003 2004 2005 2006 2007 2008
a.i. pe
r ha
or ton
a.i. kg/ton soybean
a.i. kg/ha soybean
© SIK 28 (54)
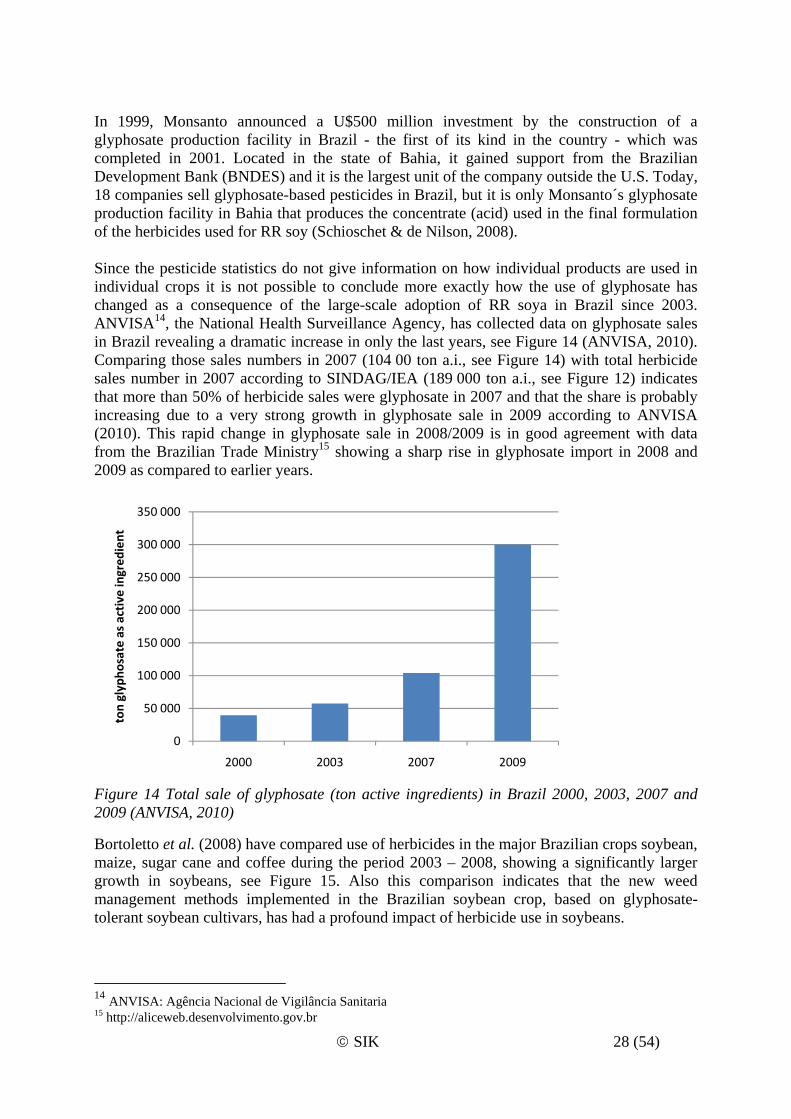
In 1999, Monsanto announced a U$500 million investment by the construction of a glyphosate production facility in Brazil - the first of its kind in the country - which was completed in 2001. Located in the state of Bahia, it gained support from the Brazilian Development Bank (BNDES) and it is the largest unit of the company outside the U.S. Today, 18 companies sell glyphosate-based pesticides in Brazil, but it is only Monsanto´s glyphosate production facility in Bahia that produces the concentrate (acid) used in the final formulation of the herbicides used for RR soy (Schioschet & de Nilson, 2008). Since the pesticide statistics do not give information on how individual products are used in individual crops it is not possible to conclude more exactly how the use of glyphosate has changed as a consequence of the large-scale adoption of RR soya in Brazil since 2003. ANVISA14, the National Health Surveillance Agency, has collected data on glyphosate sales in Brazil revealing a dramatic increase in only the last years, see Figure 14 (ANVISA, 2010). Comparing those sales numbers in 2007 (104 00 ton a.i., see Figure 14) with total herbicide sales number in 2007 according to SINDAG/IEA (189 000 ton a.i., see Figure 12) indicates that more than 50% of herbicide sales were glyphosate in 2007 and that the share is probably increasing due to a very strong growth in glyphosate sale in 2009 according to ANVISA (2010). This rapid change in glyphosate sale in 2008/2009 is in good agreement with data from the Brazilian Trade Ministry15 showing a sharp rise in glyphosate import in 2008 and 2009 as compared to earlier years.
Figure 14 Total sale of glyphosate (ton active ingredients) in Brazil 2000, 2003, 2007 and 2009 (ANVISA, 2010)
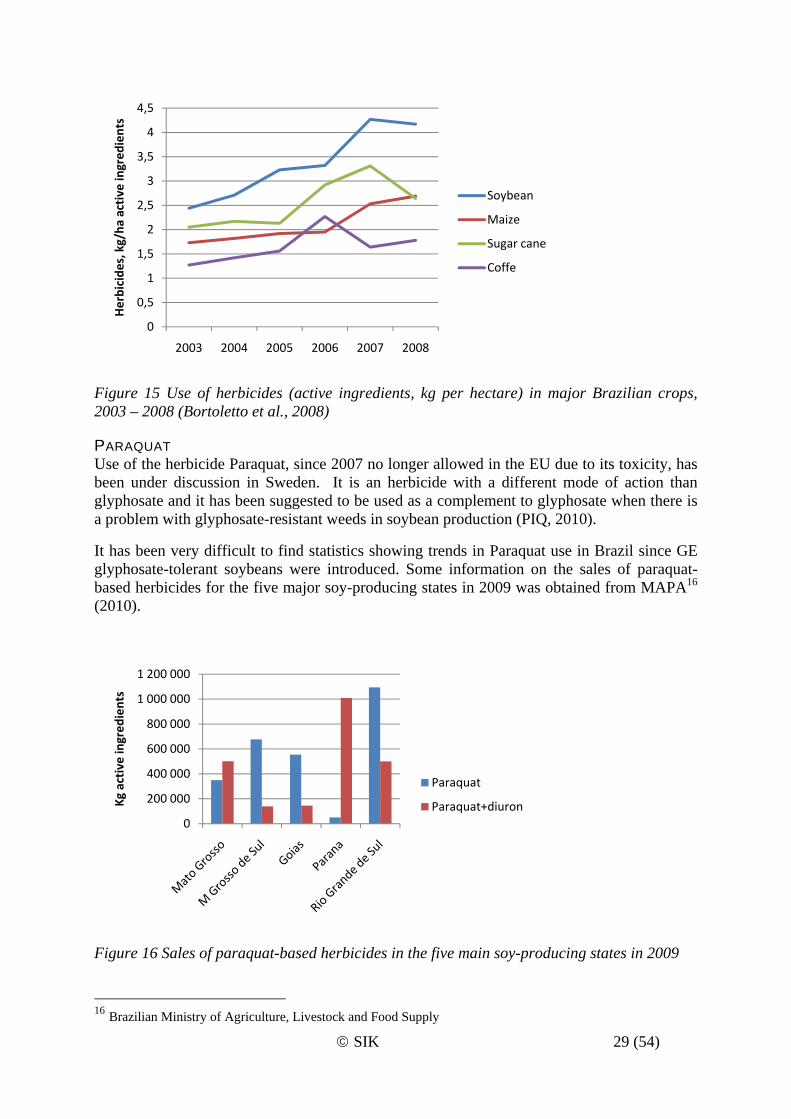
Bortoletto et al. (2008) have compared use of herbicides in the major Brazilian crops soybean, maize, sugar cane and coffee during the period 2003 – 2008, showing a significantly larger growth in soybeans, see Figure 15. Also this comparison indicates that the new weed management methods implemented in the Brazilian soybean crop, based on glyphosate-tolerant soybean cultivars, has had a profound impact of herbicide use in soybeans.
14 ANVISA: Agência Nacional de Vigilância Sanitaria 15 http://aliceweb.desenvolvimento.gov.br
0
50 000
100 000
150 000
200 000
250 000
300 000
350 000
2000 2003 2007 2009
ton glypho
sate as active ingred
ient
© SIK 29 (54)
Figure 15 Use of herbicides (active ingredients, kg per hectare) in major Brazilian crops, 2003 – 2008 (Bortoletto et al., 2008)
PARAQUAT Use of the herbicide Paraquat, since 2007 no longer allowed in the EU due to its toxicity, has been under discussion in Sweden. It is an herbicide with a different mode of action than glyphosate and it has been suggested to be used as a complement to glyphosate when there is a problem with glyphosate-resistant weeds in soybean production (PIQ, 2010).
It has been very difficult to find statistics showing trends in Paraquat use in Brazil since GE glyphosate-tolerant soybeans were introduced. Some information on the sales of paraquat-based herbicides for the five major soy-producing states in 2009 was obtained from MAPA16 (2010).
Figure 16 Sales of paraquat-based herbicides in the five main soy-producing states in 2009
16 Brazilian Ministry of Agriculture, Livestock and Food Supply
0
0,5
1
1,5
2
2,5
3
3,5
4
4,5
2003 2004 2005 2006 2007 2008
Herbicide
s, kg/ha
active ingred
ients
Soybean
Maize
Sugar cane
Coffe
0
200 000
400 000
600 000
800 000
1 000 000
1 200 000
Kg active ingred
ients
Paraquat
Paraquat+diuron
© SIK 30 (54)
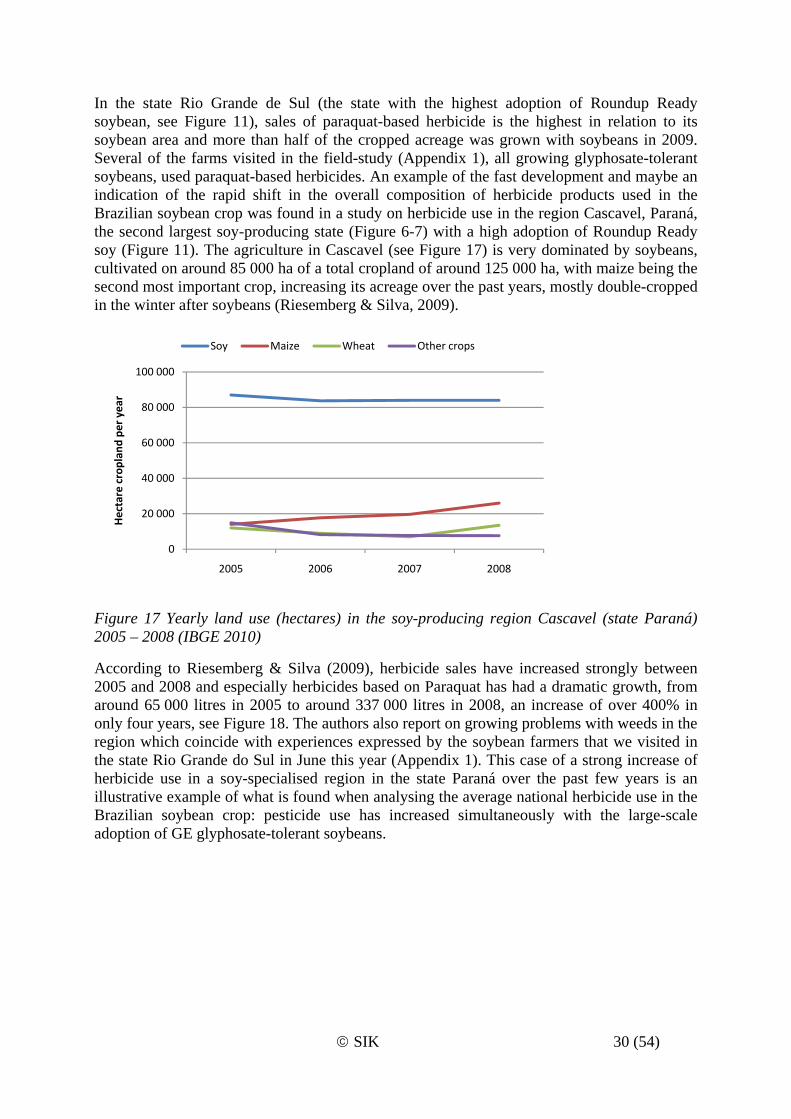
In the state Rio Grande de Sul (the state with the highest adoption of Roundup Ready soybean, see Figure 11), sales of paraquat-based herbicide is the highest in relation to its soybean area and more than half of the cropped acreage was grown with soybeans in 2009. Several of the farms visited in the field-study (Appendix 1), all growing glyphosate-tolerant soybeans, used paraquat-based herbicides. An example of the fast development and maybe an indication of the rapid shift in the overall composition of herbicide products used in the Brazilian soybean crop was found in a study on herbicide use in the region Cascavel, Paraná, the second largest soy-producing state (Figure 6-7) with a high adoption of Roundup Ready soy (Figure 11). The agriculture in Cascavel (see Figure 17) is very dominated by soybeans, cultivated on around 85 000 ha of a total cropland of around 125 000 ha, with maize being the second most important crop, increasing its acreage over the past years, mostly double-cropped in the winter after soybeans (Riesemberg & Silva, 2009).
Figure 17 Yearly land use (hectares) in the soy-producing region Cascavel (state Paraná) 2005 – 2008 (IBGE 2010)
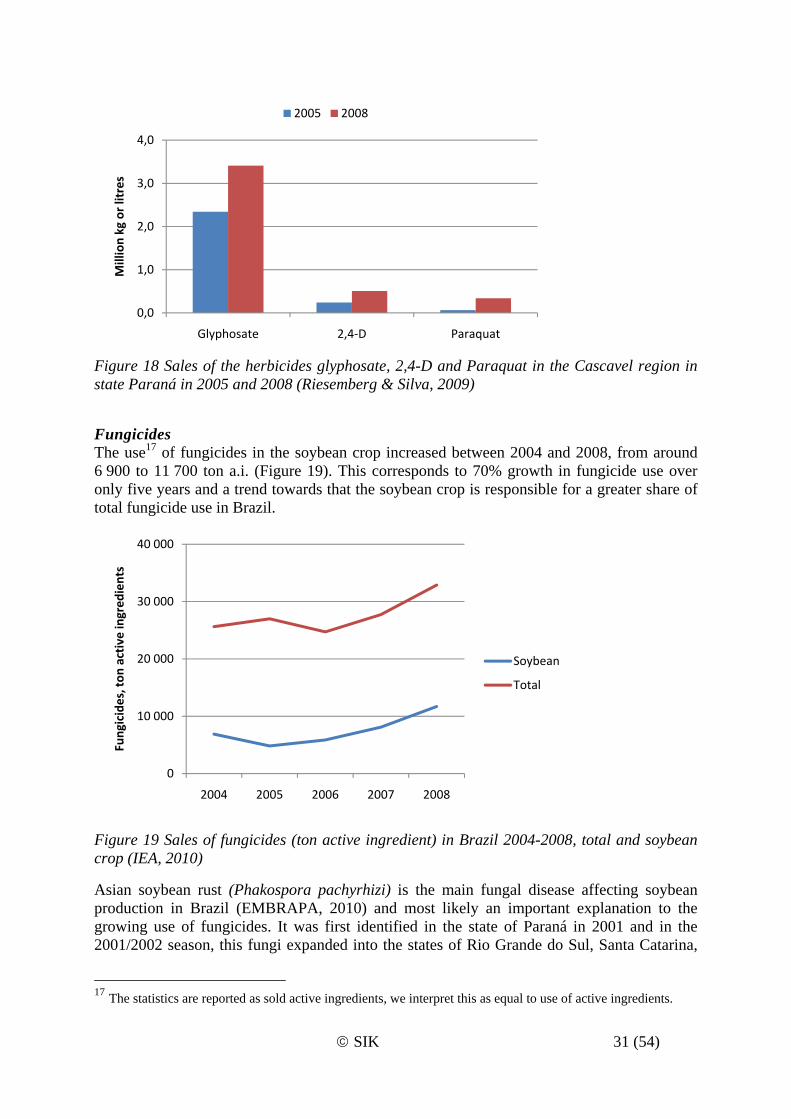
According to Riesemberg & Silva (2009), herbicide sales have increased strongly between 2005 and 2008 and especially herbicides based on Paraquat has had a dramatic growth, from around 65 000 litres in 2005 to around 337 000 litres in 2008, an increase of over 400% in only four years, see Figure 18. The authors also report on growing problems with weeds in the region which coincide with experiences expressed by the soybean farmers that we visited in the state Rio Grande do Sul in June this year (Appendix 1). This case of a strong increase of herbicide use in a soy-specialised region in the state Paraná over the past few years is an illustrative example of what is found when analysing the average national herbicide use in the Brazilian soybean crop: pesticide use has increased simultaneously with the large-scale adoption of GE glyphosate-tolerant soybeans.
0
20 000
40 000
60 000
80 000
100 000
2005 2006 2007 2008
Hectare croplan
d pe
r year
Soy Maize Wheat Other crops
© SIK 31 (54)
Figure 18 Sales of the herbicides glyphosate, 2,4-D and Paraquat in the Cascavel region in state Paraná in 2005 and 2008 (Riesemberg & Silva, 2009)
Fungicides The use17 of fungicides in the soybean crop increased between 2004 and 2008, from around 6 900 to 11 700 ton a.i. (Figure 19). This corresponds to 70% growth in fungicide use over only five years and a trend towards that the soybean crop is responsible for a greater share of total fungicide use in Brazil.
Figure 19 Sales of fungicides (ton active ingredient) in Brazil 2004-2008, total and soybean crop (IEA, 2010)
Asian soybean rust (Phakospora pachyrhizi) is the main fungal disease affecting soybean production in Brazil (EMBRAPA, 2010) and most likely an important explanation to the growing use of fungicides. It was first identified in the state of Paraná in 2001 and in the 2001/2002 season, this fungi expanded into the states of Rio Grande do Sul, Santa Catarina,
17 The statistics are reported as sold active ingredients, we interpret this as equal to use of active ingredients.
0,0
1,0
2,0
3,0
4,0
Glyphosate 2,4‐D Paraquat
Million kg or litres
2005 2008
0
10 000
20 000
30 000
40 000
2004 2005 2006 2007 2008
Fungicides, ton
active ingred
ients
Soybean
Total
© SIK 32 (54)
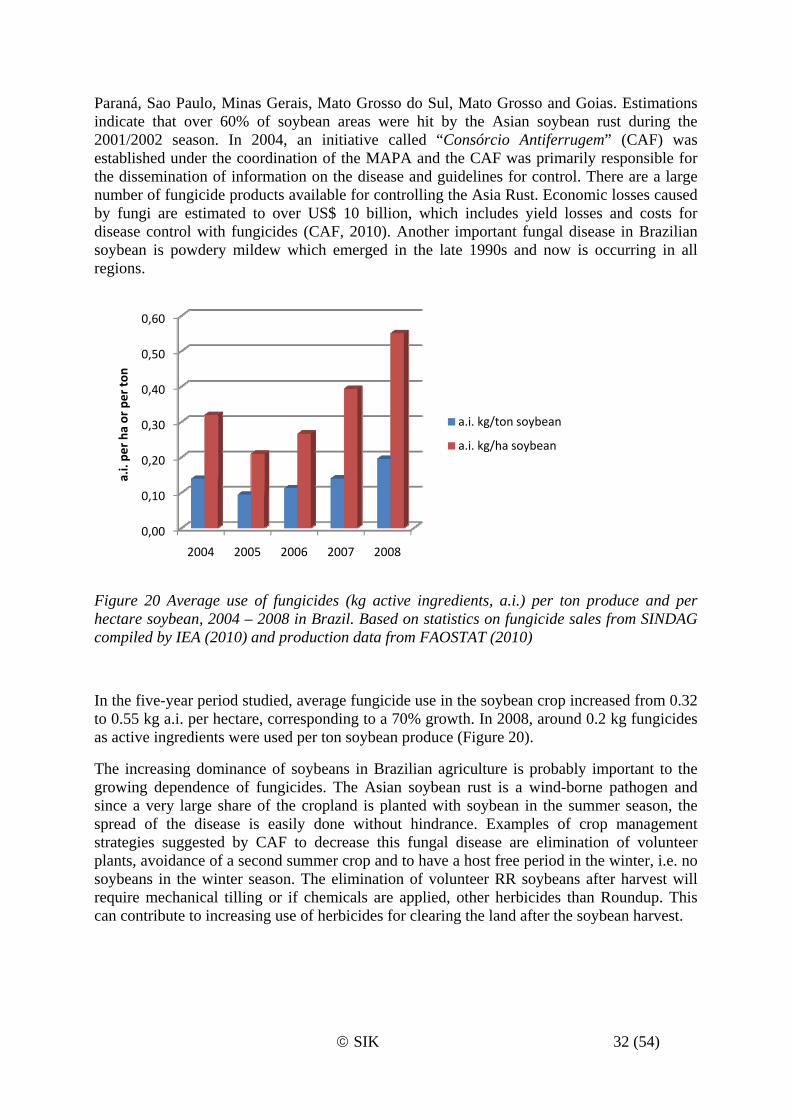
Paraná, Sao Paulo, Minas Gerais, Mato Grosso do Sul, Mato Grosso and Goias. Estimations indicate that over 60% of soybean areas were hit by the Asian soybean rust during the 2001/2002 season. In 2004, an initiative called “Consórcio Antiferrugem” (CAF) was established under the coordination of the MAPA and the CAF was primarily responsible for the dissemination of information on the disease and guidelines for control. There are a large number of fungicide products available for controlling the Asia Rust. Economic losses caused by fungi are estimated to over US$ 10 billion, which includes yield losses and costs for disease control with fungicides (CAF, 2010). Another important fungal disease in Brazilian soybean is powdery mildew which emerged in the late 1990s and now is occurring in all regions.
Figure 20 Average use of fungicides (kg active ingredients, a.i.) per ton produce and per hectare soybean, 2004 – 2008 in Brazil. Based on statistics on fungicide sales from SINDAG compiled by IEA (2010) and production data from FAOSTAT (2010)
In the five-year period studied, average fungicide use in the soybean crop increased from 0.32 to 0.55 kg a.i. per hectare, corresponding to a 70% growth. In 2008, around 0.2 kg fungicides as active ingredients were used per ton soybean produce (Figure 20).
The increasing dominance of soybeans in Brazilian agriculture is probably important to the growing dependence of fungicides. The Asian soybean rust is a wind-borne pathogen and since a very large share of the cropland is planted with soybean in the summer season, the spread of the disease is easily done without hindrance. Examples of crop management strategies suggested by CAF to decrease this fungal disease are elimination of volunteer plants, avoidance of a second summer crop and to have a host free period in the winter, i.e. no soybeans in the winter season. The elimination of volunteer RR soybeans after harvest will require mechanical tilling or if chemicals are applied, other herbicides than Roundup. This can contribute to increasing use of herbicides for clearing the land after the soybean harvest.
0,00
0,10
0,20
0,30
0,40
0,50
0,60
2004 2005 2006 2007 2008
a.i. pe
r ha
or pe
r ton
a.i. kg/ton soybean
a.i. kg/ha soybean
© SIK 33 (54)
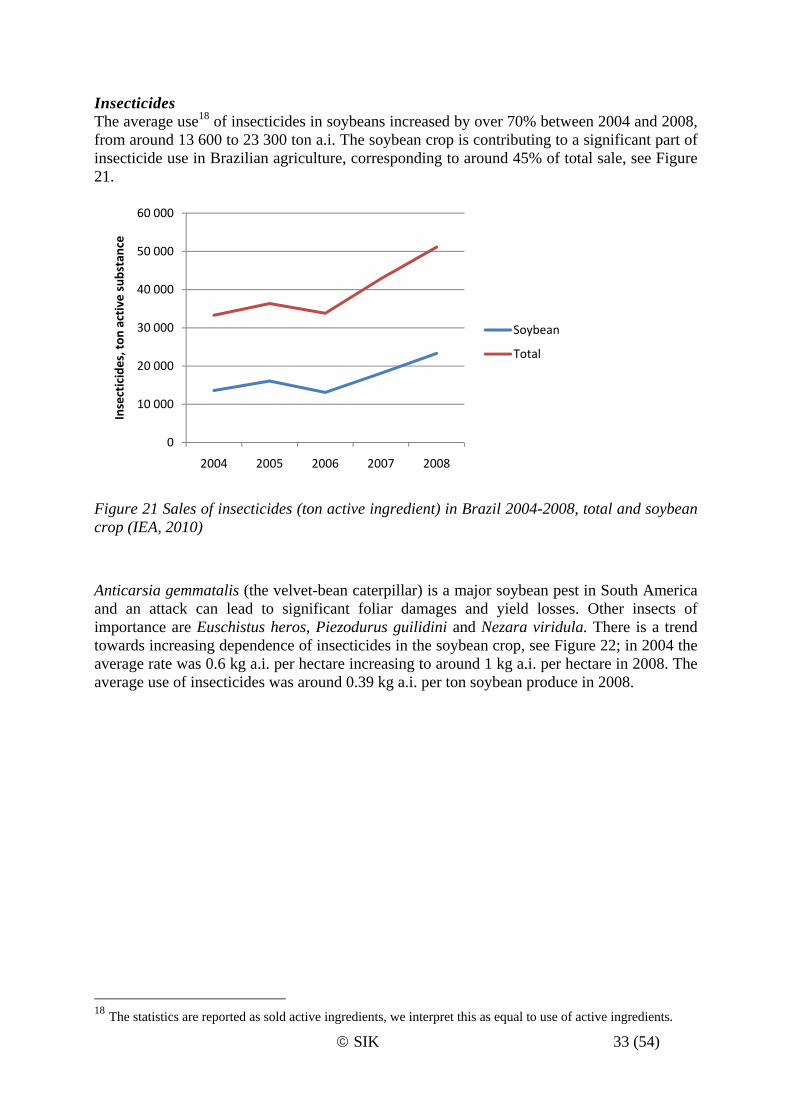
Insecticides The average use18 of insecticides in soybeans increased by over 70% between 2004 and 2008, from around 13 600 to 23 300 ton a.i. The soybean crop is contributing to a significant part of insecticide use in Brazilian agriculture, corresponding to around 45% of total sale, see Figure 21.
Figure 21 Sales of insecticides (ton active ingredient) in Brazil 2004-2008, total and soybean crop (IEA, 2010)
Anticarsia gemmatalis (the velvet-bean caterpillar) is a major soybean pest in South America and an attack can lead to significant foliar damages and yield losses. Other insects of importance are Euschistus heros, Piezodurus guilidini and Nezara viridula. There is a trend towards increasing dependence of insecticides in the soybean crop, see Figure 22; in 2004 the average rate was 0.6 kg a.i. per hectare increasing to around 1 kg a.i. per hectare in 2008. The average use of insecticides was around 0.39 kg a.i. per ton soybean produce in 2008.
18 The statistics are reported as sold active ingredients, we interpret this as equal to use of active ingredients.
0
10 000
20 000
30 000
40 000
50 000
60 000
2004 2005 2006 2007 2008
Insecticides, ton
active substance
Soybean
Total
© SIK 34 (54)
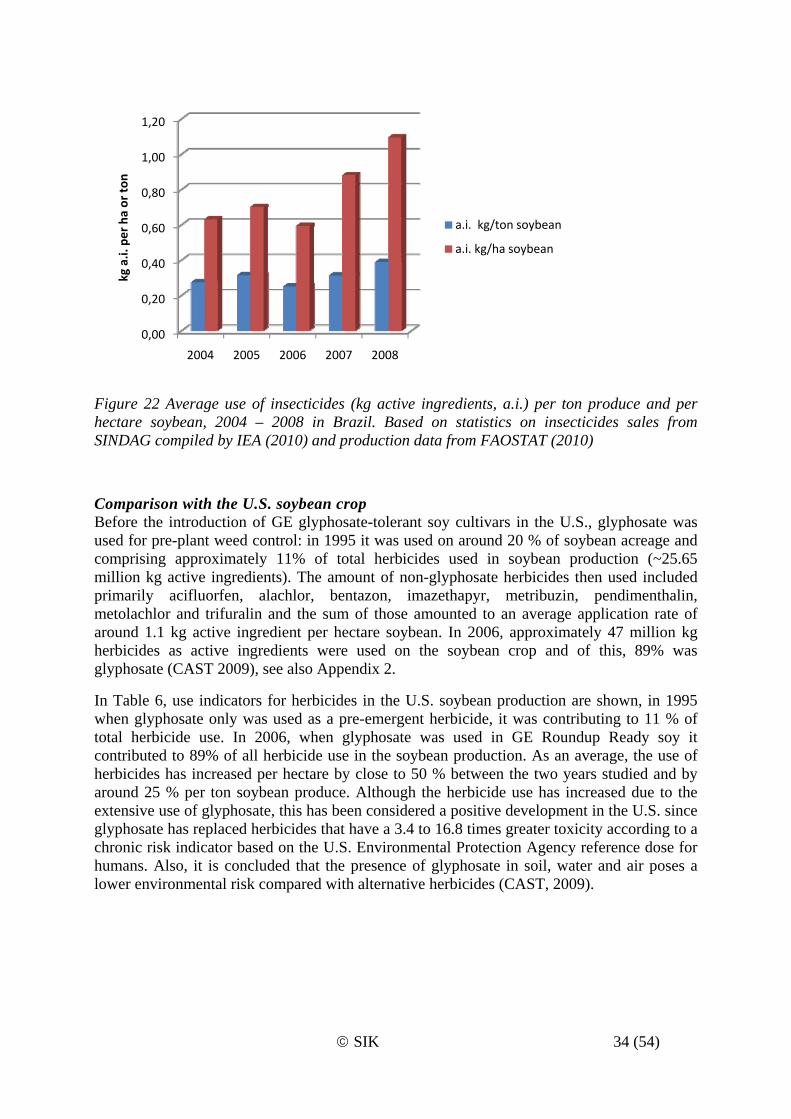
Figure 22 Average use of insecticides (kg active ingredients, a.i.) per ton produce and per hectare soybean, 2004 – 2008 in Brazil. Based on statistics on insecticides sales from SINDAG compiled by IEA (2010) and production data from FAOSTAT (2010)
Comparison with the U.S. soybean crop Before the introduction of GE glyphosate-tolerant soy cultivars in the U.S., glyphosate was used for pre-plant weed control: in 1995 it was used on around 20 % of soybean acreage and comprising approximately 11% of total herbicides used in soybean production (~25.65 million kg active ingredients). The amount of non-glyphosate herbicides then used included primarily acifluorfen, alachlor, bentazon, imazethapyr, metribuzin, pendimenthalin, metolachlor and trifuralin and the sum of those amounted to an average application rate of around 1.1 kg active ingredient per hectare soybean. In 2006, approximately 47 million kg herbicides as active ingredients were used on the soybean crop and of this, 89% was glyphosate (CAST 2009), see also Appendix 2.
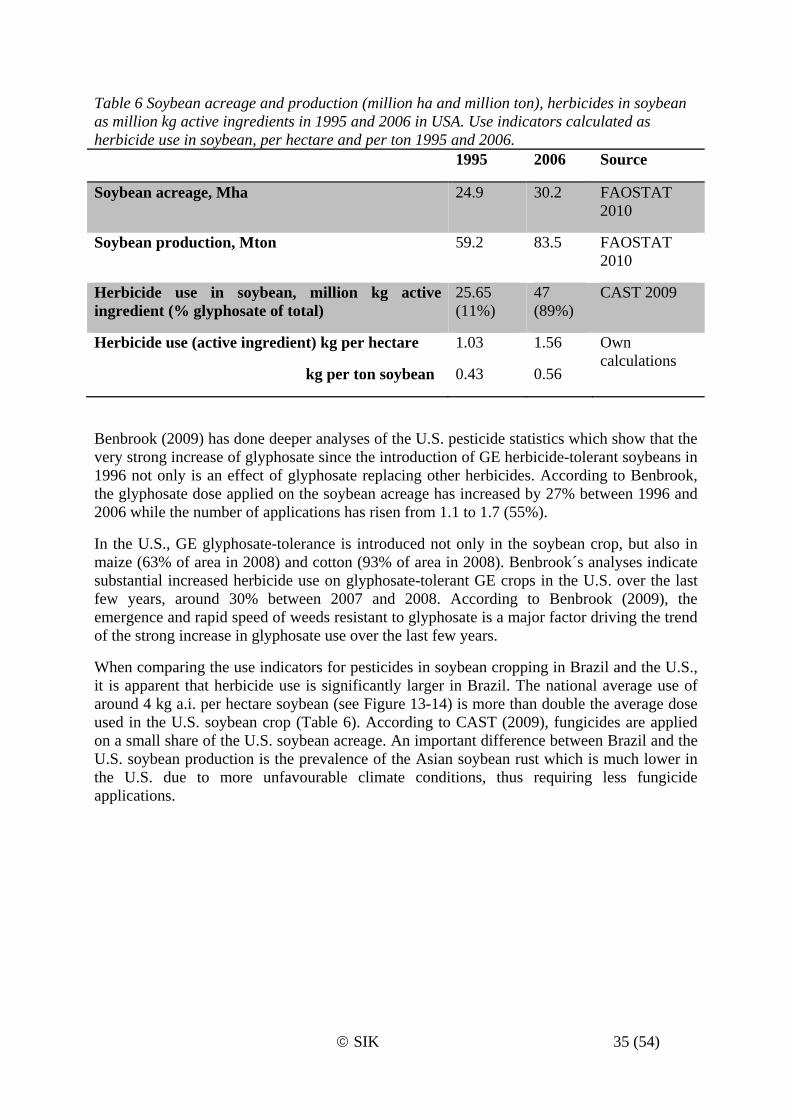
In Table 6, use indicators for herbicides in the U.S. soybean production are shown, in 1995 when glyphosate only was used as a pre-emergent herbicide, it was contributing to 11 % of total herbicide use. In 2006, when glyphosate was used in GE Roundup Ready soy it contributed to 89% of all herbicide use in the soybean production. As an average, the use of herbicides has increased per hectare by close to 50 % between the two years studied and by around 25 % per ton soybean produce. Although the herbicide use has increased due to the extensive use of glyphosate, this has been considered a positive development in the U.S. since glyphosate has replaced herbicides that have a 3.4 to 16.8 times greater toxicity according to a chronic risk indicator based on the U.S. Environmental Protection Agency reference dose for humans. Also, it is concluded that the presence of glyphosate in soil, water and air poses a lower environmental risk compared with alternative herbicides (CAST, 2009).
0,00
0,20
0,40
0,60
0,80
1,00
1,20
2004 2005 2006 2007 2008
kg a.i. per ha or ton
a.i. kg/ton soybean
a.i. kg/ha soybean
© SIK 35 (54)
Table 6 Soybean acreage and production (million ha and million ton), herbicides in soybean as million kg active ingredients in 1995 and 2006 in USA. Use indicators calculated as herbicide use in soybean, per hectare and per ton 1995 and 2006. 1995 2006 Source
Soybean acreage, Mha 24.9 30.2 FAOSTAT 2010
Soybean production, Mton 59.2 83.5 FAOSTAT 2010
Herbicide use in soybean, million kg active ingredient (% glyphosate of total)
25.65 (11%)
47 (89%)
CAST 2009
Herbicide use (active ingredient) kg per hectare
kg per ton soybean
1.03
0.43
1.56
0.56
Own calculations
Benbrook (2009) has done deeper analyses of the U.S. pesticide statistics which show that the very strong increase of glyphosate since the introduction of GE herbicide-tolerant soybeans in 1996 not only is an effect of glyphosate replacing other herbicides. According to Benbrook, the glyphosate dose applied on the soybean acreage has increased by 27% between 1996 and 2006 while the number of applications has risen from 1.1 to 1.7 (55%).
In the U.S., GE glyphosate-tolerance is introduced not only in the soybean crop, but also in maize (63% of area in 2008) and cotton (93% of area in 2008). Benbrook´s analyses indicate substantial increased herbicide use on glyphosate-tolerant GE crops in the U.S. over the last few years, around 30% between 2007 and 2008. According to Benbrook (2009), the emergence and rapid speed of weeds resistant to glyphosate is a major factor driving the trend of the strong increase in glyphosate use over the last few years.
When comparing the use indicators for pesticides in soybean cropping in Brazil and the U.S., it is apparent that herbicide use is significantly larger in Brazil. The national average use of around 4 kg a.i. per hectare soybean (see Figure 13-14) is more than double the average dose used in the U.S. soybean crop (Table 6). According to CAST (2009), fungicides are applied on a small share of the U.S. soybean acreage. An important difference between Brazil and the U.S. soybean production is the prevalence of the Asian soybean rust which is much lower in the U.S. due to more unfavourable climate conditions, thus requiring less fungicide applications.
© SIK 36 (54)
Concluding remarks For a period of only a little more than ten years, weed management in world´s soybean fields has changed profoundly as a consequence of the rapid adoption of the new cultivation technique combining GE glyphosate-tolerant cultivars and no-tillage. Today, over 85% of soybean acreage in the three major producing countries (USA, Brazil and Argentina) is cultivated with genetically modified cultivars, foremost Roundup Ready soy. There are no signs that this new weed management technique has resulted in a general reduction of herbicide use in soybeans. In fact, pesticide statistics from the U.S. and Brazil instead point at the opposite. Herbicide use has increased subsequently to the large-scale shift to this new cultivation technique including GE glyphosate-tolerant soy cultivars which involves a very high reliance on one single herbicide, glyphosate. The major cause for the increasing use of herbicides in soybeans is the rapid evolvement of glyphosate-resistant weeds in GE glyphosate-tolerant crops (foremost soybean, maize and cotton) and this development disqualifies earlier claims that glyphosate could be used as (almost) the sole herbicide to manage weed in GE glyphosate-tolerant crop systems. According to Waltz (2010), Monsanto had an aggressive market campaign in the late 1990s, saying that weeds would not develop resistance to glyphosate if the herbicide was used in right time and at the right rate. To qualify for the company´s Roundup Reward´s program (a kind of warrantee for crops) at that time, U.S. growers could only use Roundup and certain approved herbicides on Roundup Ready crops. The qualifications for Monsanto´s rewards program has since changed and in autumn 2010, the company launched the Roundup Ready Plus program, paying growers to apply additional herbicides besides glyphosate to hamper the emerging weed-resistant problem. This very different attitude from Monsanto, which has occurred in a period of only some ten years, is a striking sign of the seriousness of the problem with glyphosate-resistant weeds. The total dominance of the new weed management technique in world soybean production, based on GE glyphosate-tolerant cultivars, has not only contributed to a rapid emergence of glyphosate-resistant weeds. Also, the development of novel herbicides with different mode of actions has slowed substantially in recent years because of little market incentives for companies to discover new herbicides due to the near-monopoly use of glyphosate in GE herbicide-tolerant soybeans (CAST, 2009). The biotech industry response to the problem is now to develop a new generation of GE crops where glyphosate-tolerant cultivars are being engineered to have additional resistance traits introduced in the crop´s genome, see also Table 3 (Waltz 2010). These additional gene inserts will confer resistance to old herbicides, most importantly 2,4-D and dicamba. Mortenssen (2010) estimates that these new multi-herbicide-tolerant cultivars can lead to an increase in herbicide use in the U.S. soybean crop of around 70% in a relatively short time. Due to the absence of newly developed herbicides, a significant proportion of the projected increased herbicide use will be older, less environmentally benign compounds (Mortenssen, 2010). Also in South America, the risk of a growing use and dependence of old and more toxic herbicides as a consequence of the evolving problem of glyphosate-resistant weeds is obvious. However, the potential development in Brazil and Argentina is less analysed than in the U.S. as there are less data and statistics available on trends in pesticide use in South America. For example, in this study we could not find consistent national statistics on how the use of Paraquat-based herbicides has developed in Brazil subsequent to the large-scale adoption of GE glyphosate-tolerant soybeans but there are indications that the use of Paraquat will increase as a consequence of the development of glyphosate-resistant weeds. Concerning this
© SIK 37 (54)
particular substance, there is an obvious double standard of morality worth calling attention to. Paraquat has not been allowed to use in the EU since 2007 due to its acute toxicity and European farm workers and environment thus now avoid the exposure to this toxic chemical. In the last few years, European exports of Paraquat dichloride to Brazil have developed from zero in 2007 to 2.8 million kg in 2008 and 6.6 million kg in 200919. Since the EU is one of the major importers of Brazilian soy products, European protein feed suppliers, not making demands on the use of toxic chemicals in their feed supply chain, can continue to benefit from relatively cheap soymeal while the risks of handling and using chemicals such as Paraquat, are transferred away from European farm-workers and environment to the other side of the Atlantic Ocean. The growing use of Paraquat is also noteworthy as it is one of 14 substances that ANVISA recently planned to re-evaluate, a process that was stopped due to court decisions, supposedly base on files from the chemical industry. The soybean fields in the Americas are the pre-dominant protein source for world´s pork and poultry production. Successful weed management is important for soybean yields and choices of cultivation technique affect important environmental impacts such as soil erosion and pesticide residuals in soil, water and air. As the soybean crop is significant and strategic for present and future food production, it is a general interest that weed control systems are developed for long-term sustainability, securing stable yield levels and minimizing environmental impact. Also the herbicide glyphosate, regarded as the world´s most important herbicide, must be used in a responsible way ensuring its long-term effect in future weed control. The rapid and large-scale adoption of GE glyphosate-tolerant soybeans has led to consequences that can threaten long-term sustainability in soybean weed management. The almost exclusive use of one single herbicide has in short time led to the evolving of several glyphosate-resistant weed species, many of which are troublesome weeds in agriculture. Development of weed management methods in the soybean crop during the last 20 years has had a one-sided focus on the GE technique and glyphosate as the single herbicide. This has prevented the progress of new herbicides that now are needed to control problem-weeds and address the weed resistance concerns. In the U.S., few non-GE soy varieties are being developed by the seed companies since the growers´ demand have foremost been for GE glyphosate-tolerant varieties.
Herbicide resistant weeds can evolve when there is insufficient diversity in weed management systems. Diversity in weed control methods includes herbicides of different mode of actions, some tillage operations, better crop rotations, use of cover crops etc. Present overall dominance of one single weed management technique in world soybean production – glyphosate dominance in GE glyphosate-tolerant cultivars combined with no- or low-tillage – is not beneficial for a diversity of cultivation techniques in soybean crops. This is a well-motivated argument for why also alternative cropping systems, conventional and organic, should be developed for future soybean production.
19 Ministry of Development, Industry and Foreign Trade of Brazil (MDIC), Siscomex & AliceWeb. Available at <http://www.mdic.gov.br/sitio/interna/interna.php?area=5&menu=607>

© SIK 38 (54)
© SIK 39 (54)
References ANVISA (2010) Statistics and information available at: <http://portal.anvisa.gov.br>
Assad E D, Marin F R, Evangelista S R, Pilau F G, Farias J R B, Pinto H S, Júnior J Z (2007) Sistema de previsão da safra de soja para o Brasil (Forecast system of soybean crop yield in Brazil). Pesq. agropec. bras. Brasília, 42(5):615-625, May 2007. Benbrook, C (2004) Genetically Engineered Crops and Pesticide Use in the United States: The First Nine Years. BioTech InfoNet Technical Paper Number 7, October 2004. Available at: <http://www.biotech-info.net/Full_version_first_nine.pdf> Benbrook, C (2009) Impacts of Genetically Engineered Crops on Pesticide Use: The First Thirteen Years. The Organic Center, Colorado, USA. Available at: <http://www.organic-center.org/science.pest.php?action=view&report_id=159> Bickel U (2004) Brasil: Expansão da Soja, Conflitos Sócio-Ecológicos e Segurança Alimentar (Brazil: Soybean expansion, social and environmental conflicts and food security). Faculty of Agronomy, Bonn University. Available at: <http://assets.panda.org/downloads/tese_expansao_soja_brasil2004_by_bickel.pdf> Bindraban P S, Franke A C, Ferrar D O, Ghersa C M, Lotz L A P, Nepomuceno A, Smulders M J M, van de Wiel C C M (2009) GM-related sustainability: agro-ecological impacts, risks and opportunities of soy production in Argentina and Brazil. Plant Research International, Wageningen UR, Wageningen, the Netherlands. Bortoletto F S, Trombeta N C, Neves E M. 2009. Agricultural chemicals in Brazil: Growth rate and relative demand by herbicides 1999-2008. Escola Superior de Agricultura de Queiroz (ESALQ) and Universidade de São Paulo(USP). Available at <www.usp.br/siicusp/Resumos/17Siicusp/resumos/2456.pdf>
CAF (2010) Information available at: <www.consorcioantiferrugem.net> Carpenter J, Gianessi L (1999) Why U.S. Farmers are Adopting Genetically Modified Crops. Economic Perspectives 4(4): 20-23. CAST (2009) Sustainability of U.S. Soybean Production: Conventional, Transgenic and Organic Production Systems. Special Publication No.30, CAST - Council for Agricultural Science and Technology, Ames, Iowa, USA. ISBN 978-1-887383-32-5 Cerdeira A L, Duke S O (2006) The current status and environmental impacts of glyphosate-resistant crops: A review. J. Environ. Qual. 35:1633–1658. CONAB (2010) Brazilian Crop Assessment. Forth Estimate. January 2010. Available at: <http://www.conab.gov.br/conabweb/> de Almeida G L, Schmitt G C, de Bairros A V, Emanuelli T, Garcia S C (2007) Os riscos e danos nas intoxicações por paraquat em animais domésticos (The risk and injuries of paraquat intoxication in domestic animals). Cienc Rural 37:5, Santa Maria Sept/Oct 2007. Available at: <http://www.scielo.br/scielo.php?pid=s0103-84782007000500051&script=sci_arttext>
© SIK 40 (54)
de Castro B S (2008) A introdução no Brasil do algodão, milho e soja geneticamente modificados: coincidências reveladoras (The introduction in Brazil of genetically modified cotton, corn and soybeans: revealing coincidences). Paper presented at the IX Congress BRASA - Tulane University, NewOrleans, USA. Available at: <http://sitemason.vanderbilt.edu/files/iD6Qxi/Castro%20Bianca%20Scarpeline.pdf> Duke S O, Powles S B (2009) Glyphosate-resistant crops and weeds: Now and in the future. AgBioForum 12(3-4):346-357. Available at: <http://www.agbioforum.org> EMBRAPA (2004) Tecnologias de Produção de Soja Região Central do Brasil 2004 (Soybean Production Technology in the central region of Brazil 2004) Available at: <http://www.cnpso.embrapa.br/producaosoja/index.htm> EMBRAPA (2010) Cronologia do embargo judicial (Chronology of the judicial embargo) Available at <www.cnpso.embrapa.br/download/cronologia_sojarr.pdf>
EC (2007) The use of plant protection products in the European Union. Data 1992-2003. Eurostat Statistical books <http://epp.eurostat.ec.europa.eu/cache/ITY_OFFPUB/KS-76-06-669/EN/KS-76-06-669-EN.PDF>
EC (2009) Europe in figures. Eurostat yearbook 2009. Eurostat Statistical books. <http://epp.eurostat.ec.europa.eu/portal/page/portal/product_details/publication?p_product_code=KS-CD-09-001>
FAOSTAT (2010) Statistics available at < http://faostat.fao.org/> FEBRAPDP (2010) Information available at <http://www.febrapdp.org.br/>
Flaskerud G (2003) Brazil’s Soybean Production and Impact. EB-79, North Dakota State University Extension Service, North Dakota, USA. Gerber P et al (2010) Greenhouse gas emissions from the dairy sector. Food and Agriculture Organization, Rome, Italy. Gijs A, Kleter GA, Harris C, Stephenson, G Unsworth J (2008) Comparison of herbicide regimes and the associated potential environmental effects of glyphosate-resistant crops versus what they replace in Europe. Pest Manag Sci 64:479–488. GM Soy Debate (2009) An analysis of twelve claims about GM soy. Available at: http://gmsoydebate.global-connections.nl/ Goedert W J (1983) Management of the Cerrado soils of Brazil: a review. Journal of Soil Science 34(3):405 – 428. IBGE (2010) Statistics available at http://www.sidra.ibge.gov.br/
IEA (2010) Defensivos Agrícolas: expectativas de aumento nas vendas em 2010 (Pesticides: expectations of higher sales in 2010). Análises e Indicadores do Agronegócio. V.5 N.7. Julio 2010. Instituto de Economia Agrícola, IEA, São Paulo, Brazil. ISSN 1980-0711. Available at: <http://www.iea.sp.gov.br/out/LerTexto.php?codTexto=11951> (latest report, earlier reports also available at the IEA website)
© SIK 41 (54)
James C (2003 – 2009) Global status of commercialized transgenic crops. International Service for the Acquisition of Agri-biotech Applications, ISAAA. Available at <http://www.isaaa.org/> KemI (2009) Försålda kvantiteter av bekämpningsmedel 2008 (Pesticide sales in 2008). Kemikalieinspektionen, Sundbyberg, Sweden. Lazzari M R (2006) Agropecuária gaúcha em 2005: estiagem, câmbio e crise (Agriculture in 2005: drought, change and crisis). Indicadores Econômicos FEE, Porto Alegre, 33(4):41-50 MAPA (2007) Cadeia Produtiva do Milho (Maize supply chain) Ministério da Agricultura, Pecuária e Abastecimento (Coord) L A Pinazza. Brasília. Available at: <http://www.iica.org.br/Docs/CadeiasProdutivas/Cadeia%20Produtiva%20do%20Milho.pdf>
MAPA (2010) Ministério da Agricultura, Pecuária e Abastecimento. Information available at: <http://extranet.agricultura.gov.br/agrofit_cons/principal_agrofit_cons>
Monsanto Company (2010) Information available at: <www.monsanto.com>
Mortensen D A (2010) Written Statement Prepared for the Domestic Policy Subcommitte of the Oversight and Government Reform Committee, 28 July, Available at: <http://oversight.house.gov/index.php?option=com_content&task=view&id=5054&Itemid=31> Owen M D K (2010) Herbicide-resistant weeds in genetically engineered crops. Statement given for the Domestic Policy Subcommitte of the Oversight and Government Reform Committee, 28 July, 2010. Available at: <http://oversight.house.gov/index.php?option=com_content&task=view&id=5054&Itemid=31> PIQ (Paraquat Information Center) (2010) Information available at http://paraquat.com/ Powles, S B (2008) Review Evolved glyphosate-resistant weeds around the world: lessons to be learnt. Pest Manag Sci 64:360-365. Riesemberg A, Silva M (2009) Nota Técnica: Reflexos Associados ao Cultivo de Plantas Trangênicas no Estados Paraná (Technical Note: Effects associated with the cultivation of transgenic plants in the state of Paraná. Report from SEAB, Department of Agriculture and Supply in Paraná. Sattler C, Kächele H, Verch G (2007) Assessing the intensity of pesticide use in agriculture. Agric, Ecosyst & Environ 119, 299-304.
Schioschet T and de Nilson P (2008) GM soy in Brazil: limits to the technological dissemination process. Estud.soc.agric (online) vol 4, selected edition. Available at <http://socialsciences.scielo.org/scielo.php?pid=S141305802008000100005&script=sci_arttext> SINDAG (2010) Sindicato Nacional da Indústria de Produtos para Defesa Agrícola

© SIK 42 (54)
Information available at: <http://www.sindag.com.br/> SOY STATS (2010) Statistics available at: www.soystats.com Steinfeld H et al. (2006) Livestock´s Long Shadow: Environmental issues and options Food and Agriculture Organization, Rome.
Vendrametto L P and Bonilla S H (2009) Contribuições da Contabilidade Ambiental em Emergia para a Compreensão do Sistema de Produção da Soja na Perspectiva da Agricultura Sustentável (Contributions of Environmental Accounting in Emergy for Understanding the Soybean Production System in the Perspective of a Sustainable Agriculture). International Workshop Advances in Cleaner Production). Key Elements for a Sustainable World, Energy, Water and Climate Change. São Paulo – Brazil – May 20th-22nd – 2009. Available at: <http://www.advancesincleanerproduction.net/second/files/sessoes/6a/3/L.%20P.%20Vendrametto%20-%20Resumo%20Exp.pdf> Vila-Aiub M M, Vidal R A, Balbi M C, Gundel P E, Trucco F, Ghersa C M (2008) Glyphosate-resistant weeds of South American cropping systems: an overview. Pest Manag Sci 64:366–371. Waltz E (2010) Glyphosate resistance threatens Roundup hegemony. Nature Biotechnology 28:537-538. Weed Science (2010) Information available at <www.weedscience.org> Wivstad M (2010) Klimatförändringarna – en utmaning för jordbruket och giftfri miljö (Climate change – a challenge to agriculture and toxic-free environment) Kemikalieinspektionen, Solna, Sweden
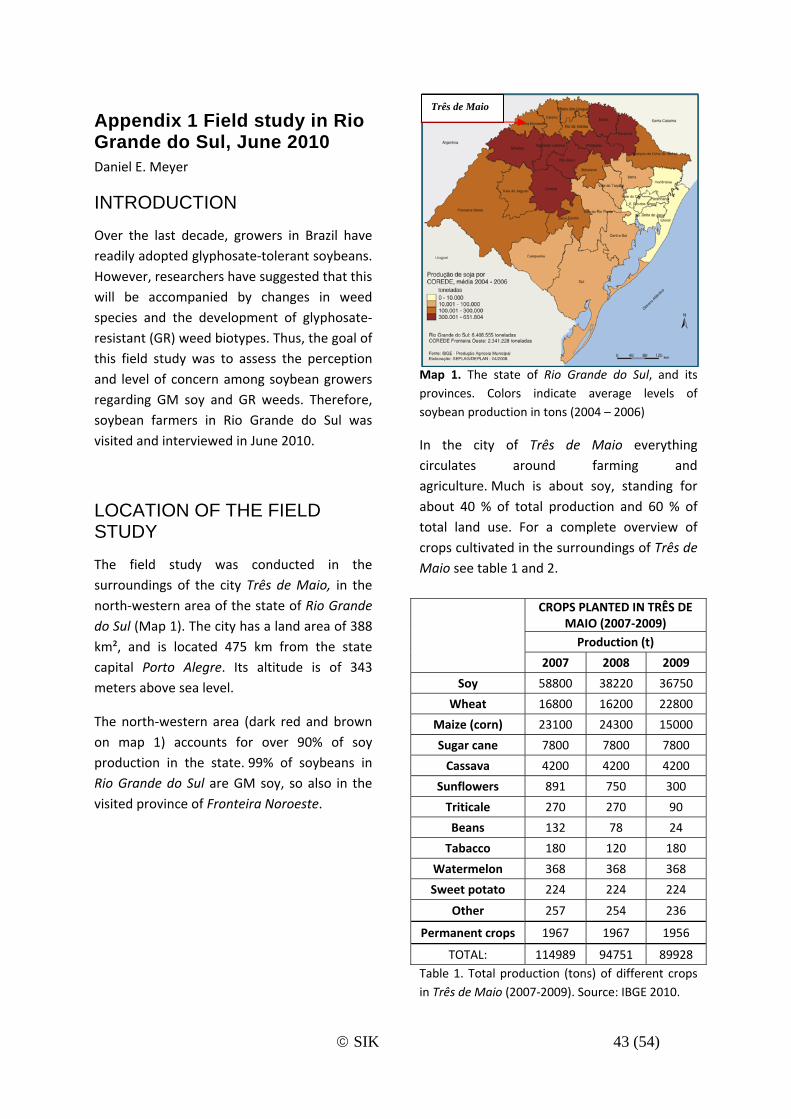
© SIK 43 (54)
Appendix 1 Field study in Rio Grande do Sul, June 2010 Daniel E. Meyer
INTRODUCTION
Over the last decade, growers in Brazil have readily adopted glyphosate‐tolerant soybeans. However, researchers have suggested that this will be accompanied by changes in weed species and the development of glyphosate‐resistant (GR) weed biotypes. Thus, the goal of this field study was to assess the perception and level of concern among soybean growers regarding GM soy and GR weeds. Therefore, soybean farmers in Rio Grande do Sul was visited and interviewed in June 2010.
LOCATION OF THE FIELD STUDY
The field study was conducted in the surroundings of the city Três de Maio, in the north‐western area of the state of Rio Grande do Sul (Map 1). The city has a land area of 388 km², and is located 475 km from the state capital Porto Alegre. Its altitude is of 343 meters above sea level.
The north‐western area (dark red and brown on map 1) accounts for over 90% of soy production in the state. 99% of soybeans in Rio Grande do Sul are GM soy, so also in the visited province of Fronteira Noroeste.
Map 1. The state of Rio Grande do Sul, and its provinces. Colors indicate average levels of soybean production in tons (2004 – 2006)
In the city of Três de Maio everything circulates around farming and agriculture. Much is about soy, standing for about 40 % of total production and 60 % of total land use. For a complete overview of crops cultivated in the surroundings of Três de Maio see table 1 and 2.
CROPS PLANTED IN TRÊS DE MAIO (2007‐2009) Production (t)
2007 2008 2009
Soy 58800 38220 36750
Wheat 16800 16200 22800
Maize (corn) 23100 24300 15000
Sugar cane 7800 7800 7800
Cassava 4200 4200 4200
Sunflowers 891 750 300
Triticale 270 270 90
Beans 132 78 24
Tabacco 180 120 180
Watermelon 368 368 368
Sweet potato 224 224 224
Other 257 254 236
Permanent crops 1967 1967 1956
TOTAL: 114989 94751 89928 Table 1. Total production (tons) of different crops in Três de Maio (2007‐2009). Source: IBGE 2010.
Três de Maio
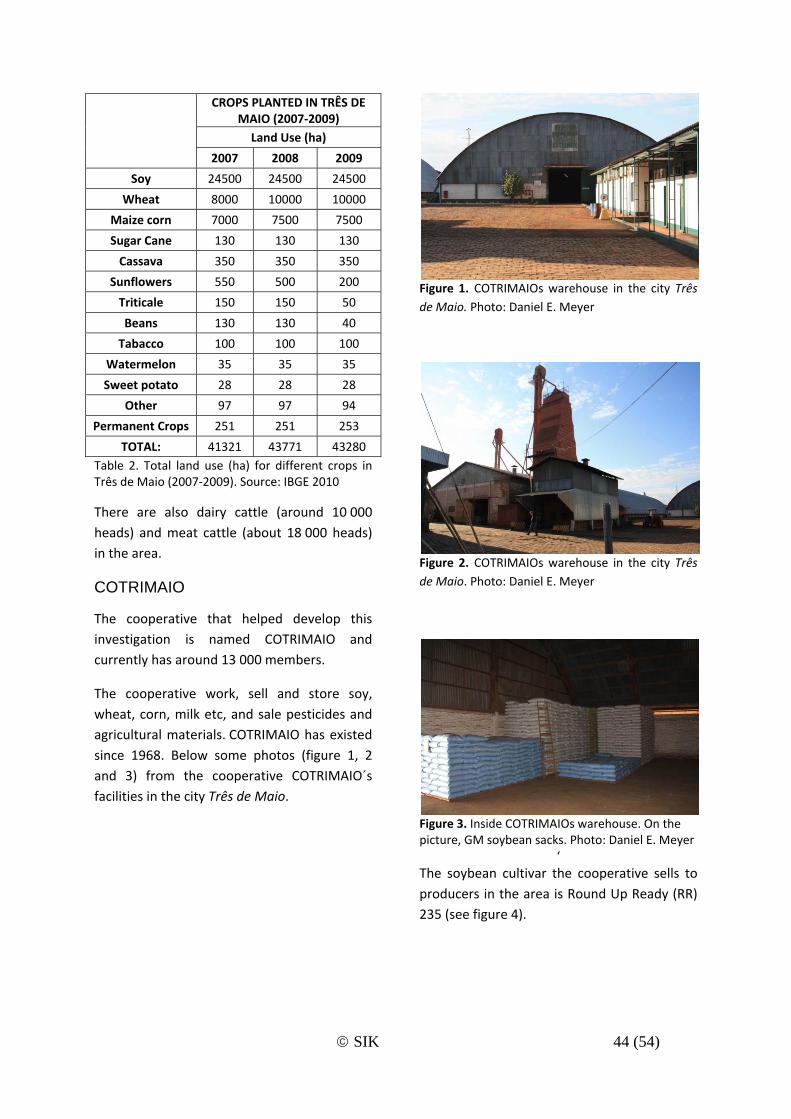
© SIK 44 (54)
CROPS PLANTED IN TRÊS DE MAIO (2007‐2009) Land Use (ha)
2007 2008 2009
Soy 24500 24500 24500
Wheat 8000 10000 10000
Maize corn 7000 7500 7500
Sugar Cane 130 130 130
Cassava 350 350 350
Sunflowers 550 500 200
Triticale 150 150 50
Beans 130 130 40
Tabacco 100 100 100
Watermelon 35 35 35
Sweet potato 28 28 28
Other 97 97 94
Permanent Crops 251 251 253
TOTAL: 41321 43771 43280 Table 2. Total land use (ha) for different crops in Três de Maio (2007‐2009). Source: IBGE 2010
There are also dairy cattle (around 10 000 heads) and meat cattle (about 18 000 heads) in the area.
COTRIMAIO
The cooperative that helped develop this investigation is named COTRIMAIO and currently has around 13 000 members.
The cooperative work, sell and store soy, wheat, corn, milk etc, and sale pesticides and agricultural materials. COTRIMAIO has existed since 1968. Below some photos (figure 1, 2 and 3) from the cooperative COTRIMAIO´s facilities in the city Três de Maio.
Figure 1. COTRIMAIOs warehouse in the city Três de Maio. Photo: Daniel E. Meyer
Figure 2. COTRIMAIOs warehouse in the city Três de Maio. Photo: Daniel E. Meyer
Figure 3. Inside COTRIMAIOs warehouse. On the picture, GM soybean sacks. Photo: Daniel E. Meyer
‘ The soybean cultivar the cooperative sells to producers in the area is Round Up Ready (RR) 235 (see figure 4).
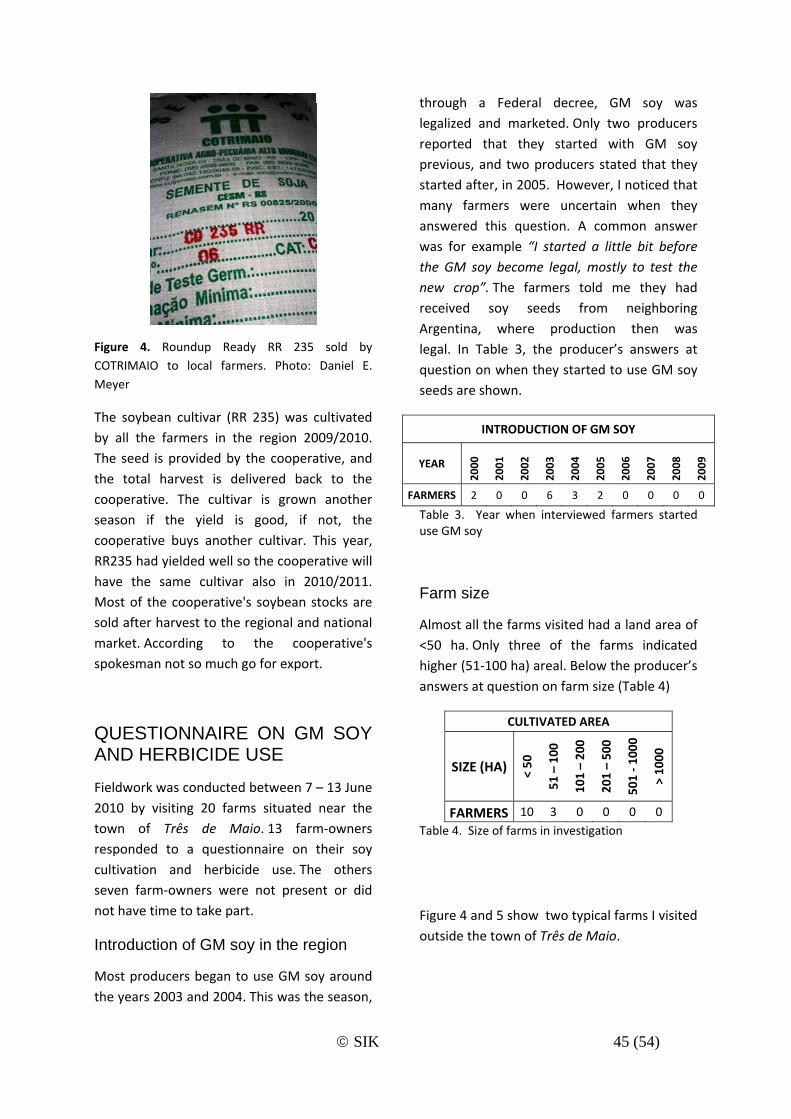
© SIK 45 (54)
Figure 4. Roundup Ready RR 235 sold by COTRIMAIO to local farmers. Photo: Daniel E. Meyer
The soybean cultivar (RR 235) was cultivated by all the farmers in the region 2009/2010. The seed is provided by the cooperative, and the total harvest is delivered back to the cooperative. The cultivar is grown another season if the yield is good, if not, the cooperative buys another cultivar. This year, RR235 had yielded well so the cooperative will have the same cultivar also in 2010/2011. Most of the cooperative's soybean stocks are sold after harvest to the regional and national market. According to the cooperative's spokesman not so much go for export.
QUESTIONNAIRE ON GM SOY AND HERBICIDE USE
Fieldwork was conducted between 7 – 13 June 2010 by visiting 20 farms situated near the town of Três de Maio. 13 farm‐owners responded to a questionnaire on their soy cultivation and herbicide use. The others seven farm‐owners were not present or did not have time to take part.
Introduction of GM soy in the region
Most producers began to use GM soy around the years 2003 and 2004. This was the season,
through a Federal decree, GM soy was legalized and marketed. Only two producers reported that they started with GM soy previous, and two producers stated that they started after, in 2005. However, I noticed that many farmers were uncertain when they answered this question. A common answer was for example “I started a little bit before the GM soy become legal, mostly to test the new crop”. The farmers told me they had received soy seeds from neighboring Argentina, where production then was legal. In Table 3, the producer’s answers at question on when they started to use GM soy seeds are shown.
INTRODUCTION OF GM SOY
YEAR 200
0
200
1
200
2
200
3
200
4
200
5
200
6
200
7
200
8
200
9
FARMERS 2 0 0 6 3 2 0 0 0 0
Table 3. Year when interviewed farmers started use GM soy
Farm size
Almost all the farms visited had a land area of <50 ha. Only three of the farms indicated higher (51‐100 ha) areal. Below the producer’s answers at question on farm size (Table 4)
CULTIVATED AREA
SIZE (HA) < 50
51 – 100
101 – 200
201 – 500
501 ‐ 1
000
> 1000
FARMERS 10 3 0 0 0 0 Table 4. Size of farms in investigation
Figure 4 and 5 show two typical farms I visited outside the town of Três de Maio.
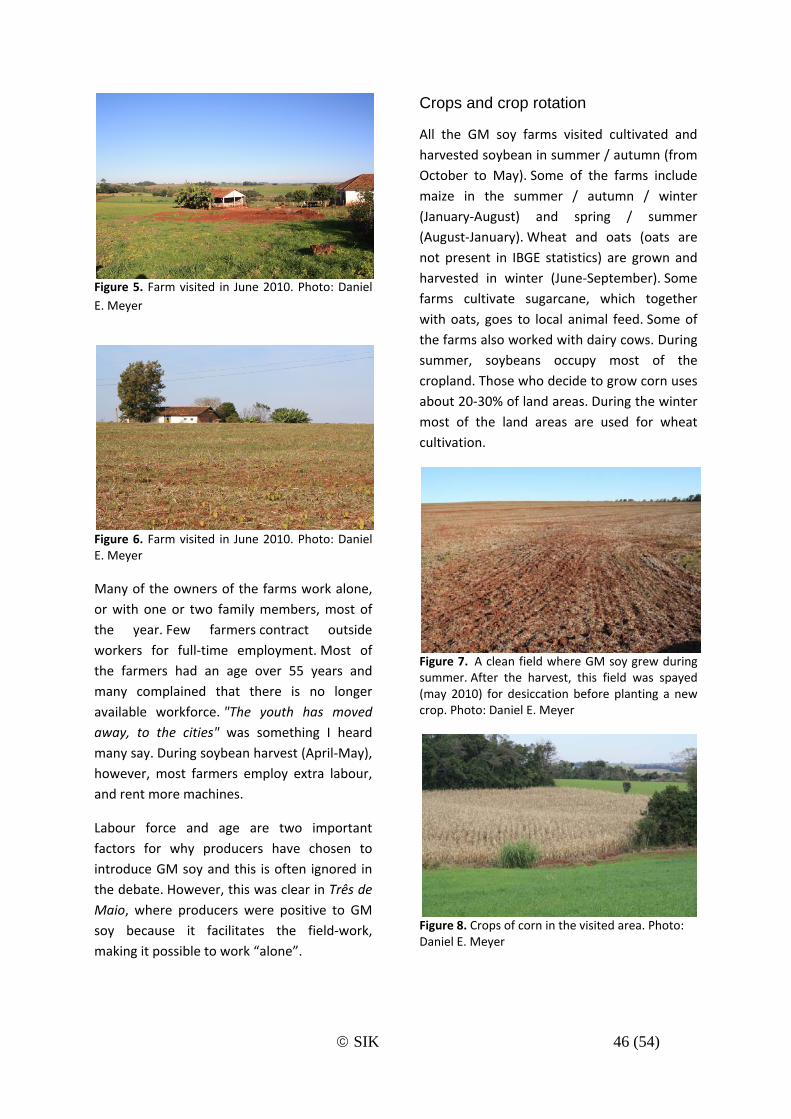
© SIK 46 (54)
Figure 5. Farm visited in June 2010. Photo: Daniel E. Meyer
Figure 6. Farm visited in June 2010. Photo: Daniel E. Meyer
Many of the owners of the farms work alone, or with one or two family members, most of the year. Few farmers contract outside workers for full‐time employment. Most of the farmers had an age over 55 years and many complained that there is no longer available workforce. "The youth has moved away, to the cities" was something I heard many say. During soybean harvest (April‐May), however, most farmers employ extra labour, and rent more machines.
Labour force and age are two important factors for why producers have chosen to introduce GM soy and this is often ignored in the debate. However, this was clear in Três de Maio, where producers were positive to GM soy because it facilitates the field‐work, making it possible to work “alone”.
Crops and crop rotation
All the GM soy farms visited cultivated and harvested soybean in summer / autumn (from October to May). Some of the farms include maize in the summer / autumn / winter (January‐August) and spring / summer (August‐January). Wheat and oats (oats are not present in IBGE statistics) are grown and harvested in winter (June‐September). Some farms cultivate sugarcane, which together with oats, goes to local animal feed. Some of the farms also worked with dairy cows. During summer, soybeans occupy most of the cropland. Those who decide to grow corn uses about 20‐30% of land areas. During the winter most of the land areas are used for wheat cultivation.
Figure 7. A clean field where GM soy grew during summer. After the harvest, this field was spayed (may 2010) for desiccation before planting a new crop. Photo: Daniel E. Meyer
Figure 8. Crops of corn in the visited area. Photo: Daniel E. Meyer

© SIK 47 (54)
Figure 9. Oats in the visited area. Oats are mainly used as animal feed in dairy and milk production. Photo: Daniel E. Meyer
No‐tilling is very common in the area and practiced by all the farms visited.
Motives for adopting GM soy
10 of 13 producers responded that they started with GM soy due ”expectation of greater flexibility in the management of weeds". Few stated that increased production or reduced costs was the main motive (Table 5)
MAIN REASON FOR ADOPTING GM SOY
Curious about new crop‐technology
0
Expectation of higher productivity 2 Expectation of cost reduction 1 Expectation of higher flexibility in weed management
10
Deal with Asian rust 0 Other 0 Table 5. Producers answers regarding why they adopted GM soy
When asking a general queation about the benefits GM soy has created over the years most producers answered “easier weed management” and some cost reduction due “exclusion of extra employees and different herbicides”. In Table 6, an overview is given of the answers regarding main benefits of GM soy for producers in the surroundings’ of the city Três de Maio.
MAIN BENEFITS OF GM SOY (open question)
Easier weed management 10 Higher yield production (kg/ha) 2
Cost reduction due exclusion of extra employees and exclusion of different herbicides
4
Table 6. Producers answers regarding benefits of GM soy
As can be seen Table 6, and as mentioned earlier, producers are positive to GM soy because it will facilitate their work on the field (e.g. weed management). In the past, production and weed management were more mechanical and required much more time, today it is faster. And since labour is missing, and farmers´ age in this area is high, it is easy to understand why producers are positive and benefiting from GM soy.
Weed problems
Many of the producers I visited said that weeds related to soybean and glyphosate use occurs more frequently since they began growing GM soy. Moreover, most were concerned or very concerned about this growing phenomenon. Most farmers noticed an increase in glyphosate‐resistant weeds after around three years (from when they started with GM soy). The problematic weed species mostly found on visited farms, and related to glyphosate use was Hairy fleabane (C. bonariensis) and Italian ryegrass (Lolium multiflorum). All the farms visited had problems with Hairy fleabane, while 10 farmers said they also had problems with Italian ryegrass. Other weed species were also found such as Morningglory (Ipomoea ramosissima). For overview of weeds identified by farmers in their farms, see table 7.
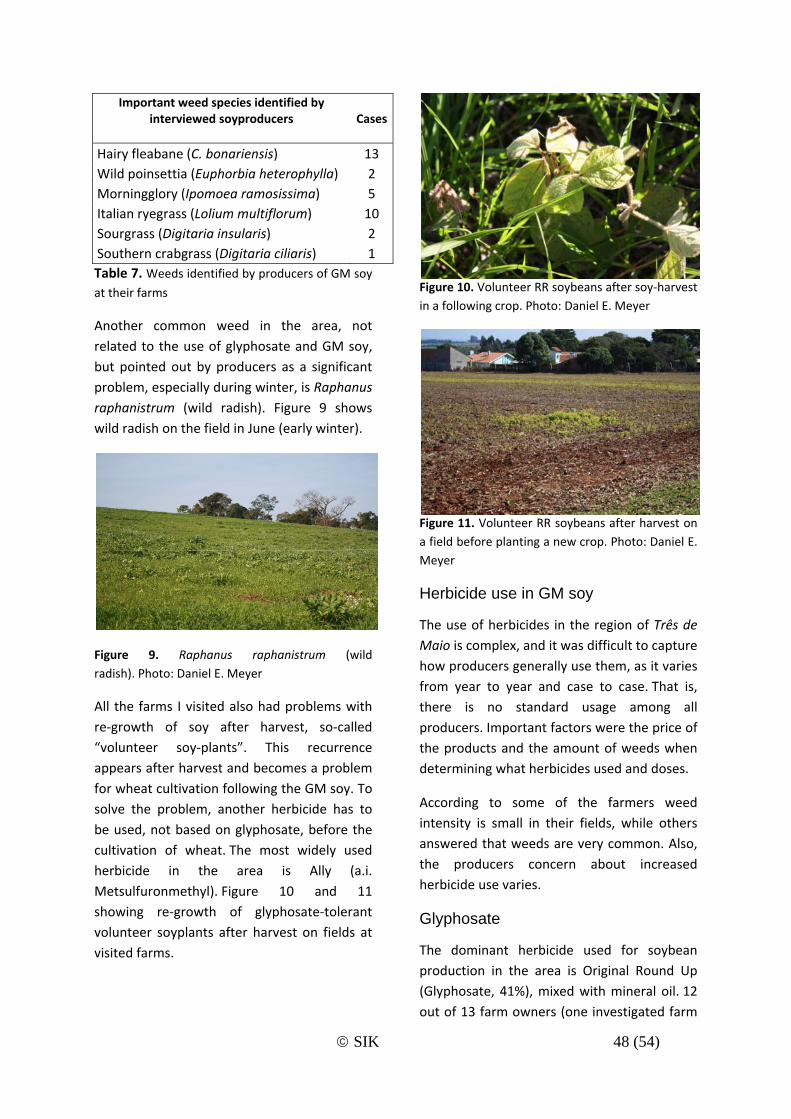
© SIK 48 (54)
Important weed species identified by interviewed soyproducers
Cases
Hairy fleabane (C. bonariensis) 13 Wild poinsettia (Euphorbia heterophylla) 2 Morningglory (Ipomoea ramosissima) 5 Italian ryegrass (Lolium multiflorum) 10 Sourgrass (Digitaria insularis) 2 Southern crabgrass (Digitaria ciliaris) 1 Table 7. Weeds identified by producers of GM soy
at their farms
Another common weed in the area, not related to the use of glyphosate and GM soy, but pointed out by producers as a significant problem, especially during winter, is Raphanus raphanistrum (wild radish). Figure 9 shows wild radish on the field in June (early winter).
Figure 9. Raphanus raphanistrum (wild radish). Photo: Daniel E. Meyer
All the farms I visited also had problems with re‐growth of soy after harvest, so‐called “volunteer soy‐plants”. This recurrence appears after harvest and becomes a problem for wheat cultivation following the GM soy. To solve the problem, another herbicide has to be used, not based on glyphosate, before the cultivation of wheat. The most widely used herbicide in the area is Ally (a.i. Metsulfuronmethyl). Figure 10 and 11 showing re‐growth of glyphosate‐tolerant volunteer soyplants after harvest on fields at visited farms.
Figure 10. Volunteer RR soybeans after soy‐harvest in a following crop. Photo: Daniel E. Meyer
Figure 11. Volunteer RR soybeans after harvest on a field before planting a new crop. Photo: Daniel E. Meyer
Herbicide use in GM soy
The use of herbicides in the region of Três de Maio is complex, and it was difficult to capture how producers generally use them, as it varies from year to year and case to case. That is, there is no standard usage among all producers. Important factors were the price of the products and the amount of weeds when determining what herbicides used and doses.
According to some of the farmers weed intensity is small in their fields, while others answered that weeds are very common. Also, the producers concern about increased herbicide use varies.
Glyphosate
The dominant herbicide used for soybean production in the area is Original Round Up (Glyphosate, 41%), mixed with mineral oil. 12 out of 13 farm owners (one investigated farm
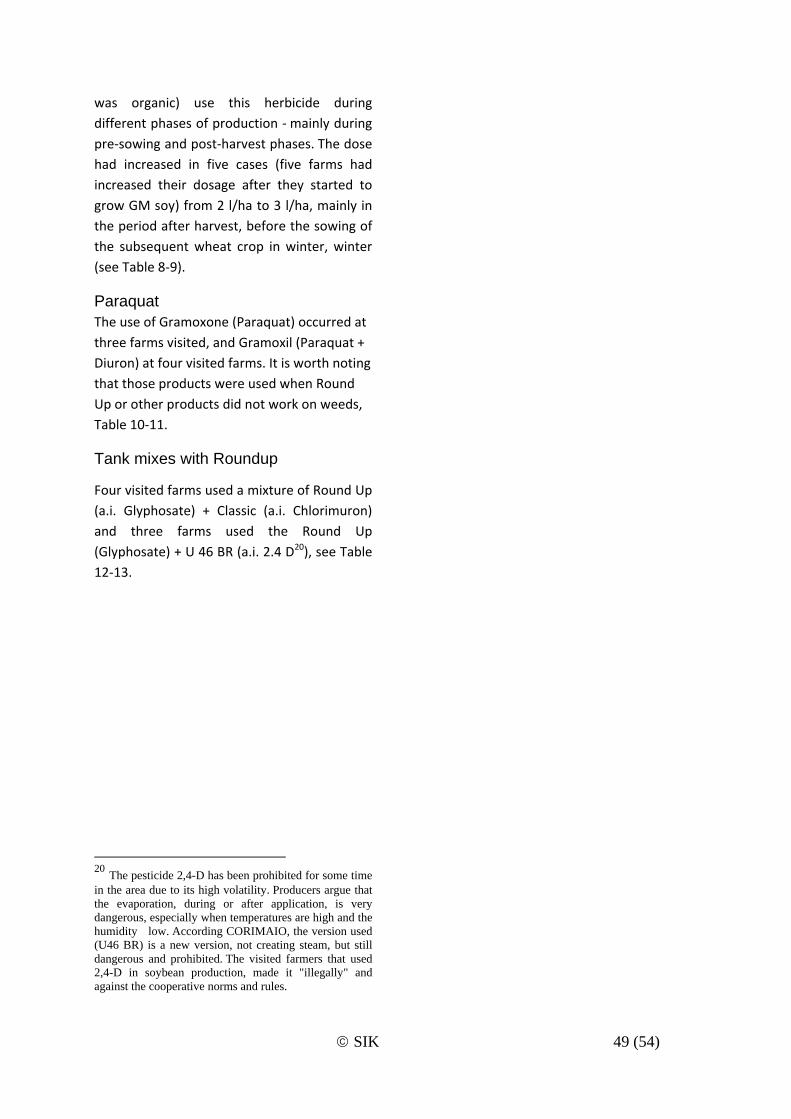
© SIK 49 (54)
was organic) use this herbicide during different phases of production ‐ mainly during pre‐sowing and post‐harvest phases. The dose had increased in five cases (five farms had increased their dosage after they started to grow GM soy) from 2 l/ha to 3 l/ha, mainly in the period after harvest, before the sowing of the subsequent wheat crop in winter, winter (see Table 8‐9).
Paraquat The use of Gramoxone (Paraquat) occurred at three farms visited, and Gramoxil (Paraquat + Diuron) at four visited farms. It is worth noting that those products were used when Round Up or other products did not work on weeds, Table 10‐11.
Tank mixes with Roundup
Four visited farms used a mixture of Round Up (a.i. Glyphosate) + Classic (a.i. Chlorimuron) and three farms used the Round Up (Glyphosate) + U 46 BR (a.i. 2.4 D20), see Table 12‐13.
20 The pesticide 2,4-D has been prohibited for some time in the area due to its high volatility. Producers argue that the evaporation, during or after application, is very dangerous, especially when temperatures are high and the humidity low. According CORIMAIO, the version used (U46 BR) is a new version, not creating steam, but still dangerous and prohibited. The visited farmers that used 2,4-D in soybean production, made it "illegally" and against the cooperative norms and rules.
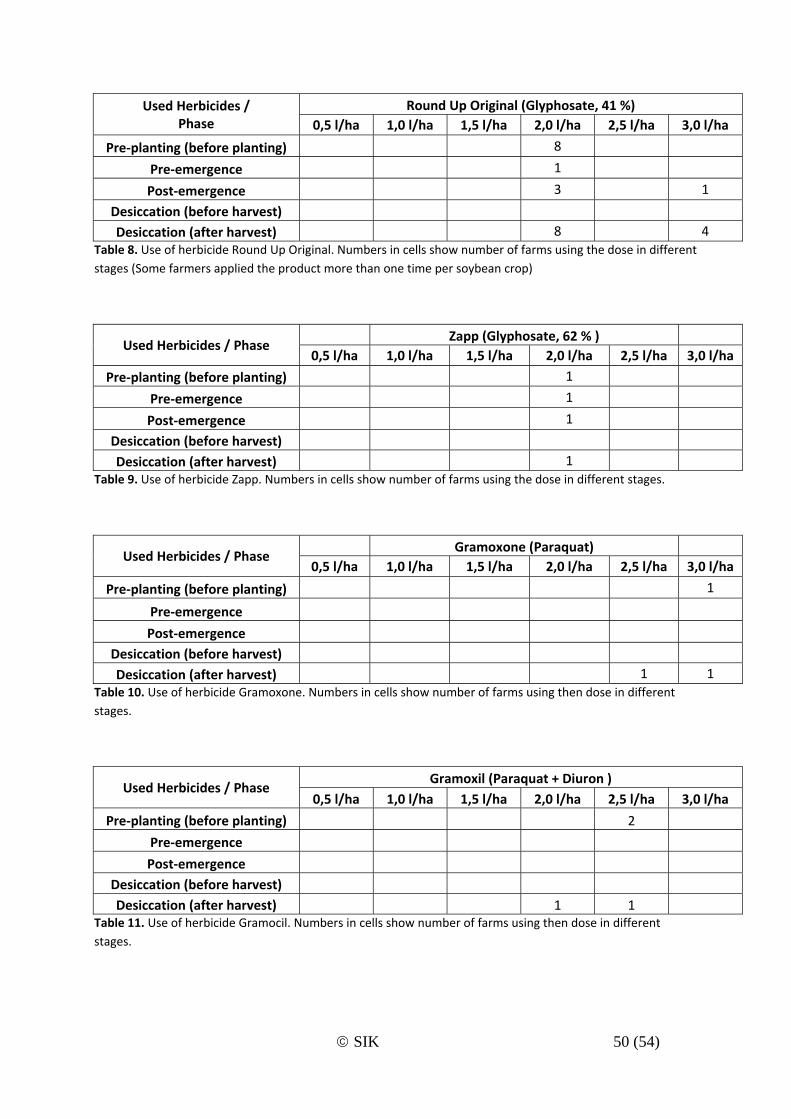
© SIK 50 (54)
Used Herbicides / Phase
Round Up Original (Glyphosate, 41 %) 0,5 l/ha 1,0 l/ha 1,5 l/ha 2,0 l/ha 2,5 l/ha 3,0 l/ha
Pre‐planting (before planting) 8
Pre‐emergence 1
Post‐emergence 3 1
Desiccation (before harvest)
Desiccation (after harvest) 8 4 Table 8. Use of herbicide Round Up Original. Numbers in cells show number of farms using the dose in different stages (Some farmers applied the product more than one time per soybean crop)
Used Herbicides / Phase Zapp (Glyphosate, 62 % )
0,5 l/ha 1,0 l/ha 1,5 l/ha 2,0 l/ha 2,5 l/ha 3,0 l/ha
Pre‐planting (before planting) 1
Pre‐emergence 1
Post‐emergence 1
Desiccation (before harvest)
Desiccation (after harvest) 1 Table 9. Use of herbicide Zapp. Numbers in cells show number of farms using the dose in different stages.
Used Herbicides / Phase Gramoxone (Paraquat)
0,5 l/ha 1,0 l/ha 1,5 l/ha 2,0 l/ha 2,5 l/ha 3,0 l/ha
Pre‐planting (before planting) 1
Pre‐emergence
Post‐emergence
Desiccation (before harvest)
Desiccation (after harvest) 1 1 Table 10. Use of herbicide Gramoxone. Numbers in cells show number of farms using then dose in different stages.
Used Herbicides / Phase Gramoxil (Paraquat + Diuron )
0,5 l/ha 1,0 l/ha 1,5 l/ha 2,0 l/ha 2,5 l/ha 3,0 l/ha
Pre‐planting (before planting) 2
Pre‐emergence
Post‐emergence Desiccation (before harvest) Desiccation (after harvest) 1 1
Table 11. Use of herbicide Gramocil. Numbers in cells show number of farms using then dose in different stages.
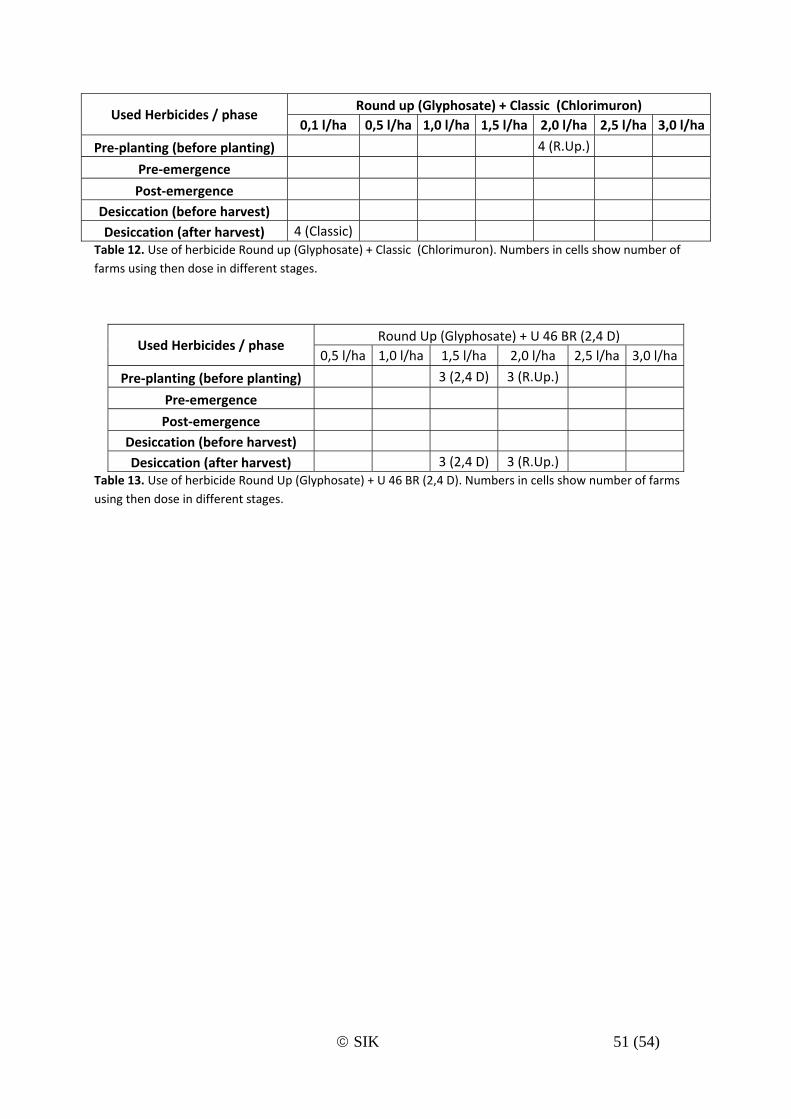
© SIK 51 (54)
Used Herbicides / phase Round up (Glyphosate) + Classic (Chlorimuron)
0,1 l/ha 0,5 l/ha 1,0 l/ha 1,5 l/ha 2,0 l/ha 2,5 l/ha 3,0 l/ha
Pre‐planting (before planting) 4 (R.Up.)
Pre‐emergence
Post‐emergence
Desiccation (before harvest)
Desiccation (after harvest) 4 (Classic) Table 12. Use of herbicide Round up (Glyphosate) + Classic (Chlorimuron). Numbers in cells show number of farms using then dose in different stages.
Used Herbicides / phase Round Up (Glyphosate) + U 46 BR (2,4 D)
0,5 l/ha 1,0 l/ha 1,5 l/ha 2,0 l/ha 2,5 l/ha 3,0 l/ha
Pre‐planting (before planting) 3 (2,4 D) 3 (R.Up.)
Pre‐emergence
Post‐emergence
Desiccation (before harvest)
Desiccation (after harvest) 3 (2,4 D) 3 (R.Up.) Table 13. Use of herbicide Round Up (Glyphosate) + U 46 BR (2,4 D). Numbers in cells show number of farms using then dose in different stages.

© SIK 52 (54)
Visit to Organic Soybean Farm
A short visit to an organic soybean farm was conducted close to the city Três de Maio. Some of the benefits and problems identified together with the organic soy producer were:
BENEFITS PROBLEMS • No pesticides used • Can not use large land areas (low output)
• No problem with volunteer soy‐plants • Weeds
• Leaves are not killed before or after harvest
• Harder work, must remove all "weeds" manual / mechanically / by hand
• Integrates the plant Pisum arvense into production ‐ natural nitrogen (N) uptake
• Time consuming
• Must follow specific standards (e.g. surrounded by sugar cane fields etc)
• Produces “more” soybeans than GM soy
• Low cost according to producer (due less pesticides and herbicides use)
Table 14. Benefits and problems of ecological soy production, according to local farmer
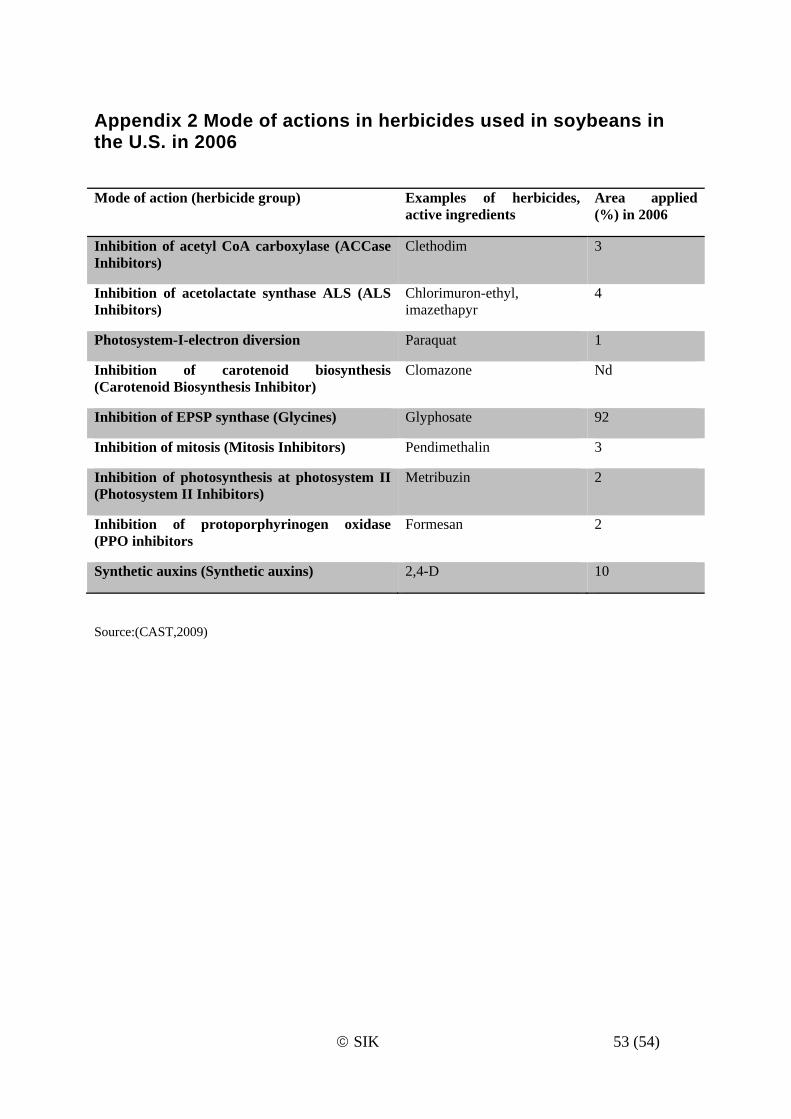
© SIK 53 (54)
Appendix 2 Mode of actions in herbicides used in soybeans in the U.S. in 2006
Mode of action (herbicide group) Examples of herbicides, active ingredients
Area applied (%) in 2006
Inhibition of acetyl CoA carboxylase (ACCase Inhibitors)
Clethodim 3
Inhibition of acetolactate synthase ALS (ALS Inhibitors)
Chlorimuron-ethyl, imazethapyr
4
Photosystem-I-electron diversion Paraquat 1
Inhibition of carotenoid biosynthesis (Carotenoid Biosynthesis Inhibitor)
Clomazone Nd
Inhibition of EPSP synthase (Glycines) Glyphosate 92
Inhibition of mitosis (Mitosis Inhibitors) Pendimethalin 3
Inhibition of photosynthesis at photosystem II (Photosystem II Inhibitors)
Metribuzin 2
Inhibition of protoporphyrinogen oxidase (PPO inhibitors
Formesan 2
Synthetic auxins (Synthetic auxins) 2,4-D 10
Source:(CAST,2009)
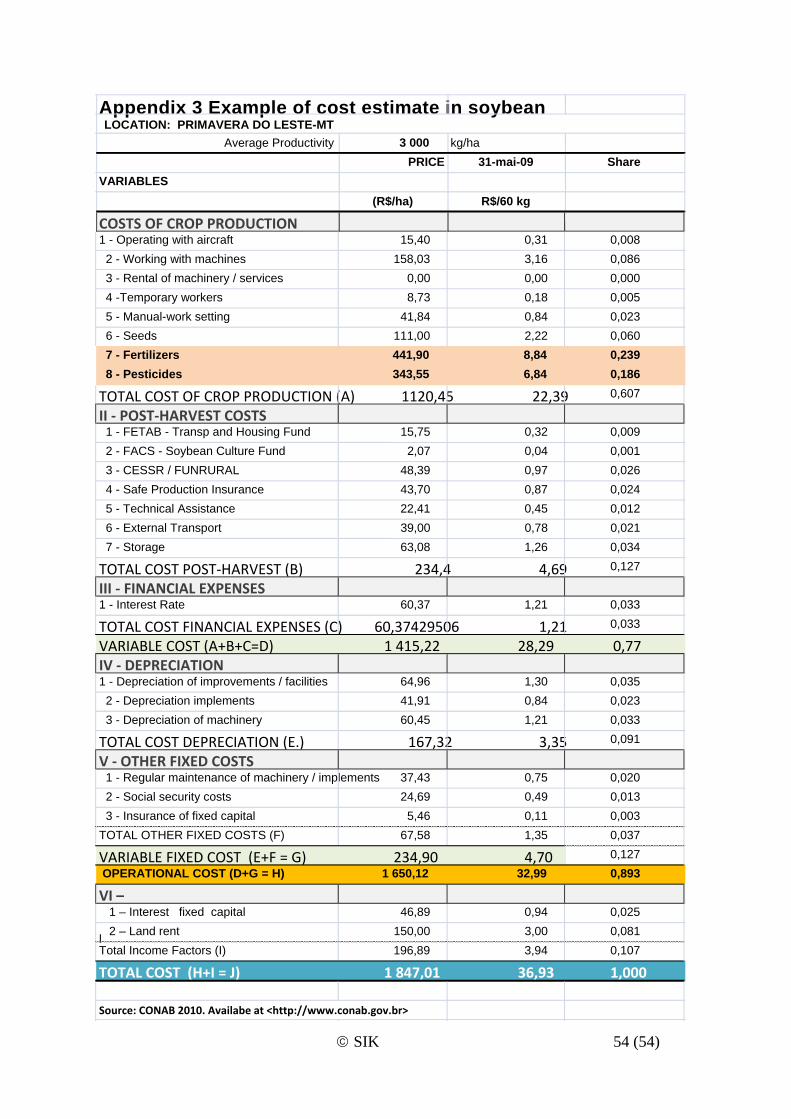
© SIK 54 (54)
Appendix 3 Example of cost estimate in soybean LOCATION: PRIMAVERA DO LESTE-MT
Average Productivity 3 000 kg/ha
PRICE 31-mai-09 ShareVARIABLES
(R$/ha) R$/60 kg
COSTS OF CROP PRODUCTION1 - Operating with aircraft 15,40 0,31 0,008 2 - Working with machines 158,03 3,16 0,086 3 - Rental of machinery / services 0,00 0,00 0,000 4 -Temporary workers 8,73 0,18 0,005 5 - Manual-work setting 41,84 0,84 0,023 6 - Seeds 111,00 2,22 0,060 7 - Fertilizers 441,90 8,84 0,239 8 - Pesticides 343,55 6,84 0,186
TOTAL COST OF CROP PRODUCTION (A) 1120,45 22,39 0,607
II ‐ POST‐HARVEST COSTS 1 - FETAB - Transp and Housing Fund 15,75 0,32 0,009 2 - FACS - Soybean Culture Fund 2,07 0,04 0,001 3 - CESSR / FUNRURAL 48,39 0,97 0,026 4 - Safe Production Insurance 43,70 0,87 0,024 5 - Technical Assistance 22,41 0,45 0,012 6 - External Transport 39,00 0,78 0,021 7 - Storage 63,08 1,26 0,034
TOTAL COST POST‐HARVEST (B) 234,4 4,69 0,127
III ‐ FINANCIAL EXPENSES1 - Interest Rate 60,37 1,21 0,033
TOTAL COST FINANCIAL EXPENSES (C) 60,37429506 1,21 0,033
VARIABLE COST (A+B+C=D) 1 415,22 28,29 0,77 IV ‐ DEPRECIATION 1 - Depreciation of improvements / facilities 64,96 1,30 0,035 2 - Depreciation implements 41,91 0,84 0,023 3 - Depreciation of machinery 60,45 1,21 0,033
TOTAL COST DEPRECIATION (E.) 167,32 3,35 0,091
V ‐ OTHER FIXED COSTS 1 - Regular maintenance of machinery / implements 37,43 0,75 0,020 2 - Social security costs 24,69 0,49 0,013 3 - Insurance of fixed capital 5,46 0,11 0,003TOTAL OTHER FIXED COSTS (F) 67,58 1,35 0,037
VARIABLE FIXED COST (E+F = G) 234,90 4,70 0,127 OPERATIONAL COST (D+G = H) 1 650,12 32,99 0,893
VI – 1 – Interest fixed capital
l
46,89 0,94 0,025 2 – Land rent 150,00 3,00 0,081Total Income Factors (I) 196,89 3,94 0,107
TOTAL COST (H+I = J) 1 847,01 36,93 1,000
Source: CONAB 2010. Availabe at <http://www.conab.gov.br>