significance of urban green and blue spaces: identifying
TRANSCRIPT

European Journal of Sustainable Development (2018), 7, 1, 435-448 ISSN: 2239-5938 Doi: 10.14207/ejsd.2018.v7n1p435
| 1Monash Sustainable Development Institute, Monash University, Clayton, Australia; Corresponding Author
2School of Social Sciences, Faculty of Arts, Monash University, Clayton, Australia
Significance of Urban Green and Blue Spaces: Identifying and Valuing Provisioning Ecosystem Services in Dhaka City
Naeema Jihan Zinia1, Paul McShane2
Abstract We evaluated urban ecosystem services in Dhaka, Bangladesh, a city exposed to increasing urban congestion, air and water pollution, and climate change (particularly extreme weather events). Ecosystem services were evaluated from field-level observation, household surveys, in-depth interviews with experts and local citizens and literature review methods. Data analysis approaches included analysis of ecosystem services and market-price based valuation. The provisioning services provided by the household gardens (particularly rooftop gardens) offered direct economic benefits measurable as the production/value of goods (fruits and vegetables). The benefits to residents could exceed direct economic metrics to regulating services as urban vegetation can act to mitigate extreme heat encountered during the summer months. Our study quantified provisioning services provided by urban ecosystems including rooftop gardens, parks, and waterbodies. The selected urban ecosystems generated BDT 5.3 million (USD 68,465) worth services in 2016. The results of our research are expected influence citizens and policy makers for sustainable urban ecosystem management in Dhaka and similar climate- and population-exposed cities.
Keywords: Urban Ecosystem, Green and blue spaces, Provisioning services, Valuation, City, Bangladesh
1. Introduction
Dhaka, the capital city of Bangladesh, is located on the bank of the River Buriganga and its total area is 1463.60 km2 (BBS, 2013). Geographically Dhaka is in the central part of Bangladesh. More than 77% of Dhaka has been urbanized and the annual population growth rate is 3.5% (BBS, 2012). Further expansion is expected to occur in the peri-urban areas of the city (Roy, 2009). Around 62% of 12 million inhabitants live in urban areas of Dhaka (BBS, 2012). Dhaka is the socio-economic and cultural center of the country. Informal settlements, housing development projects, and associated infrastructure construction proceeding at the cost of loss or degradation of Dhaka’s wetlands and vegetation (Alam & Mullick, 2014; Shubho et al., 2015; Zinia & Kroeze, 2015) and thus threatening or reducing crucial provisioning ecosystem services, that is, the goods/products that humans obtain from ecosystems (MA, 2005): food, drinking and irrigation water, fodder, fuelwood, medicinal plants, and raw materials. The permanent and temporary cropped areas in Dhaka City Corporations (also known as Dhaka Metropolitan) are 4,286 and 22,018 hectare (ha), respectively (BBS, 2013). According to BBS (2013), 1,724,442 holdings in the city corporation area are engaged in agricultural production of crops and livestock of which 48% of holdings operate on their own lands. Commonly-cultivated crops in the city corporation include rice (Aman and

436 European Journal of Sustainable Development (2018), 7, 1, 435-448
Published by ECSDEV, Via dei Fiori, 34, 00172, Rome, Italy http://ecsdev.org
Boro varieties), potato, pepper, tomato, radish, bean, pumpkin, cabbage, brinjal, lady’s fingers, cauliflower, cucumber, papaya, guava, banana, mango and jackfruit. Wheat, jute, sugarcane, lentil and maize are no longer cultivated in this area. Urban agriculture in the highly built up residential and business areas of Dhaka city tends to include rooftop gardens, house peripheral gardens, and plants in balconies (Islam, 2002). Historically, many of the buildings in Dhaka’s residential areas have had homestead gardens in front and in back yards where fruit trees, timber trees, ornamental plants, perennial flowering plants and vegetables are grown (Fattah et al., 2010). Almost all of these gardens have been subsumed accompanying demand for housing developments induced by rapid population growth (Fattah et al., 2010; Islam, 2002). Since the 1970s, rooftop gardening has gained popularity in Dhaka (Fattah et al., 2010) as it promotes food security and satisfies the nutritional needs of residents (Islam, 2002). Commonly-grown fruits and vegetables in rooftop gardens include guava, lemon, papaya, grapes, mango, green chili, pumpkin, tomato, leafy vegetables, cucumber, bean, gourds of different types, cauliflower, cabbage, ladies fingers and brinjals (Fattah et al., 2010; Islam, 2002). The daily demand for fish in Dhaka city is about 250-300 tons (Islam et al., 2004). Fish are sourced from rivers, aquaculture, and floodplains in Dhaka, from neighboring districts and from imports. The annual fish production in Dhaka’s inland water in 2014-15 was 19,173 metric tons, of which about 40% came from ponds and 25% from floodplains (FRSS, 2016). The Dhaka City Corporation area contains 676 ponds (BBS, 2013). Commonly cultured fish include: Ruhi (Labeo rohita), Catla (Catla catla), Mrigel (Cirrhinus mrigala), Kalbaush (Labeo calbasu), Sarpunti (Puntius sarana), Bacha (Eutropichthys vacha), Pangas (Pangasius pangasia), Koi (Anabas testudineus), Shing (Heteropneustes fossilis), Magur (Clarius batrachus), Telapia (Oreochromis mossambicus), Nilotica (Oreochromis niloticus), Silver carp (Hypophthalmicthys molitrix) and Grass carp (Cteopharyngodon idella) (BBS, 2013; FRSS, 2016). Commercial aquaculture in Dhaka city is limited. Pollution from household and human waste disposal and untreated industrial effluent frustrates sustainable aquaculture in Dhaka (Islam et al., 2004). The current demand for water in Dhaka city is 2,250-2,300 million liters per day (MLD) (DWASA, 2016). The Dhaka Water Supply and Sewerage Authority (DWASA) supplies safe water to residential, industrial and commercial customers and to slum dwellers covering a 360 km2 area. DWASA typically produces 2,420 MLD from 702 deep tube wells and four water treatment plants (DWASA, 2016). Seventy eight percent of this water originates from ground water. The remaining 22% is produced by treating surface water of the rivers Buriganga and Shitalakhya. Ground water levels in Dhaka are decreasing by 2-3 meter per year accompanying continuous extraction of water. Decreased ground water has the potential to cause environmental hazards including heavy metal contaminants (Rahman & Hossain, 2008). The waters of Dhaka’s peripheral rivers Balu, Turag, Buriganga and Tongi khal are extremely polluted exceeding acceptable levels of water quality standards for surface water (see Rahman & Hossain, 2008 for details). Apart from rainfall, these rivers receive municipal and untreated industrial waste water, storm water through point sources such as city drains and sluice gates, and run off from the Ganges-Brahmaputra Rivers system (Nahar et al., 2014). These waters are not suitable for use in dry seasons but could be used in the wet seasons when the increased

N. J. Zinia, P. McShane 437
© 2018 The Authors. Journal Compilation © 2018 European Center of Sustainable Development.
river flows (between 50%-90%) accompanying monsoonal rains improves the water quality through dilution (Rahman & Hossain, 2008). We did not find any complete study that focused on quantification and valuation of urban ecosystem and ecosystem services in Bangladeshi cities, specifically in Dhaka. In this study we aimed to assess provisioning ecosystem services generated by the urban ecosystems in Dhaka. We applied an ecosystem services analysis (ESA) method. We estimated the gross value of ecosystem services in the year 2016. We believe that this is the first holistic assessment of provisioning ecosystem services in the highly built-up city of Dhaka. 2. Methodology 2.1 Study area
Dhaka district was established in 1772. The average annual temperature and rainfall of Dhaka are 34.5°C (maximum), 11.5°C (minimum) and 1,931 mm, respectively (BBS, 2012). Agro-based activities dominate in rural areas of Dhaka whereas urban areas are industry based. Dhaka district has two city corporations, Dhaka North City Corporation (DNCC) and Dhaka South City Corporation (DSCC). The total area of DNCC is 82.638 km2 and it lies between 90º20’ to 90º28’ east longitudes and 23º44’ to 23º54’ north latitudes (Dhaka North City Corporation, ND). DNCC comprises 36 wards (the smallest administrative urban geographic unit) which are distributed among five zones. Our study area consisted of wards 6, 7, and 8 under Zone 2 (Mirpur-Pallabi). We selected this area as it had diverse urban ecosystems and access to perform research (Figure 1). We classified urban ecosystems for our study area based on field level verification and expert judgement which would be analyzed as part of a parallel study. The classification included khal (local name for canal), lake, jheel (abandoned channel bottom of a river having confined water), pond, wetland, cultivated land, park, playground, open space/vacant plot, roadside trees and others (graveyards and mixed ecosystems). 2.2 Data collection methods
We performed observations for identifying goods/products that people obtained from urban ecosystems in our study area. We conducted a survey on 510 households (one household from each building) in April-May, 2016. The study area (three wards) shared 41% areas of Zone 2 containing a total of 9,156 holdings (independent houses and high-rise apartments) (Dhaka North City Corporation, ND). We asked the randomly-selected respondents on the availability of ecosystems in their neighborhoods and on production and/or use of provisioning ecosystem services. We collected market price information from several markets in the study area, expert opinion, and secondary sources (govt. reports and websites). Furthermore, we undertook in-depth interviews (e.g., local residents, the National Botanical Garden) and utilized personal experiences. An evaluation of relevant peer-reviewed literature complemented these empirical studies.

438 European Journal of Sustainable Development (2018), 7, 1, 435-448
Published by ECSDEV, Via dei Fiori, 34, 00172, Rome, Italy http://ecsdev.org
2.3 Data analysis approaches 2.3.1 Ecosystem services analysis
We applied Ecosystem Services Analysis (ESA) to identify and to quantify provisioning ecosystem services. The typology of ecosystem services was adapted from Van der Ploeg et al. (2010) and De Groot et al. (2012). ESA was evaluated based on observation, survey, interviews and personal experiences. As there were scarce data on ecosystem quantities; ESA was mostly undertaken qualitatively.
Figure 1. Mapping of urban ecosystems in the study area. Source: This study, 2016.
2.3.2 Valuation mechanism
For valuation, we selected one park (the National Botanical Garden), the Pallabi jheel, cultivated lands (area extracted from satellite images and GIS maps), and rooftop gardens. We identified rooftop gardens during our survey. Based on the survey data we extrapolated total gross value of rooftop provisioning services for all holdings in the study area following equation 1 from Lannas and Turpie (2009). 𝑉𝑎𝑙𝑢𝑒 𝑜𝑓 𝑟𝑜𝑜𝑓𝑡𝑜𝑝 𝑔𝑎𝑟𝑑𝑒𝑛 = %𝑃𝐸𝑆 × 𝐻𝐻 × 𝑉𝑃𝐸𝑆𝑃𝐸𝑆 …………………..…………(1) Here, PES represents provisioning ecosystem services (i.e., fruits and vegetables from rooftop gardens), %hh is the percentage of surveyed households that used a particular species of fruit or vegetable, HH represents the total number of holdings in the study area, and V indicates the average income earned per user household from the rooftop (see Table 2 for step-wise calculations). We estimated gross values of provisioning ecosystem services from the other ecosystems multiplying prices and quantities. In such cases our calculations reflected production

N. J. Zinia, P. McShane 439
© 2018 The Authors. Journal Compilation © 2018 European Center of Sustainable Development.
rather than consumption. All values were expressed in terms of Bangladesh currency Taka (BDT) and US dollar (USD) for the year 2016. The exchange rate considered was 78 BDT = 1 USD. 3. Identification of Provisioning Ecosystem Services 3.1 Food 3.1.1 Crops, fruits and vegetables
About 35% of the holdings surveyed had rooftop gardens of which almost 70% belonged to the owners. We observed house-front and house-peripheral gardens. Many respondents had plants in balconies. Mixed gardens accounted for 36%: these generally comprised seasonal fruits, vegetables and flower/ornamental plants. Fruit gardens occupied 32% of households. The surveyed rooftop garden products are shown in Table 1. Table 1 Quantities of fruits and vegetables produced in the surveyed rooftop gardens.
Local/common names Scientific names Unit Production quantity
(units/year)
Aalu/Potato Solanum tuberosum Kg 60 Aam/Mango Mangifera indica Kg 665 Amra/Yellow mombin Spondias mombin Kg 11 Begun/Brinjal Solanum melongena Kg 53 Bel/Wood apple Aegle marmelos Piece 20 Borboti/String bean Vigna unguiculata ssp. sesquipedalis Kg 3 Boroi/Indian plum Ziziphus mauritiana Kg 113 Dalim/Pomegranate Punica granatum Kg 79 Dherosh/Ladies finger Abelmoschus esculentus Kg 11 Dhundul/Sponge gourd Luffa aegyptiaca Kg 6 Kalo Jaam/Java plum Syzygium cumini Kg 13 Jamrul/Java apple Syzygium samarangense Kg 50 Jhinga/Angled luffa Luffa acutangula Kg 13 Jolpai/Olive Elaeocarpus serratus Kg 4 Kamranga/Star fruit Averrhoa carambola Kg 13 Kanthal/Jackfruit Artocarpus heterophyllus Piece 45 Kola/Banana Musa Piece 2,948 Komola/Orange/Malta Citrus × sinensis Kg 40 Korola/Bitter gourd Momordica charantia Kg 13 Lau/Bottle gourd Lagenaria siceraria Kg 48 Lebu/Lime Citrus × aurantiifolia Piece 1,326 Lichu/Litchi Litchi chinensis Kg 27 Kancha morich/Green chili Capsicum annuum Kg 17 Narkel/Coconut Cocos nucifera Piece 145 Pepe/Papaya Carica papaya Kg 148 Peyara/Guava Psidium guajava Kg 335 Potol/Pointed gourd Trichosanthes dioica Kg 2 Sajna/Moringa Moringa oleifera Kg 30 Shaak/Leafy vegetables
Kg 89
Sheem/Hyacinth bean Lablab purpureus Kg 23 Sobji/Mixed vegetables
Kg 42
Sofeda/Sapodilla Manilkara zapota Kg 6 Tomato Solanum lycopersicum Kg 60

440 European Journal of Sustainable Development (2018), 7, 1, 435-448
Published by ECSDEV, Via dei Fiori, 34, 00172, Rome, Italy http://ecsdev.org
Source: This study, 2016.
Fruit was one of the revenue sources of the National Botanical Garden in Dhaka. The garden authority called for open tender each year to lease out fruit cultivation. Fruits included Aam/Mango (Mangifera indica), Kanthal/Jackfruit (Artocarpus heterophyllus), Taal/Palmyra palm (Borassus flabellifer), Lichu/Litchi (Litchi chinensis), Chapalish (Artocarpus chaplasha) and Kau (Garcinia cowa). Production of all fruits decreased over the years particularly for mangoes (Figure 2). Declining production reflects the declining number of mango trees (27, 28 and 20 in years 2014, 2015 and 2016, respectively). Even so, in fiscal year 2013-14 the total earning from fruits was BDT 132,100 which increased to BDT 134,500 in 2014-15 (Director’s office, the National Botanical Garden, 2016).
Figure 2. Fruit production in the National Botanical Garden from 2014 to 2016. Source: Adapted from Director's office, The National Botanical Garden, 2016
The study area had very little cultivated land (0.1 ha). Paddy and mixed winter vegetables including common leafy vegetables, beans, lady’s fingers, bottle gourds and mula/white radish (Raphanus sativus) were observed being cultivated. The Pallabi jheel and other wetlands had abundant naturally-grown kochu/taro (Colocasia esculenta) that residents (mostly slum dwellers) consumed as vegetables. 3.1.2 Fish
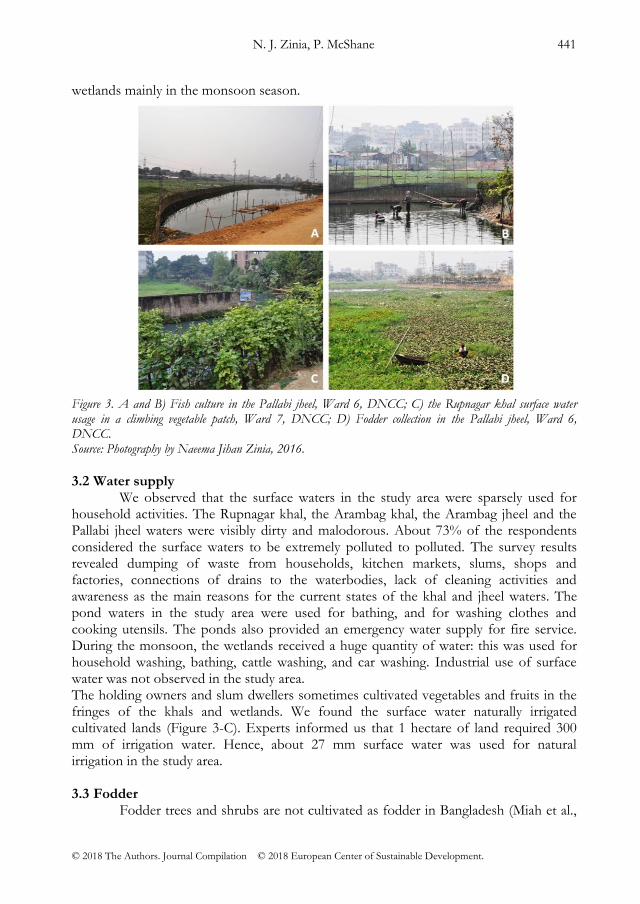
Fish were cultured in lakes, ponds and wetlands in the study area. Apart from the lakes in the Bangladesh National Zoo, all other waterbodies were privately owned. Data for the total production of fish from wetlands, lakes, jheel and ponds were not available. The Pallabi jheel (ward 6) was leased out to the Dhaka Sangbadik Somobay Somiti Ltd (Cooperative Society of Journalists). According to the local residents, about 150 kg fish were harvested three to four times a month from this jheel. Ruhi (Labeo rohita), pangas (Pangasius pangasia), tilapia (Oreochromis mossambicus) and some other common species were cultured there. Figure 3-A and B shows fish culture in the Pallabi jheel. We observed several ponds where fish culture existed such as three ponds in Ward 8 (inside the Mazar of Hazrat Shah Ali Bughdadi (R)) and one in Ward 6 (in the corner of the Eastern Housing entrance from the flood embankment road). None of these ponds were accessible to the public for fishing. Fishing activities were common in
N. J. Zinia, P. McShane 441
© 2018 The Authors. Journal Compilation © 2018 European Center of Sustainable Development.
wetlands mainly in the monsoon season.
Figure 3. A and B) Fish culture in the Pallabi jheel, Ward 6, DNCC; C) the Rupnagar khal surface water usage in a climbing vegetable patch, Ward 7, DNCC; D) Fodder collection in the Pallabi jheel, Ward 6, DNCC. Source: Photography by Naeema Jihan Zinia, 2016.
3.2 Water supply
We observed that the surface waters in the study area were sparsely used for household activities. The Rupnagar khal, the Arambag khal, the Arambag jheel and the Pallabi jheel waters were visibly dirty and malodorous. About 73% of the respondents considered the surface waters to be extremely polluted to polluted. The survey results revealed dumping of waste from households, kitchen markets, slums, shops and factories, connections of drains to the waterbodies, lack of cleaning activities and awareness as the main reasons for the current states of the khal and jheel waters. The pond waters in the study area were used for bathing, and for washing clothes and cooking utensils. The ponds also provided an emergency water supply for fire service. During the monsoon, the wetlands received a huge quantity of water: this was used for household washing, bathing, cattle washing, and car washing. Industrial use of surface water was not observed in the study area. The holding owners and slum dwellers sometimes cultivated vegetables and fruits in the fringes of the khals and wetlands. We found the surface water naturally irrigated cultivated lands (Figure 3-C). Experts informed us that 1 hectare of land required 300 mm of irrigation water. Hence, about 27 mm surface water was used for natural irrigation in the study area. 3.3 Fodder
Fodder trees and shrubs are not cultivated as fodder in Bangladesh (Miah et al.,

442 European Journal of Sustainable Development (2018), 7, 1, 435-448
Published by ECSDEV, Via dei Fiori, 34, 00172, Rome, Italy http://ecsdev.org
2005). We observed Kochuripana (common water hyacinth- Eichhornia crassipes), Guine grass (Megathyrsus maximus), Dal grass (Hymenachne amplexicaulis), Nalkhagra (Phragmites karka), Kalmi (Ipomoea aquatica) and Dhaincha (Sesbania bispinosa) growing naturally in the jheels, khals and wetlands of the study area. These plants were collected by people (living nearby) as fodder for their cattle. Figure 3-D shows fodder collection in the study area. Locals informed us that about three maund (1 maund = 40 kg) of fodder were collected each week from the Pallabi jheel for about six months (mostly in winter) of a year. 3.4 Medicinal and ornamental plants
Medicinal plants are widely used by folk medicinal practitioners (kobiraj), tribal or river gypsy (bede) communities mostly in rural areas of Bangladesh (Hasan et al., 2010; Rahmatullah et al., 2011). Such plants are not known to be cultivated in Dhaka for commercial purposes, rather seen sporadically. The botanical garden has a special section of medicinal plants that has about 200 plants of 150 species (BFD, 2014; NBG, 2014). Ornamental and flowering plants have been historically grown in Dhaka (Fattah et al., 2010; Islam, 2002). Flat dwellers prefer flowering, ornamental plants and vegetables for growing on their balconies (Fattah et al., 2010). We observed medicinal plants such as tulsi (Ocimum tenuiflorum), basak (Justicia adhatoda), nayantara (Catharanthus roseus), neem (Azadirachta indica), ornamental and flowering plants in rooftop gardens, balconies, and in the periphery of houses in the study area. About 29% of the rooftop gardens surveyed consisted of only flower/ornamental plants. Balcony-based gardens were popular among tenants and residents of flats in high-rise buildings. 3.5 Fuelwood
Fuelwood is used for cooking, brick burning and making charcoal (Uddin et al., 2013). The rural population of Bangladesh largely depends on fuelwood for their daily energy needs (Hassan et al., 2014; Miah et al., 2009). Miah et al. (2009) found that 4.2 tons of fuelwood were consumed per family per year in rural floodplain areas of the country. This practice is less common in Dhaka city. Fuelwoods were collected from the woody species grown in trees in opens paces/vacant plots, homestead gardens, roadside trees, the parks (National Botanical Garden and the Bangladesh National Zoo), and around playgrounds in the study area. There was no record of annual fuelwood collection. However, fuelwoods and waste wood from construction works were sold in neighboring market places. These were used mainly by the slum dwellers in the study area. Local information indicated that a family of five members on average required 5 kg fuelwood per day. Price of fuelwood was around BDT 10 per kg in 2016. 3.6 Timber
Timber is the most important ecosystem service supplied by natural and plantation forests in Bangladesh. Timber exploitation happens in 63% of the total natural forest area of the country (MoEF & FAO, 2007). Dhaka city no longer has any natural forests. Timber trees are available in Dhaka’s protected parks/gardens: the National Botanical Garden, the Bangladesh National Zoo, Osmani Uddayan, Chandrima Uddyan,

N. J. Zinia, P. McShane 443
© 2018 The Authors. Journal Compilation © 2018 European Center of Sustainable Development.
Suhrawardy Uddyan, Ramna Ramna Park, and Baldha Garden. Mahogany (Swietenia macrophylla), koroi (Albizia lebbeck), rain tree (Albizia saman) and kadam (Neolamarckia cadamba) were available timber trees we found in the study area. These were mostly placed in the road dividers and on roadsides. The timber trees were occasionally seen in house peripheries. We identified most of the trees observed inside the graveyards and around playgrounds as common timber trees. The National Botanical Garden had 33,413 trees of 306 species (BFD, 2014). These timber trees were not harvested commercially. 4. Valuation of Provisioning Ecosystem Services 4.1 Value of the park ecosystem services
The National Botanical Garden’s revenue included sales of fruits and seedlings. We considered seedlings to be provisioning ecosystem services. The total gross value of the provisioning ecosystem services was BDT 260,900 (USD 3,345) in 2014-15 (Director’s office, the National Botanical Garden, 2016). Assuming that this value remained constant and after adjusting for inflation (5.92% in 2015-16) the gross value of provisioning services was estimated to be BDT 276,334 (USD 3543) in 2016. 4.2 Value of the rooftop garden ecosystem services
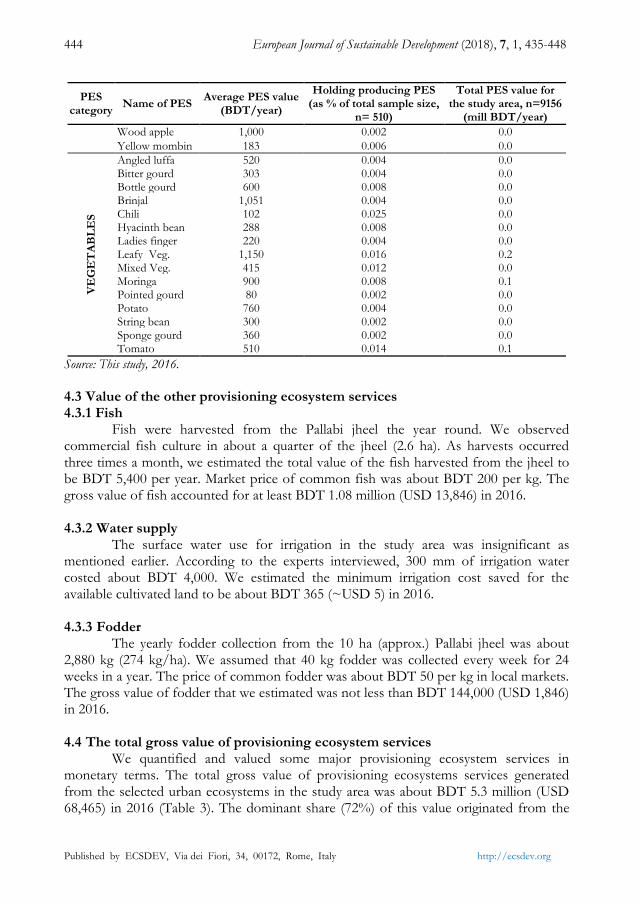
We estimated the gross value of fruits and vegetables produced in the rooftop gardens of the surveyed holdings (n=510) to be BDT 213,867 (USD 2,742) in 2016. Extrapolating these findings for all holdings (n=9156) in wards 6, 7, and 8 using equation 1 we found the gross values to be BDT 3.3 million (USD 0.04 million) for fruits and BDT 0.54 million (USD 0.01 million) for vegetables totalling BDT 3.84 million (~USD 0.05 million) in 2016 (Table 2). Table 2. Estimated gross values (BDT/year) of the rooftop garden provisioning ecosystem services (PES) in the study area.
PES category
Name of PES Average PES value
(BDT/year)
Holding producing PES (as % of total sample size,
n= 510)
Total PES value for the study area, n=9156
(mill BDT/year)
FR
UIT
S
Banana 2,412 0.022 0.5
Coconut 1,208 0.012 0.1
Guava 440 0.139 0.6
Indian plum 404 0.027 0.1
Jackfruit 1,050 0.010 0.1
Java apple 350 0.020 0.1
Java plum 650 0.004 0.0
Lime 133 0.114 0.1
Litchi 882 0.010 0.1
Mango 709 0.147 1.0
Olive 300 0.004 0.0
Orange/Malta 6,000 0.002 0.1
Papaya 587 0.035 0.2
Pomegranate 951 0.035 0.3
Sapodilla 720 0.002 0.0
Star fruit 347 0.006 0.0
444 European Journal of Sustainable Development (2018), 7, 1, 435-448
Published by ECSDEV, Via dei Fiori, 34, 00172, Rome, Italy http://ecsdev.org
PES category
Name of PES Average PES value
(BDT/year)
Holding producing PES (as % of total sample size,
n= 510)
Total PES value for the study area, n=9156
(mill BDT/year)
Wood apple 1,000 0.002 0.0
Yellow mombin 183 0.006 0.0
VE
GE
TA
BL
ES
Angled luffa 520 0.004 0.0 Bitter gourd 303 0.004 0.0 Bottle gourd 600 0.008 0.0 Brinjal 1,051 0.004 0.0 Chili 102 0.025 0.0 Hyacinth bean 288 0.008 0.0 Ladies finger 220 0.004 0.0 Leafy Veg. 1,150 0.016 0.2 Mixed Veg. 415 0.012 0.0 Moringa 900 0.008 0.1 Pointed gourd 80 0.002 0.0 Potato 760 0.004 0.0 String bean 300 0.002 0.0 Sponge gourd 360 0.002 0.0 Tomato 510 0.014 0.1
Source: This study, 2016.
4.3 Value of the other provisioning ecosystem services 4.3.1 Fish
Fish were harvested from the Pallabi jheel the year round. We observed commercial fish culture in about a quarter of the jheel (2.6 ha). As harvests occurred three times a month, we estimated the total value of the fish harvested from the jheel to be BDT 5,400 per year. Market price of common fish was about BDT 200 per kg. The gross value of fish accounted for at least BDT 1.08 million (USD 13,846) in 2016. 4.3.2 Water supply
The surface water use for irrigation in the study area was insignificant as mentioned earlier. According to the experts interviewed, 300 mm of irrigation water costed about BDT 4,000. We estimated the minimum irrigation cost saved for the available cultivated land to be about BDT 365 (~USD 5) in 2016. 4.3.3 Fodder
The yearly fodder collection from the 10 ha (approx.) Pallabi jheel was about 2,880 kg (274 kg/ha). We assumed that 40 kg fodder was collected every week for 24 weeks in a year. The price of common fodder was about BDT 50 per kg in local markets. The gross value of fodder that we estimated was not less than BDT 144,000 (USD 1,846) in 2016. 4.4 The total gross value of provisioning ecosystem services
We quantified and valued some major provisioning ecosystem services in monetary terms. The total gross value of provisioning ecosystems services generated from the selected urban ecosystems in the study area was about BDT 5.3 million (USD 68,465) in 2016 (Table 3). The dominant share (72%) of this value originated from the

N. J. Zinia, P. McShane 445
© 2018 The Authors. Journal Compilation © 2018 European Center of Sustainable Development.
rooftop garden provisioning services. Similarly, the jheel ecosystem generated noticeable monetary values. Table 3. Total gross value of provisioning ecosystem services (PES) in the study area in 2016.
Ecosystem Number of ecosystems
Ecosystem services considered
Value of PES (BDT/Year)
Park (National Botanical Garden) 1 Fruits and seedlings 276,334 Rooftop garden N/A Fruits and vegetables 3,839,533 Cultivated land N/A Water supply 365
Jheel 1 Fish 1,080,000 Fodder 144,000
Total 5,340,233
Source: This study, 2016.
5. Conclusions and Discussions
Our study identified and quantified provisioning ecosystem services in three highly built-up areas (wards 6, 7, and 8) of Mirpur-Pallabi Zone, Dhaka North City Corporation (DNCC). It was based on empirical data collected through field observation, household survey and in-depth interviews. The provisioning ecosystem services included: crops, fruits, vegetables, fish, water for irrigation, fodder, medicinal or ornamental plants, fuelwood, and timber. The total gross value of the provisioning services from the selected urban ecosystems in our study area was BDT 5.3 million (USD 68,465) in the year 2016. Our results show that provisioning ecosystem services measurable as the direct economic benefits are considerable particularly for a city in which poverty is widespread. Land for cultivation is scarce in Dhaka city. We have shown that rooftop garden provided direct economic benefits through food provision. Rooftop gardening practice is easily implementable, does not require additional space and profitable. Fishing could be made more popular by creating provisions for it by managing the confined waterbodies (lakes, jheels, and ponds) of Dhaka city. Wetland and other waterbodies management could lead to necessary improvements in surface water and therefore increased usage. Ecosystem services assessment and valuation is a new area of research in the context of Bangladesh. A few studies considered provisioning ecosystem services: valuation of timber, fuel wood, fish and crab, honey and wax, and thatching materials of the Sundarbans mangrove forest located in the coastal area (Uddin et al., 2013), assessment of aquaculture in urban and peri-urban areas of Dhaka (Islam et al., 2004), and evaluation of the potential of rooftop gardening in Dhaka city (Islam, 2002). More generally, urban ecosystem services attract relatively little research attention. Milestone studies including Costanza et al. (1997), Costanza et al. (2014) and TEEB database (http://doc.teebweb.org/wp-content/uploads/2017/03/teeb_database_teebweb.xlsx) by Van der Ploeg et al. (2010) have very limited information on the values of urban ecosystems. The benefits of urban ecosystems are extended to urban heat mitigation and aesthetics contribute to social and (therefore) economic wellbeing (See Betancourth, 2011; Bhattacharya et al., 2012; De Oliveira, 2014; Kazmierczak & Carter, 2010; Rahman et al., 2015). We had previously shown a reluctance by common people to invest directly

446 European Journal of Sustainable Development (2018), 7, 1, 435-448
Published by ECSDEV, Via dei Fiori, 34, 00172, Rome, Italy http://ecsdev.org
in ecosystem-based (green) adaptation responses by increasing urban green and blue spaces in Dhaka (Zinia & McShane, In press). This reflects a general lack of awareness consistent with other studies which show that non-market benefits (particularly regulating ecosystem services) attract little value among the community. Our analysis was based on a relatively small spatial scale and sample size due to time and resource constraints. We focused on the gross values of provisioning ecosystem services. We did not consider net values which required cost information beyond the scope of our study. Extrapolation gave an estimate which might vary from the reality. Data on quantities of provisioning ecosystem services from common properties especially in an urban setting was challenging to collect. Our study is a necessary contribution to the local and the broader scientific communities. We expect it will influence citizens and policy makers for sustainable urban ecosystem management at city scale. We strongly recommend for more research to estimate precise values of provisioning and other non-market urban ecosystem services in Dhaka city and of other climate-exposed highly built-up cities in the developing world. 6. Acknowledgements
This paper has been prepared as part of the doctoral research project “Green Adaptation for Ecosystem Services Management in Dhaka: A Socio-economic Evaluation” (project number: CF15/4498 - 2015001949) and funded through Monash Sustainable Development Institute and Monash University, Australia. We are grateful to Professor Michael Ward for advice. We are thankful to the interviewees, the respondents and everyone who helped us with data collection in Dhaka and encouraged for this paper. References Alam, M. J., & Mullick, R. A. (2014). Climate change effects upon massive land and housing development:
Case of Dhaka, Bangladesh. International Journal of Climate Change Strategies and Management, 6(3), 315-331.
BBS. (2012). Bangladesh Population and Housing Census 2011 Community Report Dhaka Zila. Dhaka: Bangladesh Bureau of Statistics (BBS), Statistics and Informatics Division (SID), Ministry of Planning, Government of The People’s Republic of Bangladesh Retrieved from http://www.bbs.gov.bd/home.aspx.
BBS. (2013). District Statistics 2011 Dhaka. Dhaka: Bangladesh Bureau of Statistics (BBS), Statistics and Informatics Division (SID), Ministry of Planning, Government of the People’s Republic of Bangladesh. Retrieved from http://www.bbs.gov.bd/WebTestApplication/userfiles/Image/District%20Statistics/Dhaka.pdf.
Betancourth, C. (2011). Eco-infrastructures, Feedback Loop Urbanisms and Network of Independent Zero Carbon Settlements. In T.-C. Wong & B. Yuen (Eds.), Eco-city Planning (pp. 51-91): Springer Netherlands.
BFD. (2014). Flora of National Botanical Garden Mirpur, Dhaka. Strengthening Regional Co-operation for Wildlife Protection Project, Bangladesh Forest Department (BFD), Ministry of Environment and Forests, Government of the People’s Republic of Bangladesh.
Bhattacharya, S., Ganguli, A., Bose, S., & Mukhopadhyay, A. (2012). Biodiversity, traditional practices and sustainability issues of East Kolkata Wetlands: A significance Ramsar site of West Bengal, (India). Res rev biosci, 6(11), 340-347.

N. J. Zinia, P. McShane 447
© 2018 The Authors. Journal Compilation © 2018 European Center of Sustainable Development.
Costanza, R., d'Arge, R., de Groot, R., Farber, S., Grasso, M., Hannon, B., Naeem, S., Limburg, K., Paruelo, J., & O'Neill, R. V. (1997). The value of the world's ecosystem services and natural capital. Nature, 387, 253-260.
Costanza, R., de Groot, R., Sutton, P., van der Ploeg, S., Anderson, S. J., Kubiszewski, I., Farber, S., & Turner, R. K. (2014). Changes in the global value of ecosystem services. Global Environmental Change, 26(0), 152-158. doi: http://dx.doi.org/10.1016/j.gloenvcha.2014.04.002
De Groot, R., Brander, L., van Der Ploeg, S., Costanza, R., Bernard, F., Braat, L., Christie, M., Crossman, N., Ghermandi, A., & Hein, L. (2012). Global estimates of the value of ecosystems and their services in monetary units. Ecosystem services, 1(1), 50-61.
De Oliveira, F. (2014). Eco-cities: The Role of Networks of Green and Blue Spaces. In S. T. Rassia & P. M. Pardalos (Eds.), Cities for Smart Environmental and Energy Futures (pp. 165-178): Springer Berlin Heidelberg.
Dhaka North City Corporation. (ND). DNCC Setup. Retrieved May 7, 2015, from http://www.dncc.gov.bd/dncc-setup/geographical-location-area-of-dncc.html
DWASA. (2016). Annual Report 2014-15: Dhaka Water Supply and Sewerage Authority (DWASA). Fattah, Q. A., Begum, M., Fattah, K. B., & Rahman, M. O. (2010). Gardens in Pakistan and Bangladesh
Periods. In M. A. Islam (Ed.), Environment of Capital Dhaka- Plants Wildlife Gardens Parks Open Spaces Air Water Earthquake (pp. 169-206). Dhaka: Asiatic Society of Bangladesh.
FRSS. (2016). Fisheries Statistical Report of Bangladesh 2014-15. Fisheries Resources Survey System (FRSS), Department of Fisheries, Ministry of Fisheries and Livestock (MoFL), Government of the People’s Republic of Bangladesh.
Hasan, M. M., Annay, M. E. A., Sintaha, M., Khaleque, H. N., Noor, F. A., Nahar, A., Seraj, S., Jahan, R., Chowdhury, M. H., & Rahmatullah, M. (2010). A survey of medicinal plant usage by folk medicinal practitioners in seven villages of Ishwardi Upazilla, Pabna district, Bangladesh. American Eurasian Journal of Sustainable Agriculture, 4, 326-333.
Hassan, M. K., Pelkonen, P., & Pappinen, A. (2014). Rural households’ knowledge and perceptions of renewables with special attention on bioenergy resources development – Results from a field study in Bangladesh. Applied Energy, 136(Supplement C), 454-464. doi: https://doi.org/10.1016/j.apenergy.2014.09.049
Islam, M. S., Chowdhury, M. T. H., Rahman, M. M., & Hossain, M. A. (2004). Urban and peri-urban aquaculture as an immediate source of food fish: Perspectives of Dhaka City, Bangladesh. Urban Ecosystems, 7(4), 341-359. doi: 10.1007/s11252-005-6834-8
Islam, S. K. M. (2002). Rooftop gardening as a strategy of urban agriculture for food security: The case of Dhaka City, Bangladesh. Paper presented at the International Conference on Urban Horticulture 643.
Kazmierczak, A., & Carter, J. (2010). Adaptation to climate change using green and blue infrastructure: A database of case studies. University of Manchester, GRaBS project.
Lannas, K., & Turpie, J. (2009). Valuing the provisioning services of wetlands: contrasting a rural wetland in Lesotho with a peri-urban wetland in South Africa. Ecology and Society, 14(2).
MA. (2005). Ecosystems and Human Well-Being: Current State and Trends, Volume 1, Findings of the Condition and Trends Working Group of the Millennium Ecosystem Assessment. In Rashid Hassan, Robert Scholes & Neville Ash (Eds.). Washington, Covelo, London: Island Press.
Miah, M. D., Al Rashid, H., & Shin, M. Y. (2009). Wood fuel use in the traditional cooking stoves in the rural floodplain areas of Bangladesh: A socio-environmental perspective. Biomass and Bioenergy, 33(1), 70-78. doi: https://doi.org/10.1016/j.biombioe.2008.04.015
Miah, M. D., Noman, M., Shin, M., & Chung, D. (2005). Availability and traditional practice with respect to fodder trees and shrubs in the floodplain areas of Bangladesh. Indilinga African Journal of Indigenous Knowledge Systems, 4(2), 429-448.
MoEF, & FAO. (2007). National forest and tree resources assessment 2005-2007 Bangladesh. In D. Altrell, M. Saket, L. Lyckeback & M. Piazza (Eds.). Dhaka: Ministry of Environment and Forests (MoEF), Bangladesh and Food and Agriculture Organization of the United Nations (FAO).
Nahar, M. S., Zhang, J., Ueda, A., & Yoshihisa, F. (2014). Investigation of severe water problem in urban areas of a developing country: the case of Dhaka, Bangladesh. Environmental Geochemistry and Health, 36(6), 1079-1094. doi: 10.1007/s10653-014-9616-5
448 European Journal of Sustainable Development (2018), 7, 1, 435-448
Published by ECSDEV, Via dei Fiori, 34, 00172, Rome, Italy http://ecsdev.org
NBG. (2014). The National Botanical Garden Mirpur, Dhaka: The National Botanical Garden (NBG), Bangladesh Forest Department, Ministry of Environment and Forests, Government of the People’s Republic of Bangladesh.
Rahman, S., & Hossain, F. (2008). Spatial Assessment of Water Quality in Peripheral Rivers of Dhaka City for Optimal Relocation of Water Intake Point. Water Resources Management, 22(3), 377-391. doi: 10.1007/s11269-007-9167-y
Rahman, S. R. A., Ahmad, H., Mohammad, S., & Rosley, M. S. F. (2015). Perception of Green Roof as a Tool for Urban Regeneration in a Commercial Environment: The Secret Garden, Malaysia. Procedia - Social and Behavioral Sciences, 170, 128-136. doi: http://dx.doi.org/10.1016/j.sbspro.2015.01.022
Rahmatullah, M., Ishika, T., Rahman, M., Swarna, A., Khan, T., Monalisa, M. N., Seraj, S., Mou, S. M., Mahal, M. J., & Biswas, K. R. (2011). Plants prescribed for both preventive and therapeutic purposes by the traditional healers of the Bede community residing by the Turag River, Dhaka district. American Eurasian Journal of Sustainable Agriculture, 5, 325-331.
Roy, M. (2009). Planning for sustainable urbanisation in fast growing cities: Mitigation and adaptation issues addressed in Dhaka, Bangladesh. Habitat International, 33(3), 276-286. doi: http://dx.doi.org/10.1016/j.habitatint.2008.10.022
Shubho, M. T. H., Islam, S. R., Ayon, B. D., & Islam, I. (2015). An improved semiautomatic segmentation approach to land cover mapping for identification of land cover change and trend. International Journal of Environmental Science and Technology, 12(8), 2593-2602. doi: 10.1007/s13762-014-0649-1
Uddin, M. S., de Ruyter van Steveninck, E., Stuip, M., & Shah, M. A. R. (2013). Economic valuation of provisioning and cultural services of a protected mangrove ecosystem: A case study on Sundarbans Reserve Forest, Bangladesh. Ecosystem services, 5(0), 88-93. doi: http://dx.doi.org/10.1016/j.ecoser.2013.07.002
Van der Ploeg, S., De Groot, R. S., & Wang, Y. (2010). The TEEB Valuation Database: overview of structure, data and results: Foundation for Sustainable Development, Wageningen, The Netherlands.
Zinia, & Kroeze. (2015). Future trends in urbanization and coastal water pollution in the Bay of Bengal: the lived experience. Environment, development and sustainability, 17(3), 531-546. doi: 10.1007/s10668-014-9558-1
Zinia, N. J., & McShane, P. (In press). Ecosystem services management: An evaluation of green adaptations for urban development in Dhaka, Bangladesh. Landscape and Urban Planning.