signals of opportunity airborne demonstrator (soop-ad) · 2018-05-24 · signals of opportunity...
TRANSCRIPT

Signals of Opportunity Airborne Demonstrator
(SoOp-AD)Earth Science Technology Forum
2014 ESTO Instrument Incubator Program (IIP)June 25th, 2015
5/15/2018 SoOP-AD 1
https://ntrs.nasa.gov/search.jsp?R=20180002866 2020-05-27T08:10:55+00:00Z

Outline
5/15/2018 SoOP-AD 2
• Overview• Project Team• Science Background and Motivations• P-Band Signal Details• Instrument Architecture• Measurement Simulation• Next Steps
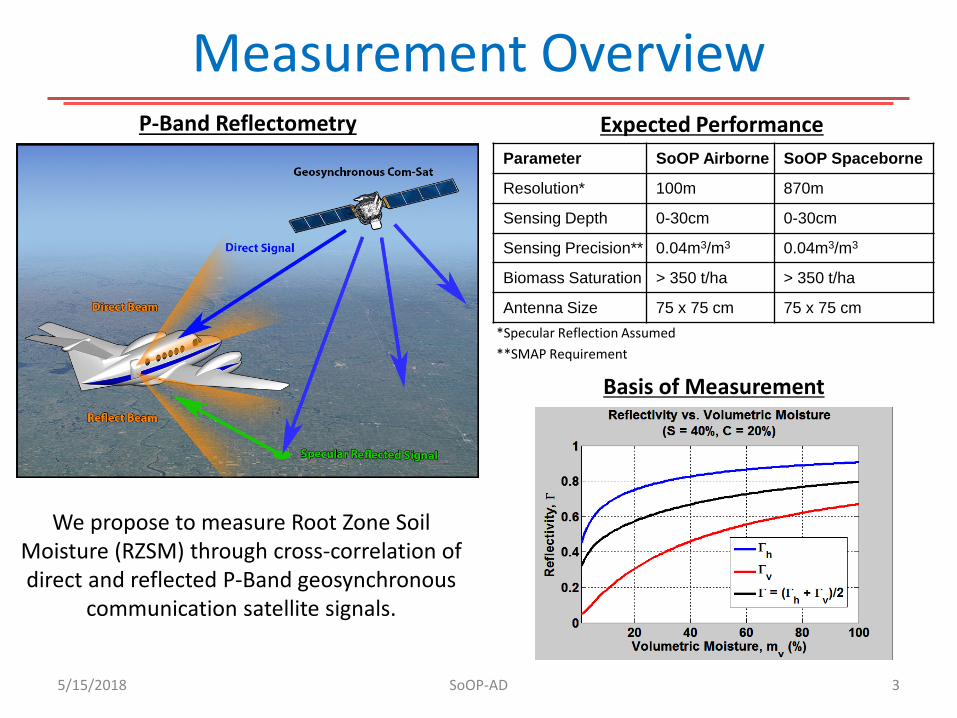
Measurement Overview
We propose to measure Root Zone Soil Moisture (RZSM) through cross-correlation of direct and reflected P-Band geosynchronous
communication satellite signals.
5/15/2018 SoOP-AD 3
Expected PerformanceParameter SoOP Airborne SoOP Spaceborne
Resolution* 100m 870m
Sensing Depth 0-30cm 0-30cm
Sensing Precision** 0.04m3/m3 0.04m3/m3
Biomass Saturation > 350 t/ha > 350 t/ha
Antenna Size 75 x 75 cm 75 x 75 cm
P-Band Reflectometry
*Specular Reflection Assumed**SMAP Requirement
Basis of Measurement

Project Team
• Purdue UniversitySimulation, Retrieval Algorithms, Requirements Def.
– PI: Jim Garrison (Assoc. Prof)– Georges Stienne (Post-doc)– Yao-Cheng “Zenki” Lin (PhD candidate)
• NASA GSFCSystems Engineering, RF Design, Aircraft Integration– Co-I: Jeff Piepmeier (555)– Co-I: Joe Knuble (555)– Ken Hersey (AS&D)– Cornelus Du Toit (AS&D)– Co-I: Alicia Joseph (617)
5/15/2018 SoOP-AD 4
• Exelis, IncDigital Receiver Design– George Alikakos– Co-I: Steve O’Brien
• Langley Research CenterAircraft Operations– Bruce Fisher
• Dr. Stephen Katzberg – ConsultantScattering Model, Signal Processing

Scientific Motivation
5/15/2018 SoOP-AD 5
• Root Zone Soil Moisture (RZSM):– Water in top ~meter of soil– Critical link between surface hydrology and deeper process– Drainage and absorption by plant roots– Connection between near-term precipitation and long-
term availability of fresh water
• Biomass: a related measurement– Carbon storage in vegetation – key part of CO2 balance– Raw material and source of 9-13% of World’s energy
Current Sensing Limitations
5/15/2018 SoOP-AD 6
• L-Band– L-band (SMAP) penetrates only few cm of soil– Saturation at L-band limits the ability to sense soil
moisture through vegetation– SMAP Level 4 data product to estimate RZSM
• P-band radar – Difficult to find allocation in heavily utilized spectrum– ESA-BIOMASS cannot operate in North America or Europe
due to interference with Space Object Tracking Radar– 4G mobile network may also cause problems– Expensive from space

SoOp Solution
5/15/2018 SoOP-AD 7
• We propose to use the principles of reflectometry and reflected SATCOM signals to measure RZSM. – Cross correlation of direct and reflected signals will be used to
measure reflection coefficient.– SoOP-AD will first measure RZSM from an aircraft.
• SoOP-AD will use the geostationary P-band satcom systems– 225-420MHz allocation for government use, SoOP will focus on 240-
270MHz band: 18 25KHz channels, 20 5KHz channels.– Continuous use by US since 1978 – SoOP-AD method measures correlation of direct and reflected signals -
does not require demod / decode of the transmission.

SoOp-AD Mission Highlights• IIP Timeline
– Awarded in April ’14. – Subsystem I&T at GSFC this summer. – Science flights in Fall of ‘16.
• Instrument– Antennas: Patch, Dual Linear Pol, Null Steering– Receivers: Standard P-Band Receivers w/ internal
calibration. S-Band receiver for XM Radio included. Brassboard and compact card.
– Digital System: FPGA based. 7TB Storage: 1 hour of raw data or many days of processed data.
• Aircraft Campaign – Flying on NASA Langley B200. – Co-Flying with SLAP instrument (GSFC’s Active /
Passive L-Band). – Science flights over the St. Joseph’s Watershed.– Two aircraft racks: 12U Total
5/15/2018 SoOP-AD 8

Signal Bands and Coverage
5/15/2018 SoOP-AD 9
240 245 250 255 260 265 2700
0.5
1
Frequency (MHz)
November Oscar Papa Quebec
5 kHz channels 25 kHz channels
(Satellite Names)

Measured Signal Details & RFI
5/15/2018 SoOP-AD 10
Waterfall spectrum measured at GSFC over 11 days. Note persistence of satcom signals and broad-band RFI.

Direct Signal Link Budgets
5/15/2018 SoOP-AD 11
P-Band S-Band
EIRP (dBW) 26 68
Frequency (MHz) 240-270 2332.5-2045.0
Bandwidth 25 kHz 1.886 MHz
Longitude (deg) -99.2 -105.6 -85 -105
Distance (km) 38128 38512 37447 38474
Path loss (dB) -172.44 -172.53 -191.31 -191.54
Atmospheric loss (dB) -1 dB
Sky-view antenna gain 7 dB
Sky-view antenna noise 145.0 K
Pre-switch noise 212.2 K
Post-switch noise 350.0 K
Total noise 707.2 K / -156.12 dBW 707.2 K / -137.35 dBW
SNR (dB) 15.7 15.6 20.1 19.8

SoOp-AD System Architecture
5/15/2018 SoOP-AD 12
Correlator: < Reflect-V*Reflect-V >*8 Channels
Correlator: < Direct-H*Reflect-V >*8 Channels
CH1CH2
CH8CH..
CH1CH2
CH8CH..
TC
Direct-H
Direct-V
Reflect-H
Reflect-V
TC
TC
TC TWPTC
tE tS tL
Z(0)
Z(tS)
Z(tE)
Z(tL)
CH1CH2
CH8CH..
RF Receiver ChannelizerCorrelator: < Direct-H*Reflect-H >*8 Channels
tN
Z(tN)
CH1CH2
CH8CH..
Complete 4x4 Matrix Inc. Cross-Pol & Auto-Corr.
400
Com
plex
Ter
ms
To Correlator
RF SYSTEM DIGITAL RECEIVER
Raw Data Mode
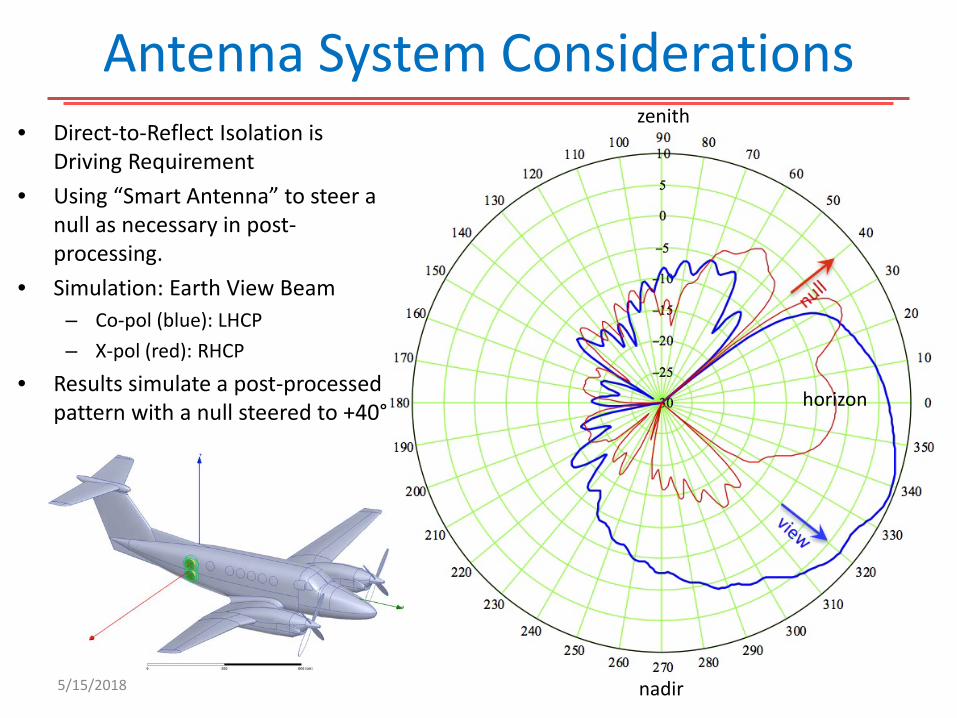
Antenna System Considerations
5/15/2018 SoOP-AD 13
• Direct-to-Reflect Isolation is Driving Requirement
• Using “Smart Antenna” to steer a null as necessary in post-processing.
• Simulation: Earth View Beam– Co-pol (blue): LHCP– X-pol (red): RHCP
• Results simulate a post-processed pattern with a null steered to +40° horizon
nadir
zenith
Measurement Simulation
5/15/2018 SoOP-AD 14
• Purpose:– Science requirement flow-down to technology requirements– Error budget– First generation retrieval algorithms
• Two Methods: Synthetic (IF) Signal Generator (forward) and Extended Kalman Filter (inverse estimator)
• Evaluate Error Sources against 0.04m3/m3 Precision Req.– SNR– Direct signal leakage into reflect antenna (easier in orbit!)– Multiple Satellite Interference / Isolation– Antenna Pattern Knowledge– Aircraft Position & Attitude Knowledge – Number of correlation delays– Terrain Height Fluctuation– RFI

Modelling Details
5/15/2018 SoOP-AD 15
Space signals models:
Receiver channels signals models:
-500 -400 -300 -200 -100 0 100 200 300 400 50000.51
1.52
2.53
3.54 x 10⁻¹⁵
Offset (Samples)
Cor
rela
tion
0
EIRP: 14 dBWBW: 25 kHz𝑮𝑮𝑺𝑺,𝑫𝑫: 8 dB𝑮𝑮𝑺𝑺,𝑹𝑹: -4 dB𝑮𝑮𝑬𝑬,𝑫𝑫L -9 dB𝑮𝑮𝑬𝑬,𝑹𝑹: 7 dBΓ: 0.5
Measurements are made on samples of Z11(autocorrelation of channel 1), Z22(autocorrelation of channel 2) and Z12 (cross-correlation between channel 1 and channel 2)
Reb
Deb
jtjRRR
jtjDDD
eetaCtx
eetaCtxτωω
τωω
τ
τ−
−
−=
−=
)()(
)()(
( )( ))()()()(
)()()()(
2,2,22
1,1,11
tntxGGtxGGftx
tntxGGtxGGftx
RREDDERF
RRSDDSRF
++=
++=
GS,D
GS,R
GE,R
GE,D
x1x2
G1
G2
Specular delay (τR-τD)
Extended Kalman Filter Method
5/15/2018 SoOP-AD 16
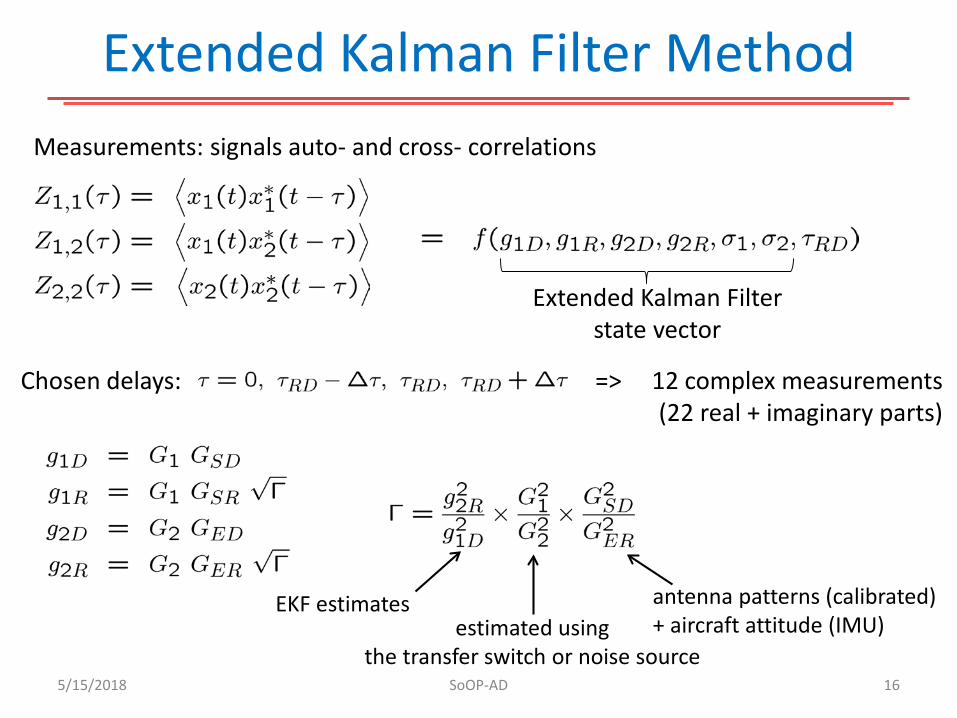
Measurements: signals auto- and cross- correlations
Chosen delays: => 12 complex measurements(22 real + imaginary parts)
Extended Kalman Filterstate vector
EKF estimatesestimated using
the transfer switch or noise source
antenna patterns (calibrated)+ aircraft attitude (IMU)
Modelling Results
5/15/2018 SoOP-AD 17
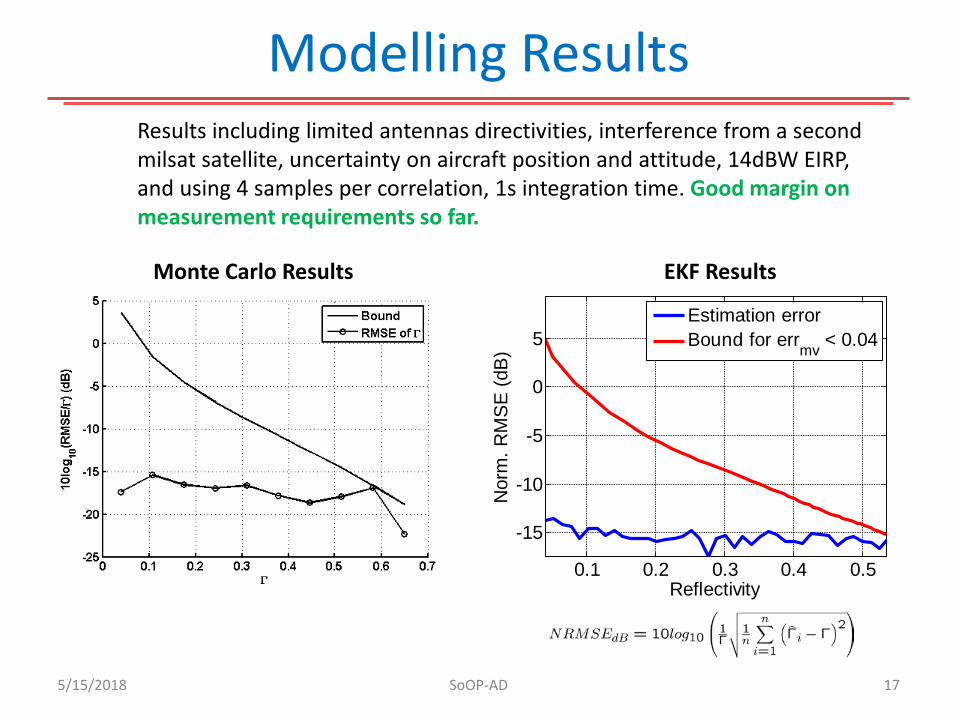
Results including limited antennas directivities, interference from a second milsat satellite, uncertainty on aircraft position and attitude, 14dBW EIRP, and using 4 samples per correlation, 1s integration time. Good margin on measurement requirements so far.
0.1 0.2 0.3 0.4 0.5
-15
-10
-5
0
5
Reflectivity
Nor
m. R
MS
E (d
B)
Estimation errorBound for errmv < 0.04
Monte Carlo Results EKF Results
Next Steps
• Continue Model Refinement• Perform I&T at GSFC this Summer• Field campaign using a tower• Aircraft campaign
5/15/2018 SoOP-AD 18