sify technologies limited notes to the...
TRANSCRIPT

1
SIFY TECHNOLOGIES LIMITED
NOTES TO THE CONSOLIDATED FINANCIAL STATEMENTS
(In thousands of Rupees, except share data and as stated otherwise)
1. Reporting entity
Sify Technologies Limited, („Sify‟ or „the Company‟) formerly known as Sify Limited and Satyam Infoway Private Limited, is a
leading internet services provider headquartered in Chennai, India. These Consolidated Financial Statements comprise the
Company and its subsidiaries (Sify Software Limited (formerly Sify Networks Private Limited), Sify Technologies (Singapore)
Pte. Limited, Hermit Projects Private Limited and Pace Info Com Park Private Limited) (together referred to as the „Group‟ and
individually as „Group entities‟). The Group is primarily involved in providing services, such as Network and IT Services, Online
Portal and Content offerings and in selling hardware and software related to such services. Sify is listed on the NASDAQ Global
Select Market in the United States.
2. Basis of preparation
a. Statement of compliance
The accompanying Consolidated Financial Statements of the Group have been prepared in accordance with International Financial
Reporting Standards (IFRS) and its interpretations as issued by the International Accounting Standards Board (IASB).
These Consolidated Financial Statements have been approved for issue by the Board of Directors on July 30, 2013.
b. Basis of measurement
These Consolidated Financial Statements have been prepared on the historical cost basis except for the following:
Available for sale financial assets are measured at fair value
Non-current asset held for sale measured at lower of carrying value and fair value less costs to sell.
Derivative financial instruments are measured at fair value
Financial instruments at fair value through profit or loss are measured at fair value.
The defined benefit asset is recognized as the net total of the plan assets, plus unrecognized past service cost and unrecognized
actuarial losses, less unrecognized actuarial gains and the present value of the defined benefit obligation.
In relation to lease prepayments, the initial fair value of the security deposit, is estimated as the present value of the refundable
amount, discounted using the market interest rates for similar instruments. The difference between the initial fair value and the
refundable amount of the deposit is recognized as a lease prepayment.
The above items have been measured at fair value and the methods used to measure fair values are discussed further in Note 4.
c. Functional and presentation currency
Items included in the financial statements of each Group entity are measured using the currency of the primary economic
environment in which the entity operates (“the functional currency”). Indian rupee is the functional currency of Sify, its domestic
subsidiaries and affiliates. The U.S. dollar is the functional currency of Sify‟s foreign subsidiary located in Singapore.
The Consolidated Financial Statements are presented in Indian Rupees which is the Group‟s presentation currency. All financial
information presented in Indian Rupees has been rounded up to the nearest thousand except where otherwise indicated.
Convenience translation (unaudited): Solely for the convenience of the reader, the financial statements as of and for the year ended
March 31, 2013 have been translated into United States dollars (neither the presentation currency nor the functional currency of the
Group) based on the reference rate in the City of Mumbai on March 31, 2013, for cable transfers in Indian rupees as published by
the Reserve Bank of India which was Rs.54.39 per $1.00. No representation is made that the Indian rupee amounts have been,
2
could have been or could be converted into United States dollar at such a rate or at any other rate on March 31, 2013 or at any
other date.
d. Use of estimates
The preparation of Consolidated Financial Statements in conformity with IFRS requires management to make judgements,
estimates and assumptions that affect the application of accounting policies and the reported amounts of assets, liabilities, the
disclosures of contingent assets and contingent liabilities at the date of financial statements, income and expenses during the
period. Actual results may differ from these estimates. Estimates and underlying assumptions are reviewed on an ongoing basis.
Revisions to accounting estimates are recognized in the period in which the estimates are revised and in future periods which are
affected.
Application of accounting policies that require critical accounting estimates and assumption having the most significant effect on
the amounts recognized in the financial statements are:
Measurement of the recoverable amounts of cash-generating units containing goodwill (Note 6)
Useful lives of property, plant and equipment (Note 3 e and Note 5)
Useful lives of intangible assets (Note 3 f and Note 6)
Lease classification (Note 3 h, 9, 17 and 32)
Utilization of tax losses (Note 11)
Measurement of defined employee benefit obligations (Note 18)
Measurement of share-based payments (Note 29 and Note 36)
Valuation of financial instruments (Note 3 c, 4, 37 and 38)
Provisions and contingencies (Note 3 n and 34)
Determination of percentage completion in construction contracts (Note 3 j)
3. Significant accounting policies
The accounting policies set out below have been applied consistently to all periods presented in these Consolidated Financial
Statements.
a. Basis of consolidation
The financial statements of the Group companies are consolidated on a line-by-line basis. Intra-group balances and transactions,
and any unrealized income and expenses arising from intra-group transactions, are eliminated. These financial statements are
prepared by applying uniform accounting policies in use at the Group.
(i) Subsidiaries
Subsidiaries are entities controlled by the Company. Control exists when the Company has the power directly/indirectly to govern
the financial and operating policies of an entity so as to obtain benefits from its activities. In assessing control, potential voting
rights that currently are exercisable are taken into account. The financial statements of subsidiaries are consolidated from the date
that control commences until the date that control ceases. The accounting policies of subsidiaries have been changed where
necessary to align them with the policies adopted by the Group.
(ii) Associates (equity accounted investees)
Associates are those entities where the Group has significant influence, but not control, over the financial and operating policies.
Associates are accounted for using the equity method (equity accounted investees) and are initially recognized at cost. The
Group‟s investment includes goodwill identified on acquisition, net of any accumulated impairment losses. The Consolidated
Financial Statements include the Group‟s share of the income and expenses and equity movements of equity accounted investees
from the date that significant influence commences until the date that significant influence ceases. The investment would be
classified as „held for sale‟ when the carrying amount of the investment will be recovered through a sale transaction rather than
through its continued use and such sale is highly probable. Such investments are measured at the lower of its carrying amount and
fair value less cost to sell. When the Group‟s share of losses exceeds its interest in an equity accounted investee, the carrying
amount of that interest (including any long-term investments) is reduced to nil and the recognition of further losses is discontinued
except to the extent that the Group has an obligation or has made payments on behalf of the investee.

3
b. Foreign currency
(i) Foreign currency transactions
Transactions in foreign currencies are initially recognized in the financial statements using exchange rates prevailing on the date of
transaction. Monetary assets and liabilities denominated in foreign currencies are translated to the relevant functional currency at the
exchange rates prevailing at the reporting date. Non-monetary assets and liabilities denominated in foreign currencies that are
measured at fair value are retranslated to the functional currency at the exchange rate at the date that the fair value was determined.
Non-monetary assets and liabilities denominated in a foreign currency and measured at historical cost are translated at the exchange
rate prevalent at the date of transaction. Foreign currency differences arising on translation are recognized in the income statement
for determination of net profit or loss during the period.
(ii) Foreign operations
The assets and liabilities of foreign operations, including goodwill and fair value adjustments arising on acquisition, are translated
to the functional currency at exchange rates at the reporting date. The income and expenses of foreign operations and cash flows
are translated to using average exchange rates during the period. Any differences arising on such translation are recognized in other
comprehensive income. Such differences are included in the foreign currency translation reserve “FCTR” within other components
of equity. When a foreign operation is disposed off, in part or in full, the relevant amount in the FCTR is transferred to profit or
loss.
c. Financial instruments
(i) Non-derivative financial instruments
Non-derivative financial instruments comprise investments in equity and debt securities, trade and other receivables, cash and cash
equivalents, loans and borrowings, and trade and other payables.
Non-derivative financial instruments are recognized initially at fair value plus any directly attributable transaction costs. However
if the instrument is recognized as at fair value through profit or loss then any directly attributable transaction costs are recognized
in profit or loss as incurred. Subsequent to initial recognition non-derivative financial instruments are measured as described
below:
Non-derivative financial assets
a) Available-for-sale financial assets
Available-for-sale (AFS) financial assets are those non-derivative financial assets that are designated as available for sale or are not
classified as (a) loans and receivables, (b) held-to-maturity investments or (c) financial assets at fair value through profit or loss in
accordance with IAS 39.
Investments in equity and certain debt securities are initially recognized at fair value and classified as available-for-sale financial
assets. Subsequent to initial recognition, they are measured at fair value and changes therein, other than impairment losses and
foreign exchange gains and losses on available-for-sale monetary items are recognized directly in other comprehensive income.
When an investment is de-recognized, the cumulative gain or loss in equity is transferred to profit or loss. These are presented as
current assets unless the management intends to dispose of the assets after 12 months from the balance sheet date.
b) Loans and receivables
Loans and receivables are non-derivative financial assets with fixed or determinable payments that are not quoted in an active
market. These are presented as current assets, except for those maturing later than 12 months after the balance sheet date which are
presented as non-current assets. Loans and receivables are initially measured at fair value plus transaction costs and subsequently
carried at amortized cost using the effective interest method, less any impairment loss. Loans and receivables are represented by
trade receivables, unbilled revenue, cash and cash equivalents. Cash and cash equivalents comprise cash balances and demand
deposits. Bank overdrafts that are repayable on demand and form an integral part of the Group‟s cash management are included as
a component of cash and cash equivalents for the purpose of the statement of cash flows.

4
c) Others
Other non-derivative financial instruments are measured at amortized cost using the effective interest method, less any impairment
losses.
Non-derivative financial liabilities
The Group classifies non-derivative financial liabilities to the other financial liabilities category. Such financial liabilities are
recognized initially at fair value plus any directly attributable transaction costs. Subsequent to initial recognition, these financial
liabilities are measured at amortized cost using the effective interest method.
Offsetting of Financial assets and Financial Liabilities
Financial assets and liabilities are offset and the net amount presented in the statement of financial position when, and only when,
the Group has a legal right to offset the amounts and intends either to settle on a net basis or to realize the assets and settle the
liability simultaneously.
(ii) Derivative financial instruments
Foreign exchange forward contracts and options are entered into by the Group to mitigate the risk of changes in foreign exchange
rates associated with certain payables, receivables and forecasted transactions denominated in certain foreign currencies.
These derivative contracts do not qualify for hedge accounting under IAS 39, and are initially recognized at fair value on the date
the contract is entered into and subsequently re-measured at their fair value. Gains or losses arising from changes in the fair value
of the derivative contracts are recognized immediately in profit or loss. Embedded derivatives are separated from the host contract
and accounted for separately if the economic characteristics and risks of the host contract and the embedded derivative are not
closely related, a separate instrument with the same terms as the embedded derivative would meet the definition of a derivative,
and the combined instrument is not measured at fair value through profit or loss.
d. Share capital
Ordinary shares are classified as equity. Incremental costs directly attributable to the issue of new ordinary shares or share options
are recognized as a deduction from equity, net of any tax effects.
e. Property, plant and equipment
Property, plant and equipment is stated at cost less accumulated depreciation and where applicable accumulated impairment losses.
Cost includes expenditure that is directly attributable to the acquisition of the asset. The cost of self-constructed assets includes the
cost of materials, direct labour and any other costs directly attributable to bringing the asset to a working condition for its intended use,
and the costs of dismantling and removing the items and restoring the site on which they are located. Purchased software that is integral
to the functionality of the related equipment is capitalized as part of that equipment.
When parts of an item of property, plant and equipment have different useful lives, they are accounted for as separate items (major
components) of property, plant and equipment.
Gains and losses on disposal of an item of property, plant and equipment are determined by comparing the proceeds from disposal
with the carrying amount of property, plant and equipment and are recognized net within “other income / other expenses” in
statement of income.
(i) Subsequent costs
The cost of replacing part of an item of property, plant and equipment is recognized in the carrying amount of the item if it is
probable that the future economic benefits embodied within the part will flow to the Group and its cost can be measured reliably.
The carrying amount of the replaced part is de-recognized. The costs of the day-to-day servicing of property, plant and equipment
are recognized in profit or loss as incurred.
(ii) Depreciation
5
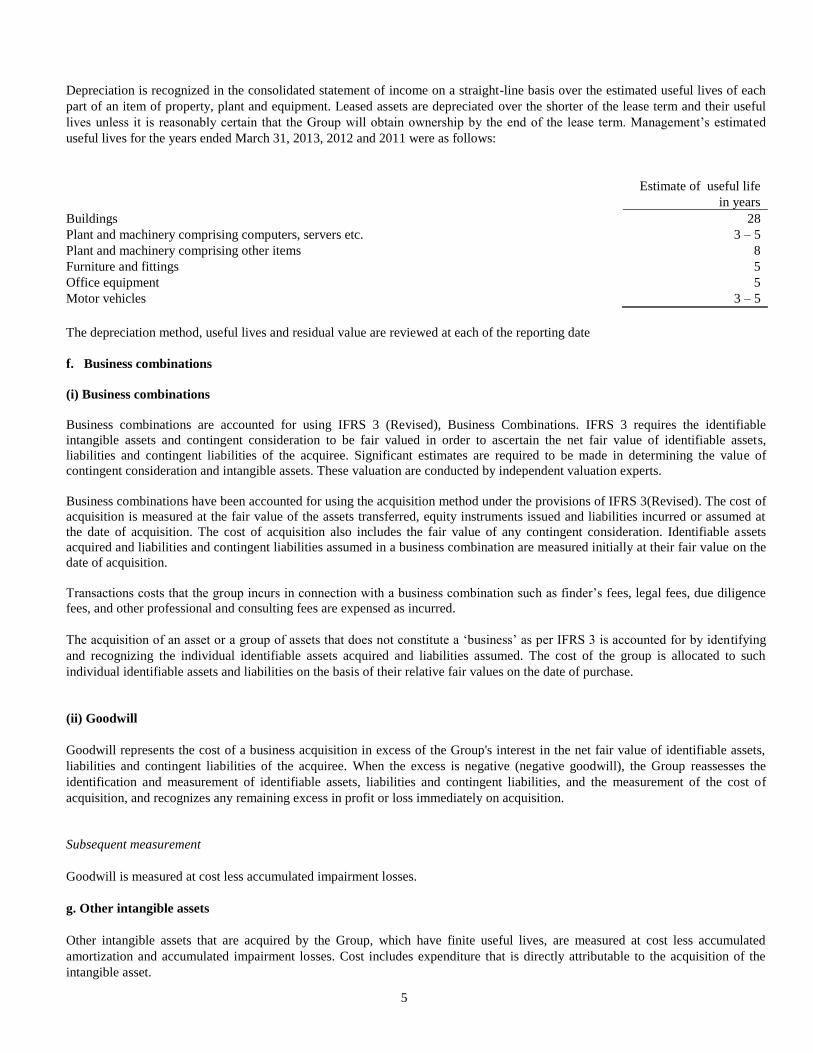
Depreciation is recognized in the consolidated statement of income on a straight-line basis over the estimated useful lives of each
part of an item of property, plant and equipment. Leased assets are depreciated over the shorter of the lease term and their useful
lives unless it is reasonably certain that the Group will obtain ownership by the end of the lease term. Management‟s estimated
useful lives for the years ended March 31, 2013, 2012 and 2011 were as follows:
Estimate of useful life
in years
Buildings 28
Plant and machinery comprising computers, servers etc. 3 – 5
Plant and machinery comprising other items 8
Furniture and fittings 5
Office equipment 5
Motor vehicles 3 – 5
The depreciation method, useful lives and residual value are reviewed at each of the reporting date
f. Business combinations
(i) Business combinations
Business combinations are accounted for using IFRS 3 (Revised), Business Combinations. IFRS 3 requires the identifiable
intangible assets and contingent consideration to be fair valued in order to ascertain the net fair value of identifiable assets,
liabilities and contingent liabilities of the acquiree. Significant estimates are required to be made in determining the value of
contingent consideration and intangible assets. These valuation are conducted by independent valuation experts.
Business combinations have been accounted for using the acquisition method under the provisions of IFRS 3(Revised). The cost of
acquisition is measured at the fair value of the assets transferred, equity instruments issued and liabilities incurred or assumed at
the date of acquisition. The cost of acquisition also includes the fair value of any contingent consideration. Identifiable assets
acquired and liabilities and contingent liabilities assumed in a business combination are measured initially at their fair value on the
date of acquisition.
Transactions costs that the group incurs in connection with a business combination such as finder‟s fees, legal fees, due diligence
fees, and other professional and consulting fees are expensed as incurred.
The acquisition of an asset or a group of assets that does not constitute a „business‟ as per IFRS 3 is accounted for by identifying
and recognizing the individual identifiable assets acquired and liabilities assumed. The cost of the group is allocated to such
individual identifiable assets and liabilities on the basis of their relative fair values on the date of purchase.
(ii) Goodwill
Goodwill represents the cost of a business acquisition in excess of the Group's interest in the net fair value of identifiable assets,
liabilities and contingent liabilities of the acquiree. When the excess is negative (negative goodwill), the Group reassesses the
identification and measurement of identifiable assets, liabilities and contingent liabilities, and the measurement of the cost of
acquisition, and recognizes any remaining excess in profit or loss immediately on acquisition.
Subsequent measurement
Goodwill is measured at cost less accumulated impairment losses.
g. Other intangible assets
Other intangible assets that are acquired by the Group, which have finite useful lives, are measured at cost less accumulated
amortization and accumulated impairment losses. Cost includes expenditure that is directly attributable to the acquisition of the
intangible asset.
6
(i) Subsequent expenditure
Subsequent expenditure is capitalized only when it increases the future economic benefits embodied in the specific asset to which
it relates. All other expenditure, including expenditure on internally generated goodwill and brands, are recognized in profit or loss
as incurred.
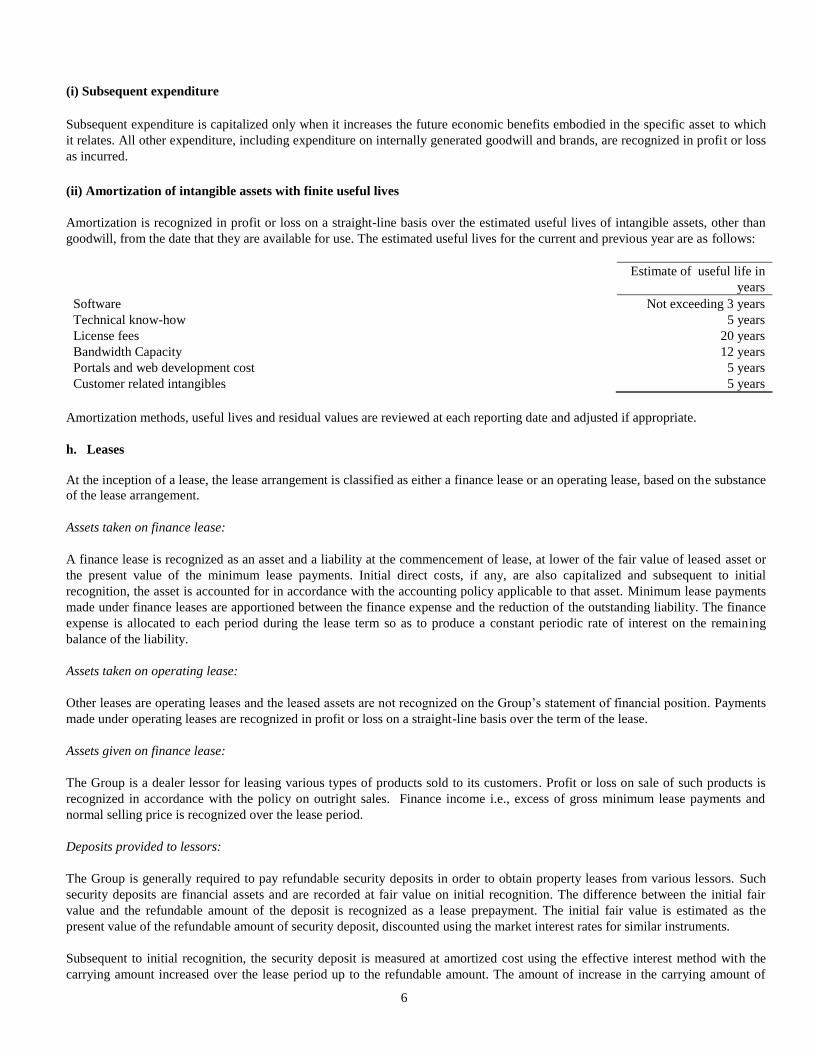
(ii) Amortization of intangible assets with finite useful lives
Amortization is recognized in profit or loss on a straight-line basis over the estimated useful lives of intangible assets, other than
goodwill, from the date that they are available for use. The estimated useful lives for the current and previous year are as follows:
Estimate of useful life in
years
Software Not exceeding 3 years
Technical know-how 5 years
License fees 20 years
Bandwidth Capacity 12 years
Portals and web development cost 5 years
Customer related intangibles 5 years
Amortization methods, useful lives and residual values are reviewed at each reporting date and adjusted if appropriate.
h. Leases
At the inception of a lease, the lease arrangement is classified as either a finance lease or an operating lease, based on the substance
of the lease arrangement.
Assets taken on finance lease:
A finance lease is recognized as an asset and a liability at the commencement of lease, at lower of the fair value of leased asset or
the present value of the minimum lease payments. Initial direct costs, if any, are also capitalized and subsequent to initial
recognition, the asset is accounted for in accordance with the accounting policy applicable to that asset. Minimum lease payments
made under finance leases are apportioned between the finance expense and the reduction of the outstanding liability. The finance
expense is allocated to each period during the lease term so as to produce a constant periodic rate of interest on the remaining
balance of the liability.
Assets taken on operating lease:
Other leases are operating leases and the leased assets are not recognized on the Group‟s statement of financial position. Payments
made under operating leases are recognized in profit or loss on a straight-line basis over the term of the lease.
Assets given on finance lease:
The Group is a dealer lessor for leasing various types of products sold to its customers. Profit or loss on sale of such products is
recognized in accordance with the policy on outright sales. Finance income i.e., excess of gross minimum lease payments and
normal selling price is recognized over the lease period.
Deposits provided to lessors:
The Group is generally required to pay refundable security deposits in order to obtain property leases from various lessors. Such
security deposits are financial assets and are recorded at fair value on initial recognition. The difference between the initial fair
value and the refundable amount of the deposit is recognized as a lease prepayment. The initial fair value is estimated as the
present value of the refundable amount of security deposit, discounted using the market interest rates for similar instruments.
Subsequent to initial recognition, the security deposit is measured at amortized cost using the effective interest method with the
carrying amount increased over the lease period up to the refundable amount. The amount of increase in the carrying amount of
7
deposit is recognized as interest income. The lease prepayment is amortized on a straight line basis over the lease term as a lease
rental expense.
Indefeasible Right of Use (IRU)
The Company has entered into IRU arrangements which entitle the company to right of use of specified bandwidth capacity for a
specified period of time. Such right is being treated as operating lease since the risks and rewards are not transferred to the
Company. Hence, the upfront payments made towards right of use of bandwidth capacities under such agreements have been
treated as prepayments and is amortized over the term of the contract.
i. Inventories
Inventories comprising traded hardware and software are measured at the lower of cost (determined using first-in first-out method)
and net realizable value. Cost comprises cost of purchase and all directly attributable costs incurred in bringing the inventories to
their present location and condition. Net realizable value is the estimated selling price in the ordinary course of business, less the
estimated costs of completion and selling expenses.
j. Construction contracts in progress
Construction contracts in progress represent the gross unbilled amount expected to be collected from customers for contract work
performed to date. It is measured at cost plus profit recognized to date less progress billing and recognized losses. Cost includes all
expenditure related directly to specific projects and an allocation of fixed and variable overheads incurred in the Group‟s contracts
and activities based on normal operating capacity.
Construction contract in progress is presented as part of trade and other receivable in statement of financial position for all
contracts in which costs incurred plus recognized profit exceed progress billings. If progress billings exceeds cost incurred plus
recognized profits, then the difference is presented as deferred income / revenue in the statement of financial position.
k. Impairment
Financial assets
A financial asset is assessed at each reporting date to determine whether there is any objective evidence that a financial asset or
group of financial assets is impaired. A financial asset is considered to be impaired and impairment losses are recognized, if
objective evidence indicates that one or more events such as a loss event, the significant financial difficulty of the issuer, a breach
of contract, the disappearance of an active market, which have had a negative effect on the estimated future cash flows of that
asset. The remaining financial assets are assessed collectively in groups that share similar credit risk characteristics.
Financial assets measured at amortized cost
An impairment loss in respect of a financial asset measured at amortized cost is calculated as the difference between its carrying
amount, and the present value of the estimated future cash flows discounted at the original effective interest rate.
Available-for-sale financial assets
Significant or prolonged decline in the fair value of the security below its cost and the disappearance of an active trading market
for the security are objective evidence that the security is impaired. An impairment loss in respect of an available-for-sale financial
asset is calculated by reference to its fair value. The cumulative loss that was recognized in the equity is transferred to the
consolidated income statement upon impairment. Such impairment loss is recognized in the consolidated income statement.
Loans and receivables
Impairment loss in respect of loans and receivables measured at amortized cost are calculated as the difference between their
carrying amount, and the present value of the estimated future cash flows discounted at the original effective interest rate. Such
impairment loss is recognized in the consolidated income statement.
Reversal of impairment loss
An impairment loss is reversed if the reversal can be related objectively to an event occurring after the impairment loss was
recognized. For financial assets measured at amortized cost and available-for-sale financial assets that are debt securities, the

8
reversal is recognized in profit or loss. For available-for-sale financial assets that are equity securities, the reversal is recognized
directly in other comprehensive income and presented within equity.
Non-financial assets
The carrying amounts of the Group‟s non-financial assets, other than inventories and deferred tax assets are reviewed at each
reporting date to determine whether there is any indication of impairment. If any such indication exists, then the asset‟s recoverable
amount is estimated. For goodwill, the recoverable amount is estimated each year at December 31.
The recoverable amount of an asset or cash-generating unit is the greater of its value in use and its fair value less costs to sell. In
assessing value in use, the estimated future cash flows are discounted to their present value using a pre-tax discount rate that
reflects current market assessments of the time value of money and the risks specific to the asset. For the purpose of impairment
testing, assets that cannot be tested individually are grouped together into the smallest group of assets that generates cash inflows
from continuing use that are largely independent of the cash inflows of other assets or groups of assets (the “cash-generating unit”).
The goodwill acquired in a business combination, for the purpose of impairment testing, is allocated to cash-generating units that
are expected to benefit from the synergies of the combination. Corporate assets for the purpose of impairment testing are allocated
to the cash generating units on a reasonable and consistent basis.
An impairment loss is recognized if the carrying amount of an asset or its cash-generating unit exceeds its estimated recoverable
amount. Impairment losses are recognized in profit or loss. Impairment losses recognized in respect of cash-generating units are
allocated first to reduce the carrying amount of any goodwill allocated to the units and then to reduce the carrying amount of the
other assets in the unit or group of units on a pro rata basis.
Reversal of impairment loss
An impairment loss in respect of goodwill is not reversed. In respect of other assets, impairment losses recognized in prior periods
are assessed at each reporting date for any indications that the loss has decreased or no longer exists. An impairment loss is
reversed if there has been a change in the estimates used to determine the recoverable amount. An impairment loss is reversed only
to the extent that the asset‟s carrying amount does not exceed the carrying amount that would have been determined, net of
depreciation or amortization, if no impairment loss had been recognized directly in other comprehensive income and presented
within equity.
l. Employee benefits
Employee benefits are accrued in the period in which the associated services are rendered by employees of the Group, as detailed
below:
(a) Defined contribution plan (Provident fund)
In accordance with Indian law, all employees receive benefits from a provident fund, which is a defined contribution plan. Both
the employee and employer make monthly contributions to the plan, each equal to a specified percentage of employee‟s basic
salary. The Group has no further obligations under the plan beyond its monthly contributions. The Group does not have any legal
or constructive obligation to pay further contributions if the fund does not hold sufficient assets to pay all employee benefits
relating to employee service in the current and prior periods. Obligation for contributions to the plan is recognized as an employee
benefit expense in profit or loss when incurred.
(b) Defined benefit plans (Gratuity)
In accordance with applicable Indian laws, the Group provides for gratuity, a defined benefit retirement plan (the Gratuity Plan)
covering all employees. The Gratuity Plan provides a lump sum payment to vested employees, at retirement or termination of
employment, an amount based on the respective employee‟s last drawn salary and the years of employment with the Group. The
Company‟s net obligation in respect of the gratuity plan is calculated by estimating the amount of future benefits that the
employees have earned in return for their service in the current and prior periods; that benefit is discounted to determine its present
value. Any unrecognized past service cost and the fair value of plan assets are deducted. The discount rate is the yield at the
reporting date on risk free government bonds that have maturity dates approximating the terms of the Company‟s obligations. The
calculation is performed annually by a qualified actuary using the projected unit credit method. When the calculation results in a
9
benefit to the Group, the recognized asset is limited to the total of any unrecognized past service costs and the present value of
economic benefits available in the form of any future refunds from the plan or reductions in future contributions to the plan.
The Group recognizes all actuarial gains and losses arising from defined benefit plans directly in other comprehensive income and
presented within equity. The Company has an employees‟ gratuity fund managed by the Life Insurance Corporation of India (LIC) .
(c) Short term benefits
Short-term employee benefit obligations are measured on an undiscounted basis and are expensed as the related service is
provided. A liability is recognized for the amount expected to be paid under short-term cash bonus or profit-sharing plans if the
Group has a present legal or constructive obligation to pay this amount as a result of past service provided by the employee and the
obligation can be estimated reliably.
(d) Compensated leave of absence
The employees of the Group are entitled to compensated absence. The employees can carry forward a portion of the unutilized
accrued absence and utilize it in future periods or receive cash compensation at retirement or termination of employment for the
unutilized accrued compensated absence. The Group recognizes an obligation for compensated absences in the period in which the
employee renders the services. The Group provides for the expected cost of compensated absence as the additional amount that the
Group expects to pay as a result of the unused entitlement that has accumulated based on actuarial valuations at the balance sheet
date, carried out by an independent actuary.
m. Share-based payment transactions
The grant date fair value of options granted to employees is recognized as an employee expense, with a corresponding increase in
equity, over the period in which the options are vested. The increase in equity recognized in connection with a share based
payment transaction is presented as a separate component in equity. The amount recognized as an expense is adjusted to reflect the
actual number of share options that vest. In respect of options whose terms and conditions are modified, the Group includes the
incremental fair value of the options in the measurement of the amounts recognized for services received from the employees. The
incremental fair value is the difference between the fair value of the modified option and that of the original option both estimated
as at the date of the modification. If the modification occurs during the vesting period, the incremental fair value granted is
included in the measurement of the amount recognized for services received over the period from the modification date until the
date when the modified equity instruments vest, in addition to the amount based on the grant date fair value of the original equity
instruments, which is recognized over the remainder of the original vesting period. If the modification occurs after vesting date, the
incremental fair value granted is recognized immediately, or over the vesting period if the employee is required to complete an
additional period of service before becoming unconditionally entitled to those modified equity instruments.
n. Provisions
Provisions are recognized if, as a result of a past event, the Group has a present legal or constructive obligation that can be
estimated reliably, and it is probable that an outflow of economic benefits will be required to settle the obligation. If the effect of
the time value of money is material, provisions are discounted using a current pre tax rate that reflects, where appropriate, the risks
specific to the liability. Where discounting is used, the increase in the provision due to the passage of time is recognized as a
finance cost.
A provision for onerous contracts is recognized when the expected benefits to be derived by the Group from a contract are lower
than the unavoidable cost of meeting its obligations under the contract. The provision is measured at the present value of the lower
of the expected cost of terminating the contract and the expected net cost of continuing with the contract. Before a provision is
established, the Group recognizes any impairment loss on the assets associated with that contract.
o. Revenue
Revenue from the sale of goods is measured at the fair value of the consideration received or receivable, net of returns, trade
discounts and volume rebates. Revenue is recognized when the significant risks and rewards of ownership have been transferred to
the buyer, recovery of the consideration is probable, the associated costs and possible return of goods can be estimated reliably,
there is no continuing management involvement with the goods, and the amount of revenue can be measured reliably. Transfers of
risks and rewards vary depending on the individual terms of the contract of sale.
10
Revenue from services rendered is recognized in the consolidated income statement in proportion to the stage of completion of the
transaction at the reporting date.
The revenue recognition in respect of the various streams of revenue is described below:
(i) Enterprise services
Enterprise services revenue broadly consist revenue from Network services, IT services and Internet access services to retail
customers.
(a) Revenue from Network services: These primarily include connectivity services including installation of a connectivity link,
and to a lesser extent, sale of hardware and software (purchased from third party vendors). In certain cases, these elements are
sold as a package consisting all or some of the elements. In these cases the Group applies the recognition criteria to the
separately identifiable components of a single transaction in order to reflect the substance of the transaction with different
revenue allocations for each component. These multiple element arrangements are recognized as separable elements because
each element constitutes a separate earnings process, each element has a fair value that is reliable, verifiable and objectively
determinable, and the undelivered element is not essential to functionality of the delivered elements. In this arrangement
involving delivery of multiple elements, the units of accounting are determined based on whether the delivered items have a
value to the customer on a stand-alone basis, whether there is objective and reliable evidence of fair value of the undelivered
elements and if the arrangement includes a general right of return relative to the delivered item, whether delivery or
performance of the undelivered item(s) is considered probable and substantially in the control of the Group. The arrangement
consideration is allocated to the units of accounting based on their relative fair values. Revenue on delivered items is
recognized when the revenue recognition criteria applicable to that unit of accounting are met.
The Group provides connectivity for a fixed period of time at a fixed rate regardless of usage. Connectivity is the last element that
is provided in the case of a bundled contract. The connectivity charges are the same when sold alone or as part of a package. The
revenue attributable to connectivity services is recognized ratably over the period of the contract.
In circumstances where there is multi element arrangement that includes hardware or software sales and last mile connectivity
services, revenue from sale of hardware/software is recognized only upon completion of the services relating to last mile
connectivity. Installation consists of commissioning of the last mile connectivity to the customer premises either through the
Group‟s wireless mode of delivery or through the carrier exchange. When the customer has such last mile connectivity, the Group
does not charge any installation fee. Due to the short duration, the revenue attributable to the installation of the link is recognized
on completion of the installation work. All revenues are shown exclusive of sales tax and service tax.
The Company provides NLD (National Long Distance) and ILD (International Long Distance) services through company‟s
network. The Company carries international voice traffic using the back-bone and delivers voice traffic to Direct Inter-connect
Operators. Revenue is recognized based upon metered call units of voice traffic terminated on the Company‟s network.
(b) Revenue from IT services: Web hosting service revenues primarily include co-location services. In certain cases, the
Group also sells related hardware/software to its web hosting customers. This hardware as well as software are purchased from
outside vendors and are freely traded in the market. The Group treats each element as a separate component of the arrangement
which have separate earnings process. The value of the hosting service is determined based on fair value from similar services
provided separately by the Group. When hardware and/or software is also included with hosting services and sold as a package,
the revenue is allocated to the respective element based on their relative fair values. Revenue from hosting services is recognized
over the period during which the service is provided.
The Company also deals in hardware and software. These are standard products that are freely traded in and purchased from the
market, have standard specifications and are not otherwise customized for the specific needs of a customer. The software sold by
the Group is off-the-shelf software, such as antivirus utilities and firewalls. The fair value for the hardware and software is
available from the market. The revenue attributable to hardware/software is recognized on delivery. Trading transactions relating
to standard hardware and software and involving arrangement of purchases from suppliers and sales to customers are reported on
gross basis or on net basis, by carrying out a fact-specific evaluation of such transactions.
The Company generates revenue from construction of data centers. Revenue from such contracts includes the initial amount agreed
in the contract plus any variations in contract work, claims and incentive payments, to the extent that it is probable that they will
result in revenue and can be measured reliably. As soon as the outcome of a construction contract can be estimated reliably,
contract revenue is recognized in profit or loss in proportion to the stage of completion of the contract. Contract expenses are
recognized as incurred unless they create an asset related to future contract activity. The stage of completion is assessed by

11
reference to the cost incurred until date to the total estimated costs. When the outcome of a construction contract cannot be
estimated reliably, contract revenue is recognized only to the extent of contract costs incurred that are likely to be recoverable. An
expected loss on a contract is recognized immediately in profit or loss.
The Group remotely manages the Information Technology infrastructure of global enterprises from India. The contracts are on
time and material basis. Revenue in relation to „time‟ is measured as the agreed rate per unit of time multiplied by the units of time
expended. The element of revenue related to materials is measured in accordance with the terms of the contract. The revenue from
on-demand storage / cloud offering is recognized based on the class of offering and usage of services.
(c) Internet access services : It include Internet access at homes and businesses through dial-up or cable operator and internet
access through a network of cybercafés. It also includes revenues from Voice over Internet Protocol („VoIP‟) or Internet telephony.
Dial-up Internet access is sold to customers either for a specified number of hours or for an unlimited usage within a specified
period of time. Customers purchase “user accounts” or “top-ups” that enable them to access the Internet for a specified quantum of
usage or for a specified period of time all within a contracted period. The amount received from customers on the sale of these user
accounts or top-ups are not refundable. The revenue from sale of user accounts or top-ups is measured based on usage (where
access is for a specified quantum of usage) or based on the time of usage (where access is for a specified period of time) by the
customer. Any unused hours at the end of the contracted period are recognized as revenue.
VoIP services are mainly provided through Internet Telephony Booths at e-ports (formerly iway‟s) cybercafés and to a smaller
extent through Cable TV operators, (CTOs). The user purchases the packs that enable them to use the Internet telephone facility
through CTOs and revenue is recognized on the basis of usage by the customer. The customers use Internet telephony facilities at
the iway cybercafés and make the payment to the extent of usage of the facility.
Internet access at homes and businesses through cable networks, a franchised network of cable operators in India. Customers buy
“user accounts” for a specified usage or volume of data transfer or for a specified period of time all within a contracted period.
Revenues are recognized on actual usage by customer (where access is for a specified quantum of usage) and based on time (where
access is for a specified period of time). Any unused hours at the end of the contracted period are recognized as revenue.
In the case of franchised cybercafé operators, the Group enters into an agreement with the franchisee that establishes the rights and
obligations of each party and grants each franchisee a non-exclusive license to operate the cybercafé using the Group‟s logo, brand
and trade names. The cybercafés are owned and operated by the franchisees. The franchisee procures the retail space, invests in
furniture, interior decor, PCs, and point of sale signage and employs and trains the franchisee staff. The franchisee is responsible
for the maintenance of the premises and interface with customers. The Group provides the complete backend support, including
bandwidth, the authentication/usage engine and the billing and collection system.
In the case of franchised cable network operators and franchised cybercafé operators, the Group enters into a standard arrangement
with franchisees that provides for the payment to the Company, of an initial non-refundable franchisee fee in consideration for
establishing the franchisee relationship and providing certain initial services. The fee covers the following upfront services
rendered by the Group:
o conducting a market survey and deciding on the best location for the cybercafé or cable head end;
o installing the broadband receiver equipment on the roof top of the cybercafé or the cable head end and connecting it to
one of Sify‟s broadcasting towers;
o obtaining the regulatory approvals for clearance of the site for wireless transmission at the allotted frequency range;
o installing the wiring from the receiver unit to the individual PCs in the cybercafé or the transmitting equipment in the
cable head end;
o assisting in obtaining facilities, including computers and interiors for the cybercafés; and
o providing the operations manual with instructions and guidelines for running the cybercafé or distributing Internet access
through cable network.
The initial franchisee fee revenue is recognized as revenue when all of the obligations required of the Group have been
substantially accomplished or provided. Internet access revenue and Internet telephony revenues are recognized based on usage by
the customer.
After the commencement of the franchisee operations, the Company renders subsequent services to the franchised cybercafés in
form of providing bandwidth for establishing connectivity through supply of Sify cybercafé cards (typically called as „user
accounts‟ or „top ups‟), providing backend support, the authentication/usage engine and the billing and collection system. The
12
cybercafé cards enable the users to access the internet for a specified quantum of usage within a contracted period. As revenue
from these subsequent services constitute continuing services, the revenue from such services are recognised based on the usage as
the access is for a specified quantum of usage within a specified time. Any unused hours at the end of the contracted period are
recognised as revenue.
The Company, along with provisioning of bandwidth on a recurring basis, renders other services on an integrated basis including
backend support, authentication / usage engine and the billing and collection system to the franchisees. In such services, the
Company, through application software, helps the franchisee to keep online track of the usage of Sify cybercafé cards by the
customers and also helps in authenticating the customer log-ins at different Cyber cafes. Such services to the franchisees are billed
and recorded as deferred revenue when the customer purchases the card and revenue is recognised over the period of provisioning
of such services (i.e when the bandwidth is used by the customers).
(ii) Software services
The Group provides e-learning software development services to facilitate web-based learning in various organizations. The
contracts executed by the Company are not similar i.e. the efforts required to execute these contracts at each stage of development
process differ from customer to customer and the contract is executed based on specific requirements regarding
content/information of the customer. Thus the e-learning packages are specifically designed for the customer and accordingly, are
accounted for as customized programmes. These services include information presentation, structured content delivery, content
digitization and simulation based training. These services are generally provided on a fixed price basis. Revenue under such
contracts is recognized when the outcome of the transaction can be estimated reliably by reference to the stage of completion of
transaction at the reporting date. The stage of completion being determined based on the actual time spent to the total estimated
time. The revenue from Application Services such as online assessment, document management services, web development,
mailing solutions and supply chain software are recognized over the period of the contract.
Online portal services: The Group enters into contracts with customers to serve advertisements in its portal and the Group is paid
on the basis of impressions, click-throughs or leads and in each case the revenue is recognized based on actual impressions/click-
throughs/leads delivered. Revenue from advertisements displayed on portals is recognized ratably over the period of contract
In the case of electronic commerce transactions, there are no performance obligations or minimum guarantees. The Group
predominantly acts in the capacity of an agent rather than as the principal for these transactions, and the revenue recognized on a
net basis is the amount of the commission earned by the Group except for transactions related to “gift certificates” which are
accounted on “gross” basis.
In the case of value-added services that are rendered using Sify‟s mobile telephone short code 54545, revenue is recognized upon
delivery of the content/ring tones to the end subscriber and confirmation by the mobile phone service provider.
(iii) Deferred income
Deferred income represents billing in excess of revenue recognized.
p. Finance income and expense
Finance income comprises interest income on funds invested (including available-for-sale financial assets), dividend income, gains
on the disposal of available-for-sale financial assets, fair value gains on financial assets at fair value through profit or loss . Interest
income is recognized as it accrues in profit or loss, using the effective interest method. Dividend income is recognized in profit or
loss on the date when the Group‟s right to receive payment is established, which in the case of quoted securities is the ex-dividend
date.
Finance expense comprises interest expense on loans and borrowings, bank charges, unwinding of the discount on provision, losses
on disposal of available-for-sale financial assets, fair value losses on financial assets at fair value through profit or loss that are
recognized in statement of income.
q. Borrowing costs
Borrowing costs that are directly attributable to the acquisition, construction or production of a qualifying asset are capitalized as
part of the cost of that asset. Other borrowing costs are recognized as expenses in the period in which they are incurred. To the
extent the Group borrows funds generally and uses them for the purpose of obtaining a qualifying asset, the Group determines the

13
amount of borrowings costs eligible for capitalization by applying a capitalization rate to the expenditure incurred on such asset.
The capitalization rate is determined based on the weighted average of borrowing costs applicable to the borrowings of the Group
which are outstanding during the period, other than borrowings made specifically towards purchase of the qualifying asset. The
amount of borrowing costs that the Group capitalizes during a period does not exceed the amount of borrowing costs incurred
during that period.
r. Income taxes
Income tax expense comprises current and deferred tax. Income tax expense is recognized in profit or loss except to the extent that
it relates to items recognized directly in equity or in other comprehensive income. Current tax is the expected tax payable on the
taxable income for the year, using tax rates enacted or substantively enacted at the reporting date. Minimum Alternate Tax (MAT)
is accounted as current tax when the Company is subjected to such provisions of the Income Tax Act. However, credit of such
MAT paid is available when the Company is subjected to tax as per normal provisions in the future. Credit on account of MAT is
recognized as an asset based on the management‟s estimate of its recoverability in the future.
Deferred tax is recognized using the balance sheet method, providing for temporary differences between the carrying amount of
assets and liabilities for financial reporting purposes and the amounts used for taxation purposes. Deferred tax is not recognized for
the following temporary differences: the initial recognition of assets or liabilities in a transaction that is not a business combination
and that affects neither accounting nor taxable profit or loss, and differences relating to investments in subsidiaries and associates
to the extent that it is probable that they will not reverse in the foreseeable future. In addition, deferred tax is not recognized for
taxable temporary differences arising on the initial recognition of goodwill, as the same is not deductible for tax purposes. Deferred
tax is measured at the tax rates that are expected to be applied to temporary differences when they reverse, based on the laws that
have been enacted or substantively enacted by the reporting date. Deferred tax assets and liabilities are offset if there is a legally
enforceable right to offset current tax liabilities and assets, and they relate to income taxes levied by the same tax authority on the
same taxable entity, or on different tax entities, but they intend to settle current tax liabilities and assets on a net basis or their tax
assets and liabilities will be realized simultaneously.
A deferred tax asset is recognized to the extent that it is probable that future taxable profits will be available against which the
temporary difference can be utilized. Deferred tax assets are reviewed at each reporting date and are reduced to the extent that it is
no longer probable that the related tax benefit will be realized.
Deferred taxation arising on investments in subsidiaries and associates is recognized except where the Group is able to control the
reversal of the temporary difference and it is probable that the temporary difference will not reverse in the foreseeable future.
Deferred taxation arising on the temporary differences arising out of undistributed earnings of the equity method accounted
investee is recorded based on the managment's intention. If the intention is to realize the undistributed earnings through sale,
deferred tax is measured at the capital gains tax rates that are expected to be applied to temporary differences when they reverse.
However, when the intention is to realize the undistributed earnings through dividend, the Group‟s share of the income and
expenses of the equity method accounted investee is recorded in the statement of income, after considering any taxes on dividend
payable by the equity method accounted investee and no deferred tax is set up in the Group's books as the tax liability is not with
the group.
s. Earnings / (loss) per share
The Group presents basic and diluted earnings / (loss) per share (EPS) data for its ordinary shares. Basic EPS is calculated by
dividing the profit or loss attributable to ordinary shareholders by the weighted average number of ordinary shares outstanding
during the period. Where ordinary shares are issued but not fully paid, they are treated in the calculation of basic earnings per share
as a fraction of an ordinary share to the extent that they were entitled to participate in dividends during the period relative to a fully
paid ordinary share. Diluted EPS is determined by adjusting the profit or loss attributable to ordinary shareholders and the
weighted average number of ordinary shares outstanding for the effects of all dilutive potential ordinary shares, which includes
share options granted to employees. To the extent that partly paid shares are not entitled to participate in dividends during the
period they are treated as the equivalent of warrants or options in the calculation of diluted earnings per share.
t. Recent accounting pronouncements
(i) IFRS 9 Financial Instruments: In November 2009, the International Accounting Standards Board issued IFRS 9,
Financial Instruments: Recognition and Measurement, to reduce the complexity of the current rules on financial
instruments as mandated in IAS 39. The effective date for IFRS 9 is annual periods beginning on or after January 1, 2015
with early adoption permitted. IFRS 9 has fewer classification and measurement categories as compared to IAS 39 and
has eliminated the categories of held to maturity, available for sale and loans and receivables. Further it eliminates the
rule-based requirement of segregating embedded derivatives and tainting rules pertaining to held to maturity investments.

14
For an investment in an equity instrument which is not held for trading, IFRS 9 permits an irrevocable election, on initial
recognition, on an individual share-by-share basis, to present all fair value changes from the investment in other
comprehensive income. No amount recognized in other comprehensive income would ever be reclassified to profit or
loss. IFRS 9, was further amended in October 2010, and such amendment introduced requirements on accounting for
financial liabilities. This amendment addresses the issue of volatility in the profit or loss due to changes in the fair value
of an entity‟s own debt. It requires the entity, which chooses to measure a liability at fair value, to present the portion of
the fair value change attributable to the entity‟s own credit risk in the other comprehensive income. The company is
required to adopt IFRS 9 by accounting year commencing April 1, 2015.
(ii) IFRS 10, Consolidated Financial Statements, IFRS 11, Joint Arrangements and IFRS 12, Disclosure of Interests in
Other Entities: In May 2011, the International Accounting Standards Board issued IFRS 10, IFRS 11 and IFRS 12. The
effective date for IFRS 10, IFRS 11 and IFRS 12 is annual periods beginning on or after January 1, 2013 with early adoption
permitted.
IFRS 10 Consolidated Financial Statements builds on existing principles by identifying the concept of control as the
determining factor in whether an entity should be included within the consolidated financial statements of the parent company.
IFRS 10 replaces the consolidation requirements in SIC-12 Consolidation of Special Purpose Entities and IAS 27 Consolidated
and Separate Financial Statements. The standard provides additional guidance for the determination of control in cases of
ambiguity such as franchisor franchisee relationship, de facto agent, silos and potential voting rights.
IFRS 11 Joint Arrangements determines the nature of an arrangement by focusing on the rights and obligations of the
arrangement, rather than its legal form. IFRS 11 replaces IAS 31 Interests in Joint Ventures and SIC-13 Jointly-controlled
Entities-Non-monetary Contributions by Venturers. IFRS 11 addresses only forms of joint arrangements (joint operations and
joint ventures) where there is joint control whereas IAS 31 had identified three forms of joint ventures, namely jointly
controlled operations, jointly controlled assets and jointly controlled entities. The standard addresses inconsistencies in the
reporting of joint arrangements by requiring a single method to account for interests in jointly controlled entities, which is the
equity method.
IFRS 12 Disclosure of Interests in Other Entities is a new and comprehensive standard on disclosure requirements for all forms
of interests in other entities, including joint arrangements, associates, special purpose vehicles and other off balance sheet
vehicles. One major requirement of IFRS 12 is that an entity needs to disclose the significant judgments and assumptions it has
made in determining:
(a) whether it has control, joint control or significant influence over another entity; and
(b) the type of joint control when the joint arrangement is structured through a separate vehicle.
IFRS 12 also expands the disclosure requirements for subsidiaries with non-controlling interest, joint arrangements and
associates that are individually material. IFRS 12 introduces the term “structured entity” by replacing Special Purpose entities
and requires enhanced disclosures by way of nature and extent of, and changes in, the risks associated with its interests in both
its consolidated and unconsolidated structured entities.
(iii) IFRS 13 Fair Value Measurement: In May 2011, the International Accounting Standards Board issued IFRS 13, Fair Value
Measurement to provide specific guidance on fair value measurement and requires enhanced disclosures for all assets and
liabilities measured at fair value, and not restricted to financial assets and liabilities. The standard introduces a precise
definition of fair value and a consistent measure for fair valuation across assets and liabilities, with a few specified exceptions.
The effective date for IFRS 13 is annual periods beginning on or after January 1, 2013 with early adoption permitted. The
company is required to adopt IFRS 13 by accounting year commencing April 1, 2013.
(iv) IAS 1 (Amended) Presentation of Financial Statements: In June 2011, the International Accounting Standard Board
published amendments to IAS 1 Presentation of Financial Statements. The amendments to IAS 1, Presentation of Financial
Statements, require companies preparing financial statements in accordance with IFRS to group items within other
comprehensive income that may be reclassified to the profit or loss separately from those items which would not be recyclable
in the profit or loss section of the income statement. It also requires the tax associated with items presented before tax to be
shown separately for each of the two groups of other comprehensive income items (without changing the option to present
items of other comprehensive income either before tax or net of tax).
The amendments also reaffirm existing requirements that items in other comprehensive income and profit or loss should be
presented as either a single statement or two consecutive statements. This amendment is applicable to annual periods beginning
on or after July 1, 2012, with early adoption permitted. The company is required to adopt IAS 1 (Amended) by accounting year
commencing April 1, 2013.
15
(v) IAS 19 (Amended) Employee Benefits: In June 2011, International Accounting Standards Board issued IAS 19 (Amended),
Employee Benefits. The effective date for adoption of IAS 19 (Amended) is annual periods beginning on or after January 1,
2013, though early adoption is permitted.
IAS 19 (Amended) has eliminated an option to defer the recognition of gains and losses through re-measurements and requires
such gain or loss to be recognized through other comprehensive income in the year of occurrence to reduce volatility. The
amended standard requires immediate recognition of effects of any plan amendments. Further it also requires assets in profit or
loss to be restricted to government bond yields or corporate bond yields, considered for valuation of Projected Benefit
Obligation, irrespective of actual portfolio allocations. The actual return from the portfolio in excess of or less than such yields
is recognized through other comprehensive income.
These amendments enhance the disclosure requirements for defined benefit plans by requiring information about the
characteristics of defined benefit plans and risks that entities are exposed to through participation in those plans. The
amendments need to be adopted retrospectively. The company is required to adopt IAS 19 (Amended) by accounting year
commencing April 1, 2013.
(vi) IFRIC 20 Stripping Costs in the Production Phase of a surface mine: In October 2009, International Accounting Standards
Board issued IFRIC 20 Stripping Costs in the Production Phase of a surface mine. The effective date for adoption of this
interpretation is annual periods beginning on or after January 1, 2013, though early adoption is permitted
This interpretation requires an entity to recognize the stripping costs incurred in the production phase as an asset based on the
benefit from the stripping activity. If the benefit is in the form of inventory produced, then stripping costs should be accounted
in accordance with IAS 2, Inventories. If the benefit is improved access to the ore, non-current asset shall be recognized if the
future economic benefit associated with stripping activity will flow to the entity, the entity can identify the component of the
ore body for which access is improved and the associated costs can be measured reliably.
(vii) IFRIC 21 Levies: In May 2013, International Accounting Standards Board issued IFRIC 21 Levies. The effective date for
adoption of this interpretation is annual periods beginning on or after January 1, 2014, though early adoption is permitted.
This interpretation clarifies that an entity shall recognize a liability for a levy when the activity that triggers payment, as
identified by the relevant legislation occurs. It also clarifies that a levy liability is accrued progressively only if the activity that
triggers payment occurs over a period of time, in accordance with the relevant legislation. For a levy that is triggered upon
reaching a minimum threshold, the interpretation clarifies that no liability should be recognised before the specified minimum
threshold is reached. This interpretation will have to be applied retrospectively when adopted.
The company is currently evaluating the requirements of above pronouncements and has not yet determined the impact on the
consolidated financial statements.
4. Determination of fair values
A number of the Group‟s accounting policies and disclosures require the determination of fair value, for both financial and non-
financial assets and liabilities. Fair values have been determined for measurement and / or disclosure purposes based on the
following methods. When applicable, further information about the assumptions made in determining fair values is disclosed in the
notes specific to that asset or liability.
(i) Property, plant and equipment
The fair value of property, plant and equipment recognized as a result of a business combination is an estimated amount for which
a property could be exchanged on the date of acquisition between a willing buyer and a willing seller in an arm‟s length transaction
after proper marketing wherein the parties had each acted knowledgeably. The fair value of items of plant, equipment, fixtures and
fittings is based on the market approach and cost approach using quoted market prices for similar items when available and
replacements costs when appropriate.
(ii) Inventories
The fair value of inventories acquired in a business combination is determined based on the estimated selling price in the ordinary
course of business less the estimated costs of completion and sale, and a reasonable profit margin based on the effort required to
complete and sell the inventories.

16
(iii) Intangible assets
The fair value of intangible assets acquired in the business combinations is based on discounted cash flows expected to be derived
from the use and eventual sale of assets (terminal value).
(iv) Investments in equity and debt securities
The fair value of available-for-sale financial assets is determined by reference to their quoted price at the reporting date. When the
fair value of the financial asset cannot be measured reliably, it is measured at cost.
(v) Trade and other receivables
The fair value of trade and other receivables, excluding construction contracts in progress, is estimated as the present value of
future cash flows, discounted at the market rate of interest at the reporting date. However in respect of such financial instruments,
fair value generally approximates the carrying amount due to the short term nature of such assets. This fair value is determined for
disclosure purposes or when acquired in a business combination.
(vi) Derivatives
The fair value of forward exchange contracts is based on their quoted price, if available. If a quoted price is not available, the fair
value is estimated by discounting the difference between the contractual forward price and the current forward price for the
residual maturity of the contract using a risk free interest rate (based on government bonds). The fair value of foreign currency
option contracts is determined based on the appropriate valuation techniques, considering the terms of the contract. Fair values
reflect the credit risk of the instrument and include adjustments to take account of the credit risk of the Group entity and the
counter party when appropriate.
(vii) Non derivative financial liabilities
Fair value, which is determined for disclosure purposes, is calculated based on the present value of future principal and interest
cash flows, discounted at the market rate of interest at the reporting date. For finance leases, the market rate of interest is
determined by reference to similar lease agreements.
(viii) Share-based payment transactions
The fair value of employee stock options is measured using the Black-Scholes method. Measurement inputs include share price on
grant date, exercise price of the instrument, expected volatility (based on weighted average historic volatility adjusted for changes
expected due to publicly available information), expected term of the instrument (based on historical experience and general option
holder behavior), expected dividends, and the risk free interest rate (based on government bonds).

17
5. Property, plant and equipment
The following table presents the changes in property, plant and equipment during the year ended March 31, 2013
Cost Accumulated depreciation Carrying
amount as
at March
31, 2013
Particulars As at
April 01,
2012
Additions Disposals As at
March 31,
2013
As at
April 1,
2012
Depreciation
for the year
Deletions As at
March 31,
2013
Building 777,419 - - 777,419 232,667 27,754 - 260,421 516,998
Plant and
machinery 5,731,924 415,512 33,648 6,113,788 3,788,648 608,832 18,135 4,379,345 1,734,443
Computer
equipments 629,605 59,926 286 689,245 510,001 51,552 286 561,267 127,978
Office
equipment 237,347 3,297 195 240,449 150,983 20,387 190 171,180 69,269
Furniture and
fittings 739,994 5,209 145 745,058 563,931 59,126 127 622,930 122,128
Vehicles 4,747 - 2,291 2,456 2,647 970 2,291 1,326 1,130
Total 8,121,036 483,944 36,565 8,568,415 5,248,877 768,621 21,029 5,996,469 2,571,946
Add:
Construction
in progress
2,497,732
Total 8,121,036 483,944 36,565 8,568,415 5,248,877 768,621 21,029 5,996,469 5,069,678
The following table presents the changes in property, plant and equipment during the year ended March 31, 2012
Cost Accumulated depreciation Carrying
amount as
at March
31, 2012
Particulars As at
April 01,
2011
Additions Disposals As at
March 31,
2012
As at
April 1,
2011
Depreciation
for the year
Deletions As at
March 31,
2012
Building 777,419 - - 777,419 204,826 27,841 - 232,667 544,752
Plant and
machinery 5,433,359 350,204 51,639 5,731,924 3,335,610 504,532 51,494 3,788,648 1,943,276
Computer
equipments 563,776 66,303 474 629,605 478,705 31,711 415 510,001 119,604
Office
equipment 234,125 3,304 82 237,347 129,932 21,133 82 150,983 86,364
Furniture and
fittings 713,359 27,985 1,350 739,994 503,102 62,034 1,205 563,931 176,063
Vehicles 2,929 2,907 1,089 4,747 2,929 807 1,089 2,647 2,100
Total 7,724,967 450,703 54,634 8,121,036 4,655,104 648,058 54,285 5,248,877 2,872,159
Add:
Construction
in progress
988,128
Total 7,724,967 450,703 54,634 8,121,036 4,655,104 648,058 54,285 5,248,877 3,860,287
Leased assets
The Group‟s leased assets include certain buildings, plant and machinery acquired under finance leases. As at March 31, 2013 the net
carrying amount of buildings, plant and machinery and vehicles acquired under finance leases is Rs.224,291 (March 31, 2012: Rs.
234,608), Rs.233,193 (March 31, 2012: Rs.226,594) and Rs.1,130 (March 31, 2012 : 2,100) respectively. During the year, the Group
acquired leased assets of Rs.404,307 (March 31, 2012 : Rs 60,149).

18
In case prepayments are made towards buildings accounted for as finance leases, such prepayments are capitalized as „Leasehold
Buildings‟ (included in buildings) on the commencement of the lease term under the head „Property, plant and equipment‟ and
depreciated in accordance with the depreciation policy for similar owned assets.
Capital Commitments
As of March 31, 2013 and March 31, 2012, the Company was committed to spend approximately Rs. 412,698 and Rs. 717,266
respectively, under agreements to purchase property, plant and equipment.
Construction in progress
Amounts paid towards acquisition of property, plant and equipment outstanding at each balance sheet date and the cost of property,
plant and equipment that are not ready to be put into use are disclosed under construction-in-progress. As of March 31, 2013,
Construction work in progress includes Rs.808,785 (March 31, 2012 : Rs. 685,027) paid towards acquisition of building under
construction on a leasehold land belonging to Pace Info Com Park Private Limited by way of acquisition of the entire shareholding
of its holding company M/s Hermit Projects Private Limited. Also refer note 36.
Capitalisation of expenses
The Company has capitalized expenses amounting to Rs.8,300 (March 31, 2012: Rs. 18,540) which are directly attributable to the
construction of building.
Security
As at March 31,2013 property, plant and equipment with a carrying amount of Rs.2,113,301 (March 31, 2012: Rs. 2,408,857) are
subject to a registered charge to secure bank borrowings. 6. Intangible assets
Intangible assets comprise the following:
March 31, 2013 March 31, 2012
Goodwill 14,595 14,595
Other intangible assets 586,027 91,132
600,622 105,727
(i) Goodwill The following table presents the changes in goodwill during the years ended March 31, 2013 and 2012
March 31, 2013 March 31, 2012
Balance at the beginning of the year 14,595 14,595
Effect of movement in exchange rates - -
Impairment loss recognized during the year - -
Net carrying amount of goodwill 14,595 14,595
The amount of goodwill as at March 31, 2013 and March 31, 2012 has been allocated to the Enterprise services segment.
(ii) Other intangibles
The following table presents the changes in intangible assets during the years ended March 31, 2013, 2012 and 2011. Technical
know-
how
Bandwidth
Capacity
Customer
related
intangibles
Software License
fees
Total
(A) Cost
Balance as at March 31, 2010 82,753 - 200,570 370,683 50,000 704,006
Acquisitions during the year - - - 23,397 - 23,397
Disposals during the year - - - - - -
Balance as at March 31, 2011 82,753 - 200,570 394,080 50,000 727,403
Acquisitions during the year - - - 44,603 - 44,603
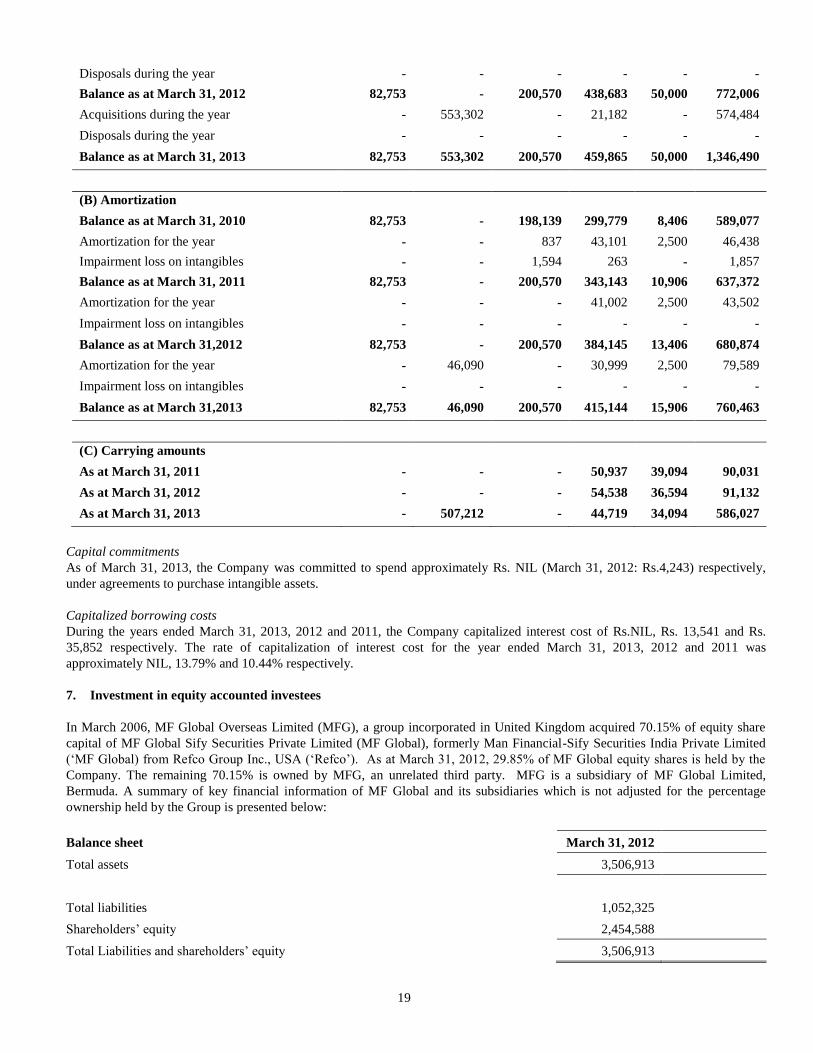
19
Disposals during the year - - - - - -
Balance as at March 31, 2012 82,753 - 200,570 438,683 50,000 772,006
Acquisitions during the year - 553,302 - 21,182 - 574,484
Disposals during the year - - - - - -
Balance as at March 31, 2013 82,753 553,302 200,570 459,865 50,000 1,346,490
(B) Amortization
Balance as at March 31, 2010 82,753 - 198,139 299,779 8,406 589,077
Amortization for the year - - 837 43,101 2,500 46,438
Impairment loss on intangibles - - 1,594 263 - 1,857
Balance as at March 31, 2011 82,753 - 200,570 343,143 10,906 637,372
Amortization for the year - - - 41,002 2,500 43,502
Impairment loss on intangibles - - - - - -
Balance as at March 31,2012 82,753 - 200,570 384,145 13,406 680,874
Amortization for the year - 46,090 - 30,999 2,500 79,589
Impairment loss on intangibles - - - - - -
Balance as at March 31,2013 82,753 46,090 200,570 415,144 15,906 760,463
(C) Carrying amounts
As at March 31, 2011 - - - 50,937 39,094 90,031
As at March 31, 2012 - - - 54,538 36,594 91,132
As at March 31, 2013 - 507,212 - 44,719 34,094 586,027
Capital commitments
As of March 31, 2013, the Company was committed to spend approximately Rs. NIL (March 31, 2012: Rs.4,243) respectively,
under agreements to purchase intangible assets.
Capitalized borrowing costs
During the years ended March 31, 2013, 2012 and 2011, the Company capitalized interest cost of Rs.NIL, Rs. 13,541 and Rs.
35,852 respectively. The rate of capitalization of interest cost for the year ended March 31, 2013, 2012 and 2011 was
approximately NIL, 13.79% and 10.44% respectively.
7. Investment in equity accounted investees
In March 2006, MF Global Overseas Limited (MFG), a group incorporated in United Kingdom acquired 70.15% of equity share
capital of MF Global Sify Securities Private Limited (MF Global), formerly Man Financial-Sify Securities India Private Limited
(„MF Global) from Refco Group Inc., USA („Refco‟). As at March 31, 2012, 29.85% of MF Global equity shares is held by the
Company. The remaining 70.15% is owned by MFG, an unrelated third party. MFG is a subsidiary of MF Global Limited,
Bermuda. A summary of key financial information of MF Global and its subsidiaries which is not adjusted for the percentage
ownership held by the Group is presented below:
Balance sheet March 31, 2012
Total assets 3,506,913
Total liabilities 1,052,325
Shareholders‟ equity 2,454,588
Total Liabilities and shareholders‟ equity 3,506,913

20
Statement of operations For the year ended
March 31, 2012 March 31, 2011
Revenues 1,169,577 1,818,283
Net profit 92,622 241,840
During October 2010, Sify Technologies Ltd, the minority shareholder of MF Global holding 29.85 percent of the outstanding
shares of the MF Global, requested MF Global‟s Board of Directors to reconsider certain costs charged to the MF Global by MF
Global Holdings Ltd and its affiliated and associated group companies, who hold 70.15 percent of the outstanding shares of the MF
Global. These charges are currently recorded in the financial statements of the MF Global for the year ended March 31, 2008
aggregating to Rs.43, 478,911 and March 31,2009 aggregating to Rs.15, 374,528. The resolution of this matter between the
shareholders of MF Global remains uncertain and any financial adjustment that may arise is not presently known and accordingly
no adjustment related to this matter has been provided for in MF Global‟s consolidated financial statements. Any financial
adjustment that may arise for resolution of the said matter would be expected to be handled prospectively and therefore would be
reported in the period in which it is resolved. Consequently, no adjustment related to the said matter was considered by Sify for
equity method of accounting for MF Global. The auditors of MF Global have included an emphasis of matter with an explanatory
paragraph in their audit report issued on the consolidated financial statements of MF Global for the three years ended March 31,
2012 in connection with such recorded cross charges. The effect of such recorded cross charge is not material to the financial
statements of Sify.
On October 31, 2011, MF Global Holding Limited, USA, sought bankruptcy protection through a chapter 11 filing in the U.S.
Bankruptcy Court in New York. Consequent to this, MFG also filed for bankruptcy proceedings in the United Kingdom and 3
individual administrators were appointed as Joint administrators (the “Joint administrators”) for MFG which holds the shares in the
Joint Venture Company.
The Company was informed by the Joint Administrators that they were in the process of seeking bids for the stakes held by MFG
in the Joint Venture Company. The Company believes that the auction process is in violation of the share holders‟ agreement
entered between MFG and the Company.
Hence, the Company filed a petition under section 9 of the Arbitration and Conciliation Act 1996 in Bombay High Court, seeking
interim relief by restraining the Joint Administrators and MFG from proceeding with the proposed auction in respect of the sale of
shares held by MFG in the Joint Venture Company in violation of share holders agreement dated November 25, 2005. A hearing
on the petition was held on December 16, 2011. The Hon‟ble High Court granted an ad-interim injunction restraining MFG
Overseas Limited through its Joint Administrators from disposing off its shares in MF Global in violation of the Shareholder
Agreement. The petition was adjourned for further proceedings. In parallel, the Company without prejudice to its legal rights under
the petition was in discussion with the Joint Administrators of MFG for an early amicable settlement in this regard.
On March 23, 2012, the Board of Directors of the Company, approved to realize the value of the investment by sale to prospective
buyers.
On March 27, 2012, the Company entered into an agreement relating to the sale and purchase of shares in MF Global Sify
Securities India Private Limited by and among Sify, MF Global Sify Securities Pvt Ltd., MF Global Overseas Limited, the joint
administrators of MF Global Overseas and entities affiliated with the Phillip Capital Group, whereby the Company agreed to sell
its entire 29.85% interest in MF Global to Phillip Capital Group.
The consummation of the transaction was subject to certain closing conditions, including regulatory and statutory approvals from
the Government of India and the stock exchanges in India.
Additionally, in connection with the execution of the Agreement, on March 27, 2012, the Company, MF Global Sify Securities
Private Limited, MF Global Overseas Limited and the Joint Administrators entered into a settlement and release agreement
pursuant to which the Company and MF Global Overseas Limited agreed to settle, effective upon the closing of the transactions
contemplated by the Agreement, their pending dispute in the Bombay High Court, India regarding certain matters, including the
termination of shareholders agreement governing their respective interests in MF Global.
Hence, effective March 23, 2012, the above investment was classified as held for sale and measured accordingly as per IFRS 5.
The above investment does not form part of any of the operating segments of the Company.
Subsequently, on August 2, 2012, in pursuance of the Agreement dated March 27, 2012 and after obtaining all the statutory and
regulatory approvals, the Company completed the sale of its entire stake and the rights therein in MF Global for a cash
consideration of Rs.1,390,270 (USD 25 million) to Phillip Capital Group, Singapore and MF Global Management Employees
Trust, India. Consequently, with effect from such date, MF Global ceased to be an associate of the Company. Further, as per the
settlement and release agreement, the Company has initiated steps to withdraw the arbitration proceedings filed against MFG and
others in the Bombay High Court, India and any other existing disputes also stand resolved. Consequently, no financial
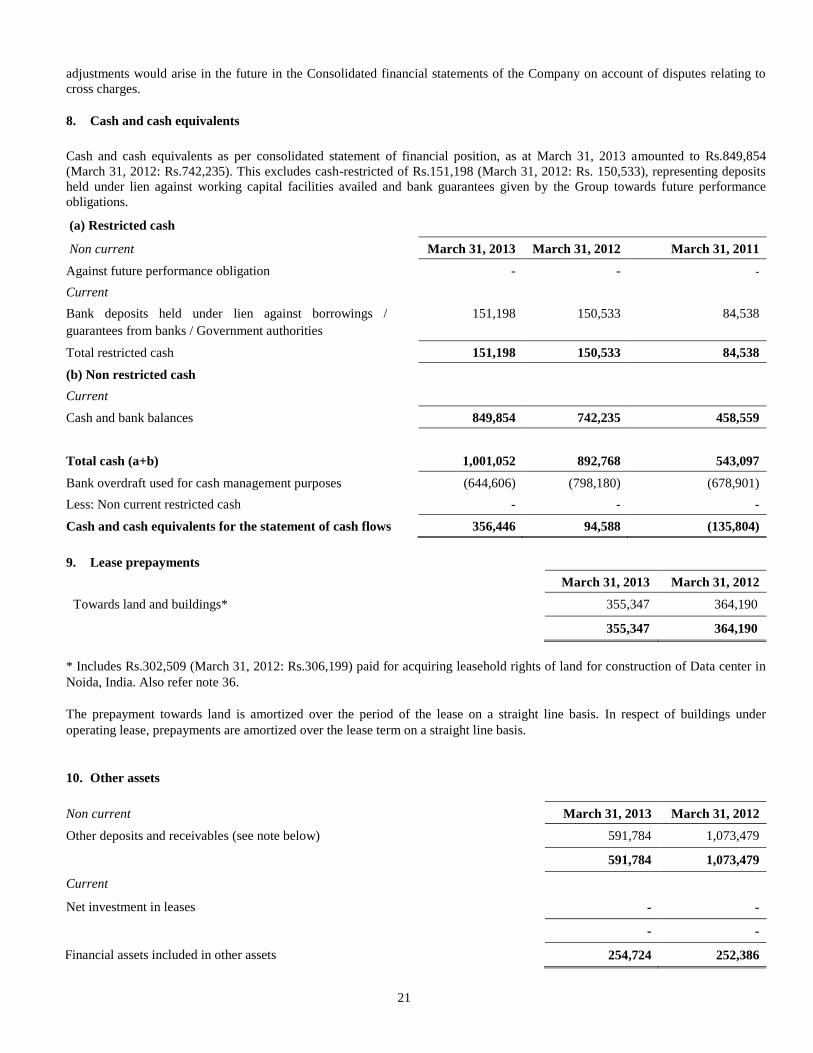
21
adjustments would arise in the future in the Consolidated financial statements of the Company on account of disputes relating to
cross charges.
8. Cash and cash equivalents
Cash and cash equivalents as per consolidated statement of financial position, as at March 31, 2013 amounted to Rs.849,854
(March 31, 2012: Rs.742,235). This excludes cash-restricted of Rs.151,198 (March 31, 2012: Rs. 150,533), representing deposits
held under lien against working capital facilities availed and bank guarantees given by the Group towards future performance
obligations.
(a) Restricted cash
Non current March 31, 2013 March 31, 2012 March 31, 2011
Against future performance obligation - - -
Current
Bank deposits held under lien against borrowings /
guarantees from banks / Government authorities
151,198 150,533 84,538
Total restricted cash 151,198 150,533 84,538
(b) Non restricted cash
Current
Cash and bank balances 849,854 742,235 458,559
Total cash (a+b) 1,001,052 892,768 543,097
Bank overdraft used for cash management purposes (644,606) (798,180) (678,901)
Less: Non current restricted cash - - -
Cash and cash equivalents for the statement of cash flows 356,446 94,588 (135,804)
9. Lease prepayments
March 31, 2013 March 31, 2012
Towards land and buildings* 355,347 364,190
355,347 364,190
* Includes Rs.302,509 (March 31, 2012: Rs.306,199) paid for acquiring leasehold rights of land for construction of Data center in
Noida, India. Also refer note 36.
The prepayment towards land is amortized over the period of the lease on a straight line basis. In respect of buildings under
operating lease, prepayments are amortized over the lease term on a straight line basis.
10. Other assets
Non current March 31, 2013 March 31, 2012
Other deposits and receivables (see note below) 591,784 1,073,479
591,784 1,073,479
Current
Net investment in leases - -
- -
Financial assets included in other assets 254,724 252,386
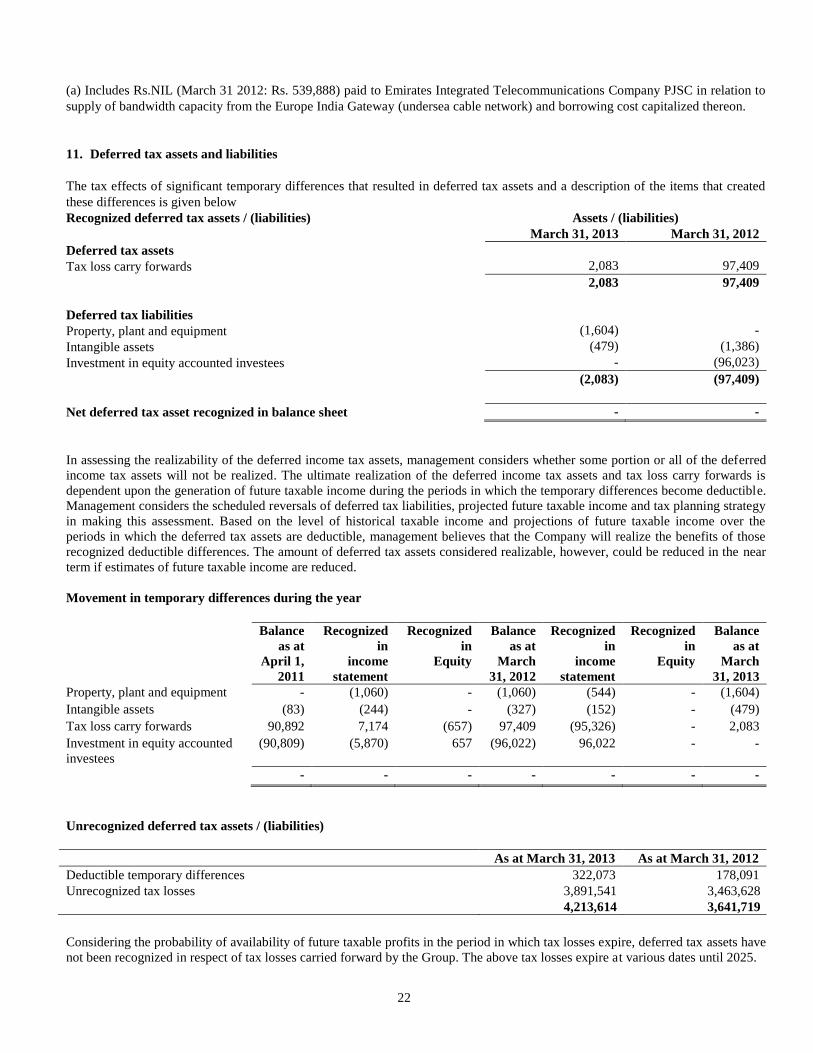
22
(a) Includes Rs.NIL (March 31 2012: Rs. 539,888) paid to Emirates Integrated Telecommunications Company PJSC in relation to
supply of bandwidth capacity from the Europe India Gateway (undersea cable network) and borrowing cost capitalized thereon.
11. Deferred tax assets and liabilities
The tax effects of significant temporary differences that resulted in deferred tax assets and a description of the items that created
these differences is given below
Recognized deferred tax assets / (liabilities) Assets / (liabilities)
March 31, 2013 March 31, 2012
Deferred tax assets
Tax loss carry forwards 2,083 97,409
2,083 97,409
Deferred tax liabilities
Property, plant and equipment (1,604) -
Intangible assets (479) (1,386)
Investment in equity accounted investees - (96,023)
(2,083) (97,409)
Net deferred tax asset recognized in balance sheet - -
In assessing the realizability of the deferred income tax assets, management considers whether some portion or all of the deferred
income tax assets will not be realized. The ultimate realization of the deferred income tax assets and tax loss carry forwards is
dependent upon the generation of future taxable income during the periods in which the temporary differences become deductible.
Management considers the scheduled reversals of deferred tax liabilities, projected future taxable income and tax planning strategy
in making this assessment. Based on the level of historical taxable income and projections of future taxable income over the
periods in which the deferred tax assets are deductible, management believes that the Company will realize the benefits of those
recognized deductible differences. The amount of deferred tax assets considered realizable, however, could be reduced in the near
term if estimates of future taxable income are reduced.
Movement in temporary differences during the year
Balance
as at
April 1,
2011
Recognized
in
income
statement
Recognized
in
Equity
Balance
as at
March
31, 2012
Recognized
in
income
statement
Recognized
in
Equity
Balance
as at
March
31, 2013
Property, plant and equipment - (1,060) - (1,060) (544) - (1,604)
Intangible assets (83) (244) - (327) (152) - (479)
Tax loss carry forwards 90,892 7,174 (657) 97,409 (95,326) - 2,083
Investment in equity accounted
investees
(90,809) (5,870) 657 (96,022) 96,022 - -
- - - - - - -
Unrecognized deferred tax assets / (liabilities)
As at March 31, 2013 As at March 31, 2012
Deductible temporary differences 322,073 178,091
Unrecognized tax losses 3,891,541 3,463,628
4,213,614 3,641,719
Considering the probability of availability of future taxable profits in the period in which tax losses expire, deferred tax assets have
not been recognized in respect of tax losses carried forward by the Group. The above tax losses expire at various dates until 2025.

23
Deferred tax liabilities as at March 31, 2013 and March 31, 2012 have not been recognized on undistributed profits of its
subsidiaries since the group expects to realize the same in a tax free manner.
Sec.79 of the Indian Income Tax Act denies carry forward of losses incurred in earlier years in case of change in the beneficial
interest in the shares outstanding by more than 51%. As a result of the private placement of shares during the year ended March 31,
2011, there was a change in the registered shareholders by more than 51%. The above provision is not applicable to companies in
which public are substantially interested. Sec. 2(18) of the Indian Income Tax Act, among other things, defines a company listed in
a recognized Stock Exchange in India as a Company in which public are substantially Interested. Based on the non-discrimination
clause available in the India - United States of America tax treaty, when the capital of the company is wholly or partly owned or
controlled, directly or indirectly, by one or more residents of the other Country, the company shall not be subjected to more
burdensome position than the similar enterprises of the Contracting Country. Based on the above clause, the Company being listed
in US Stock Exchange should not be discriminated for being not listed in India and be treated on par with a Company listed in
India. Hence, the Company believes that it is out of the purview of Sec.79 of the Indian Income Tax Act. Further as disclosed in
Item 7 of this Annual Report, there has been no change in the beneficial ownership of Shares by more than 51% compared to
earlier years and the Board of Directors of the Company have continued to be the same. Hence based on the advice, the Company
believes that it can carry forward and set-off the above losses incurred by it in earlier years.
Income tax expense recognized in profit or loss
March 31, 2013 March 31, 2012 March 31, 2011
Current tax expense / (benefit)
Current period - - -
- - -
Deferred tax expense
Origination and reversal of temporary differences (95,326) 7,174 8,875
Recognition of previously unrecognized tax losses 95,326 (7,174) (8,875)
Reversal of previously recognized tax losses - - -
- - -
Total income tax expense / (benefit) - - -
Income tax directly recognized in other comprehensive income
March 31,2013 March 31,2012 March 31,2011
Actuarial (gains) or losses - - -
Tax effect of changes in the fair value of other investments - - -
Tax effect on share of profit of associate recognized in OCI - - -
Tax effect on foreign currency translation differences - - -
Income tax benefit / (expense) recognized directly in equity - - -
Reconciliation of effective tax rate
A reconciliation of the income tax provision to the amount computed by applying the statutory income tax rate to the income
before taxes is summarized below:
Year ended
March 31, 2013
Year ended
March 31, 2012
Year ended
March 31, 2011
Profit / (loss) before income taxes 451,569 (383,337) (519,492)
Enacted tax rates in India 32.45% 32.45% 33.22%
Computed expected tax expense / (benefit) 146,512 (124,373) (172,575)
Effect of:
Share based payment expense not deductible for tax purposes 814 10,082 2,697
Unrecognized deferred tax assets on losses incurred during the year (190,987) 123,148 194,140
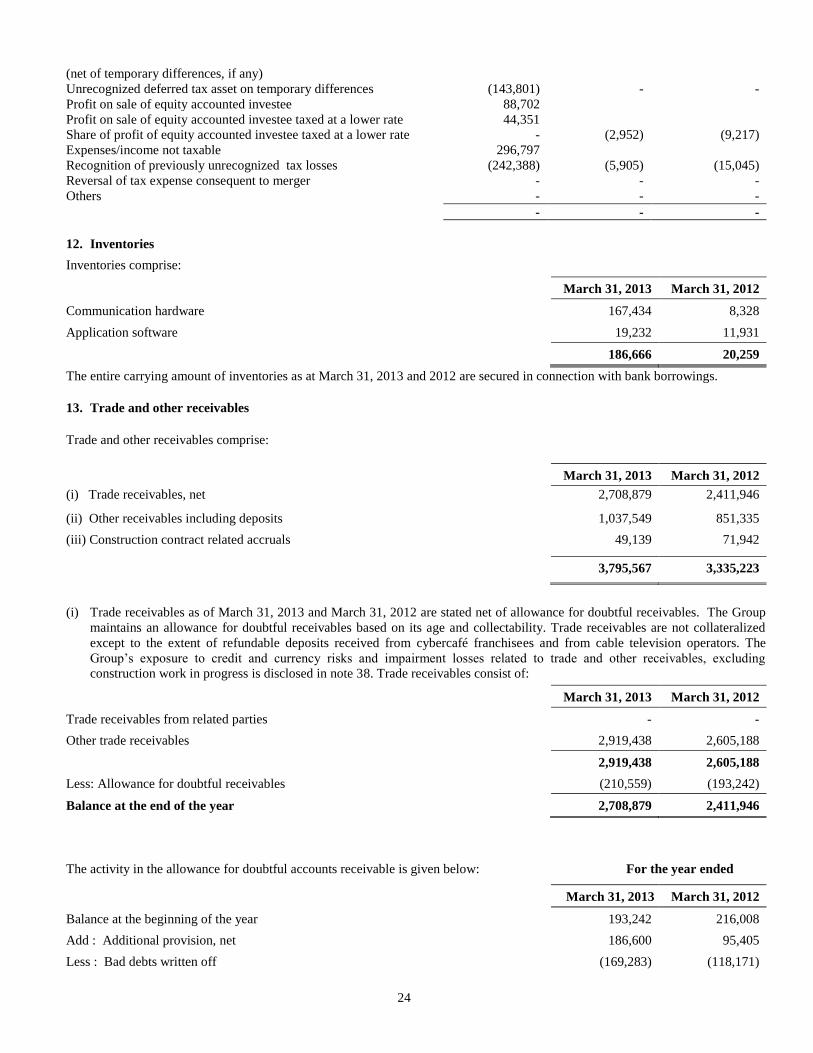
24
(net of temporary differences, if any)
Unrecognized deferred tax asset on temporary differences (143,801) - -
Profit on sale of equity accounted investee 88,702
Profit on sale of equity accounted investee taxed at a lower rate 44,351
Share of profit of equity accounted investee taxed at a lower rate - (2,952) (9,217)
Expenses/income not taxable 296,797
Recognition of previously unrecognized tax losses (242,388) (5,905) (15,045)
Reversal of tax expense consequent to merger - - -
Others - - -
- - -
12. Inventories
Inventories comprise:
March 31, 2013 March 31, 2012
Communication hardware 167,434 8,328
Application software 19,232 11,931
186,666 20,259
The entire carrying amount of inventories as at March 31, 2013 and 2012 are secured in connection with bank borrowings.
13. Trade and other receivables
Trade and other receivables comprise:
March 31, 2013 March 31, 2012
(i) Trade receivables, net 2,708,879 2,411,946
(ii) Other receivables including deposits 1,037,549 851,335
(iii) Construction contract related accruals 49,139 71,942
3,795,567 3,335,223
(i) Trade receivables as of March 31, 2013 and March 31, 2012 are stated net of allowance for doubtful receivables. The Group
maintains an allowance for doubtful receivables based on its age and collectability. Trade receivables are not collateralized
except to the extent of refundable deposits received from cybercafé franchisees and from cable television operators. The
Group‟s exposure to credit and currency risks and impairment losses related to trade and other receivables, excluding
construction work in progress is disclosed in note 38. Trade receivables consist of:
March 31, 2013 March 31, 2012
Trade receivables from related parties - -
Other trade receivables 2,919,438 2,605,188
2,919,438 2,605,188
Less: Allowance for doubtful receivables (210,559) (193,242)
Balance at the end of the year 2,708,879 2,411,946
The activity in the allowance for doubtful accounts receivable is given below: For the year ended
March 31, 2013 March 31, 2012
Balance at the beginning of the year 193,242 216,008
Add : Additional provision, net 186,600 95,405
Less : Bad debts written off (169,283) (118,171)

25
Balance at the end of the year 210,559 193,242
(ii) Other receivables comprises of the following items:
March 31, 2013 March 31, 2012
Advances and other deposits (Refer Note (a) below) 474,440 411,833
Withholding taxes (Refer Note (b) below) 563,109 439,502
1,037,549 851,335
Financial assets included in other receivables 34,475 122,214
Notes:
a) Advances and other deposits primarily comprises of receivables in the form of deposits, service tax and other advances
given in the ordinary course of business.
b) Includes withholding taxes recoverable from the Department of Income-tax for which the Company has filed tax returns for
refund. The Company expects to realize such refund of withholding taxes within the next 12 months.
14. Prepayments for current assets
Prepayments for current assets comprise of the following:
March 31, 2013 March 31, 2012
Prepayments for purchase of bandwidth 74,870 90,399
Prepayments related to insurance 468 1,432
Prepayments-others 112,890 97,449
Lease prepayments 8,754 8,753
196,982 198,033
15. Other investments
Other Investments comprise investment in unquoted equity instruments classified as available for sale financial assets which are
carried at cost. The details of such investments are given below:
March 31, 2013 March 31, 2012
Investment in equity shares of Vashi Railway Station Commercial Complex Limited 150 150
Investment in equity shares of Sify Empower India Foundation 100 10
Less: Impairment of investments (100)
Investment in equity shares of Sarayu Clean Gen Private Limited 1,560 -
1,710 160
16. Share capital and share premium
No of shares
Year ended March 31,
2013 2012 2011
Issued as at April 01 178,513,589 178,351,498 53,351,498
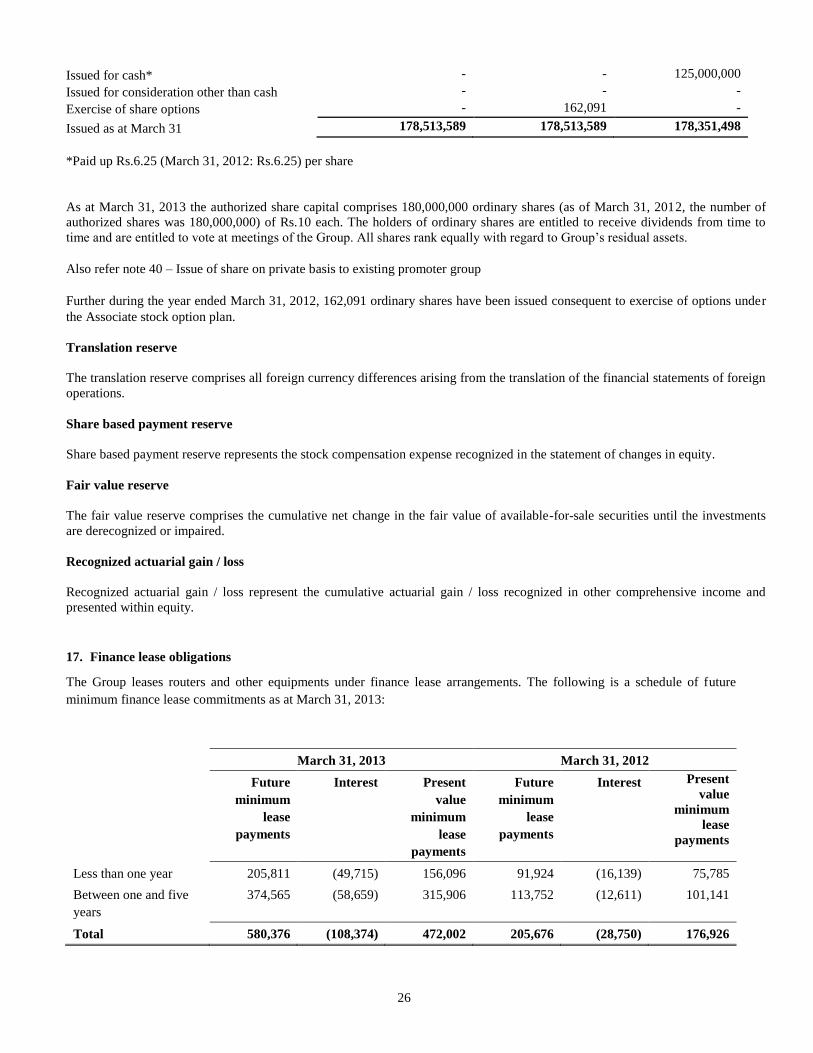
26
Issued for cash* - - 125,000,000
Issued for consideration other than cash - - -
Exercise of share options - 162,091 -
Issued as at March 31 178,513,589 178,513,589 178,351,498
*Paid up Rs.6.25 (March 31, 2012: Rs.6.25) per share
As at March 31, 2013 the authorized share capital comprises 180,000,000 ordinary shares (as of March 31, 2012, the number of
authorized shares was 180,000,000) of Rs.10 each. The holders of ordinary shares are entitled to receive dividends from time to
time and are entitled to vote at meetings of the Group. All shares rank equally with regard to Group‟s residual assets.
Also refer note 40 – Issue of share on private basis to existing promoter group
Further during the year ended March 31, 2012, 162,091 ordinary shares have been issued consequent to exercise of options under
the Associate stock option plan.
Translation reserve
The translation reserve comprises all foreign currency differences arising from the translation of the financial statements of foreign
operations.
Share based payment reserve
Share based payment reserve represents the stock compensation expense recognized in the statement of changes in equity.
Fair value reserve
The fair value reserve comprises the cumulative net change in the fair value of available-for-sale securities until the investments
are derecognized or impaired.
Recognized actuarial gain / loss
Recognized actuarial gain / loss represent the cumulative actuarial gain / loss recognized in other comprehensive income and
presented within equity.
17. Finance lease obligations
The Group leases routers and other equipments under finance lease arrangements. The following is a schedule of future
minimum finance lease commitments as at March 31, 2013:
March 31, 2013 March 31, 2012
Future
minimum
lease
payments
Interest Present
value
minimum
lease
payments
Future
minimum
lease
payments
Interest Present
value
minimum
lease
payments
Less than one year 205,811 (49,715) 156,096 91,924 (16,139) 75,785
Between one and five
years
374,565 (58,659) 315,906 113,752 (12,611) 101,141
Total 580,376 (108,374) 472,002 205,676 (28,750) 176,926

27
18. Employee benefits
March 31, 2013 March 31, 2012
Gratuity payable 23,160 19,515
Compensated absences 29,069 30,551
52,229 50,066
Gratuity cost
The components of gratuity costs recognized in the consolidated income statement for the years ending March 31, 2013, March 31,
2012 and March 31, 2011 consist of the following:
March 31, 2013 March 31, 2012 March 31, 2011
Service cost 15,900 15,892 22,275
Interest cost 4,876 4,449 3,786
Expected return on plan asset (3,295) (3,214) (2,875)
17,481 17,127 23,186
Details of employee benefit obligation and plan asset are as follows:
March 31, 2013 March 31, 2012
Present value of projected benefit obligation at the end of the year 65,723 62,610
Funded status of the plans (42,563) (43,095)
Recognized (asset) / liability 23,160 19,515
The following table set out the status of the gratuity plan:
Change in defined benefit obligation March 31, 2013 March 31, 2012 March 31, 2011
Projected benefit obligation at the beginning of the year 62,610 59,571 51,046
Service cost 15,900 15,892 22,275
Interest cost 4,876 4,449 3,786
Actuarial (gain) / loss (5,835) (9,372) (8,358)
Benefits paid (11,828) (7,930) (9,178)
Projected benefit obligation at the end of the year 65,723 62,610 59,571
Change in plan assets March 31, 2013 March 31, 2012 March 31, 2011
Fair value of plan assets at the beginning of the year 43,095 40,455 34,293
Expected return on plan assets 3,296 3,214 2,875
Actuarial gain / (loss) - - -
Employer contributions 8,000 7,356 12,465
Benefits paid (11,828) (7,930) (9,178)
Fair value of plan assets at the end of the year 42,563 43,095 40,455
Actual return on plan assets 3,296 3,214 2,875
Actuarial assumptions at end of the year:
The principal actuarial assumptions as on March 31, 2013, 2012 and 2011 were as follows:
March 31, 2013 March 31, 2012 March 31, 2011
Discount rate 8.60% P.a 8.00% P.a 8.15% P.a
Long-term rate of compensation increase 8.00% P.a 8.00% P.a 8.00% P.a
Expected long term rate of return on plan assets 8.00% P.a 8.00% P.a 8.00% P.a
Average future working life time 8.40 years 8.60 years 11.06 years
Discount rate: The discount rate is based on prevailing market yields of Indian Government securities as at the end of the year for
the estimated term of the obligations.

28
Long term rate of compensation increase: The estimates of future salary increases considered take into account inflation,
seniority, promotion and other factors.
Expected long term rate of return on plan assets: This is based on the average long term rate of return expected on investments of
the fund during the estimated term of the obligations.
Assumptions regarding future mortality are based on published statistics and mortality tables.
The Group assesses these assumptions with the projected long-term plans of growth and prevalent industry standards.
Historical information
March 31, 2013 March 31, 2012
Experience adjustment on plan liabilities 10,147 5,044
Experience adjustment on plan assets - -
Contributions: The Group expects to contribute Rs.15,000 (March 31 2013: Rs.15,000) to its gratuity fund during the year ending
March 31, 2014.
Plan assets: The Gratuity plan‟s weighted-average asset allocation at March 31, 2013 and March 31, 2012, by asset category is as
follows:
March 31, 2013 March 31, 2012
Funds managed by insurers 100% 100%
Actuarial gains and losses recognized in other comprehensive income
The amount of actuarial gains and losses recognized in other comprehensive income for the years ending March 31, 2013, 2012
and 2011 are as follows:
March 31, 2013 March 31, 2012 March 31, 2011
Actuarial gain / (loss) 5, 835 9,372 8,358
5,835 9,372 8,358
Contributions to defined contribution plans
In accordance with Indian law, all employees receive benefits from a provident fund, which is a defined contribution plan. Both
the employee and employer make monthly contributions to the plan, each equal to a specified percentage of employee‟s basic
salary. The Group has no further obligations under the plan beyond its monthly contributions. The Group contributed Rs.59,524,
Rs. 57,144 and Rs. 53,923 for the years ended March 31, 2013, 2012 and 2011.
19. Other liabilities
March 31, 2013 March 31, 2012
Franchisee deposits and other liabilities 223,434 211,504
223,434 211,504
Financial liabilities included in other liabilities 217,848 211,044
Internet access services at home and through a network of cybercafés is provided through a franchised network of cable operators
in India and cybercafé operators. The Group enters into an agreement with the franchisee that establishes the rights and obligations
of each party and grants each franchisee a non-exclusive license to operate the cybercafé using the Group‟s logo, brand and trade
names. The agreement provides for payment to the Company, of an initial security deposit in consideration for establishing the
franchisee relationship and providing certain initial services.
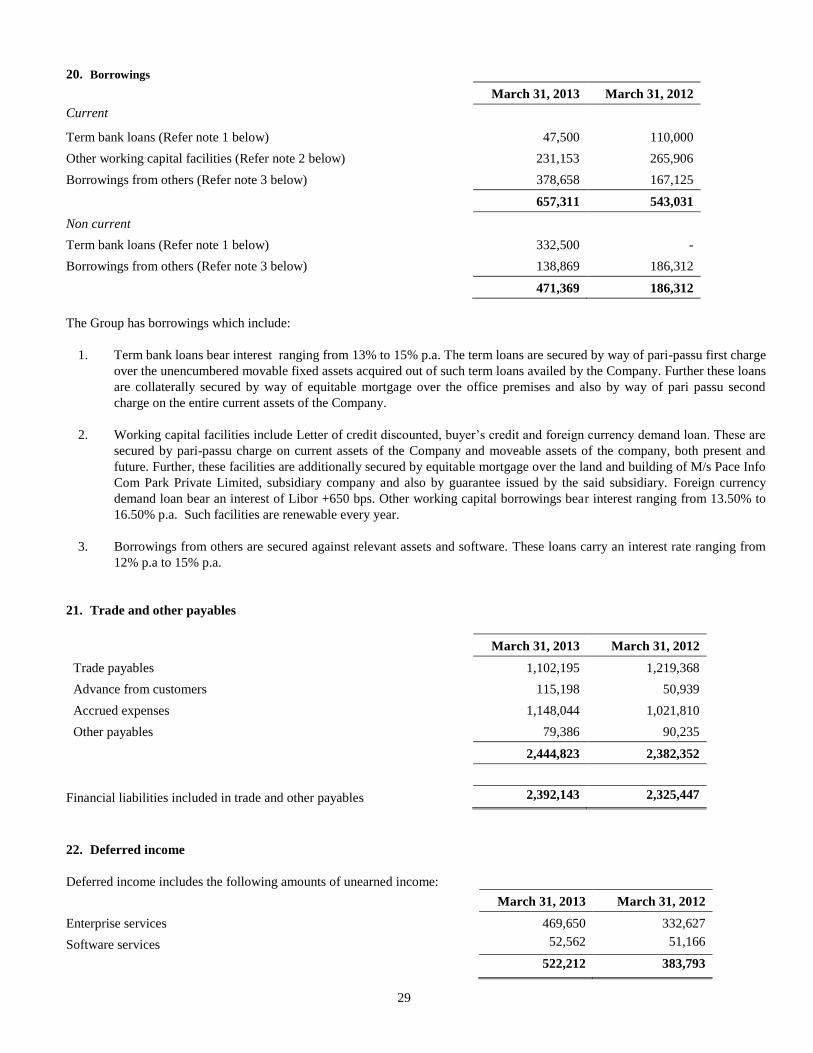
29
20. Borrowings
March 31, 2013 March 31, 2012
Current
Term bank loans (Refer note 1 below)
Other working capital facilities (Refer note 2 below)
47,500
231,153
110,000
265,906
Borrowings from others (Refer note 3 below) 378,658 167,125
657,311 543,031
Non current
Term bank loans (Refer note 1 below) 332,500 -
Borrowings from others (Refer note 3 below) 138,869 186,312
471,369 186,312
The Group has borrowings which include:
1. Term bank loans bear interest ranging from 13% to 15% p.a. The term loans are secured by way of pari-passu first charge
over the unencumbered movable fixed assets acquired out of such term loans availed by the Company. Further these loans
are collaterally secured by way of equitable mortgage over the office premises and also by way of pari passu second
charge on the entire current assets of the Company.
2. Working capital facilities include Letter of credit discounted, buyer‟s credit and foreign currency demand loan. These are
secured by pari-passu charge on current assets of the Company and moveable assets of the company, both present and
future. Further, these facilities are additionally secured by equitable mortgage over the land and building of M/s Pace Info
Com Park Private Limited, subsidiary company and also by guarantee issued by the said subsidiary. Foreign currency
demand loan bear an interest of Libor +650 bps. Other working capital borrowings bear interest ranging from 13.50% to
16.50% p.a. Such facilities are renewable every year.
3. Borrowings from others are secured against relevant assets and software. These loans carry an interest rate ranging from
12% p.a to 15% p.a.
21. Trade and other payables
March 31, 2013 March 31, 2012
Trade payables 1,102,195 1,219,368
Advance from customers 115,198 50,939
Accrued expenses 1,148,044 1,021,810
Other payables 79,386 90,235
2,444,823 2,382,352
Financial liabilities included in trade and other payables 2,392,143 2,325,447
22. Deferred income
Deferred income includes the following amounts of unearned income:
March 31, 2013 March 31, 2012
Enterprise services 469,650 332,627
Software services 52,562 51,166
522,212 383,793
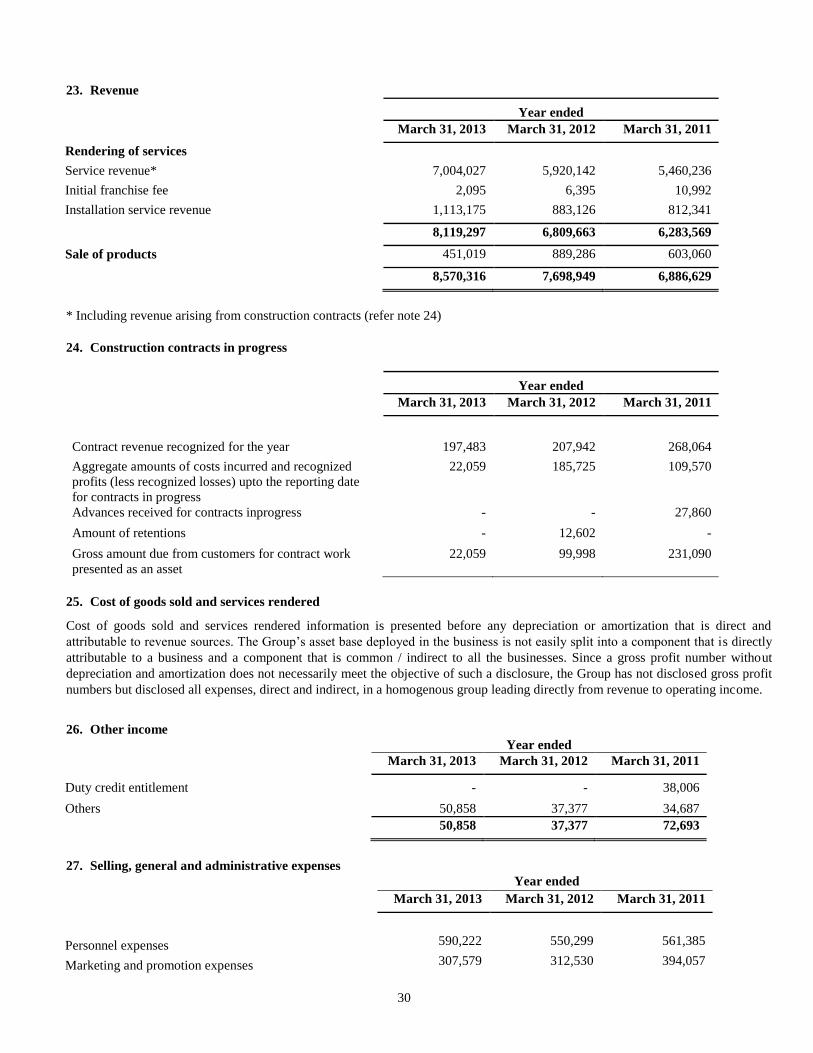
30
23. Revenue
Year ended
March 31, 2013 March 31, 2012 March 31, 2011
Rendering of services
Service revenue* 7,004,027 5,920,142 5,460,236
Initial franchise fee 2,095 6,395 10,992
Installation service revenue 1,113,175 883,126 812,341
8,119,297 6,809,663 6,283,569
Sale of products 451,019 889,286 603,060
8,570,316 7,698,949 6,886,629
* Including revenue arising from construction contracts (refer note 24)
24. Construction contracts in progress
Year ended
March 31, 2013 March 31, 2012 March 31, 2011
Contract revenue recognized for the year 197,483 207,942 268,064
Aggregate amounts of costs incurred and recognized
profits (less recognized losses) upto the reporting date
for contracts in progress
22,059 185,725 109,570
Advances received for contracts inprogress - - 27,860
Amount of retentions - 12,602 -
Gross amount due from customers for contract work
presented as an asset
22,059 99,998 231,090
25. Cost of goods sold and services rendered
Cost of goods sold and services rendered information is presented before any depreciation or amortization that is direct and
attributable to revenue sources. The Group‟s asset base deployed in the business is not easily split into a component that is directly
attributable to a business and a component that is common / indirect to all the businesses. Since a gross profit number without
depreciation and amortization does not necessarily meet the objective of such a disclosure, the Group has not disclosed gross profit
numbers but disclosed all expenses, direct and indirect, in a homogenous group leading directly from revenue to operating income.
26. Other income
Year ended
March 31, 2013 March 31, 2012 March 31, 2011
Duty credit entitlement - - 38,006
Others 50,858 37,377 34,687
50,858 37,377 72,693
27. Selling, general and administrative expenses
Year ended
March 31, 2013 March 31, 2012 March 31, 2011
Personnel expenses 590,222 550,299 561,385
Marketing and promotion expenses 307,579 312,530 394,057

31
Administrative and other expenses* 2,143,704 1,684,380 1,486,357
3,041,505 2,547,209 2,441,799
* Includes foreign exchange gain / (loss) of Rs.18,881, Rs. 37,650 and Rs. 12,941 for the years ended March 31, 2013, 2012 and
2011 respectively.
28. Personnel expenses
Year ended
March 31, 2013 March 31, 2012 March 31, 2011
Salaries and wages 1,356,744 1,314,023 1,211,183
Contribution to provident fund and other funds 77,286 77,840 77,164
Staff welfare expenses 15,599 17,426 22,296
Employee stock compensation expense 2,566 31,385 10,201
1,452,195 1,440,674 1,320,844
Attributable to cost of goods sold and services rendered 861,973 890,375 759,459
Attributable to selling, general and administration
expenses
590,222 550,299 561,385
29. Share-based payments
Share based payments are designed as equity-settled plans. Under the equity settled plans, the Group had issued stock options
under Associate Stock Option Plan (ASOP) 1999, ASOP 2000, ASOP 2002, ASOP 2005 and ASOP 2007. Each option entitles the
holder to purchase one American Depository Share (ADS) at an exercise price determined by the Compensation committee on the
date of the grant. There are no options outstanding in respect of ASOP 1999, ASOP 2000, ASOP 2002 and ASOP 2005 plans as at
April 1, 2009. Our stock option plans are detailed as under:
(i) Associate Stock Option Plan 2007
In September 2007, the Shareholders of the Group approved a new scheme for allotment of stock options to employees, the
Associate Stock Option Plan 2007. Consequent upon the introduction of ASOP 2007 plan, 797,600 unissued stock options
pertaining to Associate Stock Option Plan 2005 are no longer available for issuance. The options vest over a period of 4 years as follows:
One sixth of the option quantity: At the end of one year from the date of the grant.
Five sixth of the option quantity: At the end of each quarter during the second, third and fourth year from the date of
the grant in twelve equal installments.
The stock options can be exercised within a period of twelve months from the date of last vesting.
As the number of stock options and the price of those options were made known to each allottee, the Plan has been considered
as a fixed price grant. Stock option activity under the ASOP 2007 Plan is as follows:
No. of options granted, exercised
and forfeited
Number
of options
Weighted
average
exercise
price in
Rs.
Number of
options
Weighted
average
exercise
price in Rs.
Number of
options
Weighted
average
exercise
price in Rs.
2013 2013 2012 2012 2011 2011
Outstanding at the beginning of the
year
601,168 152.26 841,200 146.58 1,078,800 149.21
Granted during the year - - - - 6,000 74.41
Replaced (Refer to notes below) - - - - - -

32
Replacement options granted
(Refer to notes below)
- - - - - -
Forfeited during the year - - (27,995) 109.33 (81,801) 152.37
Expired during the year (546,576) 144.52 (49,946) 144.52 (161,799) 158.52
Exercised during the year - - (162,091) 131.99 - -
Outstanding at the end of the year 54,592 98.85 601,168 152.26 841,200 146.58
Vested and Exercisable at the end
of the year
54,592 98.85 579,140 153.59 566,908 151.36
Weighted average grant date fair
value of grants during the year
- - - - - -
The fair value of stock options granted has been measured using the Black Scholes model at the date of the grant. The Black
Scholes model includes assumptions regarding dividend yields, expected volatility, expected term (or “option life”) and risk free
interest rates. In respect of the options granted, the expected term is estimated based on the vesting term, contractual term as well
as expected exercise behavior of the employees receiving the option. Expected volatility of the option is based on historical
volatility, during a period equivalent to the option life, of the observed market prices of the Company‟s publicly traded equity
shares. Dividend yield of the options is based on the recent dividend activity. Risk-free interest rates are based on the Government
securities yield in effect at the time of the grant. These assumptions reflect management‟s best estimates, but these assumptions
involve inherent market uncertainties based on market conditions generally outside the Company‟s control. As a result, if other
assumptions had been used in the current period, stock-based compensation expense could have been materially impacted. Further,
if management uses different assumptions in the future periods, stock compensation expense could be materially impacted in future
years.
The estimated fair value of stock options is charged to income on a straight-line basis over the requisite service period for each
separately vesting portion of the award as if the award was, in substance, multiple awards.
The fair value of services received in return for share options granted under ASOP 2007 is based on the fair value of share options
granted measured using Black Scholes model, with the following inputs:
No. of options granted, exercised and forfeited Year ended
March 31, 2013
Year ended
March 31, 2012
Year ended March
31, 2011
Weighted average share price - - 82.68
Weighted average exercise price - - 74.41
Expected volatility - - 110.5% -
124.7%
Option life - - 3 – 4.5 years
Expected dividends - - -
Risk-free interest rate - - 2.61%
A summary of information about fixed price stock options outstanding as at March 31, 2013 is furnished below:
Range of
exercise price
in Rs.
Number
outstanding at
March 31, 2013
Weighted
average
exercise price
in Rs.
Weighted
average
remaining
contractual life
Number
exercisable at
March 31, 2012
Weighted
average
exercise price
in Rs.
ASOP
2007
51.51-188.32 54,592 98.85 0.56 yrs 601,168 152.26
Modification
During the year ended March 31, 2008, the stock options issued under ASOP 2005 and ASOP 2007 had been out of money for
most time of the vesting period. As a result, the Group‟s compensation committee allowed certain employees in their approval
dated January 22, 2008 to surrender their (a) unvested (b) vested and (c) unexercised stock options and obtain fresh options at a
discount of 10% of the market price under ASOP 2007 prevalent at the date of modification in lieu of the surrendered stock
options. This modification resulted in the revision in the exercise price as well as the service period over which the stock options
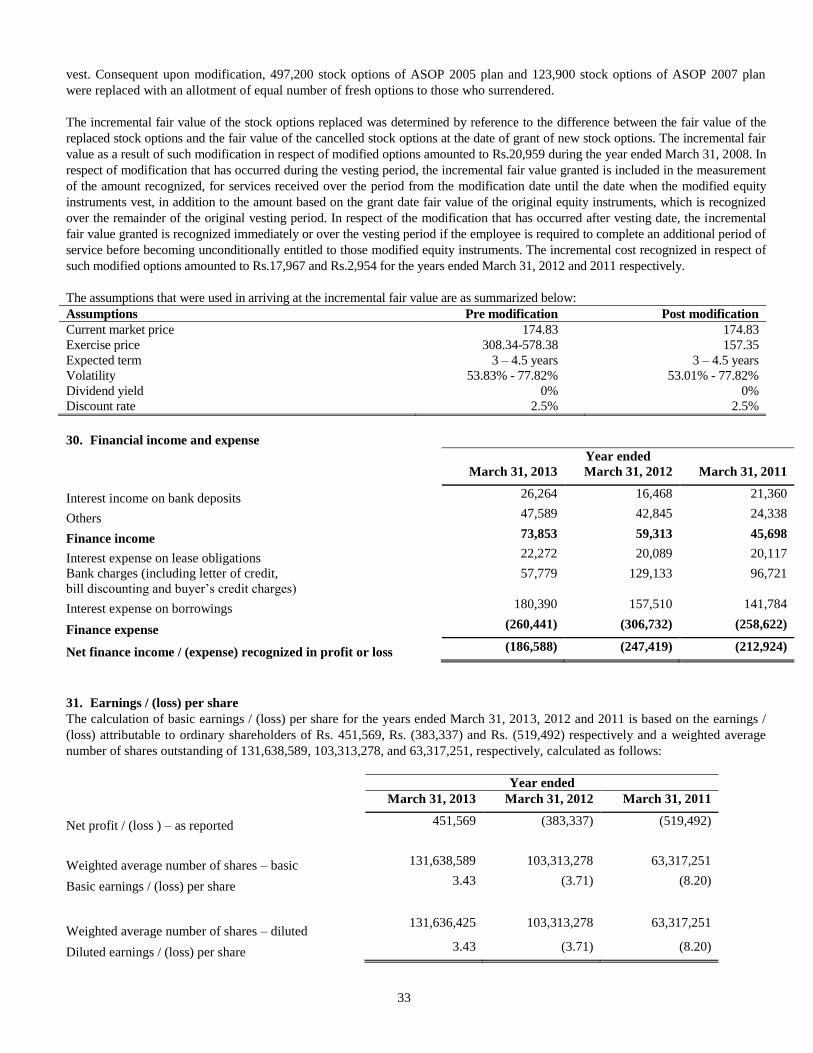
33
vest. Consequent upon modification, 497,200 stock options of ASOP 2005 plan and 123,900 stock options of ASOP 2007 plan
were replaced with an allotment of equal number of fresh options to those who surrendered.
The incremental fair value of the stock options replaced was determined by reference to the difference between the fair value of the
replaced stock options and the fair value of the cancelled stock options at the date of grant of new stock options. The incremental fair
value as a result of such modification in respect of modified options amounted to Rs.20,959 during the year ended March 31, 2008. In
respect of modification that has occurred during the vesting period, the incremental fair value granted is included in the measurement
of the amount recognized, for services received over the period from the modification date until the date when the modified equity
instruments vest, in addition to the amount based on the grant date fair value of the original equity instruments, which is recognized
over the remainder of the original vesting period. In respect of the modification that has occurred after vesting date, the incremental
fair value granted is recognized immediately or over the vesting period if the employee is required to complete an additional period of
service before becoming unconditionally entitled to those modified equity instruments. The incremental cost recognized in respect of
such modified options amounted to Rs.17,967 and Rs.2,954 for the years ended March 31, 2012 and 2011 respectively.
The assumptions that were used in arriving at the incremental fair value are as summarized below:
Assumptions Pre modification Post modification
Current market price 174.83 174.83
Exercise price 308.34-578.38 157.35
Expected term 3 – 4.5 years 3 – 4.5 years
Volatility 53.83% - 77.82% 53.01% - 77.82%
Dividend yield 0% 0%
Discount rate 2.5% 2.5%
30. Financial income and expense
Year ended
March 31, 2013 March 31, 2012 March 31, 2011
Interest income on bank deposits 26,264 16,468 21,360
Others 47,589 42,845 24,338
Finance income 73,853 59,313 45,698
Interest expense on lease obligations 22,272 20,089 20,117
Bank charges (including letter of credit,
bill discounting and buyer‟s credit charges)
57,779 129,133 96,721
Interest expense on borrowings 180,390 157,510 141,784
Finance expense (260,441) (306,732) (258,622)
Net finance income / (expense) recognized in profit or loss (186,588) (247,419) (212,924)
31. Earnings / (loss) per share
The calculation of basic earnings / (loss) per share for the years ended March 31, 2013, 2012 and 2011 is based on the earnings /
(loss) attributable to ordinary shareholders of Rs. 451,569, Rs. (383,337) and Rs. (519,492) respectively and a weighted average
number of shares outstanding of 131,638,589, 103,313,278, and 63,317,251, respectively, calculated as follows:
Year ended
March 31, 2013 March 31, 2012 March 31, 2011
Net profit / (loss ) – as reported 451,569 (383,337) (519,492)
Weighted average number of shares – basic 131,638,589 103,313,278 63,317,251
Basic earnings / (loss) per share 3.43 (3.71) (8.20)
Weighted average number of shares – diluted 131,636,425 103,313,278 63,317,251
Diluted earnings / (loss) per share 3.43 (3.71) (8.20)

34
Weighted average number of ordinary shares basic
Year ended March 31,
2013 2012 2011
Issued fully paid ordinary shares at April 01 53,351,498 53,351,498 53,351,498
Effect of shares issued on exercise of stock options 162,091 98,392 -
Effect of partly paid shares (Note 1) 78,125,000 49,863,388 9,965,753
Effect of shares issued consequent to amalgamation of Sify Communications
Limited - - -
Weighted average number of equity shares and equivalent shares outstanding 131,638,589 103,313,278 63,317,251
Weighted average number of ordinary shares diluted
Year ended March 31,
2013 2012 2011
Weighted average number of ordinary shares (basic) 131,638,589 103,313,278 63,317,251
Effect of stock options (2,164) - -
Weighted average number of equity shares outstanding (diluted) 131,636,425 103,313,278 63,317,251
As the Company incurred a net loss attributable to ordinary shareholders for the years ended March 31, 2012 and 2011, 601,168
and 841,200 ordinary shares arising out of potential exercise of outstanding stock options as at March 31, 2012 and 2011
respectively were not included in the computation of diluted earnings per share, as their effect was anti-dilutive.
Note 1: During the year ended March 31, 2011, 125,000,000 ordinary shares were issued to the existing promoter group on a
private placement basis. As of March 31, 2012, these shares were partly paid up to the extent of Rs.6.25 (March 31, 2011
: Rs.2.50) per share. Refer note 16 to the consolidated financial statements.
32. Operating leases
The Group leases office buildings and other equipment under operating lease arrangements that are renewable on a periodic basis
at the option of both the lessor and the lessee. Some of the leases include rent escalation clauses. Rental expenses under these
leases were Rs.367,252, Rs. 339,139 and Rs. 326,507 for the years ended March 31, 2013, 2012 and 2011 respectively. The
schedule of future minimum rental payments in respect of operating leases is set out below:
As at March 31, 2013
Lease obligations Total Less 1-5 years More than 5
years than 1 year
Non-cancellable operating lease obligations 1,803,863 113,744 519,254 1,170,865
As at March 31, 2012
Lease obligations Total Less 1-5 years More than 5
years than 1 year
Non-cancellable operating lease obligations 1,778,901 109,762 479,262 1,189,877
33. Segment reporting
The primary operating segments of the Group are:
Enterprise Services; such as Network Services and IT Services, providing Internet, connectivity to large corporate and mid-
market customers, SMBs, SOHOs and through cybercafés and homes, Voice ILD/NLD, Hosting , security and consulting,
managed service solutions;
Software services, such as application services and development of e-learning software and online portal services and content
offerings
The Chief Operating Decision Maker (“CODM”), i.e, The Board of Directors and the senior management, evaluate the Group‟s
performance and allocate resources to various strategic business units that are identified based on the products and services that they

35
offer and on the basis of the market served. The measure of profit / loss reviewed by the CODM is “Earnings/loss before interest,
taxes, depreciation and amortization” also referred to as “segment operating income / loss”. Revenue in relation to segments is
categorized based on items that are individually identifiable to that segment. Bandwidth costs, which form a significant part of the
total expenses, is allocated to Network Services. Manpower costs of Technology resources rendering services to support
Infrastructure operations, Managed services and Application services, are identified to an operating segment specifically. The
Group believes that the resulting allocations are reasonable.
Certain expenses, such as depreciation, technology infrastructure and administrative overheads, which form a significant
component of total expenses, are not allocable to specific segments as the underlying services are used interchangeably.
Management believes that it is not practical to provide segment disclosure of these expenses and, accordingly, they are separately
disclosed as “unallocated” and adjusted only against the total income of the Group.
A significant part of the fixed assets used in the Group‟s business are not identifiable to any of the reportable segments and can be
used interchangeably between segments. As a result the measures of segment assets and liabilities are not regularly reviewed by the
CODM and hence disclosures relating to segment assets and liabilities have not been provided.
The Group‟s operating segment information for the years ended March 31, 2013, 2012 and 2011, are presented below:
Year ended March 31, 2013
Enterprise
services
Software
Services
Total
Segment revenue 7,869,647 700,669 8,570,316
Allocated segment expenses (6,486,556) (717,919) (7,204,475)
Segment operating income / (loss) 1,383,091 (17,250) 1,365,841
Unallocated expenses:
Selling, general and administrative expenses (587,909)
Depreciation and amortization (848,210)
Other income / (expense), net 50,858
Finance income 73,853
Finance expenses (260,441)
Gain on sale of equity accounted investee 657,577
Profit / (loss) before tax 451,569
Income tax (expense) / benefit -
Profit / (loss) for the year 451,569
Year ended March 31, 2012 (As adjusted)
Enterprise
services
Software
Services
Total
Segment revenue 6,949,872 749,077 7,698,949
Allocated segment expenses (5,906,845) (729,587) (6,636,432)
Segment operating income / (loss) 1,043,027 19,490 1,062,517
Unallocated expenses:
Selling, general and administrative expenses (571,550)
Depreciation and amortization (691,560)
Other income / (expense), net 37,377
Finance income 59,313
Finance expenses (306,732)
Share of profit of equity accounted investee 27,298
Profit / (loss) before tax (383,337)
Income tax (expense) / benefit -
Profit / (loss) for the year (383,337)

36
Year ended March 31, 2011 (As adjusted)
Enterprise
services
Software
Services
Total
Segment revenue 6,156,774 729,855 6,886,629
Allocated segment expenses (5,453,848) (623,451) (6,077,299)
Impairment loss on intangibles including
goodwill
- (1,857) (1,857)
Segment operating income / (loss) 702,926 104,547 807,473
Unallocated expenses:
Cost of goods sold (36,222)
Selling, general and administrative expenses (537,708)
Depreciation and amortization (685,836)
Other income / (expense), net 72,693
Finance income 45,698
Finance expenses (258,622)
Share of profit of equity accounted investee 73,032
Profit / (loss) before tax (519,492)
Income tax (expense) / benefit -
Profit / (loss) for the year (519,492)
Year Reconciliations
Cost of goods sold Selling, general
and
administrative
expenses
Finance expenses Total
Year ended March 31, 2013
Allocated segment expenses 4,750,879 2,453,596 - 7,204,475
Unallocated segment expenses - 587,909 260,441 848,350
Total as per income statement 4,750,879 3,041,505 260,441 8,052,825
Year ended March 31, 2012
Allocated segment expenses 4,660,773 1,975,659 - 6,636,432
Unallocated segment expenses - 571,550 306,732 878,282
Total as per income statement 4,660,773 2,547,209 306,732 7,514,714
Year ended March 31, 2011
Allocated segment expenses 4,173,208 1,904,091 - 6,077,299
Unallocated segment expenses 36,222 537,708 258,622 832,552
Total as per income statement 4,209,430 2,441,799 258,622 6,909,851
Reorganization of business segments
We have been historically operating with three segments of business viz Enterprise Services, Commercial and Consumer Service
and Software services till the previous reporting year ending March 2012. Data as a service was offered by two segments namely
Enterprise services and Commercial and Consumer services, with both the segments focussing on different market segmentation.
Over the years, there has been significant growth in the mid range of the Data industry, creating a niche position for Small and
Medium Business (SMB), thereby witnessing a de-growth in the lower end of the market. In order to focus and participate in the
growth market, leverage the technology capabilities and to achieve economies of scale, the Chief Operations Decision Maker
(CODM) has decided to integrate the two segments into one. Based on the management decision, certain changes to the business
structure are made effective April 1, 2012. The Corresponding revenues and costs have been regrouped into the respective
segments. Manpower cost of Technology division, comprising of Infrastructure, Managed Services and Software, is now identified
as a specific operating cost to all relevant segment.

37
Consequently the revised operating segments are as below:
Enterprise Service: Enterprise Service is broadly represented by two Line of business namely “ Network Services and IT
services”. Data services to corporates, mid market (SMB , SOHO) and voice services are offered as Network Services, while Data
Center Hosting and Managed Services, along with System Integration, will comprise IT services. They will service both domestic
and international clients from large corporate and mid-market customers.
Software Service: These services comprise application services and e-learning services. This business line will offer applications
through the Cloud, primarily targeted at enterprise and international customers. Under Software services the Company also operates
the portals, “Sify.com”,”Samachar.com”, and “SifyMax.in” that provides a variety of India-related content to audiences both in
India and abroad, and which generates revenue from advertisements and other value added services.
These reorganization of operating segments did not have any effect on reported consolidated operating income, income before
income taxes, net income or per share amounts. The following table provides the amounts reclassified for all prior periods.
Revenue reclassifications
For the year ended March 31, 2012
Previous operating
segments
Enterprise services Commercial and
consumer services
Software services Total
As previously
reported
6,675,853 390,045 633,051 7,698,949
Enterprise services 274,019 (274,019) - -
Software services (116,026) 116,026 -
Revised revenue 6,949,872 - 749,077 7,698,949
Revised operating
segments
Enterprise services - Software services
For the year ended March 31, 2011
Previous operating
segments
Enterprise services Commercial and
consumer services
Software services Total
As previously
reported
5,752,879 526,366 607,384 6,886,629
Enterprise services 403,895 (403,895) - -
Software services - (122,471) 122,471 -
Revised Revenue 6,156,774 - 729,855 6,886,629
Revised operating
segments
Enterprise services - Software services
Operating and unallocated cost reclassifications:
For the year ended March 31, 2012
Previous operating
segments
Enterprise services Commercial and
consumer services
Software services Unallocated
expenses and
income
As previously
reported
5,169,236 473,210 587,949 977,587
Cost of goods sold 372,000 - 34,037 (406,037)
Operating expenses 365,609 (473,210) 107,601 -
Revised Costs 5,906,845 - 729,587 571,550
Revised operating Enterprise services - Software services

38
segments
For the year ended March 31, 2011
Previous operating
segments
Enterprise services Commercial and
consumer services
Software services Unallocated
expenses and
income
As previously
reported
4,403,435 724,283 506,936 980,353
Cost of goods sold 442,645 - - (442,645)
Operating expenses 607,768 (724,283) 116,515 -
Revised Costs 5,453,848 - 623,451 537,708
Revised operating
segments
Enterprise services - Software services
Geographic segments
The Group has two geographic segments India and rest of the world. Revenues from the geographic segments based on domicile of
the customer are as follows:
Description India Rest of the
world Total
Revenues
Year ended March 31, 2013 5,222,415 3,347,901 8,570,316
Year ended March 31, 2012 4,864,915 2,834,034 7,698,949
Year ended March 31, 2011 4,495,801 2,390,828 6,886,629
The Group does not disclose information relating to non-current assets located in India and rest of the world as the necessary
information is not available and the cost to develop it would be excessive.
The revenue from transactions with a single external customer did not exceed more than 10% of the total revenue of the Company
for each of the three years ended March 31, 2013.
34. Contingencies
a)During the previous years, the Group had received assessment orders from the Income-tax Department of India for various
financial years disallowing certain expenditure like bandwidth charges and foreign currency payments for non-deduction of
withholding taxes. The Company appealed against those order before Commissioner of Income Tax (Appeals) (CIT(A)) and
received favourable orders. The department has filed appeals before Income Tax Appellate Tribunal (ITAT) disputing CIT(A)
orders. The group believes that the appeal by the department is not sustainable and consequently no loss contingency is necessary
as at March 31, 2013. Income tax claims against the company as at March 31, 2013 amounted to Rs.NIL (March 31, 2012:
Rs.84,981).
b) Contingencies due to certain service tax claims as at March 31, 2013 amounted to Rs.478,876 (March 31, 2012: Rs 421,730).
c) Additionally, the Group is also involved as a party to lawsuits, claims and proceedings, which arise in the ordinary course of
business. The Group does not foresee any material contingency out of the pending issues.
d) The Group during the year ended March 31, 2009 entered into a contract with Emirates Integrated Telecom for the construction
and supply of capacity from the Europe India Gateway. As per the contract with Emirates, the Group is required to pay its share
of decommissioning costs if any that may arise in the future. No provision has been made by the Group for such
decommissioning costs as the amount of provision cannot be measured reliably as at March 31, 2013.

39
e) Liability on customer letter of credit discounted amounted to Rs. 122,260 (March 31, 2012: Rs.87,793).
f) During the year, the Company has participated in the Export Promotion Capital Goods Scheme (“the scheme”) under which
capital equipments are permitted to be imported against a special licence at a substantially reduced customs duty, subject to
fulfilment of obligation to export goods/services supplied or rendered by use of capital equipment imported under the scheme to the
extent of over 8 times the value of duty saved over a period of 8 years from the date of obtaining the licence. In case of failure to
meet the export obligation, the company would be liable to pay the differential between the normal duty and the duty saved under
the scheme along with the interest. As of now, the Company is holding 19 licences with a corresponding export obligation of
Rs.626,900. Taking into account the track record of our exports, the Company believes that it would be able to meet the export
obligation within the time frame and would not be exposed to any liability on account of the above scheme
g) In respect of contingencies arising on legal proceedings, refer Note 35.
35. Legal proceedings
a) The Company and certain of its officers and directors are named as defendants in a securities class action lawsuit filed in the
United States District Court for the Southern District of New York. This action, which is captioned In re Satyam Infoway Ltd.
Initial Public Offering Securities Litigation, also names several of the underwriters involved in Company‟s initial public
offering of American Depository Shares as defendants. This class action is brought on behalf of a purported class of
purchasers of Company‟s ADSs from the time of Company‟s Initial Public Offering (“IPO”) in October 1999 through
December 2000. The central allegation in this action is that the underwriters in Company‟s IPO solicited and received
undisclosed commissions from, and entered into undisclosed arrangements with, certain investors who purchased Company‟s
ADSs in the IPO and the aftermarket. The complaint also alleges that Company violated the United States Federal Securities
laws by failing to disclose in the IPO prospectus that the underwriters had engaged in these allegedly undisclosed
arrangements. More than 300 issuers have been named in similar lawsuits.
On April 2, 2009, the parties lodged with the Court a motion for preliminary approval of a proposed settlement between all
parties, including the Company and its former officers and directors. The proposed settlement provides the plaintiffs with $586
million in recoveries from all defendants. Under the proposed settlement, the Issuer Defendants collectively would be
responsible for $100 million, which would be paid by the Issuers‟ insurers, on behalf of the Issuer Defendants and their officers
and directors.
Accordingly, any direct financial impact of the proposed settlement is expected to be borne by the Company‟s insurers. On
June 12, 2009, the Federal District Court granted preliminary approval of the proposed settlement. On October 6, 2009, the
District Court issued an order granting final approval of the settlement. Subsequent to the final approval of Settlement
agreement by the District court, there were several notices of appeal filed. Most were filed by the same parties that objected to
the settlement in front of the District Court. These appeals were consolidated into a single appeal and briefing schedule was
held. On January 9, 2012 the class counsel and objectors counsel entered into a settlement agreement, which includes an
agreement to dismiss the above appeal. Thus the above Appeal has been dismissed with prejudice confirming the Settlement
agreement entered before the District Court.
As of March 31,2013, the exposure under this settlement has been settled by the insurer as per the settlement agreement.
b) Proceedings before Department of Telecommunications
(i) License fees
On October 12, 2009 (as later clarified by the DoT), the Department of Telecommunications („DOT‟) raised a
demand on Sify Technologies for Rs.14 million after correcting the arithmetical error in the assessment letter.
On February 26, 2010 DOT raised a demand on Sify Communications (erstwhile subsidiary merged with Sify
Technologies Limited) for Rs.26 million.
The above demands were made by the DoT on the premise that all amounts of income (whether direct or indirect) including
certain items like other income, interest on deposits, gain on foreign exchange fluctuation, profit on sale of assets & provision
written back, that have got anything to do with telecom operations of the Company or arise in connection with the Telecom
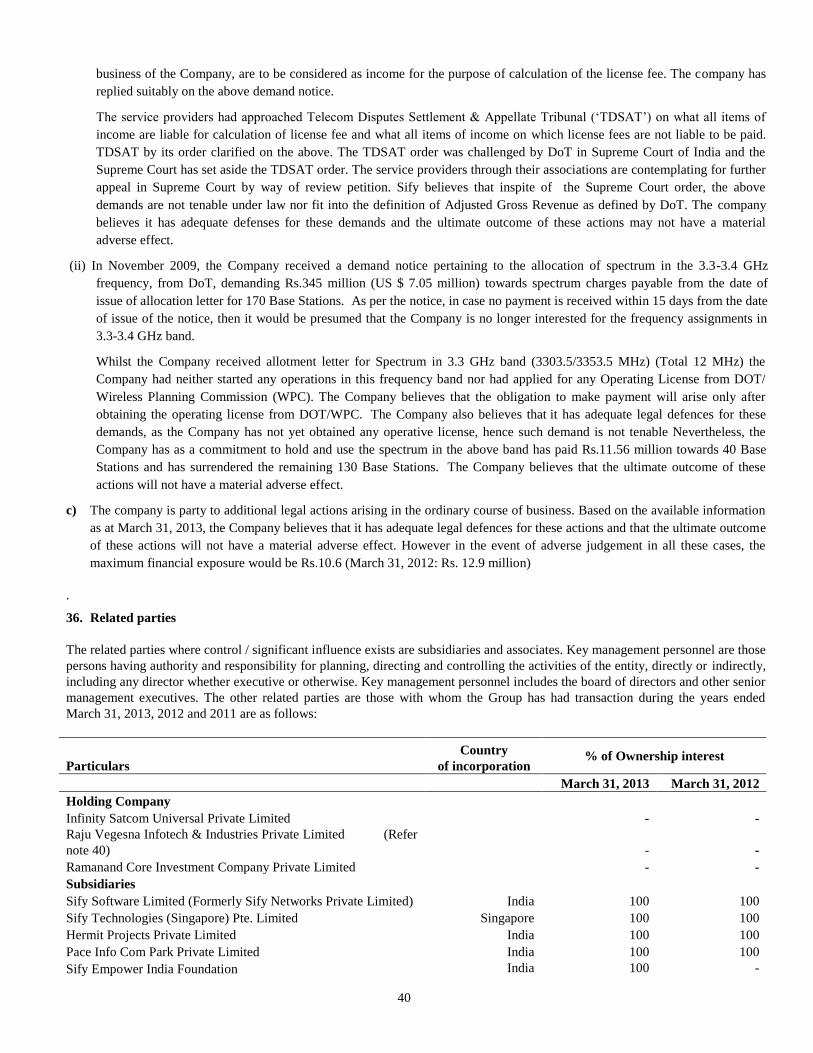
40
business of the Company, are to be considered as income for the purpose of calculation of the license fee. The company has
replied suitably on the above demand notice.
The service providers had approached Telecom Disputes Settlement & Appellate Tribunal („TDSAT‟) on what all items of
income are liable for calculation of license fee and what all items of income on which license fees are not liable to be paid.
TDSAT by its order clarified on the above. The TDSAT order was challenged by DoT in Supreme Court of India and the
Supreme Court has set aside the TDSAT order. The service providers through their associations are contemplating for further
appeal in Supreme Court by way of review petition. Sify believes that inspite of the Supreme Court order, the above
demands are not tenable under law nor fit into the definition of Adjusted Gross Revenue as defined by DoT. The company
believes it has adequate defenses for these demands and the ultimate outcome of these actions may not have a material
adverse effect.
(ii) In November 2009, the Company received a demand notice pertaining to the allocation of spectrum in the 3.3-3.4 GHz
frequency, from DoT, demanding Rs.345 million (US $ 7.05 million) towards spectrum charges payable from the date of
issue of allocation letter for 170 Base Stations. As per the notice, in case no payment is received within 15 days from the date
of issue of the notice, then it would be presumed that the Company is no longer interested for the frequency assignments in
3.3-3.4 GHz band.
Whilst the Company received allotment letter for Spectrum in 3.3 GHz band (3303.5/3353.5 MHz) (Total 12 MHz) the
Company had neither started any operations in this frequency band nor had applied for any Operating License from DOT/
Wireless Planning Commission (WPC). The Company believes that the obligation to make payment will arise only after
obtaining the operating license from DOT/WPC. The Company also believes that it has adequate legal defences for these
demands, as the Company has not yet obtained any operative license, hence such demand is not tenable Nevertheless, the
Company has as a commitment to hold and use the spectrum in the above band has paid Rs.11.56 million towards 40 Base
Stations and has surrendered the remaining 130 Base Stations. The Company believes that the ultimate outcome of these
actions will not have a material adverse effect.
c) The company is party to additional legal actions arising in the ordinary course of business. Based on the available information
as at March 31, 2013, the Company believes that it has adequate legal defences for these actions and that the ultimate outcome
of these actions will not have a material adverse effect. However in the event of adverse judgement in all these cases, the
maximum financial exposure would be Rs.10.6 (March 31, 2012: Rs. 12.9 million)
.
36. Related parties
The related parties where control / significant influence exists are subsidiaries and associates. Key management personnel are those
persons having authority and responsibility for planning, directing and controlling the activities of the entity, directly or indirectly,
including any director whether executive or otherwise. Key management personnel includes the board of directors and other senior
management executives. The other related parties are those with whom the Group has had transaction during the years ended
March 31, 2013, 2012 and 2011 are as follows:
Particulars
Country
of incorporation % of Ownership interest
March 31, 2013 March 31, 2012
Holding Company
Infinity Satcom Universal Private Limited - -
Raju Vegesna Infotech & Industries Private Limited (Refer
note 40) - -
Ramanand Core Investment Company Private Limited - -
Subsidiaries
Sify Software Limited (Formerly Sify Networks Private Limited) India 100 100
Sify Technologies (Singapore) Pte. Limited Singapore 100 100
Hermit Projects Private Limited India 100 100
Pace Info Com Park Private Limited India 100 100
Sify Empower India Foundation India 100 -

41
Others (Entities in which the Key Management Personnel
have controlling interest / significant influence and relatives
of Key Management Personnel)
Radhika Vegesna India - -
Server Engines LLC USA - -
Server Engines India Private Limited India - -
VALS Developers Private Limited India - -
Raju Vegesna Developers Private Limited India - -
The following is a summary of the related party transactions for the year ended March 31, 2013:
Transactions
Holding
Company
Associates
Others Key
Management
Personnel***
Consultancy services received - - - 240
Sitting fees paid - - - 980
Salaries and other short term benefits - - - 42,042
Contributions to defined contribution plans - - - 1,934
Share based payment transactions - - - 270
Issue of shares on private placement basis** - - - -
Advance lease rentals and refundable deposits
refunded*
- - - -
Refundable lease deposit paid**** - - - -
Lease rentals paid**** 900 - 3,429 -
Amount of outstanding balances
Advance lease rentals and refundable deposits
made****
- - 2,558 -
The following is a summary of the related party transactions for the year ended March 31, 2012:
Transactions
Holding
Company
Associates
Others Key
Management
Personnel***
Consultancy services received - - - 240
Sitting fees paid - - - 1,280
Salaries and other short term benefits - - - 37,385
Contributions to defined contribution plans - - - 1,602
Share based payment transactions - - - 1,041
Issue of shares on private placement basis** 1,500,000 - - -
Advance lease rentals and refundable deposits
refunded*
- - 2,175 -
Refundable lease deposit paid**** - - - -
Lease rentals paid**** 150 - 3,129 -
Amount of outstanding balances
Advance lease rentals and refundable deposits
made****
- - 2,558 -
The following is a summary of the related party transactions for the year ended March 31, 2011:
Transactions
Holding
Company
Associates
Others Key
Management
Personnel***
Consultancy services received - - - 240
Sitting fees paid - - - 1,200
Salaries and other short term benefits - - - 40,328

42
Contributions to defined contribution plans - - - 1,913
Share based payment transactions - - - 4,226
Issue of shares on private placement basis** 1,000,000 - - -
Advance lease rentals and refundable deposits
refunded
- - 282,825 -
Refundable lease deposit paid**** - - 2,558 -
Lease rentals paid**** - - 2,558 -
Amount of outstanding balances
Debtors - - - -
Advance lease rentals and refundable deposits
made****
- - 2,558 -
*Represents deposits made to VALS Developers Private Limited (“VALS”).VALS was owned and controlled by Raju Vegesna
Infotech & Industries Private Limited, in which Mr. Raju Vegesna, our principal share holder and Managing Director, was holding
94.66% equity in his personal capacity. During the year ended March 31, 2009, Sify entered into an agreement for Sub Lease with
VALS Developers Private Limited to take on lease on long term basis the proposed building which is in the process of being
constructed. The lease agreement, when final and executed, was expected to have an initial non-cancellable term of 5 years, with a
further option for Sify to renew or cancel the lease for the incremental five year terms. In terms of this Agreement for Sub Lease,
Sify had paid a security deposit of Rs.125,700 and advance rental of Rs.157,125 to VALS. As per the terms of the Sub Lease, the
security deposit will be refunded at the end of lease term and the advance rental would be adjusted over a period of 15 months
from the commencement of the lease. To give effect to the above arrangement, VALS had entered into a Memorandum of
Understanding on 16th June 2008 with M/s. Advance India Projects Limited (AIPL) and M/s. Pace Info com Private Limited
(PACE), wherein PACE is an allottee of the land situated at B-07, Sector-132, Noida and VALS had through a Special Purpose
Vehicle Hermit Projects Private Limited (HERMIT) decided to acquire the shares of PACE including the land held by it. VALS
had paid a sum of Rs.285,000 to AIPL at the time of signing the MoU.
During the year, on October 30, 2010, the Board of Directors had approved to cancel the MoU for lease arrangement and decided
to acquire the property which is under construction from the third party directly. On 12th January 2011, through a Memorandum of
Amendment, the company with the intention to acquire the said land, had substituted its name with that of VALS and through such
amendment VALS had agreed to assign all rights, responsibilities, obligations, title etc. in favour of the company, thus making the
company eligible to acquire PACE through HERMIT and subsequently the land and also making liable to pay the entire
consideration of Rs.1,140,000. Hence the Company had paid VALS an amount of Rs.2,175 i.e., difference between the amount
paid by the Company to VALS and the amount paid by VALS to AIPL.
During the previous year, the Company acquired the leasehold rights along with the building under construction through
acquisition of entire shares HERMIT which in turn holds the entire shares of PACE, the original allottee of the land. As of March
31, 2013, the Company had paid a sum of Rs. 161,739 as an advance to AIPL towards construction of the building and any further
sum it has to advance as per the commitment shall be adjusted towards value of investment in HERMIT after settling further debts
and liabilities relating to construction of the said data center.
** Also refer note 16 in relation to transactions relating to issue of equity shares on private placement basis to Raju Vegesna
Infotech & Industries Private Limited.
*** Some of the key management personnel of the Group are also covered under the Group‟s gratuity plan along with other
employees of the Group. Proportionate amounts of gratuity accrued under the gratuity plan have not been separately computed or
included in the above disclosure.
****The company had entered into a lease agreement with Ms Radhika Vegesna, Daughter of Mr. Ananda Raju Vegesna,
Executive Director of the company, to lease the premises owned by her for a period of three years effective June 1, 2010 on a rent
of Rs.256 per month and payment of refundable security deposit of Rs.2,558. This arrangement will be automatically renewed for a
further period of two blocks of three years with all the terms remaining unchanged.
****During the year 2012, the Company had entered into a lease agreement with M/s Raju Vegesna Infotech and Industries Private
Limited, the holding Company, to lease the premises owned by it for a period of three years effective February 1, 2012 on a rent of
Rs.75 per month.

43
****During the year 2012, the Company had entered into a lease agreement with M/s Raju Vegesna Developers Private Limited, a
Company in which Mr Ananda Raju Vegesna, Executive Director of the Company and Mr Raju Vegesna, Chairman and Managing
director of the Company exercise significant influence, to lease the premises owned by it for a period of three years effective
February 1, 2012 on a rent of Rs.30 per month.
37. Financial instruments
Financial instruments by category
The carrying value and fair value of financial instruments by each category as at March 31, 2013 were as follows:
Particulars Note Loans and
receivables
Financial
assets /
liabilities
at fair
value
through
profit and
loss
Available
for sale
Other
financial
liabilities
Total
carrying
value
Total fair
value
Assets
Cash and cash equivalents 8 1,001,052 - - - 1,001,052 1,001,052
Other assets 10 254,724 - - - 254,724 254,724
Trade receivables 13 2,708,879 - - - 2,708,879 2,708,879
Other receivables 13 34,745 - - - 34,745 34,745
Derivative financial instrument - - - - - -
Other investments 15 - - 1,710 - 1,710 1,710
Liabilities
Bank overdraft 8 - - - 644,606 644,606 644,606
Finance lease liabilities 17 - - - 472,002 472,002 472,002
Other liabilities 19 - - - 217,848 217,848 217,848
Borrowings from banks 20 - - - 611,155 611,155 611,155
Borrowings from others 20 - - - 517,527 517,527 517,527
Trade and other payables 21 - - - 2,392,143 2,392,143 2,392,143
The carrying value and fair value of financial instruments by each category as at March 31, 2012 were as follows:
Particulars Note Loans and
receivables
Financial
assets /
liabilities
at fair
value
through
profit and
loss
Available
for sale
Other
financial
liabilities
Total
carrying
value
Total fair
value
Assets
Cash and cash equivalents 8 892,768 - - - 892,768 892,768
Other assets 10 252,386 - - - 252,386 252,386
Trade receivables 13 2,411,946 - - - 2,411,946 2,411,946
Other receivables 13 122,214 - - - 122,214 122,214
Derivative financial instrument - 2,891 - - 2,891 2,891
Other investments 15 - - 160 - 160 160
Liabilities
Bank overdraft 8 - - - 798,180 798,180 798,180
Finance lease liabilities 17 - - - 176,926 176,926 176,926
Other liabilities 19 - - - 187,236 187,236 187,236
Borrowings from banks 20 - - - 375,906 375,906 375,906
Borrowings from others 20 - - - 353,435 353,435 353,435
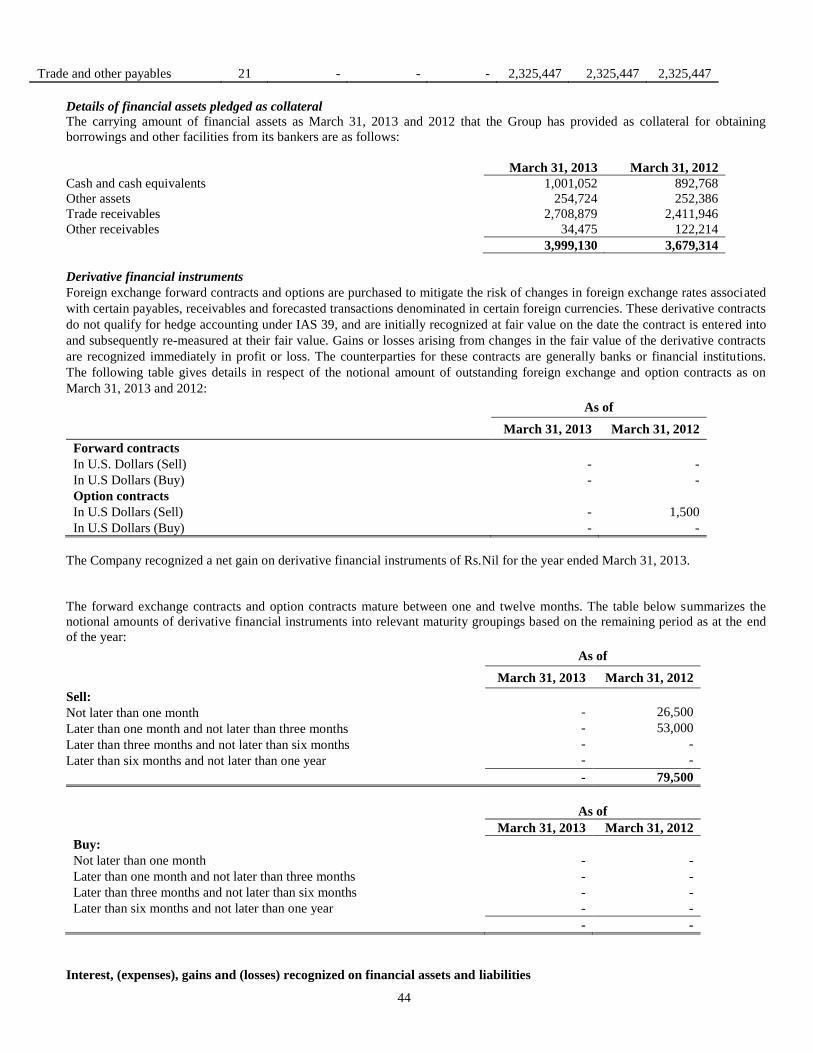
44
Trade and other payables 21 - - - 2,325,447 2,325,447 2,325,447
Details of financial assets pledged as collateral
The carrying amount of financial assets as March 31, 2013 and 2012 that the Group has provided as collateral for obtaining
borrowings and other facilities from its bankers are as follows:
March 31, 2013 March 31, 2012
Cash and cash equivalents 1,001,052 892,768
Other assets 254,724 252,386
Trade receivables 2,708,879 2,411,946
Other receivables 34,475 122,214
3,999,130 3,679,314
Derivative financial instruments
Foreign exchange forward contracts and options are purchased to mitigate the risk of changes in foreign exchange rates associated
with certain payables, receivables and forecasted transactions denominated in certain foreign currencies. These derivative contracts
do not qualify for hedge accounting under IAS 39, and are initially recognized at fair value on the date the contract is entered into
and subsequently re-measured at their fair value. Gains or losses arising from changes in the fair value of the derivative contracts
are recognized immediately in profit or loss. The counterparties for these contracts are generally banks or financial institutions.
The following table gives details in respect of the notional amount of outstanding foreign exchange and option contracts as on
March 31, 2013 and 2012:
As of
March 31, 2013 March 31, 2012
Forward contracts
In U.S. Dollars (Sell) - -
In U.S Dollars (Buy) - -
Option contracts
In U.S Dollars (Sell) - 1,500
In U.S Dollars (Buy) - -
The Company recognized a net gain on derivative financial instruments of Rs.Nil for the year ended March 31, 2013.
The forward exchange contracts and option contracts mature between one and twelve months. The table below summarizes the
notional amounts of derivative financial instruments into relevant maturity groupings based on the remaining period as at the end
of the year:
As of
March 31, 2013 March 31, 2012
Sell:
Not later than one month - 26,500
Later than one month and not later than three months - 53,000
Later than three months and not later than six months - -
Later than six months and not later than one year - -
- 79,500
As of
March 31, 2013 March 31, 2012
Buy:
Not later than one month - -
Later than one month and not later than three months - -
Later than three months and not later than six months - -
Later than six months and not later than one year - -
- -
Interest, (expenses), gains and (losses) recognized on financial assets and liabilities

45
Recognized in profit or loss
Year ended
March 31, 2013 March 31, 2012 March 31, 2011
Loans and receivables
Interest income on bank deposits 26,264 16,468 21,360
Interest income from other loans and receivables 5,731 3,706 3,871
Impairment loss of trade receivables (210,559) (193,232) (161,922)
Impairment loss on finance lease receivables - - -
Financial assets at fair value through profit or loss
Net change in fair value of derivative financial
instruments
- 2,891 -
Other financial liabilities
Interest expenses on lease obligations (22,272) (20,089) (20,117)
Interest expenses on borrowings from banks, others and
overdrafts
(180,390) (157,510) (161,897)
Recognized directly in other comprehensive income
Year ended
March 31, 2012 March 31, 2011 March 31, 2010
Net change in fair value of available-for-sale financial
assets
- - -
38. Financial Risk Management
The Group has exposure to the following risks from its use of financial instruments:
Credit risk
Liquidity risk
Market risk
The Board of Directors has overall responsibility for the establishment and oversight of the Group‟s risk management framework.
The Board of Directors have established a risk management policy to identify and analyze the risks faced by the Group, to set
appropriate risk limits and controls, and to monitor risks and adherence to limits. Risk management systems are reviewed
periodically to reflect changes in market conditions and the Group‟s activities. The Group Audit Committee oversees how
management monitors compliance with the Group‟s risk management policies and procedures, and reviews the risk management
framework. The Group Audit Committee is assisted in its oversight role by Internal Audit. Internal Audit undertakes reviews of
risk management controls and procedures, the results of which are reported to the Audit Committee.
Credit risk: Credit risk is the risk of financial loss to the Group if a customer or counterparty to a financial instrument fails to
meet its contractual obligations and arises principally from the Group‟s trade receivables, treasury operations and other activities
that are in the nature of leases.
Trade and other receivables
The Group‟s exposure to credit risk is influenced mainly by the individual characteristics of each customer. Management considers
that the demographics of the Group‟s customer base, including the default risk of the industry and country in which customers
operate, has less of an influence on credit risk. The group is not exposed to concentration of credit risk to any one single customer
since the services are provided to and products are sold to customers who are spread over a vast spectrum. Credit risk is managed
through credit approvals, establishing credit limits and continuously monitoring the credit worthiness of the customers to which the
Company grants credit terms in the normal course of the business.
Cash and cash equivalents and other investments
In the area of treasury operations, the Group is presently exposed to counter-party risks relating to short term and medium term
deposits placed with public-sector banks, and also to investments made in mutual funds.
Guarantees
The Group‟s policy is to provide financial guarantees only to subsidiaries.
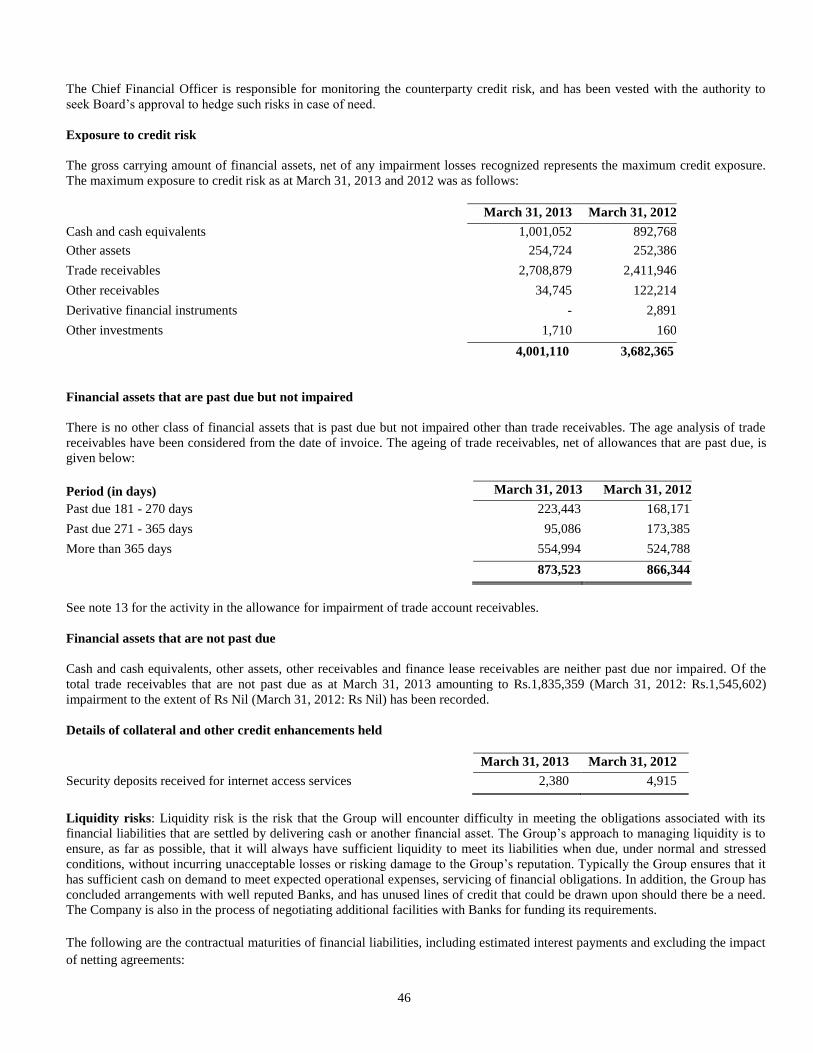
46
The Chief Financial Officer is responsible for monitoring the counterparty credit risk, and has been vested with the authority to
seek Board‟s approval to hedge such risks in case of need.
Exposure to credit risk
The gross carrying amount of financial assets, net of any impairment losses recognized represents the maximum credit exposure.
The maximum exposure to credit risk as at March 31, 2013 and 2012 was as follows:
March 31, 2013 March 31, 2012
Cash and cash equivalents 1,001,052 892,768
Other assets 254,724 252,386
Trade receivables 2,708,879 2,411,946
Other receivables 34,745 122,214
Derivative financial instruments - 2,891
Other investments 1,710 160
4,001,110 3,682,365
Financial assets that are past due but not impaired
There is no other class of financial assets that is past due but not impaired other than trade receivables. The age analysis of trade
receivables have been considered from the date of invoice. The ageing of trade receivables, net of allowances that are past due, is
given below:
Period (in days) March 31, 2013 March 31, 2012
Past due 181 - 270 days 223,443 168,171
Past due 271 - 365 days 95,086 173,385
More than 365 days 554,994 524,788
873,523 866,344
See note 13 for the activity in the allowance for impairment of trade account receivables.
Financial assets that are not past due
Cash and cash equivalents, other assets, other receivables and finance lease receivables are neither past due nor impaired. Of the
total trade receivables that are not past due as at March 31, 2013 amounting to Rs.1,835,359 (March 31, 2012: Rs.1,545,602)
impairment to the extent of Rs Nil (March 31, 2012: Rs Nil) has been recorded.
Details of collateral and other credit enhancements held
March 31, 2013 March 31, 2012
Security deposits received for internet access services 2,380 4,915
Liquidity risks: Liquidity risk is the risk that the Group will encounter difficulty in meeting the obligations associated with its
financial liabilities that are settled by delivering cash or another financial asset. The Group‟s approach to managing liquidity is to
ensure, as far as possible, that it will always have sufficient liquidity to meet its liabilities when due, under normal and stressed
conditions, without incurring unacceptable losses or risking damage to the Group‟s reputation. Typically the Group ensures that it
has sufficient cash on demand to meet expected operational expenses, servicing of financial obligations. In addition, the Group has
concluded arrangements with well reputed Banks, and has unused lines of credit that could be drawn upon should there be a need.
The Company is also in the process of negotiating additional facilities with Banks for funding its requirements.
The following are the contractual maturities of financial liabilities, including estimated interest payments and excluding the impact
of netting agreements:

47
As at March 31, 2013
Carrying
amount
Contractual
cash flows
0-12 months 1-3 years 3-5 years
Non-derivative financial liabilities
Bank overdrafts 644,606 644,606 644,606 - -
Finance lease liabilities 472,002 580,375 205,811 343,774 30,790
Other liabilities 211,044 217,848 217,848 - -
Borrowing from banks 611,155 780,018 327,818 200,054 252,146
Borrowings from others 517,527 577,871 422,825 142,813 12,233
Trade and other payables 2,392,143 2,392,143 2,392,143 - -
4,848,477 5,192,861 4,211,051 6886,641 295,169
As at March 31, 2012
Carrying
amount
Contractual
cash flows
0-12 months 1-3 years 3-5 years
Non-derivative financial liabilities
Bank overdrafts 798,180 798,180 798,180 - -
Finance lease liabilities 176,926 205,675 91,923 99,521 14,231
Other liabilities 187,236 187,236 187,236 - -
Borrowing from banks 375,906 381,269 381,269 - -
Borrowings from others 353,435 416,449 202,842 185,060 28,547
Trade and other payables 2,325,447 2,325,447 2,325,447 - -
4,217,130 4,314,256 3,986,897 284,581 42,778
Market risk: Market risk is the risk of loss of future earnings or fair values or future cash flows that may result from a change in
the price of a financial instrument. The value of a financial instrument may change as a result of changes in the interest rates,
foreign exchange rates and other market changes that affect market risk sensitive instruments. Market risk is attributable to all
market risk sensitive financial instruments including foreign currency receivables and payables. The Group is exposed to market
risk primarily related to foreign exchange rate risk (currency risk), interest rate risk and the market value of its investments. Thus
the Group‟s exposure to market risk is a function of investing and borrowing activities and revenue generating and operating
activities in foreign currencies.
Currency risk: The Group‟s exposure in USD, Euro and other foreign currency denominated transactions gives rise to Exchange
Rate fluctuation risk. Group‟s policy in this regard incorporates:
Forecasting inflows and outflows denominated in US$ for a twelve-month period
Estimating the net-exposure in foreign currency, in terms of timing and amount
Determining the extent to which exposure should be protected through one or more risk-mitigating instruments to maintain the
permissible limits of uncovered exposures.
Carrying out a variance analysis between estimate and actual on an ongoing basis, and taking stop-loss action when the
adverse movements breaches the 5% barrier of deviation, subject to review by Audit Committee.
The Group‟s exposure to foreign currency risk as at March 31, 2013 was as follows:
All amounts in respective currencies as mentioned (in thousands)
USD CAD CHF EUR GBP DHS HKD SGD
Cash and cash equivalents 1,098 - - - - - -
Trade receivables 14,260 - 37 95 151 - - 8
Trade payables (4,757) - (4) (35) - - (15) -
Gross balance sheet exposure 10,601 - 33 60 151 - (15) 8
Forward exchange / option
contracts
- - - - - - - -
Net exposure 10,601 - 33 60 151 - (15) 8

48
The Group‟s exposure to foreign currency risk as at March 31, 2012 was as follows:
All amounts in respective currencies as mentioned (in thousands)
USD CAD CHF EUR GBP DHS HKD SGD
Cash and cash equivalents 758 - - - - - -
Trade receivables 17,046 5 539 12 136 - - 6
Trade payables (9,031) - (15) (52) (1) (59) (10) -
Gross balance sheet exposure 8,773 5 524 (40) 135 (59) (10) 6
Forward exchange / option
contracts
(1,500) - - - - - - -
Net exposure 7,273 5 524 (40) 135 (59) (10) 6
Sensitivity analysis
A 10% strengthening of the rupee against the respective currencies as at March 31, 2013 and 2012 would have increased /
(decreased) other comprehensive income and profit or loss by the amounts shown below. This analysis assumes that all other
variables, in particular interest rates, remain constant. The analysis is performed on the same basis for 2012.
Other
comprehensive
income
Profit or loss
March 31, 2013 - 59,542
March 31, 2012 - 40,782
A 10% weakening of the rupee against the above currencies as at March 31, 2013 and 2012 would have had the equal but opposite
effect on the above currencies to the amounts shown above, on the basis that all other variables remain constant.
Interest Rate Risk: Interest rate risk is the risk that an upward movement in interest rates would adversely affect the borrowing
costs of the group.
Profile
At the reporting date the interest rate profile of the Group‟s interest –bearing financial instruments were as follows:
Carrying amount
March 31, 2013 March 31, 2012
Fixed rate instruments
Financial assets
- Fixed deposits with banks
211,315
400,629
Financial liabilities
- Borrowings from banks
-
48,476
- Borrowings from others 517,527 353,435
Variable rate instruments
Financial liabilities
- Borrowings from banks 611,155 327,430
- Bank overdrafts 644,606 798,180
Fair value sensitivity for fixed rate instruments
The Group does not account for any fixed rate financial assets and liabilities at fair value through profit or loss, and the Group does
not designate derivatives (interest rate swaps) as hedging instruments under a fair value hedge accounting model. Therefore a
change in interest rates at the reporting date would not affect profit or loss.
Cash flow sensitivity for variable rate instruments
An increase of 100 basis points in interest rates at the reporting date would have increased / (decreased) equity and profit or loss by
the amounts shown below. This analysis assumes that all other variables, in particular foreign currency rates, remain constant. The
analysis has been performed on the same basis as 2012.

49
Equity Profit or loss
March 31, 2013 - (12,399)
March 31, 2012 - (11,256)
A decrease of 100 basis points in the interest rates at the reporting date would have had equal but opposite effect on the amounts
shown above, on the basis that all other variable remain constant.
39. IPO listing
The Ministry of Finance of the Government of India („MoF‟) issued a press release dated March 31, 2006, making amendments to
the ‟Issue of Foreign Currency Convertible Bonds and Ordinary Shares (through Depository Receipt Mechanism) Scheme 1993‟
(„the Scheme‟). The amendments included a statement that unlisted Companies which had accessed FCCBs, ADR/GDRs in terms
of guidelines of May 22, 1998 and are not making profit, be permitted to comply with listing condition on the domestic stock
exchanges within three years of having started making profit. Further, the press release states that no fresh issues of FCCBs,
ADR/GDRs by such companies will be permitted without listing first in the domestic exchanges. Securities and Exchange Board
of India (SEBI) has amended the (Issue of Capital and Disclosure Requirements) (Fourth Amendment) Regulations, 2012 on
12.10.2012. In terms of the amended Clause 26 (1) (b), in order to be eligible to go for the Initial Public Offer, the Company
should have a minimum average pre-tax operating profit of Rs.150,000 calculated on a restated and consolidated basis, during the
three most profitable years out of the immediately 5 preceding years.
This is in addition to the other clauses viz. it has a track record of distributable profits in terms of Section 205 of the
Companies Act, 1956, for at least three out of the immediately preceding five years; provided that extraordinary items shall not be
considered for calculating distributable profits, for being eligible to go for the IPO
Hence the Company would not be able to raise funds by issuing ADRs until such time the Company complies with the ‟Issue
of Foreign Currency Convertible Bonds and Ordinary Shares (through Depository Receipt Mechanism) Scheme 1993‟ and lists in
the domestic stock exchanges as per the above press release.
40. Issue of shares on a private placement basis to the existing promoter group
On August 4, 2010, the Board of Directors of the company approved the issuance, in a private placement, of upto an
aggregate of 125,000,000 of the company‟s equity shares, par value Rs.10 per share (“Equity shares”) at a discount compared to
market value of , for an aggregate purchase price of Rs.4,000,000, to a group of investors affiliated with the company‟s promoter
group, including entities affiliated with Mr Raju Vegesna, the company‟s Chairman and Managing Director and Mr Ananda Raju
Vegesna, Executive Director and brother of Mr Raju Vegesna (the “Offering”). The company‟s shareholders approved the terms of
the Offering at the Company‟s Annual General Meeting held on September 27, 2010.
On October 22 2010, the company entered into a Subscription Agreement with Mr Ananda Raju Vegesna, acting as
representative (the “Representative”) of the purchasers in connection with the Offering. In pursuance of the Agreement, the
company issued and allotted 125,000,000 equity shares to M/s Raju Vegesna Infotech and Industries Private Limited (“RVIIPL”),
a promoter group company. In accordance with Indian law, the purchase price is to be paid at such time as determined by Board of
Directors of the company.
On August 14, 2011, the company received a letter from RVIIPL expressing its intention to transfer the above partly paid
shares to its wholly owned subsidiary M/s Ramanand Core Investment Company Private limited (“RCICPL”). The company, on
August 26, 2011, registered such transfer of partly paid shares in the name of RCICPL.
On September 7, 2011, the parties entered into an amendment to the Subscription Agreement (the “Amendment”)
extending the validity of the agreement period to September 26, 2013. This Amendment provides the Board of Directors of the
Company with additional time to call upon the purchasers to pay the balance money, in accordance with the terms of the
Subscription Agreement.
As on March 31, 2013, these shares are partly paid to the extent of Rs.6.25 per share. Until the full purchase price is paid by
the purchasers, the company retains a lien on the equity shares purchased in connection with the Offering. As of March 31, 2013,
entities affiliated with our Chairman and Managing Director, Raju Vegesna, beneficially owned approximately 86.27% of our
outstanding equity shares, which includes the 125,000,000 shares (partly paid with proportionate voting rights) issued in
connection with the above Offering.

50