siet trieste, 17th june 2009 elisabetta venezia determinants of the demand for urban transport:...
TRANSCRIPT

SIETTrieste, 17th June 2009
Elisabetta Venezia
Determinants of the demand for urban transport:
results of a case study

Aims
This paper has a twofold aim:
it focuses on current problems linked to urban passenger public transport and
it presents results of an empirical analysis on a case study.

European comparisons-local transport

The European framework
Explosive growth in car use
Greater car depedence Difficulties of collective
public transport systems

Exhibit 1 - Cars in use 1970-2004 in Europe (EU-15)
-
50.000.000
100.000.000
150.000.000
200.000.000
250.000.000
1970 1980 1990 1995 2000 2001 2002 2003 2004**
years
n. o
f car
s

Local public transport
Theoretically there are different models:
Free market or deregulated market;
Regulated market; Closed market.

Regulation models of urban LPT
Closed market
Starting regulated market
Advanced regulated market
Free market
Great BritainIrland
SpainPortugal
France
Italy
Germany
Denmark
Netherlands
Belgium
Austria
Poland
Czech Rep.
Hungary
Latvia
Lithuania
Estonia
Switz.
Slovakia
Greece
Bulgaria
BosniaCroatia
Norway
Sweden
Finland
Source: Earchimede (2005)

Local transport - Structural indicators (%)
Italy UK Germany France Sweden Holland Belgium
P-km road 65 48 47 45 50 45 58
P-Km rail 35 52 53 55 50 55 42
Km per habitant
30. 8 41.3 31.8 26.9 56.0 23.5 22.0
Average speed for buses (km/h)
20.2 24.00 20.7 23.07 27.3 22.6 21.2
Source: Earchimede (2005)

Local transport - Structural indicators (%)
Italy UK Germany France Sweden Holland Belgium
Market share of the first 5 bus companies
27 66 37 82 72 49 77
Km public operators
68 5 52 36 24 95 72
Km private operators
32 95 48 64 76 5 28
Source: Earchimede (2005)

Local transport - Performance indicators (€)
Italy UK Germany France Sweden Holland Belgium
Public funds per km
2.2 0.6 1.5 1.9 0.9 1.5 2.0
Traffic revenues per km
1.08 1.49 2.39 1.14 1.07 0.98 1.00
Ordinary price ticket
0.84 1.53 1.89 1.26 1.95 1.60 1.40
Source: Earchimede (2005)

Local transport - Performance indicators (% and €)
Italy UK Germany France Sweden Holland Belgium
Degree of cost coverage (%)
30.7 84.2 60.5 39.2 55.4 40.0 33.1
Labour costs per km
(€)
2.3 0.8 2.1 1.6 1.1 1.7 2.0
Source: Earchimede (2005)

Average: 10,0%Average: 10,0%
low high
Margin (% of production value)
low
medium
high
% of urban tr.:
Italy
Germany
Netherlands
Belgium
SwedenEngland
France
Degree of satisfaction*
Average: 79%Average: 79%
* % of satisfied local public transport users Source: Earchimede (2005)
Degree of public transport users’ satisfation

Urban public transport in Italy
At present, the structural reform of the Italian local public transport is aimed at:
a potential re-launching of the sector
the achievement of more general objectives.

Urban public transport in Italy
The most innovative points are:
the privatisation of operators
regionalisation service contracts regulated liberalisation.

Current situation
Several obstacles are still hampering the actual implementation of a true competitiveness,
this situation caused several misunderstandings and excessive differences among regional laws.
Poor results.

Current situation
Who is responsible for all this?
Probably, the main responsibility is of regions and of local bodies, which managed the local public transport up to date.

Reform results
There was no recovery of efficiency loss,
the efficiency gap of local public transport in terms of revenues and externalities due to traffic was not decreased,
the reform has not currently achieved efficiency and effectiveness.

Reform results
Recently, changes in the legislation on local public services allow the assignment of transport services “in house”.
This means that tendering procedures will no longer be compulsory.
We are back to monopoly!
Reform results
European Court of Justice 6.4.2006 on the assignment of transport services “in house” in Bari:
“Tendering procedure, no in house assignment for AMTAB”.
Good news, then!

Suggestions
Operators of urban transport service have to take in consideration the exigencies of current and potential users.
Operators should abandon the idea that only systematic transport demand use urban buses.

Empirical evidence – sample
In this context, it could be useful to investigate on a city like Bari with a twofold aim:
Analysis of the current supply of public transport – as perceived by users
Understanding mobility needs and behaviours of population living in Bari and of those who use urban transport in Bari.

Empirical evidence – sample
Useful information on needs of some user categories, such as pensioners and housewives.
Investigation on the eventual knowledge of new mobility sustainable tools.
All these elements may help to define: the expected quality, which pays
attention to the expressed needs of users,
the perceived quality, which measures values attributed by the client at the current quality level of transport services.

Empirical evidence – sample
City: BariType of survey: Direct survey, questionnaires on 1886 users. Covered survey time: 7.00-21.00.Composition: the sample is composed by 45% males and by 55%
females. Age structure: the age composition of this sample is structured
with 32% of users who have an age between 19-29, followed by 29% belonging to the class 30-50, while 16% are over 65, 13% are in the class 51-65 and, finally, 10% is represented by user below 19.

Occupational composition
Employees 25%
Housewives19%
Self-emloyed workers
8%
Others4%
Pensioners14% Students
30%

Availability of private means - all day
Som etim es12%
Never64%
Alw ays24%

Urban transport mode normally used
Bus83%
Private m ode11%
Foot6%

Frequency in the use of buses
Every day 73%
Never1%Rarely
7%3-4 tim es per
w eek 12%
1-2 tim es per w eek
7%

Reasons for using buses in comparison with other means
No answ er11%
Punctuality6%
Com fort61%
Convenience22%

Vantages from the use of buses in comparison with private means
Others11%
Less polluting 16%
Cheaper23%
No answ er1%
No park ing problem s
49%

Degree of satisfaction for using buses
Not m uch33%
A lot6%Not at all
19%
No answ er1%
Enough41%

Aspects of buses services to be improved
Puntuality22%
Frequency 30%
More controls on board 10%
More m aintenance w orks
3%
Others16%
No answ er3%
Inform ation1%
Cleaning3%
Thronging6%
None4%
More direct links 2%

Main defects of buses
None2%
Insecure10%
Expensive7%
Accessability for disables 9%
Dirtiness13%
No punctuality 30%
No answer1%
Crowded28%

Safety on board
Yes30%
No70%

Opinion on the equity of the bus service price
No45%
Yes55%

Availability to pay something more for a higher bus frequency
No39%
Yes61%

Reasons for not using buses
Short distances 2%
Scarce puntuality9%
Scarce frequency4%
Too long w aiting tim e 11%
Availabity of other m eans
9%
Too s low4% Too crow ded
6%
None45%
Others10%

Definitive choice for not using buses
Yes65%
No35%

Scopes for using buses
Others1%
Leisure tim e22% School/
w ork41%
Shopping36%

Knowledge of car sharing, car pooling and collective taxi
Yes20%
No80%
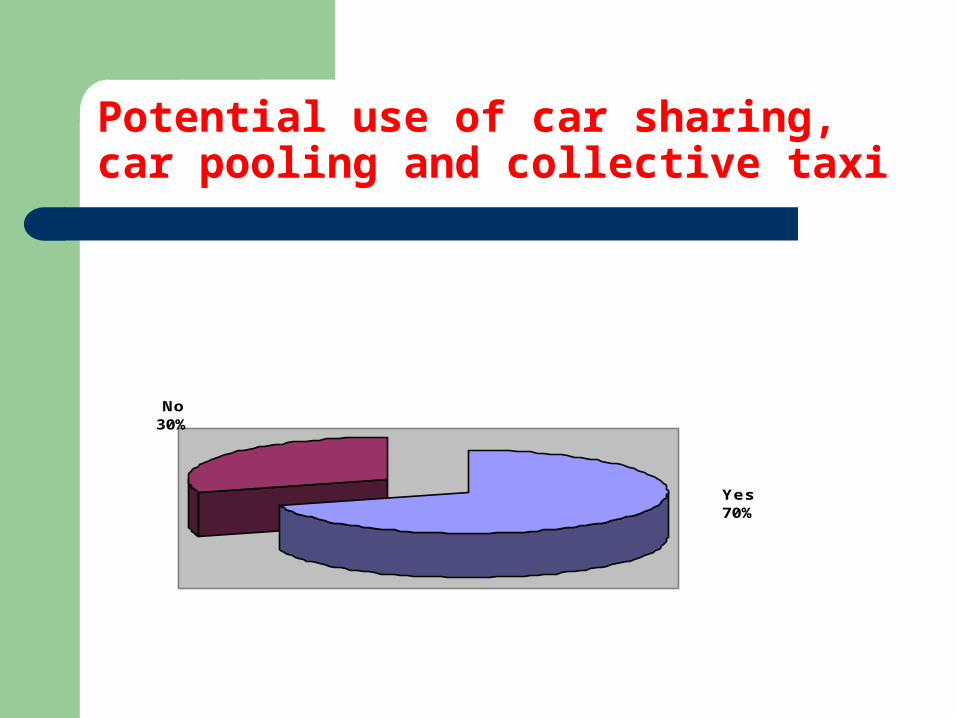
Potential use of car sharing, car pooling and collective taxi
Yes70%
No30%

Random utility model
The random utility model has been used to give an interpretation of data on individual choice related to bus service provided in Bari.

Random utility model
The individual’s utility of two choices – bus transit and private means – is estimated by binary logistic regression and logistic regression coefficients are used to estimate odds ratios for each independent variable in the model.
The values assumed by the dependent variable, as the probability of using buses, are equal to one.

Gender
Results indicate that females are more likely to be bus users than males. As a matter of fact, women have nearly twice as much the probability of using buses in comparison with males.
This aspect has a variety of implications, among which the demand for mobility which is strictly linked to the quality of life of this population segment.

Age
Figures show that the probability of using buses is particularly important for those belonging to the 19-29 year-old range, followed by respondents who are over the 51year-old range.

Availability of other transport means
Those who expressed a higher probability of using buses are those who always have a car.
This is a very good indication because for the future these figures are underlying propensities for changing behaviour.

Main reasons for using buses
Due to the very high congestion in the city centre, buses guarantee more punctuality than private means – mainly due to congestion and parking problems - and therefore respondents would be more in favour of using collective modes.

Frequency
If frequency is considered, those who would like to use buses are, quite reasonable, those who now use buses every day.

Scopes
As for scopes, transit due to:
leisure activities and school/working activities
are almost one and a half times more important than those who would like to use buses for shopping.

Main advantages from potential use
Respondents indicate, as advantages, “no parking problem” and the fact that this transport mode is cheaper in comparison with alternatives.
So, individuals would behave rationally with regard to the choice between public and
private transport.

Results and conclusions
The survey and the empirical analysis suggest that one best direct option is simply not to improve congestion.
One can simply suggest increasing the space allocated to buses and thus reducing the road space allocated to car traffic.
So doing, at least, buses can guarantee affordable services, although some other general improvements are requested, such as a higher frequency.

Results and conclusions
The results of the survey also suggest that, in the future, there could be some hope, also in sustainable terms especially if – regardless of the final end of the reform process – operators take into consideration what their clients need.

For the future …. more research
New survey (done! 2008) New empirical analysis (in progress) Comparisons with other cases

Thank you for your attention!