sierra leone fish value chain analysis with special emphasis on tonkolili...
TRANSCRIPT
Sierra Leone fish value chain analysis with special emphasis on Tonkolili District
Phot
o cr
edit:
Fro
nt c
over
, Mon
ica
Pasq
uial
ino/
Wor
ldFi
sh

2
AuthorsLaila Kassam,1 Kepifri Lakoh,2 Catherine Longley,3 Michael J. Phillips4 and Sunil N. Siriwardena5
Authors’ Affiliations1 Amaranth Sustainable Development LLP, London, United Kingdom2 Njala University, Bo, Sierra Leone3 Independent Consultant, formerly with WorldFish, Lusaka, Zambia4 WorldFish, Penang, Malaysia5 WorldFish, Freetown, Sierra Leone
CitationThis publication should be cited as: Kassam L, Lakoh K, Longley C, Phillips MJ and Siriwardena SN. 2017. Sierra Leone fish value chain with special emphasis on Tonkolili District. Penang, Malaysia: WorldFish. Program Report: 2017-33.
AcknowledgmentsThis work was undertaken as part of the CGIAR Research Program on Fish Agri-Food Systems (FISH). This publication was made possible by the support of the American people through the Feed the Future program of the United States Agency for International Development (USAID).
DisclaimerThe contents of this publication are the sole responsibility of WorldFish and do not necessarily reflect the views of USAID or the United States Government.
Sierra Leone fish value chain analysis with special emphasis on Tonkolili District

3
Contents
List of figures 4
List of tables 5
List of abbreviations 6
Executive summary 7
Introduction 10
Methodology 13
Overview of the fisheries and aquaculture sector in Sierra Leone 18
Marine fish value chain analysis 21
Wild caught freshwater fish value chain analysis 34
Farmed fish value chain analysis 37
Fish consumption in Tonkolili District 50
Crosscutting services 53
Policy and enabling environment 56
Recommendations for potential interventions 61
Notes 72
References 74
Annex 1. Costs of smoking marine fish 78
Annex 2. Prices of commonly available fish species from capture fisheries in the Sierra Leone market 79
Annex 3. Fish species consumed by households in Tonkolili District 79
4
List of figures
Figure 1. Value chain assessment scope. 13
Figure 2. Map of Sierra Leone livelihood zones. 14
Figure 3. Sierra Leone’s exports and imports of fish products. 19
Figure 4. Value chain map for the marine fish value chain. 22
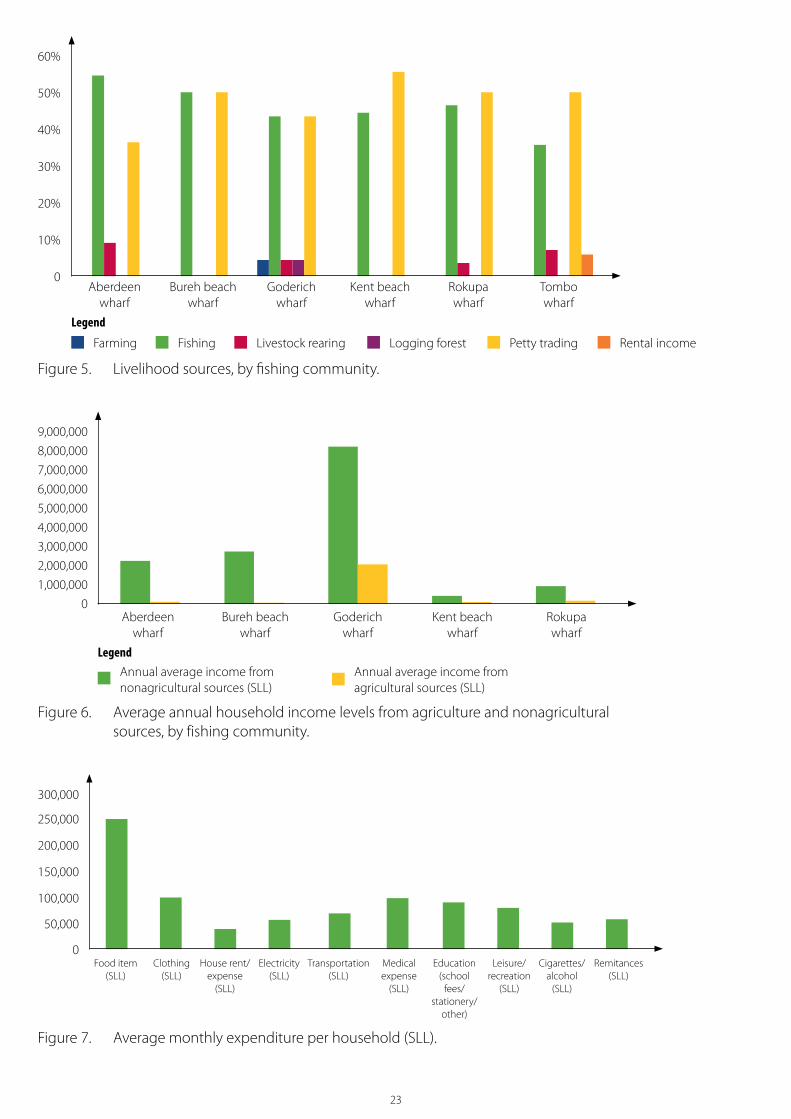
Figure 5. Livelihood sources, by fishing community. 23
Figure 6. Average annual household income levels from agriculture and nonagricultural sources, by fishing community. 23
Figure 7. Average monthly expenditure per household (SLL). 23
Figure 8. Commonly used fishing boat types in Western Area. 24
Figure 9. Important fish markets and their primary supply sources in Sierra Leone. 28
Figure 10. Distribution of fishponds in Tonkolili District. 37
Figure 11. Trend in operational status of fishponds in Tonkolili District. 38
Figure 12. Trend in fishpond development in Tonkolili District. 38
Figure 13. Percentage distribution of fish that farmers harvest in each month. 41
Figure 14. Household consumption of marine fish, by chiefdom. 51
Figure 15. Household consumption of wild caught freshwater fish, by chiefdom. 51
Figure 16. Household consumption of farmed fish, by chiefdom. 51
Figure 17. Percentage of households that purchased or exchanged fish at market, by chiefdom. 52
Figure 18. Seasonality in fish consumption (kg/households/week). 52

5
List of tables
Table 1. Sampling of fish producers and consumers. 17
Table 2. Fish value chain actors interviewed. 17
Table 3. Gross margins for key actors along the marine fish value chains. 31
Table 4. Land area cultivated, by crop type. 40
Table 5. Sources of credit facilities for farmers in Tonkolili District. 40
Table 6. Number and size of ponds. 41
Table 7. Production, revenue and distribution of tilapia by fish farming households in the past 12 months, by chiefdom. 42
Table 8. Percentage of fish farmers who consume and sell their fish, by chiefdom. 42
Table 9. Capital costs for one pond (304 m2) (2015 prices). 43
Table 10. Annual operating costs of one pond. 43
Table 11. Annual average production, sales, revenue and total value of tilapia harvest per farmer. 44
Table 12. Profitability indicators for fish farmers. 44
Table 13. Annual operation costs for FtF project-supported fish farmers, by treatment group. 45
Table 14. Projected annual production, sales, revenue and total value of tilapia harvest of FtF project-supported fish farmers, by treatment group. 45
Table 15. Projected profitability indicators for FtF project-supported fish farmers, by treatment group. 46
Table 16. Capital costs of fry/fingerling-rearing pond of Ms. Marie Sanko. 47
Table 17. Annual operating cost based on two four-month culture cycles per year. 47
Table 18. Annual production, costs, revenue and profitability. 47

6
List of abbreviations
ABC Agricultural Business CenterACP African, Caribbean, Pacific group statesADB African Development BankAfP Sierra Leone’s Agenda for Prosperity BMPs best management practicesCA conservation agriculture CAPs community agriculture partnersCGIAR Consultative Group for International Agricultural ResearchCMA community management associationEEZ exclusive economic zone EU European UnionEVD Ebola virus diseaseFAO Food and Agriculture OrganizationFGD focus group discussionFtF Feed the FutureFSA financial services associationsIAA integrated agriculture-aquaculture ICT information and communications technologyIFAD International Fund for Agricultural DevelopmentIUU illegal, unreported and unregulatedIVS inland valley swampSLL Sierra Leonean LeoneMAFFS Ministry of Agriculture Forestry and Food SecurityMCS monitoring, control and surveillanceMFI microfinance institutionMFMR Ministry of Fisheries and Marine ResourcesNEPAD New Partnership for Africa’s DevelopmentNGO nongovernmental organizationOECD Organization for Economic Co-operation and DevelopmentPPP public-private partnershipRRS rice research stationSCP smallholder collaboration programSE standard errorSEZ special economic zoneSLARI Sierra Leone Agriculture Research InstituteSPRING Strengthening Partnerships, Results, and Innovations in Nutrition GloballySRI system of rice intensificationt metric tonTCP technical cooperation projectUSAID United States Agency for International DevelopmentUSD United States DollarWAAPP West Africa Agricultural Productivity ProgramWARFP West Africa Regional Fisheries ProgramWFP World Food Programme
7
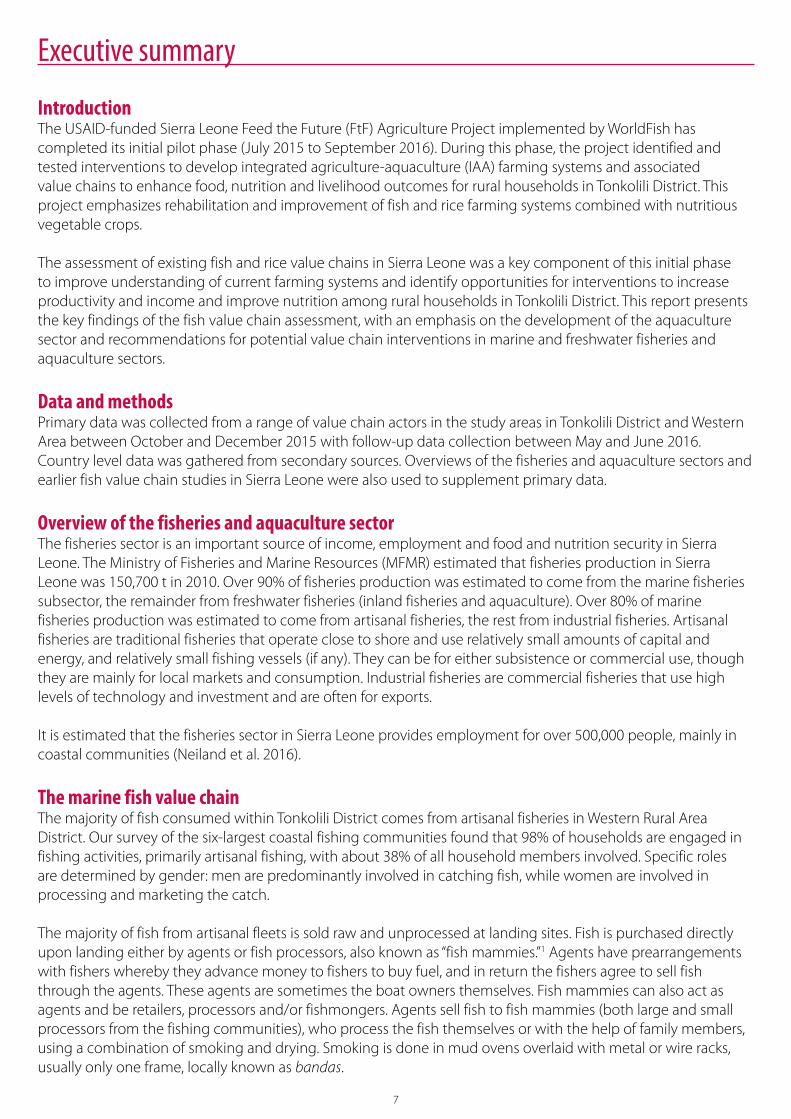
Executive summary
IntroductionThe USAID-funded Sierra Leone Feed the Future (FtF) Agriculture Project implemented by WorldFish has completed its initial pilot phase (July 2015 to September 2016). During this phase, the project identified and tested interventions to develop integrated agriculture-aquaculture (IAA) farming systems and associated value chains to enhance food, nutrition and livelihood outcomes for rural households in Tonkolili District. This project emphasizes rehabilitation and improvement of fish and rice farming systems combined with nutritious vegetable crops.
The assessment of existing fish and rice value chains in Sierra Leone was a key component of this initial phase to improve understanding of current farming systems and identify opportunities for interventions to increase productivity and income and improve nutrition among rural households in Tonkolili District. This report presents the key findings of the fish value chain assessment, with an emphasis on the development of the aquaculture sector and recommendations for potential value chain interventions in marine and freshwater fisheries and aquaculture sectors.
Data and methodsPrimary data was collected from a range of value chain actors in the study areas in Tonkolili District and Western Area between October and December 2015 with follow-up data collection between May and June 2016. Country level data was gathered from secondary sources. Overviews of the fisheries and aquaculture sectors and earlier fish value chain studies in Sierra Leone were also used to supplement primary data.
Overview of the fisheries and aquaculture sectorThe fisheries sector is an important source of income, employment and food and nutrition security in Sierra Leone. The Ministry of Fisheries and Marine Resources (MFMR) estimated that fisheries production in Sierra Leone was 150,700 t in 2010. Over 90% of fisheries production was estimated to come from the marine fisheries subsector, the remainder from freshwater fisheries (inland fisheries and aquaculture). Over 80% of marine fisheries production was estimated to come from artisanal fisheries, the rest from industrial fisheries. Artisanal fisheries are traditional fisheries that operate close to shore and use relatively small amounts of capital and energy, and relatively small fishing vessels (if any). They can be for either subsistence or commercial use, though they are mainly for local markets and consumption. Industrial fisheries are commercial fisheries that use high levels of technology and investment and are often for exports.
It is estimated that the fisheries sector in Sierra Leone provides employment for over 500,000 people, mainly in coastal communities (Neiland et al. 2016).
The marine fish value chainThe majority of fish consumed within Tonkolili District comes from artisanal fisheries in Western Rural Area District. Our survey of the six-largest coastal fishing communities found that 98% of households are engaged in fishing activities, primarily artisanal fishing, with about 38% of all household members involved. Specific roles are determined by gender: men are predominantly involved in catching fish, while women are involved in processing and marketing the catch.
The majority of fish from artisanal fleets is sold raw and unprocessed at landing sites. Fish is purchased directly upon landing either by agents or fish processors, also known as “fish mammies.”1 Agents have prearrangements with fishers whereby they advance money to fishers to buy fuel, and in return the fishers agree to sell fish through the agents. These agents are sometimes the boat owners themselves. Fish mammies can also act as agents and be retailers, processors and/or fishmongers. Agents sell fish to fish mammies (both large and small processors from the fishing communities), who process the fish themselves or with the help of family members, using a combination of smoking and drying. Smoking is done in mud ovens overlaid with metal or wire racks, usually only one frame, locally known as bandas.

8
Industrial fishing boats have freezing and facilities to grade, sort, clean, freeze and package their catch onboard to reach their customers in different countries on time. Frozen fish destined for the Sierra Leonean domestic market (e.g. herring) is packaged in 20–30 kg cartons, sold to companies on the Freetown Peninsula and stored in their onshore cold stores. The majority of higher-value fish landed by industrial fleets is exported to Senegal for repacking and marketing to the European Union (EU) or sent for sale to lucrative markets in Ivory Coast, Ghana and Nigeria.
Fish marketing and trading in Sierra Leone is complex and competitive. Like in other parts of Africa, women dominate the fish value chain, especially wholesaling, processing, trading and retailing artisanal and industrially caught fish. Agents, fish mammies and wholesale traders either purchase fresh fish from artisanal fishers, local agents or local processors, or they purchase 20–30 kg cartons or bags of frozen fish from agents of the fishing companies in the industrial sector.
Fish found in markets in Tonkolili District are largely marine fish, over 80% of which are estimated to be smoked. The majority of fish traders and retailers within Tonkolili District are women who are small-scale operators. These traders and retailers reported that the costs of purchasing frozen fish are high, and agents or wholesalers who have access to cold stores often control prices and supplies, so these small-scale traders and retailers tend to rely on the artisanal sector for their supplies. The most common fish sold within the communities in Tonkolili are smoked bonga (Ethmalosa fimbriata, Bowdich 1825), herring (Sardinella maderensis, Lowe 1839 and Sardinella aurita, Valenciennes 1847), West African ilisha (lati) (Ilisha africana, Bloch 1795) and various species of high-value fish, called “good fish.” Herring and bonga are the most common and are available all year. These are the key constraints in the marine fish value chain.• poor overall fisheries management• poor input supply• high postharvest losses from poor postharvest fish handling and inadequate primary processing• inefficient processing methods, which have significant environmental costs and result in low product quality• poor storage and transportation • unequal power within the value chain • limited market information • low quality fish distributed to inland areas• limited access to credit.
The wild caught freshwater inland fisheries value chainAt present, wild caught freshwater fish production is low and done mostly for home consumption. The value chain is, therefore, very undeveloped. Fishing is seasonal, with most fish caught during the dry season between October and February when the water levels in rivers, streams and wetlands decrease. For perennial streams, the cycle is slightly longer. The main species of fish caught in inland fisheries are tilapia (e.g. Tilapia zillii, Gervais 1848 and Tilapia guineensis, Bleeker 1862) (estimated at 60%) and catfish (Clariidae spp.) (30%) with the remainder including cutlassfish (Notopterus afer, Gunther 1868), slippery fish (Clarias spp.), electric fish (Malapterurus electricus, Gmelin 1789) and mullets (Mugil spp.). The family and friends of fishers generally eat fish fresh, and only a small quantity (10%–20%) enters the local market.
These are the key constraints in the wild caught freshwater inland fisheries value chain.• limited data and knowledge on inland fisheries • unsustainable fishing practices • habitat destruction• limited capacity for inland fisheries management and conservation of fish stock• inadequate input supplies.
The farmed fish value chainAquaculture in Sierra Leone is confined to freshwater pond culture of Nile tilapia (Oreochromis niloticus, Linnaeus 1758) with catfish (Clarias gariepinus, Burchell 1822 and Heterobranchus spp.) as nontargeted, naturally recruited

9
fish. The production system is a low input-low output system. The most common method is rearing fish in earthen ponds. Aquaculture is mostly practiced in inland valley swamps (IVSs) and wetlands, with the highest concentrations in Tonkolili District, where the number of active fish farmers is low and the aquaculture value chain is undeveloped.
Fry and fingerling supplies are severely limited and inconsistent. State fish hatcheries and farms in Makali and Bo do not have specific fish hatchery facilities, and Nile tilapia fingerlings are produced in both hatcheries by natural breeding in ponds. The project has been supporting the Makali hatchery since January 2016. Between May and July 2016, it produced 90,000 fingerlings and supplied 45,000 fingerlings to stock in 45 community ponds.
There is no fish feed manufacturing or reasonably processed, appropriate farm-made feed. Among farmers surveyed, 95% reported regular feeding. All of the farmers surveyed feed their fish rice bran, 95% feed them termites, 75% feed them cassava flour, 55% feed them leaves and only 15% use on-farm formulated feed. Organic or inorganic fertilizer is used by 50% of fish farmers surveyed. All active fish farms surveyed operate low input-low output subsistence-oriented production systems. The primary species cultured by all farmers surveyed is Nile tilapia, with 5% producing it in a mixed culture with catfish. On average, farmers reported having 1.6 functional ponds, with an average water area of 286 m2 per pond. It costs approximately SLL 1 million (USD 154) to construct a fishpond in Tonkolili District. The average production cycle for farmers surveyed is a little less than 8 months with just over one main harvest a year. On average, approximately 40 kg of tilapia was harvested per farmer in the previous 12 months and a little less than 60% was sold. Average yield is estimated to be a bit less than 1.4 t/ha/year. Of the 75% of farmers who reported selling their fish, 87% sell directly to consumers, indicating a short supply chain and limited market development.
Economic analysis suggests that fish farming is not profitable for the majority of farmers at the present time. The FtF project has been conducting on-farm trials of two different aquaculture production systems, both of which use fingerlings produced by FtF-supported breeder farmers and/or Njala University and formulated farm-made feed. Treatment A ponds have daily inorganic fertilizer applied while Treatment B ponds do not have any inorganic fertilizer applied. Both Treatment A and B ponds are expected to yield positive gross and net profits. While average costs for project farmers are higher than for nonproject farmers, production and revenues for project farmers are disproportionately higher than for nonproject farmers.
These are the key constraints in the farmed fish value chain.• poor aquaculture uptake and a high rate of abandonment• limited access to good quality formulated fish feed• limited and inconsistent supply of good quality fish seed• limited access to affordable credit• insecure access to land, discouraging commercial investment• lack of technical and business development knowledge• poor extension and research • poor capacity building approaches • poor productivity and profitability• limited marketing• lack of government support.
Recommendations are included in the report to improve marine, freshwater fish and aquaculture value chains. These recommendations are informed by the findings of the value chain assessment along with WorldFish’s experience during the project period, including other assessments conducted by this project. These recommendations also draw more widely on lessons learned from WorldFish fisheries, aquaculture and IAA projects globally as well as recent experiences and literature on sustainable agro-ecological and climate smart production systems.
10
Introduction
BackgroundThe Government of Sierra Leone recognizes the potential social and economic benefits from the fisheries sector and regards the sector as a Growth Pole for the country. It is not only an important source of income and employment but also provides the most important animal-source food in the diets of Sierra Leoneans, providing about 80% of animal protein intake (FAOSTAT 2016). Fish is critically important for nutrition, especially in a country that ranks very low globally according to poverty and nutrition indicators. This is particularly concerning for women and young children. The fisheries sector comprises three subsectors: marine fisheries, inland fisheries and aquaculture. Institutional weaknesses in the country and lack of development in the three fish value chains hindered the growth of the fisheries sector to its optimum potential. Therefore this study assesses the three fish value chains to identify the key constraints along the value chains and short- to long-term opportunities and interventions that provide scope for increased productivity and income and returns and improved nutrition.
Sierra LeoneSierra Leone is located in West Africa, south of the Republic of Guinea and west of the Republic of Liberia. The population was estimated at 6.3 million in 2014, with just over 60% living in rural areas (World Bank 2016). The World Bank defined Sierra Leone as a low income country with gross national income per capita estimated at USD 700 in 2014 (ibid.). Approximately 53% of the population lives under the national poverty line (ibid.) while 70% of households live on less than USD 2 a day (WFP 2011), and 59% of Sierra Leoneans go to bed hungry on a daily basis (World Bank 2013).
For the past five years, Sierra Leone has ranked in the bottom 10 of the Human Development Index, ranking 179 out of 188 countries (UNDP 2016). It has also ranked among the bottom five countries in health infrastructure and services, ranking 139 out of 142 countries according to the Legatum Prosperity Index (2015). Infant and maternal mortality rates are among the highest in the world, average life expectancy is just 51 years and the rate of infant mortality is 87 per thousand live births (World Bank 2016).
Prior to the Ebola virus disease (EVD) outbreak in May 2014, the national economy had been growing rapidly with gross domestic product (GDP) growth rates reported to be among the top five fastest-growing developing countries in the world. At its peak, Sierra Leone’s GDP grew at about 15% (2012) and 19% (2013) (World Bank 2013). The GDP growth rate declined to 4.6% in 2014. (IMF 2016). The main driver of growth was the mining sector, especially bauxite, iron ore, rutile and diamonds (USGS 2015). There had also been an influx of large agribusiness investments that significantly contributed to agriculture’s share on GDP growth, which was 31% in 2013 (PEMSD 2013). Agriculture continues to be the mainstay of the economy, employing over 63% of the country’s labor force (Turay et al. 2015).
The economic impact of the response to the EVD crisis (May 2014 to November 2015) combined with a decline in global iron ore prices, reduced GDP growth in Sierra Leone to 6% in 2014. The economy contracted in 2015 and GDP growth was –22% (World Bank 2016), largely as a result of the closure of the two main iron ore mines, including the Tonkolili mine, which ceased production in December 2014 (Himelein et al. 2015). Although the 2014 harvest was comparable to yields in previous years (ibid.), a nationwide ban on weekly commodity markets and restrictions on agricultural group work and other forms of collective action from July 2014 until early August 2015 had negative impacts along the whole agribusiness chain (Davis 2015). Declines in rice prices were reported where restrictions were heaviest and traders had to auction their goods (ibid.). Some analysts claim that the measures taken to contain EVD were more economically damaging than the disease itself (DFID/Adam Smith International 2015). Even after restrictions were lifted in early August 2015, many weekly markets remained closed, and agricultural activities were slow to restart, continuing at lower than normal levels because of EVD fears.
EVD and the global decline in mining were not the only shocks to the economy in recent years. The food price crisis of 2008 and the financial crisis of 2009 had severe negative impacts, coming at a time when the country had only just recovered to some extent from the civil war that lasted from 1991 to 2002. Sierra Leone is highly dependent on food imports and was badly hit by the sharp rise in global food prices in 2008. In 2009,

11
remittances and revenues from minerals dropped by 30%, having negative implications for household food security (WFP 2011).
The importance of fish in Sierra LeoneFish and other aquatic products are critical for economic activity, export earnings and employment in Sierra Leone, as well as food security and nutrition. The fisheries sector is one of the main contributors to the national economy, making up about 10% of GDP (Neiland et al. 2016). Fish is the most important animal-source food in the diets of Sierra Leoneans, providing about 80% of animal protein intake, and it is important for nutrition, especially in a country that ranks very low globally in poverty and nutrition indicators, which is particularly concerning for women and young children (Pasqualino et al. 2016).
Fish supply in Sierra Leone derives mainly from marine fisheries, followed by inland fisheries, with only limited production from aquaculture so far. An analysis of demand, trade, supply and consumption of fish in the country by the New Partnership for Africa’s Development (NEPAD) working group on aquaculture (Hecht et al. 2012) predicted that there will be an overall shortfall of 32,000 t/year in Sierra Leone by 2020. This shortfall could increase by an additional 10,000 t/year once a fish export ban to the EU has been lifted (COFREPECHE 2013). Considering the apparently stagnating capture fisheries capacity, a potentially viable option for Sierra Leone to cope with this shortage is to develop the aquaculture sector. Recent reviews conducted for the African, Caribbean, and Pacific Group States (ACP) (COFREPECHE 2013) and NEPAD (Hecht et al. 2012) confirm the strong potential for aquaculture-related activities, with various recommendations for its development (e.g. commercial semi-intensive tilapia and catfish farming models and in rural areas low input systems integrated within rural livelihoods and farming systems). Enhancing production from inland fisheries could also contribute to reducing this shortage and improving access to fish in communities away from the coastal region.
Study objectivesThe objectives of this assessment are to improve understanding of the fisheries and aquaculture production systems and value chains as well as identify opportunities for short- and longer-term interventions that have the potential to increase productivity and income and improve nutrition among rural households in Tonkolili District.
Three distinct fish value chains have been analyzed based on the different sources and product types.• the marine fish value chain for saltwater fish from the sea and coastal estuaries• the freshwater fish value chain, for which fish is wild caught from inland streams, IVSs, wetlands and rivers
(inland fisheries)• the aquaculture value chain for which fish is farmed in ponds at the household level.
Thus, the assessment covers marine fisheries, inland fisheries and aquaculture products, including smoked fish.
The study aims to accomplish the following:• Map the marine, inland fisheries and farmed fish value chains from input supply to end markets, with a focus
on Tonkolili District. It describes value chain core functions, value chain actors and their activities; production systems and products; linkages between actors; and the flow of fish products through the value chains.
• Assess the institutional environment in which the fish value chains operate, including social norms, laws, rules and regulations, policies and infrastructure and their implications for value chain development.
• Identify key constraints to value chain development.• Recommend potential interventions to overcome constraints for equitable and pro-poor value chain upgrading.
These include opportunities to increase production and incomes through commercialization of production and marketing activities, enhance value addition activities, develop pro-poor enterprises along the value chain, increase food and nutrition security of poor and vulnerable consumers, and integrate fish production with other food producing sectors with special emphasis on IAA practices.
12
Criteria for recommendations, prioritization and timingOverall, these recommendations are based on the identification of interventions that have the greatest potential to promote inclusive growth, reduce poverty and improve nutrition (for all populations, especially women and children) among the largest number of people. Proposed value chain interventions and investments are characterized and prioritized according to their potential for• inclusiveness and households reached;• poverty reduction and income generation;• nutrition enhancement;• value chain upgrading and development.
Crosscutting issues such as promoting gender equity and women’s empowerment are also considered. Recommendations for short-, medium- and longer-term interventions are proposed and potential implementation partners for each recommendation are suggested.
Report structureFollowing this introduction, Section on page 13 describes the methodology used to conduct the value chain assessment. Section on page 18 provides an overview of the fisheries and aquaculture sector in Sierra Leone. Sections on page 21 to 37 provide a detailed analysis of the three fish value chains under analysis (marine fish, freshwater wild caught fish and farmed fish), including the key constraints in each with a focus on Tonkolili District. Section on page 50 analyzes fish consumption patterns in Tonkolili District. Section on page 53 describes the crosscutting services that support the fish value chains. Section on page 56 provides an overview of the policy and enabling environment in which these value chains operate, including past and present interventions of nongovernmental organizations (NGOs) and government agencies in the fisheries and aquaculture sector. Section on page 61 presents recommendations for future value chain interventions to address the identified constraints and facilitate equitable and pro-poor development and upgrading of the fish value chains.

13
Methodology
Conceptual frameworkA value chain is a way of describing a series of related enterprises (operators or actors) conducting activities (functions) to add value to a product from conception and primary production through processing and marketing to the final sale of the product to consumers. Production is just one of a number of value-added links in the value chain, and each link includes a range of activities, including sourcing inputs, production and selling the product on to the next link in the chain. Value chains are supported by a range of service providers that do not take ownership of the product but supply value chain enterprises with financial information and other types of services that facilitate the flow of products along the value chain. Value chains are also embedded within and influenced by the policy, regulatory, physical and socioeconomic environment. All of these aspects are included in the scope of the value chain assessment framework used in this study (Figure 1) and will be assessed in more detail in the following sections.
Value chain analysis has become a popular tool used to help understand and assess the relative importance of factors and conditions under which both firms and value chains can improve and “upgrade” their performance. Value chain analysis is often used to find ways to promote pro-poor growth and reduce poverty, focused on identifying ways to (a) improve the competitiveness of value chains, especially those with large numbers of small firms, (b) increase and expand the benefits generated (e.g. by finding ways to integrate lower income groups into value chain activities), (c) equitably enhance returns along the value chain and (d) improve access to value chain benefits and outputs for lower income and vulnerable groups. In line with these objectives, value chain analysis usually focuses on identifying major constraints to improving performance or competitiveness, especially those related to end-market opportunities, and identifying targeted interventions to overcome these constraints.
Figure 1. Value chain assessment scope.
Value chain supporters,influencers and service providerse.g. financial service providers, extension and research, transportation, etc.
National/ local/ informalenabling environment
Global/regionalenabling environment
Input suppliers
Producers
Processors/traders
Exporters
Wholesalers
Local/national retailers
Local/national consumers
Regional/global retailers

14
This value chain assessment considers the production and consumption of marine and freshwater fish commodities in Sierra Leone with a focus on Tonkolili District. Based on the framework above, the study follows the fish value chains from production to end-markets with a focus on those value chain actors and processes present in and affecting households in Tonkolili District. Key crosscutting services (e.g. extension and research, finance) and the enabling environment are also assessed.
Study areaThe area of focus of the USAID-funded FtF Agriculture Project and this value chain study is Tonkolili District in central Sierra Leone (Figure 2). Research was conducted mainly in Tonkolili District with some additional research on fish markets in Freetown and on marine fisheries production, processing and wholesaling in Western District (described further below).
PUJEHUN
WESTERNURBAN
BOMBALI
BO
KAMBIA
MOYAMBA
KONO
KOINADUGU
KENEMA
PORT LOKO
WESTERNRURAL
BONTHE
TONKOLILI
KAILAHUN
Kenema
Pujehun
Kailahun
Koidu town
Bo
Bonthe
Moyamba
Port Loko
Makeni
Magburaka
Kabala
Kambia
Freetown
Figure 2. Map of Sierra Leone livelihood zones.
Degradation, short cycle, root crop, trade, cassava, yam Rice bowl area
Formerly mixed (NW) - crop, livestock, rice, cassava sw potato Rice and trees
Vegetable production area
Fish and food crop Rice and secondary gold mines
Freetown peri-urban
Cash crop, food crop, trade (SE) Livestock, trade, food crop
Legend
15
Nearly 75% of land in Sierra Leone is arable land, which is distributed between two main ecologies: (1) the upland, which makes up 78% of arable land, and (2) the lowland, which makes up the remaining 22% (Aleu 2005). The uplands are composed of forest, savannah woodlands and grasslands while the lowlands comprise 690,000 ha of IVS, 145,000 ha of bolilands (large, saucer-shaped basins), 130,000 ha of riverine grasslands and 200,000 ha of mangrove swamps (WorldFish 2016). The three main farming ecologies in Tonkolili District are uplands, IVS and bolilands. Access to upland/IVS combination is the most common (65%) followed by boliland/IVS/upland (19%) and boliland/IVS, and only upland, IVS and boliloand (16%). The majority of farmers grow rice in IVS (ibid.).
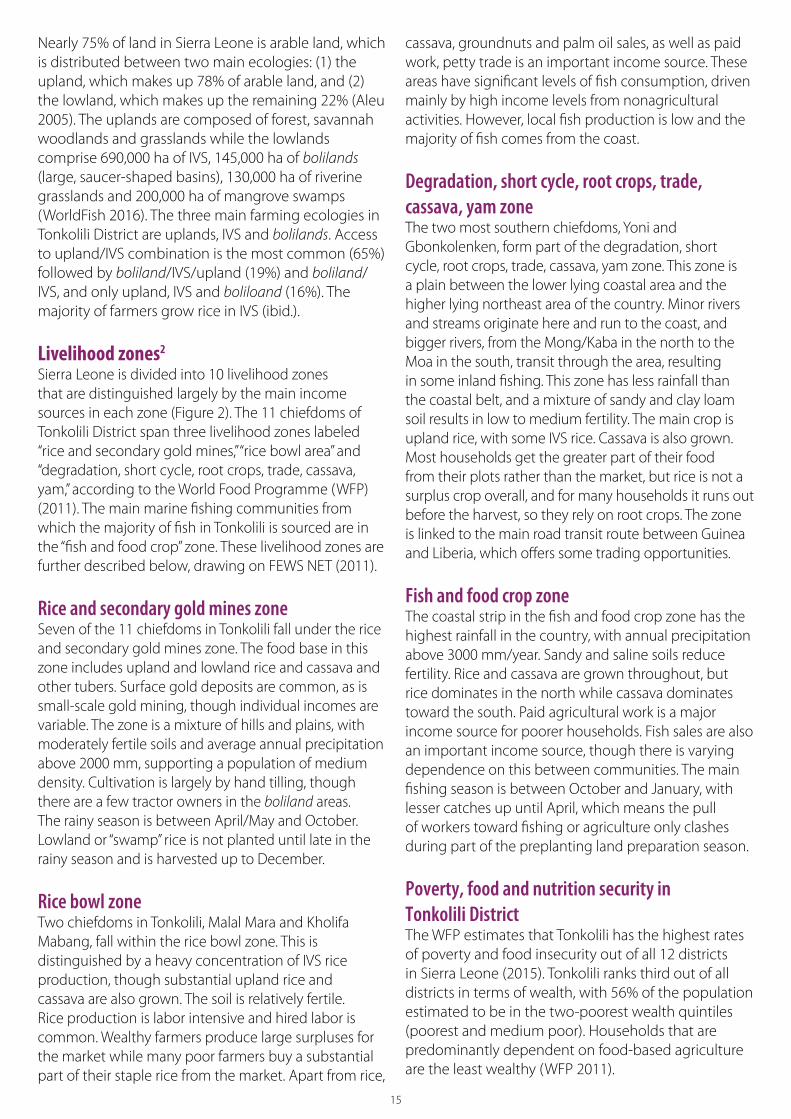
Livelihood zones2 Sierra Leone is divided into 10 livelihood zones that are distinguished largely by the main income sources in each zone (Figure 2). The 11 chiefdoms of Tonkolili District span three livelihood zones labeled “rice and secondary gold mines,” “rice bowl area” and “degradation, short cycle, root crops, trade, cassava, yam,” according to the World Food Programme (WFP) (2011). The main marine fishing communities from which the majority of fish in Tonkolili is sourced are in the “fish and food crop” zone. These livelihood zones are further described below, drawing on FEWS NET (2011).
Rice and secondary gold mines zone Seven of the 11 chiefdoms in Tonkolili fall under the rice and secondary gold mines zone. The food base in this zone includes upland and lowland rice and cassava and other tubers. Surface gold deposits are common, as is small-scale gold mining, though individual incomes are variable. The zone is a mixture of hills and plains, with moderately fertile soils and average annual precipitation above 2000 mm, supporting a population of medium density. Cultivation is largely by hand tilling, though there are a few tractor owners in the boliland areas. The rainy season is between April/May and October. Lowland or “swamp” rice is not planted until late in the rainy season and is harvested up to December.
Rice bowl zoneTwo chiefdoms in Tonkolili, Malal Mara and Kholifa Mabang, fall within the rice bowl zone. This is distinguished by a heavy concentration of IVS rice production, though substantial upland rice and cassava are also grown. The soil is relatively fertile. Rice production is labor intensive and hired labor is common. Wealthy farmers produce large surpluses for the market while many poor farmers buy a substantial part of their staple rice from the market. Apart from rice,
cassava, groundnuts and palm oil sales, as well as paid work, petty trade is an important income source. These areas have significant levels of fish consumption, driven mainly by high income levels from nonagricultural activities. However, local fish production is low and the majority of fish comes from the coast.
Degradation, short cycle, root crops, trade, cassava, yam zoneThe two most southern chiefdoms, Yoni and Gbonkolenken, form part of the degradation, short cycle, root crops, trade, cassava, yam zone. This zone is a plain between the lower lying coastal area and the higher lying northeast area of the country. Minor rivers and streams originate here and run to the coast, and bigger rivers, from the Mong/Kaba in the north to the Moa in the south, transit through the area, resulting in some inland fishing. This zone has less rainfall than the coastal belt, and a mixture of sandy and clay loam soil results in low to medium fertility. The main crop is upland rice, with some IVS rice. Cassava is also grown. Most households get the greater part of their food from their plots rather than the market, but rice is not a surplus crop overall, and for many households it runs out before the harvest, so they rely on root crops. The zone is linked to the main road transit route between Guinea and Liberia, which offers some trading opportunities.
Fish and food crop zoneThe coastal strip in the fish and food crop zone has the highest rainfall in the country, with annual precipitation above 3000 mm/year. Sandy and saline soils reduce fertility. Rice and cassava are grown throughout, but rice dominates in the north while cassava dominates toward the south. Paid agricultural work is a major income source for poorer households. Fish sales are also an important income source, though there is varying dependence on this between communities. The main fishing season is between October and January, with lesser catches up until April, which means the pull of workers toward fishing or agriculture only clashes during part of the preplanting land preparation season.
Poverty, food and nutrition security in Tonkolili DistrictThe WFP estimates that Tonkolili has the highest rates of poverty and food insecurity out of all 12 districts in Sierra Leone (2015). Tonkolili ranks third out of all districts in terms of wealth, with 56% of the population estimated to be in the two-poorest wealth quintiles (poorest and medium poor). Households that are predominantly dependent on food-based agriculture are the least wealthy (WFP 2011).
16
Tonkolili District is ranked third out of all districts in terms of food insecurity, with nearly 75% of households estimated to be food insecure, defined as having poor or borderline food consumption (ibid.). Tonkolili also has the highest proportion of households experiencing severe food insecurity (22.5%). In terms of livelihood zones, the rice and secondary gold mines zone has the highest level of food insecurity, with 69% of households classified as severely and moderately food insecure followed by 61% in the rice bowl zone and 55% in the degradation, short cycle, root crops, trade, cassava, yam zone (ibid.). Tonkolili District also has the highest rates of stunting and underweight children among those less than 5 years old in the country. While 29% of children under 5 are stunted nationally, the rate is 41% in Tonkolili. Additionally, 13% of children under 5 are underweight in Sierra Leone, and that rises to 20% in Tonkolili (MHS and UNICEF 2014).
Data and methods This value chain study is based on both primary and secondary data. Country level data was gathered from secondary sources, including government- and donor-funded surveys and project reports. Overviews of the fisheries and aquaculture sectors and earlier fish value chain studies in Sierra Leone were also used as background and to supplement primary data.
Primary data was collected from the study areas between October and December 2015 with follow-up data collection between May and June 2016. Quantitative and qualitative research methods were used to collect primary data. Fieldwork followed the value chain assessment scope framework in Figure 1 and gathered data from the main actors and service providers along and around the fish value chains, including input suppliers, producers (marine and inland fishers and fish farmers), processors, wholesalers, retailers and consumers. Overall, data was collected on the characteristics and functions of these actors, the linkages between them and the constraints they face.
A number of questionnaire surveys were undertaken during these two fieldwork periods, complemented by semistructured interviews, focus group discussions (FGDs), key informant interviews and direct observation (described in more detail below). Primary data was supplemented with findings from other studies conducted by the FtF project, namely an IVS assessment (WorldFish 2016a) and an aquaculture assessment (WorldFish 2016b). Information presented in this study is therefore a synthesis of data obtained from a variety of sources using a range of methods.
Primary data collectionQuestionnaire surveys were used to gather data from fish producers, both fish farmers and inland fishers, and consumers in all 11 chiefdoms in Tonkolili District. For freshwater fish producers, a purposive sampling technique was used based on the distance to Makali (the hub for aquaculture in the district) and the project’s knowledge of fish farmer concentration. Between 2 and 20 October 2015, 303 fish producer questionnaires were administered throughout all 11 chiefdoms within the district. For consumers, a two-stage random sampling technique was used to select 303 households throughout all chiefdoms within Tonkolili District, which were also surveyed in October 2016. The sampling plan was based on the proportion of the populations in the different chiefdoms as shown in Table 1.
A survey was also conducted in the six-largest coastal fishing communities in Western Area where the majority of fish in Tonkolili District is sourced: Bureh Beach, Goderich Beach, Kent Beach and Tombo Beach in the rural part of Western District and Aberdeen and Rokupa fishing communities in the urban part of Western District. A random sample of 150 households in these communities was surveyed. Data from fish processors, wholesalers and retailers, along with input suppliers and transporters, was collected through individual interviews.
In addition, in Tonkolili District in September 2015, seven FGDs were conducted with each of the following groups: 28 fish producers (inland fishers and fish farmers), 28 consumers, 42 fish wholesalers, 42 fish retailers and 42 transporters. The FGDs were held to better understand issues of fish production, consumption, demand, supply, inefficiency and market structure and supplement survey data. Key informants such as researchers, policymakers and consultants were also interviewed.
As a result of the small number of “active” fish farmers (those who had stocked or harvested in the preceding 12 months) captured in the fish producer survey sample, a follow-up survey was conducted in the two chiefdoms with the highest concentration of fish farmers (Konike Barina and Konike Sanda) between 13 and 17 June 2016. This survey collected detailed economic data from 20 active farmers based on the previous 12 months to better understand current aquaculture practices, costs and benefits.
Using project records, cost and projected production and revenue data was collected on nine project-

17
supported fish farmers currently trialing two different fertilization models for tilapia farming combined with the use of recommended management practices.
Data analysisData analysis used simple descriptive analytical techniques to determine frequencies and means of key statistics across the different actors. Data collected from value chain actors using key informant interviews and FGDs was used to supplement and help interpret survey results as well as describe and analyze the value chains within the conceptual framework discussed above.
Analyses evaluating the financial viability of nonproject and project-supported fish farmers, based on the cost and revenue data collected, estimated key economic indicators as follows:• gross profit (gross revenue – variable operating cost)• net profit (gross revenue – total operating costs)• gross profit margin (gross profit/gross revenue)• net profit margin (net profit/gross revenue)• undiscounted benefit cost ratio (net profit/total costs)• return on variable costs (gross profit/variable
operating costs)• return on capital costs (net profit/total capital costs)• payback period (total capital cost/net profit).
Data processing and analysis were carried out using Microsoft Excel, SPSS and QGIS.
Validation workshopA validation workshop on fish value chain assessment in Sierra Leone was held on 15 December 2015 in Freetown, Sierra Leone. Participants included key stakeholders, such as government agencies, NGOs and value chain actors, including producers, producer organizations, potential investors, processors, traders, marketers and input suppliers. The objective of the workshop was to present the findings of the fish value chain assessment draft, gather feedback from participants, especially with regards to constraints and recommendations for value chain interventions, and incorporate feedback into the report. The outcomes of this workshop form the basis of the constraints sections in each of the value chain analyses below and the recommendations proposed in Section on page 61.
Chiefdom Population Percentage of chiefdom population
Producers targeted
Producers surveyed3
Consumerstargeted
Consumers surveyed
Gbonkolenken 47,665 14.0 42 42 42 43
Kafe Simiria 19,817 6.0 18 17 18 17
Kalansogoia 16,406 5.0 15 17 15 15
Kholifa Mabang 12,437 3.5 12 18 12 18
Kholifa Rowalla 47,391 13.5 42 13 42 42
Konike Barina 13,411 4.0 12 53 12 12
Konike Sanda 42,968 12.0 36 82 36 35
Malal Mara 14,025 4.0 12 18 12 18
Sambaya Bendugu 22,728 7.0 21 10 21 21
Tane 22,242 6.0 18 14 18 17
Yoni 87,366 25.0 75 13 75 75
Total 346,456 100 303 297 303 313
Note: Chiefdom population figures and sampling proportions provided by Statistics Sierra Leone.
Table 1. Sampling of fish producers and consumers.
Value chain actor Number interviewed LocationMarine fish processors 10 Western District
Marine and freshwater fish retailers 30 Tonkolili District
Marine fish wholesalers 30 Western District
Aquaculture input suppliers 22 Tonkolili District
Transporters 10 Tonkolili District
Table 2. Fish value chain actors interviewed.
18
BackgroundThe fisheries sector is an important source of income, employment and food and nutrition security in Sierra Leone. Accurate and up-to-date data on the volume and value of production is hard to get, so the estimates reported here should be read with caution. Production of marine and freshwater fisheries in Sierra Leone was estimated by the MFMR to be 150,700 t in 2010. Over 90% (137,000 t) of fisheries production is estimated to be from the marine fisheries subsector with the remainder from freshwater fisheries (comprised of inland fisheries and aquaculture). Over 80% (112,650 t) of marine fisheries production is estimated to come from artisanal fisheries with the rest from industrial fisheries.4
It has been estimated that the fisheries sector provides employment and contributes to the livelihoods of over 500,000 people, (just under 10% of the population) mainly in coastal communities (Neiland et al. 2016). In coastal areas, approximately 25% of the male population of working age is reported to be involved in fishing at least part time (COFREPECHE 2013). Overall, the fish resources of Sierra Leone have an estimated capitalized economic value of USD 735 million (Neiland et al. 2016).
Artisanal marine fisheries take place in estuaries and coastal waters, extending from the shoreline to a depth of 20–40 m. Crafts used in these fisheries include a variety of dugout and planked canoes measuring 10 m or under in length, which use a range of fishing gear (cast nets, ring nets, driftnets, beach seines and hooks) and are either motorized or not motorized (powered by an outboard or inboard engine not exceeding 25 hp, sails or paddles). It is estimated there are over 9500 artisanal fishing crafts (Précon 2014). Semi-industrial fishing vessels are often lumped in with artisanal fisheries and include (a) decked fishing vessels less than 20 m in length with an inboard engine and (b) undecked fishing vessels between 10–20 m in length, a weight of less than 50 gross register tonnage (GRT) and powered by engines of at least 25 hp.
Data on the number of licenses, boats, gear types or fishing efforts by the artisanal fisheries appears flawed, while data collection on the production and composition of the catch is unreliable or nonexistent. It is likely that the actual fishing effort of the artisanal sector as well as the volume of catch landed is much higher than assumed. Artisanal fishers land their catch in 640 fish sites along the 560 km coastline with over 100,000 t of fish yearly. Artisanal fishing is a major
Overview of the fisheries and aquaculture sector in Sierra Leone
activity in the coastal districts of Western Area, Port Loko, Kambia, Moyamba, Bonthe and Pujehun.
Industrial fisheries take place in deep waters. The subsector is capital-intensive and foreign-dominated. Foreigners own the majority of registered industrial fishing companies. Industrial vessels are decked fishing vessels over 20 m in length and with an inboard engine.
It is estimated there are over 100 fishing vessels, including shrimpers, demersal fish trawlers, tuna purse seiners, tuna long liners, canoe support vessels, supply carriers and processing vessels, which catch fish mainly for export, with little value addition (Précon 2014). In 2014, industrial fisheries production contributed SLL 30 billion (about USD 6 million) to national revenue. Some of the vessels/companies that visit Sierra Leone’s waters fish in territories they may not have been assigned/registered to fish. The inability to prevent such illegal activities within the Sierra Leonean fishing zones brings about significant loss in revenue that could be used in the development of the sector or the country. Sierra Leone is losing an estimated USD 29 million annually to illegal, unreported and unregulated (IUU) fishing alone (EJF 2012), which could be reduced with improved monitoring, control and surveillance (MCS).
Inland fisheries take place in rivers, a few lakes, floodplains and swamps. Production is consistently estimated at 14,000 t/year (FAO 2016), suggesting it is not accurately monitored. Aquaculture is mostly practiced in IVS and wetlands. National aquaculture production is limited, and estimated at 276 t/year (Showers 2015).
The levels of complexity of fish value chains in Sierra Leone vary depending on the source of fish. The most developed value chain is associated with marine fish, while the least developed value chains are for inland fisheries and aquaculture because of the relatively low volumes associated with these localized value chains. These value chains are described in detail in Sections on pages 21-52 below.
International trade flowsSimilar to the data on production, data on Sierra Leone’s international fish trade is limited and inconsistent. Aside from a general lack of reliable data, this is due in part to the unknown amount of fish and seafood caught by foreign fleets that is not landed in Sierra Leone. The country’s seafood trade in recent

19
years appears to be very low in relation to the national catch. Figure 3 contains Sierra Leone’s fish and seafood trade between 2000 and 2011, showing the country as a net exporter during that span.
There is very little declared seafood trade between Sierra Leone and the major markets in the Organization for Economic Co-operation and Development (OECD) such as the EU and US. The EU has not officially imported any Sierra Leone seafood over the past decade (Sierra Leone is not authorized to export seafood directly to the EU because it has not satisfied the EU requirements to become part of its harmonized trading system) but did export a few hundred metric tons a year in the early 2000s. The US has imported small quantities (50–100 t) over the past decade, and US seafood exports to Sierra Leone are minimal. While this is the official picture, what is not captured here is the IUU trade by foreign fishing fleets. As a result of a lack of onshore facilities, a substantial part of the high value fish catch is frozen and transshipped at sea and exported to the EU via Senegal and Las Palmas in the Canary Islands (Précon 2014). As noted above, Sierra Leone is losing an estimated USD 29 million annually because of IUU fishing (about 10% of the country’s education budget) (MRAG 2005).
Industrial fisheries are currently the main source of export earnings, the value of which is estimated to be over USD 12 million/year (Précon 2014), though this figure almost certainly underestimates the artisanal fish trade (e.g. smoked fish from the artisanal sector
exported to Guinea and Liberia). Fish from the industrial sector is exported to the West African subregion and Asia. Small quantities of high value fish are exported fresh on ice to the US and Asia (Précon 2014).
Fish consumption and nutritional benefits Fish is an important part of the Sierra Leonean diet. Fish supply in Sierra Leone (estimated at just over 33 kg per capita per year) is significantly greater than the average for the African continent (FAOSTAT 2016). As of 2003, per capita fish consumption in Sierra Leone was 17 kg per capita per year,5 and fish comprised 80% of animal protein consumed nationally (FAOSTAT 2016). Although updated national fish consumption figures are urgently needed, surveys indicate that fish is more commonly consumed than any other type of meat in Sierra Leone (SSL 2014).
Although fish is an excellent source of protein, it is unique from other animal-source foods because of the significant quantity of additional nutrients it contains (FAO 2014). Fish is rich in micronutrients, minerals, proteins and essential fatty acids, especially omega-3 long-chain polyunsaturated fatty acids. Even when consumed in small quantities, fish adds amino acids to plant-based diets and improves the overall quality of dietary protein intake (FAO 2014; Beveridge et al. 2013). Fish provides essential minerals such as calcium, phosphorus, magnesium, iron, potassium, sodium, zinc, copper, manganese and selenium, and vitamins such as A, B12, C, D and E, as well as folic acid and
Figure 3. Sierra Leone’s exports and imports of fish products.
Sources: COFREPECHE (2013) and FAOSTAT (2016)
Year
8000
7000
6000
4000
5000
3000
2000
1000
02000 20042002 20062001 20052003 2007 2008 2009 20112010
Met
ric
tons
Exports
Imports
Net exports
Legend
20
choline (Tacon and Metian 2013). Small fish, which are normally consumed whole, have particularly high levels of micronutrients, especially in the bones, head and gut (Beveridge et al. 2013). Fish consumption is particularly important during pregnancy and the first two years of a child’s life, as the long-chain omega-3 fatty acids that it provides promote optimal brain and neural system development (ibid.). Fish consumption also has health benefits for adults, as studies have
20
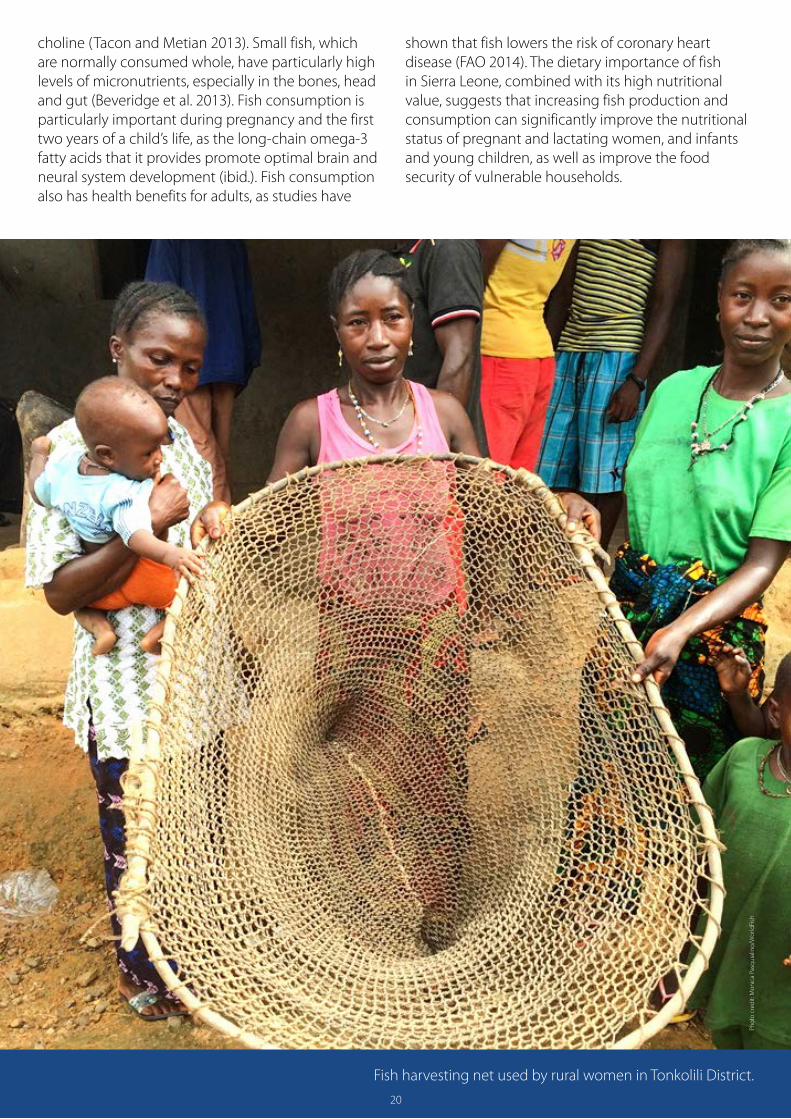
Fish harvesting net used by rural women in Tonkolili District.
Phot
o cr
edit:
Mon
ica
Pasq
uial
ino/
Wor
ldFi
sh
20
shown that fish lowers the risk of coronary heart disease (FAO 2014). The dietary importance of fish in Sierra Leone, combined with its high nutritional value, suggests that increasing fish production and consumption can significantly improve the nutritional status of pregnant and lactating women, and infants and young children, as well as improve the food security of vulnerable households.

21
OverviewFish species and productsThe marine fisheries resources of Sierra Leone can be classified into the following four categories (Précon 2014):• pelagic stocks (herring, barracudas, tunas) • demersal stocks (snappers, catfish, groupers) • shellfish (shrimps, crabs, lobsters) • others (bivalves, snails, cuttlefish, octopus).
Roughly 200 fish species have been identified in the country’s exclusive economic zone (EEZ), about 80 of which have commercial value. Over 25 species are commonly found in Sierra Leone’s domestic markets (see Annex 2)—including relatively inexpensive species such as herring, croaker (Psuedotolithus typus) and lati (West African illisha) (Illisha Africana), as well as high value species such as snapper (Dentex canariensis), crocus (Pomadasys jubelini) and kuta (barracuda) (Sphyraena guachancho)—that are destined for restaurants and middleclass urban consumers.
Small pelagics, particularly bonga, herring and lati, have accounted for over half of the total catch in recent years. These species, which are traditionally processed by smoking, are caught by both artisanal and industrial fishers and dominate the domestic fish supply. These products penetrate inland markets and set benchmark prices for seafood in much of Sierra Leone (Hecht et al. 2012). Species from the industrial sector include snapper, sea bream and barracuda (kuta), much of which gets exported. The remainder is for the domestic market, especially the small pelagics.
The vast majority of fish sold in markets throughout Sierra Leone, particularly in inland areas including Tonkolili District, is smoked. A study by Sankoh (2009) estimated that 97% of fish sold in daily and weekly markets throughout the country are smoked with the remainder being frozen (2.5%) or fresh (0.5%). The study also found bonga (Ethmalosa fimbriata, Bowdich 1825) was the most common species in the 29 markets surveyed, sold by more than half the traders sampled, closely followed by herring and croaker (gwangwa) (Pseudotolithus elongates, Bowdich 1825). There are four main smoked fish types sold in Tonkolili: bonga, herring, West African ilisha and “good fish,” which is a group of fish consisting of mainly barracuda (Sphyraena guachancho, Cuvier 1829), snapper (Dentex canariensis, ), European barracuda (kinni) (Sphyraena sphyraena,
Marine fish value chain analysis
Linnaeus 1758) and croaker. It represents a special category of high-end smoked fish obtained from industrial fish catches and caters to a select few in the Tonkolili market. Although some urban consumers consume fresh fish, there are few places where people can buy high quality fresh fish on ice. Sierra Leonean cuisine uses smoked fish in the majority of its dishes, and it is generally preferred over fresh (Précon 2014).
Seasonality of demand and supplyMarine fish from both artisanal and industrial fisheries, both iced and smoked, is available throughout the year. However, supply is lower during the rainy season from May to September, particularly low between July and September, and the species caught vary across the year. Fish demand is highest between October and March and lowest between August and September.
EmploymentThe small-scale artisanal fishery is a significant source of employment and rural income in Sierra Leone. The sector offers direct employment for about 30,000 fishermen and 500,000 additional jobs through ancillary activities like traditional fish processing, smoking and marketing (mostly by women) and boat-building/repairs (Précon 2014). The industrial sector is estimated to employ only about 1000 people (Précon 2014).
Marine fish value chain map, actors and their functionsFigure 4 illustrates the marine value chain map, covering both industrial and artisanal fisheries, roughly corresponding to the flow of raw or frozen and smoked fish, respectively, along the various links in the chain. The domestic value chain, with an emphasis on those value chain actors and functions focused on marketing fish in Tonkolili District, is further described in the following sections.
Input supplyIn Sierra Leone, there is a lack of input suppliers focusing on the supply of raw materials and manufacturing. There is currently no adequate fishing gear manufacturing or yards to build and repair boats. Official boat engine representation is lacking, and building materials, including cooling technology, have to be imported through costly channels. This lack of suppliers increases the production costs of the value chain considerably (Précon 2014).

22
ProductionThe majority of fish consumed within Tonkolili District comes from the artisanal fisheries in Western Area Rural District. Our survey of the six-largest coastal fishing communities found that 98% of households surveyed are engaged in fishing activities, primarily artisanal fisher folk involved in coastal fishing. With an average household size of eight, about 38% of all members of these households are involved in fishing activities. There are gender-specific roles for the different members of the households with men predominantly involved in catching fish and women involved in processing and marketing the catch (discussed further below). The primary source of livelihood for these households is fishing, with about 44% coming directly from fish catching and 43%
from processing and marketing the catch. Figure 5 presents livelihood sources disaggregated by fishing community, which shows that fishing and petty trading (processing and marketing of fish) are the two main livelihood sources in the respective communities.
On average, about 78% of fisher folk surveyed are Temnes ethnic language speaking, less than 5% of whom have primary school education. Annual revenues from fishing activities range between SLL 450,000 and SLL 8 million. The share of revenues obtained from agricultural activities is very small. The average revenue from agricultural activities is about SLL 500,000, ranging from SLL 60,000 to SLL 2,000,000. As shown in Figure 6, revenues were greatest for the Goderich fishing community and lowest for the Kent fishing community.
Figure 4. Value chain map for the marine fish value chain.
Fresh fish flows Iced fish flows Smoked fish flows
VC supporters &influencers
Iced/frozen fish companies and
agentsAgents Wholesalers
Fishmammies
Value chain map
Cold store operators
Domestic consumersRegional export markets
(Guinea & Liberia)Global export markets
Wholesalers and semiwholesalers
Retailers/traders
MFMR (regulation and policy, research,
extension, food safety and
standards)
Smoked fishprocessors
NGOs, development
projects
CBOs (e.g.traders
associations
Financialservice
providers
Transporters
Industrial fleet
Input suppliers forartisanal production
(limited)
Input suppliers(e.g. mangrove
wood)
Artisanal and semi-industrial fishers
Legend
23
Figure 5. Livelihood sources, by fishing community.
Aberdeen wharf
Bureh beachwharf
Goderich wharf
Kent beachwharf
Rokupa wharf
Tombo wharf
60%
50%
40%
30%
20%
10%
0
Farming Logging forestFishing Petty tradingLivestock rearing Rental income
Legend
Figure 6. Average annual household income levels from agriculture and nonagricultural sources, by fishing community.
Aberdeen wharf
Bureh beachwharf
Goderich wharf
Kent beachwharf
Rokupa wharf
9,000,000
5,000,000
7,000,000
3,000,000
8,000,000
4,000,000
6,000,000
2,000,000
1,000,000
0
Annual average income from agricultural sources (SLL)
Annual average income from nonagricultural sources (SLL)
Legend
Figure 7. Average monthly expenditure per household (SLL).
Food item (SLL)
Clothing (SLL)
House rent/ expense
(SLL)
Electricity (SLL)
Transportation (SLL)
Medical expense
(SLL)
Education (school
fees/ stationery/
other)
Leisure/ recreation
(SLL)
Cigarettes/ alcohol
(SLL)
Remitances (SLL)
300,000
150,000
250,000
100,000
200,000
50,000
0

24
On average, monthly household expenditure is approximately SLL 900,000 with food accounting for the largest share (30%).
None of the respondents had savings or access to credit or loans for the start of their activities. Their initial income sources were primarily from family members.
The fishing communities in Western Area use approximately 15 different boat types that vary according to propulsion method and fish species targeted. Four commonly used boat types are Herrine Boat, Kuta Boat, Lego chain boat and Morel boat. As shown in Figure 8, four boat types are used in Rokupa and Goderich beaches. Kent has only Herrine and Morel boats, while the Lego chain boats are used in all communities, except Kent. Fishers usually do not own the boats they use and are more like employees of boat owners, though they may work on different boats for different boat owners simultaneously.
All artisanal fishermen are registered to fish by the local council, as well as the maritime and harbor administrations. These boats make an average of 16 –22 trips per month, with the most trips made by boats in Rokupa and the least trips by boats in Aberdeen beach. On average, catch per trip is reported to be 264–756 dozen fish, of which 80% is sold to the market (95% raw and the remainder smoked), 10% consumed at home and about 10% given as gifts to neighbors or used to pay off debts.
Production in the industrial fishing sector has been discussed in Section on page 18. Industrial fishing is highly capital intensive and foreign dominated, employing about 1000 local people. The sector contributes 15%–20 % of total fish production in the country, though this is likely an underestimate.
Postharvest processing and packaging Processing of fish from artisanal fisheriesApproximately 80% of fish from artisanal fleets is sold raw and unprocessed at landing sites. Few landing sites have specific fishery infrastructure, and in general the artisanal sector operates with limited onshore facilities. While many artisanal fishing boats take ice onboard to preserve their catch, many do not. There is minimal processing onboard, and fish are unloaded and displayed straight on the sandy beach or on tarpaulins. There, fish are sorted by size and quality and cleaned with seawater. Some are taken to an enclosed shelter to be cut into pieces. Onshore cleaning and processing sites usually lack basic infrastructure such as running water, electricity, ice or storage. Skills and knowledge regarding quality processing is limited.
The majority of fish is purchased upon landing on the beaches by agents, or directly by fish mammies with whom fishers have arrangements (discussed in more detail in the marketing section below). Agents are those who have prearrangements with fishers to sell to fish mammies. Sometimes agents are boat owners. These agents advance money to fishers to buy fuel and have an agreement to sell fish through them. Fish mammies can also act as agents, retailers, processors and/or fishmongers. All fish buyers, including the wives or daughters of fishers and boat owners, negotiate fish prices. Some agents and fish mammies have agreements with fishers and will come to the beach to buy higher value fish for a good price if the fish are well preserved on ice. These higher quality fish are sold to fulfill orders to a number of fish processors that export high value species to Asian markets (mostly South Korea). In general, however, agents and fish mammies have little incentive to practice proper handling for fish sold on the domestic market as there are no economic benefits or regulatory obligations (Précon 2014).
Figure 8. Commonly used fishing boat types in Western Area.
Morel boatBarracuda/ kuta boat Lego chain boatHerrine boat
100%
80%
60%
40%
20%
0Aberdeen
wharfBureh beach
wharfGoderich
wharfKent beach
wharfRokupa wharf
Tombo wharf
Legend

25
Agents sell fish to fish mammies (both large and small processors from the fishing communities) who process the fish themselves, or with the help of family members, using a combination of smoking and drying techniques. Fish smoking is usually a small-scale process done in fishing communities as a family business. When handling larger quantities, additional labor may be hired. Small quantities of salted and sundried products are also produced for both local and export markets (ibid.)
Smoking is done in bandas. Smoking fish is largely encouraged by the lack of electricity, refrigeration and ice to preserve fish. The inputs needed for smoking include fuel wood (both large pieces and smaller “chips” used as kindling), kerosene and packaging materials (see Annex 1 for a breakdown of costs and revenues related to fish smoking from two fish processors). Smoking consumes a lot of wood, mainly from mangroves, which provides a livelihood for mangrove wood suppliers but results in negative environmental impacts. Compared to smoked fish from other parts of West Africa, products in Sierra Leone are of very poor quality because of the smoking ovens, which burn rather than smoke the fish, as well as a lack of suitable storage. Data from fish processors (Annex 2) suggests that the cost of smoking and packaging 5100–6000 fish is approximately SLL 100,000. This represents an additional 17%–25% on the cost of fresh fish (excluding transportation costs), depending on the buying price of fresh fish.
Fish are smoked three times during the course of a day to become “hard dried.” If the fuel wood is dry, each smoking takes 2–3 hours. The fish are then cooled, turned and smoked again. Laborers are hired to lay the fish on the smoking racks and turn them after each smoking. Fully smoked or hard dried fish reportedly have a shelf life of about two months and are therefore suitable for the more distant markets (e.g. Liberia, Barmoi/Guinea and inland districts in Sierra Leone). Consumers in the local markets, however, (e.g. Waterloo and the Freetown Peninsula) have a preference for softer, partially smoked fish known as “fresh dried.” This involves smoking the fish only once or twice, resulting in a product that is easily broken and has only a two-day shelf life. Because of its perishability and tendency to break apart, only limited amounts of fresh dried fish are sent to inland districts. Although the fresh dried fish fetches a higher price, traders prefer hard dried fish to mitigate the risk of losing their product.
Smoked fish is carefully packed and layered in large basins with extended cardboard sides and brown
paper lining. Packaging is generally done by laborers hired by the processor. A fully packed basin generally contains 3000–3600 ieces of smoked herring or bonga. The packed basins containing smoked fish are transported in minivans to the provinces, as well as into Guinea and Liberia.
A small percentage of women process fish using improved smoking ovens (e.g. the Altona oven located at Tombo imported from the US by the MFMR and used by local processors for a fee). These processors produce high quality products to fulfill requests of wholesalers for the regional and export market and get a better price for their products (20%–25% more).
Semi-industrial and some artisanal boats have built-in ice stores. Iced fish from artisanal boats are purchased by companies on the Freetown Peninsula, packaged into bags containing mixed species, then frozen and subsequently sold on the domestic and export markets. Some artisanal boats without ice stores are able to sell their catch to such companies. One company has a fleet of boats that ply the coast buying fresh fish from local fishers, packing them on ice and then transporting them to the company’s freezer facility, from where some are exported and some are sold on the local market.
Processing of fish from industrial fisheriesIndustrial fishing boats have onboard freezing and packaging facilities that make it easy for them to grade, sort, clean, freeze (mainly whole not gutted) and package their catch onboard and reach their customers in different countries on time. Frozen fish destined for the Sierra Leonean domestic market (e.g. herring) are packaged in 20–30 kg cartons containing single or mixed species, sold to companies on the Freetown Peninsula that are licensed to land and sell fish from foreign fleets (discussed further below) and temporarily stored in the onshore cold stores of these companies. The majority of the higher quality, higher value fish landed by the industrial fleet is exported to Senegal for repacking and marketing to the EU, or it is sent for sale to lucrative markets in Ivory Coast, Ghana and Nigeria, where customers are prepared to pay prices that equal those in the EU or US (Précon 2014).
Postharvest lossesFish is very perishable and postharvest losses, including loss of nutritional quality, occur at all stages of the value chain. Losses occur during postharvest handling both on the boat (e.g. when unloading from the net to the boat), unloading and sorting at the landing site, processing (including breakages

26
when smoking poor quality fish) and storage, and subsequent transportation to markets as well as at markets waiting to be sold.
Globally, 25%–40% of landed fish is lost or wasted from landing to consumption as a consequence of spoilage, infestation, fragmentation or a lack of temperature control. There is no data available for postharvest losses in Sierra Leone, but it is estimated that in the artisanal sector they are as high as 40%–50% (ibid.). This estimate is supported by key informant interviews with the MFMR’s Fish Safety and Quality Control Unit and direct observations of fish handling at the landing and fish processing sites and at local markets in Tonkolili. Promoting primary fish processing practices such as head and gut removal and cleaning can reduce postharvest losses. Keeping the headed, gutted and cleaned fish on ice can further delay these losses.
Interviews with fish mammies suggest that the proportion spoiled is especially high in boats using monofilament nets.6 Fish mammies also report that when they go to the landing site to buy fish, fishermen often mix in spoiled fish with good fish (especially with small fish like herring, which is difficult to check), and it is only when they take the fish back to their bandas they can ascertain how much is actually spoiled. Fish mammies reported that sometimes 75%–100% can be spoiled, and once they have bought spoiled fish, it cannot be taken back. Consumers know when fish is bad, even when it has been smoked. For example, one processor explained that when spoiled bonga is smoked, the scales increase in size, separate from the body and become protruded, whereas when good bonga is smoked, the scales stay compact and stuck to the body.
Breakage of smoked fish is not that common during smoking, but if the fish is spoiled, breakages will rise considerably and the fish will be lighter and lose value. In addition, transportation of smoked fish, especially when it is smoked spoiled, leads to more breakages (discussed below).
Marketing and wholesaling marine fish in Western AreaFish marketing and trading in Sierra Leone is complex and competitive. Like in other parts of Africa, women dominate the fish value chain, especially the wholesaling, processing, trading and retailing of both artisanal and industrially caught fish. In the weak institutional environment found in Sierra Leone, fish value chain actors such as fish mammies and wholesalers overcome transaction costs and
uncertainty by dealing mainly with those from family or kinship groups and other trusted actors.
Fish mammies play a central role in the fish marketing system. In Sierra Leone, they consolidate their collective power through economic organizations and institutions such as osusus, a rotating savings/credit and labor support organization that can mobilize to protest against activities that might diminish their incomes. Each member pays a fee that is used to finance certain occasions, solve unexpected problems or as social support in case of illness or marriage (Précon 2014).
Agents, fish mammies, traders and retailers must secure access to fish to stay in business. Agents and fish mammies involved in the purchasing of large volumes of fish invest in building and maintaining relationships with the fish providers, whether they are fishing companies or artisanal fishers. Agents and fish mammies largely rely on informal networks to get information on prices, markets and trade. Being in a powerful position, agents and fish mammies in both artisanal and industrial value chains determine the price at first sale and claim a commission for their services.
Agents, fish mammies and wholesale traders in the fish value chains either purchase fresh fish from artisanal fishers, local agents or local processors, or they purchase 20–30 kg cartons or bags of frozen fish from agents of the fishing companies in the industrial sector.
There are potentially several links in the value chain between fishermen and consumers, which makes the distinction between wholesaler and retailer difficult to determine. There are also semi-wholesalers, who buy from wholesalers and sell smaller quantities to retailers, though retailers also purchase directly from wholesalers.
Artisanal fish marketing and wholesaling in Western AreaFishers often work with agents and fish mammies because they have established networks of clients and are able to negotiate a good price, which the agents and fish mammies pay at least part of in cash to fishers. Fishers may or may not be aware of the prices of fish at other landing sites, or of options for selling fish at a better price elsewhere, and are largely reliant on their agents for market information.
While women have traditionally played vital postharvesting roles, they are now diversifying from selling fish for profit to directly investing in fish capture. Like their male counterparts, women are
27
increasingly owning boats and gear directly and financing fishing operations. It is common for agents and fish mammies to own canoes and fishing gear and/or advance money to the fishers for fuel, food, ice and other inputs and costs for a fishing trip to secure access to the resulting fish catch. In the rainy season when the fish catch is low, agents often extend loans to fishers who are then obliged to sell to them. An agent or fish mammie may own one or several boats or have an agreement with the boat owner(s) to buy and sell their fish (Précon 2014).
While larger fish mammies may have good market information, some smaller fish mammies reported serious losses, since the price of fish is volatile and price information for other landing sites is not available. Often they take their fish to market only to find there has been another big catch at another landing site, which has decreased the retail price to below the wholesale price they paid.
Smoked fish is widely distributed by road throughout the interior of Sierra Leone and to neighboring countries via an extensive network of retail and wholesale traders, almost all of whom are women. While the majority of smoked fish is distributed to inland areas, significant quantities of it, especially bonga, have traditionally been exported by wholesalers using both road and water transport to Liberia and Guinea. This trade is not recorded and the scale is unknown, but was thought to be significant before the EVD outbreak, and trading at the Koindu International Market, in Kailahun District, was an important hub.
Industrial fish marketing and wholesaling in Freetown PeninsulaOn the Freetown Peninsula, there are at least six companies7 that operate fish auction and distribution sites. Fish landed at the landing site of these companies, which has already been graded, sorted and frozen onboard the fishing vessels, is temporarily stored in the companies’ onshore cold stores. One of the most important providers of fish within Sierra Leone is the Sierra Fishing Company, the only company that exclusively lands fish for domestic marketing. About 400 women (agents or fish mammies) maintain business relationships with the sales manager. There is strong competition for access to fish, and agents often pay advance deposits to ensure they are allowed to purchase at least part of the required cartons of fish (e.g. SLL 5 million for 50 cartons). Some of the agents may purchase up to 500 cartons per week. A carton bought at Sierra Fishing Company contains different species, weighs 20–30 kg, and depending on the
content, may cost SLL 90,000 for herring up to SLL 215,000 for high value species.
Maintaining good relationships between the agents and companies is mutually beneficial. The agents maintain regular access to fish, even during the rainy season when there is limited fish from the artisanal sector, while the companies need the agents to market their products. Some companies, like Kombra, also have a national network of agents with cold stores in major towns where there is a reliable supply of electricity. Refrigerated trucks transport frozen fish to the cold rooms inland where they are sold to retailers (ibid.).
Marketing: Wholesaling and retailing marine fish in Tonkolili DistrictFish found in markets in Tonkolili District are largely marine, the majority of which are smoked. While the survey data did not estimate the actual volume or percentage of fish that are smoked or raw/iced, key informant interviews and direct observation of markets in Tonkolili suggest that over 80% of fish are smoked, and only very little iced fish, is sold in Tonkolili. This is supported by direct observations from the fish markets visited and also from Sankoh (2009) who estimated that 97% of fish in 29 markets surveyed around the country was sold smoked, 2.5% was sold frozen and the remaining 0.5% sold fresh.
There are no markets exclusively selling fish products in Sierra Leone, though markets in Freetown, such as Dovecot, Kennedy Street, Bombay Street, Garrison Street, Krootown Road and Congo Market, have sections for fish products. In Tonkolili, fish is sold alongside other produce in daily and periodic/weekly (luma) markets throughout the district. Markets generally consist of a large, open-sided roofed building constructed by the government or municipality and are usually surrounded by additional makeshift stalls. These markets lack adequate infrastructure needed to sell perishable products such as fish. Markets have limited access to piped water and toilet facilities. They have many uncovered spaces and no cold storage facilities to store unsold fish.
In addition to these markets and surrounding stalls, much fish retailing takes place in small makeshift stalls on roadsides. In both markets and on roadsides, there may be multiple small retailers selling more or less the same products, generating low levels of profit.
The market structure that facilitates the flow of fish from the coast to inland areas involves many different levels and types of markets. There are six major
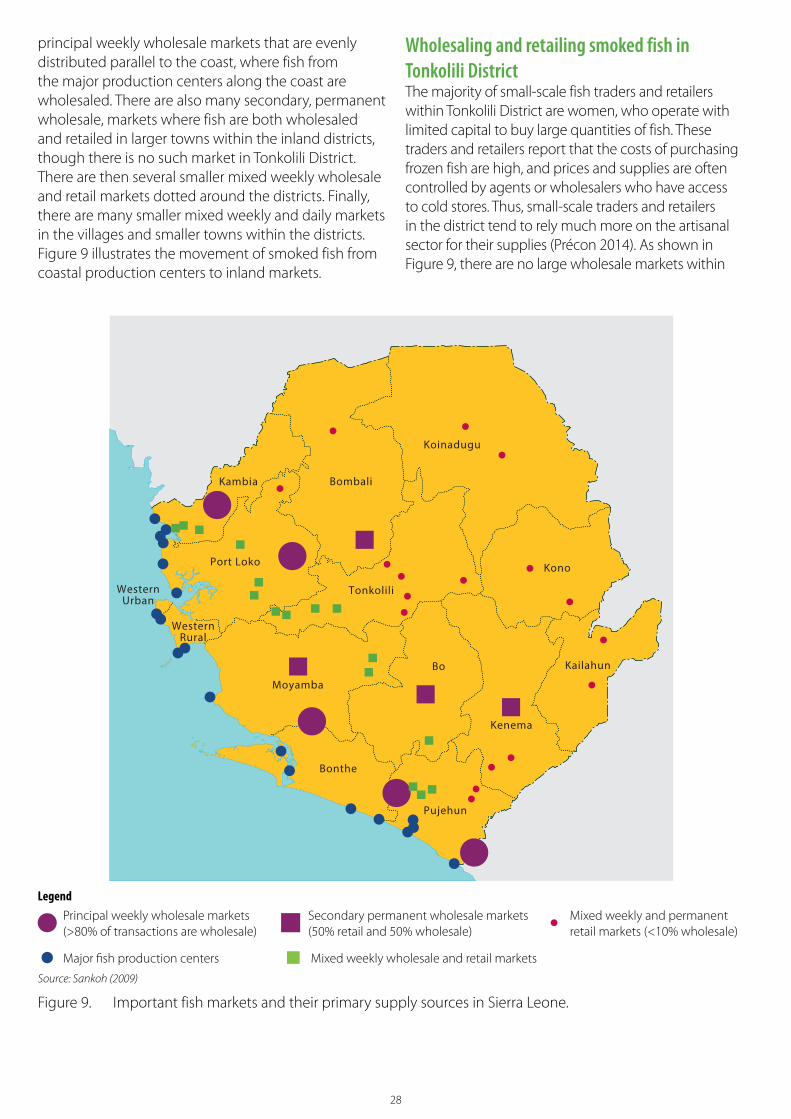
28
principal weekly wholesale markets that are evenly distributed parallel to the coast, where fish from the major production centers along the coast are wholesaled. There are also many secondary, permanent wholesale, markets where fish are both wholesaled and retailed in larger towns within the inland districts, though there is no such market in Tonkolili District. There are then several smaller mixed weekly wholesale and retail markets dotted around the districts. Finally, there are many smaller mixed weekly and daily markets in the villages and smaller towns within the districts. Figure 9 illustrates the movement of smoked fish from coastal production centers to inland markets.
Wholesaling and retailing smoked fish in Tonkolili DistrictThe majority of small-scale fish traders and retailers within Tonkolili District are women, who operate with limited capital to buy large quantities of fish. These traders and retailers report that the costs of purchasing frozen fish are high, and prices and supplies are often controlled by agents or wholesalers who have access to cold stores. Thus, small-scale traders and retailers in the district tend to rely much more on the artisanal sector for their supplies (Précon 2014). As shown in Figure 9, there are no large wholesale markets within
Pujehun
WesternUrban
WesternRural
Bombali
Bo
Kambia
Moyamba
Kono
Koinadugu
Kenema
Port Loko
Bonthe
Tonkolili
Kailahun
Figure 9. Important fish markets and their primary supply sources in Sierra Leone.
Major fish production centers
Principal weekly wholesale markets (>80% of transactions are wholesale)
Mixed weekly and permanent retail markets (<10% wholesale)
Mixed weekly wholesale and retail markets
Secondary permanent wholesale markets (50% retail and 50% wholesale)
Source: Sankoh (2009)
Legend
29
Tonkolili District, and the majority of wholesalers there obtain smoked fish directly from the Tombo fishing community. These wholesalers predominantly serve as intermediaries between fish mammies in Tombo and retailers in Tonkolili. Most wholesalers and traders have agreements with fish mammies for the collection and marketing of fish. They purchase smoked fish on a weekly basis from fish mammies and sell it to retailers in the districts at the various periodic/weekly markets. Smoked fish is then distributed and sold at local markets by a network of retailers. Often, because of the time between first processing and the actual sale, the fish must be re-smoked to prevent spoilage. The re-smoking does not add value to the fish, but instead dries it out to extend the shelf life, which degrades the value of the product.
In general, fish retailers sell daily at fixed markets, rotate between different weekly markets, sell by the roadside or sell door to door or village to village. FGDs with fish wholesalers, retailers and consumers in Tonkolili found that fish are mainly sold in the local markets and around the communities by itinerant traders/hawkers, but also sold weekly in the luma. However, the majority of participants in the consumer FGDs reported they sometimes have to go to the luma to purchase fish because it is unavailable in their communities, especially during the low season.
The most common fish reported to be sold within the communities in Tonkolili are smoked bonga, herring, lati, the high value good fish and sometimes freshwater catfish. Of these, herring and bonga are the most common and are reported to be available year-round.
Wholesaling and retailing raw iced fish in Tonkolili DistrictThere are two main types of wholesaler/cold store operators supplying raw, iced fish to Tonkolili District: agents linked to particular fish companies on the Freetown Peninsula (e.g. Sierra and Kombra Fishing Companies, as discussed above) and private individuals who source their fish from multiple companies. Key informant interviews indicate that 60% of the Sierra Fishing Company’s fish is transported to the provinces (while 40% is marketed in Freetown), half of which is marketed through cold stores owned by Sierra Fishing and the other half sold to independently owned cold stores. In 2014, the Sierra Fishing Company was landing approximately 2000–2500 t/month to be marketed domestically (Précon 2014).
Some agents directly transport fish from Freetown to regional cold stores in Makeni, Bo, Kono, Kenema and
elsewhere (where there is a good supply of electricity) in refrigerated trucks or trailers that are either hired or owned by the company directly to be distributed by local wholesalers and retailers. For Tonkolili District, most agents servicing the district with frozen/iced fish have district sub-hubs in Makeni and or Magboraka. There are two agents with cold stores in Makeni and Bo who sell frozen fish in cartons sourced from the same Freetown-based company that supplies frozen fish (herring) from a Russian fleet. The agent sells to retailers strictly on a cash basis. Frozen fish sold in the southern part of Tonkolili District (e.g. Mile 91, Yele) is supplied either from the cold stores in Bo or Makeni. The Makeni agent also supplies frozen chickens.
In addition to these agents, there are approximately five private, individually or family-owned cold store operators in Makeni and one in Magburaka supplying frozen fish in cartons and bags from a range of companies. These cold store operators sell to individual retailers from Tonkolili and other districts on a cash or credit basis, depending on the relationship. Some retailers can get boxes on credit and pay the agent after the boxes are sold. Credit may be provided for a maximum of four days with an interest of SLL 5000 or 5% per carton (ibid.). Retailers usually buy one or two cartons each from these cold stores to sell fresh on the market.
Retailing raw fish has a different dynamic from retailing smoked fish. Few retailers have access to ice or cold storage, so the fish lose value very quickly. If fish are not sold within two or three days, retailers will dry or smoke them before they spoil further. However, such processing attempts only make the price continue to drop. Overall, it is clear that consumers in inland areas are getting inferior quality fish.
Storage and handling of marine fishAgents and fish mammies do not generally practice proper handling by ensuring fish are kept on ice before smoking, because there is no real economic incentive or legal obligation to do so. In general, smoked fish traders and retailers use baskets made of palm leaves as the main packaging material for storage and transport. These baskets can hold 10–100 dozen fish (the total weight varies depending on the size of the fish). General markets lack adequate provisions for selling perishable products like fish, so leftover fish are poorly stored and often just covered with thatch or plastic sheets to keep them dry. The material used for packing does not protect products from spoilage, insect damage or infestation, especially in the rainy reason, when postharvest losses are reported to be high.

30
Although a lack of access to ice was not reported as a problem by fishers and fish mammies/agents, catch and transport estimates suggest there is not enough ice producing capacity to supply the artisanal fishing industry and distribution network (ibid.). Given the limited financial incentive to handle fish that are to be smoked properly, it is likely that the use of ice is not a priority for most value chain actors. This may explain the high level of smoked and dried fish against “fresh” produce in local markets, especially inland.
Some cold storage facilities exist in Makeni and are owned by Lebanese businessmen (Sankoh 2009). Special arrangements can be made with the cold store owners in case cartons cannot be sold in one day.
Transportation of marine fishFish are transported by road in a variety of vehicles: refrigerated and/or insulated trucks (e.g. for fish from the industrial sector being distributed to inland cold stores),
pickup trucks, private vehicles, public transport and taxis as well as bicycles and motorcycles (okada). Female traders often have a contract with a driver for transport and distribution. Traders of smoked/dried fish often travel with the consignment (Précon 2014).
The two main types of transportation are motorcycles, which have the capacity to carry four cartons of frozen fish in one trip, and public transport vehicles, which can carry 15 cartons. These motorcycles and vehicles transport fish (frozen and smoked), rice, palm oil, fuel and vegetable traders. Motorcycles mainly supply the remote areas.
Depending on the amount of fish, transporting a 30 kg carton of frozen fish in a public transport vehicle from regional or district cold stores to nearby markets is approximately SLL 3500 per carton and SLL 30,000 per basket of smoked fish. Motorcycles charge about SLL 4000–5000 per carton. In general, prices increase
30
Dried bonga fish being sold in a daily market in Makeni in Bombali District.
Phot
o cr
edit:
Mon
ica
Pasq
uial
ino/
Wor
ldFi
sh
30
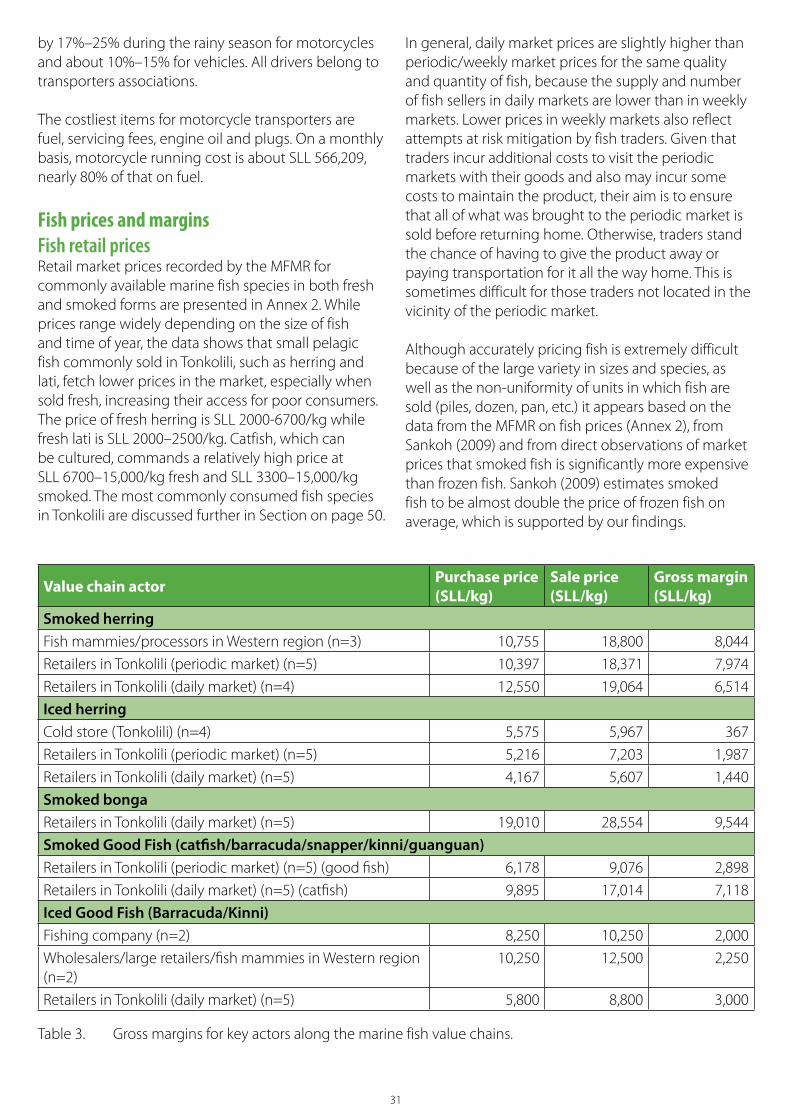
31
by 17%–25% during the rainy season for motorcycles and about 10%–15% for vehicles. All drivers belong to transporters associations.
The costliest items for motorcycle transporters are fuel, servicing fees, engine oil and plugs. On a monthly basis, motorcycle running cost is about SLL 566,209, nearly 80% of that on fuel.
Fish prices and marginsFish retail pricesRetail market prices recorded by the MFMR for commonly available marine fish species in both fresh and smoked forms are presented in Annex 2. While prices range widely depending on the size of fish and time of year, the data shows that small pelagic fish commonly sold in Tonkolili, such as herring and lati, fetch lower prices in the market, especially when sold fresh, increasing their access for poor consumers. The price of fresh herring is SLL 2000-6700/kg while fresh lati is SLL 2000–2500/kg. Catfish, which can be cultured, commands a relatively high price at SLL 6700–15,000/kg fresh and SLL 3300–15,000/kg smoked. The most commonly consumed fish species in Tonkolili are discussed further in Section on page 50.
In general, daily market prices are slightly higher than periodic/weekly market prices for the same quality and quantity of fish, because the supply and number of fish sellers in daily markets are lower than in weekly markets. Lower prices in weekly markets also reflect attempts at risk mitigation by fish traders. Given that traders incur additional costs to visit the periodic markets with their goods and also may incur some costs to maintain the product, their aim is to ensure that all of what was brought to the periodic market is sold before returning home. Otherwise, traders stand the chance of having to give the product away or paying transportation for it all the way home. This is sometimes difficult for those traders not located in the vicinity of the periodic market.
Although accurately pricing fish is extremely difficult because of the large variety in sizes and species, as well as the non-uniformity of units in which fish are sold (piles, dozen, pan, etc.) it appears based on the data from the MFMR on fish prices (Annex 2), from Sankoh (2009) and from direct observations of market prices that smoked fish is significantly more expensive than frozen fish. Sankoh (2009) estimates smoked fish to be almost double the price of frozen fish on average, which is supported by our findings.
Table 3. Gross margins for key actors along the marine fish value chains.
Value chain actor Purchase price (SLL/kg)
Sale price (SLL/kg)
Gross margin (SLL/kg)
Smoked herringFish mammies/processors in Western region (n=3) 10,755 18,800 8,044
Retailers in Tonkolili (periodic market) (n=5) 10,397 18,371 7,974
Retailers in Tonkolili (daily market) (n=4) 12,550 19,064 6,514
Iced herringCold store (Tonkolili) (n=4) 5,575 5,967 367
Retailers in Tonkolili (periodic market) (n=5) 5,216 7,203 1,987
Retailers in Tonkolili (daily market) (n=5) 4,167 5,607 1,440
Smoked bongaRetailers in Tonkolili (daily market) (n=5) 19,010 28,554 9,544
Smoked Good Fish (catfish/barracuda/snapper/kinni/guanguan)Retailers in Tonkolili (periodic market) (n=5) (good fish) 6,178 9,076 2,898
Retailers in Tonkolili (daily market) (n=5) (catfish) 9,895 17,014 7,118
Iced Good Fish (Barracuda/Kinni) Fishing company (n=2) 8,250 10,250 2,000
Wholesalers/large retailers/fish mammies in Western region (n=2)
10,250 12,500 2,250
Retailers in Tonkolili (daily market) (n=5) 5,800 8,800 3,000
32
Gross marginsTable 3 presents data on purchase and sale prices of popular fish in Tonkolili, as well as gross margin estimates from key actors along the marine fish value chain: fish mammies in Western region and retailers in periodic and daily markets in Tonkolili. The data does not present an accurate picture of gross margins along the marine fish value chains because of the small sample sizes and wide variation in fish prices based on size, species and seasonality. However, the data does provide some insights into the relative size of gross margins for smoked and iced fish and between different value chain actors.
The gross margin for fish mammies who process smoked herring is similar to that of the retailers in Tonkolili. However, data from key informant interviews with value chain actors (traders and retailers) and other studies (e.g. Précon 2014) suggests agents, fish mammies and wholesalers control the smoked marine fish value chain and have significantly more power than small-scale retailers at the end of the chain. Given the small sample size and wide variety of prices, it is likely that fish mammies have higher margins than retailers at the end of the value chain. These retailers have to accept the quality of the fish being sold to them and often have to re-smoke the product to prevent spoilage. While fish mammies incur costs of smoking and processing, retailers also have to bear additional costs of transportation, market dues and storage, further reducing their net margins. As discussed earlier, fish mammies often have arrangements with fishers that allow them to buy fish at low prices. Précon (2014) estimates the price of fish from fishers or agents is likely to be 30% of the final retail value, which is similar to the data presented here.
As noted above, the price of fresh/iced fish is significantly lower than smoked fish. Table 3 shows that this price difference is also reflected in lower margins for fresh/iced fish when compared to smoked fish.
The gross margins for retailers in periodic and daily markets are similar for smoked and iced herring and iced good fish. The margins for smoked good fish (catfish) for retailers at the daily market are higher than for retailers at the periodic market, which suggests that margins for smoked catfish are generally higher than for other types of higher value fish. The retail margins for smoked bonga are also significantly higher than those for smoked herring.
Overall, margins are likely to be higher for fish mammies than retailers, for smoked fish than fresh fish and for smoked bonga than smoked herring.
Key constraints in the marine fish value chainBased on the findings presented above and the outcome of the Fish Value Chain Validation Workshop, key constraints identified in the marine fish value chain are presented below.
Poor overall fisheries management• There is a lack of stock assessments to understand
the availability of stocks and formulate effective fisheries management measures.
• Fisheries management practices are unsatisfactory.• Inadequate technical knowledge of fishers on
fishing gear technology to employ environmentally friendly and effective fishing gear leads to destructive and illegal fishing (e.g. use of unselective monofilament nets).
• Ineffective MCS and poor fishery policies and governance lead to high levels of IUU fishing.
Poor input supply• Inadequate and expensive supplies of fishing gear
(nets and accessories) means fishers choose cheaper and harmful gear, fishing methods and equipment.
• Low quality boat manufacturing and the high cost of outboard engines and fuel limit the speed at which fresh fish is delivered to landing sites.
• Inadequate lifesaving equipment on fishing boats leads to potential loss of life in the event of an accident.
• Intermittent electricity makes investments in the processing and cold storage of fish and fish products too risky.
• The high costs of diesel for generators further reduce the viability of cold storage enterprises and constraining new investments.
High postharvest losses from poor postharvest fish handling and inadequate primary processing• Fish are poorly handled on the boats. Netting such
as gill nets used by fishers is not always specific to the fish they catch, so the fish are damaged when fishermen remove them from the net.
• Fish are poorly handled upon landing. Most of the postharvest losses occur at the landing site where fish are dropped directly onto the sand and are not put on ice.
• Inadequate primary processing of fish fails to preserve the postharvest quality of fish, which increases postharvest losses.
33
Inefficient processing methods have significant environmental costs and result in poor product quality• Use of large quantities of mangrove wood for
fish smoking has both cost and environmental implications. The majority of smoking ovens used are traditional or hybridized banda ovens,8 which are not as efficient as Chokor9 or Altona ovens.10 In other parts of West Africa, fish processors use much more efficient ovens with up to 10 stacked frames, which are covered with sheets to encourage smoke circulation. As a result, fish products in Sierra Leone are burned rather than smoked and therefore of poor quality.
Poor storage and transportation • Inadequate cold storage facilities and a lack of
formal credit and financial support to invest in postharvest quality lead to losses.
• Poor road networks and vehicles with few refrigerated trucks and cold storage facilities mean there is an inadequate supply of good quality fresh and frozen fish to inland areas such as Tonkolili.
• The shelf life of smoked fish is limited after transportation by open trucks and motorcycles on bad roads (results in breakages), particularly in the rainy season.
Unequal power within the value chain and limited market information • In the artisanal value chain, the agents and fish
mammies have the most power. In the industrial fishing chain, the fishing companies have the most power because they own large cold rooms and so can manufacture scarcity and increase prices.
• Small-scale retailers who sell the fish in the local markets, namely those in Tonkolili District, pay for the costs accumulated along the chain (e.g. commissions for agents and fish mammies, postharvest losses and transportation) while also having to accept the quality of the fish offered. The businesses of these retailers remain small and confined to local markets and clients. These small-scale traders and retailers are dependent on the more powerful actors (e.g. fish mammies), who dominate the value chain.
• There is a lack of market and price information available to smaller fish processors and traders as a result of price volatility based on fish catch. Traders may buy fish at a certain price not knowing that in another landing site the price could be much lower. When traders sell at a market where retailers are selling fish from other landing sites, they will have to reduce the price and therefore the profit margin.
Low quality fish going to inland areas• The perishability of the product and poor
postharvest handling practices discussed above suggest that fish transported and marketed to inland areas such as Tonkolili are of inferior quality.
Limited access to credit• Credit is expensive (commercial interest rates are
18%–20%) and not tailored to the requirements of the sector and small and medium enterprises, which means fish value chain actors are unable to develop their businesses. Value chain actors rarely obtain credit through formal channels and rely instead on informal financial arrangements between fishermen, fish processors and traders and osusus or market associations.
34
At present, wild caught freshwater fish production is low and is used mostly for home consumption. Therefore, the value chain is undeveloped, especially when compared to the marine fish value chain. Given the immature nature of the wild caught freshwater fish value chain in Sierra Leone, the following section is relatively limited in detail and provides a broad overview of the sector.
Overview of wild caught freshwater inland fisheriesNational inland fisheries production is estimated at about 15,000 t/year, with a quarter coming from lakes and three quarters from riverine areas and flood plains (EPLSL 2014). Estimates of production from inland fisheries are unreliable and likely underestimated, because the MFMR does not collect primary data on inland fisheries production since their main focus is on the more lucrative marine sector. Inland fishing is undertaken throughout the country, anywhere where suitable water bodies are present. In riverine villages, consumption of freshwater fish provides the main source of animal protein.
Fishing is seasonal, with most fish caught in the dry season between October and February when the water levels in rivers, streams and wetlands decrease. For perennial streams, the cycle is slightly longer. Nearly 90% of IVSs in Tonkolili District are perennial with 11–12 months of running water. Fishing in these IVSs occurs throughout the year while more households report they fish in the dry season that the rainy season (WorldFish 2016). Despite this seasonality, inland fisheries appear to be important localized sources of fish, crabs and other aquatic products in some inland districts.
There are two types of aquatic environments in Sierra Leone: freshwater lakes and rivers. There are eight major river basins and 11 freshwater lakes in the country. The major river systems are the Great Scarcies, Jong (Maboleh) River, Little Scarcies, River Rokel (Seli), Kpamgbai River, Sewa River and Mano River, and 16 families of fish comprising around 100 species have been identified in the freshwater ecosystem (EPASL, 2014). The major fish species include Brycinus longipinnus (Gunther, 1864) (longfin tetra), Hepsetus odoe (Bloch, 1794) (African pike), Ctenopoma kingsleyae (Gunther, 1896) (Tailsopt ctenopoma), Polypterus palmas (shortfin bichir), Hemichromis fasciatus
Wild caught freshwater fish value chain analysis
(banded jwelfish), tilapia spp., Clarias gariepinus (Burchell, 1892) (North African catfish), Clarias laeviceps (Gill, 1862) (catfish) and Mormyrus microcephalus Worthington, 1929) (magbukpui, mahereh, n’heren). There are also several species of catfish (Bagrus baya (Forsskal, 1775), Synodontis nigrita (Velenciennes, 1840), Clarias platycephalus (Boulenger, 1902), and Chrysichthysnigrodigitatus (Lacepede, 1803)) found in lakes, rivers and lagoons (Payne 1986). The FishBase country checklist for freshwater fish species in Sierra Leone consists of 174 species and identified three species as endemic: Kribia leonensis (Boulenger, 1916), Marcusenius meronai (Bigorne and Paugy, 1990) and Prolabeo batesi (Norman, 1932), none of which is listed as threatened in the International Union for Conservation of Nature (IUCN) Red List classification. However, Iscandri (1990) identified 18 freshwater fish species as endemic. This indicates the need for a systematic study to prepare an inventory of freshwater species in Sierra Leone with status (native/indigenous and endemic) of species to plan and develop inland freshwater fisheries, management and conservation.
Payne (1986) identified 42 freshwater species in the lower stretches of the Pampana/Taia River system in Tonkolili District. Taia is a relatively short forest river flowing in a southeasterly direction across Tonkolili District in central Sierra Leone. Near its source, the river is called the Pampana, whereas farther along its course it is called the Taia River, which joins the Jong River before flowing into the Atlantic Ocean at the Sharbro Estuary. The closest neighboring river basin is the Rokel/Seli immediately northeast and only 10 km apart from the Pampana/Taia at Magburaka, the main town of Tonkolili District.
As in most African rivers, Cichlidae (tilapia), Cyprinidae (carps), Mormyridae (elephant-noses), Characidae (tetras and similar) and Clariidae (catfish) are likely to be the most important families in the Pampana/Taia river system in Tonkolili District, and the greatest number of species will occur along the middle reaches of the river since this is normally the most diverse part (Sankoh 2009). At different times of the year, the middle reaches can include permanent and semipermanent resident species as well as temporary visitors (e.g. fish species that normally live in the estuary or the coast but enter the lower river to breed, or species that are carried down from the upper reaches by floods during heavy rains).
35
The most widely distributed fish species in the Pampana/Taia system are likely to be banded jwelfish, Synodontis clarias (Linnaeus, 1758) (Mandi) and Clarias anguillaris (Linnaeus, 1758) (mudfish), which are found upstream and downstream and are species known to adapt to a wide range of environmental conditions. In the upper sections of the system, species such as Hemichromis bimaculatus (Gill, 1862) (jwelfish), Labeo chariensis (Pellegrin, 1904) and Petrocephalus simus are likely to be prevalent, whereas banded jwelfish and Mormyrus sp, are mainly in the center reaches of these rivers and Hydrocynus (tigerfish) and African pike are more widely distributed in the middle and lower reaches (ibid.).
Based on key informant interviews conducted, the main species of fish caught in inland fisheries are tilapia, estimated at 60%, and catfish, estimated at 30%, with the remainder including cutlassfish (Notopterus asp.), slippery fish (Clarias spp.), electric fish and mullet. The fish are generally consumed fresh by the family and friends of fishers and so the value chain remains simple and localized.
Households in nine out of the 11 chiefdoms included in the fish producer survey reported to engage in wild freshwater fishing, and over 85% of the 598 households sampled in Tonkolili District for the WorldFish IVS assessment reported to engage in fishing in IVSs (WorldFish 2016). It is thought that fishing is particularly concentrated among communities along the shores beside the two main rivers (Pampana and Rokel) in the district.
InputsWith the exception of imported nets, as well as hooks and lines, that might be used on larger water bodies, inputs for wild caught fishing are mainly locally made and use local materials. The survey found that fishing gear used includes set nets, gill nets, current traps, valve net traps, triggered traps, cast nets, fencing, long lines, hook and line, and fixed bag nets.
ProductionFish are caught by men, women and children, and also communally by groups through various methods. Men use locally made traps set within a fence constructed across a watercourse and locally made cast nets from imported netting. Women use locally made fish pots baited with worms or palm fruits as well as locally made scoop nets, often fishing above a fence or in a trap pond previously dug in the dry season along a seasonal watercourse. Boys use baited hook and line. Fishing in IVSs is an almost wholly a female affair.
Women are responsible for preparing fishing nets, fishing, processing and, if the catch is substantial, sales.
While inland fishing occurs in almost all districts in Tonkolili, the survey revealed that Gbonkonlenken accounts for the largest average production of all chiefdoms. Yoni has the most and Gbonkonlenken third-most waterways in the district, presumably providing a significant source of freshwater fish in the dry season.
FGDs in almost all communities surveyed revealed that the head of the extended family sometimes bans fishing in particular swamps for specified periods based on their local knowledge. This practice is intended to prevent overfishing and allow restocking.
MarketingIn all communities of the district, capture fisheries are reported to be almost exclusively for household consumption and only small quantities of fish (10%–20%) enter the local market (WorldFish 2016a). In some communities, wild fish is seen as a delicacy and so preferred over all other sources of fish when it is in season. Wild freshwater fish tends to be traded fresh, though small quantities might be smoked in some areas. Smoked wild freshwater fish fetches an even higher price than fish from the coast during the dry season. Overall, consumers prefer catfish.
Generally, those who sell wild freshwater fish are women from the communities where fish is caught. Given the short distances involved, it is typically head-loaded and transported by foot or motorcycle.
The largest inland landing site in the country is at Gbondapi in Pujehun District. Traders buy fish from Gbondapi in bulk, put it on ice and then smoke approximately 90% of it for retail. Fishers sell to fish mammies, who then smoke and sell the fish. Some of these fish mammies are the wives of fishermen.
Key constraints in the wild caught inland freshwater fish value chainBased on the findings presented above and the outcome of the Fish Value Chain Validation Workshop, the key constraints identified in the wild caught freshwater fish value chain are presented below.
Limited data and knowledge on inland fisheries • Very little is known about the inland fisheries sector,
and there is a shortage of official data on fish stocks, species, supply, demand, prices, etc.

36
• There is no updated freshwater fish species inventory with status of species, whether endemic or native/indigenous and resident or migratory. This prevents effective planning for the development of inland freshwater fisheries as well as management and conservation of stocks.
• There are knowledge gaps with respect to floodplain dynamics and their role in inland fisheries enhancement. There are also gaps in the knowledge of fish populations and productivity within IVSs and associated rice field systems.
Unsustainable fishing practices • The use of nonselective fishing gear, such as fences
and gill nets with small mesh sizes, is a concern for fish resource conservation. Most of the rainy season fishing in floodplains may have a negative impact on the breeding populations.
• Ineffective enforcement of fishing gear regulation and protection of breeding and spawning grounds has led to destructive fishing practices.
36
Fish harvest from a pilot fishpond in Machen in Tonkolili District.
Phot
o cr
edit:
Sun
il Si
riwar
dena
/Wor
ldFi
sh
36
Habitat destruction• Mining activities in Tonkolili District have caused a
reduction in fish stocks in rivers and streams from shrinkage in floodplain areas and habitats suitable for breeding and spawning. Further plans for dams and water management schemes may reduce habitat even more. Mining activities also make rivers and streams prone to pollution.
Limited capacity for inland fisheries management and conservation of fish stock• There is a capacity building gap in inland fisheries
management, including stock enhancement practices.
Inadequate input supplies• There are inadequate supplies of fishing gear, such
as nets and crafts, for fishers to engage in fishing.
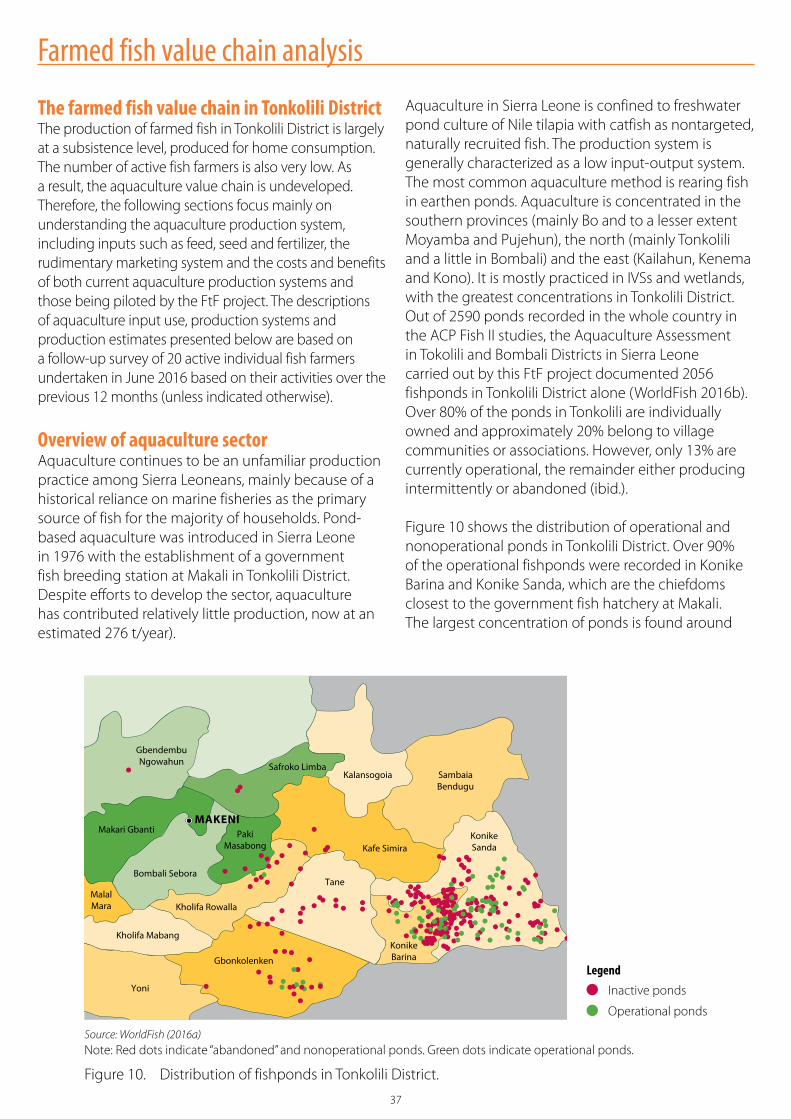
37
The farmed fish value chain in Tonkolili DistrictThe production of farmed fish in Tonkolili District is largely at a subsistence level, produced for home consumption. The number of active fish farmers is also very low. As a result, the aquaculture value chain is undeveloped. Therefore, the following sections focus mainly on understanding the aquaculture production system, including inputs such as feed, seed and fertilizer, the rudimentary marketing system and the costs and benefits of both current aquaculture production systems and those being piloted by the FtF project. The descriptions of aquaculture input use, production systems and production estimates presented below are based on a follow-up survey of 20 active individual fish farmers undertaken in June 2016 based on their activities over the previous 12 months (unless indicated otherwise).
Overview of aquaculture sectorAquaculture continues to be an unfamiliar production practice among Sierra Leoneans, mainly because of a historical reliance on marine fisheries as the primary source of fish for the majority of households. Pond-based aquaculture was introduced in Sierra Leone in 1976 with the establishment of a government fish breeding station at Makali in Tonkolili District. Despite efforts to develop the sector, aquaculture has contributed relatively little production, now at an estimated 276 t/year).
Farmed fish value chain analysis
Aquaculture in Sierra Leone is confined to freshwater pond culture of Nile tilapia with catfish as nontargeted, naturally recruited fish. The production system is generally characterized as a low input-output system. The most common aquaculture method is rearing fish in earthen ponds. Aquaculture is concentrated in the southern provinces (mainly Bo and to a lesser extent Moyamba and Pujehun), the north (mainly Tonkolili and a little in Bombali) and the east (Kailahun, Kenema and Kono). It is mostly practiced in IVSs and wetlands, with the greatest concentrations in Tonkolili District. Out of 2590 ponds recorded in the whole country in the ACP Fish II studies, the Aquaculture Assessment in Tokolili and Bombali Districts in Sierra Leone carried out by this FtF project documented 2056 fishponds in Tonkolili District alone (WorldFish 2016b). Over 80% of the ponds in Tonkolili are individually owned and approximately 20% belong to village communities or associations. However, only 13% are currently operational, the remainder either producing intermittently or abandoned (ibid.).
Figure 10 shows the distribution of operational and nonoperational ponds in Tonkolili District. Over 90% of the operational fishponds were recorded in Konike Barina and Konike Sanda, which are the chiefdoms closest to the government fish hatchery at Makali. The largest concentration of ponds is found around
Figure 10. Distribution of fishponds in Tonkolili District.
Source: WorldFish (2016a) Note: Red dots indicate “abandoned” and nonoperational ponds. Green dots indicate operational ponds.
Inactive ponds
Operational ponds
Legend

38
Makali, where there are several active clusters of fish farmers operating with low input-output systems. The current concentration of fishponds has been influenced by several factors, including access to water and expectation of being funded by NGO projects. Functional hatchery and technical support from the Makali State fish farm is believed to be the primary factor responsible for the proliferation of fishponds in two chiefdoms, Konike Barina and Konike Sanda, around Makali, rather than the application of site suitability criteria. Approximately 92% of operational fish farms were recorded in these two chiefdoms (ibid.). This is further supported by the drastic decrease in the number of operational ponds since 2009 (Figures 15 and 16) largely from the nonoperational status of the Makali State fish farm and the lack of seed supply and technical support (ibid.).
InputsFry and fingerlingsSierra Leone’s fry and fingerling supply is severely limited and inconsistent. In Tonkolili, it is estimated that the current supply of fish seed satisfies only 34% of demand (FAO 2015). Farmers get fingerlings from a range of sources. Several private fish farmers, who are also IVS rice farmers, produce and sell limited quantities of tilapia fingerlings by regularly harvesting small, naturally bred individuals from their ponds. However, this method is detrimental to the genetic quality of following generations because of the use of both wild and domesticated tilapia species and the lack of scientific breeding and selection, which lead to poor quality fingerlings and low yields.
There are five private fingerling suppliers in Tonkolili District located in four chiefdoms: Kholifa Rowalla, Konile Barina, Konike Sanda and Samba Bendugu. The main supplier is a woman located in the Konike Sanda chiefdom. All the other suppliers reported that they obtain their fingerling supply from her to resell.
State fish farms in Makali and Bo currently do not have specific fish hatchery facilities, and Nile tilapia fingerlings are produced in both by natural breeding in ponds. At the time of the first survey in September 2015, the Makali hatchery was not producing any seed because the irrigation canal used as the water supply was closed for the construction of new turbines at the Makali dam. However, the FtF project has been supporting the Makali hatchery since January 2016, and it produced 90,000 fingerlings between May and July 2016 and supplied 45,000 fingerlings to stock 45 community ponds.11
Of the 20 active fish farmers surveyed in June 2016, 95% stocked tilapia fingerlings while only 5% stocked catfish fingerlings. The average stocking density of the farmers surveyed was 1 fingerling per m2. The main source of tilapia fingerlings for 55% of farmers is other farmers, while 20% get their fingerlings from their own ponds, 15% from government hatcheries (at Makali and Bo) and 10% from the wild, especially at the time of floodplain inundation and because catfish fingerlings are sourced solely from the wild. All farmers use mixed-sex tilapia fingerlings. The survey found that on average one tilapia fingerling is sold for approximately SLL 600 (with prices ranging from
Figure 11. Trend in operational status of fishponds in Tonkolili District. Figure 12. Trend in fishpond development in Tonkolili
District.
% operatonal ponds % abandoned ponds
2005 2009 2015
100
90
80
60
70
50
40
30
20
10
0
Total number of ponds
Operatonal ponds
Abandoned ponds
2005 2009 2015
3000
2500
2000
1500
1000
500
0
Legend Legend

39
SLL 100 to 2000). In general, tilapia fingerling prices vary between SLL 200 and 600 while catfish fingerling prices vary between SLL 1000 and 2000 depending on the size.
Fish feedFish feed is the most important input in fish farming in terms of cost (Table 10 and Table 13). The provision of high quality feeds or at least reasonably processed, farm-made feed is necessary for increasing production yields, lowering production costs, improving economic returns and lessening risk. Fish feed formulation and preparation in Sierra Leone is underdeveloped at best. There is no fish feed manufacturing or reasonably processed, appropriate farm-made feed. Various donor-funded projects have imported manufactured feeds, but these have not been widely available on a regular basis.
Nearly all (95%) of the farmers surveyed reported feeding fish daily or every two days while the rest (5%) reported limited feeding or none at all. They feed their fish rice bran (100%), fish termites (95%), cassava flour (75%), cassava, sweet potato or other leaves (55%), palm kernels (35%), meal (20%) and on-farm formulated feed (15%). Nearly half (45%) reported using other feeds, including bulgur, millet, sliced cassava, corn, cooked rice, mango and orange peel. Three-quarters of farmers use only one feed ingredient at each feeding time, while the remaining 25% use two or more ingredients mixed together. In general, rice bran, cassava, millet and maize are sourced from farmers’ own production. Rice bran, cassava and bulgur are also purchased. Farmers use household or hired labor to collect termites and ants. However, it should be noted that feeding with a single plant origin feed ingredient or termites has little benefit in terms of increasing fish yield. Farmers using rice bran without separating the husk do more harm than good. Mixing several ingredients together to feed fish without due consideration of the nutritional requirements of the target species also adds little benefit. In both cases, the anticipated benefits would not be generated.
FertilizerFertilizing ponds with organic or inorganic fertilizer promotes the growth of algae on which fish can feed. Organic or inorganic fertilizer is used by 50% of the fish farmers surveyed while 15% use inorganic fertilizer. Unfortunately, there is limited availability and accessibility of organic and inorganic fertilizer in Tonkolili District compared to other districts in the Northern Region where households have more livestock, so farmers get organic fertilizer from their
backyards instead. Inorganic fertilizer is generally too expensive for smallholder farmers to purchase at the market price. Fertilizer prices in Tonkolili are pushed up because of the presence of large marijuana farms in the district. Marijuana is a highly valued product, and marijuana farmers pay an extra premium for fertilizer. A black market for fertilizer has developed, given the lack of a regulatory enforcement framework to guide fertilizer policy, and because fertilizer shortages, which are common within the formal system, prevent farmers from accessing it at the officially subsidized rate, thus making it unaffordable for most smallholder farmers.
LandLand tenure in Sierra Leone has a dual ownership structure. Land in Western Area is held under the English freehold concept while land in the other districts is held through communal ownership under customary tenure (the land tenure system is discussed in more detail in Section on page 56). Most communities in Tonkolili District practice a communal land ownership system, and most land is owned by a single household or extended households. In some cases, freehold ownership was recorded, such as in Mashengbi in the Konike Sanda chiefdom, Yoni in the Yonibana chiefdom, Yoni in the Mafonday chiefdom and Bumbuna in the Kalasogoia chiefdom.
Although the constitution grants women equal property rights, they rarely have full access to land (SIGI 2015). In contrast to other communities in the district, equal rights in land tenure between men and women was reported in Yele in the Gbonko Lenken chiefdom, Mayepoh in the Gbonko Lenken chiefdom and Yoni in the Mafonday chiefdom (WorldFish 2016a).
In Tonkolili, land access for aquaculture is traditionally not a problem, and for group or communally managed ponds, the chiefdom elders make land available as and when needed. However, the ownership system can become problematic for group-managed ponds. FGDs revealed that when specific clans or families provide the land for the pond, they normally end up owning and benefitting from the pond if/when it is abandoned. FGDs also showed that group-owned ponds are not considered sustainable, unlike privately owned or individually managed ponds, which tend to stay active longer. There are comparatively few privately owned ponds, and in group-owned ponds the members neglect the day-to-day operational activities because they lack a sense of ownership.

40
Analysis of farm sizes for various crops reveals that farm units are typically small, which is consistent with the subsistence orientation of farming in Tonkolili District. Table 4 shows that the majority of farms, ranging from 51% for upland rice to 91% for cassava, are below 1 ha. The percentage of farms in the other size categories gets progressively lower with increasing size. Overall, household land areas range from 0.3 to 1.08 ha in IVSs and 0.48 to 1.56 ha in upland areas (WorldFish 2016a).
LaborIn pond fish farming, the main labor requirements are in the manual construction of ponds, daily pond maintenance such as feeding the fish, detection of any fish diseases and mortalities, and harvesting. Men play an active role in the construction and management of fishponds while women and children generally carry out the day-to-day maintenance, including searching for termites to feed the fish. In some cases, hired labor
is employed to collect termites. Household labor, both male and female, is commonly used for harvesting fishponds, though supplementary hired labor is often required and paid in kind (e.g. 10% of the harvest is shared between those hired).
CreditOverall, less than 7% of the 260 fish farmers surveyed in September 2015 had received a loan for their fish farming operations (of approximately SLL 170,000, on average). In general, sources of credit for fish farmers in Tonkolili are extremely limited. As shown in Table 5, in order of importance, these sources include informal loans from friends and family, informal savings and credit groups, bank loans, loans from cooperative societies and grants from international NGOs. The most important sources of funds for fish farming come from personal savings (58%) and friends or relatives (11%). Farmers rarely patronize banks for loans simply because of the interest rates, which can be as high as 40% (ibid.).
Table 4. Land area cultivated, by crop type.
Source: WorldFish (2016)Note: Typically, depending largely on labor availability, respondents simultaneously cultivate a number of the crops listed here.
CropLand area
NBelow 1 ha 1–2 ha 2–3 ha Over 3 ha
Palm oil 105 (52.8%)
64 (32.1%)
26 (13.1%)
4 (2.0%)
199
Upland rice 235 (51.4%)
148 (32.3%)
50 (10.9%)
24 (5.3%)
457
IVS rice 178 (56.9%)
89 (28.4%)
37 (11.8%)
9 (2.9%)
313
Cassava 107 (90.6%)
9 (7.6%)
2 (1.7%)
0 (0.0%)
118
Chinese yam 207 (80.6%)
41 (15.9%)
6 (2.3%)
3 (1.2%)
257
Sorghum 208 (80.3%)
42 (16.2%)
5 (1.9%)
4 (1.5%)
259
Av. % all crops 68.8% 22.1% 7.0% 2.2%
Table 5. Sources of credit facilities for farmers in Tonkolili District.
Credit sources PercentageBank loans 1.5
Cooperatives 1.3
Friends and relatives 11
International NGOs 0.2
Personal savings 58
Informal groups 2.3
Source: WorldFish (2016)
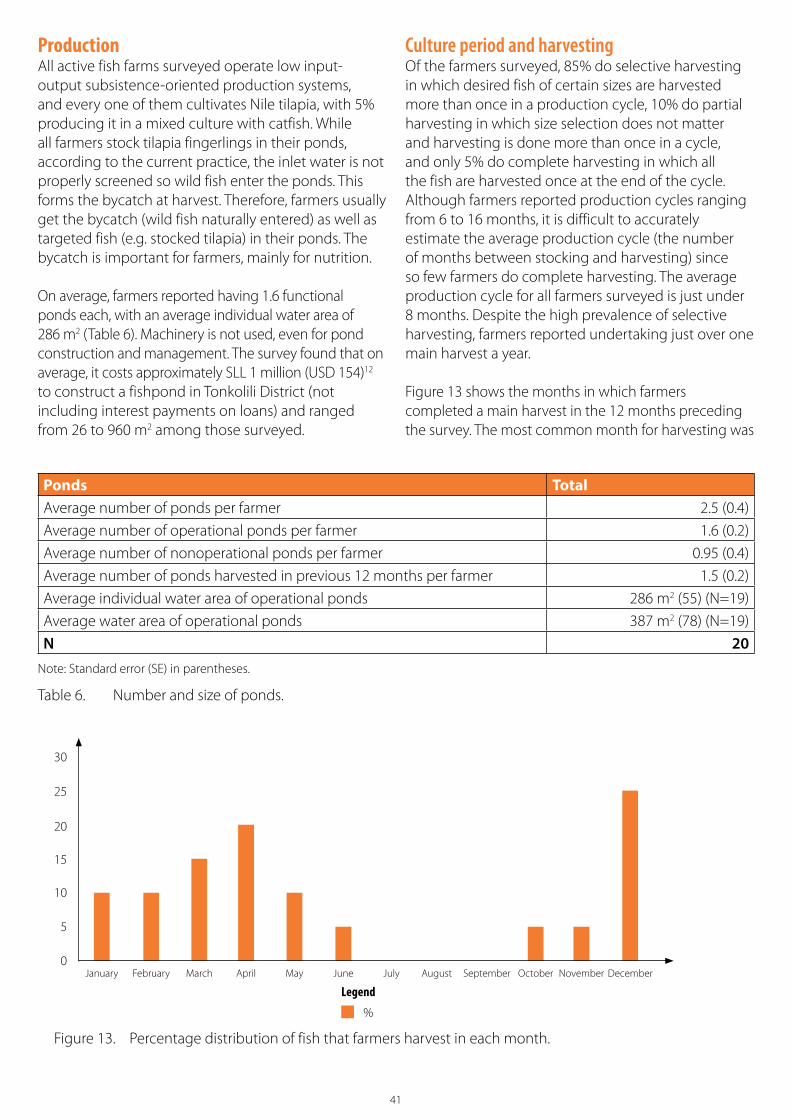
41
ProductionAll active fish farms surveyed operate low input-output subsistence-oriented production systems, and every one of them cultivates Nile tilapia, with 5% producing it in a mixed culture with catfish. While all farmers stock tilapia fingerlings in their ponds, according to the current practice, the inlet water is not properly screened so wild fish enter the ponds. This forms the bycatch at harvest. Therefore, farmers usually get the bycatch (wild fish naturally entered) as well as targeted fish (e.g. stocked tilapia) in their ponds. The bycatch is important for farmers, mainly for nutrition.
On average, farmers reported having 1.6 functional ponds each, with an average individual water area of 286 m2 (Table 6). Machinery is not used, even for pond construction and management. The survey found that on average, it costs approximately SLL 1 million (USD 154)12 to construct a fishpond in Tonkolili District (not including interest payments on loans) and ranged from 26 to 960 m2 among those surveyed.
Culture period and harvesting Of the farmers surveyed, 85% do selective harvesting in which desired fish of certain sizes are harvested more than once in a production cycle, 10% do partial harvesting in which size selection does not matter and harvesting is done more than once in a cycle, and only 5% do complete harvesting in which all the fish are harvested once at the end of the cycle. Although farmers reported production cycles ranging from 6 to 16 months, it is difficult to accurately estimate the average production cycle (the number of months between stocking and harvesting) since so few farmers do complete harvesting. The average production cycle for all farmers surveyed is just under 8 months. Despite the high prevalence of selective harvesting, farmers reported undertaking just over one main harvest a year.
Figure 13 shows the months in which farmers completed a main harvest in the 12 months preceding the survey. The most common month for harvesting was
Table 6. Number and size of ponds.
Ponds TotalAverage number of ponds per farmer 2.5 (0.4)
Average number of operational ponds per farmer 1.6 (0.2)
Average number of nonoperational ponds per farmer 0.95 (0.4)
Average number of ponds harvested in previous 12 months per farmer 1.5 (0.2)
Average individual water area of operational ponds 286 m2 (55) (N=19)
Average water area of operational ponds 387 m2 (78) (N=19)
N 20Note: Standard error (SE) in parentheses.
Figure 13. Percentage distribution of fish that farmers harvest in each month.
30
25
20
15
10
5
0January MayFebruary September November DecemberJuneMarch JulyApril August October
%
Legend
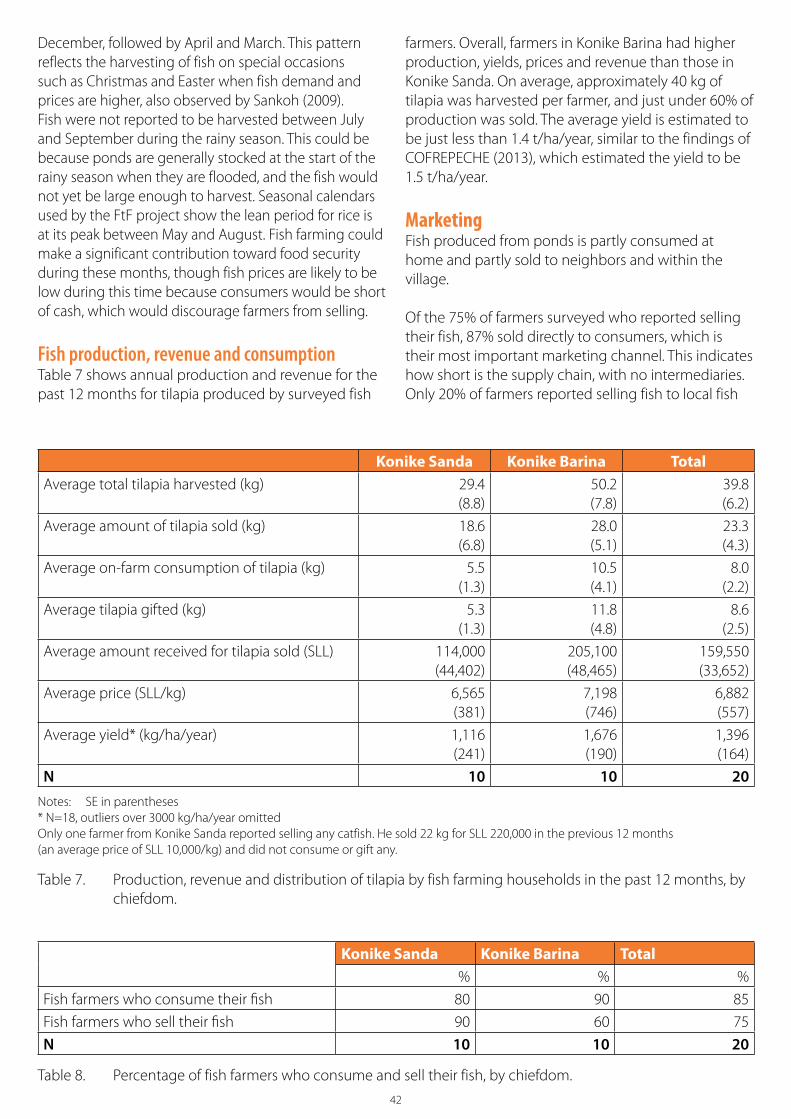
42
December, followed by April and March. This pattern reflects the harvesting of fish on special occasions such as Christmas and Easter when fish demand and prices are higher, also observed by Sankoh (2009). Fish were not reported to be harvested between July and September during the rainy season. This could be because ponds are generally stocked at the start of the rainy season when they are flooded, and the fish would not yet be large enough to harvest. Seasonal calendars used by the FtF project show the lean period for rice is at its peak between May and August. Fish farming could make a significant contribution toward food security during these months, though fish prices are likely to be low during this time because consumers would be short of cash, which would discourage farmers from selling.
Fish production, revenue and consumptionTable 7 shows annual production and revenue for the past 12 months for tilapia produced by surveyed fish
farmers. Overall, farmers in Konike Barina had higher production, yields, prices and revenue than those in Konike Sanda. On average, approximately 40 kg of tilapia was harvested per farmer, and just under 60% of production was sold. The average yield is estimated to be just less than 1.4 t/ha/year, similar to the findings of COFREPECHE (2013), which estimated the yield to be 1.5 t/ha/year.
MarketingFish produced from ponds is partly consumed at home and partly sold to neighbors and within the village.
Of the 75% of farmers surveyed who reported selling their fish, 87% sold directly to consumers, which is their most important marketing channel. This indicates how short is the supply chain, with no intermediaries. Only 20% of farmers reported selling fish to local fish
Table 7. Production, revenue and distribution of tilapia by fish farming households in the past 12 months, by chiefdom.
Konike Sanda Konike Barina TotalAverage total tilapia harvested (kg) 29.4
(8.8)50.2 (7.8)
39.8 (6.2)
Average amount of tilapia sold (kg) 18.6 (6.8)
28.0 (5.1)
23.3 (4.3)
Average on-farm consumption of tilapia (kg) 5.5 (1.3)
10.5 (4.1)
8.0 (2.2)
Average tilapia gifted (kg) 5.3 (1.3)
11.8 (4.8)
8.6 (2.5)
Average amount received for tilapia sold (SLL) 114,000 (44,402)
205,100 (48,465)
159,550 (33,652)
Average price (SLL/kg) 6,565(381)
7,198(746)
6,882(557)
Average yield* (kg/ha/year) 1,116(241)
1,676 (190)
1,396(164)
N 10 10 20Notes: SE in parentheses* N=18, outliers over 3000 kg/ha/year omittedOnly one farmer from Konike Sanda reported selling any catfish. He sold 22 kg for SLL 220,000 in the previous 12 months(an average price of SLL 10,000/kg) and did not consume or gift any.
Table 8. Percentage of fish farmers who consume and sell their fish, by chiefdom.
Konike Sanda Konike Barina Total% % %
Fish farmers who consume their fish 80 90 85
Fish farmers who sell their fish 90 60 75
N 10 10 20
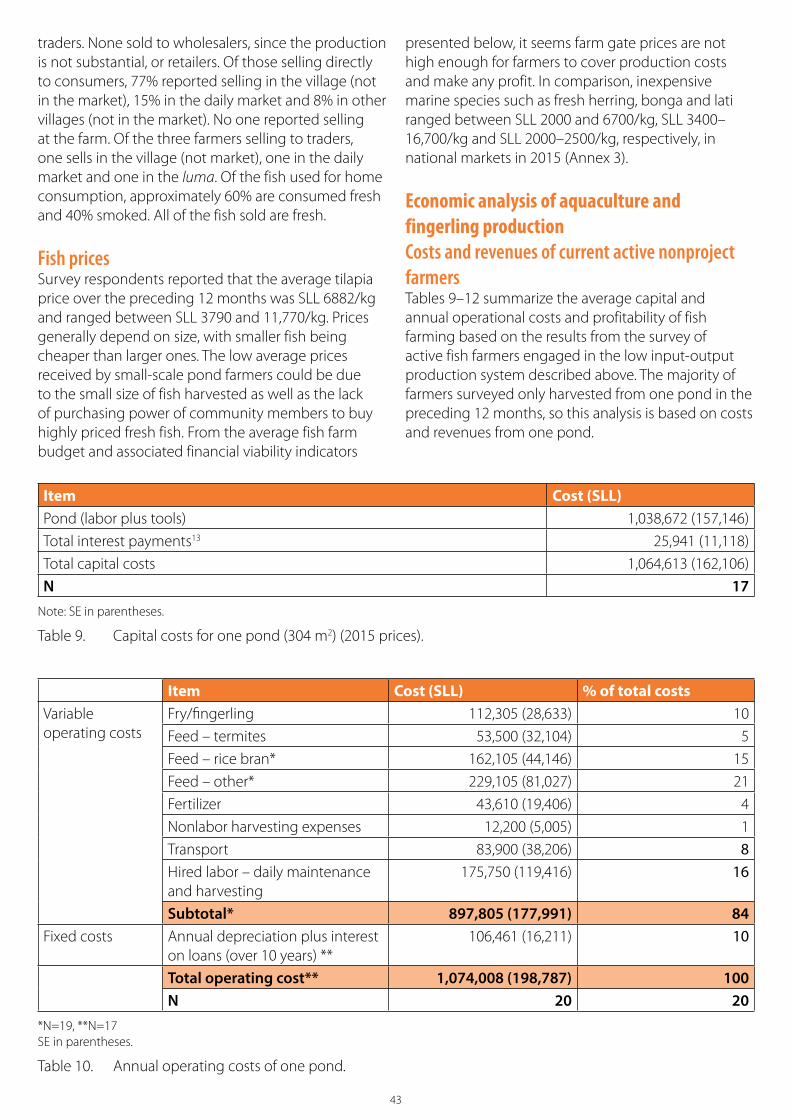
43
traders. None sold to wholesalers, since the production is not substantial, or retailers. Of those selling directly to consumers, 77% reported selling in the village (not in the market), 15% in the daily market and 8% in other villages (not in the market). No one reported selling at the farm. Of the three farmers selling to traders, one sells in the village (not market), one in the daily market and one in the luma. Of the fish used for home consumption, approximately 60% are consumed fresh and 40% smoked. All of the fish sold are fresh.
Fish pricesSurvey respondents reported that the average tilapia price over the preceding 12 months was SLL 6882/kg and ranged between SLL 3790 and 11,770/kg. Prices generally depend on size, with smaller fish being cheaper than larger ones. The low average prices received by small-scale pond farmers could be due to the small size of fish harvested as well as the lack of purchasing power of community members to buy highly priced fresh fish. From the average fish farm budget and associated financial viability indicators
presented below, it seems farm gate prices are not high enough for farmers to cover production costs and make any profit. In comparison, inexpensive marine species such as fresh herring, bonga and lati ranged between SLL 2000 and 6700/kg, SLL 3400–16,700/kg and SLL 2000–2500/kg, respectively, in national markets in 2015 (Annex 3).
Economic analysis of aquaculture and fingerling productionCosts and revenues of current active nonproject farmersTables 9–12 summarize the average capital and annual operational costs and profitability of fish farming based on the results from the survey of active fish farmers engaged in the low input-output production system described above. The majority of farmers surveyed only harvested from one pond in the preceding 12 months, so this analysis is based on costs and revenues from one pond.
Table 9. Capital costs for one pond (304 m2) (2015 prices).
Item Cost (SLL)Pond (labor plus tools) 1,038,672 (157,146)
Total interest payments13 25,941 (11,118)
Total capital costs 1,064,613 (162,106)
N 17Note: SE in parentheses.
Table 10. Annual operating costs of one pond.
Item Cost (SLL) % of total costsVariable operating costs
Fry/fingerling 112,305 (28,633) 10
Feed – termites 53,500 (32,104) 5
Feed – rice bran* 162,105 (44,146) 15
Feed – other* 229,105 (81,027) 21
Fertilizer 43,610 (19,406) 4
Nonlabor harvesting expenses 12,200 (5,005) 1
Transport 83,900 (38,206) 8Hired labor – daily maintenance and harvesting
175,750 (119,416) 16
Subtotal* 897,805 (177,991) 84Fixed costs Annual depreciation plus interest
on loans (over 10 years) **106,461 (16,211) 10
Total operating cost** 1,074,008 (198,787) 100N 20 20
*N=19, **N=17SE in parentheses.
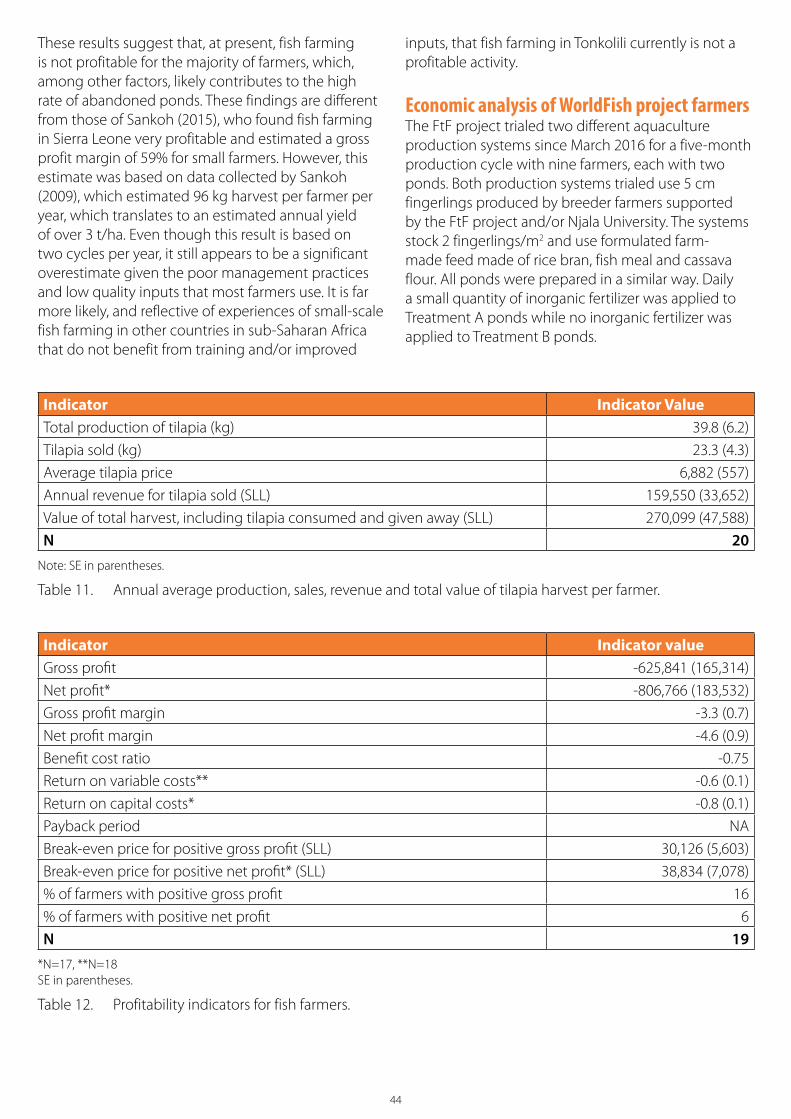
44
Table 11. Annual average production, sales, revenue and total value of tilapia harvest per farmer.
Indicator Indicator ValueTotal production of tilapia (kg) 39.8 (6.2)
Tilapia sold (kg) 23.3 (4.3)
Average tilapia price 6,882 (557)
Annual revenue for tilapia sold (SLL) 159,550 (33,652)
Value of total harvest, including tilapia consumed and given away (SLL) 270,099 (47,588)
N 20Note: SE in parentheses.
Table 12. Profitability indicators for fish farmers.
Indicator Indicator valueGross profit -625,841 (165,314)
Net profit* -806,766 (183,532)
Gross profit margin -3.3 (0.7)
Net profit margin -4.6 (0.9)
Benefit cost ratio -0.75
Return on variable costs** -0.6 (0.1)
Return on capital costs* -0.8 (0.1)
Payback period NA
Break-even price for positive gross profit (SLL) 30,126 (5,603)
Break-even price for positive net profit* (SLL) 38,834 (7,078)
% of farmers with positive gross profit 16
% of farmers with positive net profit 6
N 19*N=17, **N=18SE in parentheses.
These results suggest that, at present, fish farming is not profitable for the majority of farmers, which, among other factors, likely contributes to the high rate of abandoned ponds. These findings are different from those of Sankoh (2015), who found fish farming in Sierra Leone very profitable and estimated a gross profit margin of 59% for small farmers. However, this estimate was based on data collected by Sankoh (2009), which estimated 96 kg harvest per farmer per year, which translates to an estimated annual yield of over 3 t/ha. Even though this result is based on two cycles per year, it still appears to be a significant overestimate given the poor management practices and low quality inputs that most farmers use. It is far more likely, and reflective of experiences of small-scale fish farming in other countries in sub-Saharan Africa that do not benefit from training and/or improved
inputs, that fish farming in Tonkolili currently is not a profitable activity.
Economic analysis of WorldFish project farmers The FtF project trialed two different aquaculture production systems since March 2016 for a five-month production cycle with nine farmers, each with two ponds. Both production systems trialed use 5 cm fingerlings produced by breeder farmers supported by the FtF project and/or Njala University. The systems stock 2 fingerlings/m2 and use formulated farm-made feed made of rice bran, fish meal and cassava flour. All ponds were prepared in a similar way. Daily a small quantity of inorganic fertilizer was applied to Treatment A ponds while no inorganic fertilizer was applied to Treatment B ponds.
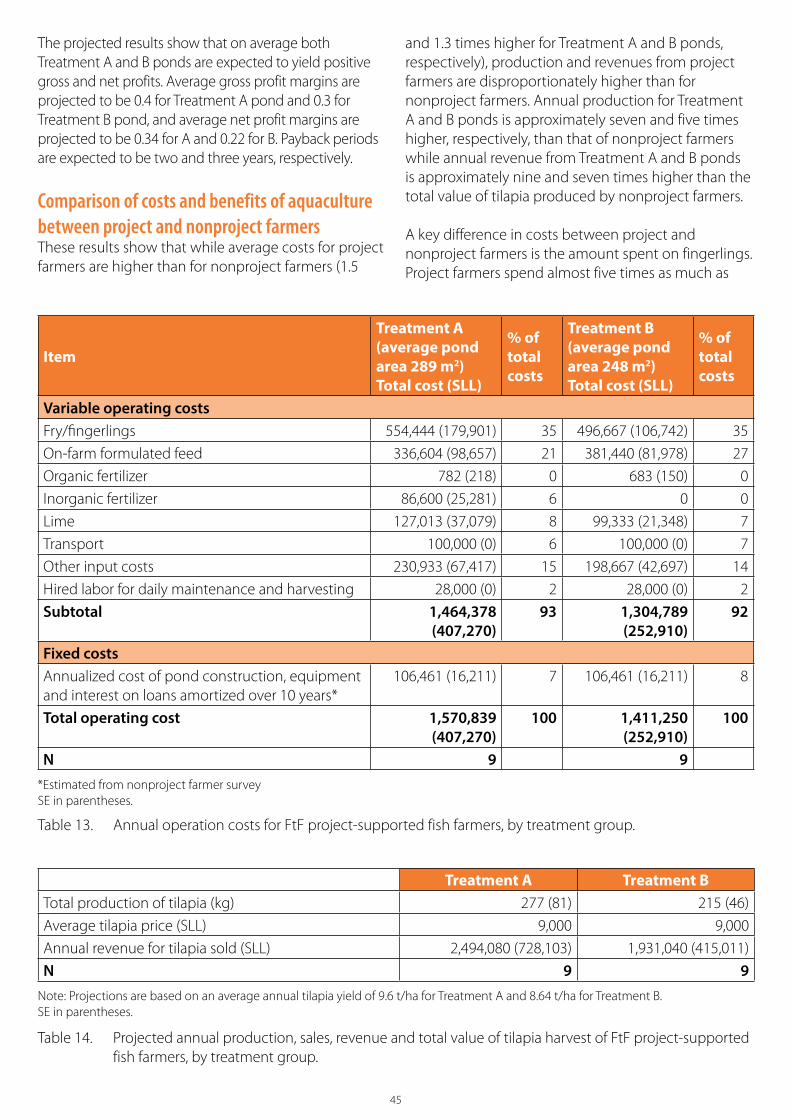
45
and 1.3 times higher for Treatment A and B ponds, respectively), production and revenues from project farmers are disproportionately higher than for nonproject farmers. Annual production for Treatment A and B ponds is approximately seven and five times higher, respectively, than that of nonproject farmers while annual revenue from Treatment A and B ponds is approximately nine and seven times higher than the total value of tilapia produced by nonproject farmers.
A key difference in costs between project and nonproject farmers is the amount spent on fingerlings. Project farmers spend almost five times as much as
Table 13. Annual operation costs for FtF project-supported fish farmers, by treatment group.
Item
Treatment A(average pond area 289 m2)Total cost (SLL)
% of total costs
Treatment B(average pond area 248 m2)Total cost (SLL)
% of total costs
Variable operating costsFry/fingerlings 554,444 (179,901) 35 496,667 (106,742) 35
On-farm formulated feed 336,604 (98,657) 21 381,440 (81,978) 27
Organic fertilizer 782 (218) 0 683 (150) 0
Inorganic fertilizer 86,600 (25,281) 6 0 0
Lime 127,013 (37,079) 8 99,333 (21,348) 7
Transport 100,000 (0) 6 100,000 (0) 7
Other input costs 230,933 (67,417) 15 198,667 (42,697) 14
Hired labor for daily maintenance and harvesting 28,000 (0) 2 28,000 (0) 2
Subtotal 1,464,378 (407,270)
93 1,304,789 (252,910)
92
Fixed costsAnnualized cost of pond construction, equipment and interest on loans amortized over 10 years*
106,461 (16,211) 7 106,461 (16,211) 8
Total operating cost 1,570,839 (407,270)
100 1,411,250 (252,910)
100
N 9 9*Estimated from nonproject farmer surveySE in parentheses.
Table 14. Projected annual production, sales, revenue and total value of tilapia harvest of FtF project-supported fish farmers, by treatment group.
Treatment A Treatment BTotal production of tilapia (kg) 277 (81) 215 (46)
Average tilapia price (SLL) 9,000 9,000
Annual revenue for tilapia sold (SLL) 2,494,080 (728,103) 1,931,040 (415,011)
N 9 9Note: Projections are based on an average annual tilapia yield of 9.6 t/ha for Treatment A and 8.64 t/ha for Treatment B.SE in parentheses.
The projected results show that on average both Treatment A and B ponds are expected to yield positive gross and net profits. Average gross profit margins are projected to be 0.4 for Treatment A pond and 0.3 for Treatment B pond, and average net profit margins are projected to be 0.34 for A and 0.22 for B. Payback periods are expected to be two and three years, respectively.
Comparison of costs and benefits of aquaculture between project and nonproject farmersThese results show that while average costs for project farmers are higher than for nonproject farmers (1.5
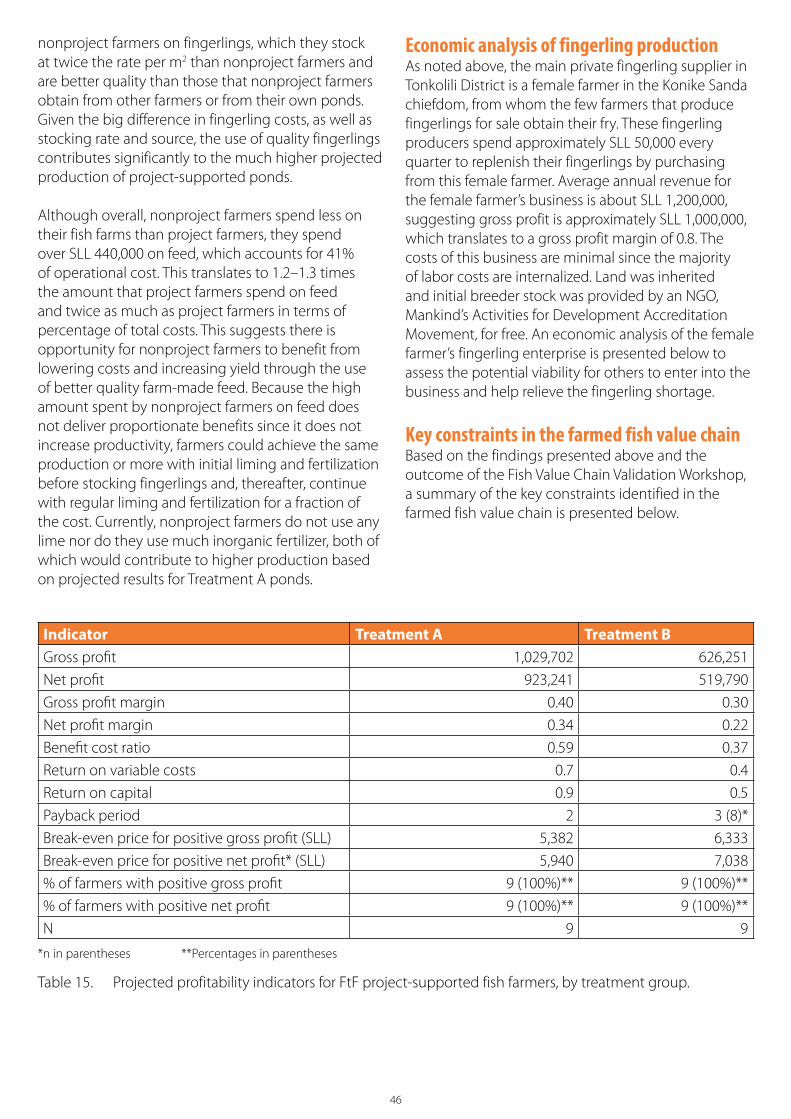
46
Table 15. Projected profitability indicators for FtF project-supported fish farmers, by treatment group.
Indicator Treatment A Treatment BGross profit 1,029,702 626,251
Net profit 923,241 519,790
Gross profit margin 0.40 0.30
Net profit margin 0.34 0.22
Benefit cost ratio 0.59 0.37
Return on variable costs 0.7 0.4
Return on capital 0.9 0.5
Payback period 2 3 (8)*
Break-even price for positive gross profit (SLL) 5,382 6,333
Break-even price for positive net profit* (SLL) 5,940 7,038
% of farmers with positive gross profit 9 (100%)** 9 (100%)**
% of farmers with positive net profit 9 (100%)** 9 (100%)**
N 9 9
*n in parentheses **Percentages in parentheses
nonproject farmers on fingerlings, which they stock at twice the rate per m2 than nonproject farmers and are better quality than those that nonproject farmers obtain from other farmers or from their own ponds. Given the big difference in fingerling costs, as well as stocking rate and source, the use of quality fingerlings contributes significantly to the much higher projected production of project-supported ponds.
Although overall, nonproject farmers spend less on their fish farms than project farmers, they spend over SLL 440,000 on feed, which accounts for 41% of operational cost. This translates to 1.2–1.3 times the amount that project farmers spend on feed and twice as much as project farmers in terms of percentage of total costs. This suggests there is opportunity for nonproject farmers to benefit from lowering costs and increasing yield through the use of better quality farm-made feed. Because the high amount spent by nonproject farmers on feed does not deliver proportionate benefits since it does not increase productivity, farmers could achieve the same production or more with initial liming and fertilization before stocking fingerlings and, thereafter, continue with regular liming and fertilization for a fraction of the cost. Currently, nonproject farmers do not use any lime nor do they use much inorganic fertilizer, both of which would contribute to higher production based on projected results for Treatment A ponds.
Economic analysis of fingerling productionAs noted above, the main private fingerling supplier in Tonkolili District is a female farmer in the Konike Sanda chiefdom, from whom the few farmers that produce fingerlings for sale obtain their fry. These fingerling producers spend approximately SLL 50,000 every quarter to replenish their fingerlings by purchasing from this female farmer. Average annual revenue for the female farmer’s business is about SLL 1,200,000, suggesting gross profit is approximately SLL 1,000,000, which translates to a gross profit margin of 0.8. The costs of this business are minimal since the majority of labor costs are internalized. Land was inherited and initial breeder stock was provided by an NGO, Mankind’s Activities for Development Accreditation Movement, for free. An economic analysis of the female farmer’s fingerling enterprise is presented below to assess the potential viability for others to enter into the business and help relieve the fingerling shortage.
Key constraints in the farmed fish value chainBased on the findings presented above and the outcome of the Fish Value Chain Validation Workshop, a summary of the key constraints identified in the farmed fish value chain is presented below.

47
Table 16. Capital costs of fry/fingerling-rearing pond of Ms. Marie Sanko.
Item Number Unit cost (SLL) Investment (SLL)
Life span(Yrs.)
Annual depreciation cost (SLL)
Ponds (250 m2 each) 01 1,500,000* 1,500,000 10 150,000
Tools 56,000 8 7,000
Total 1,556,000 157,000* Based on 10 persons working for 10 days at a rate of SLL 15,000/day/person
Table 17. Annual operating cost based on two 4-month culture cycles per year.
Item Number Unit price (SLL) Total cost (SLL)Variable operating costs for 4-month culture cycle (2 per year)Fry/fingerling to raise broodfish 500 50,000 per 100 pieces 250,000
Feed – bulgur (wheat) 10 bags of 50 kg 10,500 105,000
Feed – rice bran 20 bags of 50 kg 10,000 200,000
Labor – daily maintenance and harvesting 02 4,000/week 96,000
Subtotal 651,000Variable operating cost per year 1,302,000Fixed costsInterest plus installment payment on loan* 120,000/month 800,000
Annual depreciation 157,000
Subtotal 957,000Total annual cost 2,259,000
* Loan repayment period is six and a half months.
Table 18. Annual production, costs, revenue and profitability.
Indicator TotalTotal annual revenue (SLL) 3,570,000
Total annual costs (SLL) 2,259,000
Gross profit (SLL) 2,268,000
Net profit (SLL) 1,311,000
Gross profit margin 0.64
Net profit margin 0.37
Payback period (years) 1.2
Note: Annual production is measured on the basis of harvesting 850 fingerlings monthly after the first 4 months, for 7 months. Revenue is calculated based on a unit price of SLL 600.
48
Poor aquaculture uptake and high rate of abandonment• Similar to other countries in sub-Saharan Africa,
fish farming is not traditional in Sierra Leone. The lack of aquaculture knowledge and experience discourages adoption.
• Aquaculture in Sierra Leone has a history of poorly planned and unsuccessful interventions, leading to high rates of disadoption (see Section 9 for more details).
• Aquaculture is viewed as relatively risky because of theft, predation, high investment costs and other factors. In general, there is insufficient time and interest among local people who are preoccupied with other less risky and more profitable livelihood activities, such as rice production.
Limited access to good quality formulated fish feed• High quality formulated fish feeds are not available
on the market, leading to low yields and economic losses.
Limited and inconsistent supply of good quality fish seed• There are few fingerling suppliers locally or
nationally, so there is an extremely limited and inconsistent supply of high quality fingerlings.
• There is no broodstock management of tilapia species, which has led to inbreeding and low quality fish seeds, yielding poor production.
Limited access to affordable credit• The relatively high investment and working capital
costs for aquaculture and the lack of formal credit sources to fund these costs contribute to the low uptake in fish farming.
• A lack of formal credit facilities from financial institutions and a tendency for farmers to borrow capital through informal sources with short repayment periods and high interest discourage investment in fish farming.
• The current poor profitability of fish farming enterprises means credit would not be able to be paid back, even if it were obtainable.
Insecure access to land discourages commercial investment• Communal land tenure management leads to
insecure access to land and water resources, which discourages long-term investment in IVS development and represents a significant constraint to commercial aquaculture development, especially
for potential fish farmers who are not from the local area.
• Widespread communal land ownership encourages community-managed ponds over private sector-led individual ponds.
• Women do not have equal land ownership rights as men, so very few own fish farms.
Lack of technical and business development knowledge• In general, fish farmers have inadequate knowledge
of good aquaculture management practices, and this, coupled with the lack of access to inputs such as feed and seed, results in poor yields.
• Farmers have limited business knowledge and capacity to develop profitable aquaculture enterprises.
Poor extension and research services• Government aquaculture extension services are
low quality and limited in reach. Extension services provided by previous NGO aquaculture projects have been high cost and unsustainable.
• There is a lack of support for basic and adaptive aquaculture research. Aquaculture research institutions in Sierra Leone (mainly Njala University) are weak, and there is limited coordination between research and development sectors.
Poor capacity building approaches • To date, NGO-driven support for farmers has either
been to rehabilitate existing fishponds or construct new ones offering short-term incentives. Farmers have received little or no capacity building for knowledge and technology transfer to enable them to manage the ponds sustainably and profitably, and as such these approaches have proven unsuccessful. Long-term support is required (3–5 years minimum) with an exit strategy for farmers to fully understand and appreciate the production technology and be able to sustain production after support ends.
Poor productivity and profitability• The majority of fish farmers currently have very low
productivity and hence profitability caused by a lack of technical knowledge on good management practices.
Limited marketing• There is limited marketing of farmed fish at present,
mainly because of the low and irregular supply of farmed fish.
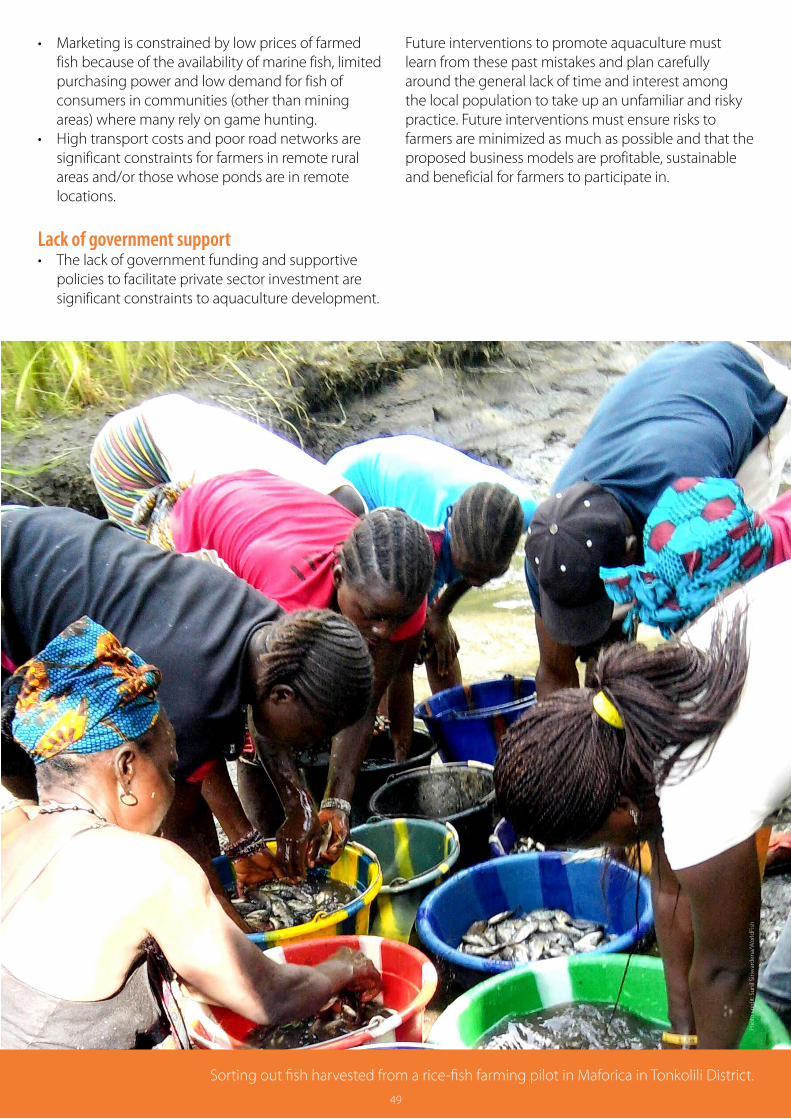
49
• Marketing is constrained by low prices of farmed fish because of the availability of marine fish, limited purchasing power and low demand for fish of consumers in communities (other than mining areas) where many rely on game hunting.
• High transport costs and poor road networks are significant constraints for farmers in remote rural areas and/or those whose ponds are in remote locations.
Lack of government support• The lack of government funding and supportive
policies to facilitate private sector investment are significant constraints to aquaculture development.
49
Sorting out fish harvested from a rice-fish farming pilot in Maforica in Tonkolili District.
Phot
o cr
edit:
Sun
il Si
riwar
dena
/Wor
ldFi
sh
49
Future interventions to promote aquaculture must learn from these past mistakes and plan carefully around the general lack of time and interest among the local population to take up an unfamiliar and risky practice. Future interventions must ensure risks to farmers are minimized as much as possible and that the proposed business models are profitable, sustainable and beneficial for farmers to participate in.
50
Existing secondary data suggests that the quantity of fish consumed by households in Tonkolili is low. An assessment by the USAID Strengthening Partnerships, Results, and Innovations in Nutrition Globally (SPRING) project estimated that the average Tonkolili household, consisting of five to 10 members, consumes two fish, five bundles of leafy green vegetables and 12 cups of rice per day, and eats fish regularly (SPRING 2015). A baseline survey conducted by Concern Worldwide in the Koya chiefdom in Kenema and the Konike-Barina chiefdom in Tonkolili found widespread fish consumption with household diets typically consisting of rice with sauce prepared with seafood, palm oil and some type of leafy green vegetable such as sweet potato or cassava leaves (Fongar 2014). However, despite this widespread and regular fish consumption, the SPRING assessment found that fish was only added in small quantities to sauce for flavor. Considering the small quantity that is actually consumed, fish currently is not considered a significant protein source for most households in Tonkolili.
The aquaculture assessment conducted by the FtF project revealed that 98% of the surveyed men and women consume flesh foods (fish and shellfish, meat, poultry, organs and grub). Of those, fish or shellfish (96%) were consumed most (WorldFish 2016b). Data from our consumer survey revealed the majority of fish consumed in Tonkolili District comes from marine sources, and much less from inland fisheries and aquaculture. Approximately 36% of households surveyed reported they had consumed fresh/iced marine fish the day before, and 34% ate dried or smoked marine fish. Just over 8% reported eating dried/smoked wild freshwater fish, 6% ate fresh wild freshwater fish and less than 1% ate farmed fish. A slightly higher percentage of consumers preferred smoked rather than fresh wild caught fish. This higher percentage of households eating marine fish over freshwater fish is not surprising, since marine fish is much more available in the markets. The limited availability of freshwater fish is directly linked to low production levels and seasonality. Smoked fish is generally preferred to fresh fish in part because of availability. It increases the shelf life of the fish, which other fish products do not because of the lack of electricity, refrigeration and ice.
Fish consumption in Tonkolili District
Household consumption of farmed fish show fish consumption patterns at the chiefdom level based on data from the consumer survey (Figures 14–16). These consumption patterns suggest that the majority of households in mining districts consume mainly fish from the coast. Despite having two big rivers passing through these chiefdoms, local communities do not appear to consume fish from these rivers or waterways. Only those chiefdoms with little mining activity consume fish from the rivers. This consumption pattern could be caused by possible pollution from mining activities, though this requires further research. Figure 14 shows that the Tane, Kafe Simira, Kholifa Magbang and Malal Mara chiefdoms completely depend on marine fish from the coast for consumption. In terms of marine fish demand, the lowest levels were recorded in the Konike Sanda and Kholifa Magbang chiefdoms. Figure 15 shows the largest consumption of wild freshwater fish was recorded in the Kholifa Magbang, Konike Sanda and Kholifa Rowalla chiefdoms. Figure 16 shows that only households in Konike Barina consumed farmed fish from fishponds.
As Figure 17 shows, the majority of households reported sourcing their fish from the market, either through purchase or exchange. Only about 12% of households reported consuming fish from their own production and/or wild caught sources. This further confirms that the majority consumed in Tonkolili is marine fish coming into Tonkolili from Western Area and Freetown. The majority of fish is being purchased from household incomes and, to some extent, varies by season. As shown in Figure 18, the most common fish type consumed across all seasons is marine fish. While equal numbers of households reported consuming fresh and smoked fish the day before, Figure 18 shows that a larger amount of dried or smoked marine fish is consumed than fresh marine fish, and when adjusting figures for smoked fish upward by 40% to represent live weights, the difference in amounts would be even higher. The third-most common fish consumed throughout the year is wild caught freshwater fish, especially during the main crop-harvesting season
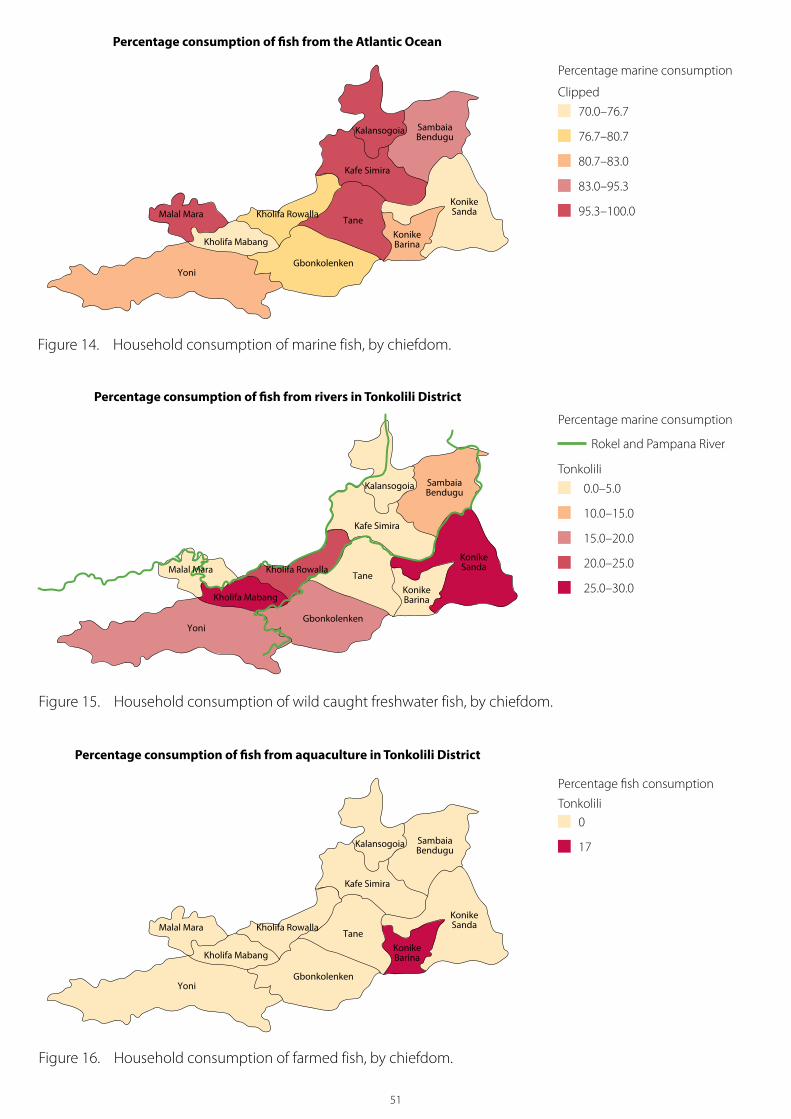
51
Figure 14. Household consumption of marine fish, by chiefdom.
Figure 16. Household consumption of farmed fish, by chiefdom.
Figure 15. Household consumption of wild caught freshwater fish, by chiefdom.
Percentage consumption of fish from the Atlantic Ocean
Percentage consumption of fish from rivers in Tonkolili District
Percentage consumption of fish from aquaculture in Tonkolili District
0Tonkolili
17
Percentage fish consumption
70.0–76.7
Clipped
80.7–83.0
76.7–80.7
83.0–95.3
95.3–100.0
Percentage marine consumption
0.0–5.0
Rokel and Pampana River
Tonkolili
15.0–20.0
10.0–15.0
20.0–25.0
25.0–30.0
Percentage marine consumption

52
from October to December. For communities with fishponds, consumption of farmed fish is lowest during the crop-harvest season. Generally, fish consumption drops at the peak of the hungry season from July to September, which can be attributed to reduced income during this period. Peak demand for fish in Tonkolili District is during the harvest season, both upland and lowland, and the most sold species during that period is dried/smoked herring from the coast.
About 15 species were reported to be consumed by households in Tonkolili District, including catfish (Arius latiscutatus), tilapia, kenteh (Chloroscombrus chrysurus, Linnaeus 1766), polock, agbolo, egbampour, kalath (Ilisha africana, Bloch 1795), ethokan, mackerel, herring, bonga and alope tank. Of these species, households consume herring the most (31%) followed by kalath (13%) and ebobor (12%).
Figure 17. Percentage of households that purchased or exchanged fish at market, by chiefdom.
Gbonkelenkeh Kafe simiria Kalasogoia Kholifa mabang
Kholifa rowalla
Kunike Kunike barina Malal mara Sambaya Tane Yoni
100%
120%
80%
60%
40%
20%
0
purchased or exchanged from market
Legend
Figure 18. Seasonality in fish consumption (kg/households/week).
Note: Marine dried or smoked fish weight values have not been adjusted to represent live weight, which would increase estimates by approximately 40%.
Ponds Wild fresh Marine fresh Marine dried
0 0.1 0.30.2 0.4 0.5 0.6 0.7 0.8
July/Aug/Sept
April/May/June
Jan/Feb/March
Oct/Nov/Dec
Legend

53
ExtensionFor agriculture, extension services are provided under MAFFS, but for fish farmers and fishers, extension and other support services fall under the MFMR. The extension service is responsible for training farmers, advising farmers on technical problems, providing information including access to inputs and output markets, facilitating the organization of farmer-based organizations and serving as links to government research institutions. Extension and support services for marine capture fisheries is provided by the MFMR’s Marine Artisanal Fisheries Unit, whose activities include (a) coordination of development activities for artisanal marine fisheries; (b) project development for small-scale fisheries, including safety at sea; (c) collaborating with local councils, fisher organizations and village authorities for co-management of the fish resources; and (d) collaboration with local councils for licensing artisanal fishing crafts and submission of returns.14 According to the MFMR, sustainable development and management of marine fishery resources requires sector capacity building by introducing improved and appropriate technology and techniques and efficient extension delivery services. The MFMR is a relatively small ministry that was formed in 1992. It was originally a department under the Ministry of Agriculture and Natural Resources, and very few technical personnel were moved to the newly created MFMR. The civil war between 1991 and 2002 did not allow the MFMR to recruit, train and deploy extension agents into the rural areas, apart from the few recruited in the aquaculture trials project in Bo and Makali. Most extension services to fish farmers are therefore provided by MAFFS extension officers, but fish farmers generally have very limited access to extension services.
The Aquaculture and Inland Fisheries Unit of the MFMR is tasked with providing support services, including extension, to fish farmers and inland fishers. The unit’s functions include (a) checking the progress of aquaculture and inland fisheries related activities; (b) providing technical knowledge and training and procuring required inputs for technicians and community beneficiaries against cost recovery; (c) supporting the organization of community-based projects in agriculture, aquaculture and inland fisheries; (d) monitoring progress made by farmers and small-scale fish farmers; (e) collecting relevant data on
Crosscutting services
fish harvests and related activities; and (f ) intervention in environmental issues related to aquaculture.15 Fishery assistants or technicians only served as extension agents to farmers in Tonkolili District at the government hatchery in Makali, which is understaffed and has few trained extension personnel. The vast majority of farmers in Tonkolili District depend on other older farmers in their areas for technical advice on fish farming (WorldFish 2016b).
Research At present, there is very limited fishery and aquaculture research in Sierra Leone. The MFMR collaborates with two research institutes, the Institute of Marine Biology and Oceanography and the Sierra Leone Agriculture Research Institute (SLARI), but they conduct very limited research in fisheries and aquaculture. Njala University, a public university located in Bo and in Njala, Moyamba District, conducts some research on aquaculture and even produces tilapia fingerlings for sale in its hatchery. Njala is the Agricultural University of Sierra Leone, and the School of Agriculture is the main entity of the university. Njala University’s research in aquaculture is mainly on integrated aquaculture with rice farming and livestock practices (particularly poultry and piggery) and catfish farming. However, none of these institutions has an adequate focus on adaptive research or problem-based research beneficial for farmers, as they address field-based issues faced by farmers.
Financial services Lack of access to credit from formal or informal sources is a constraint across all the fish value chains. Access to credit varies among operators in the value chains. For example, large fish processors are more likely to be financed than small traders, fish farmers or fishers, though processors obtaining credit from formal sources were still very uncommon in this assessment. Actors engaged in production are the least likely to be able to access formal sources of credit. This limited access is not specific to the fisheries and aquaculture sectors. It is also a common constraint in the agriculture sector more broadly and in the private sector in general. The World Bank (2014) ranked Sierra Leone 151 out of 189 countries in terms of credit accessibility, and another World Bank study (2015) found that private sector financing in Sierra Leone was only 28% of total commercial bank lending.16
54
Marine fisheriesIn the marine fisheries sector, fishing companies, processors and traders cannot expand their businesses without access to capital, and availability of credit through formal channels is expensive, with interest rates of 18%–20% (Précon 2014). Banks are not familiar with the fisheries sector, where actors often lack assets and collateral such as land. Agents and wholesale traders rarely obtain credit through formal channels, given the complexity of procedures involved and the low level of literacy among these actors.
Aquaculture Rural farmers (current and potential fish farmers) also find it difficult to raise capital through formal banking systems. Community banks were only introduced in Sierra Leone around 2005, and commercial banks are unwilling to lend money to poor rural farmers whose production activities are deemed risky, who do not have collateral (e.g. title deeds for the family land they use or livestock) and who are unable to repay within the short payback periods that traders, for example, can. No commercial banks currently have agriculture specific products, and they do not extend credit to small producers (Schweisguth et al. 2015), so value chain actors must turn to informal sources of credit. Apart from the perceived risky nature of fishing and fish farming (and agricultural production) an important reason for the financial exclusion among these value chains is the failure of financial services providers to develop specific financing products and services for fisheries and aquaculture, and agribusiness more broadly.
Commercial banksCommercial banks such as Standard Chartered Bank, Union Trust Bank (UTB) and Ecobank tend not to finance producers (farmers) because of the perceived high risks involved. The relatively little lending they do provide to agriculture value chain actors tends to be for input suppliers, buyers and transporters and, to a lesser extent, processors.
Apex Bank is also increasingly involved in developing special facilities for Agriculture Business Centers (ABCs)17 and piloting products for agricultural service providers, such as agricultural input loans, agricultural rehabilitation loans financing palm oil, coffee and cocoa, agricultural processing and marketing loans—all of which are delivered through community banks.
Other financial services providersThere are a number of other types of financial services providers, including microfinance institutions (MFIs) and NGOs. Unlike banks, however, they do not take deposits, which limits their ability to meet demand. Of note is the Building Resources Across Communities (BRAC) microfinance program in Tonkolili District, which includes crop and livestock subcomponents with innovative models that provide training and credit to farmers and focus only on women. One such model is the community agricultural promoters (CAPs) scheme, under which the loan amount is SLL 480,000 to be repaid over 12 months at no interest. BRAC’s CAPs deliver technical services and inputs to farmers. BRAC helps CAPs to establish themselves as small entrepreneurs and strengthen their businesses. The objective is for each CAP to encourage and recruit others into agriculture and one of the other schemes under this agriculture subcomponent. BRAC agriculture and livestock schemes cover areas such as vegetables, goats and chickens. BRAC could be a potential partner for developing aquaculture in Tonkolili District.
Community-based groups and informal credit arrangementsCommunity-based savings and credit groups such as village savings and loans associations, financial cooperative societies, financial clubs called osusus and other types of social structures, including labor clubs, have enabled poor rural farmers to access informal sources of credit and have been reported to be very useful (Sankoh 2009). Osusu members contribute money or farm produce for all their members on a rotational basis. The osusus have now been formalized into financial services associations (FSAs) (WorldFish 2016b). Tonkolili District has three community banks and two FSAs, which were established under IFAD’s Rural Finance Community Improvement Program.
The most reliable funding system that has sustained the local marine fisheries industry is the informal financial arrangements between fishermen, fish processors and traders (e.g. fish processors and agents providing fishermen with fuel on the agreement that fishermen sell their catch to them or other inputs on credit) or processors selling smoked fish on credit or on a commission basis to traders. Stakeholders in the marine fish value chain often are part of osusus and market associations that help provide small amounts of capital. However, for larger projects most processors and traders draw on their kinship networks.
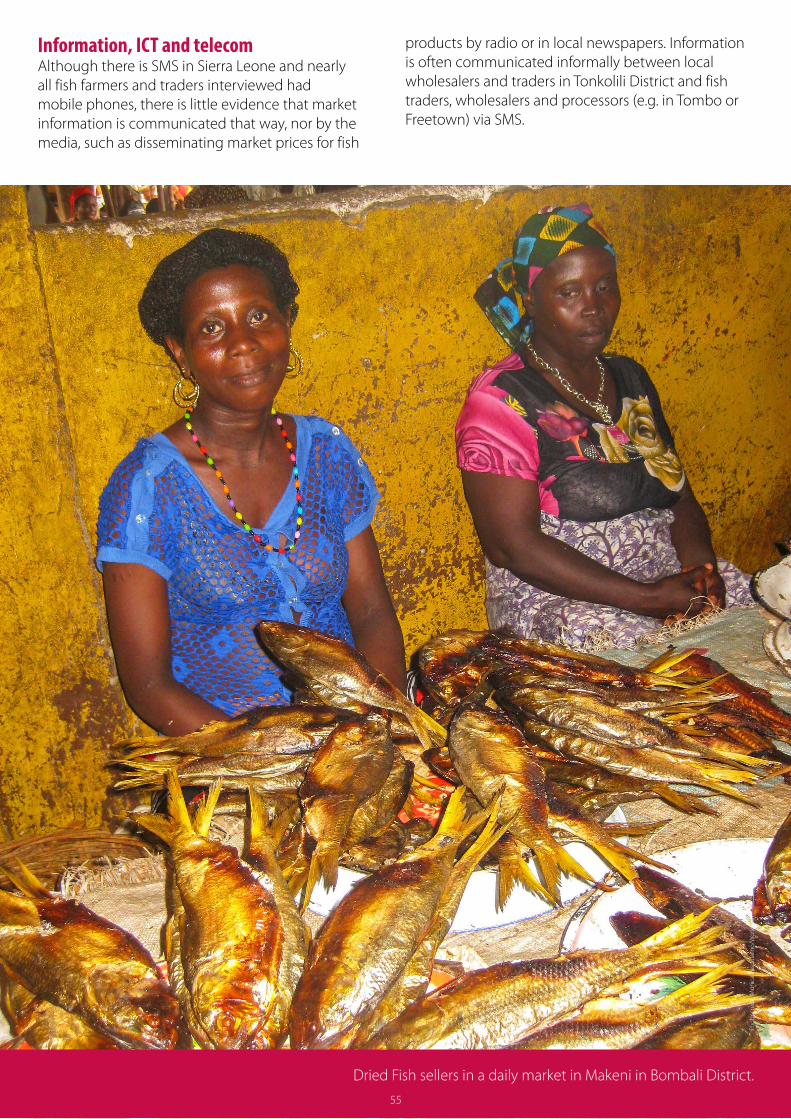
55
Information, ICT and telecomAlthough there is SMS in Sierra Leone and nearly all fish farmers and traders interviewed had mobile phones, there is little evidence that market information is communicated that way, nor by the media, such as disseminating market prices for fish
55
Dried Fish sellers in a daily market in Makeni in Bombali District.
Phot
o cr
edit:
Mon
ica
Pasq
uial
ino/
Wor
ldFi
sh
55
products by radio or in local newspapers. Information is often communicated informally between local wholesalers and traders in Tonkolili District and fish traders, wholesalers and processors (e.g. in Tombo or Freetown) via SMS.
56
Fisheries and aquaculture policies and regulationsThe most important government policy paper is the Agenda for Prosperity (AfP): Sierra Leone‘s Third Generation Poverty Reduction Strategy Paper (2013–2018). The vision of the AfP is for Sierra Leone to become a middle-income country by 2035. The strategy focuses on the following eight pillars:1. diversified economic growth (including fisheries)2. managing natural resources (including fisheries)3. accelerating human development4. international competitiveness (including fisheries)5. labor and employment6. social protection7. governance and public sector reform8. gender and women’s empowerment.
The fisheries sector, including aquaculture, is identified as a suitable engine for inclusive growth in Sierra Leone under Pillar 1. However, as the strategy notes, inclusive and pro-poor growth requires a stable macroeconomic environment and a more efficient and sustainable use of renewable and nonrenewable natural resources. The goal for fisheries within the AfP is to become a sustainable sector that primarily focuses on value addition, ensures food security, increases exports and creates jobs.
The priority objectives for fisheries under Pillar 1 of the AfP are to • increase the supply of fish for the domestic market
by at least 15% annually, particularly from semi-industrial, artisanal, inland and aquaculture fisheries activities;
• increase fish exports by focusing on strategic high-value markets such as the EU;
• promote and increase value-adding activities for fisheries products.
Under Pillar 2, the AfP seeks to strengthen capacity to combat IUU fishing by improving MCS systems. Under Pillar 4, the AfP promotes the establishment of hubs of value-adding activities under the framework of special economic zones (SEZs) and “growth poles.”
Given that the AfP identifies fisheries as a growth pole for the country, it is clear that the development of the fisheries sector is a high priority for the government. This is also reflected in other important policy documents, such as the National Sustainable Agriculture Development Plan 2010–2030, which
Policy and enabling environment
provides the broad framework for putting the objectives of the AfP and the Comprehensive Africa Agriculture Development Program into action.
The legal framework for fisheries management is enshrined in the 1994 Fisheries Management and Development Act, complemented by the 1995 Fisheries Regulations. These legal tools are aided by the more recent Fisheries Bill of 2010, which is seen as more progressive than existing laws in addressing the issues that concern marine resources management. However, this bill has not been enacted yet and requires further amendments that the MFMR is currently working on. The policy sets out a vision and framework for the management and use of fisheries aimed at ensuring their biologically sustainability, reducing poverty and generating wealth in a manner that contributes to the economy of coastal and riverine communities. The following five strategies are outlined to achieve this vision:1. conservation and sustainable use through risk
assessment and regulatory action2. increasing stakeholders’ responsibilities for
management and use3. development of an efficient and effective
extension service to facilitate stakeholder engagement in management
4. diversifying and increasing trade of fish products (building the business capacity of the fishing industry)
5. sustainable aquaculture development.
In particular, the new policy has moved from a rather open access policy toward an ecosystem-based approach to fisheries resource use. The new policy also includes the adoption of good governance principles as a base for arbitrating the implementation of measures to ensure sustainable and equitable use of the aquatic resources as well as food and nutrition security. The long-term strategy of the government is to build human capacity, improve the sector’s infrastructure and boost the role of Sierra Leone in the (semi-) industrial fisheries while ensuring that resource benefits and export earnings stay in the country.
The aquaculture sector is also considered an important strategy in this new fisheries policy and requires the development of an appropriate governance framework, including policy and legal instruments (strategies, plans legislation, etc.). The Food and Agriculture Organization (FAO) has assisted the MFMR
57
to prepare a draft “strategic framework for aquaculture development for Sierra Leone” as a first step toward preparing a detailed strategy for aquaculture development. The strategic framework defines four sub-objectives for the aquaculture subsector to• make farmed fish available and affordable to
enhance food security;• create an enabling environment for the production
and marketing of fish through fish farming;• establish aquaculture farms to enhance
employment opportunities and income generation in rural and urban areas;
• regulate aquaculture to reduce the pressure on capture fisheries and other wildlife through aquaculture development (COFREPECHE 2013).
The government also seeks to develop the aquaculture sector more broadly in line with NEPAD’s Policy Framework and Reform Strategy for Fisheries and Aquaculture in Africa and with FAO’s Special Program for Aquaculture Development in Africa, which focuses on stimulating the private sector to take up aquaculture as a business.
Despite the range of policy and strategy documents that have been developed, there is currently limited human, institutional, technical and financial capacity within the MFMR and other public services and institutions needed to implement them.
Past and ongoing interventions in fisheries and aquaculture development Marine and inland capture fisheriesThere have been a number of projects in the marine fisheries sector over the past decade. Between 2003 and 2010, the African Development Bank (ADB) and the Sierra Leone government jointly funded the construction and development of four artisanal landing sites in Tombo, Goddrich, Shenge and Bonthe at a cost of USD 12 million. The project was implemented by the MFMR and covered the artisanal fisheries development (construction of landing sites) (27.5% of budget), operating a credit facility (23%), institutional strengthening and capacity building (19%), and rational management of fish resources (18%). The project management cost accounted for 12.5%. However, while the construction has been completed, the sites are not operational, and it is still extremely hard to find reliable stock and catch data, which suggests the project was not a success (Précon 2014).
Between 2006 and 2010 the EU funded a project for strengthening fishery products and health conditions in African, Caribbean and Pacific/Overseas Countries and Territories (ACP/OCT) countries for an estimated USD 0.5–1 million. The objectives were institutional strengthening and capacity building (50%) and construction of a national laboratory for the testing of fish and fisheries products (50%). However, government institutions in Sierra Leone are not capable of organizing food safety official controls to EU expectations, and while laboratory equipment was sent and received, it has not been properly installed and is currently not used, suggesting this project was a failure (ibid.).
In 2011, the Sierra Leone government commissioned the Dutch firm Précon Food Management to facilitate access to EU markets for its fish and fisheries products through a USD 3 million three-year program designed to boost the development of industry standard practices to allow Sierra Leone to obtain certification to export fisheries products to the 28 EU countries. The main aspects of the program are institutional strengthening and capacity building to meet EU requirements (40% of budget), development of the industrial sector to meet EU requirements (35%) and development of vocational training (25%).18
The biggest program to date has been the USD 28 million World Bank-funded West Africa Regional Fisheries Program (WARFP) in Sierra Leone implemented between April 2010 and September 2016. The project was designed as an initiation phase to establish the foundation for sustainable fisheries management in West Africa and to increase the overall wealth generated by fisheries in the region and the proportion of that wealth captured by West African countries. The objectives of WARFP are to strengthen the capacity of Cape Verde, Liberia, Senegal and Sierra Leone to govern and manage targeted fisheries, reduce illegal fishing and increase local value added to fish products. The EVD outbreak forced the project to close in Sierra Leone; however, despite this, surveillance was maintained and communities were reported to still be benefitting from the project through more secure and sustainable fish harvests from the recently established community management associations (CMAs). Twenty-three CMAs have been established and 17 have developed bylaws. The project has been working with the government to make the joint maritime committee functional again, which is critical to control IUU fishing. The WARFP team

58
is currently preparing for a new global environment facility financing for USD 4 million to support Sierra Leone’s fisheries governance and communities.19
AquacultureAlthough there had been efforts by the government to initiate mangrove oyster (Crassostrea tulipa, Lamarck 1819) culture in the mid-1960s, which continued later in 1974 with funding from Canada’s International Development Research Center, these efforts resulted in limited production and stopped in 1981, mainly because of high capital costs (Kamara 1982). Fish farming in Sierra Leone started in earnest in 1978 with the construction of a government fish culture station at Makali in Tonkolili District by the fisheries division and the US Peace Corps, with materials from Catholic Relief Services. About 1000 Nile tilapia fingerlings were donated by the fisheries department of the Ivory Coast. In 1988, the government set up an aquaculture experimental station in Bo in Bombali District under the Bo/Pujehun rural development project. Production figures from the experimental fishponds at Bo were recorded to range from 600 to 4000 kg/ha/year with an average of 2500 kg/ha/year. The Makali and Bo fish culture stations were the focal points of the government’s aquaculture development efforts, and by the mid-1990s there were over 1500 fishponds in the country with a heavy concentration in Tonkolili (COFREPECHE 2013). The Peace Corps and the German Agency for Technical Cooperation were the major partners for fish farming activities between 1978 and 1990. Apart from the above interventions on aquaculture introductions and development, other partners such as FAO and national and international NGOs have supported, at various stages and levels, some form of aquaculture production activities. However, almost all aquaculture activities came to an end during the civil war, and government infrastructure was largely destroyed. Many NGOs have intervened in the country since the war to help fish farmers resettle in their communities after being displaced. One strategy of such interventions was to support fish farmers to rehabilitate their fishponds or construct new ones. Objectives of these interventions were to support rural livelihoods diversification, income generation and youth employment after the war. Many of the ponds constructed failed as the farmers were driven by the incentives (food, cash and tools) offered by NGOs and not by a perception of fish farming as an opportunity to enhance livelihood and nutrition (COFREPECHE 2013). After many aquaculture development interventions between 2002 and 2005, the MFMR commissioned the following four aquaculture baseline studies and WorldFish
implemented aquaculture assessment funded by USAID in 2015–2016:1. aquaculture baseline studies funded by the ADB
Artisanal Fisheries Development Project (AfDEP) in 2005
2. NEPAD-supported aquaculture baseline studies in 2012
3. ACP Fish II comprehensive aquaculture baseline studies in 2013
4. FAO-supported aquaculture baseline studies in 2015.
At the time these assessments started, the Bo and Makai fish stations were still not functional. The Makali hatchery only recently started to produce fingerlings (from May 2016 onward) thanks to the support of this WorldFish FtF project (from January 2016). The government established a rural youth development program in 2004 covering six districts, including Tonkolili. The program constructed community ponds and supplied Nile tilapia fingerlings from the fish stations in Bo and Makali. NGOs, including the Tropical Agriculture and Rural Development Program and the Community Development Association (CODA) in Yele District, were also involved, and focused on rehabilitating abandoned community ponds. In fact, since the end of the war, several NGOs have tried to help farmers resettle in their communities after being displaced by supporting them to rehabilitate or construct ponds in exchange for food, tools and in a few cases cash. Nearly 370 ponds were reported to have been rehabilitated or established through support from NGOs and other development partners. However, given the limited technical capacity of these NGOs, most ponds were poorly built, renovated and/or sited. In addition, the food for work strategy proved to be misguided as most farmers found the amount of food they received in return for constructing fishponds was more valuable than the fish they produced in the first year of fish farming. The food-for-work strategy encouraged those who were not really interested in fish farming to dig ponds only for the supply of food, and after the program they abandoned the ponds (WorldFish 2016b). The approach used by NGOs and donors to support aquaculture has been short term and unsustainable. Many of these programs relied on high-cost extension services for knowledge transfer that the government did not have the funds to sustain after the projects ended. Once farmers had rehabilitated or constructed ponds, they were left on their own with no continuing knowledge/technology transfer to enable them to manage the ponds
59
sustainably and profitably. Overall, many of these activities were done in isolation without considering the importance of developing a sustainable national aquaculture program based on support from the private sector and in line with current best practices (ibid.). Since the 1980s, most interventions by both the government and NGOs supported community-based ponds, but these have almost never worked because of a lack of sense of ownership. The relatively few operational ponds are largely individually owned.
Over the years, FAO has been an important partner supporting aquaculture development through projects in its Technical Cooperation Programme (TCP). In 2005, FAO developed a concept note entitled “Stimulating sustainable growth of Sierra Leones aquaculture sub-sector,” which emphasized the importance of the role of the private sector in the following ways:• promoting “for profit” small-, medium- and large-
scale operations• focusing on high potential zones and clusters• establishing profitable private sector input suppliers• developing public/private partnerships• promoting producer associations.
The draft National Aquaculture Strategy document was completed in 2009 under a TCP project and outlines the roles of government and the private sector based on the principles in the concept note. However, the national aquaculture development plan as envisioned by the TCP still needs to be developed.
FAO, in partnership with the MFMR, is currently implementing a USD 342,000 TCP project called the Sustainable Aquaculture for Food Security, Livelihood and Nutrition Project in Sierra Leone. The TCP plans to establish 30–50 ha of fishponds in communities in Tonkolili and three other districts between 2015 and 2017. The project is intended to improve aquaculture by providing assistance to small-scale individual and group fish farmers through empowerment and capacity building, strengthening of extension services and pilot production of local fish feed.20 The MFMR has also implemented four aquaculture baseline studies since 2005 (the latest in 2015 was in collaboration with the FtF pilot project and FAO). All of these studies confirm the strong potential for aquaculture, with various recommendations for its development, from commercial semi-intensive tilapia and catfish farming models to low input integrated systems in rural areas.
Land tenure systemLand ownershipSierra Leone has about 850,000 ha of arable land, 90% of which is in the provinces. The country’s land tenure system has a dual structure, with ownership in Western Area, including the Freetown Peninsula, governed by a freehold system of British origin while the majority of agricultural land in the rest of the country is held under customary tenure by traditional authorities such as the paramount chiefs who have the final authority in granting or obstructing land access to any individual (Chaytor 2010). This includes Tonkolili District where most of the land is owned by the extended family and never exclusively by a single person, since individual property does not exist.
The communal land tenure system is based on the following three principles:1. In all circumstances, the land belongs to the
community and cannot be taken away from it without its permission.
2. Within the community, each person has a right to an area corresponding to his various needs.
3. No one shall remain without land.
All adult males of an extended family have equal rights, and no male or female member of the family can be deprived of the use of family land. Access to family land is influenced by gender: male members have inalienable rights that can never be revoked, and unmarried female members have unrestricted access to family land, though preference is given to men because they are responsible for providing for their households. Unmarried females belong to their fathers’ households, and their parents provide their food and other needs. When a woman marries, her right to her father’s family land is revoked as she now becomes a member of her husband’s family, and access to land for her farming needs is restricted to her husband’s extended family land.
Even though women participate in all household agricultural activities and over 20% of households are headed by women (WFP 2011), the land use system makes it difficult for them to access or invest in agricultural development (Larbi 2012). A woman who wants to lease, borrow or hold land in trust often has to have a man guarantee her. Despite these difficulties, over 97% of respondents in the FtF project’s IVS assessment reported that women have access to land for all their farming needs in Tonkolili District (WorldFish 2016a).
60
A stranger or outsider (someone who has no consanguineous relationship with the extended family) can obtain land for farming by “begging” from the heads of their host families. This usually involves payment of a small annual royalty, known locally as bora. Bora is not rent per se, rather it is perceived as a symbolic gesture in recognition of the fact that the land is not owned by the user.
Although communal ownership is the prevailing land tenure system, additional rights to particular parcels of land for individual members are recognized in certain circumstances. For example, if a member habitually cultivates a particular IVS, over the years the swamp tends to be reserved for his or her use as long as there is no land shortage. If a member plants cash tree crops, such as palm oil, coffee, cashew, oranges or mangoes, he or she has undisputed right to the use of that land for as long as his or her crops occupy it. The land, however, never becomes the member’s private property.
Availability of land for the various farming needs of households does not appear to be problematic anywhere in Tonkolili District. Overall, 97% of respondents in the IVS assessment reported having adequate access to land for all their farming needs. The main methods of acquiring land for farming are family ownership (83%), use right granted by land-owning families (13%), which is the method that strangers or nonfamily members use to acquire land, and leasing (4%) usually when a substantial acreage is required for commercial (tree crop) farming.
Security of tenureFamily members cannot be denied access to family land for their basic farming needs, even by heads of the extended families. Also, when a member habitually cultivates a swamp or plants tree crops he or she has an undisputed right to that land. Such permanent use of land will only be allowed, in the first instance, by the head of the extended family if it will not create a land shortage for other members. The same security of tenure applies to strangers. In the case of a stranger who has been allowed to cultivate tree crops, under native law he cannot be evicted. Ownership of the crops is transferred to his heirs when he dies, the land and crops revert to the host family in the event of the stranger dying without leaving heirs or the stranger is obliged to sell the rights to his tree crops to the land owners if he or she decides to leave the host community for good.
In recent decades, especially since 1974 when the Northern Integrated Agricultural Development Project was launched with the development of IVSs for rice cultivation in Bombali and Tonkolili districts, strangers’ security of tenure of IVSs has been undermined. The project provided extension services and input loans that enabled project farmers to substantially increase production and income. FGDs revealed that several land-owning families took over cultivation of IVS plots that they had allowed strangers to use once the productivity increased. The insecure land tenure position of strangers has serious negative implications for attracting private investment in fish farming activities in Tonkolili District from outsiders.
Attitudes to land reformWithin Tonkolili, there is general satisfaction with the prevailing land tenure arrangements. Virtually all land-owning families are in favor of maintaining the status quo. This disposition is apparently encouraged by the fact that land is generally in abundant supply as no land shortages were reported. Only strangers and some prominent community members (most residing in urban areas) interested in large-scale land acquisition for plantation agriculture are in favor of land reform to make freehold possible.
The laws governing customary land tenure in the provincial areas of Sierra Leone have, over recent decades, been subjected to critical scrutiny. Specifically, they are deemed outdated and not secure enough to enable farmers to use their land as collateral for the credit necessary for agricultural development. Sierra Leone’s National Development Plan 1974/75–1978/79 succinctly outlines the emerging viewpoints: “The replacement of communal tenure by individual tenure may be an essential prerequisite if the standard of living of the community is to be improved. Certain forms of communal tenure may not provide security of tenure.”
61
This section outlines broad, strategic recommendations for development of the fish value chains in Tonkolili District based on the findings presented above and the outcomes of the Fish Value Chain Validation Workshop.
Criteria and appoach for recommendations, timing and prioritizationEach recommendation includes the following:• an indicative timeframe for implementation and
for impact to show (short, medium and long term indicating two to four years, five to six years and seven to 10 years, respectively)
• the potential impact on income, nutrition and food security for the most people, particularly members of vulnerable groups, such as women and children
• key groups of direct beneficiaries • potential implementation partners• priority level (low, medium and high).
The most detailed and numerous recommendations are focused on the development of the aquaculture value chain. This focus on developing the aquaculture sector is a result of the yet untapped potential of farmed fish to fill the increasing gap between supply and demand for fish in Sierra Leone, the opportunity aquaculture provides for rural households in Tonkolili to increase their incomes, food and nutrition security and the comparative advantage that WorldFish has in this area.
All activities developed from these recommendations should be planned and undertaken in a participatory way through consultation with relevant stakeholders, especially direct beneficiaries, be they fish processors, traders, fish farmers, rice farmers or consumers. In addition, all activities arising from these recommendations must ensure interventions are sustainable so as not to repeat past mistakes of activities being stopped once funding streams and projects have ended. For all three value chains under analysis, a coordinated value chain development approach is recommended whereby complementary and simultaneous investments at key stages of the value chain are made, rather than isolated investments to overcome one or two key constraints. Such an approach will maximize the chances for successful overall value chain development.
Recommendations for potential interventions
Recommendations for the marine fish value chainReduce illegal, unreported and unregulated fishing It is estimated that Sierra Leone is losing USD 29 million annually to IUU fishing alone. To reverse this trend, improved MCS systems must be developed and put in place. Further research should be carried out to understand the whole fisheries sector in the country, assess the weaknesses in current monitoring systems and identify possible solutions. While many potential policies require multilateral action on a global level (e.g. establishment of a global database and tracking system) and making IUU fishing a transnational crime (Daniels et al. 2016), country level policies and actions have a crucial role to play. Examples include• banning transshipments at sea;• enhancing port measures by ratifying the legally
binding Agreement on Port State Measures to Prevent, Deter and Eliminate IUU Fishing aimed at strengthening the controls in ports where the fisheries catches are landed and reported, and denying access to any vessels suspected of IUU activity;
• building national and regional capacity to draw on global satellite and terrestrial tracking systems action;
• having western African navies work more closely together to monitor and protect their coastal waters, especially in inshore territorial waters crucial to the communities that depend on coastal fisheries (ibid.).
Timeframe – long termPotential impact – highPotential beneficiaries – all stakeholders in the marine fisheries sectors, including fishers, female traders and processors and consumersImplementation partners – MFMR, Institute of Marine Biology and Oceanography, FAO, World Bank/WAFRP, ADB, EUPriority – high
Encourage industrially caught fish to land in Sierra LeoneFor over a decade, plans have existed to develop a fisheries harbor in Freetown to simplify and encourage the landing of industrially caught fish, reduce transshipments at sea and increase Sierra Leone’s share of the value added generated by its fisheries resources. Existing onshore facilities to process fish and add value before export are limited and generally in a bad state of repair. Establishment of modern facilities to
62
maintain high quality standards are critically needed to enhance fish exports and increase benefits to Sierra Leone.Timeframe – long termPotential impact – mediumPotential beneficiaries – all stakeholders in the marine fisheries sectors, including fishers, female traders and processors and consumersPotential implementation partners – MFMR, FAO, World Bank/WAFRP, ADB and other development donorsPriority – medium
Utilize bycatchAccording to the Industrial Fisheries Division of the MFMR, a substantial amount of fish discards have been recorded from marine capture fish landings. The species composition and the estimated quantity of discards have yet to be determined. Some of the discards may include small pelagic fish, which are rich in micronutrients and could be used for value addition to make nutrient-rich products, particularly for pregnant and lactating women as well as children. If fish processing is developed, low quality fish waste/byproducts might also be used in fish feed preparation or livestock when not suitable for human consumption. If primary fish processing (cleaning, removal of head and guts and keeping in flaked ice) is promoted, it will not only improve the quality of market fish but also generate waste useful in fish feed preparation. Further research is needed to understand the quantities and species composition of the trash fish or discards from marine fish landings and to explore whether these can be used in a profitable way that enhances incomes and nutrition through the development of products either for human consumption or animal feeds, including for fish.Timeframe – medium termPotential impact – mediumPotential beneficiaries – consumers, especially women and children, and small-scale fish (and animal) feed enterprises, aquaculture farmers Potential implementation partners – MFMRPriority – medium
Improve primary processing for reduced postharvest losses and improved product quality The high level of postharvest losses in the artisanal value chain can potentially be addressed by improving the currently limited primary processing of fish. While poor electricity supply and high diesel costs for generator use make investments in cold room infrastructure risky for investors, research is needed
to assess the feasibility of small-scale and locally built processing plants, such as using local materials like unused cargo containers and equipping them with basic processing equipment, such as counter tops, basins and ice dispensers, to process fish, put it on ice and provide cold storage. Fish could then be suitable for sale in higher value fresh fish markets, taken to market in small, refrigerated vans, as well as for smoking in traditional value chains. Successful models from other countries should be explored, especially the potential for public-private partnerships (PPPs) between government and private sector investors. Cold rooms at market centers would also reduce postharvest losses for traders who would be able to store leftover fish to sell the next day, especially during the peak season for fish such as herring, which floods the market during the rainy season. Timeframe – short to medium termPotential impact – mediumPotential beneficiaries – female fish traders and processors, consumers especially in inland areas such as Tonkolili, small- to medium-sized entrepreneurs Potential implementation partners – MFMR, World Bank/WAFRPPriority – medium
Improve fish smoking efficiencyFirewood represents a substantial cost for fish processors who smoke fish. It may be possible to reduce this cost and deforestation through the use of more efficient ovens and/or alternative fuels. Further research is needed to explore whether current technologies for fish smoking can be improved and made more efficient through using less fuel wood or using alternative fuels instead. Research is needed to understand current practices and look at successful models promoted in other West African countries where fish processors use much more efficient ovens that require much less wood. Research should estimate the impact of introducing improved ovens on all aspects of the processing activities, including efficiency, profit, environmental impact, nutritional value, product quality, price effects and potential for new markets. Processors could be trained and have their technical and business skills upgraded to enable them to use and benefit from improved technology. Research should also focus on storage requirements to further reduce postharvest losses and maintain value for processors and traders along the chain. Timeframe – short to medium termPotential impact – mediumPotential beneficiaries – female fish processors, consumers especially in inland areas such as TonkoliliPotential implementation partners – MFMR, fish

63
trader associations, World Bank/WARFPPriority – medium
Improve storage, marketing and market informationWomen control and manage the fish trade in Sierra Leone. There is a need to invest in the training of female traders in fish preservation and processing (see above), and the private finance sector should be encouraged to provide credit to improve market conditions and sales. The marketing of marine fish, both smoked and raw/iced, can be enhanced through improvements in the storage technologies available to traders, the provision of credit (particularly to support business development) and the dissemination fish price information to retailers and wholesalers (e.g. through coordinating with MAFFS and the MFMR on an extension and market information service via SMS). Introduction of ice boxes/cold storage would increase profit margins for traders and improve fish quality since consumers, especially in inland areas such as Tonkolili District, are currently being sold spoiled smoked fish.Timeframe – short to medium termPotential impact – mediumPotential beneficiaries – fish traders and processors, consumers especially in inland areas such as TonkoliliPotential implantation partners – MFMR, MAFFS, fish trader associationsPriority – medium
Recommendation for the freshwater wild fish value chainSustainably manage inland fisheries through fish stock conservation Conservation of fisheries resources is key to ensuring the success and sustainability of any value chain intervention. Use of nonselective fishing gear such as fences and gill nets with small mesh sizes are of special concern for fish stock conservation. Most of the rainy season fishing in floodplains may have a negative impact on the breeding populations. The fisheries regulations relevant to inland fisheries should be revisited to formulate effective management measures and fishing gear regulations to conserve breeding and spawning grounds of freshwater fish species in rivers and streams.Timeframe – short to medium termPotential impact – highPotential beneficiaries – marginalized inland fishers, rural women who engage in inland fishing, IVS communities, researchers and scientists
Potential implementation partners – MFMR, Njala UniversityPriority – high
Sustainably manage inland fisheries through habitat enhancement Habitat enhancement measures such as the creation of dry season fish refuges, fish rings and pits should be implemented to enhance rice field fisheries and wild fisheries in IVS and preserve brood fish. Such measures would seek to build on the existing conservation practices of communities. For example, paramount chiefs impose fishing bans and restrictions in the dry season, and the heads of extended families/custodians of family assets restrict fishing in particular swamps for specified periods. This practice is intended to prevent overfishing of the particular swamps and allow natural fish stock to replenish. It is also important to generate improved knowledge on the ecological significance of dry season refuges aimed at influencing policymakers and planners to view them as an integral component of the overall ecosystem and integrate these resources into future development plans for IVSs. Timeframe – short to medium termPotential impact – highPotential beneficiaries – marginalized inland fishers, rural women who engage in inland fishing, IVS communities, policymakers and planners, researchers and scientistsPotential implementation partners – MFMR, Njala University, community groupsPriority – high
Sustainably manage inland fisheries through species assessmentFreshwater species play an important role in the social and economic fabric of inland communities. Many freshwater species are important for subsistence fishing and form valuable species groups in artisanal fisheries. Most fish live in a particular part of a river, and many travel out of their normal environment once a year or more to breed. An assessment of fish species present in the freshwaters and identification of migratory and resident species would provide useful information on which to base management measures when designing and implementing development plans, such as hydropower plants. With the construction of a large dam at Bumbuna in Tonkolili District, the upstream and downstream fish populations are likely to be almost completely separated. To better understand the behavior of fish in streams and rivers and the overall trends occurring in the inland fisheries sector, the assessment of
64
freshwater fish species availability in rivers, streams and lakes undertaken two decades ago should be updated with a current inventory of freshwater fish species in Sierra Leone. Timeframe – short to medium termPotential impact – highPotential beneficiaries – marginalized inland fishermen, rural women who engage in inland fishing, IVS communities, policymakers and planners, researchers and scientists, nutritionistsPotential implementation partners – MFMR, Njala University, community groupsPriority – medium
Prevent the shrinkage of inland waterwaysAn assessment is needed to understand floodplain dynamics associated with rivers and streams in Tonkolili District and to propose measures to prevent their shrinkage and pollution caused by anthropogenic activities such as mining. The assessment should consolidate and build on existing hydrographical data and existing knowledge on the occurrence and location of floodplains through documenting local knowledge and use of GIS tools. It should also identify high potential strategies for management of inland waterways through a participatory approach to provide options for management and conservation of this resource for all stakeholders. Timeframe – medium to long termPotential impact – high Potential beneficiaries – marginalized inland fishermen, rural women who engage in inland fishing, policymakers and planners, researchers and scientistsPotential implementation partners – MFMRPriority – medium
Conduct participatory management of floodplain fisheriesA participatory methodology to manage, conserve and promote floodplains and dry season refuges should be developed to ensure marginalized and poor groups can contribute to and benefit from development interventions. Such an approach would seek to ensure that, in the longer term, the rural poor associated with floodplain areas are empowered through equitable access to natural resources, sources of fish and other aquatic food organisms, both from natural production and from aquatic farming, resulting in sharing experiences and lessons learned between communities. Timeframe – short to medium termPotential impact – high
Potential beneficiaries – marginalized inland fishermen, rural women who engage in inland fishing, IVS communities, policymakers and plannersPotential implementation partners – MFMR, Njala University, community groupsPriority – medium
Create a marketing studyA marketing study is necessary to examine the current and potential demand for wild caught freshwater fish and explore opportunities in different market segments (e.g. the types of species, sizes and processing demanded in different low and high value markets as well as the seasonality of supply and demand) and associated prices. Such a survey is required to better understand the market for freshwater fish and how best to take advantage of these developing market opportunities while balancing the need for sustainable fisheries management.Timeframe – short termPotential impact – mediumPotential beneficiaries – inland fishers, consumers, fish traders and processors Potential implementation partners – MFMR Priority – medium
Recommendation for the farmed fish value chainDevelop aquaculture clustersSeveral factors have influenced the current concentration of fishponds, including access to water, proximity to the government hatcheries at Makali and Bo and the expectation of funding from NGO projects. However, the low level of adoption, remote location of rural farmers and poor infrastructure to connect farmers to undeveloped input and output markets mean that interventions are unlikely to succeed unless they are focused on supporting the development of clusters of farmers. WorldFish’s aquaculture assessment study (2016b) has analyzed site suitability for aquaculture in Tonkolili District and identified the most suitable clusters for aquaculture development based on a set of criteria under each of the following three areas: (1) water and land, (2) inputs and knowledge and (3) market and accessibility. The most suitable chiefdoms for aquaculture development are Gbonkolenken, Kholifa Rowalla, Tane Konike Barina and Konike Sanda. These chiefdoms should be the target of future interventions outlined below. Environmental impact assessments should be conducted in potential aquaculture cluster areas to mitigate adverse climate and other environmental issues of cluster development.Timeframe – short term

65
Potential impact – highPotential beneficiaries – all aquaculture stakeholders including fish farmers, input (fish feed and fingerling) suppliers, potential small- and medium-sized entrepreneurs who would like to enter into contract farming, consumers in Tonkolili District, those outside the sector benefitting from the economic multipliers effect arising from aquaculture development and increased income spent on locally produced goods and servicesPotential implementation partners – MFMR, MAFFS, community groups, private sector (e.g. Business Investment Group)Priority – high
Maintain a sustainable livelihoods approach to aquaculture development Developing aquaculture, as well as inland fisheries, for poverty alleviation, livelihood enhancement and nutrition should be based on a sound understanding of the livelihoods of poor communities, households and fishers. Poor farmers and remote households usually have limited options and livelihood assets to engage in aquaculture. A sustainable livelihoods approach is needed to better understand the constraints and opportunities to engage in aquaculture, identify which groups could benefit from participating in aquaculture and inland fisheries development and explain how their livelihoods could be enhanced sustainably. Without an understanding of the livelihoods, constraints and opportunities faced by potential beneficiaries, supply-driven packaging of technology according to the desires of the ministries or development agencies will not succeed. A sustainable livelihoods analysis should be conducted to identify available opportunities for aquaculture development and create a spectrum of appropriate and well-targeted poverty alleviation strategies, interventions and technologies according to the resources available to the poor. These strategies and interventions should be informed by an understanding of who the poor are, the constraints they face and the kinds of aquaculture and inland fisheries options that would be acceptable, appropriate and beneficial to them to sustainably enhance their livelihoods. Timeframe – short term Potential impact – highPotential beneficiaries – poor farmers, consumers who will benefit from increased fish supplies, policymakers and plannersPotential implementation partners – MFMR, MAFFS, Njala University, private sectorPriority – high
Improve feed development and supplyExperiences in other countries suggest that private sector investment in the development of feed mills and the commercially formulated feed supply requires a certain minimum level of aquaculture production or critical mass to have been reached. In the meantime, good quality and affordable farm-made fish feed based on locally available ingredients should be developed and promoted to farmers to increase production yields in the short term. Piloting and promoting farm-based feeds should build on the findings of the fish feed ingredients availability assessment commissioned by this FtF project and explore effective use and enterprise models for fish feed production and improving aquaculture productivity. The capacity of fish farmers and aquaculture extension officers to make farm-made fish feed should be developed. In the medium term, the government should encourage the establishment of fish feed mills producing affordable and good quality formulated fish feed (e.g. through tax incentives and a reduction of import duties on equipment) and different business models explored (e.g. private sector-led, PPPs and/or development projects such as FtF providing technical expertise). Timeframe – short to medium termPotential impact – highPotential beneficiaries – fish farmers, consumers who will benefit from increased fish supplies, suppliers of locally sourced feed ingredients (e.g. rice bran, fish meal and cassava), potential small- and medium-sized entrepreneurs who wish to enter into fish feed manufacturingPotential implementation partners – MFMR, MAFFS, ABCs, fish farmer organizations/groups, Njala University, private sectorPriority – high
Improve seed supplyA reliable supply of good quality and affordable fingerlings to fish farmers in the various clusters discussed above is extremely important if aquaculture is to develop in Tonkolili. At present, the FtF project is demonstrating a decentralized fish seed supply model by testing suitable on-farm breeding and fertilized egg incubation techniques for tilapia to supply fish seed within the pilot clusters. As part of this model, the Makali fish farm is being improved to boost the tilapia fingerling supply, and a tilapia and catfish broodstock is being developed there to provide genetically sound brood fish to farmers for on-farm breeding. Although this model is already increasing the fingerling supply in the district, and its decentralized nature makes good sense, it is not clear how the model will be sustainable
66
beyond the life of the project. The design and outcomes of this pilot model should be assessed to improve its effectiveness in increasing access to good quality seed in the aquaculture clusters and explore options for scaling up and sustaining the development of the fish seed supply. Such an assessment should build on the experience and lessons from successful and sustainable seed supply models established elsewhere and carefully consider the role of the government.
It was suggested at the validation workshop that state fish farms should only undertake the development and maintenance of the genetic quality of broodstock to supply broodfish for on-farm breeding but not try to compete with the private sector for fish seed supply. However, to date, the government has not developed the fish farms at Bo or Makeni, and it is not clear if they have the technical capacity or funds to supply good quality broodfish to farmers for breeding. Therefore, the assessment should consider different business models for hatchery development, such as direct intervention by the MFMR, partial privatization or leasing of government stations, forming PPPs and establishing a separate private hatchery. Both technical and business development training should be conducted with interested fish farmers who want to develop a fingerling business to supply farmers in the potential clusters identified above.Timeframe – short to medium termPotential impact – highPotential beneficiaries – fish farmers, fingerling enterprises, consumersPotential implementation partners – MFMR, MAFFS, Njala University, private sectorPriority – high
Land reformLand tenure reforms are a prerequisite for attracting private sector investment in commercial aquaculture. Many of those who could invest in fish farming are discouraged because they do not have secure access to suitable land, and those who do are either not willing or do not have the right to sell the land. Participants at the validation workshop suggested advocating to government to enable changes in policies and customary regulations to open up the land tenure system to allow private sector actors to establish fish farms. However, such advocacy, if successful, is only likely to change policies and regulations in the long term. In the medium term, the government could negotiate with landowners for reasonable lease agreements similar to government negotiations on behalf of land-owning families
with the Sierra Rutile mining company for a surface rent agreement. In the short to medium term, it is important to focus on areas where more secure land tenure is possible. As such, aquaculture development interventions should focus primarily on beneficiaries who have secure tenure and whose plots belong to their extended family. Exceptions exist in some communities where the flexible management structure of the land could encourage long-term investment (Yele and Mayepoh in the Gbonko Lenken chiefdom, Rochain Malal in the Malah Mara chiefdom, Yoni in the Yonibana chiefdom and Bumbuna in the Kalasogoia chiefdom). Timeframe – short, medium and long termPotential impact – highPotential implementation partners – MFMR, MAFFS, Ministry of Lands, Country Planning and Environment, Sierra Leone Investment and Export Promotion Agency, private sector (e.g. BIG) development partners focused on agribusiness development (e.g. Agricultural Cooperative Development International/Volunteers in Overseas Cooperative Assistance [ACDI/VOCA], Cooperative for Assistance and Relief Everywhere)Priority – high
Develop on-farm testing of suitable production systemsFish farming is currently a low input-output subsistence level activity. The production system itself needs to be developed to support the sustainable intensification of aquaculture. Species and production system-specific feeding and fertilization regimes and best management practices (BMPs) should be developed and tested on-farm to maximize the productivity, profitability and sustainability of small-scale pond farmed tilapia and catfish. These production systems can then be scaled up. Timeframe – short termPotential impact – highPotential beneficiaries – fish farmers, consumers, input suppliers, fish traders and processors Potential implementation partners – MFMR, MAFFS, Njala UniversityPriority – high
Conduct technical and business development training and capacity building of farmersTraining and capacity building of farmers in BMPs is required for fish farming enterprises to be successful. Cost-effective and sustainable extension approaches for adoption, adaptation and dissemination of BMPs should be explored and developed, for example, in participatory farmer-to-farmer approaches such as
67
farmer field schools, lead farmer networks, training of trainer programs and demonstration farms. Disseminating aquaculture knowledge through radio and television programs should also be promoted to raise awareness of the benefits of fish farming and to disseminate BMPs. Training and capacity building of farmers in business and entrepreneurial skills is just as important as technical knowledge. Fish farming is currently not a profitable enterprise in Sierra Leone, and it is unclear if active farmers are even aware that their fish farming activities are unprofitable. Similar mechanisms for disseminating business skills as technical skills noted above should be developed. Such capacity building should be informed by the development of profitable business models for different scales and intensities of operation discussed below.Timeframe – short to medium termPotential impact – highPotential beneficiaries – fish farmers, consumers, input suppliers, tradersPotential implementation partners – MFMR, MAFFS, aquaculture extension staff, Njala University, fish farmer organizations/groupsPriority – high
Strengthen aquaculture extension and researchThe extension services of both MAFFS and the MFMR need to be strengthened. Training extension staff, including training of trainers, is required to ensure effective dissemination of extension approaches for the adoption, adaptation and distribution of aquaculture BMPs and sustainability of aquaculture development activities. The technical capacity of aquaculture extension staff should be developed to effectively advise fish farmers on pond siting and construction and BMPs as well as utilize field-proven extension approaches to disseminate. Capacity building should be supported by preparing extension material that contains examples of proven methods that have been successful elsewhere and that includes updated information on current and new methods, techniques and interventions, with special emphasis on their applicability in Sierra Leone. However, even if extension staff are trained, the lack of resources for them to visit farmers is still a constraint. It is therefore necessary to explore other extension approaches as discussed above, such as peer-to-peer approaches and lead farmer networks.
Capacity building of universities and research institutions is also needed to carry out research that is relevant to the needs of fish farmers and other value chain actors. Potential interventions could include
developing research skills among agriculture research institutes and university staff, developing capacity development material for use by MAFFS, the MFMR, Njala University and aquaculture and agriculture extension staff. Timeframe – short to medium termPotential impact – mediumPotential beneficiaries – fish farmers, extension staff, consumers, aquaculture researchers Potential implementation actors – MFMR, MAFFS, Njala University, other research organizations, fish farmer organizations/groupsPriority – high
Develop profitable business modelsCommercial production must be carefully planned for aquaculture to compete favorably with products from marine capture fisheries. Research is required to develop system-specific business plans targeting a range of markets (low and high value rural and urban markets for small, medium and large fresh and/or processed fish) appropriate to the financial and technical resources of different farmer categories. These business plans should do the following:• Calculate the smallest economically viable size of
fish farms by species.• Determine most profitable times to harvest. For
example, marine fish supplies are particularly low between July and September, so there may be opportunity to increase fish farming profit if harvests were done during the rainy season. Demand is also high during the dry season ceremonies of initiations, memorial services, weddings, child naming ceremonies and other public gatherings, which could be ideal times to harvest and sell fish if production is synchronized.
• Consider that the most profitable, productive and/or nutritious species (e.g. catfish) appear to have a higher demand and price on the market than tilapia. They could be more appropriate for commercial aquaculture while the potential of small nutritious fish should also be explored for household nutrition.
Timeframe – short termPotential impact – highPotential beneficiaries – fish farmers, consumers, input suppliers, traders, potential entrepreneurs who wish to enter into aquaculture businessesPotential implementation actors – MFMR, MAFFS, ACDI/VOCA, fish farmer organizations/groups, private sector groupsPriority – high

68
Improve access to creditAlthough credit is reported to be a constraint both to aquaculture adoption and increasing fish production, it is important that profitable fish farming business models are first developed and tested on-farm before encouraging farmers to take on debt that they may not be able to repay. Once profitable business models have been successfully tested on-farm, creative credit models that do not rely on commercial banks should be investigated. Government could make revolving capital available to farmers at reasonable interest rates and medium-term payback periods to encourage farmers to take up fish farming as a business. To get farmers started, the FtF project or other development partners should consider developing arrangements between input suppliers, either individually or through fish farmers groups, so that farmers can receive inputs on credit, which can be repaid once fish have been harvested and sold. Partnerships with MFIs such as BRAC should also be explored.Timeframe – short to medium termPotential impact – lowPotential beneficiaries – current and potential fish farmers, consumersPotential implementation partners – MFMR, MAFFS, other development partners, community banks, MFIs (e.g. BRAC), village savings and loans associations, financial cooperative societies, osususPriority – high
Increase the species diversity in aquacultureNile tilapia is currently the predominant fish species being farmed in Tonkolili, with very few farmers culturing catfish and/or other species. This could be caused by past and current interventions promoting mainly tilapia, because tilapia, which is herbivorous with omnivorous tendencies, thrives well on any type of feed, whereas catfish is carnivorous and will only grow and reach marketable size when fed the right feed, containing the right crude protein content. At the grassroots level, it is easier to culture tilapia than catfish, especially among the poor. However, suitable aquaculture species, aside from tilapia, should be identified to increase aquaculture species diversity. Potential species include those that are locally available, already demanded by communities, on the market, capable of increasing farmers’ productivity and profitability, and small indigenous species with high nutritional value that would be readily consumed by poor farming households. As noted above, production systems and business models should be developed for these different species.
Previous studies (e.g. Sankoh 2009; Hecht et al. 2012) suggest that African catfish is the best possible species to develop aquaculture in Sierra Leone because it is indigenous, widely distributed, hardy, easy to produce, tolerant of poor water quality and can be produced at high densities. In addition, smoked catfish fetches the highest price of freshwater fish in Sierra Leone and is in demand across West Africa. A successful catfish industry would also support a successful catfish smoking industry, which would benefit female processors and traders, among others. The FtF project has started work on developing good quality catfish seed at the Makali hatchery. Other possibilities include African carp (Labeo coubie).Timeframe – short to medium termPotential impact – highPotential beneficiaries – fish farmers, consumers (including poor consumers), hatcheries and fingerling suppliers, women fish processors and tradersPotential implementation partners – MFMR, Njala University, hatcheries, fingerling suppliers Priority – high
Work with existing farmers groupsMembership in farmers groups is high (about 50%) in Tonkolili District (IVS 2016). The most common services they provide are crop processing, procurement of farm inputs, savings, credit and marketing. Future fish value chain interventions should focus on working with and through established, well-functioning and interested farmers groups, including those under active ABCs and existing fish farmer organizations/community-based groups. Farmers groups can be strengthened through training in group organization, business development, record keeping, etc., to facilitate the provision of services for members, such as purchasing inputs (e.g. fish seed and feed ingredients), transporting and marketing fresh fish to local markets, providing training and supplying credit. It is well documented that farmers groups formed by outsiders are unlikely to be successful, so it is recommended to work with existing groups. Timeframe – short to medium termPotential impact – mediumPotential beneficiaries – fish farmers, consumers, input suppliers, female fish processors and traders Potential implementation partners – MFMR, MAFFS, ABCs, fish farmer organizations/groupsPriority – medium
Integrate aquaculture and agricultureThere is high potential for adopting systems (e.g. integration of fish with rice and/or horticulture) to benefit small-scale farming households. IAA systems
69
have the potential to positively impact farming systems, land and water productivity, profitability and farm sustainability. Given the small and decreasing size of land plots in Tonkolili District (farms can be as small as 500–1000 m2) sustainable intensification based on IAA systems is especially important. It has been estimated that if 10% of the existing 54,650 ha of IVSs in Tonkolili District is developed with rice-fish farming (5465 ha of modified rice fields with a potential fish production of 1640 t/year, based on 0.3 t/ha/crop), it would improve the food and nutritional security of about 164,000 people (assuming 10 kg/capita fish consumption), which amounts to 50% of the population in Tonkolili District.
The FtF project’s IVS assessment identifies opportunities for IAA systems to increase income and production for IVS-associated households in Tonkolili District (WorldFish 2016a). The project has been testing two IAA systems: (1) concurrent or in-situ integrated rice-fish farming (with fish stocked in the flooded paddy field) and (2) integrated fish-vegetable farming, in 20 pilot sites. Two high yielding rice varieties are being cultivated in rice-fish farming pilots to test their suitability in an integrated farming system, and several nutritious vegetables including orange flesh sweet potato identified through participatory community consultations have been planted on pond dikes. Further pilots will test traditional rice varieties during the rainy season in concurrent rice-fish farming pilots and alternate rice-fish farming pilots at the onset of rainy season.
However, given that rice is not an aquatic plant (Uphoff 2015), concurrent or in-situ integration of fish in flooded rice paddies results in a productivity tradeoff in terms of rice yield and total output. Therefore, it is strongly recommended that these pilots be expanded to include on-farm testing and development of sustainable agro-ecological and climate smart production systems such as SRI21 and CA22 and CA-based SRI23 (Reeves et al. 2016) in rice-fish farming pilots and rice-fish-horticulture pilots.
SRI rice and fish production cannot be concurrent because of the SRI water management practice of maintaining moist soil conditions in the case of wetland rice, through intermittent irrigation or short cycle alternate wetting and drying of the soil, as opposed to continuous flooding in the conventional system. Rather, rainwater can be captured and stored for aquaculture and horticulture crops in a pond adjacent to the paddy field while also providing supplementary irrigation for the rice crop. Thakur et al.
(2015) conducted a two-year field trial of integrated SRI with horticulture and rice in India, which improved rice yield by 52% and found SRI rice to be more drought-tolerant and productive with greatly expanded and active root systems.
The SRI system is currently being trialed in Sierra Leone by SLARI at Rokupr under the World Bank-funded West Africa Agricultural Productivity Program (WAAPP). The trials have produced impressive results in terms of increased productivity and decreased labor and input requirements. Results from these trials show yields from conventional rice production of 2 t/ha compared to yields of 6.2 t/ha from SRI production (Harding 2014).
CA has also been shown to improve yields relative to conventional tillage agriculture even without external inputs such as fertilizers, herbicides, pesticides, compost or improved seed varieties, showing farmers can practice and benefit from CA with the resources they have, according to Lalani et al. (2016a). Lalani et al. (2016b) also found that in Mozambique, poor farmers have the highest intentions to use CA based on the benefits they have experienced from previous cropping cycles under CA. Therefore, not only do both SRI and CA production systems increase productivity with no or little requirements for purchased inputs, they are more productive, resilient, sustainable and pro-poor than conventional systems.
Combining IAA with CA-SRI is suitable for upland and IVS rice growing ecologies, though more research is needed on the boliland ecology. Expanding IAA pilots to include CA-SRI would increase the focus on climate-smart agro-ecological approaches to sustainable intensification that are also pro-poor. Based on the results of these pilots, rice farmers should be encouraged to practice the types of IAA that suit their agro-ecology and interest.Timeframe – short to medium termPotential impact – highPotential beneficiaries – poor rice farming households, fish farmers, rice and fish consumers, and development planners Potential implementation partners – MFMR, MAFFS, Njala University, ABCs, SLARI (Rokupur), WAAPP, rice and fish farmer-based organizationsPriority – high
Conduct a marketing study to understand current and potential market for farmed fishWhile an overreliance on marine fisheries can be seen as a major constraint to aquaculture development,
70
supply from marine fisheries is stagnating and unable to meet rising demand for fish in Sierra Leone, which is an opportunity for aquaculture development. The low quality of fresh (and smoked) marine fish in inland markets suggests that higher quality farmed fish would easily compete with marine fish; however, at present, the price of farmed tilapia in Tonkolili is extremely low. A marketing study on the current and potential demand for farmed fish is required. The study should include analysis of opportunities in different market segments (e.g. the types of species, sizes and processing demanded in different low and high value rural and urban markets) seasonality of supply and demand and associated prices, and the ways and means of linking poor farmers to these markets. Such a study would improve understanding of the current and potential market for farmed fish and how best to take advantage of these developing market opportunities. The marketing study could assess and build on the findings of those such as Sankoh (2009), who argues that catfish offers a more profitable opportunity than tilapia for farmers since it is in higher demand and commands a higher price, and prices for fresh fish are highest during the height of the rainy season when supply is low and demand is high. The results of the marketing study should inform the development of profitable business models discussed above.Timeframe – short to medium termPotential impact – highPotential beneficiaries – poor fish farmers, women groups who undertake drying and smoking fish, traders, MFMR, researchers, scientistsPotential implementation partners – MFMR, MAFFS, Njala UniversityPriority – high
Provide price information to fish farmersAlthough fish farmers are generally aware of the prices of fish for consumption in the local markets, there is a lack of awareness of the prevailing prices of fish, including fish fry and fingerlings, within and around communities. This makes it difficult for farmers to negotiate with market traders and intermediaries to receive a good price for their produce. A mechanism should be developed by the MFMR to disseminate accurate price information to farmers. This mechanism would involve town chiefs collecting relevant prices and submitting them to the MFMR. The ministry would then redistribute the pooled price information among relevant stakeholders through the town chiefs and agriculture extension staff.Timeframe – short to medium termPotential impact – high
Potential beneficiaries – fish farmers, consumers, fish traders and processors Potential implementation partners – MFMR, community leadersPriority – medium
Create an enabling environment for aquaculture developmentAt present, there is limited regulatory, strategic or financial support for the aquaculture sector from the government. There is a need to create a comprehensive regulatory framework for aquaculture development aimed at protecting the industry, the environment and other resource users and consumers. There is also a need to revisit the government’s aquaculture development strategy to promote and provide incentives for private sector-led aquaculture development. Incentives could include tax holidays and duty-free equipment imports for the private sector to enter into commercial aquaculture, including feed manufacturing and fish seed supply. Poor infrastructure is a major constraint to aquaculture development, especially in rural areas such as Tonkolili. Therefore, it is necessary to rehabilitate and construct roads leading to production areas.Timeframe – medium to long termPotential impact – highPotential beneficiaries – all aquaculture stakeholders (e.g. fish farmers, input suppliers, private investors, policymakers and planners) Potential implementation partners – MFMR and other relevant ministries, development organizations (e.g. FAO) and private sector associations (e.g. farmers associations and BIG) Priority – high
Cross cutting recommendations for gender and nutrition through all fish value chainsGender equality and social equityAll three fish value chains involve gender-differentiated roles. For example, there are few female producers in aquaculture, though women often share pond management work with their husbands. Women undertake almost all postharvest (processing and marketing) activities in all three value chains. Without an explicit focus on enhancing gender equality and social equity, benefits gained from value chain interventions may not automatically be equitably shared among poor and vulnerable target groups such as women. Interventions need to take a gendered and pro-poor approach, exploring ways to create equitable opportunities along the value chain for women, small-scale producers, value chain actors and consumers to derive an equitable share of benefits.
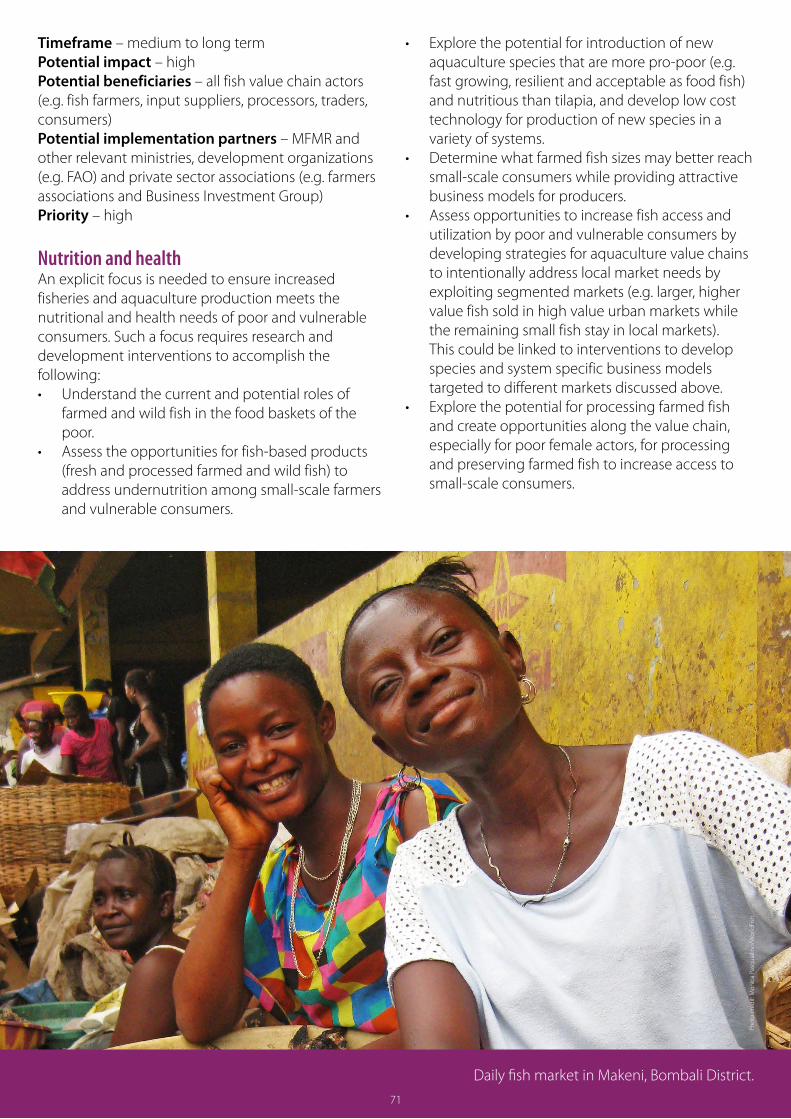
71
Timeframe – medium to long termPotential impact – highPotential beneficiaries – all fish value chain actors (e.g. fish farmers, input suppliers, processors, traders, consumers) Potential implementation partners – MFMR and other relevant ministries, development organizations (e.g. FAO) and private sector associations (e.g. farmers associations and Business Investment Group) Priority – high
Nutrition and health An explicit focus is needed to ensure increased fisheries and aquaculture production meets the nutritional and health needs of poor and vulnerable consumers. Such a focus requires research and development interventions to accomplish the following: • Understand the current and potential roles of
farmed and wild fish in the food baskets of the poor.
• Assess the opportunities for fish-based products (fresh and processed farmed and wild fish) to address undernutrition among small-scale farmers and vulnerable consumers.
• Explore the potential for introduction of new aquaculture species that are more pro-poor (e.g. fast growing, resilient and acceptable as food fish) and nutritious than tilapia, and develop low cost technology for production of new species in a variety of systems.
• Determine what farmed fish sizes may better reach small-scale consumers while providing attractive business models for producers.
• Assess opportunities to increase fish access and utilization by poor and vulnerable consumers by developing strategies for aquaculture value chains to intentionally address local market needs by exploiting segmented markets (e.g. larger, higher value fish sold in high value urban markets while the remaining small fish stay in local markets). This could be linked to interventions to develop species and system specific business models targeted to different markets discussed above.
• Explore the potential for processing farmed fish and create opportunities along the value chain, especially for poor female actors, for processing and preserving farmed fish to increase access to small-scale consumers.
71
Daily fish market in Makeni, Bombali District.
Phot
o cr
edit:
Mon
ica
Pasq
uial
ino/
Wor
ldFi
sh
71
72
Notes 1 These are entrepreneurial women of sound financial stature in the artisanal fisheries sector in Sierra Leone
and other West African countries, such as Ghana.
2 This section is based on information from FEWS NET (2011) unless otherwise stated.
3 During the survey, certain chiefdoms (e.g. Kholifa Rowalla) did not have the targeted number of fish producers. To maintain the total sample number, certain chiefdoms with many fish producers (e.g. Konike Barina and Konike Sanda) were oversampled.
4 Ministry of Fisheries and Marine Resources. 2016. Table of total fish production in Sierra Leone: 1990–2010. Accessed 12 June 2016. http://www.bsl.gov.sl/pdf/Fish.pdf
5 This figure does not seem to have changed over the 13-year period. Our own calculations based on MFMR fish production data suggests per capita consumption is about 18 kg/year.
6 Monofilament nets are illegal because they catch juveniles and other marine life, which end up becoming bycatch. As they are made of nylon and other nondegradable materials, monofilament nets continue to trap marine plant and animals, referred to as “ghost fishing.”
7 Fish auction and distribution companies in Freetown include the Sierra Fishing Company, Peninsular Fish Processing Company, Sun Hu, Chung Gang Fishing Company Kombra Fishing SL, and the Brothers Fishing Company.
8 Banda ovens consist of a raised platform with open or closed sides above the fire-place.
9 Chokor ovens are comprised of a rectangular oven at the base and smoking trays which are stacked above the oven, forming a chimney.
10 Altona ovens consist of a wooden smoke unit placed above a fire box. The fire box is built from clay or sun dried clay blocks.
11 The FtF project started rehabilitating the Makali fish farm in January 2016 by establishing the water supply system, renovating ponds and building a hatchery. Fingerling production began in May 2016.
12 USD 1 = SLL 6500 (the Standard Chartered Bank rate at the time of data collection).
13 The average interest for the seven farmers who took loans was SLL 63,000 (SE 20,283) and the average loan repayment period was 4.6 (SE 1.2) months.
14 Ministry of Fisheries and Marine Resources. Marine Artisanal Fisheries Unit. 2015. Accessed 13 June 2016. http://mfmr.gov.sl/index.php/2015-02-06-13-57-55/2015-02-06-13-59-17/marine-artisanal-fisheries-unit
15 Ministry of Fisheries and Marine Resources. Aquaculture and Inland Fisheries Unit. 2015. Accessed 13 June 2016. http://mfmr.gov.sl/index.php/2015-02-06-13-57-55/2015-02-06-13-59-17/aquaculture-and-inland-fisheries-unit
16 Bank of Sierra Leone. 2016. Statistics: Monetary Sector Data. Accessed 12 August 2016. http://www.bsl.gov.sl/statistics.html
73
17 In 2010, an EU-funded project implemented by MAFFS and FAO introduced the Agriculture Business Centers (ABCs) for buying and selling agricultural inputs. MAFFS has been working to transform them into cooperatives to become viable private sector agribusinesses through the World Bank-funded Smallholder Commercialization Program. However, the majority of them are not functioning because of management issues. Currently eight of the 17 ABCs in Tonkolili District are known to be functional.
18 Précon Food Management. 2013. About Us. Précon Sierra Leone. Accessed 14 August 2016. http://precon.sl/about-us/
19 The World Bank. 2016. West Africa Regional Fisheries Program (P106063): Implementation Status and Results Report. Accessed 15 August 2016. http://documents.worldbank.org/curated/en/268211468204547808/pdf/ISR-Disclosable-P106063-05-18-2016-1463589145815.pdf
20 Food and Agricultural Organization. 2015. Sierra Leone and FAO sign over USD 300,000 worth-aquaculture project. FAO Regional Office for Africa: News. 27 February 2015. Accessed 26 June 2016. http://www.fao.org/africa/news/detail-news/en/c/279438/UN. 2016. Improving the nutrition status of rural households. Sierra Leone: United Nations. Accessed 26 June 2016. https://sl.one.un.org/2016/05/30/improving-the-nutrition-status-of-rural-households/
21 SRI is a climate-smart, agro-ecological methodology for increasing the productivity of rice and more recently other crops by changing the management of plants, soil, water and nutrients. SRI methodology is based on four main principles that interact with each other: (1) early, quick and healthy plant establishment; (2) reduced plant density; (3) improved soil conditions through enrichment with organic matter; and (4) reduced and controlled water application. For more information on SRI visit: http://sri.ciifad.cornell.edu/index.html
22 CA aims to achieve sustainable and profitable agriculture to improve farmers’ livelihoods through the application of the three principles: (1) no or minimal mechanical soil disturbance; (2) permanent soil mulch cover with crop stubbles and residues, and cover crops; and (3) cropping system diversification through rotations and associations. CA holds tremendous potential for all farm sizes and agro-ecological systems, especially for smallholder farmers and those facing acute labor shortages. CA is a way to combine profitable agricultural production with environmental concerns and sustainability, and it has been proven to work in a variety of agro-ecological zones and farming systems. For more information on CA visit: http://www.fao.org/ag/ca/. For more information on CA rice systems see Reeves et al. (2016).
23 SRI International Network and Resources Center (SRI-Rice). 2015. Pakistan. SRI International Network and Resources Center. http://sri.ciifad.cornell.edu/countries/pakistan/
74
References
Alieu EK. 2005. Policies and strategies for promoting food security in Sierra Leone with special reference to rice. Paper presented at the WARDA workshop on Policies and Strategies for Promoting Rice Production in Sub-Saharan Africa, Cotonou, Benin, 7–9 November 2005.
Beveridge MCM, Thilsted SH and Phillips MJ. 2013. Meeting the food and nutrition needs of the poor: The role of fish and the opportunities and challenges emerging from the rise of aquaculture. Journal of Fish Biology 83:1067–84. http://onlinelibrary.wiley.com/doi/10.1111/jfb.12187/epdf
Chaytor B. 2010. The commercialisation of agriculture in Sierra Leone: Options for the legal and regulatory framework. Food and Agriculture Organisation of the United Nations Rome: FAO.
COFREPECHE. 2013. A comprehensive aquaculture baseline study: Sierra Leone. Final technical report. Project ref. N° WA-1.2-B1. Strengthening Fisheries Management in ACP Countries. Project funded by the EU. Accessed on 12 July 2016. http://acpfish2-eu.org/uploads/projects/id309/WA-1.2-B1%20FTR.pdf
Daniels A, Gutiérrez M, Fanjul G, Guereña A, Matheson I and Watkins K. 2016. Western Africa’s missing fish. London: Overseas Development Institute.
Davis P. 2015. Ebola in Sierra Leone: Economic impact and recovery. London: DFID/Adam Smith International. Accessed on 8 August 2016. http://www.adamsmithinternational.com/documents/resource-uploads/Ebola_in_Sierra_Leone.pdf
DFID/Adam Smith International. 2015. Ebola in Sierra Leone: Economic impact and recovery. Department for International Development – Gov. UK and Adam Smith International. Accessed on 29 July 2017. http://www.adamsmithinternational.com/documents/resourceuploads/Ebola_in_Sierra_Leone.pdf
[EJF] Environmental Justice Foundation. 2012. Pirate fishing exposed: The fight against illegal fishingin West Africa and the EU. London, United Kingdom: EJF.
[EPASL] Environmental Protection Agency of Sierra Leone. 2014. Fifth national report to the convention on biological diversity. Sierra Leone: Environmental Protection Agency of Sierra Leone Government of Sierra Leone.
[FAO] Food and Agricultural Organization. 2014. The state of world fisheries and aquaculture. Accessed on 14 July 2016. http://www.fao.org/3/a-i3720e.pdf
[FAO] Food and Agricultural Organization. 2016. National aquaculture sector overview: Sierra Leone. Accessed on 12 July 2016. http://www.fao.org/fishery/countrysector/naso_sierraleone/en
FAOSTAT. 2016. Food balance sheets. Accessed on 17 June 2016. http://faostat3.fao.org/browse/FB/FBS/E
[FEWS] Famine Early Warning System. 2011. Livelihood description: Sierra Leone livelihoods zoning “plus”– Famine early warning system. United States: FEWS.
Fongar A. 2014. LANN Sierra Leone in Tonkolili and Kenema District: Cross-sectional baseline survey final draft report. Welthungerhilfe, Irish Aid, Concern Worldwide.
Harding S. 2014. SRI in Sierra Leone. Accessed on 9 September 2016. https://www.google.co.uk/url?sa=t&rct=j&q=&esrc=s&source=web&cd=1&cad=rja&uact=8&ved=0a hUKEwiPyby3qIPPAhWMB8AKHZnVDc0QFggeMAA&url=https%3A%2F%2Fsriwestafrica.files.wordpress.com%2F2014%2F06%2Fsri-west-africa-newsletter.docx&usg=AFQjCNFLrVnelw2Px4bTWMSDtvjlt58ug

75
Hecht T, Abban K, Elago P, Kaunda E and Peacock N. 2012. Sierra Leone aquaculture needs assessment. NPCA Working Group on Aquaculture. South Africa: New Partnership for Africa’s Development (NEPAD) Agency.
Himelein K, Testaverde M, Turay A and Turay S. 2015. The socio-economic impacts of ebola in Sierra Leone: Results from a high frequency cell phone survey, round 3. Freetown, Sierra Leone: Statistics Sierra Leone and World Bank.
[IMF] International Monetary Fund. 2016. World Economic and Financial Surveys, World Economic Outlook Database, International Monetary Fund. Accessed on 30 September 2017. https://www.imf.org/external/pubs/ft/weo/2016/02/weodata/index.aspx
Iscandri NB. 1990. Biological observations on freshwater systems adjacent to the coast of Sierra Leone. Hydrobiologia 208:63–73.
Kamara AB. 1982. Preliminary studies to culture mangrove oysters, Crassostrea tulipa, in Sierra Leone. Aquaculture 27(3):285–94.
Lalani B, Dorward P, Kassam A and Dambiro J. 2016a. Innovation systems and farmer perceptions regarding conservation agriculture in Cabo Delgado, Mozambique. In Kassam A, Mkomwa S and Friedrich T, eds. Conservation Agriculture For Africa: Building Resilient Farming Systems In A Changing Climate. Wallingford, UK: CABI. (In press).
Lalani B, Dorward P, Holloway G and Wauters E. 2016b. Smallholder farmers’ motivations for using conservation agriculture and the roles of yield, labour and soil fertility in decision making. Agricultural Systems 146:80–90.
Larbi A. 2012. Country pasture/forage resource profiles: Sierra Leone. Rome: FAO.
Legatum Institute. 2015. The 2015 Legatum prosperity index: Sierra Leone country profile. Accessed on 10 June 2016. http://www.prosperity.com/#!/country/SLE
[MFMR] Ministry of Fisheries and Marine Resources. 2010. Policy and operational framework for fisheries of Sierra Leone. Freetown, Sierra Leone: MFMR.
[MHS and UNICEF] Ministry of Health and Sanitation, and United Nations Children’s Fund. 2014. Sierra Leone national nutrition survey 2014. Freetown, Sierra Leone: Ministry of Health and Sanitation.
[MRAG] Marine Resources Assessment Group. 2005. Review of impacts of illegal, unreported and unregulated fishing on developing countries. London: MRAG.
Neiland AE, Cunningham S, Arbuckle M, Baio A, Bostock T, Coulibaly D, Gitonga NK, Long R and Sei S. 2016. Assessing the potential contribution of fisheries to economic development: The case of post-ebola Sierra Leone Natural Resources 7:356–76. http://dx.doi.org/10.4236/nr.2016.76031
Pasqualino MM, Thilsted SH, Phillips MJ and Koroma AS. 2016. Food and nutrition security in Sierra Leone with a focus on fish in Tonkolili District. Penang, Malaysia: WorldFish. Program Report: 2016-23.
Payne AI. 1986. The Ecology of Tropical Lakes and Rivers. Chichester UK: John Wiley and Sons.
[PEMSD] Planning Evaluation Monitoring and Statistics Division. 2013. Planning Evaluation Monitoring and Statistics Division Quarterly Update. Freetown, Sierra Leone: MAFFS.
Précon. 2014. The Sierra Leonean fisheries value chain, a supply chain in statu nascendi, The Netherlands: Précon Food Management BV. The Précon Food Management BV is the name of the consultancy company undertook the study.

76
Reeves TG, Thomas G and Ramsay G. 2016. Save and grow in practice: Maize, rice, wheat: A guide to sustainablecereal production. Rome: FAO.
Sankoh SK. 2009. Aquaculture in Sierra Leone: Traditional systems and the prospect for market oriented development. [PhD thesis] University of Stirling, Scotland.
Sankoh SK. 2015. The economic importance and social values of traditional aquaculture rural Sierra Leone. Journal of Agricultural Science and Technology B 5(4):277–91.
Schweisguth MA, Bhonopha JB, Bode S, Dupras D, Elliott FJ, Fraser HK, James B, Kagbo R, Lansana D, Lavahun M et al. 2015. Sierra Leone agricultural value chain analysis. Leveraging Economic Opportunities (LEO) Report 23. Freetown, Sierra Leone: USAID.
Showers PAT. 2015. Baseline survey on the aquaculture sector in Sierra Leone. FAO Technical Cooperation Programme TCP/SIL/3502. Freetown, Sierra Leone: FAO.
[SIGI] Social Institutions & Gender Index. 2015. Country profiles: Sierra Leone. Accessed on October 10 2015. http://genderindex.org/country/sierra-leone
[SPRING] Strengthening Partnerships, Results, and Innovations in Nutrition Globally. 2015. Integrated nutrition and agriculture needs assessment for Sierra Leone. Arlington, US: USAID.
[SSL] Statistics Sierra Leone. 2014. Sierra Leone integrated household survey report, 2012. Sierra Leone: SSL.
Tacon AGJ and Metian M. 2013. Fish matters: Importance of aquatic foods in human nutrition and global food supply. Reviews in Fisheries Science 21(1):22–38.
Thakur AK, Mohanty RK, Singh R and Patil DU. 2015. Enhancing water and cropping productivity through integrated system of rice intensification (ISRI) with aquaculture and horticulture under rainfed conditions. Agricultural Water Management 161:65–76.
Turay A, Turay S, Margolis D, Rosas N and Vidarte R. 2015. Sierra Leone 2014 labor force survey report. Freetown: Sierra Leone: SSL, World Bank and International Labour Organization.
Uphoff N. 2015. The system of rice intensification (SRI): Responses to frequently asked questions. SRI-Rice. Ithaca, US: Cornell University.
[UNDP] United Nations Development Programme. 2016. Human development report Sierra Leone. Accessed on 29 July 2017. http://hdr.undp.org/en/countries/profiles/SLE
[USGS] United States Geological Survey. 2015. 2013 minerals yearbook: Sierra Leone (advanced release). Accessed on 29 July 2013 http://www.eisourcebook.org/cms/January%202016/Sierra%20Leone%20Minerals%20Yearbook%202013.pdf
[WFP] World Food Programme. 2011. The state of food security and nutrition in Sierra Leone. Comprehensive Food Security and Vulnerability Analysis (CFSVA). Freetown, Sierra Leone: WFP.
[WFP] World Food Programme. 2015. Food insecurity on the rise as Ebola abates: Application of shock impact simulation model (SISMod) to measure Ebola’s economic impacts on hunger, VAM security analysis. Freetown, Sierra Leone: WFP.
World Bank. 2013. Trading towards prosperity: Sierra Leone diagnostic trade integration study update. Washington D.C.: World Bank.

77
World Bank. 2014. Doing business 2015: Going beyond efficiency. Economy Profile 2015: Sierra Leone. Washington D.C.: World Bank.
World Bank. 2016. World development indicators. Accessed on 8 August 2016. http://data.worldbank.org/country/sierra-leone
WorldFish. 2016a. Inland valley swamp assessment study in Tonkolili District, Sierra Leone. Freetown, Sierra Leone: WorldFish.
WorldFish. 2016b. Report of the aquaculture assessment studies for Tonkolili and Bombali districts. Freetown, Sierra Leone: WorldFish.

78
Annex 1. Costs of smoking marine fish
Input CostCase study 1: Fatmata Koroma, Tombo; smoking ovens have a capacity of 400–450 dozen.400–450 dozen fish at SLL 700–1,200/dozen SLL 403,750
10 dozen bunches of wood SLL 65,000
Kindling or “chips” SLL 5,000
2 pints of kerosene SLL 6,000
Labor for laying the fish SLL 15,000
Labor for carrying the fish from the boats to the smoking house: SLL 1,000 per rubber; 6 rubbers (roughly equivalent to 400–450 dozen) comes to SLL 6,000
SLL 6,000
Total for 425 dozen (excluding own labor) SLL 500,750
Price of smoked fish per dozen, when sold at source SLL 1,326Price of smoked fish is SLL 2,000–2,500/dozen. The broken pieces are sold at SLL 70,000 per basin/bafu.
Case study 2: Mama Kamara (fish processor): Her ovens have a capacity of 500 dozen fish.Fish – 500 dozen at SLL 1,200/dozen SSL 600,000
Wood SSL 15,000
Chips SSL 18,000
4 cans of kerosene SSL 4,000
Porters to carry fish from harbor to smoking house – SLL 1,500 per rubber. One rubber contains 50 dozen fresh fish, so 10 rubbers comes to SLL 15,000
SSL 15,000
Labor for laying fish on the smoking racks (100 dozen) SLL 3,000
Total labor for smoking SSL 15,000
Labor for packing the smoked fish (if not sold in loose form direct from the smoking house) is SLL 10,000 per basin load (packed/wrapped using 2 cement bags, 2 paper bags and 2 “jonx” bags; the jonx bags can be used about twice before being replaced).
Total packing labor for 500 dozen. SSL 20,000
Paper/cardboard/bag packaging is SLL 6,000 per basin. Cost of basin itself was not counted – this can be reused. When fully packed, one basin-load carries 250–300 dozen.
Cost of packaging materials for 500 dozen. SSL 12,000
Cost per dozen when sold at source (SLL 699,000/500) SSL 1,398Note: Transport costs below are based on a fully packed basin: When fully packed, one basin-load carries 250–300 dozen.
Total costs for 500 dozen are based on 2 fully packed basins.
Transport from the smoking house to the transport park: SLL 5,000 per basin-load;. SSL 10,000
Labor for loading: SLL 2,000 per basin-load;. SSL 4,000
Transportation costs: SLL 45,000 per basin-load to Barmoi. SSL 90,000
Cost per dozen when sold at Barmoi (SLL 803,000/500) SSL 1,606Mama Kamara reported that the cost price of the smoked fish (taking into consideration the above costs, without packing and transport) comes to SLL 1,500 per dozen. She sells at SLL 2,000 or 2,200 or 2,500 per dozen, depending on where it is sold. She sometimes takes a loss.
A case study of small-scale fish processing business models with potential for improvement and scaling.

79
Annex 2. Prices of commonly available fish species from capture fisheries in the Sierra Leone market
Annex 3. Fish species consumed by households in Tonkolili District
Local name Scientific name Price range per kg (SLL)1 of fresh fish
Price range per kg (SLL)1 of smoked fish
Black gwangwa Pseudotolithus epipercus 1,250–6,250 -
Bonga Ethmalosa fimbriata 3,400–16,700 3,300–25,000
Butterfish Pteroscion peli 2,500–2,500 -
Catfish Arius latiscutatus 6,700–15,000 3,300–15,000
Crocus Pomadasys jubelini 10,000–30,000 3,000–5,000
Dani Notopterus sp. 3,000–12,000 -
Grouper Lutjanus fulgens 10,000–11,200 -
Gwangwa Psuedotolithus typus 1,250–7,700 -
Herring Sardinella maderensis 2,000–6,700 2,000–20,000
Joefish Trachinotus goreensis 5,400–10,000 2,400–8,000
Kini Sphyraena sphyraena 6,000–20,000 3,300–12,500
Kuta Sphyraena guachancho 1,100–25,000 2,500–22,000
Lati Illisha Africana 2,000–2,500 -
Lady Pseudotolithus senegalensis 3,500–37,500 1,250–8,000
Mackerel Scomberomorus tritor 2,400–20,000 2,700–10,000
Mollit Mugil cephalus 1,700 -
Pollock Decapterus rhonchus 4,700–16,000 3,300–35,000
Pomp Alectis alexandrines 2,500–8,000 3,000–10,000
Record Epinephelus goreensis 5,000–20,000 8,300–10,000
Sheephead Drepane Africana 5,000–10,000 -
Shinenose Galeiodes decadactylus 5,000–10,000 8,300–10,000
Silver fish Trichiurus lepturus 2,500 3,000–10,000
Sole Soles hexophthalma 8,000–10,000 -
Snapper Dentex canariensis 6,800–50,000 10,000–25,000
Tenney Albula vulpes 5,600–40,000 3,800–10,000
Whiting Pseudolithus brachygnathus 6,700–30,000 -1 Price range is depending on the size and month(s) of the year.Source: Ministry of Fisheries and Marine Resources (2015).
Local name Scientific nameBalan Hemichromis fasiatusBonga Ethmalosa fimbriataCatfish Arius latiscutatusCutlass Notopterus afferHerring Sardinella maderensisKalat Ilisha africana
Local name Scientific nameKente Chloroscomrus chrysurusKuta Sphyraena guachanchoPollock Decapterus rhonchuShinenose Galeoides decadactylusTilapia Oreochromis spp
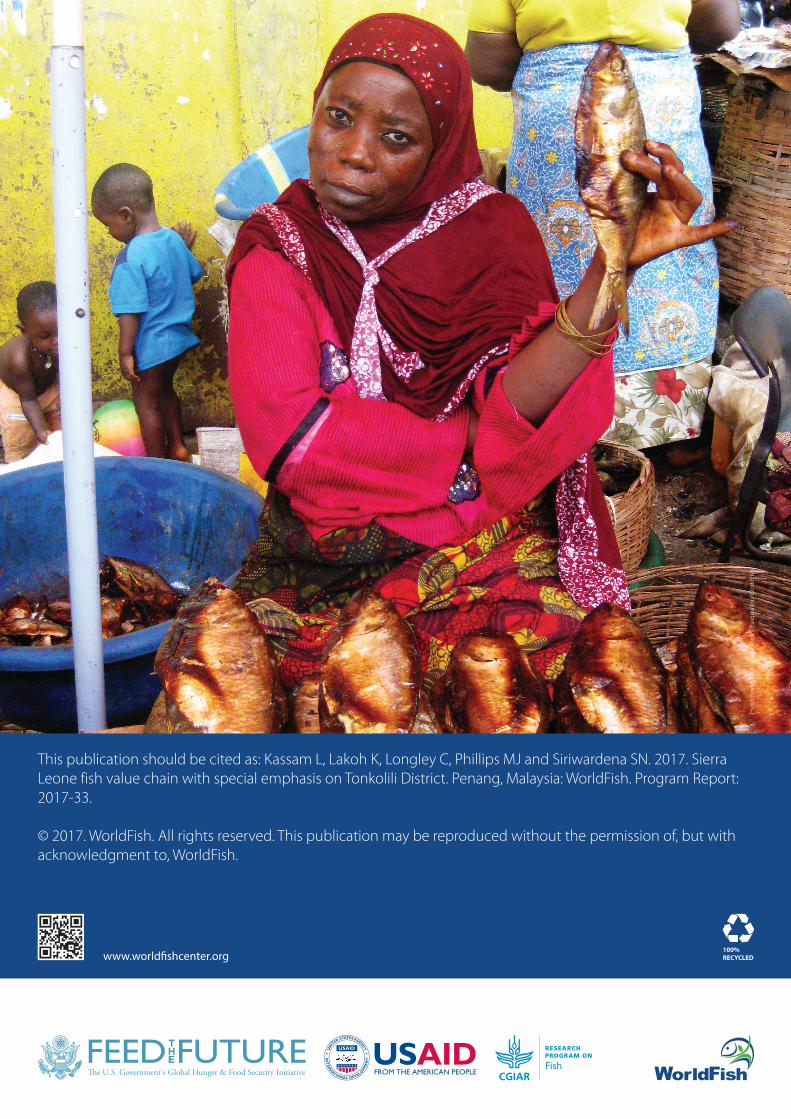
This publication should be cited as: Kassam L, Lakoh K, Longley C, Phillips MJ and Siriwardena SN. 2017. Sierra Leone fish value chain with special emphasis on Tonkolili District. Penang, Malaysia: WorldFish. Program Report: 2017-33.
© 2017. WorldFish. All rights reserved. This publication may be reproduced without the permission of, but with acknowledgment to, WorldFish.
Phot
o cr
edit:
Bac
k co
ver,
Mon
ica
Pasq
uial
ino/
Wor
ldFi
sh
www.worldfishcenter.org100%RECYCLED