sidrat asim pakistan urban forum willingness to pay study for improved water supply services in...
TRANSCRIPT

Sidrat Asim
Pakistan Urban Forum
Willingness to Pay Study for Improved Water Supply
Services in Karachi
Problem Identification Clean drinking water remains the greatest
perceived need of the people of Karachi Only 4 hours of continuous water supply Flat Rate Tariff based on floor areas results in
high consumption Low Tariff does not cover Operation and
Maintenance Cost Public forced to buy water from private water
tankers Bottled water usage for drinking purpose is
high

Water Tariff
Source: KWSB

Water Supply Summary in South Asia
Source: Water in Asian Cities, ADB report

Objectives examines the current water usage habits of
the people in the city using the Averting Expenditure Approach

Theoretical Framework
ValuationStated
Preference
Contingent
Valuation Method
Conjoint Analysis
Revealed Preference
Averting Expenditu
re Approach
Travel Cost
Method
Hedonic Pricing Method
Cost of Illness
Methods

Averting Expenditure Approach Strengths:
based on observed behaviors and market data relatively simple to do
Weaknesses: underestimation of the true WTP

Averting Behavior
Water Tankers
Bottled Water
Suction Pumps
Boring Wells
Water Purification

Description of the Study Site

Karachi

Water Supply 354573 residential water connections in
Karachi 58% households connected Water demand estimated at 1080 million
gallons daily (MGD) Water Supply is limited to 650 MGD K-IV Project may augment water supply to
1300 MGD in 5 years Water Tanker mafia siphons off over 40%
water supply


Gulshan-e- Iqbal One of eighteen
towns in Karachi Main residential area
of the city Population of over a
million people Educational hub of
the city with a concentration of higher education institutions within its vicinity

Methodology
Primary Survey

Survey Site

Survey
• Face to face interviews
• Representative of all income groups and ethnicities in Karachi
• Conducted on public holidays in last week of December 2012
• 718 households visited by eleven surveyors
Population: Connected Households
Sample: 400 households

Results
Descriptive Statistics

Importance of Water
• 37% of the respondents rated water as the most important public utility
1 2 3 4 5 60%
5%
10%
15%
20%
25%
30%
35%
40%37%
33%
18%
9%
2%0%
Ranking of Water

Ratings of various public goods
Water ranks second most important public utility after health
Health Water School Power Road Telephone0
1
2
3
4
5
6R
ati
ng

Income and Expenses
• Households spend the least amount on piped water

Income
Less than Rs. 10,000
1%
Rs. 10,000-20,0007%
Rs. 20,000 - 50,00037%
Rs. 50,000 - 100,00032%
Greater than PKR 100,00023%

Source of Water used for Washing
• 99% use piped water as primary source of water for washing
• 56% use boring wells as a secondary source for water
• 28% use water tankers as a secondary source for waterPrimary Washing
SourcesSeconadary Washing
Sources
0%
10%
20%
30%
40%
50%
60%
70%
80%
90%
100%
0.990220048899756
0.00733496332518337
0.56140350877193
0.280701754385965
1.75%
Piped Water Water Tankers Public TapBoring Well Other

Source of Water used for Drinking
• 60% people use piped water as a primary source
• 22% use mineral water a
• 4% use water from water tankers.
• 36% use mineral water as a secondary source of drinking water
Primary Drinking Sources
Secondary Drinking Sources
0%
10%
20%
30%
40%
50%
60%
70%
80%
90%
100%
60.64%47.89%
22.49%
36.62%
7.04%
Piped Water Water Tankers Mineral Water
Public Tap Boring Well Other

Current Water Satisfaction• Surveyed
households receive an average of 27 hours of water supply in a week
• Users were only moderately satisfied with current water supply
Overa
ll Su
pply
Hours
of S
uppl
y
Volu
me
of S
uppl
y
Qualit
y of
Wat
er
Relia
bilit
y of
Sup
ply
0
1
2
3
4
5
2.63 2.62 2.70 2.60 2.48
Rati
ng

Coping Behavior• 80% of the
households run motors
• 10% have a well installed
• electric motors run for 3 hours/day
• Onetime cost of having a well installed was Rs. 45800 on average
• 23% use water tankers
• 50% drink mineral water File: () 30 Dec 2013
Venn Diagram
N = 409
Motor
Well
(80 %)
(11 %)
(50 %) (23 %) Mineral Water
Tanker
27 (7 %)
20 5 %
133 33 %
21 5 %
5 1 %
16 4 %
97 24 %
1 0 %
1 0 %
28 7 %
14
3 %
2
0 %
9 %
38
6 1 %
% of total

Coping Cost
Tankers Mineral Water0
500
1000
1500
2000
2500
3000
3500
4000
3589
2981
(Rs./
mon
th)

Coping costs by Income
• Coping costs are higher for higher income households
Less
than
PKR
10,
000
PKR 1
0,00
0 - 2
0,00
0
PKR 2
0,00
0 - 5
0,00
0
PKR 5
0,00
0 - 1
00,0
00
Great
er th
an P
KR 1
00,0
000
1000
2000
3000
4000
5000
6000R
s./
mon
th

Water Purification Methods
60% of the households use some form of water purification method
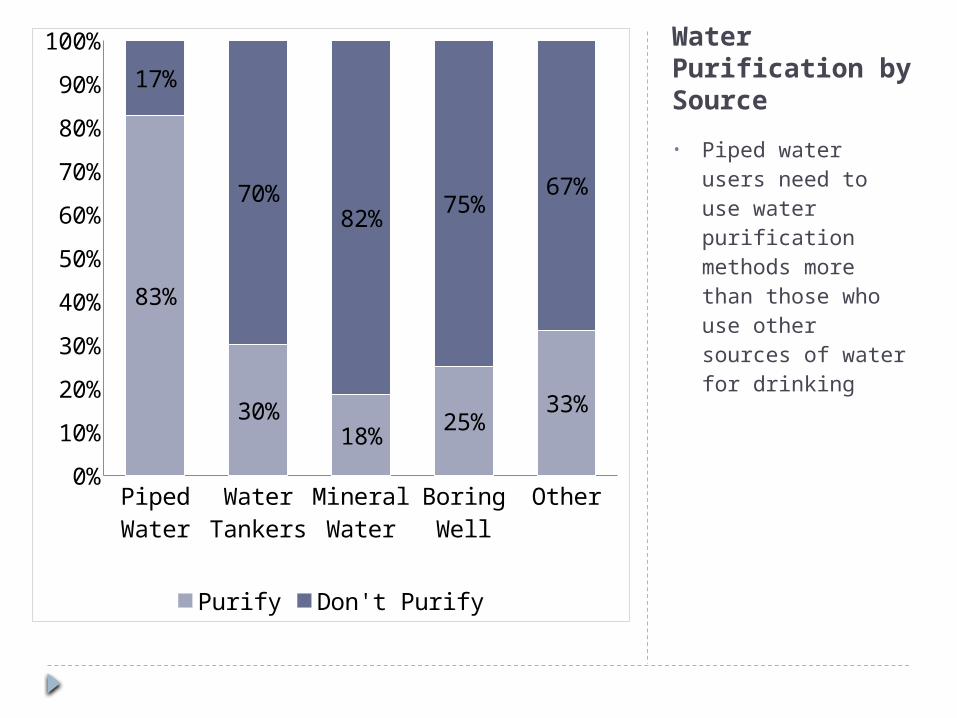
Water Purification by Source
• Piped water users need to use water purification methods more than those who use other sources of water for drinking
0%
10%
20%
30%
40%
50%
60%
70%
80%
90%
100%
83%
30%18% 25%
33%
17%
70%82% 75%
67%
Purify Don't Purify

Empirical Results

• Household Income and Household size affect Coping costs positively.
(1) (2)
LABELS Coping Cost
Water Purification
Income Class 885.0*** -0.266***
(3.257) (-3.784)
Household Size 121.6**
(2.184)
Constant -409.3 1.235***
(4.579)
Observations 189 390
R-squared 0.102

Discussion

Limitations
Study only focuses on the demand side
Study does not deal with the institutional weakness of the KWSB or issues of bill collection and financial management
Study is restricted to Blocks 4 and 7 of Gulshan-e-Iqbal town in Karachi

Thank you