side-by-side comparison of passive mems strain test...
TRANSCRIPT

Copyright © 2001 by the American Society for Testing and Materials
Nathan D. Masters,1,2 Maarten P. de Boer,1 Brian D. Jensen,1,3 Michael S. Baker,1 and David Koester4
Side-by-Side Comparison of Passive MEMS Strain Test Structures under Residual Compression
REFERENCE: Masters, N. D., de Boer, M. P., Jensen, B. D., Baker, M. S., and Koester, D., “Side-by-Side Comparison of Passive MEMS Residual Strain Test Structures under Residual Compression,” Mechanical Properties of Structural Films, STP 1413, S. B. Brown and C. L. Muhlstein, Eds., American Society for Testing and Materials, West Conshohocken, PA, Online, Available: www.astm.org/STP/1413/1413_23, 15 September 2001.
ABSTRACT: Knowledge and control of residual strain is critical for device design in MEMS, and therefore it is important to establish standards for residual strain measurement. In this study, pointer, microring, bent-beam, and fixed-fixed beam test structures are used to evaluate residual strain both theoretically and experimentally. An equation that enables easier evaluation of bent-beam structures is derived. Also, a finite difference model that incorporates the non-idealities of fixed-fixed beams and determines an optimum fit to the measured deflection curve is presented. The model allows accurate residual strain evaluation of each buckled fixed-fixed beam. Experimentally, pointer structures were found to be susceptible to adhesion. Microrings, intended for residual tension assessment, also could not be evaluated because the residual strain was compressive. Bent-beam and fixed-fixed beams could both be evaluated. The main criterion for test structure effectiveness was taken to be the repeatability of residual strain on structures in close proximity; each should exhibit the same value. Using optical microscopy, the residual strain of bent-beams was determined with ± 13 µε repeatability based on standard deviation of adjacent structures of similar design. Using optical interferometry, the residual strain of fixed-fixed beams was determined with ± 2 µε repeatability based on standard deviation for adjacent beams of different lengths. The strain values obtained from the two structures are in reasonably good agreement. Cantilevers were also evaluated to obtain film curvature values.
KEYWORDS: residual strain, MEMS test structures, bent-beams, microrings, pointers, fixed-fixed beams, cantilevers, optical metrology
Introduction Polycrystalline silicon (polysilicon), used in integrated circuits and
Microelectromechanical Systems (MEMS), is commonly deposited by chemical vapor deposition. Residual strain in polysilicon thin films is a result of the interactions of many factors that may be present during deposition, including thermal environments, dopants, impurities, and grain coalescence, orientation and growth, and surface as well as interfacial stress [1-6]. Because of the importance of residual strain in mechanical design and as a measure of fabrication control, many techniques and structures have been
1 Sandia National Laboratories, PO Box 5800, Albuquerque, NM 87185,
www.mdl.sandia.gov/Micromachine 2 current address – Mechanical Eng. Dept., Brigham Young University, Provo, UT 84602. 3 current address – Mech. Eng. Dept., University of Michigan, Ann Arbor, MI 48109-2125. 4 Cronos Integrated Microsystems, 3026 Cornwallis Rd., Research Triangle Park, NC 27709.

MECHANICAL PROPERTIES OF STRUCTURAL FILMS 2
suggested for residual strain measurements. However, it remains difficult to quantify strain to a known accuracy. Further, it is not known whether various laboratories will measure the same value even on the same structures. Usually, low residual strain is desired for device designs, leading to test structure designs that must be highly compliant to enable strain evaluation. Depending on the test structure design, this can lead to adhesion (i.e., stiction) or out-of-plane buckling that can render the test structures ineffective.
To address these issues, a round robin evaluation of test structures was organized and sponsored by the American Society of Testing and Materials (ASTM) Task Group E08.05.03. The intent of the study was to use passive structures that have been previously proposed and that could be easily analyzed. Pointers [7], bent-beams [8,9] microrings [10], and fixed-fixed beams [11-14] were chosen. Cantilevers [15,16] were also studied to obtain stress gradient information. In this paper, we report on the analysis of the test structures made by our group at Sandia National Laboratories. One other group has analyzed its results [17].
To decide how to measure and analyze the test structures, we made the following two considerations. First, nondestructive testing is important for round robin testing, and is also important in general to MEMS. Second, because residual strain can vary across a wafer, from wafer to wafer, and from lot to lot, it is important to quickly yet accurately assess residual strain values. Our analysis criteria are as follows:
1) The metrology is only by optical methods. 2) Only two-dimensional deflections and analyses are considered.
The first criterion allows for rapid and noncontacting measurements. While scanning electron microscopy (SEM) metrology enables higher resolution for in-plane measurements, we ruled it out as being too expensive and time consuming for routine metrology. Also, any concern that electrostatic charging may induce test structure deflection during the measurement is alleviated. Furthermore, for out-of-plane measurements, optical interferometry is more sensitive than SEM and is well calibrated. The second criterion is in keeping with most of the literature, and reflects our interest in keeping the analysis as simple as reasonably possible.
Given these criteria, our assessment of the test structures is based on addressing the following questions in the Discussion section: 1) How well are the critical deflections measured? 2) To what degree do the test structure deflections reflect the 2-D analysis? 3) How repeatable are the measurements on similar structures in close proximity? 4) What are the area requirements? 5) How long does it take to determine the strain value?

MASTERS ET AL. ON COMPARISON OF TEST STRUCTURES 3
FIG. 1—Test structures used for residual strain evaluation (top views).
Test Structures and Analysis The test structures we studied are shown schematically in Fig. 1. Critical
geometric parameters for each device are indicated. We present the results of the two-dimensional mechanics analyses in this section. The equations are derived in Appendices A-D. For the pointers (Appendix A) and the microrings (Appendix C), literature references have been used. For the bent-beams (Appendix B), we introduce a new derivation that is simpler to use than previous literature references and applies for the strain range examined here. For idealized fixed-fixed beams (Appendix D), Euler buckling theory is used for first order modeling. This is appropriate because the test structures were under residual compression. Our approach for 2-D finite difference modeling incorporating the effects of boundary compliance in fixed-fixed beam structures is also outlined in this section. Cantilevers, also shown in Fig. 1, are used to measure curvature (allowing the stress gradient to be deduced), and are described in this section along with the fixed-fixed beams.
The analysis for several of the test structures (pointers, microrings, and rigidly supported fixed-fixed beams) can be carried out without knowledge of Young’s modulus, E. However, the analyses for bent-beam sensors and the 2-D finite difference model for

MECHANICAL PROPERTIES OF STRUCTURAL FILMS 4
the buckled fixed-fixed beams require E to be known. We will report the uniaxial residual strain Rε of these devices assuming E = 165 GPa [18]. Uniaxial residual stress
Rσ can be calculated from Rσ = E Rε (the loading condition of fixed-fixed beams is within 1% of plane stress conditions [19] - therefore no adjustment to E is made).
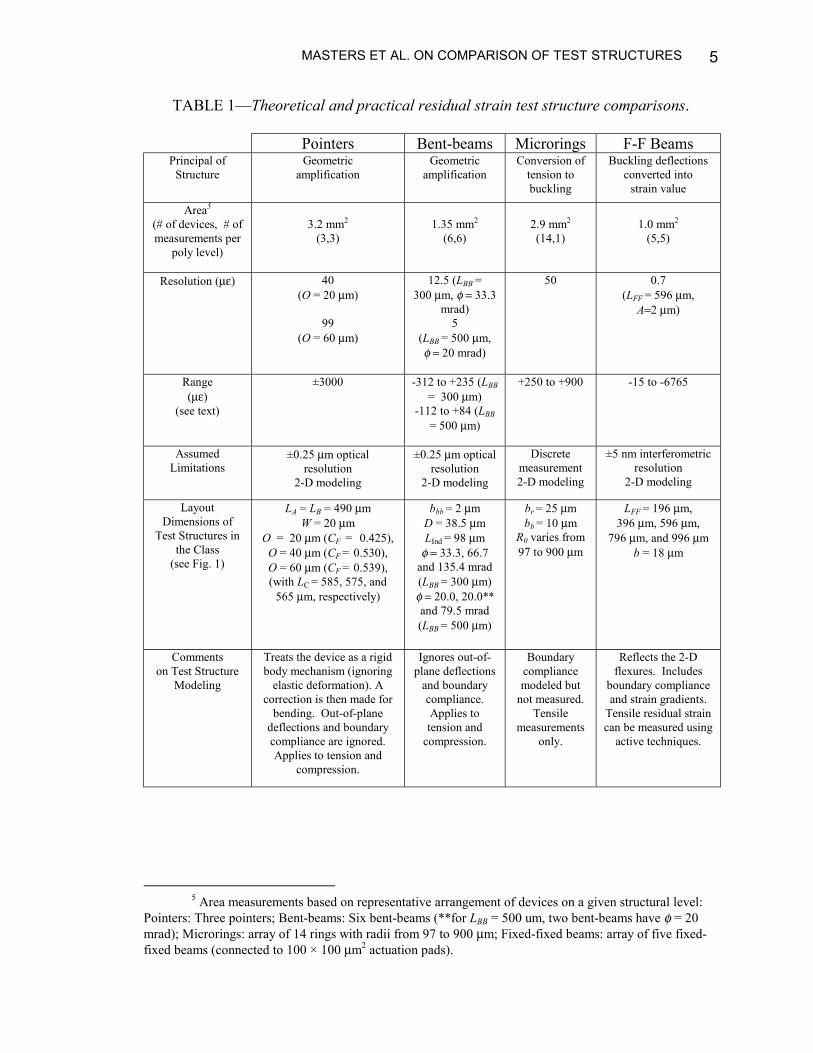
In Table 1, we compare the various structures from the point of view of test structure principle, area consumed, typical resolution and strain range, assumed limitations, layout dimensions and comments on the analyses. The test structures can be separated into two main families according to the primary measurement technique used to extract the residual strain value: in-plane (pointers and bent-beams) and out-of-plane (microrings and fixed-fixed beams). The area information in Table 1 is for all the structures on a given level of polysilicon, and the number of associated residual strain measurements is given as well. In making strain resolution comparisons, we assume a 0.5 µm (± 0.25 µm) deflection resolution for in-plane devices, and a 10 nm (± 5 nm) resolution for the out-of-plane measurements. These values stem from the limitations of the brightfield and interferometry optical techniques, respectively. The resolution values reflect the uncertainty in strain measurements due to metrology only. Because these structures are fabricated side-by-side, we obtain information on the relative accuracy of structures in a given family. For absolute accuracy, sensitivity to film thickness, line width, boundary conditions, and 3-D deflections would also have to be considered. Each test structure in Table 1 is discussed next.
Pointers Pointers are in-plane test structures that make use of geometric layout to amplify
small displacements induced by residual strain (compressive or tensile). The amplified output of the pointer indicator, y, is measured on a scale attached to the substrate [7]. The support beam lengths, LA and LB, are typically identical. Increasing the length of LC or decreasing the separation distance O will enhance the amplification effect. Displacement readings at the pointer end are used to calculate the residual strain levels. The analysis in Ref 7, which is repeated in Appendix A, assumes an ideal geometric relationship between residual strain and the displacement of the indicator, augmented by a correction factor, CF, derived from finite element models of the devices, resulting in Eq 1,
FCBA
R COLLLOy 1
)2/)(( ++=ε . (1)
The area of pointers is relatively large at ~1 mm2 per test structure. The resolution is 40 µε, assuming an optical resolution of light microscopy of 0.5 µm (±0.25 µm), and dimensions of a studied device (LA = LB = 490 µm, LC = 575 µm, W = 20 µm, O = 20 µm and CF = 0.425). Three pointers were used here with O ranging from 20 µm to 60 µm. We determined the values of CF for the geometries used here from finite-element analysis over a range of ± 3000 µε. Pointers are capable of measuring compressive and tensile residual strain for negative (left) and positive (right) indicator values, respectively. In keeping with the 2-D analysis, the possibilities of buckling across the LA + LB support arms, adhesion to the substrate and strain gradient along the pointer length (which may cause the tip to contact the substrate) are not considered.
MASTERS ET AL. ON COMPARISON OF TEST STRUCTURES 5
TABLE 1—Theoretical and practical residual strain test structure comparisons.
Pointers Bent-beams Microrings F-F Beams Principal of
Structure Geometric
amplification Geometric
amplification Conversion of
tension to buckling
Buckling deflections converted into
strain value
Area5 (# of devices, # of measurements per
poly level)
3.2 mm2
(3,3)
1.35 mm2
(6,6)
2.9 mm2 (14,1)
1.0 mm2
(5,5)
Resolution (µε) 40 (O = 20 µm)
99
(O = 60 µm)
12.5 (LBB = 300 µm, φ = 33.3
mrad) 5
(LBB = 500 µm, φ = 20 mrad)
50 0.7 (LFF = 596 µm,
A=2 µm)
Range (µε)
(see text)
±3000 -312 to +235 (LBB = 300 µm)
-112 to +84 (LBB = 500 µm)
+250 to +900
-15 to -6765
Assumed Limitations
±0.25 µm optical resolution
2-D modeling
±0.25 µm optical resolution
2-D modeling
Discrete measurement 2-D modeling
±5 nm interferometric resolution
2-D modeling
Layout Dimensions of
Test Structures in the Class
(see Fig. 1)
LA = LB = 490 µm W = 20 µm
O = 20 µm (CF = 0.425), O = 40 µm (CF = 0.530), O = 60 µm (CF = 0.539), (with LC = 585, 575, and
565 µm, respectively)
bbb = 2 µm D = 38.5 µm LInd = 98 µm
φ = 33.3, 66.7 and 135.4 mrad (LBB = 300 µm) φ = 20.0, 20.0** and 79.5 mrad (LBB = 500 µm)
br = 25 µm bb = 10 µm
R0 varies from 97 to 900 µm
LFF = 196 µm, 396 µm, 596 µm,
796 µm, and 996 µm b = 18 µm
Comments on Test Structure
Modeling
Treats the device as a rigid body mechanism (ignoring
elastic deformation). A correction is then made for
bending. Out-of-plane deflections and boundary compliance are ignored. Applies to tension and
compression.
Ignores out-of-plane deflections
and boundary compliance. Applies to tension and
compression.
Boundary compliance modeled but
not measured. Tensile
measurements only.
Reflects the 2-D flexures. Includes
boundary compliance and strain gradients.
Tensile residual strain can be measured using
active techniques.
5 Area measurements based on representative arrangement of devices on a given structural level:
Pointers: Three pointers; Bent-beams: Six bent-beams (**for LBB = 500 um, two bent-beams have φ = 20 mrad); Microrings: array of 14 rings with radii from 97 to 900 µm; Fixed-fixed beams: array of five fixed-fixed beams (connected to 100 × 100 µm2 actuation pads).

MECHANICAL PROPERTIES OF STRUCTURAL FILMS 6
Bent-Beams Bent-beams also take advantage of geometric layout to amplify in-plane
displacements induced by residual strain [8,9]. We develop in Appendix B a linear solution. The displacement, δ, of the indicators on freestanding structures is measured and the residual strain level is then computed from
( )
−+
++
=
φφ
φφφφφ
δε
cos12
cos2
cossin6
sin12
cossin
3
3
4
3
BByyBBIndBB
IndyyBByyBB
RLILwtLL
LILILwt
, (2)
where L is the support beam span and LInd is the length of the indicator. For the double beam geometry in this study, wt = )(2 tbBB is the support cross sectional area and
( )12/2 3BByy btI = is the in-plane moment of inertia. Also, φ is the support beam angle
defined as [ ]BBLDD 2/)(arctan 0 −=φ , as indicated in Fig. 1. Our derivation for Eq 2 is distinct from those in Refs 8 and 9. It considers the residual strain in both the indicators and the supporting beams using Castigliano's theorem6. Equation 2 is accurate at low
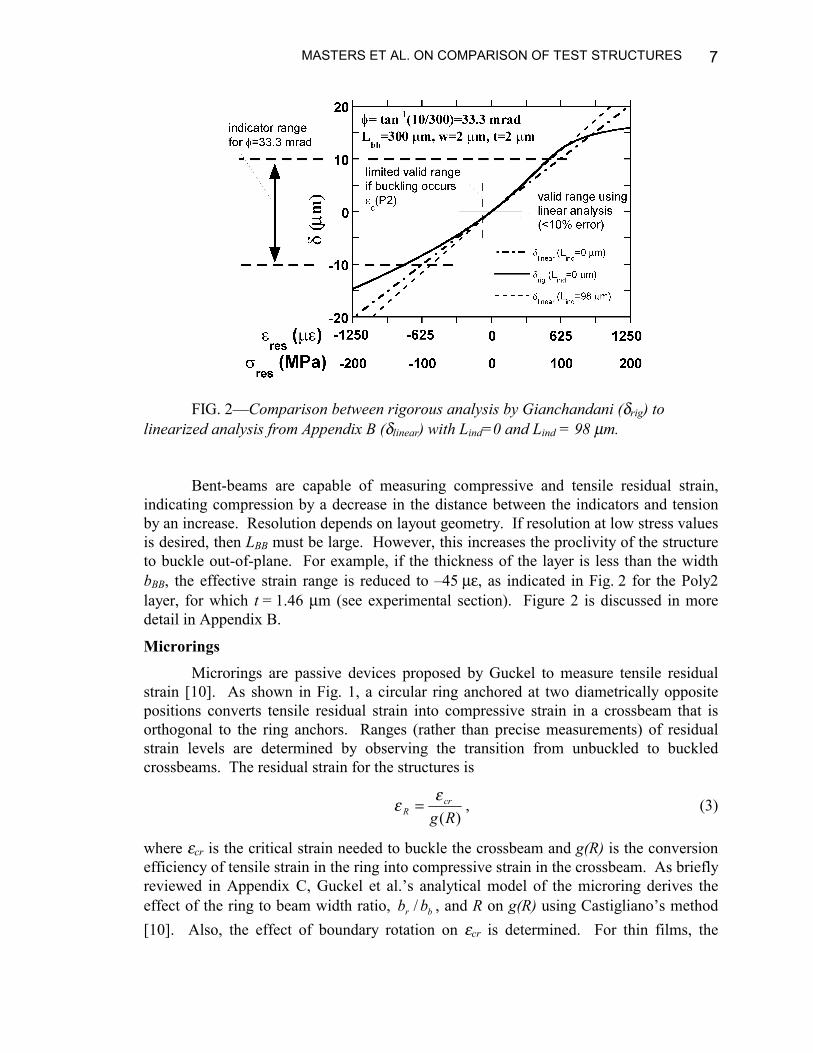
Rε values and is independent of E. Importantly, it is more quickly applied than the approaches in Refs 8 and 9. Also, the effect of LInd, not considered in Refs 8 and 9, is accounted for here. However, nonlinear effects, important at high Rε values as detailed in Ref 8, are not considered. In Fig. 2, we quantitatively compare the three cases for a specific geometry.
The area of bent-beams is small at ~0.23 mm2 per structure. The resolution is 12.5 µε assuming an optical resolution of light microscopy of 0.5 µm (±0.25 µm), and a layout representative of the studied devices (LBB = 300 µm, φ = 33.3 mrad, bbb = t = 2 µm and LInd = 98 µm). The strain range is defined as shown in Fig. 2. At high residual strain values ( Rε < -313 µε, Rε > 235 µε, based on 10% deviation in deflection from Ref 8), Eq 2 loses accuracy. However, this is beyond the acceptable strain level of many MEMS processes. It should be noted that for the layout dimensions considered in Fig. 2, the deflection range of the device is ±10 µm. If Eq 2 were used over this range, the accuracy would remain within 30%. Bent-beam incremental sensitivity over the entire range of the structure has been discussed in detail [8]. Five geometrical variations were used here, with φ = 33.3, 66.7 and 135.4 mrad (LBB = 300 µm), and φ = 20.0, 20.0 and 79.5 mrad (LBB = 500 µm). We note that two structures with φ = 20.0 mrad at LBB = 500 µm were laid out.
6 Castigliano's theorem is an energy method for determining the elastic deflection of a system. It
requires that deflections be linear and elastic. As such the strain energy, U, stored in the system may be computed as the area under the load-deflection curve (which will be a triangle). The deflection of the system can then be found by differentiating the strain energy with respect to a load, P, acting in line with the deflection direction of interest PU ∂∂=∆ (in many cases this is accomplished by virtual loads). This method works for axial, bending, transverse shear, and torsional loading. See for example Ref 20.
MASTERS ET AL. ON COMPARISON OF TEST STRUCTURES 7
FIG. 2—Comparison between rigorous analysis by Gianchandani (δrig) to linearized analysis from Appendix B (δlinear) with Lind=0 and Lind = 98 µm.
Bent-beams are capable of measuring compressive and tensile residual strain, indicating compression by a decrease in the distance between the indicators and tension by an increase. Resolution depends on layout geometry. If resolution at low stress values is desired, then LBB must be large. However, this increases the proclivity of the structure to buckle out-of-plane. For example, if the thickness of the layer is less than the width bBB, the effective strain range is reduced to –45 µε, as indicated in Fig. 2 for the Poly2 layer, for which t = 1.46 µm (see experimental section). Figure 2 is discussed in more detail in Appendix B.
Microrings Microrings are passive devices proposed by Guckel to measure tensile residual
strain [10]. As shown in Fig. 1, a circular ring anchored at two diametrically opposite positions converts tensile residual strain into compressive strain in a crossbeam that is orthogonal to the ring anchors. Ranges (rather than precise measurements) of residual strain levels are determined by observing the transition from unbuckled to buckled crossbeams. The residual strain for the structures is
)(Rg
crR
εε = , (3)
where εcr is the critical strain needed to buckle the crossbeam and g(R) is the conversion efficiency of tensile strain in the ring into compressive strain in the crossbeam. As briefly reviewed in Appendix C, Guckel et al.’s analytical model of the microring derives the effect of the ring to beam width ratio, br bb / , and R on g(R) using Castigliano’s method [10]. Also, the effect of boundary rotation on εcr is determined. For thin films, the

MECHANICAL PROPERTIES OF STRUCTURAL FILMS 8
normal mode of buckling is out-of-plane. If brightfield microscopy is used, detection of buckling requires focal plane adjustments. Interferometry is a more sensitive technique for detecting buckling. As suggested in Ref [7], a critically-buckled test structure is established when the crossbeam center deflection is ~0.6t, where t is the film thickness.
The area occupied to obtain a single measurement from microrings is large—2.9 mm2. To determine the strain resolution and the range over which residual strain can be measured, Drieënhuizen et al. [7] showed that the number of buckling structures required is
1)1log(
)/log( minmaxmin −
+=
rN εε
, (4)
where Nmin is the minimum number of structures, εmax and εmin are the upper and lower limit of the desired range of study, and r is the resolution (in percent) of the measurement. Using this equation we can determine that 40 microrings would be required for a range of 10-500 µε with a resolution of 10% of the range. In this study, 14 microrings of various sizes were distributed in each level of polysilicon, with a designed resolution of approximately 50 µε over a range from 250 to 900 µε tensile.
The microring is in reality a three-dimensional structure. It was demonstrated by 3-D finite element analysis that for small values of rb , post-release microring shortening in the beam direction versus the constraining direction increases the critical strain for buckling [21]. Also, increasing the length of the connection supporting the ring decreases the critical strain [21]. Further, the strain gradient has been identified as affecting the flexures of the microring [22], meaning that the entire shape and not only the crossbeam flexures must be measured in order to correctly interpret the structure. We note that interferometric measurements integrated with 3-D modeling could be applied to reduce the required number of microrings. The technique would be similar to but more complicated than that used with cantilever and fixed-fixed beams covered in the next section.
Fixed-Fixed Beams Fixed-fixed beams have been used as passive structures for compressive strain
measurement by detecting buckling in an array of beams similar to the measurements of microrings [7,10,11,23]. However, the amplitude is sensitive to residual stress in the film, and this allows each buckled beam to be used for residual strain measurement. From Euler buckling theory as in Appendix D, residual strain for each buckled beam is determined from
+=
34
22
2
2 tALFF
Rπε , (5)
where A is the amplitude of the buckling deflection, LFF is the beam length and t is the beam thickness. The shape will be sinusoidal according to
2/2/,2cos12
)( FFFFFF
LxLL
xAxz ≤≤−
+= π . (6)

MASTERS ET AL. ON COMPARISON OF TEST STRUCTURES 9
The area of fixed-fixed-beams is small at ~0.20 mm2 per structure. Considering that A can be measured very well by interferometry, Eq 5 is very accurate for
RcrFF tLL επ 3/1.11.1 =≈> , (7)
where crL is the critical buckling length, as discussed in Appendix D. From Eq 6, the approximate strain resolution is
22.5FF
RL
AA ⋅∆=∆ε , (8)
where A∆ = 10 nm is the amplitude uncertainty. For example, with A∆ = 10 nm, FFL = 596 µm, and A = 2 µm, a value of Rε∆ = 0.7 µε (± 0.35 µε) is calculated. A lower
limit to the strain range of 15 µε can be estimated from Eq 5 using values of t = 2 µm, A = 0.05 µm (minimum detected amplitude) and FFL = 996 µm. Likewise, an upper range of 6765 µε can be approximated using values of t = 2 µm, A = 10 µm and
FFL = 196 µm (upper limit of small-slopes assumption in Appendix D). Five beams of lengths from 196 µm to 996 µm in 200 µm increments were used in the layout. Fixed-fixed beams may also be tested electrostatically, allowing extension to the case of residual tension [12-14,24].
The modeling in Appendix D does not take into account non-idealities such as boundary compliance, unloaded beam takeoff angle or strain gradient. To more accurately extract the residual strain, we can compare the full deflection curve (rather than just the amplitude) with a two-dimensional finite difference model (FDM). The FDM incorporates these non-idealities. We have applied it to the case of electrostatically actuated cantilevers [16] and fixed-fixed beams [13,14,24], and apply it in this paper to the case of passively buckled beams. Figure 3a schematically represents the FDM. The beam is discretized into elements having the material and cross section properties of the beam. Using the Bernoulli-Euler equation, deflections are calculated by performing the numeric integrals of successive loading, moment, and angular deflection profiles.
As shown in Fig. 1, cantilevers of dimensions similar to the fixed-fixed beams were also placed on the test chip. Unloaded cantilevers contain curvature information, and their deflection curve is closely approximated by
2/)( 2xxxz o κθ += , (10)
where x is the position along the beam beginning at the support post. Our procedure to accurately determine unloaded beam takeoff angle oθ and film curvature κ (due to strain gradient through the thickness of the film) from interferometric data has been described in Ref 16. Knowing κ from the cantilever beam, the internal moment due to strain gradient Mi is assigned according to κIEM i −= . (11) Figure 3b shows the support post model used in the FDM. Loaded beam takeoff angle θ is different from oθ in a cantilever due to the moment in the buckled beam at the support post. The contributions to θ are from oθ , the moment due to buckling and Mi.

MECHANICAL PROPERTIES OF STRUCTURAL FILMS 10
FIG. 3—Finite difference model and support post model diagrams.
The FDM for the case of passively buckled fixed-fixed beams was first compared and shown to agree with Eqs 5 and 6 for rigid boundaries. It also showed excellent agreement with analytical theory that describes the pre- (|εR| < |εcr|), transition (|εR| ~ |εcr|) and post buckling (|εR| > |εcr|) regimes for compliant boundaries [25], as shown in Fig. 4. Finally, as described in Ref 26, negative oθ (cantilever takeoff angle is down) induces downward buckling, while negative strain gradient (cantilever curves down) induces upward buckling. The FDM also agrees with these predictions. These checks validate that the FDM appropriately handles the buckled beam mechanics.
When evaluating deflection curve data in our FDM implementation, θ and Rε are simultaneously iterated upon in an optimization routine that minimizes the error between the modeled and measured deflection curve. Torsional compliance exerts a measurable effect on the deflection curve. Therefore, unlike Ref 25, this approach does not require finite element analysis of the boundaries conditions as input to the model, because the effect of the boundaries is taken into account by the optimization routine. The analysis here includes only the torsional compliance and not the axial compliance of the boundaries. However, for the beams analyzed in the experimental section, the effect of M on support post flexures is much larger than that of axial force P.
FIG. 4—Using the same boundary conditions, FDM agrees with analytical model for
buckling of fixed-fixed beams.

MASTERS ET AL. ON COMPARISON OF TEST STRUCTURES 11
Experimental The test structures were processed as part of the Multi-User MEMS Processes
(MUMPs™) MUMPS28 fabrication lot. Utilizing conventional surface micromachining technology, MUMPS provides three structural layers of polysilicon. Each of the test structures described above was fabricated side-by-side on a single test chip in the Poly1, Poly2, and Poly1/2 laminate structural layers. The nominal thicknesses of the layers are 2.0, 1.5, and 3.5 µm, respectively, and were measured at t = 2.00, 1.46, and 3.45 µm using profilometry [27]. The minimum allowable line width for structural layers is 2.0 µm. Typical etch profiles are 88-90º, and typical line width loss from the mask drawing is 0 to 0.2 µm.
The structures were released from the sacrificial oxide layers using an HF acid etch. To minimize stiction, supercritical carbon dioxide drying [28] was applied. After processing, the chips were placed on an adhesive, covered, and sent first to Sandia National Laboratories for analysis. The test structures were fabricated both over a Poly0 ground plane, and over nitride. We report the results of the former only, as they were less susceptible to adhesion (stiction) problems. Our group then sent parts to the next laboratory, which performed its testing, and the round robin continued sequentially. The evaluation period was from February to May, 1999, and a meeting was held in Seattle, Washington in May of 1999 to discuss results of the round robin.
All in-plane deflections were measured using high magnification bright field microscopy (100X objective, NA = 0.9). Magnification will depend on the focus used for each test structure. To minimize variation, the same operator focused and recorded all of the images. Optical micrographs were recorded on a CCD camera. With integrated circuit fabrication techniques, the pitch (linewidth and space) is well known. In-plane calibration was achieved by counting the pixels between Poly0 lines of 20 µm pitch. Transitions in intensity at line edges were used to determine the edge locations. For the 100X objective, a 60 µm length corresponded to 470 pixels, yielding a calibration factor of 0.128 µm/pixel.
Out-of-plane deflections were measured by interferometry (5X objective, NA = 0.09). As shown in Fig. 5, Michelson interferometry with green light of wavelength λ = 546 nm (obtained from an interference filter of 4 nm linewidth (HWFM) as characterized by spectrum photometry) was chosen because polysilicon is only weakly transmissive at this wavelength. This eliminates confusion with substrate reflections that arise in multi-wavelength interferometry techniques. Interferometry allows rapid acquisition of qualitative and quantitative out-of-plane deflection data (see Figs. 6–10). Interference patterns result from a difference in phase between the light reflected from the wafer and the reference surface. The resulting image is a superposition of the test structure and the interference pattern with fringes representing contour lines of the out-of-plane deflection. The direction of out-of-plane deflection (up or down) is determined by adjusting the focus and observing the direction of fringe movement. Images were captured on the CCD camera for further analysis. Linescans along the length of the structures are recorded. Each fringe in the interference pattern indicates a deflection of 1/2 wavelength, or 273 nm. Pixel by pixel out-of-plane deflections are extracted by interpolating linescan intensity data. The out-of-plane resolution of this technique is

MECHANICAL PROPERTIES OF STRUCTURAL FILMS 12
better than 10 nm/pixel. In-plane pixel length calibration was achieved by measuring a structure of known length, with accuracy of about 1 pixel in 200.
FIG. 5—Schematic of interferometric microscope.
TABLE 2—Qualitative assessment from interferometry.
Test structure
Poly1 Layer Poly2 Layer Poly1/2 Layer Further Study?
Pointers Adhered (Fig. 6) Adhered Adhered No: adhered
Bent-beams
LBB = 300 µm: free LBB = 500 µm: free minimal out-of-plane deflections
LBB = 300 µm: buckled up ~two fringes LBB = 500 µm: two adhered, one buckled up ~three fringes (Fig. 7)
LBB = 300 µm: free LBB = 500 µm: free minimal out-of-plane deflections
Yes: evaluate effect of buckling for P2 structures
Micro-rings
No flexures apparent: compression (Fig. 8)
Flexures in crossbeams and rings due to stress gradient (Fig. 8)
Not attached to substrate. Not properly anchored
No: incompatible stress state
Canti-levers
LCB = 196 µm: bending down LCB = 396-996 µm: tip contacting (Fig. 9)
LCB = 196 µm: bending down LCB = 396 µm: tip contacting LCB = 596-996 µm: long section adhered
LCB = 196-596 and 996 µm: bending down LCB = 796 µm: tip contacting (adhesion)
Yes: curvature measurement
Fixed-fixed
Beams
LFF = 196, 396 µm: flat LFF = 596, 996 µm: buckled up LFF = 796 µm adhered
LFF = 196 µm: buckled up ~½ fringe (Fig. 10) LFF = 396-996 µm: buckled up many fringes (Fig. 10)
196-796 µm: flat, 996 µm: buckled up ~1 fringe
Yes

MASTERS ET AL. ON COMPARISON OF TEST STRUCTURES 13
For this single image/wavelength technique, quantitative analysis of interferograms (as applied here to the fixed-fixed and cantilever beams) requires that at least one half-fringe be available, that continuous structures be used to avoid phase problems, and that tilt adjustments of the reference surface setting the background fringes parallel to the structures be made. Although the interferometry yields high resolution z-deflection data, x and z-offsets must be determined. The interferometric data near the support post is noisy because of rapid changes in topography. Therefore, linescan data usually begins about 5 to 10 pixels away from the beam. By measuring the first pixel used relative to the support post and knowing the calibration factor, the x-offset can be adjusted within ±2 pixels. Because the interferometric data does not begin at the support post, the z-offset must also be determined. This is done by comparing the interferometric data to the model data, and assigning an optimum offset for a given model calculation at the first measured pixel.
Results
Qualitative Evaluation
Qualitative results are summarized in Table 2 and are discussed in this section. Interferometry was first used to evaluate any out-of-plane deflections that might affect the accuracy of the analyses. Pointer structures were plagued by adhesion to the substrate as seen in Fig. 6. The closely spaced fringes near the supports followed by a uniform section with very little contrast indicate that the devices are adhered to the substrate. All pointer structures were affected in a similar manner. A previous study has shown that valid measurements can be obtained from pointer structures adhered in their stress-relaxed position [29]. However, for the low residual strain values observed here, it is difficult to determine the relative contribution to deflections from adhesive forces versus residual strain forces. Therefore, the pointer structures were deemed unusable for further study.
Bent-beam structures fabricated in the Poly2 level are shown in Fig. 7. On the left side of the image where the LBB = 300 µm long structures reside, a few fringes are visible on the support beams, indicative of small out-of-plane deflections. The deflections are away from the substrate (up). However, on the right side of Fig. 7 where the LBB = 500 µm long bent-beams are located, more severe out-of-plane distortions are observed on the lower two bent-beams. These deflections are downwards. The structures were adhered to the substrate and therefore these two were not evaluated. The top bent-beam on the right hand side of Fig. 7 is not contacting the substrate, but is buckled up slightly. The bent-beams in the Poly1 and Poly1/2 levels were freely suspended and exhibited small out-of-plane deflections, and they were deemed appropriate for further analysis.
Figure 8 shows microrings in both Poly1 and Poly2. No out-of-plane flexures are observed for the Poly1 microrings, indicating that this layer is either in compression or low tension. Note that both the rings and the crossbeam exhibit roughly equal flexure for the Poly2 level. Both are bending down from a centerline defined by the clamps, which is a manifestation of the strain gradient-induced curvature of the films [22]. This is an excellent example of why it is necessary to consider not only residual strain but also strain gradient when evaluating the microrings. Without the complementary information

MECHANICAL PROPERTIES OF STRUCTURAL FILMS 14
from the cantilevers and fixed-fixed beams below, we may have incorrectly inferred that the crossbeams were buckled and that the residual strain in the Poly2 level was tensile. In fact, a tensile state would only be indicated by significantly different out-of-plane flexures for the crossbeam compared to the ring. The Poly1/2 level microrings were not properly anchored to the substrate, and therefore could not be assessed.
FIG. 8—Interferogram of microrings. Poly2 exhibits a large stress gradient.
FIG. 6—Interferogram of adhered pointers in Poly1.
FIG. 7—Inteferogram of Poly2 bent beams. LBB = 300 µm show buckling (left), and LBB = 500 µm are adhered (lower and middle right).

MASTERS ET AL. ON COMPARISON OF TEST STRUCTURES 15
An array of Poly1 cantilevers is shown in Fig. 9. From the shortest cantilever (196 µm), it is clear that the curvature is significant. This cantilever was determined to be bending down. Longer cantilevers were contacting the substrate at their tips because of the large curvature. For the longest cantilever (996 µm), the substrate imposes an upward force at the tip of the beam that causes its initial deflection beginning at the support post to be upwards. The Poly2 layer exhibited greater out-of-plane deflection than the Poly1 layer, with beams bending down again, and only the shortest cantilever was free. On the other hand, the Poly1/2 laminate exhibited small curvature, and even the 996 µm beam did not contact the substrate. For all layers, free cantilever beams bent down. The cantilever beams were deemed appropriate for obtaining curvature information. However, for the Poly1 and Poly2 layers, data could only be extracted from the shortest cantilever, while for the Poly1/2 layer only the longest cantilever exhibited enough fringe information for quantification.
Short (196 and 396 µm) Poly1 fixed-fixed beams exhibited no deflection. Longer (596 and 996 µm) were buckled out-of-plane (upwards). However, the 796 µm Poly1 fixed-fixed beam was adhered to the substrate. A set of Poly2 fixed-fixed beams is shown in Fig. 10, where it can be seen that increasing beam lengths exhibit more fringes. The deflections were upwards, implying the beams were compressively buckled. For the Poly1/2 laminate, all beams were free, but only the longest beam (996 µm) exhibited a slight upward out-of-plane flexure. Nonadhered, buckled fixed-fixed structures were deemed appropriate for quantitative analysis. From the observed buckling, all layers are in compression.
Quantitative Evaluation
The qualitative evaluation leads us to eliminate pointers and microrings from further evaluation, leaving one in-plane and one out-of-plane test structure for further study. Summaries of the quantitative analyses are found in Table 3 and in Fig. 11, and are discussed in this section.
Bent-beams—The separation between reference indicators fixed to the substrate
FIG. 9—Interferogram of Poly1 cantilevers. Except for the shortest, all are contacting the
substrate at their tips.
FIG. 10—Interferogram of buckled Poly2 fixed-fixed beams.

MECHANICAL PROPERTIES OF STRUCTURAL FILMS 16
(see Fig. 7) was first measured in pixels. Then, the separation between suspended indicators of the bent-beam structure was measured. The difference was multiplied by the calibration factor, and Eq 2 was used to calculate residual strain values. A sample calculation is adjacent to Fig. 11. In Fig. 11, we plot the values of residual strain for each poly level. The error bars indicate error for ±0.25 µm measurement resolution. For larger LBB and smaller φ, the error bars are smaller. The average and standard deviation of residual strain for each poly level is shown in Table 3.
Cantilevers—In Fig. 12, best model fits to the cantilever deflections are shown, along with the deflection data from the interferometry. The Poly1/2 level is the flattest layer, and Poly2 is the layer with the greatest curvature. Agreement between model and data is better than 4 nm/pixel. Results for κ and oθ are tabulated in Table 3. From contour plots in (κ, oθ ) space that evaluate the difference between the measured and model deflections [16], we can evaluate the confidence regime of the κ and oθ values. To 95% confidence, the values of oθ are accurate within ±50 µrad (implying that oθ is different from 0), while the values of κ are accurate within ±2 m-1 for Poly1 and Poly2, and within ± 0.2 m-1 for Poly1/2. Note that the magnitude of oθ correlates reasonably well with stress gradient (Eκ), and as we shall see next, with Rε . This is in agreement with observations in Ref 15.

MASTERS ET AL. ON COMPARISON OF TEST STRUCTURES 17
Fixed-Fixed Beams—Using the finite difference model described in Section 2.4, and including the values of strain gradient determined for cantilevers, best fits to the measured deflection curves were found and associated Rε values were calculated. Four different beam lengths are shown in Fig. 13 for the Poly2 fixed-fixed beams. The larger errors per pixel between modeled and measured data (10–30 nm/pixel) compared to the cantilevers are mainly due to a small offset in the measured heights of the two ends. This is likely not real, and can be reduced by making a linear correction to the data. Such a correction would affect the values of Rε by less than 2%. For Poly1, the critical buckling
length is Rcr tL επ 3/= = 499 µm ( Rε = 52.9 µε and t = 2.0 µm). Therefore, the 996
and 596 µm Poly1 fixed-fixed beams were also in the post buckled state (the 796 µm Poly1 fixed-fixed beam was adhered to the substate), consistent with Lcr. For Poly2, Lcr = 265 µm ( Rε = 100 µε, with t = 1.46 µm). Therefore, the fixed-fixed Poly2 beams of Figs. 10 and 13 are also in the post buckling regime (the 196 µm beam is in a pre-buckled state, LFF < Lcr, and did not present enough fringe information for analysis). The Poly1/2 996 µm fixed-fixed beam was only weakly buckled. With Rε = 35.1 µε and t = 3.45 µm, crL is 1056 µm. This confirms that the boundary compliance is responsible for the apparent buckling of the longest Poly1/2 fixed-fixed beam, and that it is in the transition buckling regime.
TABLE 3—Quantitative residual strain results (N- number of structures evaluated).
Bent-beams Fixed-fixed beams Cantilevers Layer εR (st. dev.) µε N εR (st. dev.) µε N κ m-1 θ0 (µrad) N Poly1 -100 (13.9) 6 -52.9 (0.2) 2 -21.58 -344 1
Poly2 -118 (12.5) 4 -99.6 (2.1) 4 -60.59 -536 1
Poly1/2 -52 (12.8) 6 -35.1 ( N/A ) 1 -1.82 +139 1
FIG. 13—Poly2 deflections for 396, 596,
796, 996 µm long buckled fixed-fixed beams. σ is the error per pixel.
FIG. 12—Measured and modeled deflections of cantilevers.

MECHANICAL PROPERTIES OF STRUCTURAL FILMS 18
TABLE 4—Evaluation of assessment criteriaa for test structures.
aAssessment criteria for test structures: 1) How well are the critical deflections measured? 2) To what degree do the test structures reflect the 2-D analysis? 3) How repeatable are the measurements on similar structures in close proximity? 4) What are the area requirements? 5) How long does it take do determine the strain value? a Crit. Fixed-fixed beams
(1) Out-of-plane deflection resolution is ±5 nm. Deflection measurements are made along the entire length of the structures, and the model is optimized to minimize the difference.
(2) Deflections are essentially two-dimensional. The 2-D FDM captures the physical effects of strain gradient and boundary compliance. Agreement between the model and the data is excellent with typical error differences between the model and the data of 20 nm/pixel.
(3) Beams in the same structural level but of different lengths yielded the same value of residual strain within 2 µε standard deviation (Table 3).
(4) The area required is 0.2 mm2 per measurement (Table 1). (5) Taking and analyzing the interferograms requires about 15 minutes per beam. Setting up for
the FDM code run requires about ten minutes. The code converges within about one minute. Bent-beams
(1) In-plane resolution is ±0.25 µm. Only one deflection point on the structure is measured. (2) The design of these structures is forced to be more compliant so that strain resolution improves,
but this makes them as susceptible to adhesion or to buckling. The flexures are clearly 3-dimensional for the Poly2 layer. However, the implications of this are minor, as addressed in the discussion.
(3) Beams in the same structural level but of different sizes yielded the same value of residual strain within 14 µε standard deviation (Table 3).
(4) The area required is 0.23 mm2 per measurement (Table 1). (5) Time to measure is about 15 minutes per structure. Analysis requires only a few minutes using
Eq 2. Pointers
(1) In-plane resolution of ±0.25 µm. Only one deflection point on the structure is measured. (2) Flexures did not satisfy the 2-D model due to adhesion to the substrate. Substrate interference
can also be caused by buckling or out-of-plane bending from stress gradient. (3) Not able to assess repeatability due to substrate adhesion. At 40 µε, the resolution for use in
measuring residual strain is low. (4) The area requirements are large, 1.0 mm2 per measurement (Table 1). (5) Time to measure is about 15 minutes per structure. Analysis requires only a few minutes using
Eq 1. Microrings
(1) Interferometry can be used to sensitively detect buckling. A critical structure must be defined, e.g., by A = 0.6t, because of the gradual transition to cross beam buckling for ring supports.
(2) Out-of-plane deflections may be due to strain gradient rather than buckling. This can be detected in interferograms, but requires that the user make the distinction between stress gradient and stress, as discussed in Ref 22.
(3) Cannot report repeatability data for these structures because compression rather than tension observed. Microrings do not have high resolution at 50 µε.
(4) The area requirements are large, 2.9 mm2 (Table 1). (5) Evaluation time is just a few minutes.

MASTERS ET AL. ON COMPARISON OF TEST STRUCTURES 19
Results for all the fixed-fixed beams are given in Table 3, and graphed against the bent-beams in Fig. 11. The standard deviation of these measurements is less than 2.1 µε or less for adjacent structures in each of the Poly1 and Poly2 layers.
Discussion
Assessment of the Test Structures
The assessment criteria, questions (1)-(5) from the Introduction, are considered in Table 4, in order of the experimental effectiveness of the test structures. In addition, we make further comments on each test structure in this section.Fixed-Fixed Beams—The fixed-fixed beams listed at the top of Table 4 yielded the highest resolution and most repeatable results. Further advantages of the fixed-fixed beam structures should be mentioned. First, if the post-buckled state is confirmed, the FDM code is not necessary. For the post-buckled beams, use of Eq 5 rather than the FDM model results in less than a 3% difference in the residual strain results. This indicates that the effect of boundary compliance on the residual strain measurements are small, as expected for post-buckled beams. The further into the post-buckled regime, the less the boundary compliance affects the buckled geometry and therefore the measured residual strain. The FDM is needed principally for evaluation of the transition- and prebuckled beams. Second, comparing the adhesion results, the fixed-fixed beam stiffness is comparable to that of the bent-beam sensors, and greater than the pointer structures. Third, because the structures are wide (18 µm), their area moment of inertia is relatively insensitive to process-induced nonidealities such as line width loss and nonvertical sidewalls. Also, because they are much wider than they are tall, there will be no buckling ambiguity (the buckling will be out-of-plane). Fourth, to obtain the intrinsic εR accuracy of fixed-fixed beams, it is essential to apply interferometry. It was originally proposed to use the transition from pre- to post-buckling with SEM or bright field microcopy to determine residual strain [11]. Using this criterion, repeatability of fixed-fixed beams for residual strain measurement was seen to be inferior to pointer structures [7]. More recently however, deflection curve measurements of post-buckled beams has also successfully been used by other authors to accurately determine residual stress [30,31]. For these reasons as well as those listed in Table 4, fixed-fixed beams measured by interferometry yielded the best residual strain measurement in this study.
It is also important to address the limitations of the fixed-fixed beams. First, the model assumed in the FDM for boundary conditions is oversimplified. Real boundaries are more complicated, as shown by finite element method simulations [24]. In particular, they exhibit a nonzero axial deflection, δ0, that can significantly affect results, i.e., by (2δo/LFF). When possible, it is best to use long beams where boundary conditions are less important. Second, our experience indicates that the method of interferometry we used works best when there are at least several fringes present on the structure of interest. For very small deflections, errors in the deflection measurement become important. For example, the background fringes on the substrate are aligned parallel to the beam of interest. Small rotation error (~5º) in the background fringes can become important in inferring small out-of-plane deflections. These corrections are commonly made with commercially available interferometers. Third, the fixed-fixed beams fortuitously

MECHANICAL PROPERTIES OF STRUCTURAL FILMS 20
buckled up rather than down, allowing even the longest beams with up to 6 mm amplitude to be analyzed. With a 2 µm support post height, the substrate would have interfered with the buckling had the beam deflections been downward, rendering the long beams unusable for residual strain evaluation. Our analysis indicates that the fixed-fixed beams should have buckled down because of the negative takeoff angles in the cantilevers. We believe that the buckling likely occurred before the release etch was completed. Then, before the oxide clears near the support posts, the downward curvature due to stress gradient would induce the fixed-fixed beams to buckle up. Fourth, cantilever curvature was used to refine the FDM result. The effect on εR was found to be minor (< 0.1% change). However, if films were more highly curved downwards, the correction would be more significant. Then, even shorter cantilevers would be necessary to avoid contact with the substrate to enable this correction. Also, for large curvatures, a concave or convex three-dimensional surface can be expected in cantilever and fixed-fixed beams, and therefore the deflections would become three-dimensional.
Bent-Beams—The most important conclusion from Table 4 is that based on the standard deviation value, the measurement repeatability of the bent-beams is about five times higher than for the fixed-fixed beams. Comparing the results for Poly2 and Poly1/2, the agreement between the bent-beam and fixed-fixed beam structures is reasonable. However, as seen in Fig. 11 for Poly1, the fixed-fixed beams indicate a smaller magnitude of compression than do the bent-beams. Although we have no satisfactory explanation, several factors can be considered in an attempt to rationalize this disagreement. First, the supports of the bent-beams can buckle out-of-plane, a feature not considered in the 2-D analysis of the bent-beams. This will act to relieve strain, but should decrease rather than increase in-plane deflections, resulting in a lower residual strain reading, which is opposite to the observation. For Poly2, the cross section moment of inertia for out-of-plane bending, Izz (bBBt3/12), is about one half of the moment of inertia for in-plane bending, Iyy (bBB
3t/12), and indeed about two fringes are seen in the interferograms of the LBB = 500 µm structures, corresponding to an amplitude of 0.5 µm. The strain relieved is negligible as can be calculated from 2)2/( LAπε =∆ = 0.5 µε (from Eq D8, where ∆ε = εR-εc). This explains how the agreement can be good between the two types of structures for the Poly2 level in spite of the buckling. Meanwhile for Poly1 and Poly1/2, minor out-of-plane buckling is expected and observed because Izz is equal to or greater than Iyy. Second, the internal moment due to strain gradient is not assessed in the 2-D bent-beam analysis. However, based on the fixed-fixed beam results, this effect is minor. Third, line width may be incorrect by up to 0.2 µm due to overexposure and overetching. Evaluation shows that this will affect the strain readings by only 1 µε or less. Fourth and most likely, some nonsystematic error such as improper focusing on the Poly1 structures may have caused the disagreement.
Pointer Structures—These structures are significantly larger than bent-beams because their intrinsic resolution is low. A folded-beam indicator structure with improved geometric amplification over pointer structures has recently been proposed [32] and optimized [33]. This structure requires an area about twice that of the bent-beam sensors, has similar sensitivity, is also evaluated by taking a measurement at a single point, and a simple equation applies. One concern is that the authors rely on sticking of the structures to the substrate, but do not account for the extra strain that is induced when

MASTERS ET AL. ON COMPARISON OF TEST STRUCTURES 21
inferring stress. Microrings—These are intended for measuring tensile residual strains and thus are
not suited for the compressive states we found to be present here. Care must be taken not to mistake strain gradient for residual tensile stress.
Strain Properties of the Laminate
We investigated the idea that the laminate properties might be a simple composite of Poly1 and Poly2. Using residual strain and strain gradient measurements obtained from the cantilever and fixed-fixed beams and assuming a superposition model for noninteracting layers, values of κ = -28.4 m-1 and Rε = -72.9 µε were calculated. The measured values were considerably different: κ = –1.82 m-1 and Rε = -35.1 µε as seen in Figs. 14 a and b. To investigate this discrepancy, transmission electron microscopy (TEM) was applied to look for microstructural or nucleation differences of Poly2 on oxide versus on Poly1.
FIG. 14—Using the properties of P1 and P2 individually, the P12 laminate propererties for (a) (steeper line implies lesser strain gradient) and (b) εR were predicted and measured (subscripts on ε and κ denote Poly layers). (c) TEM reveals a small degree of templating , as indicated by the arrow.
A thin oxide at the Poly1/Poly2 interface indicates that the layers should not
interact. However, there is a small degree of templating of Poly2 on Poly1, as can be seen in Fig. 14c, and this may be related to the large differences in the predicted versus measured laminate properties. Other features noted in both Poly1 and Poly2 layers include nucleation of grains at the interface, with growth processes resulting in some through-thickness grains of a given poly level. Also, some stacking faults and microtwins are observed, similar to Ref 2.

MECHANICAL PROPERTIES OF STRUCTURAL FILMS 22
Case of Tensile Residual Stress
We were only able to evaluate the performance of these test structures in compressive residual strain. It is desirable to have structures that measure both tension and compression so that a single set of devices and test procedures are used, and area requirements are minimized. We now consider which devices would have been the best had the residual strain been tensile.
Pointer structures would not suffer as much from adhesion. However, film curvature can still cause interference from the substrate. The theoretical resolution of pointers is low. In tension, microrings would work within the limitations described, i.e., resolution is dependent on the number of rings and space requirements are large. Both pointers and microrings are earlier MEMS developments (early 1990s and late 1980s, respectively) intended mainly to look at higher states of strain than observed in the present study. As MEMS matures, residual strains are decreasing to near zero, and more sensitive test structures and metrologies are required to accurately assess residual strain levels.
Bent-beams exhibit higher resolution than the pointer and microrings, and under tension would also be less likely to suffer from adhesion. Additionally, buckling would not occur, resulting in a situation that more closely matches the model conditions. However, resolution is lower than for the fixed-fixed beams. Use of active methods allows extension of the fixed-fixed beam test structures to the case of residual tension [12–14,24]. Furthermore, active methods allow additional validation of residual stress values of buckled beams. The deflections due to electrical loads at different voltages are compared to models that include the applied electrical load as a function of beam height, and are highly sensitive to residual strain. Once implemented, electrical actuation adds little in cost or time to the measurement process and can be used to obtain and average multiple data points from beams subject to either tensile or compressive residual strain. An integrated platform to accomplish interferometry of actuated devices at the wafer scale is under development [34].
Recommendations for the Next ASTM Round Robin
For the next ASTM residual strain round robin, we recommend investigating the bent-beam, folded beam [33], cantilever and fixed-fixed beam test structures in more detail. A significant drawback in the current study is that the number of test structures assessed is small (see Table 3). In the next study, only structures over Poly0 ground pads should be used, and some of the same exact geometries should be laid out side-by-side for improved repeatability quantification. Beams with more length variations should be employed to enable detailed study of the pre- and transition-buckling regimes. We also recommend that participants be equipped with interferometry so that the full deflection curves of beams can be compared. We have observed inconsistent deflection measurements when using a multi-wavelength interferometer (i.e., different results at different magnifications, and different results from profilometry). We believe this is due to the different transmission coefficient of light through silicon at different wavelengths. The effectiveness of a green interference filter in improving the reliability of the measurements on polysilicon structures should be further investigated.

MASTERS ET AL. ON COMPARISON OF TEST STRUCTURES 23
Summary and Conclusions The most important result of this study is summarized in Fig. 11, which shows
that there is reasonable agreement between the bent-beam sensors and the beam structures. It also shows that especially good repeatability and small uncertainty is possible with post-buckled beam structures measured by optical interferometry. We now state the major conclusions: (1) It is important to assess whether fabricated test structures satisfy the 2-D analyses
that have been offered. Interferometry is a valuable tool in evaluating the 3-D flexures of the structures. We found that the flexures of fixed-fixed beam and bent-beam structures are essentially 2-D, while microrings can exhibit 3-D flexures because of strain gradient, which can cause the sign of residual strain to be incorrectly inferred. If test structures are adhered to the substrate, it is difficult to determine to what degree their flexures are due to adhesive versus residual strain forces, especially at the low residual strain levels typically achieved in MEMS. Any adhered structures were ruled out from further study because of adhesion to the substrate.
(2) Because of the high resolution afforded by interferometry, which can be used to obtain nanometer scale measurements across the length of structures, the standard deviation of Rε values measured on geometrically different test structures on the same poly level is about 2 µε for the fixed-fixed beam structures, The standard deviation was 13 µε for the bent-beams, likely because of the lower resolution in-plane metrology.
(3) For the case of post-buckled beams, it was found that the non-idealities affect the residual strain measurement only to second order. A simple measurement of the amplitude of post-buckled beams, coupled with Eq (5), allows Rε to be determined with high repeatability.
(4) The main importance of the cantilevers is as an aide in understanding the flexures of other structures (e.g., the buckling direction of fixed-fixed beams, the curvature of microrings).
(5) The strain measurements from the beam structures indicate that the strain state is different for polysilicon when grown on oxide versus polysilicon. The sensitive measurements enabled by the interferometry motivated us to find a microstructural difference in Poly2 on oxide versus on Poly1. With TEM, we were able to resolve some templating of Poly2 on Poly1, which may be responsible for this interactive effect.
(6) If the state of residual strain is tensile rather than compressive, the fixed-fixed beam test structures also will exhibit significant advantages over the other test structures. In that case, however, active techniques must be employed. Such techniques are under development [34]. Bent-beam structures are a reasonable alternative in the absence of active methods.
MECHANICAL PROPERTIES OF STRUCTURAL FILMS 24
Acknowledgments
Sandia is a multiprogram laboratory operated by Sandia Corporation, a Lockheed Martin Company, for the United States Department of Energy under Contract DE-AC04-94AL85000. We would like to acknowledge Paul G. Kotula at Sandia National Laboratories for electron microscopy work.
References [1] Kamins, T. I., "Design Properties of Polycrystalline Silicon," Sensors and Actuators,
A, Vol. 21-23, 1990, p. 817. [2] Krulevitch, P., Johnson, G. C., and Howe, R. T., "Stress and Microstructure in
Phosphorus Doped Polycrystalline Silicon," Materials Research Society Proceedings, Vol. 202, 1992, pp. 79–84.
[3] Adamaczewska, J. and Budzynsky, T., "Stress in Chemically Vapour-Deposited Silicon Films," Thin Solid Films, Vol. 113, No. 4, 1984, p. 271.
[4] Maier-Schneider, D., Koepurueluelue, A., Ballhausen Holm, S. and Obermeier, E., "Elastic Properties and Microstructure of LPCVD Polysilicon Films," Journal of Micromechanical Microengineering, Vol. 6, 1996, p. 436.
[5] Fuertsch, M., Offenberg, M., Muenzel, H. and Morante, J. R., "Influence of Anneals in Oxygen Ambient on Stress of Thick Polysilicon Layers," Sensors and Actuators A, Vol. 76, 1999, p. 335.
[6] Floro, J. A., Hearne, S. J., Hunter, J. A., Kotula, P. G., Chason, E., Seel, S. C., and Thompson, C. V., "The Dynamic Competition Between Stress Generation and Relaxation Mechanisms During Coalescence of Volmer-Weber Thin Films," Journal of Applied Physics, Vol. 89, No. 9, 2001, p. 4886.
[7] van Drieënhuizen, B. P., Goosen, J. F. L., French, P. J., and Wolffenbuttel, R. F., "Comparison of Techniques for Measuring Both Compressive and Tensile Stress in Thin Films," Sensors and Actuators A, Vol. 37–38, 1993, p. 756.
[8] Gianchandani, Y. B. and Najafi, K., "Bent-Beam Strain Sensors," Journal of Micromechanical Systems, Vol. 5, No. 1, 1996, p. 42.
[9] Zavracky, P. M., Adams, G. G., and Aquilino, P. D., "Strain Analysis of Silicon-On-Insulator Films Produced By Zone Melting Recrystallization," Journal of MEMS, Vol. 4, No. 1, 1995, p. 42.
[10] Guckel, H., Burns, D., Rutigliano, C., Lovell, E., and Choi, B., "Diagnostic Microstructures for the Measurement of Intrinsic Strain in Thin Films," Journal of Micromechanical Microengineering, Vol. 2, 1992, p. 86.
[11] Guckel, H., Randzaao, T., and Burns, D. W., "A Simple Technique for the Determination of Mechanical Strain in Thin Films With Applications to Polysilicon," Journal of Applied Physics, Vol. 57, No. 5, 1985, p. 1671.
[12] Osterberg, P. M. and Senturia, S. D., "M-Test: A Test Chip for MEMS Material Property Measurement Using Electrostatically Actuated Test Structures," Journal of MEMS, Vol. 6, No. 2, 1997, p. 107.
[13] Jensen, B. D., de Boer, M. P. and Miller, S. L., "IMaP: Interferometry for Materials Property Evaluation in MEMS," MSM '99, San Juan, Puerto Rico, 1999, pp. 206–209.
[14] Jensen, B. D., de Boer, M. P., and Bitsie, F., "Interferometric Measurement for

MASTERS ET AL. ON COMPARISON OF TEST STRUCTURES 25
Improved Understanding of Boundary Effects in Micromachined Beams," Proceedings of the SPIE, Vol. 3875, Santa Clara, CA, 1999, pp. 61–72.
[15] Fang, W. and Wickert, J. A., "Determining Mean and Gradient Residual Stresses in Thin Films Using Micromachined Cantilevers," Journal of Micromechanical Microengineering, Vol. 6, 1996, p. 301.
[16] Jensen, B. D., de Boer, M. P., Masters, N. D., Bitsie, F. and LaVan, D. A., "Interferometry of Actuated Cantilevers to Determine Material Properties and Test Structure Non-Idealities In Mems," Journal of MEMS, Vol. 10, No. 3, 2001, in press.
[17] Marshall, J. C., “Length and Strain Measurements Using An Optical Interferometer,” NIST Internal Report NISTIR 6779, 2001.
[18] Sharpe, W. N., Yuan, B., and Edwards, R. L., "A New Technique for Measuring the Mechanical Properties of Thin-Films," Journal of MEMS, 1997, Vol. 6, No. 3, 1997, p. 193.
[19] Gupta, R. K., "Electrostatic Pull-In Test Structure Design For In-Situ Mechanical Property Measurement of MEMS," Ph. D. Thesis, Massachusetts Institute of Technology, 1997, 82 pages.
[20] Juvinall, R. C., Stress, Strain and Strength, First ed., New York, McGraw-Hill, 1967.
[21] Boutry, M., Bosseboeuf, A., Grandchamp, J. P., and Coffignal, G., "Finite-Element Method Analysis of Freestanding Microrings for Thin Film Tensile Strain Measurements," Journal of Micromechanical Microengineering, Vol. 7 , 1997, p. 280.
[22] Boutry, M., Bosseboeuf, A., and Coffignal, G., "Characterization of Residual Stress in Metallic Films on Silicon With Micromechanical Devices," Proceedings of the SPIE, Vol. 2879, 1996, pp. 126–134.
[23] Marshall, J. C., Read, D. T., and Gaitan, M., "Analysis of Fixed-Fixed Beam Structures," Proceedings of the SPIE, Vol. 2880, 1996, pp. 46–55.
[24] Baker, M. S., de Boer, M. P., Smith, N. F., and Sinclair, M. B., "Measurement of Residual Stress in MEMS to Sub Megapascal Accuracy," Journal of MEMS, submitted.
[25] Kobrinsky, M. J., Deutsch, E. R., and Senturia, S. D., "Effect of Support Compliance and Residual Stress on the Shape of Doubly Supported Surface Micromachined Beams," Journal of Micromechanical Systems, Vol. 9, No. 3, 2000, p. 361.
[26] Fang, W. L., Lee C. H., and Hu, H. H., "On The Buckling Behavior of Micromachined Beams," Journal of Micromechanical Microengineering, Vol. 9, No. 3, 1999, p. 236.
[27] http://www.memsrus.com/cronos/svcsdata28.html, . [28] Mulhern, G. T., Soane, D. S., and Howe, R. T., "Supercritical Carbon Dioxide
Drying of Microstructures," Proceedings, 7th International Conference on Solid-State Sensors and Actuators, Transducers '93, Vol. , Yokohama, Japan, 1993, pp. 296–299.
[29] Elbrecht, L., Storm, U., Catanescu, R., and Binder, J., "Comparison of Stress Measurement Techniques in Surface Micromachining," Journal of

MECHANICAL PROPERTIES OF STRUCTURAL FILMS 26
Micromechanical Microengineering, Vol. 7, 1997, p.151. [30] Chan, E. K., Garikipati, K., and Dutton, R. W., "Comprehensive Static
Characterization of Vertical Electrostatically Actuated Polysilicon Beams," IEEE Design and Test of Computers, Vol. 16, No. 4, 1999, p. 58.
[31] Nicu, L., Temple-Boyer, P., Bergaud, C., Scheid, E., and Martinez, A., "Energy Study of Buckled Micromachined Beams for Thin Film Stress Measurements Applied to SiO2," Journal of Micromechanical Microengineering, Vol. 9, 1999, p. 414.
[32] Lin, L., Pisano, A. P., and Howe, R. T., "A Micro Strain Gauge with Mechanical Amplifier," Journal of MEMS, Vol. 6, No. 4, 1997, p. 313.
[33] Ericson, F., Greek, S., Soederkvist, J., and Schweitz, J. A., "High Sensitivity Surface Micromachined Structures for Internal Stress and Stress Gradient Evaluation," Journal of Micromechanical Microengineering, Vol. 7, 1997, p. 30.
[34] de Boer, M. P., Smith, N. F., Masters, N. D., Sinclair, M. B., and Pryputniewicz, E. J., "Integrated Platform for Testing MEMS Mechanical Properties at the Wafer Scale by the IMaP Methodology," Mechanical Properties of Structural Thin Films, STP 1413, S. B. Brown and C. L. Muhlstein, Eds., American Society for Testing and Materials, West Conshohocken, PA, 2001.
[35] Gere, J. M., and Timoshenko, S. P., Mechanics of Materials, 3rd ed., Boston: PWS, 1990.
[36] Chai, H., Babcock, C. D., and Knauss, W. G., "One Dimensional Modeling of Failure in Laminated Plates By Delamination Buckling,"International Journal of Solid Structures, Vol. 17, No. 11, 1981, p. 1069.
Appendix A – Pointers The relationship of residual stress to displacement for pointers was derived by van
Drieënhuizen et al. [7]. In the analysis, the device is treated as a rigid body mechanism. Ideal rotational points, or hinges, are assumed, allowing the deflection to be based purely on geometry. A correction factor is then applied to account for hinge compliance. The layout of pointers is shown in Fig. A1. After release from the substrate, the angles in Fig. A2 are calculated as follows:
WLL
OBAR ++−
=ε
φ )tan( 1 , (A1)
2222222
222222
2 ]})(][)1()1{[(2)()1()1(]1)1[()cos(
WLLOWOWLLLW
BARRR
BBRBRRR
++−++++++−++−++++=
εεεεεεεφ , (A2)
OW=φ )tan( 3 , (A3)
and °−++= 90321 φφφα , (A4)

MASTERS ET AL. ON COMPARISON OF TEST STRUCTURES 27
where LA and LB are the lengths of the support beams (for this study they are equal), W is the pointer width, O is the distance between the turning points and εR is the residual strain. The primes (LA′, LB′ etc.) in Fig. A2 indicate strain-relaxed lengths of members.
If W << (LA and LB) and if cos(θ) ≈ 1 (true if LB >> O), then the strain may be approximated by
BA
R LLO
+= )tan(αε , (A5)
and 2
)tan(OL
yC +
=α , (A6)
where y is the displacement of the indicator. This allows a linear relationship between the displacement of the pointer, y, and
the residual strain. Based on finite element modeling, a correction factor, CF, is also included.
FCBA
R COLLLOy 1
)2/)(( ++=ε . (A7)
Appendix B – Bent-beams Bent-beams use geometry to amplify the small displacements due to residual
stress. By using two opposing bent-beam structures the measured deflection is double the deflection of an individual bent-beam, increasing sensitivity. This analysis will use Castigliano’s method [20], which assumes that all deflections remain linearly elastic, in-plane, and that material properties are homogeneous. These assumptions are valid because the deflections are small and polysilicon is elastically homogeneous at the length scale of the test structures. The analysis considers a single bent-beam (“One-Half” model) subject to an effective axial force, F, as shown in the top diagram of Fig. B1. The effective force, F, facilitates correlation between the residual strain and deflection of the indicator. At this stage the deflection due to the strain in the indicator is neglected (second diagram, Fig. B1), but will be added later.
FIG. A1—Pointer Structure FIG. A2—Geometry of Pointers

MECHANICAL PROPERTIES OF STRUCTURAL FILMS 28
By symmetry the bent-beam may be reduced to a fixed-guided member as shown in the third diagram (or “One-Quarter” model) of Fig. B1. The loading condition of a fixed-guided beam may be represented by point loads and an applied moment as shown in the final diagram of Fig. B1. The force Q is a virtual load used in Castigliano’s method to evaluate the deflection of the beam in the direction of Q (which is the direction of the measured indicator displacement).
The top diagram of Fig. B2 shows how the model is further simplified (using the symmetry of a fixed-guided segment) to a simple cantilever beam (length = L/2) with point loads. The deflection of the complete bent-beam will be double that of this “One-Eighth” model. The middle diagram of Fig. B2 shows how the indicator may now be modeled by treating it as a segment having the same cross section as the support beams and susceptible only to axial deflections. This allows the axial strain of the modeled indicator to be equal to that of the support beams. Finally the coordinate axes are rotated to simplify the form of the derivation. The bottom diagram of Fig. B2 shows the model that will be used for the analysis.
Lb is the actual length of the support beam (as used in the "One-Eighth" model), equal to LBB/(2cosφ), where LBB and φ = arctan((D0-D)/2LBB) are as indicated in Fig. 1. The functions for the moment and axial load along the beam and the axial load in the indicator are:
xQFxMb )cossin()( φφ += , (B1)
)sincos()( φφ QFxPb −= , (B2)
and FPInd = . (B3)
where Mb(x) is the bending moment along the support beam. Pb(x) is the transverse bending force and PInd is the axial force on the indicator.
The total elastic energy, U, of the deflected system of the one-eighth model is determined by the following integral (see Ref 20):
FIG. B1—Bent beams One-Half and One-Quarter Models.
FIG. B2—Simplified model forCastigliano’s theoremevaluation.

MASTERS ET AL. ON COMPARISON OF TEST STRUCTURES 29
∫∫∫ ++=)4/(
0
2
0
2
0
2
222
IndbbL
IndL
bL
yy
b dxEA
PdxEAPdx
EIMU . (B4)
where E is the modulus of elasticity, Iyy and A are the in-plane moment of inertia and area of the effective beam cross section (in the configuration used in this study the support beams are composed of two beams each, thus 122 3tbI yy = and btA 2= ). Transverse shear effects are negligible because support beams are long and slender.
By Castigliano’s theorem, the deflections (in the directions of Q and F) are calculated by taking the derivative of the energy integral with respect to the forces Q and F:
( ) ( )EA
LQFEI
LQFQU b
yy
bQ
φφφφφφδ sinsincos3
coscossin 3 −−+=∂∂= . (B5)
( ) ( )EA
FLEA
LQFEI
LQFFU Indb
yy
bF 4
cossincos3
sincossin 3
+−++=∂∂= φφφφφφδ . (B6)
The virtual force, Q, is now set to zero and Eq B5 is solved for F in terms of δQ, the deflection in the direction of Q (the displacement of the indicator)
[ ] φφδ
cossin33
3bb
Qyy
ILALAEI
F−
= . (B7)
This is substituted into Eq B6, yielding a function for δF, the deflection in the direction of F (the strain induced deflection), in terms of δQ, such that
[ ]
++
−=
φφφφ
δδ
cossin43
cot3tan3
33
Indyybb
byyb
QF
LIILAL
LIAL. (B8)
The strain of such a deflection is the total deflection (for the "Half model") divided by the total length of the device, as in the following equation,
IndBB
F
TOT
FR LLL +
==2
44 δδε . (B9)
Substituting Eq B8 into Eq B9 and setting Lb = LBB/2cosφ and δQ = δ/4, we obtain
( )
−+
++
=
φφ
φφφφφ
δε
cos12
cos2
cossin6
sin12
cossin
3
3
4
3
BByyBBIndBB
IndyyBByyBB
resLIALLL
LILIAL
. (B10)
Eq B10 for the cases LInd = 0 and LInd = 98 µm is compared to Gianchandani’s rigorous derivation in Fig. 2 in the main body (with other parameters as indicated). For residual stress near zero, the results between the rigorous and linearized derivation with LInd = 0 agree. The correction including LInd = 98 µm leads to a 15% increase in the slope,

MECHANICAL PROPERTIES OF STRUCTURAL FILMS 30
meaning that for a given reading of δ, the value of residual stress will be 15% lower. A 2-D finite element model that included non-linear deflections was developed in ANSYS to confirm the linear bent-beam model presented here. The results of the linear model were found to be within 2% of those obtained from the FEA model for strains within the range encountered in this study.
It should be noted that Eq B10 is more quickly applied than the rigorous derivation. The derivations in refs. [8,9] include strain stiffening, which is not accounted for in the present analysis. This omission simplifies the derivation of Eq B10, but as such Eq B10 does not account for nonlinearities at higher stress levels. On the other hand, Gianchandani's derivation does not account for the effect of the indicator length on the apparent stress as his structures were designed with indicator of negligible length. The sensors used here are taken from the design of Zavracky [9] who used indicators of substantial length, and therefore their length should not be neglected.
In tension, the effect of axial elongation and stress stiffening on δ become greater
than 10% at a strain value of +235 µε (for the parameters used in Fig. 2). In compression, the axial elongation component is negligible compared to the bending contribution, and therefore the rigorous and linearized derivation with LInd = 0 µm agree within 10% to -312 µε. Beyond this value, the nonlinear analysis becomes important because of loss of sensitivity inherent in the bending contribution. From this comparison we deduce that the linear model with LInd = 98 µm is valid over the range from –312 to 235 µε (for LBB = 300 and (Do-D)/2 = 10). It should be noted that neither of these analyses takes buckling into account. If Izz > Iyy, (as for Poly1 and Poly1/2 here), out-of-plane buckling is not expected. However, if Izz < Iyy, buckling is complicated because out-of-plane buckling is favored by lower Izz, but in-plane buckling is favored by φ. A simple way to evaluate out-of-plane buckling is by interferometry, as discussed in the main text.
In short, for the values of stress encountered here (from –50 to –130 µε), Eq B10 with LInd = 98 µm gives the best values of residual stress. However, buckling is not accounted for, and may occur in Poly2 at values beyond -(πt/L)2/3 = –45 µε, the critical strain for out-of-plane bucking for this layer. Higher sensitivity is possible at low φ at the expense of a greater likelihood of buckling.
Appendix C – Microrings The analysis of microrings, as presented by Guckel et al. [10], uses Castigliano’s
method to calculate the residual strain from the radius of the critical ring. The following is a brief overview of that derivation. In the first step, the conversion efficiency, g(R), is found from the following formulae:
)2/()2()( 22
2112 fbfbfbfbRg bbrr −+−= , (C1)
2/)1(4//4/2)/)(/24/(1 ν+π+π−π+π−π−π= fkReeRf , (C2)
)1(/42/1/2)/)(/22/1(2 ν+−π+−π−π−= fkReeRf . (C3)
Definitions of the geometrical parameters rb and bb can be found in Fig. C1. The

MASTERS ET AL. ON COMPARISON OF TEST STRUCTURES 31
constant kf is a form factor for transverse shear (kf = 1.2 for rectangular cross sections, see Appendix A.2. of Ref 10 for more explanation), ν is Poisson's Ratio (≈0.23 for polysilicon), R is the effective ring radius, and e is the eccentricity,
e = R – br / ln(RO/Ri). (C4)
In the second step, the effect of boundary compliance due to ring torsion on the critical buckling strain εcr is calculated. The boundary stiffness (as defined by applied torque divided by rotation at the crossbeam to ring connection) for out-of-plane buckling (i.e., for crossbeams with bb > t where t is the film thickness) is
])61(/)61(41)[16(
4222
3
rrr
rro cccR
tEbc++−+−++
=νπννπ
α . (C5)
where cr is the torsional coefficient for the rectangular cross sections of the ring (the “o” subscript on α refers to out-of-plane). The torsional coefficent cr is approximated to within 0.5% by
−=
tb
btc r
rr 2
tanh6431
5π
π. (C6)
For in-plane buckling (bb < t) the boundary stiffness is
)8(3 2
3
−=
ππα
RbtE r
i (C7)
(the “i” subscript on α now refers to in-plane). Knowing α, the beam buckling criterion is found by solving the following
transcendental equation for kR
0)tan(/ =+ kRkEIb α , (C8)
where bcr EIPk /2 = , 12/3tbI bb = for out-of-plane buckling or 12/3btb for in-plane
buckling, and tEbP bcrcr ε= . In the case of out-of-plane buckling, for example, if
rb = 2 bb , rc = 1/3 and ν = 0.23, from Eqs C5 and C8,
kRkR 3098.0)tan( −= , (C9)
resulting in 485.2−=kR and 222 12/)( crcrcr RkRt=ε = 0.515 2)/( crRt , where crR is the radius of the first buckled ring. The tensile strain may now be calculated by dividing the critical buckling strain by the conversion efficiency resulting in

MECHANICAL PROPERTIES OF STRUCTURAL FILMS 32
)()/(515.0
)(12)/()(
)(
222
cr
cr
cr
cr
cr
crR Rg
RtRg
RtkRRg
=== εε . (C10)
Appendix D – Fixed-fixed Beams The governing equation for an elastically buckled beam supported by fixed
clamps, assuming small slopes, is [35]
)/()()( 2 EIMxzkxz o=+′′ , (D1)
where k2 = P/EI, I = bFFt3/12, P is the axial load in the beam and Mo is the end moment supported by the clamps. The clamped boundary conditions are
0)2/()2/()2/()2/( =′==−′=− FFFFFFFF LzLzLzLz . (D2)
The general solution satisfying Eqs. (D1) and (D2) is
+=
FFLxnAxz π2cos1
2)( , ...,5,3,1=n 2/2/ FFFF LxL ≤≤− . (D3)
where A is the amplitude of the buckled beam. The only solution of practical interest, representing the smallest critical load, Pcr, is for n = 1. Then, k = 2π/LFF and Pcr = EI(2π/LFF)2, giving a critical buckling strain εcr of
2
22
3 FFFF
crcr L
ttEb
P πε == . (D4)
The amplitude A can be related to the residual strain in the unbuckled beam in light of the following two considerations [36]. First, the length of the buckled beam can be determined from the arc length formula by using the small angle approximation (as
justified by the assumption of small slopes),
FIG. C1—Microring diagram.

MASTERS ET AL. ON COMPARISON OF TEST STRUCTURES 33
+≈∫
+=
−
2212
2
2
211
FFFF
L
Lbeam L
AπLdxdxdzl
FF
FF
. (D5)
Second, for the assumption of small slopes, the stress in the buckled beam is equal to the buckling stress. Then, the residual strain released by buckling (i.e., the strain that contributes to a change in length of the beam) is
crR εεδε −= . (D6)
where εR is the residual strain in the material. Therefore, the length of the buckled beam may also be expressed as
)1()1( crRFFFFbeam LLl εεδε −+=+= . (D7)
From Eqs D5 and D7, and using Eq D4, we obtain
( )222
2
2
22
2
22
431234
tALL
tL
AFF
RFFFF
+=+= πππε . (D8)
Both A and t can be accurately measured, and FFL is well-known from the layout
dimensions. Considering that the elastic supports built by surface micromachining methods are typically relatively stiff, Eq D8 gives excellent results for the measurement of εR using beams of lengths somewhat larger than the ideal critical Euler buckling length
crL , i.e.,
=>≈
crcrFF
tLLε
π3
1.11.1 , (D9)
where we have rearranged Eq D4 to find crL . In Eq D9, we have used Fig. 4 in the main body to assign the 10% length correction compared to the ideally clamped boundary case. Note that the greater the value of FFL with respect to crL , the smaller is Mo, and the lesser the effect of any boundary compliance on the deflection curve. Therefore, because the small slopes assumption remains valid, as FFL grows large compared to crL , Eq D8 correspondingly improves in accuracy.