sid 5 research project final report -...
TRANSCRIPT
SID 5 (Rev. 07/10) Page 1 of 42
General enquiries on this form should be made to:
Defra, Procurements and Contracts Division (Science R&D Team)
Telephone No. 0207 238 5734 E-mail: [email protected]
SID 5 Research Project Final Report
Note
In line with the Freedom of Information Act 2000, Defra aims to place the results of its completed research projects in the public domain wherever possible. The SID 5 (Research Project Final Report) is designed to capture the information on the results and outputs of Defra-funded research in a format that is easily publishable through the Defra website. A SID 5 must be completed for all projects.
This form is in Word format and the boxes may be expanded or reduced, as appropriate.
ACCESS TO INFORMATION
The information collected on this form will be stored electronically and may be sent to any part of Defra, or to individual researchers or organisations outside Defra for the purposes of reviewing the project. Defra may also disclose the information to any outside organisation acting as an agent authorised by Defra to process final research reports on its behalf. Defra intends to publish this form on its website, unless there are strong reasons not to, which fully comply with exemptions under the Environmental Information Regulations or the Freedom of Information Act 2000.
Defra may be required to release information, including personal data and commercial information, on request under the Environmental Information Regulations or the Freedom of Information Act 2000. However, Defra will not permit any unwarranted breach of confidentiality or act in contravention of its obligations under the Data Protection Act 1998. Defra or its appointed agents may use the name, address or other details on your form to contact you in connection with occasional customer research aimed at improving the processes through which Defra works with its contractors.
Project identification
1. Defra Project code AC0223
2. Project title
Extended lactations to reduce greenhouse
gas emissions from dairy cows
3. Contractor organisation(s)
Dr. G. E. Pollott, Royal Veterinary
College, Royal College Street,
London, NW1 0TU
54. Total Defra project costs £68,481
(agreed fixed price)
5. Project: start date ................ 3/01/10
end date ................. 21/07/10

SID 5 (Rev. 07/10) Page 2 of 42
6. It is Defra’s intention to publish this form.
Please confirm your agreement to do so. ........................................................................................................ YES
(a) When preparing SID 5s contractors should bear in mind that Defra intends that they be made public. They should be written in a clear and concise manner and represent a full account of the research project which someone not closely associated with the project can follow.
Defra recognises that in a small minority of cases there may be information, such as intellectual property or commercially confidential data, used in or generated by the research project, which should not be disclosed. In these cases, such information should be detailed in a separate annex (not to be published) so that the SID 5 can be placed in the public domain. Where it is impossible to complete the Final Report without including references to any sensitive or confidential data, the information should be included and section (b) completed. NB: only in exceptional circumstances will Defra expect contractors to give a "No" answer.
In all cases, reasons for withholding information must be fully in line with exemptions under the Environmental Information Regulations or the Freedom of Information Act 2000.
(b) If you have answered NO, please explain why the Final report should not be released into public domain
Executive Summary
7. The executive summary must not exceed 2 sides in total of A4 and should be understandable to the intelligent non-scientist. It should cover the main objectives, methods and findings of the research, together with any other significant events and options for new work.
The aim of this study was to see if the use of extended lactations (~450 d) in UK dairy herds
could reduce greenhouse gas emissions (GHGE) from the current levels. The approach used was
to review the literature on extended lactations, define the characteristics of lactation length in UK
dairy herds, and use this information in both a farm and national dairy model to estimate GHGE.
Various alternative scenarios would be modelled to test both the sensitivity of the results and the
effects of varying some basic parameters of dairy herds.
Research into the use of extended lactations was very limited but three studies indicated some of
the characteristics of extended lactations and demonstrated that nutrition, milking regime,
genetics and calving season all affected yields from extended lactations. Persistency (the rate of
decline in daily milk yield after the peak of lactation) was considered a key feature of an extended
lactation, successful extended lactations having a higher persistency i.e. a slower rate of decline.
Systems of production involving concentrate feeding were more successful at utilising extended
lactations than grazing systems. Most extended lactation systems produced a similar amount of
milk per year to a „normal‟ system and were not found to be less economic.
An analysis of the relationships between calving interval, a trait highly correlated to lactation
length, found that longer calving intervals were associated with higher milk yields per lactation,
higher peak milk yield but a lower level of persistency. Persistency was heritable and so could be
used in an appropriate selection programme to increase persistency without necessarily increasing
peak yield.
An analysis of lactation length in the UK dairy herd over the last 20 years was undertaken. In
this study lactation length was measured as the day of last test-day record and probably
underestimates true lactation length by ~15 d. Mean lactation length has increased from 352 d in
1990 to 395 d in 2007 and the spread of lactations lengths also increased over this time period.
An analysis of herd/year lactation length characteristics found a greater spread of mean lactation
lengths in 2007 compared to 1990. The SD of herd/year lactation lengths indicated that a
considerable number of farms have a higher mean lactation length but a relatively low SD,
indicating a conscious move towards managing herds for longer lactations. The wider use of
extended lactations has led to a more even calving pattern throughout the year than was

SID 5 (Rev. 07/10) Page 3 of 42
previously the case.
A dairy herd model was used to investigate the effect of using lactations of 305, 370 and 440
days on herd structure and GHGE, given maintenance of the current annual milk output. A base
scenario was used for comparative purposes which was constructed from the model herd used for
deriving the economic weights for the UK PLI index. Data from UK dairy herds were analysed to
determine the relationships between key lactation parameters and to derive the characteristics of
lactations of the three lengths modelled.
Initial use of the model indicated that as lactation length increased milking cow and follower
numbers decreased, However GHGE increased as lactations became longer. This was due to the
emissions from the milking herd increasing at a faster rate than the reduction due to smaller herd
sizes. The lower milk yield during the last few months of lactation carried a greater overhead cost
of emissions, in order to maintain the cow per kg of milk produced.
Changes in the persistency of lactation were shown to alter the GHGE such that improvements
in persistency decreased emissions. The level, of change was relatively small and a 20%
improvement in persistency only decreased GHGE by about 3% for lactations of 440 days.
Improvements in longevity and changes in the number of followers required both have an effect
on the herd via the replacement rate required to maintain herd numbers. Changes in replacement
rate were also modelled. A move from a 25% replacement rate to 20% once again had a small
positive effect on GHGE resulting in a reduction of about 0.5%.
The most promising way to reduce GHGE from dairy herds appeared to be through increased
milk yield. A move from the current scenario to the level of the top 10% of lactation yields
reduced GHGE by 12% for herds using 440-d lactations. This was accompanied by a reduction in
the herd size from 127 to 97 milking cows. If such a change could be made in conjunction with
improvements in persistency then further reductions in GHGE would be possible. Greater
reductions in GHGE were made when using the shorter lactations, 19% for 370-d and 25% for
305-d lactations.
A number of negative effects of longer lactations were identified from the research both
reviewed and carried out as part of this project. These were increased fat % in milk, higher
somatic cell counts, lower casein content and a saltier taste to the milk. These effects were mostly
small.
Although this research project has used a considerable amount of information associated with
extended lactations very little of it has come from commercial UK herds managed to achieve 18-
month calving intervals. In this sense there are huge knowledge gaps on the use of extended
lactations. Critical features of extended lactations that need more research include fertility and
longevity of cows involved in extended lactations, particularly if the move towards higher milk
yields is seen as the way to reduce GHGE from the dairy sector. The combination of higher yields
and longer lactations will highlight conception rate as a more critical fertility trait, rather than
calving interval. By removing the imperative to get cows back into calf as soon as possible after
calving then culling for poor fertility may be reduced and so longevity may increase.
An economic assessment of extended lactations based on real UK data is also required so that
producers have some idea of the real costs of moving to extended lactations. This assessment will
need to take into account the effects of different levels of milk yield and persistency
Project Report to Defra
8. As a guide this report should be no longer than 20 sides of A4. This report is to provide Defra with details of the outputs of the research project for internal purposes; to meet the terms of the contract; and to allow Defra to publish details of the outputs to meet Environmental Information Regulation or Freedom of Information obligations. This short report to Defra does not preclude contractors from also seeking to publish a full, formal scientific report/paper in an appropriate scientific or other journal/publication. Indeed, Defra actively encourages such publications as part of the contract terms. The report to Defra should include:
the scientific objectives as set out in the contract;
the extent to which the objectives set out in the contract have been met;
details of methods used and the results obtained, including statistical analysis (if appropriate);

SID 5 (Rev. 07/10) Page 4 of 42
a discussion of the results and their reliability;
the main implications of the findings;
possible future work; and
any action resulting from the research (e.g. IP, Knowledge Transfer).
References to published material
9. This section should be used to record links (hypertext links where possible) or references to other published material generated by, or relating to this project.

SID 5 (Rev. 07/10) Page 5 of 42
Introduction Under its Climate Change Act of 2008, the UK Government is committed to reducing national
greenhouse gas emissions (GHGE) to 80% of 1990 levels, by 2050. Each sector of the UK
economy has been committed to contributing to these reductions. In the agriculture sector,
livestock systems are an important source of GHGE, particularly methane (CH4) and nitrous
oxide (N2O). Livestock account for up to 40% of the world methane (CH4) production, a large
proportion (80%, de Haan et al., 1997) of which comes from enteric fermentation and a smaller
proportion (20%, Safeley et al., 1992) from anaerobic digestion in liquid manure. Sixty-four
percent of global N2O emissions are due to agriculture, chiefly as a result of fertilizer use (organic
and inorganic) but livestock species produce N2O from manure management. There are a number
of options for reducing GHGE from livestock systems. These include improving productivity and
efficiency, reducing wastage at the herd level and selecting animals which individually produce
less GHGE. This work is intended to follow up the unsupported suggestion by Hopkins and
Lobley (2009) that the adoption of extended lactations could lead to reduced GHGE. The
assumption underlying this project is that the use of extended lactations could lead to more
efficient production and less wastage. It is supposed that this approach could use a two-pronged
attack on GHGE by both reducing the number of stock required in the national dairy herd and
improving the efficiency of the remaining cows. The project will review all information currently
known about extended lactations, provide new information from an analysis of commercial UK
dairy herd records, model extended lactation production at the herd and national levels and use
the results to investigate the overall likely changes in GHGE from a move to extended lactations.
Throughout the project any negative impacts of extended lactations and any gaps in knowledge
will be identified.
The six objectives of the project were:
1. Review experiments, industry data analyses and economic modelling in UK and
elsewhere into extended lactations and determine the technical (yield, milk
composition, reproduction, health, welfare) and economic feasibility of extending
lactation length per cow from 305 days to 450 days (15 months) so that cows calve at
18-month intervals rather than at 12-month intervals (i.e. two lactations in three years v
three lactations in three years).
2. Determine the relationships between peak yield, total lactation yield, persistency
and calving index in the UK dairy herd.
3. Establish the extent to which extended lactations occur by default in UK dairy
herds, and reasons for its occurrence.
4. Determine whether or not the current output of milk in the UK could be sustained
through the adoption of extended lactations in the national dairy herd, and if so what
size of milking cow and herd replacement population would result, if the current levels
of dairy cow fertility and longevity are maintained.
5. Determine the potential impact on greenhouse gas emissions from the dairy sector
of the adoption of extended lactations.
6. Examine research and industry data into extended lactations to identify any
negative impacts that they might have on other aspects of milk production e.g.
seasonality payments, lower milk price due to higher somatic cell counts.
SID 5 (Rev. 07/10) Page 6 of 42
Objective 1. Review experiments, industry data analyses and economic modelling in UK and elsewhere into
extended lactations and determine the technical (yield, milk composition, reproduction, health,
welfare) and economic feasibility of extending lactation length per cow from 305 days to 450
days (15 months) so that cows calve at 18-month intervals rather than at 12-month intervals (i.e.
two lactations in three years v three lactations in three years).
Traditional dairy production has relied on an annual cycle of events, designed largely to fit with
the yearly pattern of grass growth but also to simplify dairy management and to satisfy the milk
buyers‟ requirements of a stable milk supply. Fixed calving periods in the spring or autumn were
maintained by aiming for a 365-day calving interval (CI; the time between successive calvings).
In order to achieve this, cows needed to have rebred after calving by about the 60th
day of
lactation since gestation length is approximately 9 mo. A lactation length of about 305 days (10
mo) became the norm and much of the recording effort, and traits used for genetic selection, were
based on this length of lactation. In recent years, the average calving interval has steadily
increased and farmers have moved away from a rigid annual calving interval, and consequently
calving periods are more flexible or even all year round. There are a number of reasons for this
change. The relentless increase in milk yields due to breed substitution with the Holstein, and
efficient genetic selection, has had a number of knock-on effects. Some cows experienced
negative-energy-balance anoestrus at the time when they would have traditionally been rebred
and so took longer to get back in calf. The idea of drying off a cow when she was still producing
a high level of milk also seemed inefficient. Calving was seen as a stressful event for the cow and
disease incidence was greatest in the first third of lactation. These factors prompted the idea of
using extended lactations as a regular system, rather than as a by-product of delayed rebreeding
(Bertilsson et al., 1997). The limited amount of research applying to extended lactations can be
grouped into three categories; experimental approaches, industry data analyses and economic
evaluation.
A number of reviews have summarised the knowledge about the issues relating to extended
lactations. Borman et al. (2004) provided background material on extended lactations in a
pasture-based setting. More recently Knight (2008) reviewed extended lactations from the
European dairying perspective. These two papers summarise a great deal of the research and
development carried out in recent years on extended lactations. However, neither review
mentions using extended lactations as a means to reduce GHGE and neither considered the
current situation with respect to extended lactations in the various developed dairy industries.
This review will start with an outline of the key research carried out on extended lactation related
issues. It will then address key topics and pull together all the information from the literature
relating to each of them.
In this work an extended lactation will be considered to be part of an 18-mo (540-d) calving
interval. This means that a lactation will be about 15 to 16 mo (450 d) in length with successful
service occurring about 9 mo (270 d) into the lactation.
Experimental results
Very few authors report research which set out to manage cows for extended lactations and
compare them with conventional systems. Some studies managed the cows „normally‟ and
observed the resulting herd parameters whilst others imposed treatments designed to increase
milk production from extended lactations. These included altering milking frequency, diet
changes and varying calving season as options to enhance production from extended lactations.
Several authors highlight a key feature of lactation, referred to as persistency. Figure 1.1 shows a
typical lactation curve which starts at a moderate level of production at parturition (Day 0), rises
to a peak within the first two months of lactation and then declines as lactation progresses until
milk yield is further reduced by the developing pregnancy (Auran, 1974; Olori et al., 1997;

SID 5 (Rev. 07/10) Page 7 of 42
Pollott, 2000). Persistency refers to the rate of decline in post-peak yield and is sometimes
described as the ability to maintain peak yield (McFadden, 1997). A persistent lactation is always
a desired feature but especially so in extended lactations. Treatments such as 3-times-a-day
milking (3X) and improved nutrition contribute to improved persistency and so may be important
features of managing extended lactation systems. In the US the use of bovine somatotrophin
(BST) is legal and has been shown to increase persistency (Bauman, 1992). This option is not
available in the UK.
0
5
10
15
20
25
30
35
0 50 100 150 200 250 300 350
Daily m
ilk
yie
ld (
kg)
Days in milk
Peak yield
Day of peak yield
Declining phase measured by persistency
Increasing phase
Figure 1.1. A typical lactation curve (note the increased fall in milk yield from Day 200 onwards
due to the developing pregnancy).
Swedish experiment
A feature of extended lactation experiments is the small number of cows used on any given
treatment; this makes significant differences between treatments difficult to achieve for some
traits and so only „trends‟ are often quoted. A number of reports exist describing work to extend
the rebreeding period by a month or two but the first published results on the experimental use of
extended lactations up to a calving interval of 18 months came from Swedish work (Bertilsson et
al., 1997; Ratnayake et al., 1998; Rehn et al., 2000; Osterman and Bertilsson, 2003; Osterman et
al., 2005). In this experiment 72 cows were divided between two treatments; 12 (12M) and 18-
month (18M) calving intervals and 2 (2X) and 3-times-a-day milking. These papers report milk
production, fertility and somatic cell count results from the system designed to compare the
calving interval groups over a three-year cycle (i.e. three normal lactations compared to two
extended lactations).
The twice-a-day milking groups had calving intervals of 358 and 545 days, equivalent to 11.8-
and 17.9-month calving intervals. The longer lactation group obviously yielded more milk per
lactation but on a „per day of calving interval‟ basis this was significantly less (P < 0.05) for the
2X group at 21.3 v 22.7 kg/d. Interestingly in the 3X groups the situation was reversed with the
shorter lactations resulting in lower production of 24.2 v 23.4 kg/d of CI. When the data were
analysed over both milking management groups there was no difference between 12 and 18-
month CI cows in milk yield per day of CI. In fact similar conclusions were reached for a number
of traits i.e. overall there was no difference between 12 and 18-month groups; this applied to
conception rate, pregnancy rate, number of inseminations per conception and somatic cell count.
Small differences were observed between heifers and older cows in some traits.
The fat and protein % lactation curves showed a continuous rise after about week 10 of lactation;
this is the expected situation in dairy cows (see for example Kolver et al., 2007). Longer

SID 5 (Rev. 07/10) Page 8 of 42
lactations result in a higher fat and protein percent overall. Similar patterns were also observed
for somatic cell count such that later milking had a slightly raised value. This was thought to be
due to the „normal‟ effect of using milking machines damaging the udder to a slight extent, rather
than an increase in mastitis.
Some positive effects of 18M were observed. Cows on the 18M regime required fewer
interventions to overcome anoestrus and, within one herd, conception rate was higher for 18M
cows. Other useful points found in this work included the fact that the higher persistency
commonly observed in heifers allowed them to utilise the 18M regime better than older cows.
Signs of heat were not found to diminish as cycle number increased past the 4th
cycle, as is
commonly expected by farmers. Increased milking frequency raised the whole lactation curve
compared to 2X but both curves demonstrated the same pattern; i.e. peak was higher but
persistency remained similar. The 3X treatment increased milk production with only a small
increase in fat and protein production. Thus fat and protein percentage was reduced in 3X cows.
Scottish study
The work reported by Sorensen et al. (2008) took a different approach from the Swedish
experiment. All 25 cows used in this research were managed for 18M calving intervals but a
range of management options were studied, all aimed at improving milk yield and/or quality in
extended lactations through improved persistency. The management options studied were milking
frequency (2X v 3X applied to 2 different quarters each of the same cow at the same time),
nutritional regime (additional 3 kg 18% CP concentrate v „normal‟ ration) and calving season
(spring v winter). The treatments that improved milk yield were 3X, high protein diet and winter
calving. Persistency was negatively correlated with peak milk yield and was also improved by 3X
and winter calving. Fat and protein proportion, and somatic cell count, showed an increase as
lactation progressed, and were also increased by 3X and winter calving. This study also looked at
casein content of the milk since this is a key aspect of manufacturing quality. This declined more
in longer lactations but was again helped by 3X and protein supplementation. This study tended
to confirm the conclusions reached in the Swedish study summarised above.
New Zealand research
The use of extended lactations in pasture-dominated systems raises a number of questions which
differ from those found in largely-housed systems. These address the issue of nutrition
throughout the extended lactation and the management of grazing under these conditions. Kolver
et al. (2007) reported a trial using 2-year calving intervals with both North American (NAHF)
and New Zealand Holstein-Friesians (NZHF; 30 cows per genotype). These animals were studied
for 2 years and fed three levels of pelleted concentrate supplementation, 0, 3 and 6 kg DM/d. The
6 treatment groups were balanced for genetic merit, calving date, age and lactation number but,
due to the genotype differences, the NZHF averaged 587 ± 70 kg bodyweight whilst the NAHF
were 700 ± 98 kg. Performance parameters from the 2-year calving animals were annualised to
allow comparison with a second group of animals maintained on 2 annual calvings.
Taking the results overall, this trial found a reduced level of milk production (18%), milk protein
(13%) and milk solids (13%) from annualised two-year lactation results compared to the annual
system. This pattern of results varied across the different feeding level/genotype combinations
such that North American Holstein-Friesians fed on 3 and 6 kg of concentrates had similar levels
of milk production in both systems. One interesting feature of these results was a second peak of
milk yield which occurred during the second spring; this was more pronounced in the NAHF than
the NZHF. Overall this report demonstrated that cows could maintain milk production over two
years from grass-based systems but there was wide variation among individual cows in their
ability to produce for more than 300 days; NAHF appeared to be better adapted to this system,
particularly when fed concentrates to supplement the pasture. In particular, NZHF appeared to lay
down too much body condition in the second year and arrived at the next lactation too fat. The
authors concluded that „with appropriate cow genetics and feed management, reduced

SID 5 (Rev. 07/10) Page 9 of 42
reproductive performance may be ameliorated in high-producing dairy cows without sacrificing
milk solids production‟.
Australian work
The use of extended lactations in a pasture-based system was reported by Audlist et al. (2007)
from an experiment under Victorian (Australia) conditions. Cows were divided into equal groups
to have lactation lengths of 10, 12, 16, 19 and 22 mo; 125 cows divided between 5 groups. A 56-
day dry period was used in this work and milk production was the main measure of output,
annualised to allow comparisons between treatments. The main conclusions were that treatments
up to 16 mo (equivalent to 18-mo CI) did not adversely affect milk yield or milk solids
production, but longer lactations (> 16 mo) led to a reduced milk and fat production per year. A
rise in milk production was observed as lactations went into their second spring and the loss in
milk production towards the end of long lactations was greater than the loss in milk solids. This
was thought to be an advantage in industries which pay on milk solids rather than milk volume.
These authors also monitored liveweight and condition score and noted that cows in longer
lactations were in better condition at the end of lactation, probably due to being in positive energy
balance for a greater part of the lactation.
American experience
A considerable amount of work in the United States of America has been undertaken looking at
the effects of bovine somatotrophin on dairy performance. The use of BST increased milk yield
and also the persistency of lactation (Bauman, 1992; Chalupa and Galligan, 1989; Chillard 1988;
Peel and Bauman, 1987) compared to an untreated control. The extra milk was gained at the cost
of extra feed for the additional milk produced but maintenance requirements were not altered
(Bauman and Vernon, 1993). In addition Ferguson (1989) found that a delay in rebreeding until
150 to 200 days postpartum, in conjunction with BST use, resulted in improvement in a number
of aspects of lactation including energy balance, fertility and health.
One of the effects of using BST is to raise both the level and persistency of lactation which has
the potential to produce an extended lactation. Van Amburgh et al. (1997) looked at using BST as
a way of creating an extended lactation. Twenty-four second lactation cows in each of 9 herds
were allocated to one of four different treatments; 60-day rebreeding period, 150-day rebreeding
period, a group not rebred and a group of heifers not rebred. The controls were contemporaries in
the herds which were not part of the experiment. Cows on the trial were given BST as
recommended by the manufacturer. Although this method is not available to UK producers it is
worth noting that the greater persistency of the BST treated cows allowed the longer lactations to
be more profitable due to the extra milk produced.
Short extensions to lactation
A number of authors have considered extensions to the 305-d lactation which resulted in calving
intervals less than 18 months by design. Most of these studies were concerned with the
„problems‟ associated with an increased days open period on an annual calving herd and so were
focussed more on fertility than overall production. Studies of this type were usually set in an
economic framework rather that purely being about the animals‟ performance. They fall into three
types of study; designed experiments, simulation studies and analyses of recorded herds.
In an Israeli study using cows in 19 commercial herds Arbel et al. (2001) compared two groups
of cows, a control group with the „normal‟ calving interval for these herds and a treatment group
which had mating delayed by 2 months. Milk yield per day of CI was higher for the treatment
group heifers but there was no difference between older cows. Several studies used a small
number of treatments or relative short extensions to the days open period and consequently
reported few differences between groups (Harrison et al,. 1974; Schneider et al., 1981).
Industry data
Dairy cow milk records used for genetic evaluation purposes are commonly taken monthly on all
SID 5 (Rev. 07/10) Page 10 of 42
milking animals in the herd. These records comprise daily milk yield, fat, protein and sometimes
lactose % and somatic cell count, an indicator of mastitis in the cow. Many recording schemes
also take data from other sources such as calving dates, service information and indicators of
body characteristics in the form of „type scores‟. Given this wealth of information recorded on
dairy herds one might expect a large number of reports providing information on lactation
characteristics relating to extended lactations in commercial herds. This is not the case. To enable
fair comparisons between animals, most genetic evaluations systems work on 305-day lactation
lengths and information from longer lactations is not used. Many papers describe the phenotypic
and genetic characteristics of dairy populations and the relationships between them but few
authors report on extended lactations. Calving interval data is routinely available from many
herds and persistency can be calculated from the monthly milk yield data but is rarely reported.
Analyses of milk data from extended lactations tends to focus on finding a lactation curve model
to adequately describe the course of milk yield (Vargs et al., 2000; Grossman and Koops, 2003;
Dematawewa et al., 2007) but these studies yield little information about relationships between
key variables. Even in our own studies modelling lactation to its conclusion we „corrected‟ for
lactation length in many analyses (Albarran-Portillo and Pollott, 2008).
Australian data
An analysis of Australian data on lactation length in Holstein Friesians gave a number of insights
into the relationships between milk production after Day 305 of lactation and prior information
(Haile-Mariam and Goddard, 2008). Herds which had a high number of cows with prolonged
lactation were selected for these analyses. Data from first and second lactation cows were
analysed for both genetic parameters and the phenotypic relationship between milk yield and
somatic cell count traits. These data had the characteristic shape of first and second lactation
cows, namely first lactation cows had a lower peak yield and were more persistent than second
lactation cows. One result of this was that first lactation cows tended to have higher milk yields in
later lactation than second lactation cows. Data on protein, fat and somatic cell count also showed
differences between cows of the two ages with second lactation cows having poorer performance
than first lactation cows.
High correlations between early and late lactation traits demonstrated that the characteristics of
the cows found in early lactation carried on into late lactation. In common with many studies
these authors found a high negative correlation between mean milk production and persistency.
When the two traits were analysed with methods to negate this correlation, persistency was found
to have a low heritability. Lactation length was found to have a very low heritability at ~0.02.
Analyses of days open
Funk et al. (1987) studied the effect of days open on milk yield from commercial dairy records in
eastern USA; this included days open in both the current and previous lactations. Analyses of
days open in the previous lactation is equivalent to looking at the effect of calving interval on the
next lactation‟s milk yield whilst using days open in the current lactation is equivalent to looking
at extended lactations, provided that cows are milked to within about 60 d of the next lactation.
Milk yield in the current lactation increased by about 2 kg per extra day open in the previous
lactation; this suggests an increase of 360 kg of milk just for using 18-mo lactations. The effect of
extending the current lactation was not linear but increased rapidly up to about 100 days open and
then had a more gradual increase above that. This is in effect a reflection of the trade off between
more days in milk with the decreasing daily yield as lactation progresses.
Studies of Israeli data by Weller et al. (1985) and Weller and Folman (1990) also concluded that
short days-open periods were less profitable than longer ones but neither study considered calving
intervals as long as 18 mo. They did make one observation, which has been echoed by several
authors, that the higher persistency in first lactation cows does make longer lactations more
productive compared to cows in later lactations.
Modelling longer lactations

SID 5 (Rev. 07/10) Page 11 of 42
Lactation modelling has been an extensively studied subject. The „classic‟ model is that described
by Wood (1967) which is relatively simple to apply and widely studied. Many authors have
shown the fit of this model to be lower than many other models and a variety of alternative
empirical and mechanistic models have been proposed (see Masselin et al. (1987) for a review).
More recently interest has centered on either suitable models for use in random regression
analyses of the test-day model or models which describe the biology of the animals in more
detail. Dematawewa et al. (2007) compared a number of models for describing extended
lactations. One result of this work was to show that the biological model of Pollott (2000) fitted
the data better than most other models. This model was used in the work described later in this
project.
Economic modelling
A number of authors reported the results of economic simulations of extended lactations but these
were very dependent on the particular country and prevailing economic conditions. The
conclusions drawn from such studies also depended on how moving away from an annual calving
pattern was viewed. If the production system was geared up to annual calving at a specific time of
year then this imposed a much greater cost of an extended lactation than in an all-year-round
calving system. Where economic comparisons between systems have been included, these studies
have provided some general guidelines on key factors to investigate in such models.
Rotz et al. (2005) took an extreme view and modelled cows with „perennial‟ lactations in the US.
They demonstrated an improvement in profitability and improved environmental benefits from
using such animals, mainly due to the increase in milking cow numbers that was possible in their
system. Lactation yield, mostly influenced by persistency, was also shown to be critical in the US
in a study comparing standard lactations with those from longer calving intervals (Holman et al.,
1984). Profitability was shown to increase as lactations became longer but then the profitability
peaked and started to decline once lactations were more than 13 months long.
Arbel et al. (2001) studied the economics of extended lactation in Israel. They too indicated that
longer calving intervals appeared to be more profitable, up to an increase of 60 days. They also
included production in the initial stages of the next lactation in their calculations and found an
even better return for extended lactations compared to „normal‟ ones.
The BST study of van Amburgh et al. (1997) also included an economic analysis of extended
lactations. Extended lactations were shown to have a number of benefits including higher
profitability, lower incidence of metabolic diseases, lower veterinary costs, fewer cullings and
replacements, an improvement in herd life and animal well-being.
A number of other economic studies have been carried out in this area but with limited
application to this project. Holman et al. (1984) modelled small changes in days open and found a
positive benefit when increasing the calving interval from 12 mo to 13 mo but this changed to a
negative value for up to 15-mo calving intervals. De Vries (2006) looked at the subject from a
different perspective and calculated the value of pregnancy to a dairy herd. This value was found
to be positive but was reduced by modelling more persistent cows. Interestingly it became
negative for high producing first lactation animals which typically have a more persistent
lactation. De Vries (2006) concluded that the optimum profitability for heifers was achieved by
rebreeding at > 450 days and for older animals at about 200 days post calving. Dekkers et al.
(1998) took a different view and studied the economics of persistency in the USA. Once again
more persistent animals were shown to have several advantages over the „standard‟ animal and
longer lactations were more profitable.
Papers dealing with extended lactations, rather than poor fertility, tend to conclude that
annualised milk yield from extended lactations is not detrimental and that such systems are
equally as profitable as annual calving patterns. However this is very dependent of the persistency

SID 5 (Rev. 07/10) Page 12 of 42
level of the lactations modelled. Three-times-a-day milking, and any other treatment designed to
increase persistency, always proved more profitable than alternative systems.
Persistency
Persistency has already been found to be a key aspect of using extended lactations in the papers
reviewed so far. The idea of persistency appears at first sight to be a simple one; a measure is
required that describes the way lactation declines after peak yield. A wide range of measures have
been used to describe persistency (see Gengler, 1995; Swalve and Gengler, 1998; Muir, 2004 for
reviews). More recently we have published industry-wide estimates of genetic and phenotypic
parameters of persistency based on a biological model of lactation (Albarran-Portillo and Pollott,
2008). Most studies conclude that there is both phenotypic and genetic variation in persistency,
and the experimental results reviewed above highlight some management practices which can
modify persistency. The heritability of persistency varied with method of calculation but was
commonly in the 0.15 to 0.25 range. Persistency tended to be negatively correlated with both
peak and total milk yield. However, van Amburgh et al. (1997) observed that higher yield was
less important than greater persistency when discussing the factors affecting the profitability of
extended lactations. As noted by several authors the higher level of heifer persistency often leads
to better yields in extended lactations than older animals (Dekkers et al., 1998; Arbel et al., 2001)
Integrating reviewed information
The characteristics of extended lactations
The only characteristic of an extended lactation that is immutable is its length, by definition. All
other characteristics are variable and depend on a range of factors. The milk yield of an extended
lactation is determined by the same range of key measurements as any other lactation; peak yield,
persistency and length (days in milk). The only different factor which may come into play is if
the persistency is so poor that the lactation terminates before its desired length; a greater
possibility the longer the lactation. Also pregnancy affects milk yield in a well defined way and
the absolute reduction in milk yield will depend on the timing of the pregnancy in relation to day
of lactation when successful conception occurred (Olori et al., 1997). Pregnancies commencing
later in lactation showed a smaller reduction in total milk yield compared to those starting earlier
in lactation. However, it is not clear whether this is an effect due to level of milk production at the
time of conception or a stage of lactation effect.
The results in Table 1.1 demonstrate some common relationships between lactation curve traits
and were derived using a biological model of lactation (Pollott, 2000) in analyses „correcting‟ for
lactation length. Total milk yield is highly related to peak yield but little else, at the phenotypic
level. Peak yield is also highly related to persistency such that lactations with a high peak yield
have a lower persistency (NB low persistency is equivalent to a high loss in milk production
between successive days). Persistency and the relative rate of cell loss are highly related but this
latter trait is not highly related to peak yield. This may at first sight seem surprising but since
peak yield occurs before the onset of cell apoptosis then the link between high peak yield and low
persistency is likely to be due to an effect on milk secretion rate per cell, and/or the number of
cells, rather than cell loss. These relationships are somewhat stronger at the genetic level. Also
milk yield and peak yield are much more highly heritable than the other traits.
Table 1.1. Heritabilities (on diagonal), genetic (above the diagonal) and phenotypic (below the
diagonal) correlations between lactation curve traits (standard errors shown below in
parentheses). From Albarran-Portillo and Pollott (2008).
PY DP DR PS TMY
Peak yield (PY) 0.30 -0.04 -0.12 0.54 0.96
(0.004) (0.053) (0.034) (0.004)
Day of peak yield (DP) 0.27 0.03 -0.69 -0.42 0.51
(0.075) (0.068) (0.093) (0.064)

SID 5 (Rev. 07/10) Page 13 of 42
Relative rate of decline 0.17 -0.39 0.08 0.84 -0.40
in cell nos. (DR) (0.004) (0.003) (0.014) (0.045)
Persistency1 (PS) 0.51 -0.10 0.88 0.08 0.31
(0.003) (0.004) (0.001) (0.047)
Total milk yield (TMY) 0.82 0.14 -0.21 0.09 0.34
(0.001) (0.004) (0.004) (0.004) 1Measured as the daily loss in milk yield mid-way between peak and end of lactation
Cows of different ages/lactation numbers have very different lactation characteristics. Heifers
tend to have a lower peak than older cows and are more persistent. Second and 3rd
lactation cows
have increasingly higher peaks and lower persistency with each successive lactation. From the 4th
to 6th
lactation there is little to distinguish between lactations in peak or persistency. Not
surprisingly total milk yield follows a similar pattern to the peak as lactation number progresses.
Younger cows are therefore likely to have lactations which are more amenable to extension than
older cows.
Although the pattern of milk component production reflects that of milk (Figure 1.1) when
expressed as proportions of milk yield the pattern is inverted (Figure 1.2). This means that as
lactation progresses fat and protein proportions increase and longer lactations will have a higher
mean fat and protein proportion compared to shorter lactations. Figure 1.2 also shows another
interesting feature of long lactations in New Zealand grass-based systems, the change in milk
production during spring of the second year (~300 DIM). In their paper Kolver et al. (2007)
highlight the increased milk yield and decreased fat proportion at this time. This is not so
apparent in more intensively-fed Holstein animals, typical of British systems.
The change in (log) somatic cell count throughout lactation follows a similar pattern to that
shown in Figure 1.2 for fat proportion; i.e. an initial fall followed by an ever increasing rise. This
also means that cows with longer lactations will have higher somatic cell counts, although
Osterman et al. (2005) suggest that this is not due to an increase in mastitis but the natural wear
of the udder increasing with the longer lactation. Age also affects SCC with heifers having lower
levels than older cows.
How to improve the milk yield for extended lactations
A number of researchers have demonstrated management practices which can be used to increase
the milk output from extended lactations. The season of calving was shown to affect the ability to
maintain a longer lactation, total milk yield and persistency (Sorensen et al., 2008); winter-calved
cows had higher values or better persistency than spring-calved cows.

SID 5 (Rev. 07/10) Page 14 of 42
Figure 1.2. Fat and protein percent throughout extended lactations for two genotypes fed three
different protein quantities (Kolver et al., 2007). New Zealand (open symbols) and North
American Holstein (filled symbols) fed on 0 (circles), 3 (triangles) and 6 (squares) kg/d
concentrates.
Feeding additional concentrate has been shown to affect yield from extended lactations with
Sorensen et al. (2008) getting a higher milk yield from 3 kg/d extra rations, as did Kolver et al.
(2007) from a comparison of 0, 3 and 6 kg/d. Neither study reported an increase in persistency
with additional feed. In their comparison of North American (NAHF) and New Zealand Holstein
(NZHF) cattle Kolver et al. (2007) were able to demonstrate a better use of the additional
concentrate by the NAHF in extended lactations. This is illustrated in Figure 1.3 which shows a
successively higher peak yield with increasing concentrate use but a similar persistency, within
breed type.
The lactation curves in Figure 1.3 also illustrate the advantage of using North American Holstein
genes to aid extended lactations; so clearly breed type can have a dramatic effect on the efficacy
of extended lactations.

SID 5 (Rev. 07/10) Page 15 of 42
Figure 1.3. Milk and milk solids production throughout extended lactations for two genotypes fed
three different protein quantities (Kolver et al., 2007). New Zealand (open symbols) and North
American Holstein (filled symbols) fed on 0 (circles), 3 (triangles) and 6 (squares) kg/d
concentrates.
A number of the factors affecting extended lactations have already discussed are part of what
might be termed a „system of production‟ e.g. time of calving, the use of concentrates etc. Both
the Australian and New Zealand research used mainly-grazing systems in their research whereas
Swedish, UK and USA work tended towards intensive systems with a greater emphasis on
concentrate feeding. One advantage of the grazing systems was the second peak of lactation
found in the second spring of extended lactations (Figure 1.3) but this could be viewed as
compensating for the lower milk production of these systems when compared to intensive
systems. Authors using both systems have described the conditions under which extended
lactations are feasible for their particular production methods.
Several authors have demonstrated the effect of changing from twice-a-day to three-times-a-day
milking frequency. The overall effect is to increase lactation yield brought about by both an
increase in the level of the lactation curve (Ostermann and Bertilsson, 2003) and persistency
(Sorensen et al., 2008). More frequent milking is expected to have such an impact in high-
yielding dairy cows due to a reduction in the feedback inhibitor of lactation effect (FIL; Knight et
al., 1994). A lower interval between milkings reduces the effect of FIL and hence allows more
milk to be produced.
Fertility of extended lactations
Calving interval is commonly used a measure of fertility in dairy herds but relies on breeders
SID 5 (Rev. 07/10) Page 16 of 42
aiming to get their cows back into calf as soon as possible after calving. In an extended lactation
scenario this is not an objective and so other measures of fertility may be required. Most reports
of designed experiments to investigate extended lactations have been too small to demonstrate
differences in other measures of fertility such as the number of services per conception or
abnormal luteal cycles. However, Ostermann et al. (2003) observed that there was no reduction in
the signs of oestrus at the 7th
cycle. In his review of extended lactations Knight (2008) concludes
that “there is no evidence that late rebreeding is „easy‟ and it can be anticipated that problems
may be different to those encountered in current practice.” As yet no such problems have been
suggested by the limited amount of published research.
Health, longevity and replacement rate with extended lactations
Once again the limited experimental evidence is unable to demonstrate any differences in health
or longevity due to different lactation lengths. Knight (2008) suggests that because cows on
extended lactations have fewer calvings, and calvings are seen as a high-risk and stressful event,
then they should be healthier than conventional cows. Modelling work with BST in the USA with
results expressed on a annualised basis (Allore and Erb, 2000) tends to confirm this view but such
conclusions have not been tested in experimental conditions. One might expect cows on extended
lactations to have a lower likelihood of culling at any given age. If this were the case then the
annual replacement rate would be reduced and the number of followers required would be lower.
However this remains as speculation at the present time.
Conclusions
A summary of the relevant literature on extended lactations has been reviewed. The information
from these papers will be used as the basis for the analysis and modelling work subsequently
reported in this project.
Objective 2.
Determine the relationships between peak yield, total lactation yield, persistency and calving
index in the UK dairy herd.
Introduction
Genetic selection for milk yield has led to a deterioration in fertility in British dairy cows during
the last two or three decades. One of the earliest reports was by Wood and Wilson (1983). They
analysed the lactations of a group of the highest yielding Friesian-Holstein cows in the UK at that
time and showed that the calving intervals of these cows were 9 days longer than the average
cow. High yields were explained by the use of high genetic merit sires and the improvement of
herd management practices. They also found a negative effect of high milk production on the
incidence of diseases. Since then, an increasing number of reports from several countries have
been published showing the decline in fertility due to selection for milk production (Dhaliwal et
al., 1996; Pryce et al., 1997; Pryce et al., 1999; Fulkerson et al., 2001; Lucy, 2001). Clearly
longer calving intervals are related to longer lactations since the average dry period has remained
at about 62 days for the last 10 years (Coffey, M,; Personal Communication). Calving interval is a
widely used measure of fertility since calving dates are widely available in milk recording
schemes. From these CI can be estimated and analysed in order to assess fertility of all cows from
commercial dairy farms in the UK.
Calving intervals reported in the literature range from 368 d (Evans et al., 2006) to 398 d (Haile-
Mariam et al., 2003) but recent work from the SAC Langhill Herd found CI to be 403 days
(Pollott and Coffey, 2008). There is general agreement that calving intervals have been
unfavourably affected by the increase of the genetic potential of dairy cows for milk production
(Pryce et al., 2000; Olori et al., 2002; Kadarmideen et al., 2003 and Banos et al., 2005).
Reproductive parameters that reflect the reproductive status of dairy cows, such as days to first

SID 5 (Rev. 07/10) Page 17 of 42
observed oestrus and start of luteal activity, have been found to be delayed in high genetic merit
cows by 21 and 11 days, respectively. These resulted in a longer days open period (99 d) than that
of low genetic merit cows (91 d) (Fulkerson et al., 2001). Lucy (2001) estimated that for every
100 kg increase in milk yield there was an increment of 1 day from calving to conception (open
days), a trait closely related to CI. The high proportion of milk produced in the first third of
lactation has been associated with a reduced rate of pregnancy to first service (Buckley et al.,
2003).
Genetic selection for increased milk yield has directly (due to selection) or indirectly (due to
energy balance) affected some characteristics of the lactation curve and milk composition. It has
been established that selection for higher milk yields and its components (fat, protein and lactose)
has negatively affected the proportions of these components (Kelm et al., 2000).
Lactation curve parameters such as day of peak yield, peak yield and persistency have been
affected by selection for higher milk yield. For instance, the day of peak yield the level of
persistency of lactation, the later the day of peak the better the persistency (Muir et al., 2004).
The level of peak yield determines total milk yield (Batra et al., 1987; Buckley et al., 2003), the
higher the peak yield the higher the total milk yield.
Pollott (2000) proposed a biological model to study the lactation curve. This model was an
alternative to empirical lactation curve models which were based on mathematical equations that
fit the shape of the lactation curve but have no biological basis. The biological model describes
parameters of the curve in terms of secretory cell differentiation in early lactation, cell death rate
after parturition and changes to secretion rate during lactation. Therefore, the output parameters
from this model have a biological basis that explain the lactation in terms of the number of
differentiated cells during lactation, the numbers of cells dying throughout lactation, plus the
secretion rate per active cell. The dynamics and characteristics of the mammary cell population
have been reported by Knight and Wilde (1987), Wilde and Knight, (1988), Wilde and Knight
(1989) Wilde et al., (1997), Knight and Wilde (1993) and Knight et al., (1998).
The parameters from Pollott‟s (2000) model cover those described by Wood (1967), as well as
some newly proposed parameters such as maximum secretion potential (MS), which is a function
of the total number of parenchyma secretory cells and the maximum secretion rate (kg/cell per
day), and is closely related to peak yield; the relative growth rate in cell numbers (GR) from
parturition to peak yield and the relative death rate in cell numbers (DR) from the start of
lactation to the end of lactation, which gives, as a result, the persistency of lactation. Pollott and
Gootwine (2001) used the biological model to estimate the genetic characteristics of the complete
lactations of Awassi sheep. They found a negative genetic correlation of 0.66 between DR and
total milk yield (TMY) and a correlation of 0.99 between MS and peak yield (PY). These genetic
correlations show the usefulness of the model to describe the parameters of the lactation curve. In
dairy cows, the model has been used to describe curve parameters and milk components of a
small data set from a single farm (Pollott, 2000) and from a multiple ovulation and embryo
transfer (MOET) herd (Pollott, 2004 and 2009). Additionally, the model was used to determine
the genetics of the lactation curve parameters from a large dataset of commercial dairy cow
records (Albarran-Portillo and Pollott, 2008).
The objective of this study was to determine the relationship between calving interval with key
lactation characteristics such as the yield traits (milk, fat, protein, lactose, total solids and water)
and parameters of the lactation curve. A full description of the research carried out is given in
Appendix 2. Only the key results are shown here
Discussion
Correlations between calving interval and lactation curve traits
The genetic correlations between calving interval and lactation curve traits were all unfavourable

SID 5 (Rev. 07/10) Page 18 of 42
in the sense that increases in production, or a decrease in persistency, were associated with
increased calving interval. The only exception was DR (the decline in cell numbers from
parturition to the end of lactation independently from the peak yield) which had a low negative
correlation with CI. This favourable correlation implies a lower rate of active cells dying as
calving interval increased, resulting in a better persistency of lactation. This was confirmed in the
phenotypic correlation of CI with DR and DM (-0.18 and -0.09, respectively).
The genetic correlations between CI and milk yields were also unfavourable, ranging from
modest 0.48 (protein) to high 0.73 (fat). The correlations of CI with milk and protein were within
the range reported by Campos et al., (1994) Haile-Mariam et al., (2003), Kadarmideen et al.,
(2003) and Muir et al., (2004). However, none of these studies reported a higher correlation than
the one found in this study of 0.73 between CI and fat production.
Appendix 2, Table 2.5. Genetic and phenotypic correlations between calving interval and
lactation curve traits (standard errors are shown below each correlation)
Correlations
MS GM DP PY DR
DM CTMY TMY
Genetic 0.59 0.46 0.20 0.59 -0.12 0.36 0.63 0.62
0.064 0.084 0.022 0.063 0.089 0.092 0.050 0.051
Phenotypic 0.03 -0.08 0.06 0.04 -0.18 -0.09 0.54 0.54
0.004 0.004 0.004 0.004 0.004 0.004 0.002 0.002
The genetic correlation between milk yield and calving interval confirmed that selection for
production has led to a genetic decline in fertility, considering CI as a suitable estimator of
fertility (Pryce et al., 1999 and Pryce et al., 2000).
Appendix 2, Table 2.6. Genetic and phenotypic correlations between calving interval and milk
component traits (standard error shown below correlations)
Milk Fat Protein Lactose Total solids Water
Genetic 0.51 0.73 0.48 0.57 0.57 0.50
0.130 0.147 0.128 0.125 0.129 0.132
Phenotypic 0.02 0.03 0.010 0.018 0.016 0.019
0.005 0.007 0.005 0.005 0.005 0.005
Phenotypically, CI and milk components were poorly correlated, in particular the correlations of
CI with milk and fat, were close to zero (0.02 and 0.03). Pryce et al., (2002) reported a negative
phenotypic correlation between CI and milk (-0.03). Other than that, phenotypic correlations
between CI, milk, fat and protein were within the ranges reported in the literature.
Levels of milk protein have been related to reproductive performance. Fulkerson et al., (2001)
associated low levels of protein (< 2.89%) with a negative energy balance, resulting in a poor
reproductive performance. Regarding fat results, De Vries et al., (2000) suggest that changes in
fat percentage are a very good indicator of energy balance and concluded that weekly changes of
fat percentages (from week 2 to week 15) were highly correlated with energy balance. Because of
this, changes of fat percentages in early lactation are good indicators of energy balance, making it
possible to use them in order to assess energy balance of cows at risk of poor reproductive
performance.
Heritability of lactation curve traits
Peak yield was the trait with the highest h2 estimated (0.36). This h
2 was higher than the 0.27
from a similar dataset in Albarran-Portillo and Pollott (2008), and higher than 0.30 estimated by

SID 5 (Rev. 07/10) Page 19 of 42
Pollott (2009) for the same trait.
Maximum secretion potential (MS) is a theoretical estimator of the maximum productive
potential of the animal that accounts for the relative number of secretory cells in the udder and the
secretion rate per active cell. As in both Albarran-Portillo and Pollott (2008) and Pollott (2009),
the h2 of MS was close to the h
2 of PY (0.36), which was the highest among the curve traits. The
heritability of PY was high compared to the h2 reported by (Farhangfar, 2002; Pollott, 2009) and
was within the range reported by Zwald et al., (2003).
The heritability of GM was 0.13. This relates to the same trait as parameter “b” in Wood‟s model,
and was higher than the estimates by Shanks et al., (1981), and Farhangfar (2002), but was lower
than Varona et al., (1998) who reported a h2 of 0.17.
Day of peak (DP) is a trait usually reported with low h2. Heritability estimates in this study was
0.03 and was lower than 0.09, 0.09, 0.10 and 0.06 reported by Shanks et al., (1981), Muir et al.,
(2004), Farhangfar (2002) and Pollott (2009), respectively.
Persistency was found to have an h2 of 0.10 and was low compared to other reports in the
literature (Shanks et al., 1981; Batra et al., 1987; Jamrozik et al., 1998; Zwald et al., 2003; Muir
et al., 2004 and Pollott, 2009). However, Farhangfar (2002) also found a low value of 0.08.
Heritability estimates of CTMY and TMY were 0.26 and 0.27 and ranged within the values
reported in the literature (Shanks et al., 1981; Batra et al., 1987; Zwald et al., 2003; Muir et al.,
2004; Ben Gara et. al., 2005; Silvestre et al., 2005).
Heritability of calving interval
There are several reports regarding the h2 of calving interval. All of these reports concluded that
CI has a low heritability. The h2 of calving interval reported here was 0.03 and was lower than
0.10 (Campos et al., 1994), 0.09 (Pryce et al., 1999), 0.04 (Olori et al., 2002) and, 0.07 (Muir et
al., 2004). However, the h2 in this study was slightly higher than 0.02 (Pryce et al., 2000), 0.01
(Pryce et al., 2001), 0.02 (Pryce et al., 2002), 0.03 (Haile et al., 2003), 0.02 (Kadarmideen et al.,
2003), 0.03 (Wall et al., 2003) and, 0.03 (Banos et al., 2005).
Extended lactations
These results are not directly about extended lactations but calving interval is very closely related
to lactation length. These analyses indicate that there is a link between calving interval and milk
production. It has commonly been assumed that this is due to higher milk yields causing low-
energy-balance anoestrus and hence the number of days open increasing. In the context of
extended lactations this may also be due to longer lactations having a higher number of
productive days and hence greater total lactation yields. The correlations reported here imply that
selection for increased milk yield will inevitably lead to longer calving intervals, higher peak
yields and reduced persistency. However, the use of suitably weighted selection indexes, or the
use of independent culling/selection levels, can break such correlations and lead to a more
desirable type of animal. Thus selection for a more persistent animal without increasing peak
yield would be possible. This could increase total milk yield without the negative effects of a high
peak yield being a factor in poorer fertility. In the context of extended lactations a longer lactation
with a higher persistency is achievable and may be desirable.
Objective 3.
Establish the extent to which extended lactations occur by default in UK dairy herds, and reasons
for its occurrence.

SID 5 (Rev. 07/10) Page 20 of 42
Introduction
For many years developed dairy industries have been focussed on an annual calving pattern and
genetic testing has been based around 305-day milk yields. Consequently very little work has
been published on lactation length in the UK. Calving interval has been widely studied since it is
a relatively easy measure of fertility, and lactation length is a major component of calving
interval. However, if extended lactations are the result of positive management decisions, rather
than a by-product of reduced fertility, then calving interval no longer becomes a measure of
fertility. The objective of this part of the project was to investigate the occurrence of extended
lactations in the UK over recent years.
Materials and methods
Data from milk recorded herds was extracted from the NMR database, held by EGENES as part
of the National Genetic Evaluations for the UK. Natural lactation length was taken to be the day
of the last lactation record in this database as opposed to a 305-d lactation length, hence the data
reported here is an underestimate by ~15d on average, since milk recording occurs once per
month. Records were collected from all completed lactations commencing since 1990. In these
analyses the year of lactation is taken as the year the lactation started. All lactations from the fifth
lactation onwards were grouped into one lactation number class.
The distribution of the lactation length data was found to be highly positively skewed and the
mean herd/year lactation length and its SD were related. Since a key output from this research
was to be the relationship between mean and standard deviation of herd lactation length it was
necessary to transform the data to a normal distribution to avoid bias in the results. A Box-Cox
transformation was used to normalise the data and achieve a dataset with a skewness of 0. The
transformation took the form:
LLtrans = (LLiλ – 1) / λ
where LLtrans and LLi were the transformed and original lactation length respectively and λ the
transformation parameter. The transformed value was scaled to give an apparently similar range
of values to the original dataset. The transformation parameter (λ) was calculated using the
original data, appropriate calculations for the skewness and the solver in Microsoft Excel to set
the skewness of the dataset to zero given the Box-Cox transformation.
Lactation length data were analysed by maximum likelihood evaluation in ASReml (Gilmour et
al., 2009) using the following model:
Yijklm = µ + hi + yj + lk + eijkl
where was lactation length in the hith
herd, in the yjth
year and from a cow in its lkth
lactation with
eijklm, the random error term.
Results
A total of over 6 million lactations occurring between 1990 and 2008 were used in these analyses
and had a mean and standard deviation lactation length of 373.6 ± 62.42 d. Figure 3.1 shows the
highly skewed nature of the distribution of lactation length in this population.

SID 5 (Rev. 07/10) Page 21 of 42
0
100,000
200,000
300,000
400,000
500,000
600,000
700,000
800,000
900,000
250 300 350 400 450 500 550 600
Nu
mb
er
Lactation length (d)
Figure 3.1. The distribution of lactation lengths in 10-d group categories.
0
100,000
200,000
300,000
400,000
500,000
600,000
1990 1992 1994 1996 1998 2000 2002 2004 2006 2008
Nu
mb
er
Year lactation commenced
Figure 3.2. The distribution of lactations by year of commencement.
The number of lactations by start year (Figure 3.2) reflects the „popularity‟ of milk recording.
From 1990 to 1998 the number of lactations rose from ~270,000 to 483,000. From 1999 to 2001
lactation numbers reduced dramatically reflecting the influence of the foot-and-mouth outbreak in
2001. Since then the steady decline in dairy herds has resulted in fewer recorded animals. The
low number in 2008 is the result of many cows starting their lactation in 2008 having not
completed it by the time this dataset was constructed. Records from 2008 will be disregarded in
subsequent analyses.

SID 5 (Rev. 07/10) Page 22 of 42
0
10
20
30
40
50
60
70
80
350
360
370
380
390
400
410
420
430
440
450
1990 1992 1994 1996 1998 2000 2002 2004 2006 2008
SD o
f lactation
length
(d)
Me
an la
cta
tio
n le
ng
th (d
)
Year lactation commenced
Mean
SD
Figure 3.3. Mean and standard deviation of lactation length by year (1990 – 2008).
Mean annual lactation length has risen since about 1994 from 360 d to 395 d in 2007 (Figure 3.3).
At the same time the variability has increased as shown by the increasing standard deviation of
the data.
0
500
1000
1500
2000
2500
3000
3500
250 300 350 400 450 500 550
Nu
mb
er
Lactation length (d)
1990
2000
2007
Figure 3.4. The distribution of lactation length for each of the years 1990, 2000 and 2007.
All three aspects of the change in the distribution of lactation length over time are illustrated in
Figure 3.4. Data from 1990 were characterised by larger numbers, lower mean lactation length
and a narrower distribution. As time progressed the number of recorded cows reduced, mean
lactation length increased and the distribution was more widely dispersed.

SID 5 (Rev. 07/10) Page 23 of 42
0
20
40
60
80
100
120
300 350 400 450 500 550
Her
d l
aca
tio
n l
eng
th S
D (
d)
Herd lactation length mean (d)
0
20
40
60
80
100
120
300 350 400 450 500 550
Her
d l
aca
tati
on
len
gth
SD
(d
)
Herd lactation length mean (d) Figure 3.5. The plots of herd/year mean lactation length against SD (d) for 1990 (left figure) and
2007 (right figure).
Plots of herd mean (minimum herd size = 40 cows/year) against herd SD for lactation length for
both 1990 and 2007 are shown in Figure 3.5, on the same scale. Several notable features of the
dataset are illustrated by these plots. Firstly the increased mean and SD noted in the overall data
is reflected in the two yearly datasets for individual herds. Secondly there is a strong correlation
(0.49) between mean and SD in these data suggesting, along with the overall distribution of
lactation length in Figure 3.1, that a transformation was necessary in order to analyse the data
using ANOVA-style methods. Such methods require the mean and variance to be independent.
0
100
200
300
400
500
600
700
250 300 350 400 450 500 550 600
Arb
itra
rily
sca
led
Box-C
ox
va
lue
Original lactation length (d)
Figure 3.6. A plot of the transformed scaled lactation length data against the original values.
A Box-Cox transformation parameter of -4.06444 was used to reduce the skewness of the
lactation length distribution to zero. The transformed data were scaled to give a similar range of
data points as the original data and so care should be taken when using these „arbitrary units‟. The
conversion of original to transformed data is shown in Figure 3.6 and the distribution of
transformed data plotted in Figure 3.7. In the transformed dataset the correlation between
herd/year mean and SD was -0.01; thus showing how successful the transformation had been.

SID 5 (Rev. 07/10) Page 24 of 42
0.0
100,000.0
200,000.0
300,000.0
400,000.0
500,000.0
600,000.0
700,000.0
800,000.0
900,000.0
300 350 400 450 500 550 600
Nu
mb
er
Transformed lactation length (arbitrary units)
Figure 3.7. The distribution of the transformed lactation length data (Arbitrary units).
The plots of herd mean (minimum herd size = 40 cows) against herd standard deviation for 1990
and 2007 using transformed lactation lengths are shown in Figure 3.8. These two plots show little
correlation between mean and SD confirming that the transformed data was more suitable to use
in subsequent analyses.
0
10
20
30
40
50
60
70
400 420 440 460 480 500 520 540 560 580 600
Her
d t
ran
sform
ed l
act
ati
on
len
gth
SD
(A
rbit
rary
un
its)
Herd transformed lactation length mean (Arbitrary units)
0
10
20
30
40
50
60
70
400 420 440 460 480 500 520 540 560 580 600
Her
d t
ran
sform
ed lacta
tion
len
gth
SD
(A
rbit
rary u
nit
s)
Herd transformed lactation length mean (Arbitrary units) Figure 3.8. The plots of herd mean against herd/year SD using the transformed lactation length
data (Arbitrary units); 1990 (left figure) and 2007 (right figure).
A comparison of the plots shown in Figure 3.4 illustrates the considerable increase in longer
lactations that has occurred in British dairy herds in recent years. The within-herd/year SD of
lactation length (Figure 3.8) highlights the fact that a number of herds with a high mean lactation
length also have a below average SD. This indicates that many herd owners are already dealing
with extended lactations and are likely to have adapted their herd management to cope with this
change.
An analysis of variance was carried out on lactation length and the results summarised in Table
3.1. The large number of records available for these analyses meant that most mean comparisons
were significantly different. With an RSD of 48.09 units, then for a group size of 350,000 (a
typical number of records per year) then a difference in means of only 0.11 units would be
significant.
Table 3.1. ANOVA summary for the main factors affecting transformed lactation length
(arbitrary units).

SID 5 (Rev. 07/10) Page 25 of 42
Source of variation Df MS F
Herd 18,304 58,656 25.36***
Year 18 48,148,552 20,817***
Lactation number 4 9,075,428 3,923***
Residual 6,651,927 2,312.9
The effect of lactation number on lactation length is shown in Table 3.2 as the mean and SD of
lactation length by lactation number.
Table 3.2. The effect of lactation number on lactation length.
Lactation
number
Number of
records
Mean all
years (d)
SD
(d)
Transformed data
(arbitrary units)
2007 data
(d)
1 2,331,749 378.7 67.07 505.1 399.1
2 1,695,634 371.8 61.62 499.7 394.1
3 1,219,029 370.3 59.56 498.5 393.8
4 852,208 370.3 57.90 498.9 393.0
5+ 571,634 370.5 55.87 500.1 394.3
First lactation cows had longer lactations than all others, 2nd
lactation cows had longer lactations
than 3rd
lactations but no other differences were significant.
One inevitable consequence of the change from an annual calving pattern to one involving longer
lactations was the change in distribution of calvings throughout the year. A summary showing the
distribution of month of calving in both 1990 and 2007 is in Figure 3.9. In 1990 there was a
marked peak of calvings in September which declined steadily until May. From June onwards
calvings picked up again until the next September peak. By 2007 this pattern of calving had
changed; there was still a peak in September but this was considerably lower than in 1990 and the
monthly proportion of calvings from December through to April were similar with a slight drop
in May. The pattern of calving seen in 2007 was likely to be a consequence of many farms
abandoning an annuals calving pattern and using longer lactations than previously was the norm.
Discussion
These data show a steady increase in lactation length of about 50 days between 1990 and 2007, as
measured by the day of the last test day. This probably underestimated lactation length by about
15 days. Apart from heifers, which have a longer lactation by a week, all other ages of cow had
similar lactation lengths. There was considerable
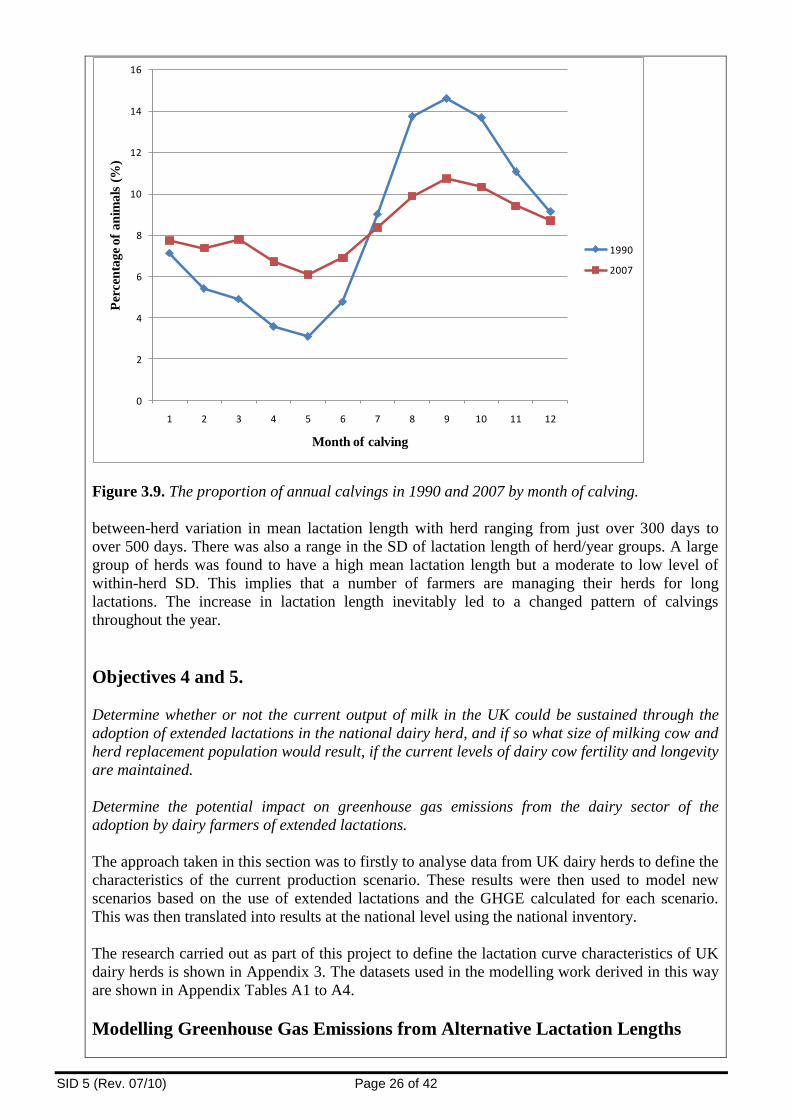
SID 5 (Rev. 07/10) Page 26 of 42
0
2
4
6
8
10
12
14
16
1 2 3 4 5 6 7 8 9 10 11 12
Per
cen
tage
of
an
imals
(%
)
Month of calving
1990
2007
Figure 3.9. The proportion of annual calvings in 1990 and 2007 by month of calving.
between-herd variation in mean lactation length with herd ranging from just over 300 days to
over 500 days. There was also a range in the SD of lactation length of herd/year groups. A large
group of herds was found to have a high mean lactation length but a moderate to low level of
within-herd SD. This implies that a number of farmers are managing their herds for long
lactations. The increase in lactation length inevitably led to a changed pattern of calvings
throughout the year.
Objectives 4 and 5.
Determine whether or not the current output of milk in the UK could be sustained through the
adoption of extended lactations in the national dairy herd, and if so what size of milking cow and
herd replacement population would result, if the current levels of dairy cow fertility and longevity
are maintained.
Determine the potential impact on greenhouse gas emissions from the dairy sector of the
adoption by dairy farmers of extended lactations.
The approach taken in this section was to firstly to analyse data from UK dairy herds to define the
characteristics of the current production scenario. These results were then used to model new
scenarios based on the use of extended lactations and the GHGE calculated for each scenario.
This was then translated into results at the national level using the national inventory.
The research carried out as part of this project to define the lactation curve characteristics of UK
dairy herds is shown in Appendix 3. The datasets used in the modelling work derived in this way
are shown in Appendix Tables A1 to A4.
Modelling Greenhouse Gas Emissions from Alternative Lactation Lengths

SID 5 (Rev. 07/10) Page 27 of 42
Introduction
Livestock systems play an important role in food production, as well as in the provision of public
good objectives including biodiversity and landscape value, which are jointly produced with
conventional outputs. However, agriculture also generates external costs or negative public
goods; specifically, diffuse pollution to air and water. Mitigating greenhouse gas emissions from
livestock is increasingly recognised as a necessary part of the UK‟s overall climate change
obligations. Under its Climate Change Act of 2008, the UK Government is committed to
ambitious targets for reducing national emissions by 80% of 1990 levels by 2050
There are many possible technical mitigation options for livestock systems. These could be
delivered through improved livestock and livestock system efficiency - converting more energy
into product output, thereby reducing GHGE per unit product. The aim of this part of the project
is to examine the impact of extended lactations on system greenhouse gas emissions.
There are many models which aim to calculate greenhouse gases for agriculture. These include
simple animal emissions factors (e.g., Tier I techniques in IPCC guidelines), national inventory
techniques (e.g., Choudrie et al., 2010), carbon footprinting tools and lifecycle analysis (e.g.,
Williams et al., 2006). However, most models differ in the way they calculate the emissions;
what output data it provides and their level of detail and accuracy.
Currently, the national inventory of GHGE uses a simplified Tier II (IPCC, 1997) to calculate
CH4 emissions from the dairy herd. This involves calculating CH4 emissions factors, due to
enteric fermentation and manure, for a milking dairy animal based on UK production parameters
(see description later). This one figure is then multiplied by the total number of animals in the
dairy breeding herd. This method does not account for variation between animals and systems,
including differences in the length of the lactation. To overcome this, a more detailed
methodology was applied to the calculation of GHGE from a dairy herd, including considering
the N2O emissions and CO2 equivalent emissions due to animal diets.
Methodology
IPCC (2006) formulae were used as the basis for developing the greenhouse gas models. UK-
specific energy coefficients and other parameters where available were put into the model moving
it from Tier I (the lowest) methodology toward the higher Tier II and III. Only emissions that
related directly to the stock were included. Emissions from capital, fuel, power etc. were assumed
to remain constant regardless of changes in lactation length and were not included in this
investigation as they were assumed to be insignificant. The carbon cost of the feed was based on
data from the Cranfield LCA model (Williams et al., 2006). In addition, the net annual carbon
dioxide emissions from livestock were assumed to be zero in accordance with IPCC (2006).
The herd
The basic biological and herd parameters are given in Appendix Tables A5 and A6, most of
which are based on the study of Stott et al. (2005), which involved a level of specialist and
industry validation of the assumptions. These figures were chosen to provide a consistent set of
figures thought representative of UK dairy farming practice.
The model parameters used by Stott et al (2005) and IPCC Tier II/III methodologies (IPCC,
2006) were used to model the CH4 (enteric fermentation and manure management) and N2O
(manure management) emissions from the whole farm system (young stock and milking herd).
Under IPCC framework N2O emissions due to nitrogen excretion when cows are grazing should
be reported in the agricultural soils of the inventory framework. This study, however, will include
these emissions as it accounts for a large proportion of the total nitrogen excreted by the dairy
system and therefore GHGE.
When examining the impact of alternative lactation lengths on overall system GHGE it was

SID 5 (Rev. 07/10) Page 28 of 42
assumed that the overall annual herd yield would remain constant and that numbers of cows (and
followers) would increase/decrease to maintain this overall yield. The following herd was
described in terms of annual steps (i.e., 0 – 1 year old, 1 – 2 year old pregnant/non-pregnant).
Results were then represented on an annualised scale. The model assumed that farmers wished to
keep total annual herd output constant, rather than individual cow lactation output. Although total
lactation output may be higher with longer lactations it may not always hold that annual outputs
of alternative lactation lengths are constant.
It was assumed that dairy cattle spent half the year indoors (Appendix Table A6). Therefore it
was assumed that their maintenance energy requirements did not have to increase to account for
the cold winter temperatures. Dairy cattle were assumed to be exposed to „Cool‟ annual average
temperatures (10-14 ºC) for the purposes of quantifying the manure management coefficient. This
meant that manure management coefficient for dairy cows at grass was 1.5%. For cattle which
had their slurry managed from indoor housing this coefficient was averaged at 17% to represent
the average values for the range of slurry management systems on dairy farms (see manure
management section).
Management
Feed digestibility (a measure of feed quality) is an influential factor in determining the
productivity and efficiency of farming ruminants (Russell et al., 1971). It can also have a
significant bearing on methane emissions (IPCC, 2006). For example a 10% error in estimating
feed digestibility can cause a 12-20% error in methane emissions (IPCC, 2006). The digestibility
values for dairy cattle on concentrates and on pasture were therefore set in the models as the
upper limits of the IPCC (2006) recommendations. Concentrate feed and lowland pasture
digestibilities were set to 85% and 75% respectively.
It was assumed that the dairy cows were grazed for approximately half the year on lowland
pastures. Cows were maintained indoors on a mixed diet of grass silage and concentrates for the
remainder of the year. The followers were assumed to follow a similar management system. The
average crude protein percentage in the annual diet was 18%. The annual average for pasture
quality was 18.45 MJGE/kg DM following recommendations by IPCC (2006) that the feed
energy value was „relatively constant‟ (at 18.45 MJGE/kg DM) across a wide range of forage and
grain-based feeds commonly consumed by livestock‟. The impact of the different diets, in terms
of GHGE, was taken from the LCA study of Williams et al. (2006). Production data were based
on the results derived previously in this study and are shown in Appendix Tables A1 to A4.
Emissions from manure storage and production at grass were estimated based on the days at grass
and indoors of the model and assumptions on manure output and storage from IPCC and
Prevention of Environmental Pollution from Agricultural Activity (PEPFAA, 2005). Greenhouse
gases from manure were calculated based on volume produced from each of the livestock
categories kept on the farm (e.g., dairy cows and followers).
Results Results from the analysis of lactations of different lengths from national data were used to
parameterise the model of dairy system GHGE. The main differences between the base scenario
(as described in Appendix Table A6) and the alternative lactation lengths are given in Table 4.1.
Table 4.1. Differences in the model assumptions for alternative lactation lengths.
Lactation length
Model parameter Units Base 305 370 440
1st lact yld kgs 7,750 7,300 8,650 10,250
2nd lact yld kgs 8,605 8,400 9,700 11,500
3rd+ lact yld kgs 8,973 8,760 10,100 12,000

SID 5 (Rev. 07/10) Page 29 of 42
Fat percent % 3.8 3.77 3.77 3.8
Replacement rate % 25.8 25 22 20
Calving interval days 370 370 430 500
Days in milk days 307 310 370 440
Running the model to produce the current level of milk output resulted in different herd structures
for the four scenarios studied (Table 4.2). As lactation length increased all categories of animals
decreased.
Table 4.2. Herd structure results from the model assuming a replacement rate of 25.8%
Base (PLI) 305-d 370-d 440-d
Milking herd size 125 129 129 127
Non-pregnant followers 17 17 15 12
Pregnant followers 39 40 34 29
Female calves 56 58 49 42
Table 4.3. Output from the GHG model of overall system emissions for alternative lactation
lengths, assuming a replacement rate of 25.8%, quantifying the total volume of GHGE from
alternative sources, expressed in t of CO2e. Base (PLI assumpt
ns) 305-d 370-d 440-d
Grass Indoors Grass Indoors Grass Indoors Grass Indoors
Enteric CH4
young stock 70.00 50.73 72.39 52.46 61.47 44.54 51.79 37.53
Enteric CH4
milking herd 250.65 196.57 252.97 198.05 248.89 247.65 243.62 302.93
Manure CH4
young stock 1.89 16.06 1.96 16.61 1.66 14.10 1.40 11.88
Manure CH4
milking herd 9.04 82.88 9.12 83.50 8.97 104.41 8.78 127.72
N2O young
stock 14.61 3.64 15.11 3.76 12.83 3.19 10.81 2.69
N2O milking
herd 61.90 15.41 64.02 15.94 64.03 15.94 62.74 15.62
CO2e feed
young stock 42.30 46.92 43.75 48.53 37.15 41.21 31.30 34.72
CO2e feed
milking herd 151.48 181.84 152.88 183.21 150.41 229.09 147.23 280.23
TOTAL/yr
t CO2e 1,195.90 1,214.25 1,285.54 1,371.02
Results in Table 4.3 show that as lactation length increases the overall annual GHGE increase.
Although there is a reduction in the number of follower animals when a dairy herd has a longer
lactation length, given the data from the national herd, the overall milking herd numbers need to
increase to maintain overall yield. Figure 4.5 shows that as lactation length increases the
proportion of the total herd emissions that comes from the follower animals decreases. About
10% of total system emissions come from enteric fermentation from the followers in the herd in
the base scenario. This decreases to 6.5% when average lactation length is 440 days. However, as
lactation length increases the proportion of GHGE from milking herd enteric fermentation
increases from 37.4% in the base scenario to 39.9% when lactation length is 440 days.
Table 4.4 shows that overall system GHGE for the differing lactation lengths with different
replacement rates. This shows that as the replacement rate increases the overall system emissions
increases. This is as a result of requiring more replacement animals to meet the requirements for
new cows entering the milking herd. However, the overall increase in emissions with increasing
replacement rates is relatively small, increasing approximately 0.5% when replacement rate
changes from 20% to 25%

SID 5 (Rev. 07/10) Page 30 of 42
0%
10%
20%
30%
40%
50%
60%
70%
80%
90%
100%
Base 305 370 440
Lactation length
Perc
en
t G
HG
em
issio
ns (
CO
2e)
Enteric CH4 Young Enteric CH4 Milk Manure CH4 N2O CO2e Feed
Figure 4.1. Distribution of GHGE from dairy systems with different average lactation lengths,
expressed as a proportion of the total emissions in CO2e.
Table 4.4. Overall system GHGE for herds with different lactation lengths (base, 305d, 370d and
440d) and different replacement rates (Base, 20%, 22% and 25%) expressed in t of CO2e.
£PLI (25.8%) 20 22 25
Base 1195.90 1188.59 1191.05 1194.88
305 1214.25 1211.96 1211.96 1211.96
370 1285.54 1294.66 1297.44 1301.76
440 1371.02 1380.74 1383.68 1388.26
Sensitivity analysis
Further to the examination of the mean results for the alternative lactations and interaction with
replacement rates an additional study of the sensitivity to the results to differing assumptions
within lactation length class was explored.
Firstly, the impact of lactation persistency was investigated by altering the persistency level of the
representative lactation curve for each lactation class, as detailed above and shown in Appendix
Tables A1 to A4. The results show (Table 4.5) that altering the persistency of the lactation curve
has a minor impact on the overall GHGE from a dairy system producing a fixed annual yield.
Improving the persistency of lactation by 10% reduced the GHGE from the dairy system by 1%
for cows with lactation length of 440 days and by 3% for cows with lactation lengths of 305 and
370 days. Increasing persistency by 20% decreased the GHGE by approximately 3.3% for cows
with lactation length of 440 days and 4.5% for cows with lactation lengths 305 and 370 days.
Reducing the persistency of the lactation curve by 10% resulted in a small increase in overall
system emissions of less than 1% for cows with lactation length 305 and 370 days. However,
decreasing the persistency of a cow lactating for 440 days increased system emissions by 3.8%
Table 4.5. Total herd GHGE from alternative lactation lengths with better/worse persistency
levels, expressed in t of CO2e/year.

SID 5 (Rev. 07/10) Page 31 of 42
Change in persistency
From
Table 4.3 -10% +10% +20%
305 1214.25 1220.82 1181.83 1163.61
370 1285.54 1301.20 1252.38 1229.91
440 1371.02 1436.09 1369.05 1338.79
There was also variation in the total lactation yield within each of the lactation lengths. The
second sensitivity study examined the impact of this variation of total lactation yield on the
predicted system emissions. This was done by modelling the overall system emissions, at fixed
annual milk volume output, of the top and bottom 10% yield cows in each of the lactation length
categories. Table 4.6 shows that the 10th
and 90th
percentile for overall lactation yield, within
lactation length, was wide. However, the fat % for higher yielding cows was always lower in the
top yielding lactations compared to the lower yielding lactations, averaging at 4.18% for lower
yields and 3.71% for higher yields. This would suggest that, although herd milk volume could be
maintained with far fewer cows for the higher yields that overall milk solids, as represented by fat
%, would be reduced.
Table 4.6. Total herd GHGE (t of CO2e/year) and number of cows in the milking herd from the
top and bottom 10% yields for alternative lactation lengths
Bottom 10% Top 10%
Lactn
length
Lactn
milk yld Fat% t CO2e/yr
Cow No. Lactn
milk yld Fat% t CO2e/yr
Cow No.
305 6,044 4.17 1,512.18 177 13,673 3.58 912.69 78
370 6,586 4.23 1,660.98 189 14,070 3.73 1,037.98 89
440 8,652 4.14 1,642.68 167 14,867 3.83 1,196.00 97
The results show that for lower yields the GHGE from the system in a year increases significantly
(compared to Table 4.3). For the lower yields within lactation class it is expected that overall
emissions would increase by between 19% (440 days) and 29% (370 days). This is largely as a
result of the increase in milking cow numbers, and the subsequent followers, required to maintain
overall herd output. For the higher yields within lactation lengths it is expected that overall
system emissions would decrease by between 14% (440 days) and 25% (305 days). This is also
due to the change, in this case decrease, in the size of the milking herd to maintain the total
annual milk output. It should be noted that the percentiles examined here are the extremes of the
yield distributions within lactation length and that they are the exception rather than the norm. To
achieve yields such as these would take a number of generations of genetic selection. Other
options to achieve such yield improvements, via nutritional or management interventions, would
not only have financial implications but also likely to have an emissions cost in their own right.
Impact in terms of national emissions The national reporting of GHGE from dairy cattle is based on guidelines and equations set out by
IPCC (1997). The reporting mechanism means that there is limited scope to separate out the CH4
and N2O emissions and fully attributed them to dairy cattle production. For example, all young
dairy cattle stock are grouped with beef cattle stock. For the purposes of clear comparisons, this

SID 5 (Rev. 07/10) Page 32 of 42
section will focus on the methane due to enteric fermentation and manure in milking dairy cows
only.
Emissions are calculated from animal population data (Table 4.7) collected in the June
Agricultural Census and published in Defra (2009) and the appropriate emission factors (Table
4.8). The dairy cattle emission factors are estimated following the IPCC Tier 2 procedure (IPCC,
1997) and vary from year to year. The base data and emission factors for cattle for 2003-2008 are
given in Table 4.8.
Table 4.7. Livestock population data and methane emissions factors for 2008 by animal type as
used in the National GHG Inventory reporting
Animal type Number Enteric methane kg
CH4/head/year
Methane from manures kg
CH4/head/year
Dairy Breeding
Herd
1,908,945 108.9 26.8
Beef and others
>1 year old 1
5,361,344 48 6
Other cattle < 1yr 2,836,696 32.8 2.96 1 Beef and others >1 year old include dairy heifers, beef heifers, others>2 and others 1-2 years old.
Table 4.8. Dairy cattle methane emission factors
Year Average
Weight of
cow (kg)
Average Rate
of Milk
Production
(litre/d)
Average
Fat
Content
(%)
Enteric
Emission
Factor (kg
CH4/head/y
Manure
Emission Factor
(kg CH4/head/y)
2003 467 18.3 3.96 94.8 23.3
2004 495 18.2 4.00 96.5 23.7
2005 714 18.8 4.02 111.6 27.4
2006 641 18.7 4.04 107.2 26.3
2007 652 19.1 4.06 109.5 26.9
2008 644 19.3 4.06 108.9 26.8 NOTES: 46% of animals graze on good quality pasture, rest confined
Gestation period 281 days; Digestible energy 74%; Methane conversion rate 6%;
Ash content of manure 8%; Methane producing capacity of manure 0.24 m3/kg VS
Table 4.9 shows that the methane emissions factor (enteric fermentation and manure) does vary
when recalculated for cows with different lactation lengths. The emissions factors in all scenarios
studied are higher than those currently used in the UK inventory. This does not reflect a real
difference in the emissions from these dairy cows but rather highlights how the different
calculations and presentation methods could result in different messages in the overall GHGE
from a dairy system.
The methane emissions factors for the alternative lactation lengths could be applied to the
national reporting framework if the total numbers of cows in each class of the lactation length
(and/or replacement rate) was know. This highlights how inventory reporting mechanisms could
be easily updated to consider a wider range of animals if more details were used, as opposed to
total census numbers only.
Table 4.9. Derived dairy cattle methane emission factors for cows with different lactation
lengths.
Lactn
length
Weight of
cow at 1st
calving
(kg)
Average Rate
of Milk
Production
(litre/d)
Average
Fat
Content
(%)
Enteric
Emission
Factor (kg
CH4/head/y
Manure
Emission
Factor (kg
CH4/head/y)
Base 540 Lact 1 = 25.2 3.8 143.1 29.4

SID 5 (Rev. 07/10) Page 33 of 42
Lact 2 = 28.0
Lact 3+ = 29.2
305 540 Lact 1 = 23.5
Lact 2 = 27.1
Lact 3+ = 28.3
3.77 139.9 28.7
370 540 Lact 1 = 23.4
Lact 2 = 26.2
Lact 3+ = 27.3
3.77 154 35.2
440 540 Lact 1 = 23.3
Lact 2 = 26.1
Lact 3+ = 27.3
3.8 172.1 43
Table 4.10 describes the proportion of milk recorded cows that could be assigned to the 3
different lactation lengths based on the number of milk recorded cows. To allow for a fair
comparison the total volume of methane produced under a methodology akin to the current
inventory was calculated based on the emissions factors estimated from the base scenario in this
study, as opposed to values currently used in the national inventory reporting. Assuming the base
scenario, when cows were not subdivided into different lactation lengths the overall methane
emissions from the milking (breeding) dairy herd was 329 Gt CH4 per annum. The proportions of
the cows in each lactation class were based on the numbers of milk recorded cows in each
lactation length class. Assuming that the proportion of milk recorded cows in each lactation
length is representative of the entire milking herd then the methane emissions attributable to the
milking herd would be estimated to be 365 Gt CH4 per annum, 11% higher than the estimate
when cows are not subdivided by lactation length. The impact of increasing the proportion of
cows in shorter/longer lactations was also shown to affect the estimation of GHGE. Such an
approach could help to highlight how inventory methodologies could be adapted to present
estimates of emissions on a finer, and more accurate, level.
Table 4.10. Derived dairy cattle methane emission factors for cows with different lactation
lengths.
Number of cows Enteric fermentn
(Gt CH4/y)
Manure
(Gt
CH4/y)
Base (no lactation length
information)
1,908,945 273.17 56.12
2008 (cows split into lactation
lengths*)
305d = 645,274
370d = 613,385
440d = 650,286
90.27
94.46
111.91
296.65
18.52
21.59
27.96
68.07
Increasing proportion in shorter
lactations by 10%
305d = 1,095,925
370d = 441,468
440d = 371,552
153.32
67.99
63.94
285.25
31.45
15.54
15.98
62.97
Increasing proportion in longer
lactations by 10%
305d = 202303
370d = 1294944
440d = 411697
28.30
199.42
70.85
298.58
5.81
45.58
17.70
69.09
305d = less then 345d; 370d = 346d – 405d; 440 = greater than 406d

SID 5 (Rev. 07/10) Page 34 of 42
Objective 6.
Examine research and industry data into extended lactations to identify any negative impacts that
they might have on other aspects of milk production e.g. seasonality payments, lower milk price
due to higher somatic cell counts.
A number of aspects of extended lactations which could be viewed as having negative impacts
have been mentioned by several authors. These are discussed here.
Milk composition
There was a link found between lower daily milk yields and higher fat and protein content. This
was not a new piece of information since the pattern of fat and protein proportion during lactation
has been known for a long time. This relationship was illustrated in Figure 1.2 showing an initial
fall followed by a continual rise as lactation progressed. Our analysis of test-day yields showed
that there was a linear relationship between milk yield and fat % (F% = 4.925 – 0.0372 MY) and
this is reflected in Figure 1.2 (from Kolver et al., 2007) when falling milk yield was halted at
turnout and fat% dropped for a while. The extended –lactation period (> 12 mo into lactation)
was characterised by falling milk production, the rate depending on persistency of the lactation,
and so was also characterised by increasing fat and protein %. In situations where payment for
milk was based on one or both of these measures then there may be a negative effect on
profitability depending on the particular penalties imposed. However, the overall effect of using
extended lactations on fat% was small, as shown in Table 4.1.
Somatic cell count
Log somatic cell count values show a very similar pattern throughout lactation to that of fat and
protein %. Appendix 3, Figure 4.7 demonstrated an initial fall followed by a rise from about day
60 of lactation. This rise continued until the end of lactation. Once again payments based on
somatic cell count may have an effect on the profitability of milk production but the overall effect
is likely to be small, since the rise in SCC in late lactation is not a major contributor over the total
length of the lactation. Bertilsson et al. (1997) suggested that this rise was not due to an increase
in mastitis but the normal erosion of mammary cells as lactation progressed.
Casein content
Sorensen et al. (2008) commented on the reduced casein content of late-lactation milk from cows
with lower milk yields. A higher casein content is required for successful processing of the milk
into cheese, fermented products, heat-treated products and cream liqueurs. This effect was not
found from more persistent lactations and so was not associated with higher-yielding animals.
Saltier taste
The Swedish work reviewed earlier suggested that there was a slightly saltier taste associated
with milk produced from very low daily yields. This is unlikely to become a major negative
factor since dilution of this milk by that from all other parts of the lactation in the bulk tank will
make it undetectable.
Gaps in knowledge
Although this research project has used a considerable amount of information associated with
extended lactations very little of it has come from commercial UK herds managed to achieve 18-
month calving intervals. In this sense there are huge knowledge gaps on the use of extended
lactations. However, persistency is a key feature of extended lactations and all animals evaluated
as part of the national genetic evaluations could have a persistency EBV. Critical features of
extended lactations that need more research include fertility and longevity of cows involved in
extended lactations, particularly if the move towards higher milk yields is seen as the way to
SID 5 (Rev. 07/10) Page 35 of 42
reduce GHGE from the dairy sector. The combination of higher yields and longer lactations will
highlight conception rate as a more critical fertility trait, rather than calving interval. By
removing the imperative to get cows back into calf as soon as possible after calving then culling
for poor fertility may be reduced and so longevity may increase.
An economic assessment of extended lactations based on real UK data is also required so that
producers have some idea of the real costs of moving to extended lactations. This assessment will
need to take into account the effects of different levels of milk yield and persistency.
Final discussion and conclusions
The objective of this research was to see if the use of extended lactations in the UK dairy industry
would lead to a reduction in greenhouse gas emissions and also have any negative effects which
may need to be considered. The approach to this project was to use a model of the „average‟ UK
dairy farm and to investigate the GHGE changes likely under a range of extended lactation
scenarios, the inputs to the model being based on a review of the literature and an analysis of
records from UK dairy farms. This is the first time that extended lactations have been
investigated as a means of reducing GHGE.
The starting point to discuss the results is Table 4.2 which compares the GHGE from the current
„PLI‟ base herd and herds having 305-d, 370-d and 440-d lactations, all having lactations
characteristics based on results from analysing performance recorded herds. This comparison
suggested that a herd based on extended lactations (440-d lactation length) would have increased
GHGE compared to the other 3 scenarios, some 14% more than the base scenario. These
comparisons were made on the basis that the current annual milk yield, fertility and longevity
within the herd were maintained. The extended lactation scenario resulted in a larger dairy herd
and fewer followers but the reduced emissions from the followers were far outweighed by the
increase in emissions from the milking herd. The increase in cow numbers was due to the
constraint that milk output should remain the same. Since milk yield in the last 6 months of the
extended lactation was relatively low, compared to the first 12 months, then more cows are
required to maintain annual output. These extra cows contribute to the increased GHGE and the
milk produced during the last 6 months of an extended lactation is the least efficient production,
in terms of GHGE.
Alternative scenarios were investigated to see how GHGE changed with a change in lactation
persistency or a shift in the lactation curve. Improving persistency by 10 or 20% resulted in
reduced GHGE but this reduction was not enough to bring the extended lactation emissions back
to the base scenario levels (Table 4.4). If herds using extended lactations reached the level of
performance in the top 10% of herds then their GHGE would be the same as the current base herd
scenario. The level of milk yield in such herds was 14,867 kg per lactation and cow numbers
were reduced from 127 to 97 in such a scenario.
Several authors suggested that the use of extended lactations may lead to greater longevity in
dairy cows. Greater longevity would be reflected in lower replacement rates so alternative
scenarios were modelled looking at a range of replacement rates (Table 4.3). Reduced
replacement rates resulted in lower levels of GHGE but the change was relatively small and herds
using extended lactations would still have higher levels of GHGE than the current base scenario.
The current research has found that a change from the current lactation length to an extended
lactation of ~450 days is unlikely to lead to a reduction in GHGE. Both improved persistency and
longevity do have an effect to reduce GHGE in longer lactations but their ability to make
substantial inroads into GHGE is small. The modelling work carried out in this study indicates
that increased milk yield is the most likely method by which GHGE can be reduced for any given

SID 5 (Rev. 07/10) Page 36 of 42
level of output from the UK dairy herd. Substantial increases in yield have been achieved over
recent years and this has been linked to reduced fertility and longer lactations. Recent studies
have shown that continuing reduced fertility as milk yield increase is not inevitable and UK,
Ireland and USA have all demonstrated a halt to declining fertility in recent years, by positive
selection for increased fertility. Selection for higher yields will result in reduced persistency
unless a positive move to select for increased persistency is incorporated in selection
programmes. This may be achieved using the parameters already calculated as part of the national
genetic evaluation process or by using parameters such as the relative rate of cell death which
arise from applying a biological model to lactation analysis. Increased yields could also be
achieved by moving to three-times-per-day milking.
Although the prime objective of this project was to estimate the effect of moving to extended
lactations on GHGE from the UK dairy herd there are a number of other interesting side-effects
from extended lactations. These include the possibility of using a more welfare-friendly system
having improved animal health, less culling from health and fertility related problems and hence
greater longevity, and the possibility of no loss in economic returns. Of course all these aspects
require more research but they may prove to be useful incentives for future research on extended
lactations.
All the project objectives have been met.
References Albarran-Portillo, B. 2007. The application of a biological model of lactation to study the
characteristics of lactation curves in dairy cows. PhD Thesis, University of London.
Albarrán-Portillo, B and Pollott, G. E. 2008. Genetic parameters derived from using a biological
model of lactation on records of commercial dairy cows. Journal of Dairy Science 91: 3639-
3648.
Allore, H. G. and Erb, H. N. 2000. Simulated effects on dairy cattle health of extending the
voluntary waiting period with recombinant bovine somatotrophin. Preventative Veterinary
Medicine 46: 29-50.
Arbel, R., Bigun, Y., Ezra, E., Sturman, H. and Holjman, D. 2000. The effect of extended calving
intervals in high lactating cows on milk production and profitability. Journal of Dairy Science
84:600-608.
Audlist, M. J., O‟Brien, G., Cole, D., Macmillan, K. L. and Grainger, C. 2007. Effects of varying
lactation length on milk production capacity of cows in pasture-based dairying systems. Journal
of Dairy Science 90:3234-3241
Auran, T. 1974. Studies on monthly and cumulative monthly milk yield records. III The effect of
calving interval and stage in pregnancy. Acta Agricultura Scandinavica 24: 339-348.
Banos, G. Brotherstone, S. and Coffey, M. P. 2005. Genetic Profile of Total Body Energy
Content of Holstein Cows in the First Three Lactations. Journal of Dairy Science 88: 2616-2623.
Batra, T. R. Lin, C. Y. McAllister, A. J. Lee, A. J. Roy, G. L. Vesely, J. A. Wauthy, J. M. and
Winter, K. A. 1987. Multitrait estimation of genetic-parameters of lactation curves in Holstein
heifers. Journal of Dairy Science 70: 2105-2111.
Baumann, D. E. 1992. Bovine somatotrophin: review of an emerging animal technology. Journal
of Dairy Science 75:3432-3451.
SID 5 (Rev. 07/10) Page 37 of 42
Bauman, D. E. and Vernon, R. G., 1993. Effects of exogenous somatotrophin on lactation.
Annual Review of Nutrition 13, 437-461.
Ben Gara, A. Rekik, B. and Bouallegue, M. 2006. Genetic parameters and evaluation of the
Tunisian dairy cattle population for milk yield by Bayesian and BLUP analyses. Livestock
Science 100: 142-149.
Bertilsson, J., Berglund, B., Ratnayake, G., Svennersten-Sjaunja, K. and Wiktorsson, H. 1997.
Optimising lactation cycles for the high-yielding dairy cow. A European perspective. Livestock
Production Science 50:5-13.
Borman, J. M, Macmillan, K. L. and Fahey, J. 2004. The potential for extended lactations in
Victorian dairying: a review. Australian Journal of Experimental Agriculture 44:507-519.
Buckley, F. O'Sullivan, K. Mee, J. F. Evans, R. D. and Dillon, P. 2003. Relationships among milk
yield, body condition, cow weight, and reproduction in spring-calved Holstein-Friesians. Journal
of Dairy Science 86: 2308-2319.
Campos, M. S., Wilcox, C. J., Becerril, C. M. and Diz, A. 1994. Genetic parameters for yield and
reproductive traits of Holstein and Jersey cattle in Florida. Journal of Dairy Science 77: 867-873.
Chalupa, W. and Galligan, D.T., 1989. Nutritional implications of somatotropin for lactating
cows. Journal of Dairy Science 72: 2510-2524.
Chilliard, Y., 1988. Long-term effects of recombinant bovine somatotropin (rbST) on dairy cow
performances. Annales de Zootechnique 37: 159-180.
Choudrie, S.L., Jackson, J., Watterson, J.D., Murrells, T., Passant, N., Thomson, A., Cardenas,
L., Leech, A., Mobbs, D.C., and Thistlewaite, G. 2010. UK greenhouse gas inventory 1990-2008:
Annual report for submission under the framework convention on climate change AEA,
Technology, Dicot, Oxfordshire, UK. Available at:
http://www.airquality.co.uk/reports/cat07/1005070919_ukghgi-90-
08_main_chapters_Issue3_Final.pdf
Defra 2009 Agriculture in the UK 2007. The Stationery Office, London.
De Haan, C., Steinfeld, H. and Blackburn, H. 1997. Livestock and the environment: finding the
balance. FAO; Rome.
Dekkers, J. C. M. Ten Hag, J. H. and Weersink, A. 1998. Economic aspects of persistency of
lactation in dairy cattle. Livestock Production Science. 53: 237-252.
Dematawewa, C. M. D., Pearson, R. E. and VanRaden, P. M. 2007. Modeling extended lactations
of Holsteins. Journal of Dairy Science 90:3924-3936.
Dhaliwal, G. S. Murray, R. D. and Dobson, H. 1996. Effects of milk yield, and calving to first
service interval, in determining herd fertility in dairy cows. Animal Reproduction Science 41:
109-117.
De Vries, M. J. and Veerkamp, R. F. 2000. Energy balance of dairy cattle in relation to milk
production variables and fertility. Journal of Dairy Science 83:62-69
De Vries, A. 2006. Economic value of pregnancy in dairy cattle. Journal of Dairy Science

SID 5 (Rev. 07/10) Page 38 of 42
89:3876-3885.
Erb, R. E., Goodwin, M. M., Morrison, R. A. and Shaw, A. O. 1952. Lactation studies. I. Effect
of gestation. Journal of Dairy Science 35: 224-233.
Evans, R. D. Wallace, M. Garrick, D. J. Dillon, P. Berry, D. P. and Olori, V. 2006. Effects of
calving age, breed fraction and month of calving on calving interval and survival across parities
in Irish spring-calving dairy cows. Livestock Science 100:216-230.
Farhangfar, H. 2002. A phenotypic and genetic study of lactation traits in Iranian Holstein cows.
PhD Thesis. University of Newcastle upon Tyne, UK.
Ferguson, J. D. 1989. Interactions between milk yield and reproduction in dairy cows. In:
Meeting the Challenges of a New Technology. Monsanto Technical Symposium Precedings.
Cornell Nutrition Conference for Feed Manufacturers, Animal Science Division, Monsanto
Agriculture, St. Louis, MO, pp. 35-44.
Fulkerson, W., Wilkins, J., Dobos, R. C., Hough G. M., Goddard, M. E. and Davison, T. 2001.
Reproductive performance in Holstein-Friesian cows in relation to genetic merit and level of
feeding when grazing pasture. Animal Science. 73: 397-406.
Funk, D. A., Freeman, A. E. and Berger, P. J. 1987. Effects of previous days open, previous days
dry and present days open on lactation yield. Journal of Dairy Science 70:2366-2373.
Gengler, N. 1995. Use of mixed models to appreciate the persistency of yields during the
lactation of milk yield. Faculte Universitaire des Sciences Agronomiques de Gembloux.
Communaute Francaise de Belgique. Ph.D. Thesis.
Gilmour, A.R., Gogel, B.J., Cullis, B.R., and Thompson, R. 2009. ASReml User
Guide Release 3.0. VSN International Ltd, Hemel Hempstead, HP1 1ES, UK
www.vsni.co.uk
Grossman, M., and W. J. Koops. 2003. Modeling extended lactation curves of dairy cattle: A
biological basis for the multiphasic approach. Journal of Dairy Science 86:988–998.
Haile-Mariam, M. and Goddard, M. E. 2008. Genetic and phenotypic parameters of lactations
longer than 305 days (extended lactations). Animal 2:325-335.
Haile-Mariam, M. Bowman, P. J. and Goddard, M. E. 2003. Genetic and environmental
relationship among calving interval, survival, persistency of milk yield and somatic cell count in
dairy cattle. Livestock Production Science. 80: 189-200.
Harrison, D. S., Meadows, C. E., Boyd, L. J., and Britt, J. H. 1974. Effects of interval to first
service on reproduction, lactation and culling in dairy cows. Journal of Dairy Science 57:628.
(Abstr.)
Holman, F. J., Shumway, C. R., Blake, R. W., Schwart, R. B. and Sudweeks, E. M. 1984.
Economic value of days open for Holstein cows of alternative milk yields with varying calving
intervals. Journal of Dairy Science 67:636-643.

SID 5 (Rev. 07/10) Page 39 of 42
Hopkins, A .and Lobley, M. 2009. A Scientific Review of the Impact of UK Ruminant Livestock
on Greenhouse Gas Emissions. University of Exeter Centre for Rural Policy Research Report No
27. pp 34-35.
IPCC. 1997. IPCC Revised 1996 Guidelines for National Greenhouse Gas Inventories, Volume 3,
Greenhouse Gas Inventory Reference Manual, IPCC. WGI Technical Support Unit, Hadley
Centre, Meteorological Office, Bracknell, UK.
IPCC. 2006. 2006 Guidelines for national greenhouse gas inventories The Intergovernmental
Panel on Climate Change Available at: http://www.ipcc-nggip.iges.or.jp/public/2006gl/vol4.html
Jamrozik, J., Jansen, G., Schaeffer, L. R. and Liu, Z. 1998. Analysis of persistency of lactation
calculated from a random regression test day model. INTERBULL Bulletin No. 16, 43.
Kadarmideen, H. N. Thompson, R. Coffey, M. P. and Kossaibati, M. A. 2003. Genetic
parameters and evaluations from single- and multiple-trait analysis of dairy cow fertility and milk
production. Livestock Production Science. 81: 183-195.
Kelm, S. C. Freeman, A. E. and NC-2 Technical Committee. 2000. Direct and correlated
responses to selection for milk yield: results and conclusions of Regional Project NC-2,
"Improvement of Dairy Cattle through Breeding, with Emphasis on Selection". Journal of Dairy
Science 83: 2721-2732.
Knight, C. H. 2008. Extended lactation in dairy cows: could it work for European dairy farmers?
In: Fertility in dairy cows: bridging the gaps (Eds. M. D. Royal, N. C. Friggens and R. F. Smith).
BSAS, Edinburgh, UK.
Knight, C. H. Peaker, M. and Wilde, C. J. 1998. Local control of mammary development and
function. Reviews of Reproduction. 3: 104-112.
Knight, C. H. and Wilde, C. J. 1987. Mammary growth during lactation: implications for
increasing milk yield. Journal of Dairy Science. 70: 1991-2000.
Knight, C. H. and Wilde, C. J. 1993. Mammary cell changes during pregnancy and lactation.
Livestock Production Science. 35: 3-19.
Knight, C. H., Hirst, D. and Dewhurst, R. J. 1994. Milk accumulation and distribution in the
bovine udder during the interval between milkings. Journal of Dairy Research 61:167-177
Kolver, E. S., Roche, J. R., Burke, C. R., Kay, J. K. and Aspin, P. W. 2007. Extending lactation
in pasture-based dairy cows: 1. Genotype and diet effect on milk and reproduction. Journal of
Dairy Science 90:5518-5530.
Lucy, M. C. 2001. ADSA Foundation Scholar Award - Reproductive loss in high-producing dairy
cattle: Where will it end? Journal of Dairy Science. 84: 1277-1293.
Masselin, S. Sauvant, D. Chapoutot, P. and Milan, D. 1987. Adjustment Models for the Lactation
Curves. Annales de Zootechnie. 36: 171-206.
Muir, B. L. 2004. Genetic of lactation persistency and relationships with reproductive
performance in Holsteins. Ph.D. Dissertation. University of Guelph; ON, Canada.
Muir, B. L., Fatehi, J. and Schaeffer, L. R. 2004. Genetic relationships between persistency and
reproductive performance in first-lactation Canadian Holsteins. Journal of Dairy Science. 87:

SID 5 (Rev. 07/10) Page 40 of 42
3029-3037.
Olori, V. E., S. Brotherstone, W.G. Hill, B.J. McGuirk. 1997. Effect of gestation stage on milk
yield and composition in Holstein Friesian dairy cattle. Livestock Production Science 52:167-176.
Olori, V. E., Meuwissen, T. H. E. and Veerkamp, R. F. 2002. Calving interval and survival
breeding values as measure of cow fertility in a pasture-based production system with seasonal
calving. Journal of Dairy Science 85: 689-696.
Osterman, S. and Bertilsson, J., 2003. Extended calving interval in combination with milking two
or three times per day: effects on milk production and milk composition. Livestock Production
Science 82:139– 149.
Osterman, S., K. Ostensson, K. Svennersten-Sjaunja, J. and Bertilsson, T. 2005. How does
extended lactation in combination with different milking frequencies affect somatic cell counts in
dairy cows? Livestock Production Science 96:225–232.
Peel, C. J. and Bauman, D. E. 1987. Somatotropin and lactation. Journal of Dairy Science
70:474-486.
Pollott, G. E. 2000. A biological approach to lactation curve analysis for milk yield. Journal of
Dairy Science 83: 2448-2458.
Pollott, G. E. 2004. Deconstructing milk yield and composition during lactation using
biologically-based lactation models. Journal of Dairy Science, 87:2375-2387.
Pollott, G. E. 2009 Genetic parameters of a biological lactation model: early lactation and
secretion rate traits of dairy heifers. Animal 3:1085-1093.
Pollott, G. E. and Gootwine, E. 2000. Appropriate mathematical models for describing the
complete lactation of dairy sheep. Animal Science. 71: 197-207.
Pollott, G. E. and Gootwine, E. 2001. A genetic analysis of complete lactation milk production in
Improved Awassi sheep. Livestock Production Science. 71: 37-47.
Pollott, G. E. and Coffey, M, P. 2008. The effect of genetic merit and production system on dairy
cow fertility, measured using progesterone profiles and on-farm recording. Journal of Dairy
Science 91: 3649-3660.
PEPFAA. 2005. Prevention of environmental pollution from agricultural activity: A code of good
practice. Available at:
http://www.scotland.gov.uk/Publications/2005/03/20613/51384
Pryce, J. E. Coffey, M. P. and Brotherstone, S. 2000. The genetic relationship between calving
interval, body condition score and linear type and management traits in registered Holsteins.
Journal of Dairy Science. 83: 2664-2671.
Pryce, J. E. Coffey, M. P. Brotherstone, S. H. and Woolliams, J. A. 2002. Genetic relationships
between calving interval and body condition score conditional on milk yield. Journal of Dairy
Science 85: 1590-1595.
Pryce, J. E. Nielsen, B. L. Veerkamp, R. F. and Simm, G. 1999. Genotype and feeding system
effects and interactions for health and fertility traits in dairy cattle. Livestock Production Science.
57: 193-201.

SID 5 (Rev. 07/10) Page 41 of 42
Pryce, J. E. Veerkamp, R. F. Thompson, R. Hill, W. G. and Simm, G. 1997. Genetic aspects of
common health disorders and measures of fertility in Holstein Friesian dairy cattle. Animal
Science. 65: 353-360.
Ratnayake, D. R. T. G., Berglund, B., Bertilsson, J., Forsberg, M. and Gustafsson, H. 1998.
Fertility in dairy cows managed for calving intervals of 12, 15 and 18 months. Acta Veterinaria
Scandinavica 39:215-228.
Rehn, H., Berglund, B., Emanuelson, U., Tengroth, G. and Philipsson, J. 2000. Milk production
in Swedish dairy cows managed for calving intervals of 12 and 15 months. Acta Agriclturae
Scandinavica A, Animal Science 50: 263–271.
Rotz, C. A., Zartman, D. L. and Crandall, K. L. 2005. Economic and environmental feasibility of
a perennial cow dairy farm. Journal of Dairy Science 88:3009-3019.
Russell, A. J. F. 1971. Relationship between energy intake and productivity in hill sheep.
Nutrition of hill cattle and sheep. Proceedings of the Nutrition Society 30: 197-204.
Safeley, L.M., Casada, M.E., Woodbury, J.W. and Roos, K.E 1992. Global Methane Emissions
from Livestock and Poultry Manure. United States Environmental Protection Agency,
EPA/4001/1-91/048.
Sargent, F. D., Lytton, V. H., and Wall, O. G. Jr. 1968. Test interval method of calculating Dairy
Herd Improvement Association records. Journal of Dairy Science 51:170-179.
SAS (Statistical Analysis Systems Institute). 1989. SAS Inst., I. Release 8.2 (TS2M0). Cary, NC,
USA.
Schneider, F., Shelford, J. A., Peterson, R. G. and Fisher, L. J. 1981. Effects of early and late
breeding of dairy cows on reproduction and production in current and subsequent lactation.
Journal of Dairy Science 64:1996–2002.
Shanks, R. D., P. J. Berger, A. E. Freeman, and F. N. Dickinson. 1981. Genetic aspects of
lactation curves. Journal of Dairy Science 64:1852–1860
Silvestre, A. M. Petim-Batista, F. and Colaco, J. 2005. Genetic parameter estimates of Portuguese
dairy cows for milk, fat, and protein using a spline test-day model. Journal of Dairy Science 88:
1225-1230.
Sorensen, A., Muir, D. D. and Knight, C. H. 2008. Extended lactation in dairy cows: effects of
milking frequency, calving season and nutrition on lactation persistency and milk quality. Journal
of Dairy Research 75:90–97.
Stott, A. W., Coffey, M. P. and Brotherstone, S. 2005. Including lameness and mastitis in a profit
index for dairy cattle. Animal Science 80: 41-52.
Swalve, H. H. and Gengler, N. 1998. Genetics of lactation persistency. Pages 75–82 in:
Proceedings of the International Symposium on Metabolic Stress in Dairy Cows. British Society
of Animal Science (BSAS), EU Concerted Action Group on Genetic Improvement of Functional
Traits (GIFT) und British Cattle Veterinary Assoc. (BCVA), Edinburgh, Scotland.
Van Amburg, M. E., Galton, D. M., Bauman, D. E. and Everett, R. W. 1997. Management and
economics of extended calving intervals with use of bovine somatotrophin. Livestock Production
Science. 50: 15-28.

SID 5 (Rev. 07/10) Page 42 of 42
Vargas, B., Koops, W. J., Herrero, M. and Van Arendonk, J. A. M. 2000. Modeling extended
lactations of dairy cows. Journal of Dairy Science 83:1371-1380.
Varona, L. Moreno, C. Cortes, L. A. G. and Altarriba, J. 1998. Bayesian analysis of Wood's
lactation curve for Spanish dairy cows. Journal of Dairy Science 81: 1469-1478.
Wall, E. Brotherstone, S. Woolliams, J. A. Banos, G. and Coffey, M. P. 2003. Genetic evaluation
of fertility using direct and correlated traits. Journal of Dairy Science 86: 4093-4102.
Weller, J. I. and Folman, Y. 1990. Effects of calf value and reproductive management on
optimum days to first breeding. Journal of Dairy Science 73:1318-1326
Weller, J. I. and Bar-Anan, R. 1985. Effects of days open on annualized milk yields in current
and following lactations. Journal of Dairy Science 68:1241.
Wilde, C. J. and Knight, C. H. 1988. Metabolic adaptations in mammary gland during the
declining phase of lactation. Journal of Dairy Science. 71: 120.
Wilde, C. J. and Knight, C. H. 1989. Metabolic adaptations in mammary gland during the
declining phase of lactation. Journal of Dairy Science. 72: 1679-1692.
Wilde, C. J. Quarrie, L. H. Tonner, E. Flint, D. J. and Peaker, M. 1997. Mammary apoptosis.
Livestock Production Science. 50: 29-37.
Williams, A. G., Audsley, E., and Sanders, D.L. 2006. Determining the environmental burdens
and resource use in the production of agricultural and horticultural commodities. Main report
Defra Research Project IS0205. Bedford: Cranfield University and Defra Available at
www.silsoe.cranfield.ac.uk and www.defra.gov.uk
Wood, P. D. P. 1967. Algebraic model of lactation curve in cattle. Nature (Lond.). 216: 164-165.
Wood, P. D. P. and Wilson, P. N. 1983. Some attributes of very high-yielding British Friesian
and Holstein dairy cows. Animal Production 37: 157-164.
Zwald, N. R. Weigel, K. A. Fikse, W. F. and Rekaya, R. 2003. Identification of factors that cause
genotype by environment interaction between herds of Holstein cattle in seventeen countries.
Journal of Dairy Science 86: 1009-1018.