sickness, disability and work -...
TRANSCRIPT

Sickness, Disabilityand Work
BREAKING THE BARRIERS
Australia, Luxembourg, Spain and the United Kingdom
Vol. 2

ORGANISATION FOR ECONOMIC CO-OPERATION AND DEVELOPMENT
The OECD is a unique forum where the governments of 30 democracies work together to
address the economic, social and environmental challenges of globalisation. The OECD is also at
the forefront of efforts to understand and to help governments respond to new developments and
concerns, such as corporate governance, the information economy and the challenges of an
ageing population. The Organisation provides a setting where governments can compare policy
experiences, seek answers to common problems, identify good practice and work to co-ordinate
domestic and international policies.
The OECD member countries are: Australia, Austria, Belgium, Canada, the Czech Republic,
Denmark, Finland, France, Germany, Greece, Hungary, Iceland, Ireland, Italy, Japan, Korea,
Luxembourg, Mexico, the Netherlands, New Zealand, Norway, Poland, Portugal, the Slovak Republic,
Spain, Sweden, Switzerland, Turkey, the United Kingdom and the United States. The Commission of
the European Communities takes part in the work of the OECD.
OECD Publishing disseminates widely the results of the Organisation’s statistics gathering and
research on economic, social and environmental issues, as well as the conventions, guidelines and
standards agreed by its members.
Also available in French under the title:
Maladie, invalidité et travail
SURMONTER LES OBSTACLES
Australie, Espagne, Luxembourg et Royaume-Uni
Vol. 2
Corrigenda to OECD publications may be found on line at: www.oecd.org/publishing/corrigenda.
© OECD 2007
No reproduction, copy, transmission or translation of this publication may be made without written permission. Applications should be sent to
OECD Publishing [email protected] or by fax 33 1 45 24 99 30. Permission to photocopy a portion of this work should be addressed to the Centre français
d’exploitation du droit de copie (CFC), 20, rue des Grands-Augustins, 75006 Paris, France, fax 33 1 46 34 67 19, [email protected] or (for US only) to
Copyright Clearance Center (CCC), 222 Rosewood Drive, Danvers, MA 01923, USA, fax 1 978 646 8600, [email protected].
This work is published on the responsibility of the Secretary-General of the OECD. Theopinions expressed and arguments employed herein do not necessarily reflect the officialviews of the Organisation or of the governments of its member countries.
FOREWORD
Foreword
Sickness and disability policy should be a key economic policy concern in all OECD countries, but
tends to receive less attention than it deserves. Medical conditions, or problems labelled as such by
societies and policy systems, are increasingly proving an obstacle to raising labour force participation
rates and keeping public expenditures under control. More and more people of working age rely on
sickness and disability benefits as their main source of income, and the employment rates of those
reporting disabling conditions are low. Unemployment has fallen in recent years in the OECD area,
yet almost nowhere has this drop translated into more jobs for people with disability. With
increasingly stricter work requirements in unemployment and social assistance programmes, and
gradual retrenchment of early retirement systems, the pressure on long-term sickness and disability
benefit schemes has increased. This, in turn, has led to rising numbers of people of working-age
drawing these benefits and more public spending on them. There is now an urgent need to address
this “medicalisation” of labour market problems.
This new thematic review looks at how abilities can be matched with opportunities. It examines
national policies to control and reduce the inflow into sickness and disability benefit programmes,
and to assist those beneficiaries who are able to work reintegrate the labour market. It attempts to
discover what leads a person with a health problem to withdraw from the labour market or remain
outside of it, and to identify areas for further policy improvement. Along these lines, this is a review
of the employment prospects of persons with health problems or disability, not of their wider position
and chances in society. This is why the report has a strong focus on benefit systems and employment
policies while saying little about, for instance, broader issues of accessibility, which can be important
pre-conditions for some of those people. Similarly, the main concern of the review is people who could
work but do not work. Many people with health problems can work and want to work, so any policy
based on the assumption that they cannot work is fundamentally flawed. Helping people to work is
potentially a “win-win” policy: it helps people avoid exclusion and have higher incomes while raising
the prospect of more effective labour supply and higher economic output in the long term.
The second report in this series examines the challenges and obstacles facing Australia,
Luxembourg, Spain and the United Kingdom. In particular, it looks at promising steps in those four
countries toward transforming sickness and disability schemes from passive benefits to active
support systems that promote work. The report consists of five chapters and an Executive Summary
of main challenges and lessons with a number of specific recommendations for further reforms for
each country. Chapter 1 sets the scale of the problems looking at current key outcomes in the four
countries. Chapter 2 evaluates past and ongoing sickness and disability policy reforms. Chapter 3
discusses how better sickness management and disability assessment can help reduce the inflow
into long-term benefits. Chapter 4 analyses how replacement rates and work incentives are affected
by the countries’ tax and benefit systems. Chapter 5, finally, looks at the roles of employers, public
authorities and people with reduced work capacity in the delivery of employment policies and
rehabilitation programmes and at recent developments and new challenges in this field.
SICKNESS, DISABILITY AND WORK: BREAKING THE BARRIERS – VOL. 2 – ISBN 978-92-64-03815-8 – © OECD 2007 3

FOREWORD
This publication is the second in a series of three comparative reports on sickness and disability
policies in selected OECD countries. The first report, which was published in 2006, covered Norway,
Poland and Switzerland, and the third one, to be published in 2008, will cover Denmark, Finland,
Ireland and the Netherlands. The three comparative reports will be followed by a synthesis report
that will summarise the lessons learned in the course of the review for all OECD countries.
Work on this review was a collaborative effort, carried out jointly by the Employment Analysis
and Policy Division and the Social Policy Division at the Directorate for Employment, Labour and
Social Affairs. The report was prepared by Patrik Andersson, Michael Förster and Christopher Prinz
(team leader). Tax-benefit models were prepared by Dominique Paturot, statistical assistance was
provided by Dana Blumin and Maxime Ladaique, and administrative support by Marie-Line Noonan.
Important inputs for the report were supplied by the Australian Department of Employment and
Workplace Relations (DEWR), Luxembourg’s General Inspectorate of Social Security (IGSS), the
Spanish Ministry of Employment and Social Affairs (MTAS) and the United Kingdom’s Department
for Work and Pensions (DWP). These institutions prepared background documents, provided
empirical evidence (together with the National Statistical Institutes), organised fact-finding missions
and commented on a draft of this report. The draft text was also discussed at a seminar in
Luxembourg in June 2007.
SICKNESS, DISABILITY AND WORK: BREAKING THE BARRIERS – VOL. 2 – ISBN 978-92-64-03815-8 – © OECD 20074

TABLE OF CONTENTS
Table of Contents
Executive Summary and Policy Recommendations . . . . . . . . . . . . . . . . . . . . . . . . . . . . . . 11
Chapter 1. Key Trends and Outcomes . . . . . . . . . . . . . . . . . . . . . . . . . . . . . . . . . . . . . . . . . . 37
1.1. Employment and unemployment of people with disability. . . . . . . . . . . . . . . . . . . . 38
A. Macroeconomic environment and labour market trends . . . . . . . . . . . . . . . . . . . 38
B. Employment among people with disability . . . . . . . . . . . . . . . . . . . . . . . . . . . . . . 39
C. Unemployment and inactivity among people with disability . . . . . . . . . . . . . . . 41
1.2. Financial resources of people with disability: income and poverty . . . . . . . . . . . . . 44
A. Relative income levels . . . . . . . . . . . . . . . . . . . . . . . . . . . . . . . . . . . . . . . . . . . . . . . . 44
B. Incidence of low incomes and poverty risks. . . . . . . . . . . . . . . . . . . . . . . . . . . . . . 45
1.3. Costs of disability benefit schemes: public spending and benefit dependence . . . 47
A. Amount and composition of public spending. . . . . . . . . . . . . . . . . . . . . . . . . . . . . 47
B. Trends in benefit recipiency . . . . . . . . . . . . . . . . . . . . . . . . . . . . . . . . . . . . . . . . . . . 48
C. Average benefit levels. . . . . . . . . . . . . . . . . . . . . . . . . . . . . . . . . . . . . . . . . . . . . . . . . 50
1.4. Exclusion and inclusion errors: disability benefit recipiency and disability
prevalence . . . . . . . . . . . . . . . . . . . . . . . . . . . . . . . . . . . . . . . . . . . . . . . . . . . . . . . . . . . . . 51
A. Understanding the concept of “disability” . . . . . . . . . . . . . . . . . . . . . . . . . . . . . . . 51
B. Exclusion and inclusion errors . . . . . . . . . . . . . . . . . . . . . . . . . . . . . . . . . . . . . . . . . 52
1.5. Demographic challenges: population ageing and future labour supply shortages. 54
A. Effects of ageing on recent trends among disability beneficiaries . . . . . . . . . . . 54
B. Demographic challenges on disability policies over the coming decades . . . . . 54
1.6. Impact of labour market requirements: work and health . . . . . . . . . . . . . . . . . . . . . 57
A. Disability and health trends in the population. . . . . . . . . . . . . . . . . . . . . . . . . . . . 57
B. Labour market requirements and health . . . . . . . . . . . . . . . . . . . . . . . . . . . . . . . . 58
1.7. Conclusion . . . . . . . . . . . . . . . . . . . . . . . . . . . . . . . . . . . . . . . . . . . . . . . . . . . . . . . . . . . . . 62
Notes . . . . . . . . . . . . . . . . . . . . . . . . . . . . . . . . . . . . . . . . . . . . . . . . . . . . . . . . . . . . . . . . . . . . . . 63
Chapter 2. Evaluating Recent and Ongoing Reforms . . . . . . . . . . . . . . . . . . . . . . . . . . . . . 65
2.1. Australia: new participation requirements through welfare reform . . . . . . . . . . . . 68
A. Expansion of services and new funding mechanisms. . . . . . . . . . . . . . . . . . . . . . 68
B. Increasing workforce participation and reducing welfare dependency . . . . . . . 70
2.2. Luxembourg: managing partial work capacity in a different way. . . . . . . . . . . . . . . 71
A. Reducing the inflow into disability benefits . . . . . . . . . . . . . . . . . . . . . . . . . . . . . . 71
B. Helping people with partial work capacity getting into work . . . . . . . . . . . . . . . 72
2.3. Spain: decentralising and concentrating decision powers . . . . . . . . . . . . . . . . . . . . . 73
A. Devolution of responsibilities to the regional level . . . . . . . . . . . . . . . . . . . . . . . . 73
B. Concentration of benefit matters at one single authority . . . . . . . . . . . . . . . . . . 74
2.4. The United Kingdom: rebalancing rights and opportunities . . . . . . . . . . . . . . . . . . . 75
A. Switching to a more active policy approach . . . . . . . . . . . . . . . . . . . . . . . . . . . . . . 75
SICKNESS, DISABILITY AND WORK: BREAKING THE BARRIERS – VOL. 2 – ISBN 978-92-64-03815-8 – © OECD 2007 5
TABLE OF CONTENTS
B. Redefining rights and responsibilities . . . . . . . . . . . . . . . . . . . . . . . . . . . . . . . . . . . 76
C. Improving assessments and work incentives. . . . . . . . . . . . . . . . . . . . . . . . . . . . . 77
2.5. The likely impact of recent and ongoing reform . . . . . . . . . . . . . . . . . . . . . . . . . . . . . 78
Notes . . . . . . . . . . . . . . . . . . . . . . . . . . . . . . . . . . . . . . . . . . . . . . . . . . . . . . . . . . . . . . . . . . . . . . 80
Chapter 3. Absence Monitoring and Assessment of Disability . . . . . . . . . . . . . . . . . . . . 81
3.1. Inflow into disability: what do we know? . . . . . . . . . . . . . . . . . . . . . . . . . . . . . . . . . . . 82
A. Evidence on inflows into disability. . . . . . . . . . . . . . . . . . . . . . . . . . . . . . . . . . . . . . 82
B. Evidence on sickness absence. . . . . . . . . . . . . . . . . . . . . . . . . . . . . . . . . . . . . . . . . . 85
C. Pathways into disability benefits . . . . . . . . . . . . . . . . . . . . . . . . . . . . . . . . . . . . . . . 87
3.2. Preventing disability early on . . . . . . . . . . . . . . . . . . . . . . . . . . . . . . . . . . . . . . . . . . . . . 88
A. Early identification and early intervention . . . . . . . . . . . . . . . . . . . . . . . . . . . . . . . 88
B. The role of employers. . . . . . . . . . . . . . . . . . . . . . . . . . . . . . . . . . . . . . . . . . . . . . . . . 90
C. Monitoring absences of sick workers . . . . . . . . . . . . . . . . . . . . . . . . . . . . . . . . . . . . 92
D. Health status monitoring of the unemployed . . . . . . . . . . . . . . . . . . . . . . . . . . . . 94
3.3. Disability benefit for those who need it . . . . . . . . . . . . . . . . . . . . . . . . . . . . . . . . . . . . 95
A. Assessing disability. . . . . . . . . . . . . . . . . . . . . . . . . . . . . . . . . . . . . . . . . . . . . . . . . . . 95
B. Health conditions and disability benefits . . . . . . . . . . . . . . . . . . . . . . . . . . . . . . . . 98
C. Addressing partial work capacity . . . . . . . . . . . . . . . . . . . . . . . . . . . . . . . . . . . . . . . 101
3.4. Future policy directions . . . . . . . . . . . . . . . . . . . . . . . . . . . . . . . . . . . . . . . . . . . . . . . . . . 104
Notes . . . . . . . . . . . . . . . . . . . . . . . . . . . . . . . . . . . . . . . . . . . . . . . . . . . . . . . . . . . . . . . . . . . . . . 105
Chapter 4. Financial Incentives and Disincentives for People with Disability . . . . . . . 107
4.1. The “attractiveness” of disability benefits . . . . . . . . . . . . . . . . . . . . . . . . . . . . . . . . . . 108
A. The relative importance of disability benefits . . . . . . . . . . . . . . . . . . . . . . . . . . . . 108
B. The tax/benefit position of persons with disability . . . . . . . . . . . . . . . . . . . . . . . . 110
C. Adequacy and generosity of replacement rates . . . . . . . . . . . . . . . . . . . . . . . . . . . 112
4.2. Disability benefits as an early retirement pathway. . . . . . . . . . . . . . . . . . . . . . . . . . . 115
A. Age bias in disability benefit recipiency . . . . . . . . . . . . . . . . . . . . . . . . . . . . . . . . . 115
B. Accounting for disability prevalence . . . . . . . . . . . . . . . . . . . . . . . . . . . . . . . . . . . . 115
C. Benefit system design and reform . . . . . . . . . . . . . . . . . . . . . . . . . . . . . . . . . . . . . . 116
D. Different pathways into retirement . . . . . . . . . . . . . . . . . . . . . . . . . . . . . . . . . . . . . 118
4.3. Work incentives and disincentives for disability benefit recipients . . . . . . . . . . . . . 120
A. Does it pay to work? . . . . . . . . . . . . . . . . . . . . . . . . . . . . . . . . . . . . . . . . . . . . . . . . . . 120
B. The impact of increasing work efforts . . . . . . . . . . . . . . . . . . . . . . . . . . . . . . . . . . . 122
4.4. The impact of recent and planned benefit reforms on work incentives . . . . . . . . . 123
A. Australia . . . . . . . . . . . . . . . . . . . . . . . . . . . . . . . . . . . . . . . . . . . . . . . . . . . . . . . . . . . . 123
B. Luxembourg . . . . . . . . . . . . . . . . . . . . . . . . . . . . . . . . . . . . . . . . . . . . . . . . . . . . . . . . . 125
C. Spain . . . . . . . . . . . . . . . . . . . . . . . . . . . . . . . . . . . . . . . . . . . . . . . . . . . . . . . . . . . . . . . 126
D. United Kingdom . . . . . . . . . . . . . . . . . . . . . . . . . . . . . . . . . . . . . . . . . . . . . . . . . . . . . 128
4.5. Conclusions . . . . . . . . . . . . . . . . . . . . . . . . . . . . . . . . . . . . . . . . . . . . . . . . . . . . . . . . . . . . 129
Notes . . . . . . . . . . . . . . . . . . . . . . . . . . . . . . . . . . . . . . . . . . . . . . . . . . . . . . . . . . . . . . . . . . . . . . 131
Annex 4.A1. Background Tables for Different Household Types . . . . . . . . . . . . . . . . . . . . 132
Chapter 5. Employment Policy – New Challenges and Directions . . . . . . . . . . . . . . . . . . 137
5.1. Employment and disability: where do we stand? . . . . . . . . . . . . . . . . . . . . . . . . . . . . 138
5.2. More and better targeted employment services . . . . . . . . . . . . . . . . . . . . . . . . . . . . . 142
A. What support is suitable for people with disability . . . . . . . . . . . . . . . . . . . . . . . . 142
SICKNESS, DISABILITY AND WORK: BREAKING THE BARRIERS – VOL. 2 – ISBN 978-92-64-03815-8 – © OECD 20076

TABLE OF CONTENTS
B. What support is available for people with disability . . . . . . . . . . . . . . . . . . . . . . . 143
C. Participation in activation measures . . . . . . . . . . . . . . . . . . . . . . . . . . . . . . . . . . . . 147
D. Access to employment activation services . . . . . . . . . . . . . . . . . . . . . . . . . . . . . . . 149
5.3. A new balance of rights and responsibilities . . . . . . . . . . . . . . . . . . . . . . . . . . . . . . . . 152
A. New directions for the state to help people with health problems back to work. . 152
B. Increasing responsibilities for individuals with health problems . . . . . . . . . . . . 158
C. New ways to better involve employers . . . . . . . . . . . . . . . . . . . . . . . . . . . . . . . . . . 161
5.4. Future policy directions . . . . . . . . . . . . . . . . . . . . . . . . . . . . . . . . . . . . . . . . . . . . . . . . . . 167
Notes . . . . . . . . . . . . . . . . . . . . . . . . . . . . . . . . . . . . . . . . . . . . . . . . . . . . . . . . . . . . . . . . . . . . . . 169
Bibliography . . . . . . . . . . . . . . . . . . . . . . . . . . . . . . . . . . . . . . . . . . . . . . . . . . . . . . . . . . . . . . . . 171
List of Acronyms . . . . . . . . . . . . . . . . . . . . . . . . . . . . . . . . . . . . . . . . . . . . . . . . . . . . . . . . . . . . 175
List of Boxes
0.1. Scope of the report . . . . . . . . . . . . . . . . . . . . . . . . . . . . . . . . . . . . . . . . . . . . . . . . . . . 11
0.2. Policy recommendations for Australia. . . . . . . . . . . . . . . . . . . . . . . . . . . . . . . . . . . 21
0.3. Policy recommendations for Luxembourg . . . . . . . . . . . . . . . . . . . . . . . . . . . . . . . 25
0.4. Policy recommendations for Spain. . . . . . . . . . . . . . . . . . . . . . . . . . . . . . . . . . . . . . 28
0.5. Policy recommendations for the United Kingdom. . . . . . . . . . . . . . . . . . . . . . . . . 32
2.1. Structure of the countries’ sickness and disability schemes – An overview . . . . 66
2.2. Illustration of countries’ policy stances and trends. . . . . . . . . . . . . . . . . . . . . . . . 79
3.1. Early identification and co-operation between main actors in Norway . . . . . . . 89
3.2. Harmonisation of sickness benefit regulations in Luxembourg . . . . . . . . . . . . . 91
3.3. Ways to re assess and monitor sickness absence in Luxembourg and Spain . . . 93
3.4. Innovative Job Capacity Assessment in Australia . . . . . . . . . . . . . . . . . . . . . . . . . 96
5.1. Personalised employment service of Work Directions United Kingdom . . . . . . 144
5.2. Specialised employment measures in Australia and the United Kingdom . . . . 145
5.3. Australia’s Job Network Disability Support Pension Pilot . . . . . . . . . . . . . . . . . . . 151
5.4. Benbro Electronics: A recurrent best-practice price winner in Australia . . . . . . 167
List of Tables
0.1. Magnitude of the problem in Australia, Luxembourg, Spain
and the United Kingdom . . . . . . . . . . . . . . . . . . . . . . . . . . . . . . . . . . . . . . . . . . . . . . 13
0.2. Selected key outcomes in Australia, Luxembourg, Spain
and the United Kingdom . . . . . . . . . . . . . . . . . . . . . . . . . . . . . . . . . . . . . . . . . . . . . . 14
1.1. Favourable economic and labour market trends in the past five years . . . . . . . 39
1.2. Employment differentials are higher for older and less educated persons . . . . 41
1.3. Higher shares of inactivity among total non-employment for people
with disability, especially among men . . . . . . . . . . . . . . . . . . . . . . . . . . . . . . . . . . 43
1.4. Many inactive persons with disability want to work. . . . . . . . . . . . . . . . . . . . . . . 43
1.5. More persons with disability among the lowest income deciles,
especially in Australia . . . . . . . . . . . . . . . . . . . . . . . . . . . . . . . . . . . . . . . . . . . . . . . . 45
1.6. Being employed reduces otherwise higher poverty risks among persons
with disability . . . . . . . . . . . . . . . . . . . . . . . . . . . . . . . . . . . . . . . . . . . . . . . . . . . . . . . 46
1.7. Average disability benefits grew faster than wages in Luxembourg and Spain,
but lagged behind in Australia and especially in the United Kingdom. . . . . . . . 50
SICKNESS, DISABILITY AND WORK: BREAKING THE BARRIERS – VOL. 2 – ISBN 978-92-64-03815-8 – © OECD 2007 7
TABLE OF CONTENTS
1.8. Benefit receipt and disability prevalence: comparing different disability
definitions . . . . . . . . . . . . . . . . . . . . . . . . . . . . . . . . . . . . . . . . . . . . . . . . . . . . . . . . . . 51
1.9. Exclusion errors are higher in continental European countries. . . . . . . . . . . . . . 53
1.10. Population ageing will have a larger impact on future beneficiary trends
in Australia and Luxembourg . . . . . . . . . . . . . . . . . . . . . . . . . . . . . . . . . . . . . . . . . . 56
1.11. Disability prevalence increases with age and lower education . . . . . . . . . . . . . . 58
1.12. Increasing levels of perceived work intensity in European countries. . . . . . . . . 61
1.13. Levels of perceived work-related stress vary greatly with work intensity
and work satisfaction . . . . . . . . . . . . . . . . . . . . . . . . . . . . . . . . . . . . . . . . . . . . . . . . . 61
3.1. The time people spend on disability benefits is increasing . . . . . . . . . . . . . . . . . 84
3.2. Long-term absence in Luxembourg is much higher for blue-collar workers . . . 86
3.3. Pathways into disability benefits are poorly documented . . . . . . . . . . . . . . . . . . 87
3.4. Employment rates drop rapidly after the onset of a disability. . . . . . . . . . . . . . . 88
3.5. Employment rates for people with mental health conditions
are extremely low . . . . . . . . . . . . . . . . . . . . . . . . . . . . . . . . . . . . . . . . . . . . . . . . . . . . 100
4.1. Earnings are the most important income source for persons with disability . . 109
4.2. Gross and net replacement rates for main disability benefit schemes
are higher in continental European countries . . . . . . . . . . . . . . . . . . . . . . . . . . . . 111
4.3. Disability benefits are more prominent among older men in Australia
and the United Kingdom . . . . . . . . . . . . . . . . . . . . . . . . . . . . . . . . . . . . . . . . . . . . . . 120
4.4. Increasing working hours is not always very attractive for workers
with disability . . . . . . . . . . . . . . . . . . . . . . . . . . . . . . . . . . . . . . . . . . . . . . . . . . . . . . . 123
4.5. Lower benefit rates but higher withdrawal rates for persons
with partially-reduced work capacity in Australia since July 2006 . . . . . . . . . . . 124
4.A1.1. Main characteristics of disability benefit and taxation systems,
as at 1st July 2005 . . . . . . . . . . . . . . . . . . . . . . . . . . . . . . . . . . . . . . . . . . . . . . . . . . . . 133
5.1. Employment characteristics of people with disability are different
from those of people without disability. . . . . . . . . . . . . . . . . . . . . . . . . . . . . . . . . . 139
5.2. Qualification levels of people with disability are lagging far behind
everywhere. . . . . . . . . . . . . . . . . . . . . . . . . . . . . . . . . . . . . . . . . . . . . . . . . . . . . . . . . . 141
5.3. Participation in employment measures in Australia and the United Kingdom 148
5.4. Per capita spending on activation measures is similar in Australia
and the United Kingdom . . . . . . . . . . . . . . . . . . . . . . . . . . . . . . . . . . . . . . . . . . . . . . 149
5.5. Employment outcomes from activation programmes
in the United Kingdom are promising . . . . . . . . . . . . . . . . . . . . . . . . . . . . . . . . . . . 155
5.6. Employment outcomes for jobseekers with disability in Australia
are slightly worse than for those without disability . . . . . . . . . . . . . . . . . . . . . . . 155
5.7. Outflows from disability benefits are relatively low everywhere . . . . . . . . . . . . 159
5.8. The majority of recipients in Australia and the United Kingdom
leave disability benefits involuntarily . . . . . . . . . . . . . . . . . . . . . . . . . . . . . . . . . . . 160
5.9. Share of disability benefit recipients in receipt of a benefit
for less than two years . . . . . . . . . . . . . . . . . . . . . . . . . . . . . . . . . . . . . . . . . . . . . . . . 160
5.10. Fulfilment of the employment quota is weak in Luxembourg. . . . . . . . . . . . . . . 163
SICKNESS, DISABILITY AND WORK: BREAKING THE BARRIERS – VOL. 2 – ISBN 978-92-64-03815-8 – © OECD 20078

TABLE OF CONTENTS
List of Figures
1.1. Employment rates of persons with disability are only half the level
of those without disability, except in Luxembourg . . . . . . . . . . . . . . . . . . . . . . . . 40
1.2. Higher and longer unemployment among the population with disability. . . . . 42
1.3. Relative income levels of persons with disability are higher in continental
European countries . . . . . . . . . . . . . . . . . . . . . . . . . . . . . . . . . . . . . . . . . . . . . . . . . . . 44
1.4. Falling trend in spending on disability benefits in recent years . . . . . . . . . . . . . 47
1.5. Incapacity-related spending exceeds unemployment-related spending,
except in Spain . . . . . . . . . . . . . . . . . . . . . . . . . . . . . . . . . . . . . . . . . . . . . . . . . . . . . . 48
1.6. Disability benefit recipiency rates have increased in Australia
and the United Kingdom but have fallen in Luxembourg. . . . . . . . . . . . . . . . . . . 49
1.7. Most persons with disability do not receive disability benefits,
and many recipients do not claim to have a disability . . . . . . . . . . . . . . . . . . . . . 52
1.8. Recent trends in beneficiary numbers result only partly from population
ageing . . . . . . . . . . . . . . . . . . . . . . . . . . . . . . . . . . . . . . . . . . . . . . . . . . . . . . . . . . . . . . 55
1.9. Projected population and labour force 2005-2050 . . . . . . . . . . . . . . . . . . . . . . . . . 57
1.10. Steadily improving health status in all four countries . . . . . . . . . . . . . . . . . . . . . 59
1.11. Inconclusive evidence on selected changes in the working environment . . . . . 60
2.1. Comparing sickness and disability policies across time and countries . . . . . . . 80
3.1. Inflows into disability benefits are falling and the gender gap is closing. . . . . . 83
3.2. Disability inflow rates and unemployment-population ratios
are highly correlated. . . . . . . . . . . . . . . . . . . . . . . . . . . . . . . . . . . . . . . . . . . . . . . . . . 84
3.3. Evolution of sickness absence in the European countries . . . . . . . . . . . . . . . . . . 85
3.4. Major health conditions of disability benefit recipients vary considerably . . . . 99
3.5. Employment rates of disability benefit recipients are highest in Spain
and lowest in the United Kingdom. . . . . . . . . . . . . . . . . . . . . . . . . . . . . . . . . . . . . . 102
3.6. Unemployment in Luxembourg increased more than disability fell. . . . . . . . . . 103
4.1. Lower-rate disability and unemployment schemes provide similar
net replacement income . . . . . . . . . . . . . . . . . . . . . . . . . . . . . . . . . . . . . . . . . . . . . . 113
4.2. Disability beneficiaries significantly biased toward older age groups,
in particular in Luxembourg and Spain . . . . . . . . . . . . . . . . . . . . . . . . . . . . . . . . . . 116
4.3. United Kingdom: interdependency between age-specific disability
recipiency and prevalence rates . . . . . . . . . . . . . . . . . . . . . . . . . . . . . . . . . . . . . . . . 117
4.4. Recipiency age bias in Australia and the United Kingdom
is explained by the age structure of disability prevalence . . . . . . . . . . . . . . . . . . 117
4.5. Age top-up to disability benefits in Spain moves net replacement rates
above those of unemployment benefits . . . . . . . . . . . . . . . . . . . . . . . . . . . . . . . . . 118
4.6. Australia: changes in old-age pension rules influenced disability inflow . . . . . 119
4.7. Taking up work can be very costly, but not so in Spain . . . . . . . . . . . . . . . . . . . . 121
4.8. Australia: moving from DSP to NSA increases work disincentives
for lower-earning singles and inactive couples . . . . . . . . . . . . . . . . . . . . . . . . . . . 125
4.9. Luxembourg: being on unemployment rather than disability benefit
can imply doubling of average effective taxation when taking up work . . . . . . 126
4.10. Spain: reform of non-contributory benefits significantly increased work
incentives in the lower earnings range . . . . . . . . . . . . . . . . . . . . . . . . . . . . . . . . . . 127
4.11. United Kingdom: net replacement income from new Employment
and Support Allowance is likely to be similar to incapacity benefit . . . . . . . . . . 128
SICKNESS, DISABILITY AND WORK: BREAKING THE BARRIERS – VOL. 2 – ISBN 978-92-64-03815-8 – © OECD 2007 9

TABLE OF CONTENTS
4.12. United Kingdom: taking up work becomes slightly more attractive
with the new Employment and Support Allowance . . . . . . . . . . . . . . . . . . . . . . . 129
4.A1.1. Net replacement rates for disability benefits,
unemployment benefits and social assistance, couple households, 2005 . . . . . 135
4.A1.2. Average effective tax rates for persons with disability in different
household situations, 2005 . . . . . . . . . . . . . . . . . . . . . . . . . . . . . . . . . . . . . . . . . . . . 136
5.1. Spending on activation measures for people with disability is low
in all countries . . . . . . . . . . . . . . . . . . . . . . . . . . . . . . . . . . . . . . . . . . . . . . . . . . . . . . . 149
SICKNESS, DISABILITY AND WORK: BREAKING THE BARRIERS – VOL. 2 – ISBN 978-92-64-03815-8 – © OECD 200710
ISBN 978-92-64-03815-8
Sickness, Disability and Work
Breaking the Barriers – Vol. 2
© OECD 2007
Executive Summary and Policy Recommendations
Too many workers leave the labour market permanently in the course of a growing health
problem, and too few people with reduced work capacity are working. This is a social as
well as economic tragedy that is common to virtually all OECD countries, including
Australia, Luxembourg, Spain and the United Kingdom. Health-related problems, or
problems labelled as such because of societies’ inability to accommodate individual
differences, are increasingly proving an obstacle to raising labour force participation rates
and keeping public expenditures under control. Yet throughout the OECD area there is a
shared paradox that needs explaining. Why it is that average health status is improving,
yet more and more people of working-age leave the workforce and rely on health-related
income support? This report explores the possible factors behind this paradox, highlights
the role played by institutions and policies, and puts forward a range of recommendations
aimed at improving the situation (see Box 0.1 for more details on the scope of the report).
Box 0.1. Scope of the report
Focus of the report
The focus of the report is on how countries’ benefit and employment policy systems couldbe enhanced so as to better match people’s work capacities with their employment prospects.Therefore, the main target group of the report is people who could work but do not work, orwork less than they could and often would like to. This is why emphasis is put on sicknessabsence monitoring and the assessment of disability; financial incentives and disincentivesoffered by the benefit system; and the rights and responsibilities of beneficiaries and workerswith health problems, their employers and the state in delivering and structuring employmentpolicy. Many other aspects of policy important for the integration of people with disability intosociety at large are outside the scope of the report. This includes, for instance, broader issuesof physical barriers and accessible transport and of attitudes of the society towards peoplewith disability. For some groups of people with reduced work capacities these issues can beimportant for their labour market integration as well. Politically, these issues are much lesscontested than benefit and employment policies. Transportation, public buildings and privateworkplaces ought to be accessible for everybody, and available technical aids (e.g. for vision orhearing-impaired workers) be made available whenever needed, and OECD countries ought tomove into this direction quickly. Non-discrimination legislation is a necessary but by nomeans sufficient step.
11
EXECUTIVE SUMMARY AND POLICY RECOMMENDATIONS
Key lessons from the report
Main challenges in Australia, Luxembourg, Spain and the United Kingdom
The general problem is similar in all four countries under review: large-scale labour
market exclusion of people with health problems and widespread dependence on
health-related benefits putting pressure on the social protection system. A closer look at
country-specific outcomes, however, shows that the countries are facing different key
challenges, as summarised in Tables 0.1 and 0.2.
A major finding for Australia is the low and falling level of income of people with
disability (measured as total income of all household members adjusted for household
size), which is more than one-third lower than for those without disability, in turn leading
Box 0.1. Scope of the report (cont.)
Definition of disability and reduced work capacity
Identifying the target group of the report, i.e. working-age people with a health problem ordisability, is not straightforward (working age is defined as the age group 20-64). Disabilityand impaired health is not a dichotomous category but instead a complex conceptinfluenced as much by personal characteristics as by “environmental” factors and barriers.Depending on the latter, a person with a health problem or disability may or may not beconfronted with a reduced work capacity. The report uses two different sets of definitions,one determined by administrative procedures and the other through self-assessment. Thelatter and broader one is used to identify all people whose activities of daily living are tosome degree, moderately or severely, hampered by their health situation, or commonlyas people with disability. This is referred to as (self-assessed) disability prevalence in theworking-age population, or commonly as people with disability. Different populationsurveys in the countries under review allow the identification of this group, noting thatresulting prevalence rates are not fully comparable across countries and sometimes evenacross surveys within the same country. Administrative definitions of disability, on thecontrary, are based on often complex and more or less objective assessment procedures,always comprising medical and to some extent also vocational elements. The main one usedin the report is the definition used by the disability benefit system (or systems, if there ismore than one such scheme with different assessment procedures), with the resulting figurereferred to as disability benefit recipiency. Another definition used only occasionally is legaldisability as determined by administrative procedures for other than benefit purposes (moreprecisely, this concept is used in both Luxembourg and Spain in the context of thesecountries’ employment quotas). Due to the nature and purpose of these different definitionsof working-age disability, resulting figures overlap only partially.
Terminology
Finally, throughout the report a uniform terminology is used. Unless noted otherwise,the term disability benefit refers to the Disability Support Pension for Australia; temporaryand permanent disability pensions and the special minimum income for persons withsevere disability for Luxembourg; invalidity pension for total, absolute and severeincapacity and non-contributory invalidity benefit for Spain; and Incapacity Benefit(short-term lower rate excluded), Income Support with a disability premium and, for olderdata, Severe Disablement Allowance for the United Kingdom.
SICKNESS, DISABILITY AND WORK: BREAKING THE BARRIERS – VOL. 2 – ISBN 978-92-64-03815-8 – © OECD 200712

EXECUTIVE SUMMARY AND POLICY RECOMMENDATIONS
to a high poverty risk. This problem partly results from the equally low and falling rate of
employment of people with disability, of only 40%, despite a tight labour market. Added to
this is the very strong increase over the past 15 years in the number of people receiving
disability benefits, only partly explained by increases in the retirement age for women and
the closing of other non-activity tested income support payments. This increase has
predominantly affected workers under age 50. Even if the increase has halted recently, the
problem will persist because of the low rate of outflow from disability benefits.
In Luxembourg, disability benefits are predominantly used as an early retirement
pathway, with more than 80% of all recipients being older than 50. In turn, the share of people
without disability on disability benefit is the highest in the four countries (the “inclusion error”)
and outflows from those benefits are low. At the same time more people with disability are
found to have neither a job nor a benefit (the “exclusion error”). Also of concern is the high level
of public spending on disability benefits, at 1.7% of GDP in 2005, despite a fall from 2.2% in the
past decade. Another challenge in Luxembourg is the weak co-operation between various
actors responsible for rehabilitation and employment support, which is one of the reasons for
the recent increase in unemployment of people with disability.
In Spain, the decentralisation of large parts of disability benefit and employment
policies to the autonomous regions has raised significant co-ordination issues. In
particular, problems arise from the complexity of the indispensable co-operation between
the decentralised employment service and the centralised social insurance institution. The
second fundamental challenge in Spain is the very high level of unemployment of people
with a disability (over 18%) and their low rate of employment (less than 35%). While
employment rates have increased recently, and incomes risen in return, the sharp drop in
overall unemployment has not reached people with disability. This is partly related to the
lower average level of educational attainment and the higher average age of this
population group.
In the United Kingdom, the main challenge is the very large number of disability
benefit recipients. At 8%, the share of the working-age population on such benefits is much
higher than on average across the OECD (though including people which in other countries
would receive a separate long-term sickness benefit), and almost twice the country’s rate
Table 0.1. Magnitude of the problem in Australia, Luxembourg, Spain and the United Kingdom
Selected key policy issues Australia Luxembourg Spain United Kingdom
Controlling incapacity-related public spending ++ +++ ++ ++
Raising employment rates for people with health problems +++ + ++++ ++
Tackling lower incomes of households with people with disability +++ + ++ +++
Reducing the inflow into sickness and disability benefits ++ ++ ++ ++++
Addressing the increase in mental health conditions ++ ++ + +++
Raising the outflow from usually permanent disability benefits +++ +++ ++ ++
Strengthening co-ordination across different benefit schemes ++ +++ +++ ++
Note: The scales should be interpreted as follows: + … minor challenge; ++ … moderate challenge; +++ ... substantial challenge; and ++++ … formidable challenge.
Source: Authors’ assessment.
SICKNESS, DISABILITY AND WORK: BREAKING THE BARRIERS – VOL. 2 – ISBN 978-92-64-03815-8 – © OECD 2007 13

EXECUTIVE SUMMARY AND POLICY RECOMMENDATIONS
of unemployment. The prevalence of mental and behavioural illness has increased sharply
to reach 40% of all disability benefit recipients in 2005. Another important issue in the
United Kingdom is the low level of income of people with disability. Given their
comparatively high rate of employment, this suggests that people with disability tend to
work in low-paid jobs.
Recent policy responses
Poor outcomes like those illustrated above may to some extent reflect changing labour
market requirements. For instance, some have argued that workplaces are increasingly
stressful and working conditions surveys find that work intensity has indeed increased.
However, one important factor at work in all OECD countries is inadequate policies.
Disability assessment procedures and benefit systems have long pushed people with
Table 0.2. Selected key outcomes in Australia, Luxembourg, Spain and the United Kingdom
Selected key outcomes Australia Luxembourg Spain United Kingdoma
Spending on sickness benefits (in % of GDP) 0.5 (falling)
0.8 (constant)
1.0 (constant)
0.6(falling)
Spending on disability benefits (in % of GDP) 1.1(constant)
1.7(falling)
1.1(constant)
1.5(falling)
Employment rate of people with disability (%) 39.8(falling)
50.(constant)
34.9(rising)
45.3(rising)
Unemployment rate of people with disability (%) 7.8(falling)
7.3(rising)
18.4(rising)
7.4(constant)
People with disability and below upper secondary education (%)
49(constant)
55(falling)
81(falling)
72(falling)
Workers with disability and below upper secondary education (%)
34(constant)
43 (constant)
69(falling)
61(falling)
People with disability below 50% of the median income (%)
36(rising)
9 (. .)
18(constant)
14(constant)
Income of people with disability relative to those without disability (%)
65(falling)
89(. .)
86(rising)
73(falling)
Workers on sickness absence in the entire past week (%)
[0.7]b
(constant)1.7
(rising)2.8
(rising)2.0
(constant)
Disability benefit recipients in % of the working-age population
5.7(rising)
4.9 (falling)
3.5(constant)
8.1(constant)
Disability benefit recipients with mental health problem (%)
29 (rising)
[18]c
(. .)10
(constant)40d
(rising)
Disability benefit recipients over age 50 (%) 56 (constant)
82 (constant)
65(falling)
47(falling)
Annual outflow from disability benefits in % of current recipientse
4.6(constant)
6.1 (rising)
. . 7.3(constant)
Inclusion error: people without disability on disability benefit (%) 29 56 34 8
Exclusion error: people with disability without benefit or work (%) 11 20 16 11
Note: Information in parentheses refers to the trend in the respective indicator in the past few years (if available).a) Except for spending data, information refers to Great Britain only.b) The figure for Australia refers to workers absent during the entire past two weeks. Other data suggest that
sickness absence rates in Australia are similar to those recorded for the United Kingdom.c) The figure for Luxembourg is a crude estimate that is not really comparable with the data for the other countries.d) The figure for the United Kingdom includes behavioural disorders.e) Data for Spain are not available. Outflows exclude deaths and transfers into retirement. Nevertheless, only
between 12% (Australia) and 22% (United Kingdom) of all outflows shown are outflows into employment.Source: Details on the outcome indicators are available from the analytical chapters of this report.
SICKNESS, DISABILITY AND WORK: BREAKING THE BARRIERS – VOL. 2 – ISBN 978-92-64-03815-8 – © OECD 200714

EXECUTIVE SUMMARY AND POLICY RECOMMENDATIONS
reduced work capacity out of work and into long-term benefit dependency. Recognising the
key role of policy in this field, the four countries under review have engaged recently in
reform processes which go in the right direction.
First, in all four countries assessment procedures have been reformed. In Australia,
what is now assessed is the remaining work capacity of the individual, instead of the
functional disability or limitation, as was the case before the reform. In the United
Kingdom, the assessment procedure is also being reformed along these lines, and in Spain
increasing efforts are being made to identify better the remaining work capacity of an
individual. Luxembourg and Spain have put greater emphasis on monitoring sickness
absence, so as to better control inflows into disability benefits. Secondly, the four countries
are making greater use of employment and rehabilitation measures for those already on
benefits but also to avoid inflows into long-term benefits. Australia and the United
Kingdom are now funding employment services on the basis of employment outcomes and
they make intensive use of individualised case management. More fundamentally, the four
countries are also in the process of creating a new balance of rights and responsibilities for
the authorities, for people with health problems or disability and, to a lesser extent, for
employers.
There are some interesting differences across the four countries in the sequence of
reform. In Australia, employment policy change preceded benefit reform, while
Luxembourg went through the reverse pattern, with employment policy expansion coming
after changes in the benefit system. In Spain and the United Kingdom, employment and
benefit policy reform went largely hand-in-hand. Reforms in the past twenty years are
likely to help improve the effectiveness of activation and integration measures, so that
outcomes can be expected to improve as well. Nevertheless, this report shows that much
more needs to be done to curtail flows from work to sickness and disability benefits, and to
raise participation rates of those people with disability who wish to work.
Work needs to be put at the heart of sickness and disability policies, for two reasons.
First, in the face of an ageing population it will be important to maintain effective labour
supply. People with reduced work capacity who are highly underrepresented in today’s
labour markets will be an important resource in this regard. To mobilise this labour
resource will be particularly challenging in view of the much higher disability prevalence
and benefit recipiency among older workers. However, improving work opportunities is
also the best way to ensure that long-term sick people and people with disability have a
chance to play the role in society to which they aspire. Current policies often serve such
people badly: they are trapped at the margins of society, excluded from work or
marginalised into special employment categories. Helping people with disability stay or
return to work should increase overall employment rates and reduce public spending,
which further justifies dedicating resources and public expenditures to achieving this end.
Causes behind the trend rise in disability
The four countries offer some interesting lessons about trends in disability benefitrecipiency, and the driving forces behind them. First, these trends are strongly influenced bythe rate of unemployment and by reforms of the unemployment benefit scheme. In bothAustralia and the United Kingdom, in the early 1990s unemployment was high andincreasing, and this translated into gradually increasing disability benefit receipt. In the
SICKNESS, DISABILITY AND WORK: BREAKING THE BARRIERS – VOL. 2 – ISBN 978-92-64-03815-8 – © OECD 2007 15
EXECUTIVE SUMMARY AND POLICY RECOMMENDATIONS
second half of the 1990s, however, when unemployment fell due to a strong economy,disability benefit recipiency continued to increase at the same pace. By now, unemploymenthas fallen to historically low levels while disability benefit receipt has reached historicalmaxima. The mechanisms behind these opposing trends are complex, but surely include thetighter participation requirements introduced for the unemployed. Disability benefitrecipiency growth only started to level off and then even halt when reforms of the disabilitybenefit system started to bite.
Conversely, recent evidence for Luxembourg suggests that tighter access to disabilitybenefit has translated into higher structural unemployment. This raises an interestingpolitical economy issue, because policy makers tend to put more importance on lowunemployment rates than total non-employment rates. Spain offers yet anotherinteresting aspect to this story, because in this country rapidly falling unemployment hasnot translated into higher disability benefit receipt. Partly this may be because the fall inunemployment in Spain is more cyclical than in Australia and the United Kingdom whereit is structural. However, part of the explanation is that unemployment has not fallenamong people with disability; on the contrary, it has risen for this group.
These country experiences also show that the number of people having difficulties inthe labour market has not declined, that today more of those difficulties are associated withor labelled as health problems, and that reducing non-employment is therefore very difficult.This finding is particularly interesting in view of the rapid economic growth which all fourcountries have enjoyed in the past decade. This further confirms that disability benefitrecipiency tends to react asymmetrically, i.e. rising in periods of economic weakness andstaying high (unless reforms are being implemented) in periods of high growth.1
Analysis for the four countries also offers some lessons about the impact of benefitlevels, which were found to be one of the two key factors (together with benefit coverage)explaining cross-country differences in disability benefit recipiency rates (OECD, 2003). Lowbenefit levels tend to lead to lower incomes and, in turn, higher poverty risks. Yet, they donot necessarily lead to either lower inflows into disability benefit or higher transitions fromdisability benefit into work. Average disability benefit levels are much lower in Australiaand the United Kingdom than in the other two countries, yet disability recipiency rates arelower in Luxembourg and, especially, Spain.
The main explanation for this is that people with disability tend to have comparativelylow levels of skills and low-wage jobs. In turn, for most (potential) recipients netreplacement rates are relatively high even in countries with seemingly low flat-ratebenefits – such as those in Australia and the United Kingdom. This is further accentuatedby the larger role of secondary cash or in-kind benefits in those countries, such as theDisability Living Allowance in the United Kingdom and various concession cards inAustralia. Moreover, replacement rates and benefit withdrawal rates of disability benefitsrelative to those of other non-employment benefits need to be taken into account inassessing the work disincentives of the disability benefit system.
All these findings point to the need for, first, coherent policies which take all different
benefit schemes into account, secondly, employment-oriented policies which help people
overcome their labour market obstacles, and thirdly, policies which address the interests
and incentives of all players involved.
SICKNESS, DISABILITY AND WORK: BREAKING THE BARRIERS – VOL. 2 – ISBN 978-92-64-03815-8 – © OECD 200716

EXECUTIVE SUMMARY AND POLICY RECOMMENDATIONS
Reducing the inflows into sickness and disability
Experiences in the four countries also offer some lessons in terms of how best to
reduce inflows into sickness and disability benefits. Good sickness management is the key
to disability prevention and work retention. There are several elements to this. First-class
medical assessment of sickness is crucial. Strict and frequent controls by independent
medical experts, as increasingly done in Spain and Luxembourg, are needed to enable early
identification and avoid unnecessary delays of action. Systematic monitoring of longer or
repeated absences is also important. This should be done by those who carry the costs of
shorter as well as longer-term absences and disability, i.e. the employer as well as private
or public insurances or benefit authorities.
Employers play an instrumental role in this context. There are three main components
for a suitable involvement of employers. First, they need to be responsible e.g. for
monitoring absences, for seeking occupational health advice and for developing, together
with the employee, a rehabilitation and work retention strategy. Secondly, they need to
have the right financial incentives to fulfil their responsibilities, e.g. by carrying substantial
costs of not managing sickness matters adequately, as is the case in the United Kingdom
and in Luxembourg. And thirdly, they need to get early and easily accessible support to
help their sick workers. This includes good information for employers about their role and
the available supports, as is since recently provided by Australia’s JobAccess tool.
There are all kinds of practical difficulties in this regard, especially as regards
confidentiality of a medical dossier. The goal is not to violate confidentiality, of course, but
to find ways to tackle problems as soon as they arise. What is needed for this is confidential
advice at an early stage. Such advice should be provided by occupational health services,
which should have the medical and vocational expertise to identify appropriate workplace
adaptation and rehabilitation needs, especially also for mental health problems. Advice
from such services should be available for employers, general practitioners and employees.
Health status monitoring and health management is equally important for the
unemployed and people on other types of income support payments, because the share of
such people moving into disability benefits is very high. For those people, the public
authorities have to take over the role of the non-existing employer. Australia offers a
good-practice example in this regard because unemployment benefit recipients with
health problems who are activity-exempt for 26 weeks or more within one year, due to a
temporary incapacity, have to undertake a comprehensive work-capacity assessment.
Finally, greater focus needs to be given to the connection between sickness and
disability. The seemingly inevitable, almost automatic transfer from long-term sickness
into disability should be broken. In the first place, this requires proper assessment at a
pre-disability stage of what a person is able to do. Australia’s Job Seeker Classification
Instrument, which is applied upon registration with the employment service, fulfils this
role by triggering a Job Capacity Assessment for disadvantaged jobseekers. However, this
also implies that long-term sick people should be treated as long-term benefit recipients
needing help to return to employment. Luxembourg has developed a model structure for
this, even though the supports put in place to achieve the objectives are insufficient.
SICKNESS, DISABILITY AND WORK: BREAKING THE BARRIERS – VOL. 2 – ISBN 978-92-64-03815-8 – © OECD 2007 17
EXECUTIVE SUMMARY AND POLICY RECOMMENDATIONS
Promoting transitions from benefits to employment
The strong “reaction” to reform of the disability benefit inflow rate and the
comparatively inert disability benefit outflow rate suggests that limited resources are best
directed towards the inflow side of the problem. Some countries, like Switzerland, have
decided to go down this route (OECD, 2006b). Indeed it is very difficult to activate people
who have been out of the labour force for many years, often more than a decade. However,
trials in both Australia and the United Kingdom have shown that this is not impossible,
and that the same elements determine success for the integration of long-term and new
recipients.
Again, experiences from the four countries point towards policy elements needed to
best promote the transition from benefits into employment. Timing of intervention is
obviously key. Work motivation and personal aspirations decline rapidly with the duration
of inactivity and disability benefit receipt, and so do qualifications. With its redeployment
procedure, Luxembourg addresses the issue of late identification and (where needed)
intervention most rigorously.
What is most important is to target services to the very needs of people who are sick
or have a disability, taking into account that needs differ enormously. The personal adviser
approach is most developed in the United Kingdom and has been shown to be effective
(and recent and emerging evidence shows that there can be a net cost-benefit). In the
context of well-targeted services, it is essential that all people who can benefit from such
services can get them. This is not always the case in the four countries. Not in Spain, where
due to resource constraints mainstreamed services have so far failed to reach people with
disability in sufficiently large numbers, not in Luxembourg, where available services are
insufficient, and not in Australia either, where people not entitled to income support
payments have access to only a more limited set of services. To a lesser extent, the latter
argument also holds for the United Kingdom. Therefore, access to effective services should
be eased in all four countries.
This is not to say that employment services should be offered without limits. All
countries to a varying degree suffer from a lack of knowledge about which of their
programmes works for whom and, even more so, the cost-effectiveness of various types of
interventions. Developing the evidence base further is an important intermediary step to
develop more effective programmes. This requires better governance and monitoring of
employment services and their regional offices. The innovative outcome-based funding of
services in Australia and the United Kingdom seems to be a step in the right direction
because it ensures that the system rewards success. It will be important to evaluate these
initiatives rigorously to see if they work.
Incentives for benefit recipients to seek work and to seek help in finding work are
other important factors. Work must pay under all circumstances. This is certainly the case
in Spain, where benefits can be cumulated with earnings from another occupation.
Gradual benefit withdrawal rates, like in Australia, are one aspect of this. In-work
payments, as available in the United Kingdom, are another element. To the extent that the
work capacity loss is permanent, the in-work benefit should be permanent as well. The
impact of these benefits would be greater if take-up were higher and the earnings range at
which they are paid broader.
SICKNESS, DISABILITY AND WORK: BREAKING THE BARRIERS – VOL. 2 – ISBN 978-92-64-03815-8 – © OECD 200718

EXECUTIVE SUMMARY AND POLICY RECOMMENDATIONS
Equally important as an incentive to seek work are benefit suspension rules, i.e. a
possibility for longer-term benefit recipients looking for work voluntarily to put their benefit
entitlement on hold and return to disability benefit if working turned out to be impossible.
Australia and in a more restrictive manner also the United Kingdom have benefit suspension
(linking) rules which seem generous in an international context, yet there are time limits of
two years, which seem to act as a major deterrent. Given the almost non-existent benefit off-
flow of long-term beneficiaries, it is worth considering to make these rules more flexible and
unconditional and allow individuals, whose condition is unlikely to improve and who have
been on a disability benefit for, say, more than three years, to return to benefit at any time.
In-work benefits and suspension rules are only part of the work incentives picture.
Stringent job-search requirements are also important, and these have been almost inexistent
until recently for people with partially-reduced work capacity claiming disability benefits. In
this regard, the recent reform in Australia through which those people are regarded as having
some capacity to work and expected to seek suitable part-time work is promising, provided the
supports given to those people adequately match their support needs.2
Challenges and policy options for Australia
The current situation
The Australian economy has enjoyed high rates of economic growth for more than a
decade. During the past five years, the overall employment rate has increased by over
2 percentage points, the unemployment rate has dropped to 4.3% and the proportion of
long-term unemployment in total unemployment has also fallen, from one-quarter to
one-sixth. And yet, the living conditions of people with disability have not improved. Their
employment rate stands at around 40%, which is lower than five years ago and only half
the rate of their counterparts without disability. The income of people with disability has
fallen further behind and is now more than one-third lower than that of those without
disability, compared with 30% five years ago.
Low incomes are also partly a consequence of the low level of benefits in Australia,
which are non-contributory (tax-funded), flat-rate and household means-tested,
i.e. targeted at those most in need. This implies that certain groups of people with
disability, i.e. those living in middle- and higher-income households, are not entitled to a
disability benefit (and most other income support payments as well). Due to the fact that
publicly-funded activation measures have benefit recipients as their primary target group,
some of these people can only access a certain set of activation measures. Little is known
about the socio-economic pathways of these people, i.e. the extent to which the economic
burden of long-standing health problems and disability may push a number of former
middle-income people down the income ladder, eventually ending up on income support.
Despite these coverage issues, which are very special to Australia, at around 6% of the
working-age population the disability benefit recipiency rate is very similar to the OECD
average. This rate has doubled since around 1990, but growth in recipiency rates has
slowed down in the past three years and halted in the second half of 2005. During the past
decade, recipiency grew fastest for people aged 20-49.
Importantly, there is a very high inflow into disability benefit from a non-employment
status. More than every third new claimant transfers from unemployment benefit. Among
them, a large proportion experience multiple spells of income support prior to the
SICKNESS, DISABILITY AND WORK: BREAKING THE BARRIERS – VOL. 2 – ISBN 978-92-64-03815-8 – © OECD 2007 19
EXECUTIVE SUMMARY AND POLICY RECOMMENDATIONS
transition, and the average pre-transition unemployment duration is more than one year.
This is partly related to institutional problems, but also suggests that long-term
unemployment tends to be associated with a work-capacity loss. There is also a
considerable flow into disability benefit from other income-support payments, such as
parenting payment, or inactivity without income-support payment.
People with mental illness have been identified as a major group of people with
disability needing significant additional support in order to build their workforce capacity
and actively participate in employment and in the community. Nearly one in five, or more
than three million Australians are affected by a mental illness in any one year. It is estimated
that the annual cost of mental illness in Australia is approximately AUD 20 billion, which
includes the costs from loss of productivity and participation in the workforce.
Key policy recommendations
The rapid increase in the disability beneficiary rate over the 1990s, reinforced by the
economic downturn in the early 1990s, partly resulted from changes in the system itself,
including easier access to benefits for people with a mental health condition. However, this
trend increase in the number of people on disability benefit was also driven by reforms in
the unemployment benefit scheme that have led to stricter compliance rules and
participation requirements.
Likewise, the recent halt in recipiency growth rates can probably be seen as a first
effect of the recent Welfare to Work reform. The reform has three important features. First,
the assessment was changed to evaluating a person’s remaining work capacity rather than
disability. Secondly, the focus on individually-tailored activation and employment support
was extended. Thirdly, a new balance was put in place between responsibilities and
support, as people with a partially-reduced work capacity (who can work between 15 and
29 hours a week) are no longer entitled to disability benefit but only to unemployment
benefit, with much stricter compliance rules. In short, Australia is in the process of
transforming its hitherto passive disability benefit system into an active labour market
programme – even though, so far, only for new benefit claimants who are assessed to be
able to work 15 or more hours per week.
The timing for the ongoing Welfare to Work reform could not be better. Due to the record
low rate of unemployment, the Australian labour market is very tight at present. This is a
promising pre-condition for the implementation of the welfare reforms which have the
primary focus of increasing employment and reducing welfare dependence, as one of the
solutions to increase household incomes in general and of people with disability in
particular. There also appears to be very strong support for the government’s reform agenda
from most public and private stakeholders. However, certain areas are not yet given the
attention they deserve. Three problems, in particular, should be addressed in future reforms:
● The limited involvement of employers in the early phase of a health condition.
● Insufficient efforts to reach all people who could benefit from employment services.
● Poor encouragement to seek work for people on benefit, contributing to low incomes.
More can be done to improve the implementation of the Welfare to Work reform with
the aim of ensuring better outcomes. To bolster ongoing and future reforms, the Australian
government should consider the following policy recommendations, as summarised in
Box 0.2.
SICKNESS, DISABILITY AND WORK: BREAKING THE BARRIERS – VOL. 2 – ISBN 978-92-64-03815-8 – © OECD 200720

EXECUTIVE SUMMARY AND POLICY RECOMMENDATIONS
Box 0.2. Policy recommendations for Australia
Strengthen employer involvement in the early phase of a health condition
Current policy pays little attention to the issue of early identification of health problemsand the role of employers in this initial period, thereby missing an opportunity to interveneearly. Sickness absence is generally not regarded as a major issue, and any paid sick leaveprovided beyond the legislated minimum of ten days per year is a matter of negotiationbetween employers and employees. Employers therefore generally only make wagepayments for sick workers for a relatively short period and have no obligation to do anythingfor their employees beyond this period. Similarly, income maintenance insurance taken outby several employers merely functions as a means to compensate their costs. Recently, a freeone-stop-information website and hotline was put in place for employers (but also workers,co-workers and service providers) to improve employers’ access to available governmentsupports and subsidies. This is a first step which should be complemented by other changesso to promote better absence management, thereby preventing people from losing part oftheir work capacity. The following measures could be considered:
● Intensify employer responsibilities and supports. Employers should be responsible formonitoring their workers’ sickness absences lasting more than around one month aswell as repeated absences, and they should inform the authorities about dismissalsfollowing a prolonged sick leave. They should have access to occupational healthservices and advice to be able to identify adequate responses to arising health issues,including e.g. workplace accommodations and job adjustments. Employees and generalpractitioners should have access to the same type of confidential support.
● Match responsibilities with corresponding incentives. This obligation should be matched byfinancial incentives for employers to increase prevention and job-retention efforts.Other countries, including Luxembourg, are doing this by lengthening the period duringwhich employers have to continue wage payments for sick workers. Consider aminimum sick-leave coverage for casual workers as part of a prevention and earlyidentification strategy, recognising the higher wage (casual loading) these workerscurrently receive to compensate for their non-coverage of paid leave.
● Back up these changes from the medical and procedural side. As a rule, sickness certificatesshould be provided for no more than a few weeks. Moreover, there should be amandatory referral to a Job Capacity Assessment for all people on sick leave for three tosix months (not only those on Sickness Allowance). General practitioners and healthprofessionals should get training on how to manage returns to work.
● Improve the functioning of private income maintenance insurance. Make efforts to develop theprevention and retention focus of private income maintenance insurance and promoteexperience-rated employer premiums for these insurances. In a second step, increaseawareness of such reformed insurance and promote take-up.
Make sure everybody who could benefit from employment services can get them
Australia has taken important steps in terms of expanding its employment andvocational rehabilitation services and improving the quality of these services. Whatremains to be done is to ensure that services better reach those clients who are currentlyinactive. For instance, certain groups like people who are not entitled to income supportpayments are only entitled to a basic set of services or face considerable waiting lists.Furthermore, some of the inherited structures – such as the separation of employment andrehabilitation services – are creating unnecessary inefficiencies e.g. when a person whocompleted rehabilitation would need ongoing on-the-job employment support (even
SICKNESS, DISABILITY AND WORK: BREAKING THE BARRIERS – VOL. 2 – ISBN 978-92-64-03815-8 – © OECD 2007 21

EXECUTIVE SUMMARY AND POLICY RECOMMENDATIONS
Box 0.2. Policy recommendations for Australia (cont.)
though some interventions are already available through both service streams). Thefollowing measures could help improve employment outcomes:
● Increase resources for employment services. The fixed appropriation of services (so-calledcapping) should be abolished to avoid parking people on waiting lists for too long orreferring them to the wrong or second-best service. People with health problems shouldhave full and equal access to all publicly-funded employment supports according totheir needs and employment disadvantage, irrespective of their benefit status. Capacityconstraints seem particularly problematic for the very effective and low-cost PersonalSupport Programme. To prevent an explosion of ineffective interventions, means totarget services better might need to be developed.
● Change funding rules to avoid creaming. For employment services, a stronger focus shouldbe put on longer-term employment outcomes beyond the first 13 or 26 weeks, with somefocus on career paths. The focus on positive outcomes in funding of the PersonalSupport Programme should also be raised, with outcome measures in this caseincluding e.g. transfers to more employment-focused services, study or vocationaltraining but also agreed social outcomes. Similarly, the funding of disability assessmentservices should move away from the current output approach and seek ways to rewardthe quality of assessments and the adequacy of referrals.
● Further streamline service provision. The distinction between Disability Employmentservices and Vocational Rehabilitation services should be further reduced. Providers ofeither of the two services should get full access to all possible types of interventions toavoid suboptimal referrals.
Benefit reform to improve work incentives and increase incomes
Disability benefits are low in an international comparison because of the non-contributorynature of the social protection system. Nevertheless, despite a free earnings zone and a lowbenefit taper rate, few benefit recipients work. In addition, transferring from unemploymentbenefit to disability benefit is attractive, because the latter comes with all the advantages ofa pension – untaxed, higher free zone, lower taper rate, more generous indexation, highersupplements – that do not apply to allowances. The Welfare to Work reform addresses someof these issues but also creates new problems, because workers with partially-reduced workcapacity are now facing higher tax rates upon moving into work up to average earnings. Thissituation could be improved by the following changes:
● Improve work incentives for people with partial work capacity. Strong work incentives areparticularly important for those with a partially-reduced work capacity who are now treatedas unemployed and expected to seek part-time work. Should the ongoing evaluation of theeffects of Welfare to Work reform show that this group is not staying in or moving into workin sufficient numbers, applying the more generous free earnings zone and taper rates of adisability benefit for this group should be considered. In-work payments would further helpimprove work incentives and job-search efforts for people with partial work capacity.
● Harmonise unemployment and disability benefit. More generally, there is a case for a singleworking-age benefit (as was already recommended in the 2000 McClure Report on socialwelfare reform) to simplify the system and avoid undesirable incentives to move fromone benefit to another.
SICKNESS, DISABILITY AND WORK: BREAKING THE BARRIERS – VOL. 2 – ISBN 978-92-64-03815-8 – © OECD 200722

EXECUTIVE SUMMARY AND POLICY RECOMMENDATIONS
Challenges and policy options for Luxembourg
The current situation
At around USD 70 000, Luxembourg’s GDP per capita is considerably higher than for
most other OECD countries.3 This relative wealth, together with a substantial share of
cross-border workers, implies that the country can afford its relatively low overall
employment rate. This rate is almost 10 percentage points lower than in Australia and the
United Kingdom, owing to low employment of young workers, older workers and mothers.
Employment rates of people with disability in Luxembourg, however, are higher than in the
other three countries, and particularly relative to their peers without disability. In 2004,
every second person with a disability was employed.
The high rates of employment of people with disability, coupled with a generous
benefit system, imply that people with disability in Luxembourg have comparatively high
incomes and a lower level of relative income poverty (below 10% earn less than 50% of
median income). Another consequence of their relatively high employment is an unusually
low proportion of inactive people with permanent disability who indicate that they wish to
work: one in seven of those under age 35, and 2% of those over age 50. This is a major
challenge for a government planning to bring more people with disability into work.
The disability benefit recipiency rate in Luxembourg has been falling steadily
since 1997, when access to disability benefits became much more stringent. Since 2000,
the annual inflow into disability benefits is roughly constant at 4-5 per 1 000 of the
working-age population, which is half the level ten years ago and below the current OECD
average. On the other hand, at around 1.7% of GDP, disability benefit spending is still
relatively high, largely because of the extremely widespread use of disability benefits in the
Box 0.2. Policy recommendations for Australia (cont.)
● Increase incentives for disability benefit recipients to move off benefit. To the extent possible,the new Welfare to Work approach, i.e. part-time participation requirements inexchange for better employment support, should be applied to current disability benefitrecipients as well (in a first step only to younger recipients with shorter durations ofbenefit receipt). For current beneficiaries without participation requirements, workincentives could be increased by relaxing benefit suspension rules: the current two-yeartime limit could be extended, with the number of years for this limit being related to thelength of previous disability benefit receipt (for those with prior benefit receipt of, say,15 or more years, abolishing the time limit could be considered).
● Evaluate payments intended to compensate additional costs of disability. Sufficient extrapayments should be made to cover the extra costs of a disability. Like the existingMobility Allowance, these payments should not be means-tested and they might even behigher for those in work to the extent that they face higher costs of working. Evaluatethe impact of the array of existing payments of this kind to identify reform needs.Promote the take-up of existing cost-of-disability payments.
● Consider further steps to raise incomes of people with disability who cannot work. Higheremployment is the best strategy to raise incomes. People who are unable to work could behelped by better and consistently-regulated disability coverage in private superannuationschemes.
SICKNESS, DISABILITY AND WORK: BREAKING THE BARRIERS – VOL. 2 – ISBN 978-92-64-03815-8 – © OECD 2007 23

EXECUTIVE SUMMARY AND POLICY RECOMMENDATIONS
mid-1990s. Disability benefits are often used as an early retirement instrument; and as the
fall in the beneficiary rate affected younger workers more than older ones, the age
structure has become even more skewed towards the early retirement age.
Hand-in-hand with falling beneficiary numbers in the past decade went a rapid increase
in unemployment rates, from 2.4% in 2000 to 4.5% in 2005. There is a great risk that much of
this additional unemployment could become structural, with some groups of people with
disability permanently parked on long-term benefits which are topped-up to the level of
disability benefits. This is confirmed by disability-specific unemployment trends: while
unemployment for people without disability has only increased by 1 percentage point in the
past five years, the increase for people with disability was 5 percentage points. In turn, there
has been a rapid increase in the share of new disability benefit recipients coming from an
unemployment status – leading to new policy challenges.
Key policy recommendations
In recent years, policy has attempted to address the unsatisfactory situation of people
with a partially-reduced work capacity, for whom access to disability benefits was de facto
closed in 1997, in turn leading to a rapid increase in long-term sickness. The main change,
introduced in 2002, was a combination of stricter absence monitoring on the one hand and
new employment or redeployment-oriented procedures on the other, directed towards those
with remaining work capacity but unable to return to their jobs. So far, the new procedure
has predominantly produced a new category of “unemployed with disability”, with
unsatisfactory transition of these workers back into employment.
An important and still ongoing reform plan, likely to be implemented as of 2009, is the
statut unique, i.e. the abolition of the current difference between blue-collar and white-
collar worker status. Harmonisation of currently very different sick-leave regulations in the
course of this reform could contribute to disability prevention by increasing the financial
incentives for employers in the blue-collar sector to avoid or reduce sickness absence.
This alone, however, will not be sufficient to improve outcomes of the new
redeployment procedure. Every effort will have to be made to better understand the
obstacles for redeployment, be it a lack of interest on the part of employers, inadequate PES
intervention, lack of motivation of workers, or a combination of all three. To improve the
outcomes from redeployment of workers with partially-reduced work capacity, the
following three aspects will have to be tackled:
● Ineffective and poorly-enforced responsibilities and financial incentives for employers.
● Insufficient work incentives which contribute to the low work motivation of people with
disability.
● Too little rehabilitation and placement efforts by the Public Employment Service.
Measures in those areas could be helped by further improving the redeployment
procedure itself, including procedural and assessment issues but also aspects of
co-ordination across the main actors. In this respect, the government of Luxembourg
should consider the following policy recommendations, as summarised in Box 0.3.
SICKNESS, DISABILITY AND WORK: BREAKING THE BARRIERS – VOL. 2 – ISBN 978-92-64-03815-8 – © OECD 200724

EXECUTIVE SUMMARY AND POLICY RECOMMENDATIONS
Box 0.3. Policy recommendations for Luxembourg
Make responsibilities and incentives stronger for employers
Employers can easily circumvent the intentions of the new redeployment procedure.Incentives should, as much as possible, encourage employers to prevent health problemsand to retain workers with health problems. Early quantitative evidence shows that internalredeployment (i.e. job retention) has improved while external redeployment (i.e. integrationinto a new job) is rare. This suggests that every effort should be made to make internalredeployment possible. To this end, the following proposals should be considered:
● Raise financial incentives for employers to prevent sickness. In harmonising sick-payregulations, make sure that incentives are strengthened for the blue-collar sectorwithout weakening those for the white-collar sector. This should be done by matchingthe regulations for the former to those of the latter.
● Strengthen internal redeployment. To make internal redeployment more likely, 1) tighten rulesfor approved non-compliance and extend the redeployment obligation to workers ending atemporary disability benefit claim; 2) involve employers in the rehabilitation and retrainingof their sick or disabled employees; and 3) speed up the process to avoid unnecessary loss ofskills, work motivation and, in particular, jobs before the procedure starts.
● Disassociate internal redeployment from the employment quota. An employer who fulfils thequota for hiring workers with disability is not obliged to redeploy another sick ordisabled worker. This link should be cut to make sure that every worker can benefit frominternal redeployment responsibilities and supports.
Strengthen responsibilities and incentives for workers
Similarly, workers should have strong incentives to remain in work or return to the labourmarket, to help improve the outcomes of internal and external redeployment. This iscurrently not the case because sickness and disability benefits are comparatively high. Thesame applies to unemployed people waiting to be redeployed who are entitled to a waitingallowance (i.e. a long-term benefit which is paid at the higher level of a disability benefit). Onthe other hand, workers (and their employers) may be inclined to seek partial wagecompensation through internal redeployment albeit having full or fully-recovered workcapacity. The following proposals should be considered to support the new procedure:
● Improve work incentives for people with disability not in work. High disability benefits help toreduce poverty rates but pose obstacles in bringing people with disability back to work.Making work pay in all circumstances will require lowering the level of out-of-workbenefits in exchange for introducing permanent in-work payments to stimulate thereturn to work.
● Strengthen job-search requirements. Strict job-search requirements and compliance rulesshould be introduced for unemployed people with partially-reduced work capacity whoreceive a waiting allowance. Otherwise, this new allowance could easily turn into justanother type of long-term disability benefit.
● Re-evaluate work capacity of people who are internally redeployed with a wage compensation.Introduce an automatic and repeated re-evaluation of the situation of an internallyredeployed person, e.g. once a year, and reduce subsidies when work capacity hasimproved. This is important to avoid that employers and employees use the newprocedure to permanently and unfoundedly save parts of the wage costs. This alsorequires that the post-redeployment job conditions are being controlled.
SICKNESS, DISABILITY AND WORK: BREAKING THE BARRIERS – VOL. 2 – ISBN 978-92-64-03815-8 – © OECD 2007 25

EXECUTIVE SUMMARY AND POLICY RECOMMENDATIONS
Challenges and policy options for Spain
The current situation
The situation in Spain is in many ways different from that in the other three countries.
Most importantly, Spain has never suffered from a particularly widespread use of the
disability benefit scheme. Inflows into this system have been stable in the past 15 years
Box 0.3. Policy recommendations for Luxembourg (cont.)
Improve rehabilitation and placement efforts
The redeployment procedure involves a large number of independent actors at differentstages. It is unclear to what extent the complexity of the procedure itself and itsinflexibility contributes to the current mediocre outcomes. The Public Employment Service(PES) bears the main responsibility for the new procedure as well as for activation supportin the form of e.g. employment subsidies and vocational rehabilitation. The availability ofthe latter is rather limited and many people have to go abroad (usually to Germany) foradequate service. Moreover, rehabilitation is still primarily medically-oriented. Given thepoor outcomes of the external redeployment process, the efficiency of the process willhave to be increased and PES intervention strengthened in various ways, including by thefollowing measures:
● Research the reasons for the failure of the redeployment process. External redeployment hasnot delivered the desired employment outcome, implying that further changes areneeded. To be sure to make the right changes, it is of utmost importance to fullyunderstand what has happened and which elements of the process have failed. Thisrequires concerted efforts to evaluate the situation of the past five years.
● Put more emphasis on vocational rehabilitation and training. Increase the focus on work-related rehabilitation and training, by fostering the work-related activities offered by theonly rehabilitation centre. The impact of vocational training would be raised byintroducing a system of recognition of such training, which is currently not the case.
● Develop a rigorous evaluation strategy. The PES needs to evaluate its labour marketprogrammes to better understand what works, and for whom. For instance, while thePES believes that wage subsidies are a very effective tool, employer organisations arguethat these subsidies will not create any jobs. Only sound scientific evidence on theimpact of different programmes can ensure effective and efficient use of availableresources.
● Increase the flexibility of the system. An internally redeployed worker who is fired after thefirst year should also become eligible for external redeployment or, at a minimum, haveaccess to the same activation support. Enable repeated reassessments of the integrationpotential beyond the current 10-week cut-off point, to account for the volatility andinstability over time of various health problems, especially mental health conditions.Facilitate earlier intervention to avoid an unnecessary loss of motivation and the decayof qualification; e.g. introduce the possibility to assess a worker’s potential before a long-term sickness absence phase.
● Strengthen the work capacity focus of the procedure. The entire assessment of disability isheavily medically-oriented. There is a need to involve vocational experts earlier in thedecision-making process, not only if and after the independent medical assessorsdecide to initiate the redeployment procedure.
SICKNESS, DISABILITY AND WORK: BREAKING THE BARRIERS – VOL. 2 – ISBN 978-92-64-03815-8 – © OECD 200726

EXECUTIVE SUMMARY AND POLICY RECOMMENDATIONS
and so has the recipiency rate which stood at 3.5% of the working-age population in 2005
– significantly below the OECD average of around 6%. Moreover, very few people claim
disability benefits for mental health reasons. Like in Luxembourg, however, disability
benefits tend to be used as an early retirement pathway, especially by men of whom almost
one-third in the age group 55-59 receive such benefit.
Importantly, contrary to what has happened in many other OECD countries some
ten years ago, even the sharp drop in the overall unemployment rate in the past decade,
from almost 20% in the mid-1990s to 9.2% in 2005, has not translated into an increase in the
disability benefit recipiency rate – even though a disability benefit for people with no
remaining work capacity is more generous than other social benefits for the working-age
population. Part of the explanation is that the fall in unemployment has only affected
people without disability, while the unemployment rate of people with disability remained
unchanged at over 15% and even increased recently.
The high rate of unemployment among people with disability in Spain, which is in part
a result of the larger share of older workers in this sub-population, went for a long time
hand-in-hand with extremely low rates of employment, of less than 30%, for this group, and
as low as 15% for those people with disability with a mental health problem. Reasons for this
are a low work motivation partly caused by the high incidence of temporary contracts; a
widespread stigma concerning the work ability of people with disability; and the
ineffectiveness of employment regulations and supports. Only since very recently has the
overall employment growth, which is driven by a steady rate of economic growth of over 3%
annually, started to affect the employment of people with disability as well. In turn, incomes
of people with disability have increased and poverty rates fallen. Nonetheless, at
around 35%, their employment rate is still below the OECD average.
Key policy recommendations
Because of stringent disability assessment and improved sickness absence monitoring
by the social security authority, Spain has been successful in keeping long-term dependency
on health-related benefits at a low level. Employment measures, on the other hand, had
much less success so far, although integration of workers with disability in the open labour
market has been a policy target for the past 25 years. Many regulations and obligations for
workers and employers exist, but these are not enforced, and take-up of available
instruments is low. Moreover, collective agreements which have a strong binding character
for Spanish employers make little reference to disability issues. With the decentralisation of
labour market institutions in the course of the devolution of powers to the autonomous
communities, new opportunities have arisen. An increasing problem is that very little is
known about the extent to which state laws are followed on a regional and local level.
The key issue for Spain for the coming years is to reduce unemployment and increase
employment of people with disability. Given the strong economy, which was able to create
some 700 000 additional jobs annually in the past five years, some of which for people with
disability, the timing for further reform is good. The recently strengthened focus of the
European Union on raising employment in general, and that of older workers and people
with disability in particular, has helped in increasing the funds available for employment
support. This in turn has helped Spain to establish a policy framework based on
non-discrimination, participation and universal accessibility.
SICKNESS, DISABILITY AND WORK: BREAKING THE BARRIERS – VOL. 2 – ISBN 978-92-64-03815-8 – © OECD 2007 27

EXECUTIVE SUMMARY AND POLICY RECOMMENDATIONS
In 2006, a new Agreement on Social Security Measures was signed between the
government and the social partners, which aims to make the social protection system
more viable while at the same time favouring employment and competitiveness. With
respect to disability, the agreement aims to discourage fraudulent use of disability benefits.
To reduce unemployment and increase employment of people with disability, the
government has recently introduced further improved incentives for enterprises to hire
workers with disability, new programmes to support workers in the open labour market,
and more supports for self-employment. Special attention is given to women with
disability to address the double discrimination they are often facing. To harvest the fruits
of this new approach, four issues in particular will have to be addressed in the future:
● The little attention given by the Public Employment Service to people with health
problems.
● Limited monitoring and evaluation efforts of policies delivered by regional governments.
● Insufficient incentives for employers to hire workers with disability.
● Obsolete features of the benefit system posing an obstacle to the new active approach.
Measures in these areas would be greatly helped by further developing the evidence
base to facilitate policy making. Along these lines, the following policy recommendations
should be considered by the Spanish government, as summarised in Box 0.4.
Box 0.4. Policy recommendations for Spain
Boost the quality of employment support for people with disability
The regional headquarters of the Public Employment Service (PES) are, since a few years,the main players in disability employment policy design and implementation. Many ofthem have developed programmes with training and work experience elements. Yet,take-up of these programmes by people with disability is low and, because of themainstreaming approach, largely unknown. Another aspect is the complexity of theinstitutional structure and challenges arising from the need of co-operation between anumber of entities: the decentralised PES (responsible for employment matters), thecentralised Institute of Social Security, INSS (responsible for benefit matters and controls),the Mutual Benefit Societies (responsible for work injury matters but also general sicknessmatters for more than 50% of the workforce) and the decentralised National HealthSystem, NHS (responsible for diagnosis and treatment of illness but also for medicalrehabilitation for those workers not covered by a Mutual Benefit Society). The followingstructural and procedural changes could help improve this situation:
● Target support to jobseekers with disability. Reconsider the current strong focus onmainstreaming, which has not sufficiently helped people with disability into work, andincrease targeting in offering PES programme places. Make sure that all groups of peoplewith disability – those with a legal disability certificate, those on disability benefit andthose with neither a certificate nor a benefit – receive the support they need.
● Refocus PES spending. Reduce subsidies for sheltered work and use this money for anupgrading of skills and the employability of people with disability. Put a stronger focuson vocational rehabilitation and training to prevent health problems or disability. Makespecial efforts to find work in new occupations for people with partially-reduced workcapacity (i.e. people with incapacity for their usual occupation). Where needed, increasethe available funding while keeping an eye on the cost-efficiency of supports.
SICKNESS, DISABILITY AND WORK: BREAKING THE BARRIERS – VOL. 2 – ISBN 978-92-64-03815-8 – © OECD 200728

EXECUTIVE SUMMARY AND POLICY RECOMMENDATIONS
Box 0.4. Policy recommendations for Spain (cont.)
● Improve the co-operation between institutions responsible for employment, vocational rehabilitationand training, and benefit matters. The current fragmentation of the institutional frameworkin relation to the management of benefit matters on the one hand and employment andvocational rehabilitation and training on the other, partly across different governmentlevels, is likely to hinder optimal employment outcomes. Strengthening the collaborationbetween the key institutions responsible for these fields of policy would be a majorbuilding block in improving the situation. Bilateral and multilateral agreements (like thosebetween INSS and NHS on controlling sickness absence) would be a promising steptowards a more integrated approach with better-coordinated interventions by all actors.In the longer term, further streamlining of responsibilities should be considered.
Increase monitoring and evaluation of regional government policies
With the devolution of significant powers to regional labour market institutions, a numberof new policy issues have arisen. There is a need for better governance of institutionsoperating at different government levels, and for better data and information collection atthe regional level for evidence-based policy making. The following adjustments should beconsidered to make the system more effective and efficient:
● Improve the governance of the PES. Introduce target agreements with regional PES officesconcerning the outcomes for jobseekers with disability (including, for instance, targetson placements into stable jobs). Individual action plans for jobseekers with disabilityshould be made in an earlier stage, not only after 12 months of unemployment as iscommon for the “standard” unemployed.
● Generate additional evidence. Systematic monitoring should be introduced for institutionsresponsible for policy implementation. For this, the national government will needsystematic evidence from the autonomous regions on both policy implementation andpolicy effectiveness. Regional PES headquarters, in particular, should be obliged toproduce regular evidence, including programme evaluations and, if possible, cost-benefit analyses. Good practices should be shared between the regional PES offices.
● Make better use of available evidence. The IMSERSO database on people with a legal disabilitycertificate, though not originally designed for this purpose, should be developed into adynamic evidence base by systematically collecting employment and benefit status aswell as disability status dynamics. Alternatively, the IMSERSO database should be betterlinked with information collected by other administrations and institutions.
Improve financial incentives and enforce responsibilities for employers
The Spanish labour law contains a series of obligations for employers, including therequirement for large companies to employ 2% of people with disability. In reality, however,regulations have little impact because they are not enforced stringently enough. Added to thisis the unawareness of most employers about existing subsidies and programmes to retain orhire workers with disability. Moreover, current regulations provide meagre incentives foremployers to improve working conditions so as to keep absence low. The following changescould contribute to a better involvement of employers in the policy process:
● Help employers to obtain support. Awareness campaigns on available workplace adaptationsubsidies and hiring supports should be launched, with the involvement of the socialpartners, to ensure that employers know what they could do. Strengthening the positionof disability policy in collective agreements by writing existing rules into sector-wideand individual agreements would raise the not sufficiently binding character ofemployer actions.
SICKNESS, DISABILITY AND WORK: BREAKING THE BARRIERS – VOL. 2 – ISBN 978-92-64-03815-8 – © OECD 2007 29

EXECUTIVE SUMMARY AND POLICY RECOMMENDATIONS
Challenges and policy options for the United Kingdom
The current situation
The United Kingdom offers perhaps the best illustration of an OECD-wide trend,
starting in the 1980s: falling unemployment and increasing use of disability benefits. With
Box 0.4. Policy recommendations for Spain (cont.)
● Enforce employer responsibilities. Employer responsibilities need to be controlled andsanctions should be used in cases of non-compliance. In this context, more responsibilityshould be given to the Labour Inspectorate which is better placed than the regionalauthority to take a neutral decision. It may also be necessary to turn the appeals processaround, i.e. to let employers appeal only if and after they have paid the established fine.
● Strengthen financial incentives for employers. Stronger elements of employer co-paymentsshould be considered to increase the economic rational of prevention and job-retentionactivities (Luxembourg’s effort to lengthen the employer’s wage-payment period for sickworkers is one example of this type of reform). Such change is supported by a recentlabour tribunal ruling in Spain, which concluded that employers should share the costsof (temporary) work incapacity.
Modernise the disability benefit system
Stringent disability assessment has kept disability benefit inflows under control, andrecently strengthened sickness monitoring has helped to halt the increase in long-termabsence. However, some elements of the disability benefit system need to be adjusted totoday’s medical, economic and labour market realities. In particular, benefits tend to begranted permanently, and 53% of all beneficiaries receive a benefit for being unable tocontinue in their own job, albeit being able to work in another occupation. The followingmeasures should be considered:
● Review the adequacy of the disability definition. The current granting of incapacity benefitson the grounds of incapacity for the usual occupation is outdated for an increasinglymobile labour market with an increasingly better and more-continuously trainedworkforce. Inspired by reforms such as those undertaken in Luxembourg, for example,workers with a disability unable to carry on their current job could be classified andtreated as unemployed, expected to accept work in another occupation that is feasibleon health grounds, and be offered (if necessary, permanent) in-work top-up payments toavoid sharp post-disability income losses.
● Reassess entitlements at regular intervals. Currently, disability benefits are de factopermanent two years after the benefit was granted. This practice does not take intoaccount that some people’s health situation might improve and, even more importantly,that the impact on work capacity might change (also e.g. due to the availability of newtechnologies). In many OECD countries, regular and repeated reassessment has becomecommon for the majority of disability benefit recipients.
● Improve work incentives for older workers with partial incapacity. The 20% supplement to thecurrent “partial” disability benefit (i.e. incapacity for the usual occupation) for peopleaged 55 and over who are not working is a strong incentive not to seek work.Significantly improved employment support for this group of people (see correspondingrecommendations above) would be a better alternative to improve those people’s socialand economic integration.
SICKNESS, DISABILITY AND WORK: BREAKING THE BARRIERS – VOL. 2 – ISBN 978-92-64-03815-8 – © OECD 200730
EXECUTIVE SUMMARY AND POLICY RECOMMENDATIONS
a strong economy and increasingly tighter compliance rules in the unemployment benefit
scheme, the United Kingdom’s unemployment rate has fallen from above 10% in 1993 to
around 5% today, while disability benefit receipt doubled to around 8% of the working-age
population. In the past few years, however, both rates have stabilised and, in 2005, the
overall disability benefit recipiency rate fell for the first time since more than thirty years.
The structure of the disability benefit population has changed substantially during the
past decade. More often than 10-15 years ago, the average recipient today is a young
person, a woman, a recipient of a non-contributory benefit with a limited work history,
and, most importantly, a person with a mental or behavioural health condition. The latter
already make up for 40% of the beneficiary population, and their share continues to
increase.
Mental health problems are an obstacle to employment: less than 20% of people with
mental conditions are employed, which is less than half of the rate of people with
muscular-skeletal conditions, for example. The overall employment rate of people with
disability in the United Kingdom is now slightly above the OECD average, both in absolute
terms (at 45%) and relative to people without disability. Moreover, employment rates of
people with disability have increased by 7 percentage points in the past eight years,
suggesting that disability discrimination legislation might have helped harvesting the
opportunities of a strong labour market. The rate of unemployment is still higher for
people with disability than for their peers without disability, but it has fallen even faster for
people with disability.
Despite these encouraging employment and unemployment trends, incomes of
people with disability are more than a quarter below those of people without disability.
This partly reflects the low level of flat-rate public disability benefits, which often only lift
incomes very slightly above the poverty line, especially for single people. On top of this,
only one-fifth of the workforce has private disability insurance to top-up public claims.
Key policy recommendations
The long-run shift from unemployment to disability is at the heart of recent and
ongoing reform, which aims to establish a new balance of rights and responsibilities for
incapacity benefit recipients. The Pathways to Work process that is currently being rolled
out nationwide requires new benefit claimants to go through a series of mandatory work-
focused interviews with their personal adviser. Any action proposed in response to these
interviews is still non-compulsory, but there are ongoing attempts to develop mandatory
activities further to bring new claimants closer to the labour market.
These changes are complementing prior reforms in the past few years, which
consisted of two main elements: first, a merger of the Benefits Agency and the
Employment Service, which has created a single point of delivery for job-search support
and benefits advice; and secondly, a new focus on individualised service delivery steered by
personal advisers in this new agency and provided more profoundly by Job Brokers.
Forthcoming benefit reform aims to add to these changes by improving work
incentives for recipients of incapacity-related benefits. Financial incentives were shown to
be insufficient in so far as of those leaving incapacity benefits for work of 16 hours per
week, at the minimum wage, only one-third gain financially unless they claim the
disability element of the Working Tax Credit. However, take-up of this credit is known to be
SICKNESS, DISABILITY AND WORK: BREAKING THE BARRIERS – VOL. 2 – ISBN 978-92-64-03815-8 – © OECD 2007 31

EXECUTIVE SUMMARY AND POLICY RECOMMENDATIONS
low and even among those claiming the credit almost one in five would not gain
financially. The additional temporary Return-to-work Credit, which is part of the Pathways
to Work programme, will improve the situation, albeit only for the first year. Through
benefit reform a new allowance will be introduced which will replace the currently existing
incapacity benefit and will, among other things, have a top-up for those fulfilling their
activity requirements.
In the course of this forthcoming reform, disability assessment will also be
transformed to take better account of both mental health problems and the actual range of
jobs a person could possibly engage in. Nevertheless, in view of the government’s objective
to reduce the incapacity benefit caseload by one million people by 2010, recent and
ongoing reforms are likely to be insufficient. Further change should address four areas in
particular:
● The neglect of the sickness phase that results in late identification of the need for help.
● The high inflow into disability benefits from unemployment and inactivity.
● The low number of people with disability, especially those with mental health problems,
who are effectively (re)integrated into the labour market.
● Insufficient incentives to seek work for people on disability-related benefits.
Measures in these areas should be complemented by effective benefit reform to
address work incentives of (potential) beneficiaries and the low incomes of people with
disability. Further steps are also needed to ensure that the intentions of recent and ongoing
reform are achieved more effectively. To this effect, the United Kingdom’s government
should consider the following policy recommendations, as summarised in Box 0.5.
Box 0.5. Policy recommendations for the United Kingdom
Accelerate the identification of health problems
Since the privatisation of sickness benefits, which are under the responsibility of theemployer for a period of 28 weeks, little is known by the public authorities about what ishappening in the early stages of sickness. Added to this, after exhaustion of sick pay,workers unable to return to their job are automatically transferred to a disability benefit (ifthey fulfil the contribution requirements); the disability assessment to determinecontinued eligibility for such benefit is only initiated a few months later. Social insurance,albeit taking over the costs of sickness and disability after the first 28 weeks, is notinvolved in controls or supports during the employer-paid absence period. This situation,which leads to a high number of new disability benefit claims, could be improved throughthe following measures:
● Intensify employer responsibilities and supports. Employers should be obliged to monitorsickness absences lasting more than around one month as well as repeated absences andto inform Jobcentre Plus about such cases. Failure to do so should have a direct impact onthe costs the employer has to carry. Employers should have access to occupational healthservices and advice to be able to identify adequate responses to the arising health issues,including e.g. workplace accommodations and job adjustments. Employees and generalpractitioners should have access to the same type of confidential support.
SICKNESS, DISABILITY AND WORK: BREAKING THE BARRIERS – VOL. 2 – ISBN 978-92-64-03815-8 – © OECD 200732

EXECUTIVE SUMMARY AND POLICY RECOMMENDATIONS
Box 0.5. Policy recommendations for the United Kingdom (cont.)
● Strengthen early medical controls. Medical control of a worker’s health status should comeearlier and be more frequent. Independent second opinions by specialists,e.g. psychiatrists, and medical controls of the decision of the general practitioner bypublic authorities (initiated by Jobcentre Plus) are needed during the employer-paidsickness phase to avoid delayed identification of longer-term health problems.Technically this would become possible through the above-mentioned obligation ofemployers to monitor longer-term and repeated absences. General practitioners andhealth professionals should also get training on how to manage returns to work.
● Advance eligibility assessment for a disability benefit. The comprehensive PersonalCapability Assessment should come before granting a disability benefit, thereby avoidingthe quasi-automatic transfer from sickness to disability, and it should be a requirementfor most claimants. Replace the functionality test by a work-capacity test and checkwhat activities a person can do. Involve more mental health experts, or expertise, in theassessment procedure.
Address the circumstances of unemployed and inactive people
Many new disability benefit claimants have lost their job prior to claiming the benefit:one in four new claimants receives unemployment benefit at the time of the claim, andone in eight receives income support. Similarly, a considerable share of those leavingdisability benefits, voluntarily or not, moves onto unemployment benefit. This suggeststhat they have continued problems in accessing the labour market. To address this groupof people and the issue of carouselling between unemployment and disability benefits, thefollowing measures could be considered:
● Improve absence monitoring of the non-employed. Put more emphasis on sickness prevention,health status monitoring and health management for people on unemployment andlone-parent benefits. Most importantly, try to identify people who would need moresupport early on to be able to return to employment. Following the example of Australia,the unemployed who are sick should go through a mandatory capacity assessment.
● Address the group of people moving between unemployment and disability. Disability benefitrecipients losing their entitlement but not moving into work are at high risk of long-termbenefit dependence. These people should be followed-up systematically and offered thesupport needed to return to employment.
Raise the number of people helped by work integration programmes
The work integration approach has changed markedly over the past decade, as can beseen from the changes in the organisation of services as well as the introduction of new,hitherto unknown programmes. A new element in disability employment policy is theshift towards outcome-based funding of services. Added to this are the new complianceresponsibilities for new claimants of a disability benefit. A key weakness of these changesis that they have not sufficiently helped people with mental health problems. All of theseareas could be developed further to ensure better outcomes and more efficient use ofresources. The following adaptations could be considered:
● Foster employment service delivery. Introduce special targets related to people with healthissues in monitoring regional Jobcentre Plus offices to ensure that jobseekers withdisability qualified for a vacancy are identified and placed into jobs rapidly. Develop moreextensive retraining opportunities in addition to the currently existing fast-placementapproach. Make additional efforts to help jobseekers with mental health problems.
SICKNESS, DISABILITY AND WORK: BREAKING THE BARRIERS – VOL. 2 – ISBN 978-92-64-03815-8 – © OECD 2007 33

EXECUTIVE SUMMARY AND POLICY RECOMMENDATIONS
Box 0.5. Policy recommendations for the United Kingdom (cont.)
● Underpin the new conditionality approach. Strengthen participation requirements beyondthe current mandatory interviews. For instance, make actions identified during theseinterviews increasingly compulsory. Consider introducing similar requirements forcurrent recipients as well.
● Further improve the condition management programmes (CMP). Ensure integration of theseprogrammes, which aim to help people deal with their health conditions, with employmentservices and help improve the co-operation of CMP health professionals with the clients’general practitioners. Develop CMP services targeted to people with mental healthconditions. Change the current bulk-funding of CMP into a more outcome-driven system.
● Strengthen the focus on sustainable employment outcomes. Further refine funding rates by:1) reducing the payment rate for very short hours work (permitted work); 2) changingthe definition of sustained employment from 13 to at least 26 weeks and adding acomponent for long-term sustained employment; and 3) including a reward forcontinued provision of in-work support leading to higher earnings (career component).
● Ensure that more disadvantaged people have access to services. Differentiate funding rates bythe degree of work limitation to ensure that more disadvantaged people, especiallythose with mental health conditions who face stronger labour market barriers, alsoreceive appropriate services. A target accelerator, i.e. funding increasing with thenumber of successful placements, could improve outcomes: providers would have anincentive to invest more to get more “difficult” clients into work rather than screeningthem out too early.
Benefit reform to improve work incentives and increase incomes
Poor work incentives for people with disability are mirrored by the high share ofbeneficiaries who would not improve their incomes by moving into work at 16 hours aweek. This is related to the low take-up of in-work benefits, especially the disabilityelement of the permanent Working Tax Credit, as well as the short earnings range at whichpeople would benefit from in-work payments. Forthcoming benefit reform aims to correctthis situation partly. The following issues will be important:
● Increase incentives for beneficiaries to seek work. Replace the 16 hours cut-off point forpermitted work by a smoothly phased-out permitted earnings criterion. Reduce the riskof benefit entitlement loss for long-term beneficiaries seeking work voluntarily bybroadening the benefit suspension (i.e. linking) rules for those with stable conditionsand on disability benefits for at least three years; changes could include 1) moresystematic promotion of the suspension rules, 2) automatic re-establishment of benefitpayments when people stop working within a certain number of years, with the numberof years depending on the previous length of disability benefit receipt, and 3) design of asimilar rule for Housing Benefit as well.
● Raise the impact of in-work payments. Raise the take-up of the Working Tax Credit byinforming clients about the impact on their future earnings as systematically and earlyas possible. Consider extending the income range at which this permanent in-workbenefit is paid.
● Improve incomes of people with disability. Reconsider the level of existing cost-of-disabilitybenefits, such as the Disability Living Allowance, to ensure that these benefits cover theactual additional costs of a person with a disability. Better private disability insurancecoverage, ideally with case-managed insurance contracts, would contribute to higherincomes of people no longer able to work.
SICKNESS, DISABILITY AND WORK: BREAKING THE BARRIERS – VOL. 2 – ISBN 978-92-64-03815-8 – © OECD 200734
EXECUTIVE SUMMARY AND POLICY RECOMMENDATIONS
Notes
1. Similar benefit substitution effects might be found between disability and early retirementschemes. There is less evidence on this hypothesis from the four countries, be it because they donot have any early retirement scheme (United Kingdom) or because they have not changed theirschemes (Spain, Luxembourg). However, in Australia the phasing-out of special options throughthe unemployment benefit scheme and the gradual increase in the old-age pension age forwomen, from 60 to 65 years, has led to a significant increase in the inflow of women aged 60-64into the disability benefit scheme. OECD (2006b) suggested that such substitution also took placein Norway and Poland.
2. The lack of participation requirements until 2006 probably explains the disappointing impact ofthe relatively strong work incentives for beneficiaries that have existed in Australia for some time.
3. GDP per capita is a slightly misleading statistic in the case of Luxembourg, because of largeamounts of foreign investment and output of non-resident cross-border workers. However, whenadjusting for foreign factor income Luxembourg remains the richest country of the OECD.
SICKNESS, DISABILITY AND WORK: BREAKING THE BARRIERS – VOL. 2 – ISBN 978-92-64-03815-8 – © OECD 2007 35


ISBN 978-92-64-03815-8
Sickness, Disability and Work
Breaking the Barriers – Vol. 2
© OECD 2007
Chapter 1
Key Trends and Outcomes
What are the main sickness and disability policy challenges thatAustralia, Luxembourg, Spain and the United Kingdom will need toaddress in the future? This chapter highlights the key outcomes andtrends in these countries during the past 10-15 years in four areas: labourmarket integration of workers with disability and reduced work capacity;financial resources of those people; costs of sickness and disability benefitschemes; and exclusion and inclusion errors of benefit schemes. Inaddition, it addresses two macroeconomic challenges: population ageingand future labour supply shortages, and the impact of changing labourmarket requirements on workers’ health. These challenges need to betaken into account if sickness and disability policy systems are to bereformed successfully.
37

1. KEY TRENDS AND OUTCOMES
This first chapter provides a summary of the most important sickness and disability
trends in Australia, Luxembourg, Spain and the United Kingdom during the past
10-15 years.1 Outcomes in the following six areas are discussed:
● Labour market integration of people with disability: employment and unemployment.
● Financial resources of people with disability: income and poverty.
● Costs of disability benefit schemes: public spending and benefit dependence.
● Exclusion and inclusion errors: disability benefit recipiency and disability prevalence.
● Demographic challenges: population ageing and future labour supply shortages.
● Impact of labour market requirements: work and health.
These key trends indicate where structural reforms in the sickness and disability area
will be most needed. It will be seen that the challenges arising from these trends are not
the same in the four countries. However, in addressing these challenges, reforms in all
countries will need to be designed so as to improve outcomes in a given area
(e.g. increasing outflows from disability benefits) without worsening other areas
(e.g. increasing financial insecurity, or increasing flows into alternative exit routes such as
early retirement).
1.1. Employment and unemployment of people with disability
A. Macroeconomic environment and labour market trends
The four countries reviewed share a number of common “starting points” and features
but diverge in others (Table 1.1). The share of persons among the working-age population
describing themselves as having a disability is around 10-12% in Australia, Luxembourg
and Spain but 18% in the United Kingdom.2 A considerable number is also drawing
disability benefits, namely 3% of the working-age population in Spain, 4-5% in Australia
and Luxembourg and 8% in the United Kingdom, compared to an OECD average of around
6% (OECD, 2003).
All four countries are undertaking major disability policy reforms against the
background of a favourable economic situation at the beginning of the 2000s. During the
past five years, real GDP grew continuously, employment rates increased and
unemployment decreased, except in Luxembourg where unemployment remained,
however, still at the lowest level across the four countries.
At slightly over 3%, annual growth of real GDP in Australia, Luxembourg and Spain was
significantly higher than the OECD average (2.5%). Growth in the United Kingdom was
about average – mainly due to a slow-down in 2005 and, to a lesser degree, in 2002. That
said, growth is projected to remain strong in all four countries over the next two years:
2.5-3% in the United Kingdom, above 3% in Australia and Spain, and around 5% in
Luxembourg (OECD, 2007a).
SICKNESS, DISABILITY AND WORK: BREAKING THE BARRIERS – VOL. 2 – ISBN 978-92-64-03815-8 – © OECD 200738

1. KEY TRENDS AND OUTCOMES
Employment rates increased in all four countries in the past five years but particularly
in Spain, namely by 7 percentage points. The increase was less marked in the other three
countries (between half and 2½ percentage points). The levels of the overall employment
rate are close to the OECD average (65%) in the two continental European countries and
significantly higher in the two English-speaking countries (72%).
Unemployment rates of 4-5% are below the OECD average in Australia, Luxembourg
and the United Kingdom. In Spain, unemployment has declined by one-third since 2000,
but still concerns almost 9% of the labour force. About one unemployed out of five are long-
term unemployed in Australia and the United Kingdom, one out of four in Luxembourg,
and one out of three in Spain. In all countries except Luxembourg, this share decreased
during the past five years.
Most recent OECD projections for the years up to 2008 expect the labour force
participation rate to grow further in Luxembourg, Spain and the United Kingdom (by
1½-3 percentage points) and to remain stable at a high level in Australia, while the OECD
average is projected to fall slightly (OECD, 2006a). Overall, the macro-economic frame and
the labour market situation in the first decade of the 2000s are encouraging in all four
countries, setting a good basis for further reforms.
B. Employment among people with disability
General labour market and macro-economic performances are likely to have “spill-over”
effects on the employment integration of people with disability. It can be expected that, in
a situation of rapid growth, high overall employment and low unemployment, persons
with reduced work capacities will have greater opportunities to find a job.
Table 1.1. Favourable economic and labour market trends in the past five yearsGDP and labour market indicators, 2000-2005
Australia Luxembourg Spain United Kingdoma OECD averageb
Population (in thousands)
Working-age population 2005 12 075 344 29 308 32 435
Disabled persons (self-assessed), circa 2005 1 488 34 3 119 6 018
Disability benefit recipients, 2005 683 17 1 011 2 615
Macroeconomic indicators
GDP per capita 2005 in USD PPPs 34 240 70 245 27 400 32 860 30 062
Annual GDP growth 2000-2005 (%) 3.2 3.1 3.2 2.4 2.5
Labour market indicators (age 15-64)
Employment ratio
2000 69.3 62.7 57.4 72.2 65.7
2005 71.6 63.6 64.3 72.6 65.5
Unemployment rate
2000 6.4 2.4 13.9 5.5 6.2
2005 5.2 4.5 9.2 4.6 6.8
Long-term unemploymentc
2000 25.5 22.4 47.6 27.9 30.6
2005 17.7 26.3 32.5 22.2 31.6
a) The number of disability benefit recipients and of self-assessed disabled persons refers to Great Britain, while theremaining figures are for the United Kingdom.
b) Unweighted average.c) Long-term unemployment is the percentage of the total unemployed who have been out of work continuously for
more than a year.Source: Figure 1.8; Table 1.9; OECD.Stat reference series; and OECD database on Labour Force Statistics.
SICKNESS, DISABILITY AND WORK: BREAKING THE BARRIERS – VOL. 2 – ISBN 978-92-64-03815-8 – © OECD 2007 39

1. KEY TRENDS AND OUTCOMES
Against the backdrop of the favourable macro-economic indicators in the four
countries highlighted above, employment outcomes for people with disability are
somewhat disappointing. Nonetheless, the most recent trends are more promising, except
in Australia. People with disability have consistently lower employment rates than their
peers without disability, especially in Spain where only one-third of them have a job. For
comparison, 40% of people with disability have a job in Australia, 45% in the United
Kingdom and 50% in Luxembourg (Figure 1.1).3 This compares to employment rates of
about 45% in Norway, 52% in Switzerland and less than 20% in Poland, for the three
countries reviewed in OECD (2006b). In relative terms – employment rates of people with
over those without disability – the ratio is about 0.5-0.6 in Australia, Spain and the United
Kingdom, but 0.7 in Luxembourg.
Employment rates tend to fall with severity of disability – though less so in
Luxembourg. In Australia and Spain, about 42% to 46% of people with moderate disability
have a job but only about 25% to 28% of those with severe disability (Chapter 5). In contrast,
in Luxembourg the respective shares are 55% and 41% (no comparable data available for the
United Kingdom).
That said, employment rates of people with disability have been increasing in recent
years in Spain, the United Kingdom and, to a lesser extent, also in Luxembourg, and even
faster than those of the population without disability. The exception is Australia, where
employment rates of people with disability stagnated between 1998 and 2003 (the latest
year for which comparable data is available) while overall employment continued to
increase, leading to a fall in the relative employment rate of people with disability.
In general, age and education but not gender determines employment differentials
between persons with and without disability (Table 1.2). There is a strong correlation
Figure 1.1. Employment rates of persons with disability are only half the level of those without disability, except in Luxembourg
Employment rates of working-age people with and without disability, latest available years (percentage)a
a) Definition of disability on self-assessment basis: existence of chronic health problem and long-term limitationsin daily life activities.
Source: SDAC (Australia); national labour force surveys (Luxembourg and Spain, 2002; United Kingdom); ECHP (Spain,1995, 2000); and EU-SILC (Luxembourg and Spain, 2004).
��
��
��
��
��
��
�
�
��
�����
���
���
���
���
���
���
��
��
���
��� �� ��� ���� ��� �� ��� ���� �� ���
������� ��������� �� ������������ �!"#��������
$%&�!'%�"��������(
)*������� +*��%�!*�� ,&��" -"�����.�"��!%
SICKNESS, DISABILITY AND WORK: BREAKING THE BARRIERS – VOL. 2 – ISBN 978-92-64-03815-8 – © OECD 200740
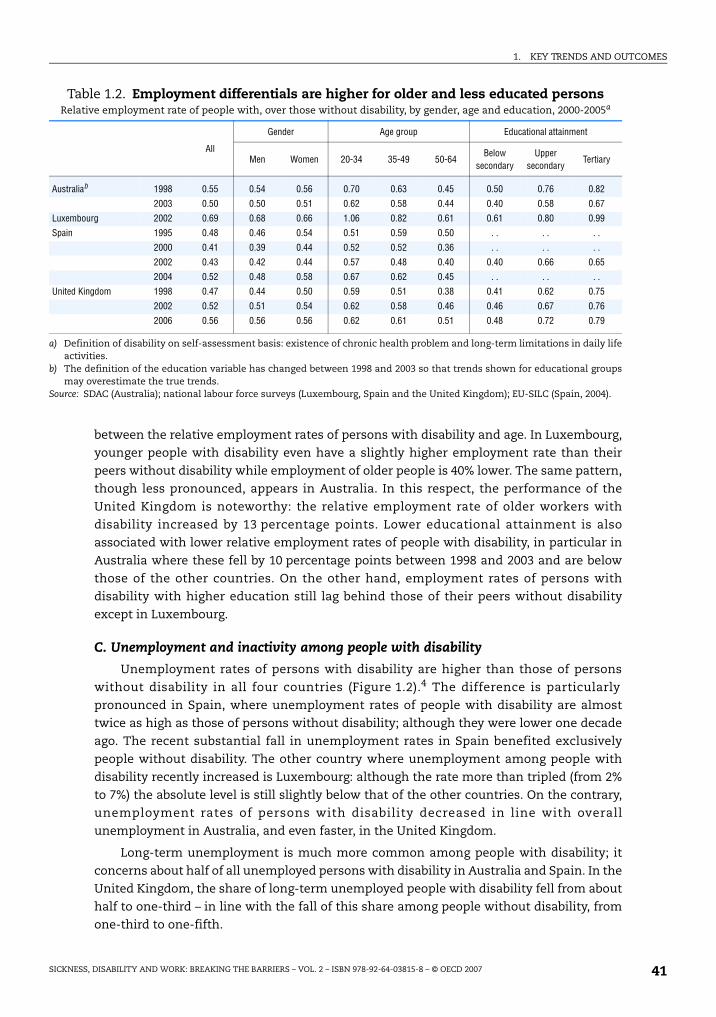
1. KEY TRENDS AND OUTCOMES
between the relative employment rates of persons with disability and age. In Luxembourg,
younger people with disability even have a slightly higher employment rate than their
peers without disability while employment of older people is 40% lower. The same pattern,
though less pronounced, appears in Australia. In this respect, the performance of the
United Kingdom is noteworthy: the relative employment rate of older workers with
disability increased by 13 percentage points. Lower educational attainment is also
associated with lower relative employment rates of people with disability, in particular in
Australia where these fell by 10 percentage points between 1998 and 2003 and are below
those of the other countries. On the other hand, employment rates of persons with
disability with higher education still lag behind those of their peers without disability
except in Luxembourg.
C. Unemployment and inactivity among people with disability
Unemployment rates of persons with disability are higher than those of persons
without disability in all four countries (Figure 1.2).4 The difference is particularly
pronounced in Spain, where unemployment rates of people with disability are almost
twice as high as those of persons without disability; although they were lower one decade
ago. The recent substantial fall in unemployment rates in Spain benefited exclusively
people without disability. The other country where unemployment among people with
disability recently increased is Luxembourg: although the rate more than tripled (from 2%
to 7%) the absolute level is still slightly below that of the other countries. On the contrary,
unemployment rates of persons with disability decreased in line with overall
unemployment in Australia, and even faster, in the United Kingdom.
Long-term unemployment is much more common among people with disability; it
concerns about half of all unemployed persons with disability in Australia and Spain. In the
United Kingdom, the share of long-term unemployed people with disability fell from about
half to one-third – in line with the fall of this share among people without disability, from
one-third to one-fifth.
Table 1.2. Employment differentials are higher for older and less educated personsRelative employment rate of people with, over those without disability, by gender, age and education, 2000-2005a
All
Gender Age group Educational attainment
Men Women 20-34 35-49 50-64Below
secondaryUpper
secondaryTertiary
Australiab 1998 0.55 0.54 0.56 0.70 0.63 0.45 0.50 0.76 0.82
2003 0.50 0.50 0.51 0.62 0.58 0.44 0.40 0.58 0.67
Luxembourg 2002 0.69 0.68 0.66 1.06 0.82 0.61 0.61 0.80 0.99
Spain 1995 0.48 0.46 0.54 0.51 0.59 0.50 . . . . . .
2000 0.41 0.39 0.44 0.52 0.52 0.36 . . . . . .
2002 0.43 0.42 0.44 0.57 0.48 0.40 0.40 0.66 0.65
2004 0.52 0.48 0.58 0.67 0.62 0.45 . . . . . .
United Kingdom 1998 0.47 0.44 0.50 0.59 0.51 0.38 0.41 0.62 0.75
2002 0.52 0.51 0.54 0.62 0.58 0.46 0.46 0.67 0.76
2006 0.56 0.56 0.56 0.62 0.61 0.51 0.48 0.72 0.79
a) Definition of disability on self-assessment basis: existence of chronic health problem and long-term limitations in daily lifeactivities.
b) The definition of the education variable has changed between 1998 and 2003 so that trends shown for educational groupsmay overestimate the true trends.
Source: SDAC (Australia); national labour force surveys (Luxembourg, Spain and the United Kingdom); EU-SILC (Spain, 2004).
SICKNESS, DISABILITY AND WORK: BREAKING THE BARRIERS – VOL. 2 – ISBN 978-92-64-03815-8 – © OECD 2007 41

1. KEY TRENDS AND OUTCOMES
Despite a higher risk of unemployment for people with disability, they also
consistently have higher shares of inactives among the non-employed population in all
four countries. The inactivity shares are some 5-12 percentage points higher than for
people without disability (Table 1.3). This differential concerns men much more than
women. In turn, there is not much of a variation across age groups.
Employment policies for people with disability are targeted mostly at those who
would wish to work – unemployed but also inactive persons. Some indication of the
share of inactive people with disability who, despite their disadvantage, wish to take up
a job is available for the European countries from the EU Labour Force Survey. Table 1.4
shows that the share of people with “permanent” disability reporting a wish to work
differs substantially across the three countries. It ranges from a low of 5% in
Luxembourg to 14% in Spain and up to 45% in the United Kingdom, compared with an
EU average of 21%.5
Based on the Australian HILDA survey, the Productivity Commission found that 55% of
inactive men who are ill or have a disability did not want to work, while 38% would wish to
work; another 6% were unsure (Lattimore, 2007). In a different survey of disability
beneficiaries, around half of all men and women indicated they were likely or hoping to
work in the future (FaCS, 2004). Hence, the Australian figures appear to be fairly close to
those in the United Kingdom.
The percentage of inactive persons with disability wishing to work further depends on
age and decreases sharply for the older age group (50-64). In Luxembourg, for instance, the
share of older inactive people with disability who would like to work is negligible. In
Figure 1.2. Higher and longer unemployment among the population with disability
Unemployment rates of persons with and without disability, 2000-2005 (percentage)a
a) Definition of self-assessed disability: existence of chronic health problem and long-term limitations in daily lifeactivities. No data by unemployment duration for Luxembourg 2004 and Spain 1995, 2000 and 2004.
Source: SDAC (Australia); national labour force surveys (Luxembourg and Spain, 2002; United Kingdom); ECHP (Spain;1995, 2000); and EU-SILC (Luxembourg and Spain; 2004).
�
��
��
��
�
��
�
�
�
�
���� �� �� ��� ���� ����� ��� ������ ���
-"�%&�!'%�"��������(
�!"#����������"��*"�%&�!'���/!����������"�!"��'���
���������"��*"�%&�!'���/!����������"�!"��'���
�!"#����������"��*"�%&�!'���/!��%!������"�!"��'���
���������"��*"�%&�!'���/!��%!������"�!"��'���
)*������� +*��%�!*�� ,&��" -"�����.�"��!%
� � � � � � � � � � �
SICKNESS, DISABILITY AND WORK: BREAKING THE BARRIERS – VOL. 2 – ISBN 978-92-64-03815-8 – © OECD 200742

1. KEY TRENDS AND OUTCOMES
contrast, more than a third of inactive people with disability in the United Kingdom
aged 50-64 would wish to work. Questionnaire wording, cultural differences, labour market
conditions and household income levels all have their say in explaining these huge
differences, but it is likely that institutional factors play an important role: replacement
rate levels and possibilities to transfer to (early) retirement.
Table 1.3. Higher shares of inactivity among total non-employment for people with disability, especially among men
Share of inactives in percentage of non-employed population, by gender and age, 2005a
AllGender Age group
Men Women 20-34 35-49 50-64
Australia
Disabled 94.4 92.8 95.6 85.0 92.3 97.3
Non-disabled 83.1 66.6 89.7 75.6 81.7 93.1
D/ND 1.14 1.39 1.07 1.12 1.13 1.05
Luxembourg
Disabled 97.9 98.5 97.3 90.7 96.6 98.9
Non-disabled 93.5 88.7 95.1 88.4 90.3 99.5
D/ND 1.05 1.11 1.02 1.03 1.07 0.99
Spain
Disabled 87.9 86.0 89.5 67.5 84.6 94.7
Non-disabled 75.3 64.9 79.7 64.8 72.1 91.5
D/ND 1.17 1.33 1.12 1.04 1.17 1.03
United Kingdom
Disabled 93.4 91.2 95.1 87.5 90.1 96.6
Non-disabled 81.0 65.2 88.3 75.7 75.8 91.2
D/ND 1.15 1.40 1.08 1.16 1.19 1.06
a) Definition of disability on self-assessment basis: existence of chronic health problem and long-term limitationsin daily life activities. Data refer to 2002 (Luxembourg), 2003 (Australia), 2004 (Spain) and 2006 (United Kingdom),respectively.
Source: SDAC (Australia); national labour force surveys (Luxembourg, United Kingdom); EU-SILC (Spain).
Table 1.4. Many inactive persons with disability want to workPercentage of inactive persons with permanent disability who say they want to work,
by age group, 2004/2005a
Total 20-34 35-49 50-64
Luxembourg Men 6.2 24.9 13.8 2.4
Women 3.7 6.3 11.1 1.3
Total 5.1 14.5 12.8 1.9
Spain Men 13.1 21.3 15.9 9.2
Women 15.8 23.0 20.0 12.4
Total 14.4 22.0 17.8 10.8
United Kingdom Men 49.1 56.4 56.6 43.0
Women 40.7 49.8 50.6 32.1
Total 45.1 53.5 53.5 37.9
OECD Europeb Men 21.8 29.7 27.5 17.3
Women 20.0 30.7 27.7 14.4
Total 20.9 30.1 27.6 15.8
a) Figures refer to the average of 2004 and 2005.b) Data are the weighted average of EU19 (excluding Ireland and the Netherlands), Iceland, Norway and Switzerland.Source: EU Labour Force Survey 2004 and 2005.
SICKNESS, DISABILITY AND WORK: BREAKING THE BARRIERS – VOL. 2 – ISBN 978-92-64-03815-8 – © OECD 2007 43

1. KEY TRENDS AND OUTCOMES
1.2. Financial resources of people with disability: income and poverty
A. Relative income levels
On average, people with disability have less financial resources than others in society
in all four countries. But income levels are much closer to the average working-age
population in the two continental European countries. Figure 1.3 shows three average
yardsticks for financial resources, presented in relative terms: i) total unadjusted incomes
of households with at least one person with a disability; ii) equivalised incomes of persons
with disability;6 and iii) individual incomes of persons with disability. Average incomes of
households with people with disability are some 10 percentage points higher than
equivalised incomes of persons with disability in those households. In Luxembourg, the
former are virtually identical to the average income of households without persons with
disability. Equivalised incomes are, in turn, higher than individual incomes, although this
difference is less pronounced in Australia and the United Kingdom.
Equivalised household income (the medium indicator) is best suited for international
comparison, because it takes into account all household incomes (income from work,
capital and social benefits) but corrects for differences in household size and refers only to
persons with disability. On that basis, average income levels of persons with disability are
around 70% of those of persons without disability in Australia7 and the United Kingdom,
but 85-90% in Luxembourg and Spain. For comparison, relative incomes stood at almost
90% in Norway and Switzerland and around 80% in Poland (OECD 2006b). In Spain, relative
incomes of people with disability increased by as much as 10 percentage points over the
period 1995 to 2004, while relative incomes stagnated or fell slightly in Australia and the
United Kingdom in the early 2000s.8
Figure 1.3. Relative income levels of persons with disability are higher in continental European countries
Average incomes of persons of working age with disability over those without disability (percentage), three income definitionsa
a) Total income of households with at least one member with a disability; equivalised adjusted income of personswith disability; individual income of persons with disability. Income concept: disposable income, except Australia:gross income.
Source: SDAC (Australia); ECHP (Spain, 1995, 2000); FRS (United Kingdom); and EU-SILC (Luxembourg and Spain, 2004).
���
��
��
��
��
������ �� ��� ���� ��� �� ���
0!*���!����"1!%�
)*������� +*��%�!*�� ,&��" -"�����.�"��!%
$2*����������"1!%� 3"�����*����"1!%�
SICKNESS, DISABILITY AND WORK: BREAKING THE BARRIERS – VOL. 2 – ISBN 978-92-64-03815-8 – © OECD 200744

1. KEY TRENDS AND OUTCOMES
How do these income levels compare to those of other economically vulnerable groups
in the countries? For example, for single parents they are at about OECD average (66%) in
Luxembourg and Spain but below that in Australia and the United Kingdom (57-58%). For
persons aged 75 years and over, they are above the OECD average in Luxembourg (91%) and
Spain (84%) and again below that in Australia (64%) and the United Kingdom (71%) (Förster
and Mira d’Ercole, 2005). Levels of relative incomes of persons with disability are, therefore,
comparable to those of senior citizens. Further, relative income levels of all economically
vulnerable groups seem to be lower in the two English-speaking countries, indicating a
higher degree of overall income inequality.
It should be noted that the traditional income concepts such as the one used here do
not adjust for specific additional costs associated with disability, e.g. for transport or
particular equipment. Empirical evidence on such costs is available for the United
Kingdom. Jones and O’Donnell (1995) report that physical disability has a significant effect
on household fuel expenditures (plus 64%) and transport expenditures (plus 45%). More
recently, Zaidi and Burchardt (2005) find that disability generates substantial additional
costs of living, especially for people with disability living alone, and that these rise with
severity of disability.9
B. Incidence of low incomes and poverty risks
To which extent do the lower income levels coupled with distributive patterns of
earnings, transfers and other incomes lead to increased poverty risks among the
population with disability? First, and foremost, a higher percentage of people with
disability fall in the lower income deciles and a correspondingly lower percentage in the
richer deciles, and this picture is particularly pronounced in Australia (Table 1.5). While, by
definition, one tenth of the total working-age population falls in the lowest decile, this
concerns 22% of Australians with disability, compared to 14% of persons with disability in
Luxembourg, Spain and the United Kingdom. These percentages increase to 57% among
the poorest three deciles in Australia,10 41% in the United Kingdom and 38% in
Luxembourg and Spain. In turn, just 13% of people with disability in Australia are part of
the richest 30% of the working-age population, compared to 21-22% in the other three
countries.
Table 1.5. More persons with disability among the lowest income deciles, especially in Australia
Cumulative percentages of persons with disability in lower and higher income deciles(based on household incomes of working-age population)a
Lowest decile
Two lowest deciles
Three lowest deciles
Three highest deciles
Two highest deciles
Highestdecile
Australia 1998 21 42 55 14 9 4
2003 22 45 57 13 8 4
Luxembourg 2004 14 27 38 22 13 7
Spain 1995 14 29 43 16 10 3
2000 15 30 41 18 11 4
2004 14 26 38 22 13 5
United Kingdom 2005 14 29 41 21 13 6
a) Income refers to disposable household income per equivalent person, except for Australia where it is grosshousehold income per equivalent person (equivalence elasticity = 0.5).
Source: SDAC (Australia); ECHP (Spain, 1995, 2000); FRS (United Kingdom); and EU-SILC (Luxembourg and Spain, 2004).
SICKNESS, DISABILITY AND WORK: BREAKING THE BARRIERS – VOL. 2 – ISBN 978-92-64-03815-8 – © OECD 2007 45
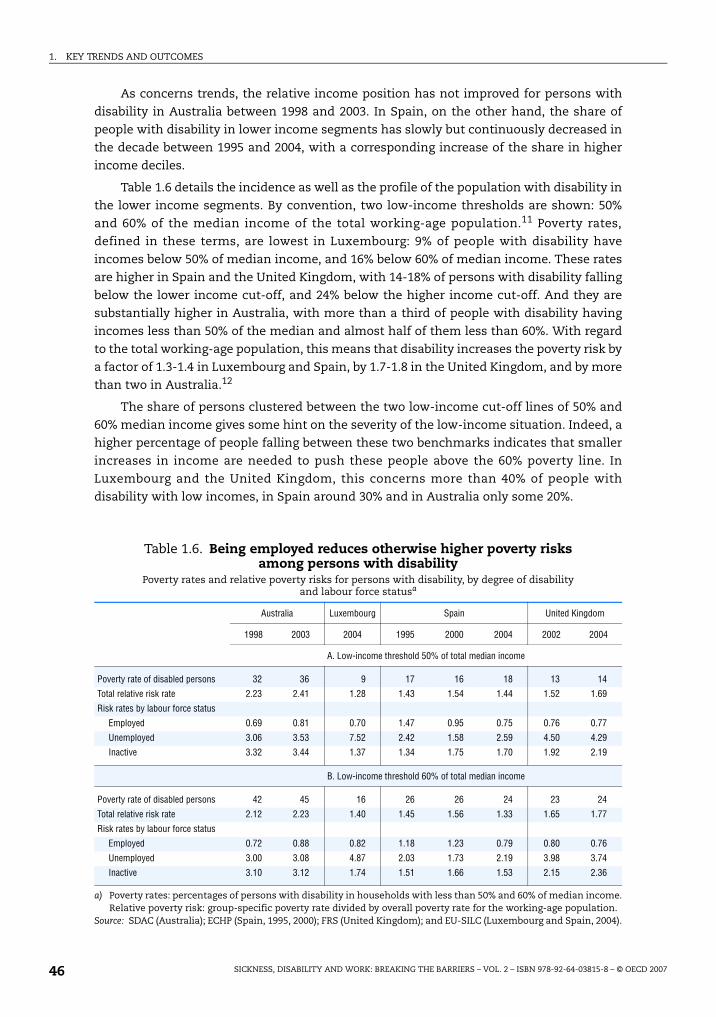
1. KEY TRENDS AND OUTCOMES
As concerns trends, the relative income position has not improved for persons with
disability in Australia between 1998 and 2003. In Spain, on the other hand, the share of
people with disability in lower income segments has slowly but continuously decreased in
the decade between 1995 and 2004, with a corresponding increase of the share in higher
income deciles.
Table 1.6 details the incidence as well as the profile of the population with disability in
the lower income segments. By convention, two low-income thresholds are shown: 50%
and 60% of the median income of the total working-age population.11 Poverty rates,
defined in these terms, are lowest in Luxembourg: 9% of people with disability have
incomes below 50% of median income, and 16% below 60% of median income. These rates
are higher in Spain and the United Kingdom, with 14-18% of persons with disability falling
below the lower income cut-off, and 24% below the higher income cut-off. And they are
substantially higher in Australia, with more than a third of people with disability having
incomes less than 50% of the median and almost half of them less than 60%. With regard
to the total working-age population, this means that disability increases the poverty risk by
a factor of 1.3-1.4 in Luxembourg and Spain, by 1.7-1.8 in the United Kingdom, and by more
than two in Australia.12
The share of persons clustered between the two low-income cut-off lines of 50% and
60% median income gives some hint on the severity of the low-income situation. Indeed, a
higher percentage of people falling between these two benchmarks indicates that smaller
increases in income are needed to push these people above the 60% poverty line. In
Luxembourg and the United Kingdom, this concerns more than 40% of people with
disability with low incomes, in Spain around 30% and in Australia only some 20%.
Table 1.6. Being employed reduces otherwise higher poverty risks among persons with disability
Poverty rates and relative poverty risks for persons with disability, by degree of disability and labour force statusa
Australia Luxembourg Spain United Kingdom
1998 2003 2004 1995 2000 2004 2002 2004
A. Low-income threshold 50% of total median income
Poverty rate of disabled persons 32 36 9 17 16 18 13 14
Total relative risk rate 2.23 2.41 1.28 1.43 1.54 1.44 1.52 1.69
Risk rates by labour force status
Employed 0.69 0.81 0.70 1.47 0.95 0.75 0.76 0.77
Unemployed 3.06 3.53 7.52 2.42 1.58 2.59 4.50 4.29
Inactive 3.32 3.44 1.37 1.34 1.75 1.70 1.92 2.19
B. Low-income threshold 60% of total median income
Poverty rate of disabled persons 42 45 16 26 26 24 23 24
Total relative risk rate 2.12 2.23 1.40 1.45 1.56 1.33 1.65 1.77
Risk rates by labour force status
Employed 0.72 0.88 0.82 1.18 1.23 0.79 0.80 0.76
Unemployed 3.00 3.08 4.87 2.03 1.73 2.19 3.98 3.74
Inactive 3.10 3.12 1.74 1.51 1.66 1.53 2.15 2.36
a) Poverty rates: percentages of persons with disability in households with less than 50% and 60% of median income.Relative poverty risk: group-specific poverty rate divided by overall poverty rate for the working-age population.
Source: SDAC (Australia); ECHP (Spain, 1995, 2000); FRS (United Kingdom); and EU-SILC (Luxembourg and Spain, 2004).
SICKNESS, DISABILITY AND WORK: BREAKING THE BARRIERS – VOL. 2 – ISBN 978-92-64-03815-8 – © OECD 200746

1. KEY TRENDS AND OUTCOMES
Employment is the most important factor for reducing poverty risks. In all four
countries, employed persons with disability have poverty rates which are 20-30% below the
average of the total working-age population. It should be noted that employment
substantially reduces poverty risks among people without disability, too. However, the
counter-factual – inactivity and in particular unemployment – has a much more
detrimental effect on the income position of persons with disability.
Over time, relative poverty risks slightly increased for all population groups with
disability in Australia and most groups in the United Kingdom. In Spain, people with
moderate disability and, in particular, those who are employed could reduce their poverty
risk, but not the other groups.
1.3. Costs of disability benefit schemes: public spending and benefit dependence
A. Amount and composition of public spending
Moderating the high costs of sickness and disability is one of the key policy concerns
– in some countries, however, more than in others. By 2005, in Luxembourg and the United
Kingdom spending on disability benefits was higher than in the other countries, at 1.7%
and 1.5% of GDP, respectively. This compares to spending of around 1.1-1.2% in Australia
and Spain, a figure which corresponds to the OECD average (Figure 1.4). That said, in all
four countries disability spending is lower than in the three countries reviewed in OECD
(2006b). Moreover, and more importantly, there was a trend toward lower spending, in
particular in the two “higher spending” countries: in the United Kingdom since the middle
Figure 1.4. Falling trend in spending on disability benefits in recent yearsAnnual spending on disabilitya and sickness benefits,b percentage of GDP, 1990-2005
a) Data include income-replacement benefits and key benefits compensating the extra costs of a disability(Luxembourg and Spain do not have separate benefits for this purpose). Australia: Disability Support Pension,Mobility Allowance, Wife Pension (DSP) and benefits for incapacitated veterans; Luxembourg: disability pensions;Spain: disability benefits for employees, self-employed, civil servants, military personnel and local governmentemployees; United Kingdom: Incapacity Benefit, Severe Disablement Allowance, Income Support with a disabilitypremium and Disability Living Allowance.
b) Australia: Sickness Allowance and employer-provided sickness payments (OECD Secretariat’s estimate);Luxembourg: employer-provided sickness payments (only from 2001 onwards) and sickness benefits; Spain:sickness benefits for employees, self-employed, civil servants, military personnel and local governmentemployees; United Kingdom: Statutory Sick Pay and employer-provided sickness payments.
Source: OECD Social Expenditure database and data supplied by national authorities.
��
��
���
��
���
���
����� ���� ��� ���
��
��
���
��
���
���
����� ���� ��� ���
(�!/�4 5 (�!/�4 5
)*�������
������������ � ���� �������� ��� � ����
+*��%�!*�� ,&��" -"�����.�"��!% 6$7
SICKNESS, DISABILITY AND WORK: BREAKING THE BARRIERS – VOL. 2 – ISBN 978-92-64-03815-8 – © OECD 2007 47
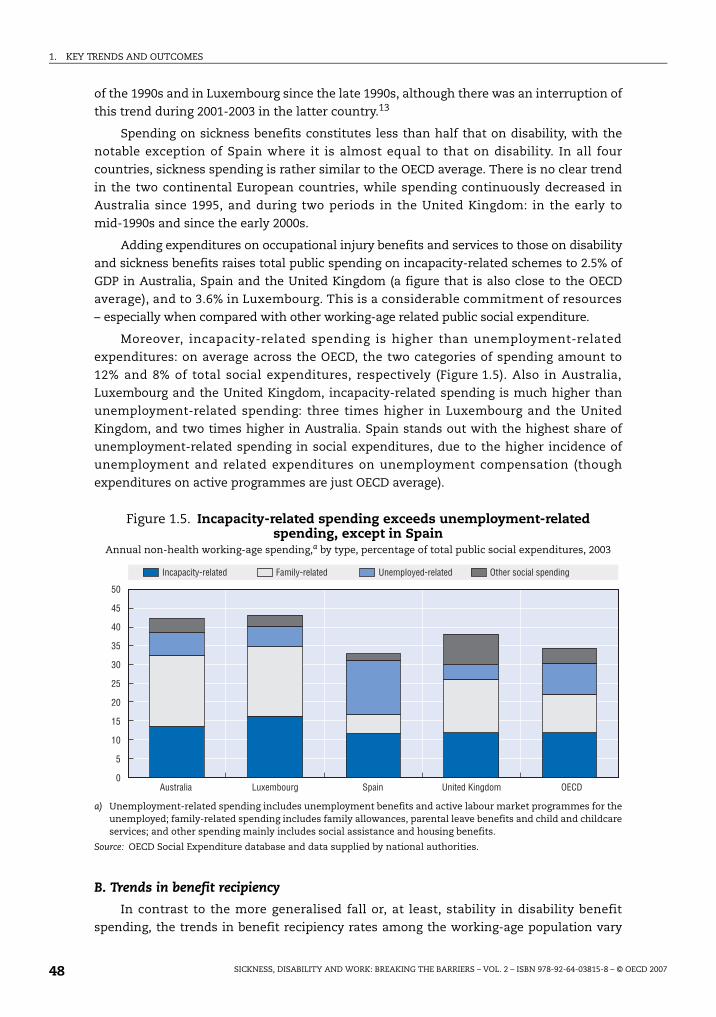
1. KEY TRENDS AND OUTCOMES
of the 1990s and in Luxembourg since the late 1990s, although there was an interruption of
this trend during 2001-2003 in the latter country.13
Spending on sickness benefits constitutes less than half that on disability, with the
notable exception of Spain where it is almost equal to that on disability. In all four
countries, sickness spending is rather similar to the OECD average. There is no clear trend
in the two continental European countries, while spending continuously decreased in
Australia since 1995, and during two periods in the United Kingdom: in the early to
mid-1990s and since the early 2000s.
Adding expenditures on occupational injury benefits and services to those on disability
and sickness benefits raises total public spending on incapacity-related schemes to 2.5% of
GDP in Australia, Spain and the United Kingdom (a figure that is also close to the OECD
average), and to 3.6% in Luxembourg. This is a considerable commitment of resources
– especially when compared with other working-age related public social expenditure.
Moreover, incapacity-related spending is higher than unemployment-related
expenditures: on average across the OECD, the two categories of spending amount to
12% and 8% of total social expenditures, respectively (Figure 1.5). Also in Australia,
Luxembourg and the United Kingdom, incapacity-related spending is much higher than
unemployment-related spending: three times higher in Luxembourg and the United
Kingdom, and two times higher in Australia. Spain stands out with the highest share of
unemployment-related spending in social expenditures, due to the higher incidence of
unemployment and related expenditures on unemployment compensation (though
expenditures on active programmes are just OECD average).
B. Trends in benefit recipiency
In contrast to the more generalised fall or, at least, stability in disability benefit
spending, the trends in benefit recipiency rates among the working-age population vary
Figure 1.5. Incapacity-related spending exceeds unemployment-related spending, except in Spain
Annual non-health working-age spending,a by type, percentage of total public social expenditures, 2003
a) Unemployment-related spending includes unemployment benefits and active labour market programmes for theunemployed; family-related spending includes family allowances, parental leave benefits and child and childcareservices; and other spending mainly includes social assistance and housing benefits.
Source: OECD Social Expenditure database and data supplied by national authorities.
��
��
��
�
�
�
�
��
��
�
�
3"1�&�1��'#������� 8�%��'#������� -"�%&�!'��#������� 6������!1�����&�"��"�
)*������� +*��%�!*�� ,&��" -"�����.�"��!% 6$7
SICKNESS, DISABILITY AND WORK: BREAKING THE BARRIERS – VOL. 2 – ISBN 978-92-64-03815-8 – © OECD 200748
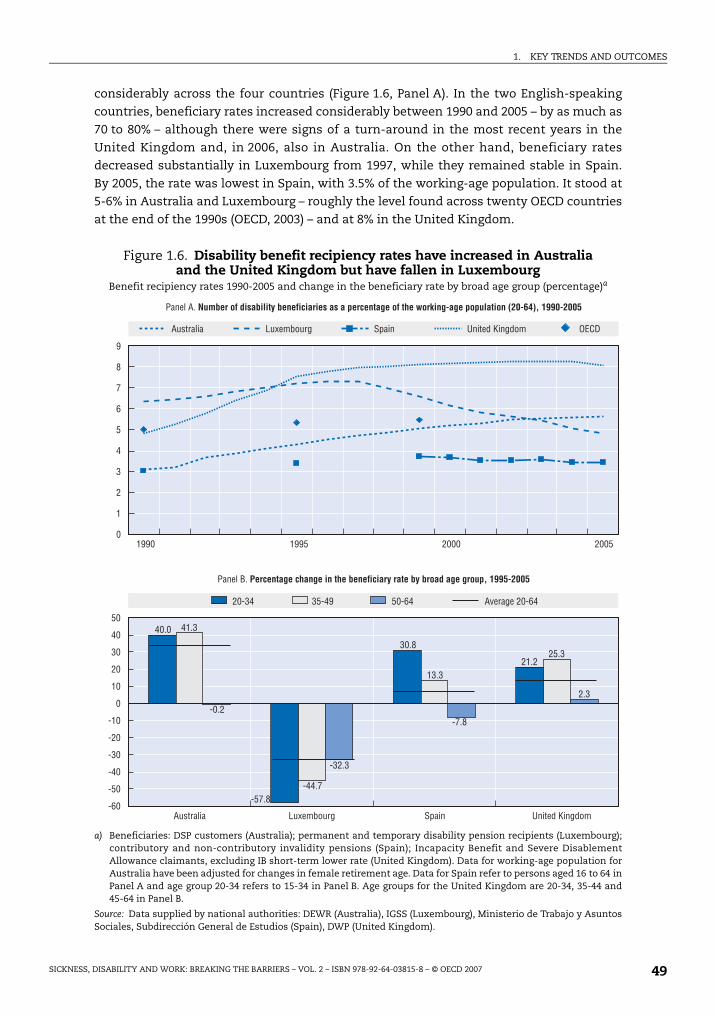
1. KEY TRENDS AND OUTCOMES
considerably across the four countries (Figure 1.6, Panel A). In the two English-speaking
countries, beneficiary rates increased considerably between 1990 and 2005 – by as much as
70 to 80% – although there were signs of a turn-around in the most recent years in the
United Kingdom and, in 2006, also in Australia. On the other hand, beneficiary rates
decreased substantially in Luxembourg from 1997, while they remained stable in Spain.
By 2005, the rate was lowest in Spain, with 3.5% of the working-age population. It stood at
5-6% in Australia and Luxembourg – roughly the level found across twenty OECD countries
at the end of the 1990s (OECD, 2003) – and at 8% in the United Kingdom.
Figure 1.6. Disability benefit recipiency rates have increased in Australia and the United Kingdom but have fallen in Luxembourg
Benefit recipiency rates 1990-2005 and change in the beneficiary rate by broad age group (percentage)a
a) Beneficiaries: DSP customers (Australia); permanent and temporary disability pension recipients (Luxembourg);contributory and non-contributory invalidity pensions (Spain); Incapacity Benefit and Severe DisablementAllowance claimants, excluding IB short-term lower rate (United Kingdom). Data for working-age population forAustralia have been adjusted for changes in female retirement age. Data for Spain refer to persons aged 16 to 64 inPanel A and age group 20-34 refers to 15-34 in Panel B. Age groups for the United Kingdom are 20-34, 35-44 and45-64 in Panel B.
Source: Data supplied by national authorities: DEWR (Australia), IGSS (Luxembourg), Ministerio de Trabajo y AsuntosSociales, Subdirección General de Estudios (Spain), DWP (United Kingdom).
��
��
�
�
��
�
#��
#�
#��
#��
#�
#��
�
����
#���
��
���
#�
#����#����
#��
�������
�
�
�
�
�
�
����� ���� ��� ���
�
�#� �#�� ��#�� )��������#��
)*������� +*��%�!*�� ,&��" -"�����.�"��!%
)*������� +*��%�!*�� ,&��" -"�����.�"��!% 6$7
5�"���)����� �������������� � ������� �������� �� ���� ������ ����������� ������������ !�"#$%�&''!� !!(
5�"���9��) �� ���� ������ ������ � � ����������� ���������� ������%�&''(� !!(
SICKNESS, DISABILITY AND WORK: BREAKING THE BARRIERS – VOL. 2 – ISBN 978-92-64-03815-8 – © OECD 2007 49

1. KEY TRENDS AND OUTCOMES
Changes in beneficiary rates during the past ten years have been driven mainly by the
younger age groups. In Australia and the United Kingdom, for instance, all of the increase
during this period is due to younger and prime-age persons, while the beneficiary rate of
people aged 50-64 hardly changed. In Spain, the beneficiary rate of the youngest increased
by almost one-third, while that of older people fell by 10%. Finally, in Luxembourg the fall
in the beneficiary rate among young workers was almost double that for those over age 50
(Figure 1.6, Panel B).
C. Average benefit levels
The second key factor in explaining spending trends is trends in average benefit levels.
It appears that trends in beneficiary rates are not related to trends in levels of average
disability benefits. Table 1.7 summarises the development of the latter over the period 2000
to 2005. On the one hand, in the two continental European countries – which experienced
a fall in rates of beneficiaries (especially Luxembourg) – the real average value of disability
benefits increased much faster than corresponding wage indicators. On the other hand, in
Australia – which experienced a considerable increase in beneficiary rates – and the United
Kingdom, the annual average growth rate of disability benefits lagged behind that of net
and gross wages. In the United Kingdom, the real value of the long-term incapacity benefit
even fell, while net and gross wages increased by more than 2% annually between 2000
and 2005. This fall in benefit levels reflects changes in both benefit rates and the
composition of beneficiaries.
There are also considerable differences as to the relative value of the average disability
benefit across countries. In Luxembourg and Spain, the average benefit is worth more than
half of average net earnings and around the level of the national minimum wage. By
contrast, the relative level of the average disability benefit is much lower in the two
English-speaking countries: it is worth less than half the national minimum wage, and 28%
and 22% of net earnings in Australia and the United Kingdom, respectively. This suggests
that barriers for taking up work for people with disability who rely only on disability
benefits are most likely not rooted in benefit levels being set too close to earnings (“benefit
traps”) in these two countries, unless other benefits – such as housing benefit or costs-of-
living benefits – are considered as well (Chapter 4).
Table 1.7. Average disability benefits grew faster than wages in Luxembourg and Spain, but lagged behind in Australia and especially in the United KingdomAnnual average growth rates of average disability benefit, gross wage and take-home pay (in real values),
2000-2005a
Annual average growth real values,b 2000-2005 Disability benefit, 2005
Disability benefit Gross earnings Take-home pay% of minimum
wage% of gross earnings
% of take-home pay
Australia 2.5 2.6 3.2 45 22 28
Luxembourg 2.2 1.1 1.9 99 42 57
Spain 2.0 0.3 0.2 118 41 52
United Kingdom –1.2 2.4 2.1 45 16 21
a) Benefits covered: DSP (Australia); temporary and permanent disability pension (Luxembourg); permanentdisability pension (Spain); Incapacity Benefit (long-term) (United Kingdom); gross earnings refer to the AverageWorker earnings, take-home pay to net earnings of an average worker (OECD, 2007a).
b) Deflated with private consumer price index.Source: Data supplied by national authorities; Taxing Wages 2005/06; OECD Economic Outlook.
SICKNESS, DISABILITY AND WORK: BREAKING THE BARRIERS – VOL. 2 – ISBN 978-92-64-03815-8 – © OECD 200750

1. KEY TRENDS AND OUTCOMES
1.4. Exclusion and inclusion errors: disability benefit recipiency and disability prevalence
A. Understanding the concept of “disability”
The number and composition of people describing themselves as “disabled” due to a
health condition is far from being identical to those who claim and receive an incapacity-
related benefit. Estimating the extent of disability is therefore not straightforward. In contrast
to the contingency “unemployment” for instance (having a job or not; searching and being
available for work or not), disability status is rarely dichotomous and much more a matter of
degree. Disability can be defined as a self-assessed or self-perceived status or else as a legal
status based on administrative sources, e.g. benefit receipt or holding a legal disability
certificate. Often, and perhaps inaccurately so, these two definitions are referred to as
“subjective”versus“objective” disability. All four countries under review use data and indicators
derived from both self-assessed and administrative definitions. None of these definitions is
“superior” to the others; rather, they measure different though related phenomena.
Household surveys estimate a similar number of disability benefit recipients as do
administrative registers (United Kingdom excepted):14 around 3-3.5% in Spain, and 5-8% in
the remaining countries (Table 1.8). On the other hand, “subjective” definitions on the basis
of own-assessed health lead to much higher disability rates: around 18% in the United
Kingdom, and around 12% in the other three countries. That said, due to variations in
actual questions asked, even among the self-assessed category using very similar
definitions, estimates may vary between surveys, as can be seen when comparing results
for the United Kingdom in Columns C (based on the national LFS) and D (based on EULFS).
Finally, estimates of the number of people not looking for work because of illness or
disability range between 3% in Luxembourg and 7% in the United Kingdom.
Table 1.8. Benefit receipt and disability prevalence: comparing different disability definitions
Number of working-age persons with a disability as a percentage of the working-age population, 2005(or closest year)a
Administrative disability status Self-assessed disability status
Beneficiaries(registers)
Beneficiaries (national survey)
Health definition (national survey)
Health definition(EU-LFS 2002)
Search for work definition (EU-LFS)
(A) (B) (C) (D) (E)
Australia 5.7 5.8 12.0 (17.5) – –
Luxembourg 4.9 5.0 12.3 (21.3) 12.2 3.0
Spain 3.5 3.1 11.7 (18.3) 9.1 4.6
United Kingdom 8.1 5.5 17.6 28.4 7.0
a) Sources and definitions are as follows: Col. (A) Australia: DSP recipients (DEWR); Luxembourg: disability pensionrecipients (IGSS); Spain: contributory and non-contributory invalidity pensions (Ministerio de Trabajo y AsuntosSociales, Subdirección General de Estudios); United Kingdom: IB and SDA claimants, excluding IB short-termlower rate (DWP, Work and Pensions Longitudinal Study). Col. (B) Australia: ABS, Disability, Ageing andCarers 2003, Disability pension; Luxembourg: EU-SILC 2004, sickness, disability and work injury benefit; Spain:SILC 2004, invalidity benefit; United Kingdom: 2006 LFS, claiming IB, SDA or IS a disability premium. Col. (C)Australia: ABS, Disability, Ageing and Carers 2003, profound/severe + moderate/mild core activity restriction(figure in bracket: national definition, includes non-core schooling and employment disabilities); Luxembourgand Spain: SILC 2004, chronic health problem and limited daily activities for at least six months (figures inbrackets: limited daily activities for at least six months); United Kingdom: LFS 2006 (Persons with reducedcapacity due to a long-lasting health problem of more than a year). Col. (D) EULFS 2002 Ad-hoc module onemployment of people with disability: existence of a longstanding health problem or disability. Col. (E) EULFS 2005(2004 for Luxembourg, United Kingdom): Persons who are not looking for work because of illness/disability.
SICKNESS, DISABILITY AND WORK: BREAKING THE BARRIERS – VOL. 2 – ISBN 978-92-64-03815-8 – © OECD 2007 51

1. KEY TRENDS AND OUTCOMES
B. Exclusion and inclusion errors
Among those who assess themselves as “disabled”, many will not claim or receive
disability benefits. They remain “excluded” from the benefit system, either because they
are working and/or they have otherwise sufficient economic resources, e.g. via other
household members (a central issue in family means-tested systems such as in Australia
or the United Kingdom), or else because of quasi or “true” exclusion errors – be it that they
may not in fact be sufficiently disabled or impaired as to qualify for a disability benefit or
that they have never applied for a disability benefit e.g. because of insufficient benefit
information or stigmatisation. At the same time, there may be a number of persons
“included” in the benefit system who do not consider themselves as “disabled” although
apparently fulfilling benefit eligibility criteria.
Figure 1.7 explores the overlap between these population groups in more detail. The
total height of the bars indicates the possible extent of disability – i.e. self-assessed people
with disability or disability benefit recipients, or both. This amounts to around 12-15% of
the working-age population in Australia, Luxembourg and Spain, and 18% in the United
Kingdom. Using the national disability definition for Australia, which includes not only
core disabilities but also non-core disabilities related to schooling and employment, the
share would also increase to 19% in this country.15 The middle bars show the overlap
between the different disability definitions, i.e. people who assess themselves as disabled’
and who are also on disability benefit rolls. These are between 2% (Luxembourg and Spain)
and 4-5% (Australia and the United Kingdom) of the working-age population and they
constitute a minor share – less than one-third – of the total disability potential.
Figure 1.7 gives some first hints on the size of “inclusion” and “exclusion” errors:
people on benefit registers who do not have self-assessed disabilities on the one hand
(upper bars), and people who do have disabilities but do not receive benefits on the other
(lower bars). At first sight, inclusion errors seem to be much lower than exclusion errors in
Figure 1.7. Most persons with disability do not receive disability benefits, and many recipients do not claim to have a disability
Overlap between self-assessed and benefit recipient disability,a 2005 (or close)
a) DB recipients refer to DSP (Australia); sickness, disability and work injury benefit (Luxembourg); invaliditybenefits (Spain); IB, SDA or IS with a disability premium (United Kingdom).
Source: SDAC 2003 (Australia); LFS 2006 (United Kingdom); and EU-SILC 2004 (Luxembourg and Spain).
�
��
��
��
�
�
�
�
��
�
���
���
��
��
���
��
��
�
����
���
��
��
���
���
���
(�!/�:!�;�"�#����&!&*����!"
9���1�&��"���*��"!�����/#�������� ,��/#����������"�� 9���1�&��"� ,��/#��������<��*��"!�� 9���1�&��"�
)*������� )*�������)9,���/�"���!"
,&��" -"�����.�"��!%+*��%�!*��
SICKNESS, DISABILITY AND WORK: BREAKING THE BARRIERS – VOL. 2 – ISBN 978-92-64-03815-8 – © OECD 200752
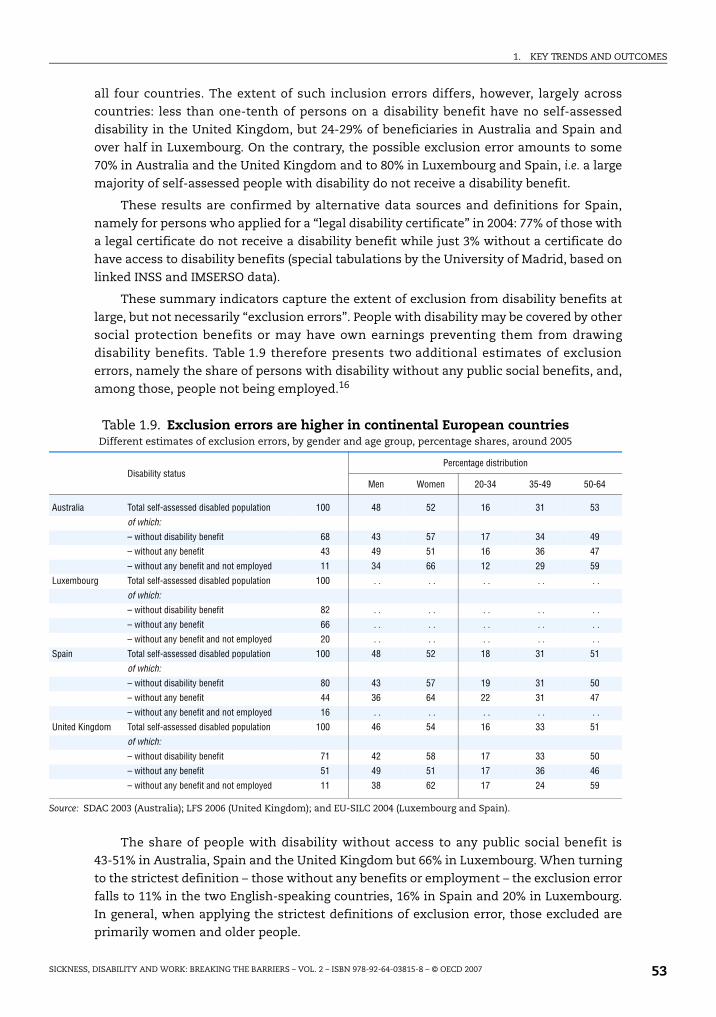
1. KEY TRENDS AND OUTCOMES
all four countries. The extent of such inclusion errors differs, however, largely across
countries: less than one-tenth of persons on a disability benefit have no self-assessed
disability in the United Kingdom, but 24-29% of beneficiaries in Australia and Spain and
over half in Luxembourg. On the contrary, the possible exclusion error amounts to some
70% in Australia and the United Kingdom and to 80% in Luxembourg and Spain, i.e. a large
majority of self-assessed people with disability do not receive a disability benefit.
These results are confirmed by alternative data sources and definitions for Spain,
namely for persons who applied for a “legal disability certificate” in 2004: 77% of those with
a legal certificate do not receive a disability benefit while just 3% without a certificate do
have access to disability benefits (special tabulations by the University of Madrid, based on
linked INSS and IMSERSO data).
These summary indicators capture the extent of exclusion from disability benefits at
large, but not necessarily “exclusion errors”. People with disability may be covered by other
social protection benefits or may have own earnings preventing them from drawing
disability benefits. Table 1.9 therefore presents two additional estimates of exclusion
errors, namely the share of persons with disability without any public social benefits, and,
among those, people not being employed.16
The share of people with disability without access to any public social benefit is
43-51% in Australia, Spain and the United Kingdom but 66% in Luxembourg. When turning
to the strictest definition – those without any benefits or employment – the exclusion error
falls to 11% in the two English-speaking countries, 16% in Spain and 20% in Luxembourg.
In general, when applying the strictest definitions of exclusion error, those excluded are
primarily women and older people.
Table 1.9. Exclusion errors are higher in continental European countriesDifferent estimates of exclusion errors, by gender and age group, percentage shares, around 2005
Disability statusPercentage distribution
Men Women 20-34 35-49 50-64
Australia Total self-assessed disabled population 100 48 52 16 31 53
of which:
– without disability benefit 68 43 57 17 34 49
– without any benefit 43 49 51 16 36 47
– without any benefit and not employed 11 34 66 12 29 59
Luxembourg Total self-assessed disabled population 100 . . . . . . . . . .
of which:
– without disability benefit 82 . . . . . . . . . .
– without any benefit 66 . . . . . . . . . .
– without any benefit and not employed 20 . . . . . . . . . .
Spain Total self-assessed disabled population 100 48 52 18 31 51
of which:
– without disability benefit 80 43 57 19 31 50
– without any benefit 44 36 64 22 31 47
– without any benefit and not employed 16 . . . . . . . . . .
United Kingdom Total self-assessed disabled population 100 46 54 16 33 51
of which:
– without disability benefit 71 42 58 17 33 50
– without any benefit 51 49 51 17 36 46
– without any benefit and not employed 11 38 62 17 24 59
Source: SDAC 2003 (Australia); LFS 2006 (United Kingdom); and EU-SILC 2004 (Luxembourg and Spain).
SICKNESS, DISABILITY AND WORK: BREAKING THE BARRIERS – VOL. 2 – ISBN 978-92-64-03815-8 – © OECD 2007 53

1. KEY TRENDS AND OUTCOMES
1.5. Demographic challenges: population ageing and future labour supply shortages
Both the number of self-assessed persons with disability and disability benefit
recipients increase strongly with age in all four countries. The process of population ageing
will, therefore, “automatically” translate into higher disability rates, without any
behavioural changes and other things being equal. Related to this fact are concerns about
declining labour supply in the forthcoming decades due to population ageing; mobilising
under-utilised labour potential among older workers and workers with disability is
sometimes seen as one policy answer to this challenge.
A. Effects of ageing on recent trends among disability beneficiaries
To what extent are recent trends in disability beneficiary numbers explained by
changes in the population structure? The “pure” effect of ageing can be explored by
producing an estimated historical series of disability beneficiaries for the past decade for
each country, multiplying 1995 age- and gender-specific beneficiary rates by population
numbers in each age and gender group. The difference between the estimated results and
the actual beneficiary numbers is the part of the trend resulting from changes in benefit
recipiency rates and therefore not explained by changes in the size of the population “at
risk” but by behavioural changes, effects of policies or both.
Demographic changes alone (dotted lines in Figure 1.8) would have continuously
increased disability beneficiary rates in the past ten years in all countries: by roughly 10%
in the United Kingdom, 20% in Spain, 30% in Australia and 40% in Luxembourg. Actual
developments, however, diverged largely across countries (straight lines in Figure 1.8). In
Australia, about half of the increase in beneficiary numbers during the period 1995-2005
was due to changes in the population age structure, i.e. the relatively larger increase in the
number of older workers who have a higher risk of developing a disability. The other half is
explained by changes in the beneficiary rates themselves.
In the United Kingdom, practically the totality of the increase is due to population
ageing, although this is a result of a stronger actual increase in the first seven years and a
reduction of the differential since 2001. The pattern is quite different in Spain and, in
particular Luxembourg, where population ageing would have increased the number of
disability beneficiaries by more than the actual numbers show. In Luxembourg, the actual
numbers even fell by 6%, which means that the already sizeable reduction would have been
even larger in the absence of population ageing.
B. Demographic challenges on disability policies over the coming decades
Yet another question is how disability beneficiary rates and numbers will evolve over
the coming decades as a consequence of future population ageing, all other things being
equal. By using national population projections,17 future trends in disability beneficiary
numbers are estimated, again assuming for illustrative purposes that beneficiary rates by
age and gender remain constant from 2005 onward.
Results from these projections are summarised in Table 1.10. The number of
beneficiaries is projected to increase by one-third in Australia and by half in Luxembourg
in the very long run, i.e. by 2050, but to remain at about the same level in Spain and the
United Kingdom.18 Likewise, the size of the self-assessed population with disability is
projected to increase by one-third in both Australia and Luxembourg and by 10% in the
SICKNESS, DISABILITY AND WORK: BREAKING THE BARRIERS – VOL. 2 – ISBN 978-92-64-03815-8 – © OECD 200754

1. KEY TRENDS AND OUTCOMES
United Kingdom but to decrease in Spain. Overall, therefore, the demographic pressure on
disability policies could well be much higher in Australia and Luxembourg than in Spain
and the United Kingdom.
The pure demographic impact on disability numbers differs according to different
time periods in each of the four countries. In Australia, numbers of both beneficiaries and
self-assessed persons with disability increase continuously and steadily over the whole
period. In Luxembourg, they increase much more substantially over the coming two
decades, but then remain constant for the subsequent 15 years or so. However, a further
increase of disability numbers is projected from around 2040 onwards.
Population projections draw a similarly dramatic picture for Spain, but only for the
next two decades. Numbers of beneficiaries are projected to increase considerably and to
Figure 1.8. Recent trends in beneficiary numbers result only partly from population ageing
Number of disability beneficiaries 1995-2005, actual and estimated, on the basis of 1995 beneficiary ratesa
a) The dotted lines labelled “demography” show estimated numbers of beneficiaries under the assumption ofconstant age- and gender-specific beneficiary rates of 1995; the solid lines show the actual numbers ofbeneficiaries. All data refer to the age group 20-64.
b) Data refer to the contributory pension only.
Source: OECD Population database and beneficiary data from national insurance administrations.
���
���
���
���
���
��
������ ���� �� ���
�
�
�
��
��
����� ���������� ���� ���������
�����
���
���
���
���
������� ���� �� ���
����
����
����
����
���
�������� ���������� ���� ���������
�*%����������� �*%�����������
�%!���&�'�!"�'
�������� *�+ �����
)1�*���"*%���
�*%����������� �*%����������� ������ ,��� ��-������
SICKNESS, DISABILITY AND WORK: BREAKING THE BARRIERS – VOL. 2 – ISBN 978-92-64-03815-8 – © OECD 2007 55

1. KEY TRENDS AND OUTCOMES
exceed one million in the 2020s. However, and in contrast to Luxembourg, as from 2030, in
line with demographic trends, beneficiary numbers decline continuously. The pattern is
again different for the United Kingdom; in this country, both beneficiary and prevalence
rates increase at a much slower path over the coming ten to twenty years and then remain
broadly stable.
Applying specific labour market integration targets to population and labour force
projections can shed some light on the possible impact of mobilising the labour potential
among persons with disability. This is done in Figure 1.9 which compares projections of the
total labour force (long-dotted lines, on the basis of the above population projections) with
projections of the labour force augmented by estimates of persons with disability taking up
work (short-dotted lines). The scenario assumes for illustrative purposes that, by 2025, all
four countries will have succeeded in integrating inactive persons with disability into the
labour force by an age- and gender-specific percentage which corresponds to the average
percentage of persons with disability wishing to work (Table 1.4), and to double this
percentage by 2050. Because of the large country differences in the wishing-to-work
proportions, the scenario takes the European average for each age- and gender group as a
basis for all four countries. For example, it is assumed that by 2025, in each country 29.7%
of the 20-34 year old inactive men with disability will enter the labour force and another
29.7% between 2025 and 2050. This is assumed to be phased in annually from 2005 onward.
Figure 1.9 shows that the labour market integration of all those who would wish to
work would have sizeable effects on projected labour supply, although the overall effects
would remain by no means sufficient to cope with possible labour shortages. By 2050, in
Australia, Luxembourg and Spain, the optimistic labour force scenario would result in
projections of some 5 percentage points higher than the constant labour force scenario.
This would, however, close the gap to the projected overall population growth only by
between one-quarter and one-third. Only in the United Kingdom – where the projected
Table 1.10. Population ageing will have a larger impact on future beneficiary trends in Australia and Luxembourg
Projected number of disability benefit recipients and self-assessed persons with disability, 2005-2050a
(in thousand)
Australia Luxembourg Spain United Kingdomb
Disability benefit
recipients
Self-assessed disabled
population
Disability benefit
recipients
Self-assessed disabled
population
Disability benefit
recipients
Self-assessed disabled
population
Disability benefit
recipients
Self-assessed disabled
population
2005 683 1 508 17.1 34.7 808 5 057 2 755 6 236
2010 749 1 639 19.4 37.5 899 5 378 2 848 6 490
2015 785 1 717 21.5 39.7 974 5 575 2 890 6 552
2020 820 1 779 23.6 41.4 1 059 5 714 2 961 6 741
2025 841 1 827 24.8 42.1 1 113 5 747 2 976 6 819
2030 853 1 848 24.4 41.9 1 123 5 657 2 922 6 707
2035 873 1 890 23.2 41.7 1 088 5 375 2 880 6 577
2040 883 1 914 23.0 42.5 996 4 946 2 906 6 613
2045 909 1 962 24.1 44.2 869 4 501 2 959 6 767
2050 920 1 982 25.6 45.9 800 4 242 2 952 6 790
a) The results refer to the age group 20-64 for all four countries.
b) The data refer to the United Kingdom which is why beneficiary numbers deviate slightly from those shownelsewhere.
Source: OECD projections based on OECD Population database and beneficiary data from national insuranceadministrations.
SICKNESS, DISABILITY AND WORK: BREAKING THE BARRIERS – VOL. 2 – ISBN 978-92-64-03815-8 – © OECD 200756
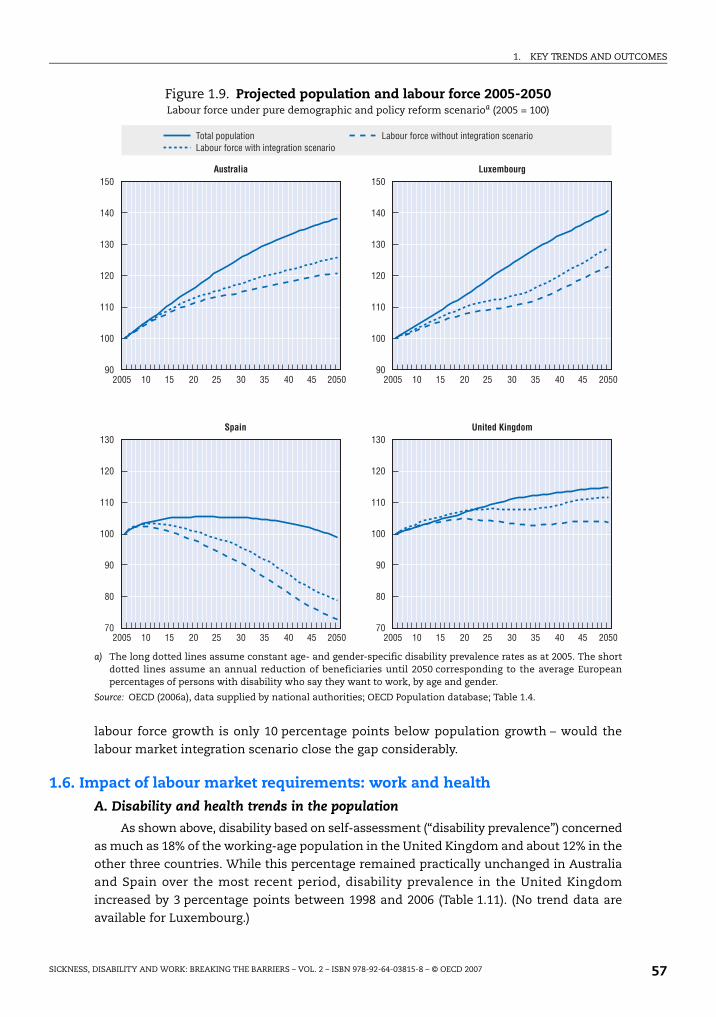
1. KEY TRENDS AND OUTCOMES
labour force growth is only 10 percentage points below population growth – would the
labour market integration scenario close the gap considerably.
1.6. Impact of labour market requirements: work and health
A. Disability and health trends in the population
As shown above, disability based on self-assessment (“disability prevalence”) concerned
as much as 18% of the working-age population in the United Kingdom and about 12% in the
other three countries. While this percentage remained practically unchanged in Australia
and Spain over the most recent period, disability prevalence in the United Kingdom
increased by 3 percentage points between 1998 and 2006 (Table 1.11). (No trend data are
available for Luxembourg.)
Figure 1.9. Projected population and labour force 2005-2050Labour force under pure demographic and policy reform scenarioa (2005 = 100)
a) The long dotted lines assume constant age- and gender-specific disability prevalence rates as at 2005. The shortdotted lines assume an annual reduction of beneficiaries until 2050 corresponding to the average Europeanpercentages of persons with disability who say they want to work, by age and gender.
Source: OECD (2006a), data supplied by national authorities; OECD Population database; Table 1.4.
���
���
��
��
���
���
����� �� � ���
���
���
��
��
���
�����
��
��
���
���
��
��
��
��
���
���
��
��
���
��
��
� � �� ��
��� �� � ������ � � �� ��
��� �� � ������ � � �� ��
��� �� � ������ � � �� ��
�������� *�+ �����
����� ,��� ��-������
=!����&!&*����!" +��!*��/!�1��:���!*���"�������!"��1�"���!+��!*��/!�1��:�����"�������!"��1�"���!
SICKNESS, DISABILITY AND WORK: BREAKING THE BARRIERS – VOL. 2 – ISBN 978-92-64-03815-8 – © OECD 2007 57

1. KEY TRENDS AND OUTCOMES
Gender differences in self-reported disability are relatively small. At the most recent
date, disabilities are slightly more prevalent among women in Australia, Spain and the
United Kingdom – as in a majority of OECD countries (OECD, 2003) – but much more
common among men in Luxembourg. There is much more of a differential across age, with
disability prevalence gradually increasing by age in all four countries, especially in
Australia and Spain. Educational attainment is also negatively linked with disability
prevalence, though it appears that the age factor has somewhat more importance than the
educational attainment factor in all four countries.
These large and persistent numbers of people with a self-assessed disability have to be
seen against the background of the improving “objective” health status of the population.
One such indicator of this improvement is the “potential years of life lost”. This is a
summary measure of premature mortality, which provides an explicit way of weighting
deaths occurring at younger ages that are, a priori, preventable. In all four countries this
measure has fallen substantially, by as much as 40 to 50% since 1980 and by 20 to 30%
since 1990 (Figure 1.10).
This means that subjective health or disability indicators provide quite a different
trend picture of the health status than objective ones. Furthermore, developments in
disability benefit receipt over time (Section 1.3.B) are not related to trends in either
objective or subjective health indicators. This suggests that these latter trends are to a
considerable extent influenced by factors beyond health.
B. Labour market requirements and health
The current restructuring of the labour market in post-industrialised societies has
profoundly changed labour market requirements. In the context of continuously increasing
efficiency and competitiveness, continuous core employment is said to be shrinking and
workloads, work pressure and job insecurity increasing. All these pressures can affect
sickness and disability prevalence via two channels: first, so-called “niche jobs” become
rarer, leaving less employment opportunities for people with reduced work ability because of
health problems and disability. Second, increased work pressure and falling work
satisfaction themselves can create health problems of employees and lead to disability.
Table 1.11. Disability prevalence increases with age and lower educationTrends in self-assessed disability prevalence by gender, age group and educational attainment, various years
All (20-64) Gender Age group Educational attainment
Male Female 20-34 35-49 50-64Below
secondaryUpper
secondaryTertiary
Prevalence rate
Relative prevalence (overall prevalence rate = 100)
Australia 1998 12.8 101 100 49 92 191 163 77 50
2003 12.0 96 104 43 87 194 159 82 64
Luxembourg 2004 12.3 117 83 42 96 175 142 91 50
Spain 1995 12.1 94 106 33 77 229 . . . . . .
2004 11.7 94 106 47 87 199 147 58 49
United Kingdom 1998 14.6 100 100 53 91 183 128 69 44
2006 17.6 94 106 50 88 167 134 76 49
Source: See Table 1.10, Column C.
SICKNESS, DISABILITY AND WORK: BREAKING THE BARRIERS – VOL. 2 – ISBN 978-92-64-03815-8 – © OECD 200758

1. KEY TRENDS AND OUTCOMES
The impact of labour market restructuring on the actual work pressure for employees
is difficult to measure, and available objective indicators are inconclusive (Figure 1.11).
Changes in long working hours (as an indicator of workloads), for instance, were rather
small in the four countries. The share of temporary work contracts as a proxy for atypical
work and job insecurity has also remained fairly stable in all countries, as in the OECD area
as a whole. Job stability, measured through five-year job retention rates, has been
increasing in Luxembourg and remained very stable in Spain and the United Kingdom
– though the levels are below OECD Europe in the latter two countries.
Comparative evidence on levels and trends in perceived working conditions and
demands of work in EU countries suggests that the work intensity may indeed have
increased. Table 1.12 shows several indicators of perceived working conditions: cognitive
demands of work (items 1.a and 1.b), autonomy in the workplace (items 2.a and 2.b), work
intensity (items 3.a and 3.b) and work satisfaction (item 4). Neither demands of work in
terms of the complexity of tasks nor autonomy in the workplace as regards the order of
tasks and the speed of work have changed very much. On the other hand, work intensity
increased strongly in Luxembourg and Spain, in line with the EU average. This is less the
case in the United Kingdom, where working to tight deadlines (item 3.b) appears to be far
more widespread already than in the other two countries and the EU as a whole.
This finding is important in view of the fact that work intensity appears to be one of
the key factors for stress at work. Persons who work under conditions of high work
intensity report stress levels almost twice as high as those reported by people who do not
have to work at high speed or to tight deadlines (Table 1.13). The only other element that
appears to be as important or even more important for the perceived level of stress
resulting from work is work satisfaction: across the European Union, one in two workers
who are not satisfied with the working conditions in their main job report stress at work,
with results for the three countries ranging from 30% in Spain to 60% in Luxembourg.19
Figure 1.10. Steadily improving health status in all four countriesPotential years of life lost until age 70, per 100 000 of population, 1980-2004a
a) The calculation of potential years of life lost (PYLL) involves summing up deaths occurring at each age andmultiplying this by the number of remaining years to live up to a selected age limit. The limit of 70 years has beenchosen for the calculations.
Source: OECD Health Data 2006.
�����
�����
�����
�����
�����
����
����� ���� ��� ���
����
�����
���� ����
5>++ )*������� +*��%�!*�� ,&��" -"�����.�"��!%
SICKNESS, DISABILITY AND WORK: BREAKING THE BARRIERS – VOL. 2 – ISBN 978-92-64-03815-8 – © OECD 2007 59

1. KEY TRENDS AND OUTCOMES
Figure 1.11. Inconclusive evidence on selected changesin the working environment
Source: Panel A: OECD database on Usual Hours Worked; Panel B: OECD database on Temporary Work; Panel C: OECDdatabase on Job Tenure.
�
�
��
��
�
����� ���� ��� ���
��
�
�
��
�����
��
��
��
��
�������������
���� ��� ����������������
���� ��� ����������������
���*�����������������%�&''!� !!(
���. ����������������������%�&''!� !!(
/��0��� � ��������� �%�&''!� !!(
(�:!�;�"����?��!*���&���:��;
(�:������%&!���'�1!"���1�
(�:������"*���!����/����'����
)*������� +*��%�!*�� ,&��" -"�����.�"��!% 6$7 �������� 6$7 �$*�!&�
SICKNESS, DISABILITY AND WORK: BREAKING THE BARRIERS – VOL. 2 – ISBN 978-92-64-03815-8 – © OECD 200760

1. KEY TRENDS AND OUTCOMES
In sum, available objective evidence on changes in work requirements is somewhat
inconclusive. The changes are not big enough to explain sickness and disability trends, nor
are the directions of change always in line with those trends. Subjective evidence suggests
that work intensity has been increasing recently, and that work intensity is positively
Table 1.12. Increasing levels of perceived work intensity in European countriesPercentage of employed persons reporting specific working conditions, 2005 and changes since 1995a
Luxembourg Spain United Kingdom EU15
Level Trend Level Trend Level Trend Level Trend
1.a Main job involves complex tasks 64 = 39 = 56 – 60 =
1.b Main job involves learning new things 76 = 59 – 69 – 74 =
2.a Able to choose/change order of tasks 70 = 64 = 66 – 69 =
2.b Able to choose/change speed of work 75 + 65 = 69 – 71 =
3.a Job involves working at very high speed 23 +++ 23 +++ 19 = 26 +++
3.b Job involves working to tight deadlines 25 +++ 23 +++ 36 + 28 +++
4. Satisfied with working conditions in the job 86 – 81 = 92 + 84 =
a) Levels refer to year 2005. Trends refer to percentage changes 1995-2000: “+++” denotes an increase of more than20%; “+” denotes an increase of between 5% and 20%; “=” denotes changes between –5% and +5%; “–” denotes adecrease of more than 5%; “–-” denotes a decrease of more than 20%.
Source: OECD Secretariat calculations based on various waves of the European Working Conditions Surveys from theEuropean Foundation for the Improvement of Living and Working Conditions (2007a).
Table 1.13. Levels of perceived work-related stress vary greatly with work intensity and work satisfaction
Share of respondents reporting stress at work, according to various working conditions, 2005a
Luxembourg Spain United Kingdom EU15
Overall 30 19 12 25
Whether main paid job involves complex tasks
Yes 30 28 16 29
No 28 13 7 19
Whether main paid job involves learning new things
Yes 28 24 15 26
No 34 12 6 21
Whether respondent can choose or change the order of tasks
Yes 26 19 12 24
No 38 18 13 27
Whether respondent can choose or change the speed or rate of work
Yes 27 20 12 24
No 39 17 12 28
Whether the job involves working at very high speed
Yes 44 33 18 36
No 25 15 10 21
Whether the job involves working to tight deadlines
Yes 42 31 20 37
No 25 15 8 20
Whether respondent is satisfied with working conditions in main paid job
Yes 25 16 9 20
No 60 31 44 51
a) Don’t knows/refusals are omitted from calculations.Source: OECD Secretariat calculations based on 4th wave (2005) of the European Working Conditions Surveys from theEuropean Foundation for the Improvement of Living and Working Conditions.
SICKNESS, DISABILITY AND WORK: BREAKING THE BARRIERS – VOL. 2 – ISBN 978-92-64-03815-8 – © OECD 2007 61

1. KEY TRENDS AND OUTCOMES
correlated with work-related stress. Policy makers are facing a vicious circle. Heightened
requirements on the labour market seem to lead to more pressure and increasing work
intensity, which in turn may lead to health problems, sickness absence, disability and,
eventually, dropping out of the labour market. Once out of the labour market, however, the
absence of a job adversely affects health. Policies need to address this vicious circle.
1.7. ConclusionThe following facts emerge from the picture drawn in this chapter:
Economic and labour market status of people with disability
● Against the backdrop of very favourable macro-economic indicators in the four countries
under review, employment outcomes for people with disability are somewhat
disappointing. Just between one-third (Spain) and half of persons with disability
(Luxembourg) have a job.
● Employment rates of people with disability, however, have been increasing faster than
those of the total working-age population in the past years in three countries:
Luxembourg, Spain and the United Kingdom.
● Unemployment is higher among people with disability, and their unemployment rate
increased in Luxembourg and Spain.
● In the past five years, average disability benefits increased faster than average earnings
in Luxembourg and Spain, but lagged behind in Australia and the United Kingdom.
By 2005, average benefits stood at 50-60% of average net wages in Luxembourg and Spain
but at only around 20-30% in Australia and the United Kingdom.
● Taking income sources from employment, public benefits and other household
members together, average income levels of persons with disability are around 70% of
those of persons without disability in Australia and the United Kingdom, but close to
90% in Luxembourg and Spain.
● Relative poverty risks of persons with disability – defined in terms of low-income
incidence – are comparatively moderate in Luxembourg, high in Spain and the United
Kingdom, and extremely high in Australia. Moreover, these risks increased in Australia
and the United Kingdom in recent years.
● Employment is the single most important factor for reducing poverty risks for persons
with disability. In contrast, unemployment – much more than inactivity – multiplies the
poverty risk among persons with disability.
Costs of disability
● By 2005, spending on disability benefits stood at 1.1-1.2% of GDP in Australia and Spain
and 1.5-1.7% in Luxembourg and the United Kingdom and there was a trend toward
lower spending.
● Adding expenditures on sickness and occupational injury benefits as well as services
raises total public spending on incapacity-related schemes to 2.5% of GDP in Australia,
Spain and the United Kingdom, and to 3.6% in Luxembourg. Incapacity-related spending
is thus much higher than unemployment-related expenditures (except in Spain).
● The rate of disability beneficiaries among the working-age population is 3.5% in Spain,
5-6% in Australia and Luxembourg (roughly the OECD average of the late 1990s) and 8%
in the United Kingdom. Sickness absence is highest in Spain and lowest in Australia.
SICKNESS, DISABILITY AND WORK: BREAKING THE BARRIERS – VOL. 2 – ISBN 978-92-64-03815-8 – © OECD 200762

1. KEY TRENDS AND OUTCOMES
● In Australia and the United Kingdom, beneficiary rates have been increasing
considerably, especially during the 1990s. On the other hand, they decreased
substantially in Luxembourg since 1997, while they remained stable in Spain. Changes in
beneficiary rates during the past ten years have been mainly driven by younger age
groups in all four countries.
● Less than one in ten persons on a disability benefit assess themselves as not having a
disability in the United Kingdom, compared to a third of beneficiaries in Australia and
Spain and over half in Luxembourg. In turn, 70-80% of self-assessed people with
disability do not receive a disability benefit in all four countries.
● The share of people without any benefit or employment is 11% of all self-assessed
persons with disability in Australia and the United Kingdom, 16% in Spain and 20% in
Luxembourg. This concerns mainly women and older people.
The impact of exogenous factors
● During the past decade, trends in disability beneficiary numbers in the United Kingdom
were strongly influenced by population ageing, while in Australia ageing accounted for
only half of the increase in those numbers. In Luxembourg and Spain, despite similar
demographic pressures, actual beneficiary trends diverged downwards.
● Assuming constant age- and gender-specific beneficiary and prevalence rates,
population projections for the next four decades suggest a much higher demographic
pressure to disability policies in Australia and Luxembourg than in Spain and the
United Kingdom.
● If 42% of inactive persons with disability were to be integrated into employment over the
next 45 years (i.e. double the percentage for the European Union as a whole of those who
say they would wish to work), this would close the gap between the projected labour
force and total population growth by only up to one-third, except in the United Kingdom
where such a scenario would close the gap considerably.
● Increased labour market requirements may contribute to raising disability. But the
evidence on this as being a significant factor behind rising disability benefit rates is
mixed. During the past ten years, perceived work intensity increased significantly in
Luxembourg and Spain, with work intensity being a key determinant of perceived
work-related stress.
Notes
1. Most figures in this report refer to Great Britain only and do not include Northern Ireland.
2. The higher figure for the United Kingdom is likely to be partly explained by cultural differences or,possibly, a difference in the way the underlying survey questions are interpreted by therespondents. Similarly high disability prevalence rates are, e.g., also found in the Scandinaviancountries.
3. These employment outcomes refer to persons who self-assess their disability status via householdsurveys, according to standardised questions on health conditions. Not all of these people – in fact,only a minority (Section 1.4) – claim and receive disability benefits. Employment rates of disabilitybenefit recipients are much lower, ranging from 5% in the United Kingdom, to 18% in Australia andLuxembourg, and 25% in Spain (Chapter 3).
4. Generally the increasing unemployment rate of people with disability is an indicator of their largerdisadvantages in the labour market. However, it can also indicate that more people with disabilitywho are out of work are becoming economically active by seeking work.
SICKNESS, DISABILITY AND WORK: BREAKING THE BARRIERS – VOL. 2 – ISBN 978-92-64-03815-8 – © OECD 2007 63
1. KEY TRENDS AND OUTCOMES
5. The large differences in these percentages across countries partly reflect the cross-countrydifference in the age structure of disability benefit recipients, with relatively young beneficiaries inthe United Kingdom and much older beneficiaries – who are closer to the retirement age andtherefore less likely to be wishing to work – especially in Luxembourg.
6. That is, household income per person with a disability where income is adjusted for householdsize with an equivalence elasticity of 0.5. This means that total household income is divided by thesquare root of the household size, implying that, for instance, the income position of a four-personhousehold is considered “equivalent” to that of two single-person households.
7. Unlike the other three countries and those reviewed in OECD (2006b), official Australian data have beenmade available only on a gross rather than disposable (net) income concept, restricting cross-countrycomparison. Analyses on Luxembourg data for 2004, which are available on both gross and net incomebases, show that this affects absolute rather than relative indicators. Based on gross income, the totalaverage income of persons with disability would be 28% higher but the relative income levels (i.e. withregard to persons without disability) would remain practically unchanged, and this holds forsub-groups by labour force status and severity of disability. Additional evidence on net incomes forAustralia is also available from the 2005 HILDA survey: these data suggest a relative income level ofpersons with over those without disability of 78% (calculations provided by Mark Pearson, OECD).
8. For those countries for which data are available (Australia, Luxembourg, Spain), incomes ofpersons with severe disability are 5-10 percentage points below those with moderate disability.
9. Adjusting the income concept for these additional costs, they find that the low-income incidenceamong people with disability of working age (those below 60% of median income) would besignificantly higher, i.e. more like 45% rather than the 30% derived with the “traditional” measure.
10. The cut-off points for the 1st, 2nd and 3rd deciles in Australia correspond to about one-quarter,one-third and half of the average wage, respectively. The corresponding figures for Luxembourgare 43%, 55% and 65% of the average wage (OECD, 2007a).
11. The threshold of 50% of median income is often used in OECD and other internationalcomparisons as a yardstick for relative income poverty. The threshold of 60% is used by theEuropean Union as a comparative yardstick for “at-risk-of-poverty”.
12. Available evidence for Australia on a net income basis suggests that 27% of people with disabilityfell short of 50% median income and 35% of the 60% median threshold (HILDA 2005, calculationsprovided by Mark Pearson, OECD). This implies relative risk rates of 1.95 and 1.71 for thetwo thresholds, respectively. Results for risk rates by labour force status are almost identical tothose reported on the basis of gross incomes in Table 1.8.
13. Disability spending data include both income-replacement benefits and the main benefitsdesigned to compensate the extra costs of a disability (Mobility Allowance for Australia andDisability Living Allowance for the United Kingdom). Luxembourg and Spain do not have separatebenefits for this purpose but they have much higher income-replacement benefits and Spain alsohas a significant top-up payment for those who are severely disabled and in need of attendance.
14. The non-matching beneficiary rates in the United Kingdom can probably be explained by people onIncome Support with a disability premium not classifying themselves as disability benefit recipients.
15. Note that the five percentage points increase in disability prevalence in Australia under thisbroader definition is almost entirely due to an increase of self-assessed persons with disabilitywho do not draw disability benefits.
16. Only inactive persons in the case of Spain.
17. The long-run demographic assumptions are as follows. Total fertility rates (children per woman):Australia 1.7 (currently 1.72), Luxembourg 1.8 (1.65), Spain 1.4 (1.3), United Kingdom 1.74 (1.77);Female life expectancy at birth (years): Australia 88 (currently 77.03), Luxembourg 86.7 (81.4),Spain 87.9 (83.4), United Kingdom 87 (81.1); Net immigration (annual numbers): Australia 110 000,Luxembourg 2 800, Spain 101 600 (currently 507 500), United Kingdom 145 000 (currently 223 000).
18. National projections for the United Kingdom, based on a more sophisticated yet less comparablemodel of flows into and out of benefits, yield slightly different results.
19. National data in the United Kingdom suggest that, on average, each stress-related absenceinvolves 29 working days lost, making work-related stress the single most relevant cause ofworking days lost through occupational injury and ill-health (Health and Safety Executive, 2006). Anational survey for Luxembourg indicates a level of work-related stress of 25%; about half of thesurveyed population believes that the stress level is likely to increase in the coming years, and one-third that it will remain constant (Confédération syndicale indépendante du Luxembourg, 2006).
SICKNESS, DISABILITY AND WORK: BREAKING THE BARRIERS – VOL. 2 – ISBN 978-92-64-03815-8 – © OECD 200764

ISBN 978-92-64-03815-8
Sickness, Disability and Work
Breaking the Barriers – Vol. 2
© OECD 2007
Chapter 2
Evaluating Recent and Ongoing Reforms
All four countries have gone through comprehensive sickness anddisability policy reform in the past decade. In the United Kingdom andSpain, employment and benefit policy reform went largely hand-in-hand.In Australia, employment policy change preceded the more recent reformof the benefit system, while Luxembourg went through the reversesequence, with employment policies only being adjusted and expandedafter significant changes in the benefit system.
In Australia and Luxembourg, reform has primarily affected people witha partial reduction of their work capacity, who are now expected to remainin or enter the workforce and who are given more help to achieve this. InAustralia and the United Kingdom, the array of employment andrehabilitation programmes was extended considerably and new fundingmechanisms were introduced. The United Kingdom, in particular, is alsoinstituting new rights and responsibilities for the government and for newdisability benefit claimants. Reforms in Spain were largely aboutdecentralisation and concentration of responsibilities to improve servicedelivery and benefit eligibility management.
65

2. EVALUATING RECENT AND ONGOING REFORMS
Sickness and disability policy in Australia, Luxembourg, Spain and the United Kingdom
has seen many comprehensive changes in recent years. In all four countries changes
relate to the assessment procedure and include a range of structural and administrative
modifications. In some of the countries, reforms also involve a new way of dealing with
people with a partially-reduced work capacity (Australia, Luxembourg), creating a new
balance of rights and responsibilities for the authorities, as well as sick workers and
people with disability themselves (Australia, United Kingdom) and, to a lesser extent,
also for employers (especially Luxembourg). This chapter summarises and evaluates the
key elements of recent and ongoing reforms. Box 2.1 gives an overview of the countries’
sickness and disability schemes to help readers understand recent reform processes
better.
Box 2.1. Structure of the countries’ sickness and disability schemes – An overview
Sickness and disability benefit systems as well as rehabilitation and employmentsupport schemes differ across the four countries in many ways, reflecting different socialprotection traditions. The key characteristics are as follows:
How are disability benefits paid?
In Australia and the United Kingdom, disability benefits are flat-rate payments set ataround 25% of average earnings. In Australia, these payments are household means andasset-tested (unless a person is blind). In the United Kingdom, contributory disabilitybenefits are not means-tested, while non-contributory payments for those who do notfulfil the contribution requirements are. Both payments, however, are flat-rate and verysimilar in amounts and they both hinge on the same personal capacity assessmenttest. Luxembourg and Spain have social insurance-type disability benefits and acomplementary but minor non-contributory programme for those not entitled toinsurance benefits. The latter are administered by a different authority and using differentmedical criteria. Insurance payments in Luxembourg consist of a flat-rate and an earnings-related component. The first is paid in full for all eligible workers while the seconddepends on the contribution record with additional increments for the period between thedate of onset of disability and age 55 (if the disability occurs before age 55). Insurancebenefits in Spain are earnings-related but, provided contribution-criteria are fulfilled, thelength of the contribution period has no impact on the benefit level (i.e. benefits do notdepend on the age of onset of a disability). The systems of Spain and Luxembourg bothspecify minimum and maximum monthly benefit amounts, with average benefit levelsaround 50-60% of the average wage. Contrary to the other countries, the Spanish system alsooffers a partial disability benefit (for people unable to work in their usual occupation, i.e.“total” incapacity) which pays around 55% of a full disability benefit (“absolute” incapacity).In addition, Spain has a 20% top-up to a partial disability benefit for people over age 55 whoare not employed.
SICKNESS, DISABILITY AND WORK: BREAKING THE BARRIERS – VOL. 2 – ISBN 978-92-64-03815-8 – © OECD 200766

2. EVALUATING RECENT AND ONGOING REFORMS
Box 2.1. Structure of the countries’ sickness and disability schemes – An overview (cont.)
Who is covered by a disability benefit?
In Australia, residents between age 16 and the statutory age-pension age are eligible fora disability benefit. If the assessed disability began before residing in Australia, the personmust have ten years of residence in the country. Contributory disability benefits inLuxembourg, Spain and the United Kingdom are paid to all workers fulfilling thecontribution criteria and with earnings above a minimum threshold. Criteria range fromless than six months of covered earnings in recent years in the United Kingdom, to12 months of covered earnings in the past three years in Luxembourg, and at least five yearsof contributions in Spain. Self-employed persons are covered in all three countries, and thereare special systems for public-sector employees in Luxembourg and also for several othereconomic sectors (e.g. seamen, miners, armed forces) in Spain. Non-contributory schemesare residency based.
Who is covered by a sickness benefit?
In Australia, employees are entitled to ten days of continued wage payment per year, andin many cases these days can be accumulated over years as long as a worker stays with thesame employer. Casual employees, who comprise around one-quarter of the workforce,are not entitled to employer payments in case of sickness. In addition, there is a public,flat-rate and means-tested sickness allowance for residents over age 21 who have asickness or injury preventing work, provided they have a job to return to. The UnitedKingdom has privatised its statutory sick pay scheme during the 1990s. Today, following athree-day waiting period, employers are responsible for sickness payments for the first sixmonths of work incapacity for all workers above a lower earnings limit, after which peopletransfer onto disability benefit. Statutory payments are flat-rate, but many employerstop-up this payment during a varying period (three months is quite common) and often tothe level of the past wage. People not fulfilling the contribution and earnings requirementsfor statutory sick pay are entitled to a disability benefit from early on (so-called short-termincapacity benefit). In Spain, sickness cash benefits are paid to employed persons with180 days of contribution in the past five years and amount to 60% of insured earnings (75%from the 21st day). The benefit is paid from the 4th day and for up to 12 months, a periodwhich can be extended to 18 months. Benefits are paid by the employer through the 15thday, and employers normally also pay a full wage in the first three days. In Luxembourg, allactive persons are covered by sickness benefits without a minimum qualifying or workperiod. Benefits are paid up to 52 weeks and reimburse the full salary which the insuredperson would have earned. Blue-collar workers receive a publicly paid sickness cashbenefit from the first day, while for white-collar workers in the private sector the employerhas to continue the wage payment for the month in which the disease occurs and for thefollowing three months.
How are disability schemes financed?
In Australia, the entire social protection system is financed from general tax revenues,with an income tax system that is less progressive than that of the other three countriesand the OECD as a whole (OECD, 2007a). In the other three countries, non-contributorydisability benefits are also tax financed. Contributory disability benefits, on the otherhand, are predominantly financed from employer and employee contributions, at(roughly) equal shares in the United Kingdom and Luxembourg but with a much largershare for employers in Spain. The government contributes with an annual subsidy in Spainand a treasury grant to cover benefit expenditure shortfalls in the United Kingdom, while
SICKNESS, DISABILITY AND WORK: BREAKING THE BARRIERS – VOL. 2 – ISBN 978-92-64-03815-8 – © OECD 2007 67

2. EVALUATING RECENT AND ONGOING REFORMS
2.1. Australia: new participation requirements through welfare reformAustralia has undergone major changes in its disability policy over the past
twenty years. The system developed gradually from a passive benefit scheme to an active
labour market programme. With the most recent Welfare to Work reform, a further big step
was taken, leading to much the same treatment for all (newly) unemployed people
regardless of whether or not their work capacity is reduced. The strong support of most
stakeholders for the government’s reform agenda in combination with the currently very
tight labour market is a promising pre-condition for effective implementation of recent
and ongoing reforms.
A. Expansion of services and new funding mechanisms
Twenty years ago, Australia’s disability policy relied largely on passive instruments,
with a range of permanent benefits and very limited employment support for people with
health problems or disability. Rehabilitation services were established soon after World
War II, but the number of people serviced remained very low. With the Disability Services
Act in 1986, which outlined new rules regarding disability service provision and vocational
rehabilitation, the approach started to change. Due to opposition from the large service
providers, however, this act remained largely unimplemented (OECD, 2001). The 1991
Disability Reform Package and later reforms provided new labour market programmes and
additional targeted places for people with disability in existing programmes. Anti-
discrimination legislation set new standards in 1992 for both employers and public
agencies. This was complemented by Commonwealth-State-Territory Disability
Box 2.1. Structure of the countries’ sickness and disability schemes – An overview (cont.)
government revenues cover one-third of total contributory benefit spending inLuxembourg. None of the three countries has a contribution rate targeted at contributorydisability benefits alone; instead, contributions cover all kinds of contributory benefitprogrammes, including old-age, survivor, sickness and maternity benefits.
How are rehabilitation and employment supports organised?
Rehabilitation and employment support is organised differently in the four countries.Medical rehabilitation falls under the remit of health insurance in all countries and haslittle work focus. However, the United Kingdom has recently introduced work-focusedCondition Management Programmes outside the health insurance to bridge this gap and inLuxembourg vocational elements are increasingly used in the medical rehabilitationprocess. Vocational rehabilitation as such is largely inexistent in Spain and Luxembourg,while there are special structures in place for this in Australia and the United Kingdom.Similarly, there are special employment services available for workers with disability inAustralia and the United Kingdom, whereas in Spain and Luxembourg those people arehelped by the Public Employment Service. The financing differs accordingly. Vocationalrehabilitation and employment services in Australia and the United Kingdom are financedthrough general taxation, and providers are partly reimbursed on the basis of outcomes. InLuxembourg and Spain most available services are financed via unemployment insurancecontributions, topped-up by regional and ESF funds in the case of Spain.
More details on the countries’ benefit and tax systems can be found in the Annex ofChapter 4 (Table 4.A1.1).
SICKNESS, DISABILITY AND WORK: BREAKING THE BARRIERS – VOL. 2 – ISBN 978-92-64-03815-8 – © OECD 200768

2. EVALUATING RECENT AND ONGOING REFORMS
Agreements (the first in 1991) to delineate the roles of the Australian government and state
and territory governments in respect of the planning, policy setting and management of
specialist disability services.
More recently, the focus switched from programme expansion and increasing the
number of places available to improving the quality and outcomes of services. In this
regard, Australia is setting new standards for other OECD countries. In 1996, the
government announced reforms to disability employment assistance to enhance
opportunities for people with disability to take part in quality employment, more closely
match funding to support needs, link funding to employment outcomes and address
historical funding inequities. The key elements of the reforms were a legislated quality
assurance system and a case-based funding model. The quality assurance system,
introduced in 2002, implies that providers are audited and certified against prescribed
disability service standards, covering employment conditions, governance and prevention
of neglect and abuse. There is no funding for providers without respective certification.
General employment services for the unemployed were changed completely as
from 1998, in the course of the first Job Network contract. These general services are now
supplied by private (be it for-profit or non-profit) providers, and some Job Network
providers are specialised in providing services to people with disability. Before reform,
payments to providers were dominated by fixed per-client fees, but today funding is mostly
outcome-based – with outcomes judged in terms of 13 and 26 weeks of continuous
employment. Fees increase with the level of disadvantage and the duration of
unemployment of the jobseeker. After various start-up problems, the placement record of
Job Network providers has improved significantly in recent years (Grubb, 2006). This is
explained by the survival of the best providers in a newly established market, promoted by
final performance management through a star-rating system; increasing stability for
providers in the course of a progressively refined strategy; and the shift to predominantly
outcome-based funding.
The principles ruling the Job Network are currently being expanded to specialist
employment services for people with disability. Since mid-2005, the Disability Employment
Network (DEN) also operates on the basis of case-based rather than block-grant funding.
Fees are based on jobseekers’ support needs, as assessed by the Job Seeker Classification
Instrument (the larger the needs, the higher the fees), and their employment outcomes.
Similarly, from mid-2006, Disability Business Services providing employment assistance to
people with more severe disability have been funded under a case-based funding model.1
Again, funding is linked to the person’s support needs, as in this case assessed by the
Disability Maintenance Instrument, and employment outcomes. Vocational Rehabilitation
services (VR) are still predominantly provided by one public agency, but, as of mid-2006, a
proportion of these services is delivered through case-based funding contracts with
non-governmental organisations.
Finally, Australia is increasingly moving away from fixed or supply-driven
appropriation of employment services which substantially limited the scope for improved
labour market integration of people with labour market disadvantage. In the course of the
Welfare to Work reform, as of mid-2006 demand-driven DEN and VR services were
introduced for jobseekers with a part-time participation requirement. These are people
who have an assessed work capacity of 15 to 29 hours per week who are able to become
independent in the workplace with no more than two years of assistance. For this group,
SICKNESS, DISABILITY AND WORK: BREAKING THE BARRIERS – VOL. 2 – ISBN 978-92-64-03815-8 – © OECD 2007 69

2. EVALUATING RECENT AND ONGOING REFORMS
the employment services no longer have a cap on the number of places available at one
point in time.2 This new uncapped stream complements the existing capped stream in
DEN and VR services, which continues to provide assistance to those people with disability
who are assessed as likely to require ongoing support to retain employment after they have
found a job.
B. Increasing workforce participation and reducing welfare dependency
The recent developments in service provision must be seen in combination with
ongoing welfare reform aimed at increased workforce participation and lower welfare
dependency of four targets groups, including people with disability. For older workers and
long-term unemployed, participation requirements were tightened to improve work
outcomes. For people with disability (and for lone parents), better employment outcomes
are sought through a restructuring of income support. Recipients who are in a position to
look for work, including part-time work, are no longer entitled to the higher disability
benefit but only to a normal unemployment benefit with its stricter compliance rules.
The key elements of the Welfare to Work reform affecting people with a disability are
the following:
● There is no change for current recipients of a Disability Support Pension (DSP). They do
not lose their benefit nor are any obligations imposed. All support services are accessible
on a voluntary basis, subject to availability, but in this case a current and valid work
capacity assessment is required.
● New applicants are only entitled to a DSP if their work capacity is less than 15 hours per
week (rather than 30 hours pre-reform). Welfare to Work reform does not entail any
changes for this group with such a low work capacity.
● New applicants with a partial work capacity of 15-29 hours per week are only entitled to
the lower unemployment benefit. They have to look for suitable part-time work,
consistent with their remaining work capacity, and/or to participate in appropriate
services offered to them.
● All DSP applicants, except for those considered as “manifestly disabled”, have to undergo
a new Job Capacity Assessment (JCA). The JCA has a dual role: to establish the
individual’s work capacity and ongoing support requirements, and to identify barriers to
work and interventions needed to overcome those barriers. The assessor will refer and
in most cases book the applicant into their first appointment with a service provider
within a few days.
● Services to which jobseekers are referred can include Disability Employment Network or
Vocational Rehabilitation services, but also specialist or generalist services offered by a
Job Network provider as well as the Personal Support Programme (for those with special
non-vocational barriers). Within the service type, the jobseeker can choose the provider.
It is too early to tell what the impact of the Welfare to Work reform and of the demand-
driven provision of job-search and training support for those with a work capacity of 15 to
29 hours a week will be.3 One direct impact is a lower benefit payment – because these
people are now on unemployment rather than disability benefit – and higher tax rates for
those moving off benefit into low-paid work (Chapter 4). However, the new comprehensive
JCA is a promising step as an integrated assessment aimed at earlier intervention, and the
last step in a shift from a medical to a functional view of disability (Chapter 3). The dual
assessment and referral role could develop into its key strength. Success of recent reforms
SICKNESS, DISABILITY AND WORK: BREAKING THE BARRIERS – VOL. 2 – ISBN 978-92-64-03815-8 – © OECD 200770

2. EVALUATING RECENT AND ONGOING REFORMS
will rely heavily on the quality of the JCA, which is contracted out to a number of public and
private agencies, and the quality of services provided after that.
JCA is also a step towards a more similar treatment of unemployed with disability and
“standard” unemployed people with labour market disadvantage. This is mirrored by the
fact that there are several ways to get to a JCA. The new assessment is compulsory for
DSP applicants but also for unemployed persons who apply for a longer-term activity-test
exemption because of temporary work incapacity. As such, this may prove to be a useful
tool to identify and tackle health problems earlier. In addition, a JCA is an option in two
other instances: first, during the profiling process for normal jobseekers (which is done
through the Job Seeker Classification Instrument), and secondly, when clients indicate to
either Centrelink or an employment service provider that they have a medical condition or
disability that impacts on their work capacity or employment assistance needs.
2.2. Luxembourg: managing partial work capacity in a different waySickness and disability policy reform in Luxembourg during the past decade was
characterised by a changing approach towards people no longer able to perform their last
job but still potentially able to work in another occupation. A pessimistic assessment of
these changes will conclude that this has simply resulted in shifts between programmes.
People were first “parked” on disability benefits, then on long-term sickness benefits, and
are now on topped-up unemployment benefits. Indeed, people with partially-reduced work
capacity have not been able to move into, or stay in, work in significant numbers. The latest
change, however, has the potential to improve the situation.
A. Reducing the inflow into disability benefits
After unification of the pension system for blue-collar, white-collar and self-employed
workers in 1987, disability benefit rolls increased very rapidly. This was essentially the
consequence of a generous administrative practice. The 1987 law defined disability as the
inability to carry on the occupation of the last post or another occupation suited to the
person’s capacity. In practice, however, this was interpreted as including all individuals
unable to carry on in the occupation of the last post, so that people no longer able to do
their current job were systematically granted a disability benefit. As a consequence, by the
mid-1990s, Luxembourg had one of the highest beneficiary rates in the OECD.
Several court rulings in the mid-1990s criticised the lenient interpretation of the
eligibility criteria and firmly established that disability has to be defined as described in the
law. In 1997, the implementation of legislation eventually became much stricter. People
with partially-reduced work capacity were no longer granted disability benefits. Benefit
rolls started to fall again and public spending on disability dropped from 2.6% of GDP (1995)
to 1.8% (2001). However, those people with partially-reduced work capacity were not given
any real support to remain employed. This had two consequences: first, long-term sickness
absence grew, and secondly, after exhaustion of sickness benefit entitlement of one year,
those who were unable to find a new job were at risk of falling out of the social security
safety net.
The first plan, several years back, was to remedy this situation by introducing a partial
disability benefit for those with an occupational but no general disability – similar to the
current partial benefit system in Spain, France and Poland (OECD, 1999). This partial or
occupational benefit, paying 50% of a full disability benefit, should have been compatible
SICKNESS, DISABILITY AND WORK: BREAKING THE BARRIERS – VOL. 2 – ISBN 978-92-64-03815-8 – © OECD 2007 71
2. EVALUATING RECENT AND ONGOING REFORMS
with professional activities in another occupation up to a ceiling. This plan, however,
never materialised, mainly because the main trade unions disagreed, fearing that this
would not avoid the poverty trap for workers entitled to the new reduced benefit
(Wagener, 2003). Instead, based on the ideas developed by a tripartite working group, a
new proposal was prepared which was approved by parliament in 2002 and is in force
since October of that year.
B. Helping people with partial work capacity getting into work
The new law has two main objectives: to prevent misuse of disability benefits by
tighter medical control procedures, and to improve employment integration of those with
a partially-reduced work capacity unable to continue working in their current job through
a new redeployment procedure.
Tighter medical control and health status monitoring comes in at several points.
Under the new law, which applies to both new and current beneficiaries, a prolonged
sickness leave leads to a compulsory medical examination by the medical control service
of the social security authority. This examination, which takes place within the first four
months of sick leave, can have three outcomes. If the worker is found able to return to
work, benefit payments are stopped. If the worker is still found unable to work, sickness
benefit payment continues and another medical exam is scheduled for a later date. If the
worker is found likely to permanently remain unable to work, application for a disability
benefit is launched.
A second more comprehensive medical examination is carried out when the worker
applies for a disability benefit. At this stage, only two outcomes are possible, i.e. acceptance
or rejection. If the worker is found to be unable to work according to the 1987 definition, the
work contract is dissolved and disability benefit payment is started. In case of benefit
rejection, another medical assessment by the occupational medical service of the Ministry
of Health determines whether or not the person can return to the last job. If not, or if the
person has no valid employment contract, the new redeployment procedure is launched.
Companies with more than 25 employees are obliged to find an appropriate job for their
worker, be it a different job in the same company or the same job at reduced working hours
(internal redeployment). If employers can prove that this is impossible or would come at an
excessive cost, external redeployment is sought.
Employers and employees involved in an internal redeployment process are given
financial incentives. If the new job pays less than the previous one, the Labour Fund pays a
compensatory benefit to the worker which covers the difference (up to five times the social
minimum wage). In addition, the redeployed worker is protected from dismissal during
one year. The employer is entitled to special support (e.g. reimbursement of the outlays for
additional training and accommodation of the workplace), as well as special tax credits.
Furthermore, internally redeployed workers count against the company’s employment
quota for handicapped persons. On the other hand, another penalty equivalent to 50% of
the statutory minimum wage (payable for up to 24 months) may be imposed on employers
who fail to comply with their obligation to internally redeploy an employee with a
disability.
If internal redeployment is not possible, the worker is registered as unemployed with
the labour office and entitled to unemployment benefit while the search for suitable
employment continues. If such employment is found, workers with disability and their
SICKNESS, DISABILITY AND WORK: BREAKING THE BARRIERS – VOL. 2 – ISBN 978-92-64-03815-8 – © OECD 200772

2. EVALUATING RECENT AND ONGOING REFORMS
employers are entitled to the same benefits as in the case of internally redeployed workers.
Compensatory benefits are calculated according to the previous wage regardless of the
level of unemployment benefit paid in the interim. If the person could not be placed in
alternative employment during the legal duration of unemployment benefit payments (of
between one and, at most, two years), the worker is entitled to a waiting allowance, which
is paid at the level of a regular disability benefit. The worker has to remain available for any
placement attempts, and payment is stopped once a suitable occupation is found. This
new waiting allowance is not paid by the Labour Fund, but by the pension insurance.
Early evidence suggests that the number of sick workers returning to their previous
company has increased, while external redeployment has failed – noting that around
two-thirds of all cases going through the process fall in the latter category. In turn,
unemployment has increased and there is a great risk that structural unemployment will
permanently remain at a higher level. The longer-term effect of the reform is yet to be seen,
in terms of both employment integration and benefit applications. Being redeployed within
the same enterprise with fewer working hours, while maintaining one’s previous income,
could make application for a disability benefit even more attractive than in the past. This is
why the first element of the reform, the tightening of medical controls, is an important
complement to the new procedure. The anticipation of external redeployment into another
company and the uncertainty surrounding the entire process, on the other hand, might
make it less attractive for workers to go through the hassle of applying for a disability benefit.
For the society and the social security system as a whole, the key question for success
of the reform is the extent to which the currently poor outcomes of external redeployment
can be improved. The new policy entails a number of permanent additional expenses.
These could be more than offset by considerably lower spending on sickness benefits and
especially disability benefits, but only if work integration of people with partially-reduced
work capacity becomes more frequent.
2.3. Spain: decentralising and concentrating decision powersSpanish disability policy changed markedly in 1982, when integration of workers with
disability in the open labour market became a target for policy. Twenty-five years later,
however, the actual implementation of active policies is still lagging far behind and
integration in the open labour market remains the exception. On the benefit side, policy
implementation was more successful; long-term benefit dependency was reduced and
poverty levels have fallen. Both these outcomes are related to the accomplishment of two
administrative reforms starting some ten years ago and completed only recently, which
changed the disability policy setting considerably.
A. Devolution of responsibilities to the regional level
The decentralisation of responsibilities from the central level to the 17 autonomous
communities is perhaps the single most important change in Spanish policy making over the
past two decades. After a long period of asymmetric federalism, today all regions have
broadly the same responsibilities as regards the delivery of public goods and services. The
Spanish Constitution enumerates the powers that may be taken up by the regions, those that
are an exclusive competence of the central government, those that may be implemented in
tandem and those that may be delegated, in full or in part, to the regions (OECD, 2005a). Many
of those tasks that are key for a better labour market integration of people with disability fall
into the latter two groups, including labour market policies, social security, and training
SICKNESS, DISABILITY AND WORK: BREAKING THE BARRIERS – VOL. 2 – ISBN 978-92-64-03815-8 – © OECD 2007 73
2. EVALUATING RECENT AND ONGOING REFORMS
programmes for both the unemployed and the working-age population more generally. For
those shared or partially-delegated responsibilities to be executed as intended, considerable
co-ordination efforts across government levels are needed.
Decentralisation of labour market policies was completed only a few years ago. Most
of the powers of the national Public Employment Service (PES) were transferred to the
regional headquarters. These regional head offices now manage all employment
programmes that are delivered by their local agencies. Apart from payment of
unemployment benefits, the responsibilities left to the national PES are to develop and
disseminate overall strategies and guidelines to ensure coherent policies across Spain and
to distribute funds to the regional offices. Regional strategies and any more specific
regulations and measures have to be developed by the regional PES headquarters. Actual
policy implementation is thus an exclusive responsibility of the autonomous communities.
Presumably, laws are implemented quite differently across regions, but as regional
implementation is not monitored systematically, little is known country-wide about the
extent to which state laws are enforced.
The decentralisation of employment policy contrasts with the central management of
the National Social Security Institute (INSS) (see below). Through the different policy
execution levels, indispensable collaboration between these two institutions has become
even more difficult. While a special Working Group (with representatives from the regional
PES offices) has been established to mediate problems across different PES levels, an
institutional interface between the PES and the INSS is lacking. More particularly, the INSS
is not responsible for activation measures or vocational rehabilitation and people are not
referred to the PES, nor does the PES refer people with health problems to the INSS. This
makes the Spanish situation quite different from that in many other countries which are
in the process of merging these two institutions.
The decentralisation of responsibilities was accompanied by a reform of financing
which aimed to increase the regions’ self-sufficiency and fiscal responsibility. However, the
devolution of spending and revenue powers remains asymmetric. In 2002, for instance,
some 45% of total public expenditure was managed at the sub-national government level,
but only about 30% of all government revenues were collected at this level (OECD, 2004a).
This funding mismatch is most evident in one area of disability policy: non-contributory
disability benefits are financed by the central government but managed at the regional
level. Reviewing the invalidity status to determine eligibility for such a benefit is carried out
by the health authorities of the autonomous communities (Chapter 3). Theoretically, this is
an incentive for the regions to shift beneficiaries with low employment potential from
social assistance rolls (which are costly for the regional administration) to non-
contributory disability benefits (the costs of which are covered by the central government),
although available data do not support this. Similarly, financing structures imply that the
fiscal consequences of failure of regional labour market policies are to a large extent borne
by the central government.
B. Concentration of benefit matters at one single authority
On the benefit side, recent policy was driven by attempts to reduce the wide use of
sickness and disability benefit schemes. With a major organisational reform, back in 1997,
all disability benefit matters were transferred to the INSS. Since then, disability is no longer
assessed by general practitioners but by a group of experts from the disability assessment
team, a newly founded INSS body. This team assesses the person’s work ability on the
SICKNESS, DISABILITY AND WORK: BREAKING THE BARRIERS – VOL. 2 – ISBN 978-92-64-03815-8 – © OECD 200774

2. EVALUATING RECENT AND ONGOING REFORMS
basis of the available medical files and a special medical assessment by one of the
(currently) 400 INSS doctors. Ultimate benefit decisions are taken by benefit administrators
in the 52 provincial branches of the INSS, usually following the advice of the national
assessment team.
But the responsibility of the INSS goes much further than this. The stricter assessment
process, coupled with a reduction in benefit levels and a change in the eligibility criterion
for a partial disability benefit, has indeed helped to avoid an increase in beneficiary
numbers in times of rapidly declining unemployment. However, it could not stop sickness
absences from increasing, although stricter sick leave controls were also enacted in 1997.
Today, INSS also has exclusive responsibility for sickness absence controls, and this
function is nowadays carried out very rigorously. In 2004, a new sub-department at INSS
was established with the sole purpose of better monitoring and reducing absence rates. A
new INSS monitoring tool (ATRIUM), with daily updated complete individual sickness
absence histories, allows online selection of cases for reviews on the basis of “longer-than-
expected” recovery phases (Chapter 3). In addition, in 2005 a general absence control was
put in place when the duration of absence was greater than six months.
In order to reduce sickness absence rates more effectively, INSS increasingly operates
on the basis of bilateral agreements with autonomous communities, big employers,
hospitals and other actors. For instance, recently INSS has signed pilot agreements with
three autonomous communities (Extremadura, Castille-La Mancha and Castille-León) to
pay special attention to the 14 most frequent sickness absence causes. INSS is setting aside
a certain budget to ensure that the regions tackle these pathologies more forcefully.
Through those funds, special primary health care is being offered by the regional public
health service, with financial rewards for general practitioners putting this programme
into operation.
Available data suggest that these efforts are having some impact. The annual rate of
growth in total sickness benefit spending, which peaked in the year 2003/2004, has
dropped continuously since (spending increased by almost 15% in 2003/2004, but by only
6% in 2006/2007).
2.4. The United Kingdom: rebalancing rights and opportunitiesSickness and disability policy in the United Kingdom has been changing rapidly. In the
past decade, the country has made a big step away from what used to be a very passive
system mainly designed to pay benefits to people out of work. Change was initiated in the
mid-1990s, with new elements on both the benefit system side (incapacity benefit
replacing the old invalidity and sickness benefit) and the employment policy side (anti-
discrimination legislation replacing the never-enforced employment quota scheme). Since
then, the government has initiated a range of policies with good-practice elements of
various kinds and ongoing reform will add yet more of these elements.
A. Switching to a more active policy approach
The employment part of the Disability Discrimination Act (DDA) came into force
in 1996. The new focus of policy is to enable persons with disability to function fully in the
regular labour market. Initially the DDA only applied to employers with 20 or more
employees, but it was gradually extended and now covers all companies irrespective of
their size. In parallel to this, the New Deal for Disabled People (NDDP) was developed, the
SICKNESS, DISABILITY AND WORK: BREAKING THE BARRIERS – VOL. 2 – ISBN 978-92-64-03815-8 – © OECD 2007 75

2. EVALUATING RECENT AND ONGOING REFORMS
first attempt to provide a national network of Job Brokers to help people with health
conditions and disability move from disability benefits into sustained employment. The
NDDP was piloted in 1998 and extended nationally as of 2001. By mid-2004, nearly
100 000 people had registered with the entirely voluntary NDDP programme.
Within NDDP, brokers have used a variety of approaches, including unpaid work trials
and temporary job-match payments for part-time work. A strong focus was put on
individual case management, sometimes with unusually low caseloads of less than
50 jobseekers per caseworker. This tailoring and case-management approach is currently
further extended in the course of the Pathways to Work reform (see below), through which
each claimant is looked after by a specially-trained Incapacity Benefit Personal Adviser.
The advisers follow their clients through the whole process and help them find the best
possible service and Job Broker. A second key element of the NDDP system is the outcome-
based funding of job-brokering services, with service providers receiving basic fees for
placements and additional fees for more sustainable job outcomes (Chapter 5).
Merging the Benefits Agency and the Employment Service, starting in 2002, was
another step towards a streamlined and more integration-oriented approach. This new
agency, Jobcentre Plus, operates on a far more customer-oriented basis and provides a
single point of delivery for jobs, benefits advice and support for people of working-age. As
a result, the practice of shifting people around – e.g. from unemployment to incapacity
benefit and vice versa – has become less common.
The overall impact of these employment-focused measures is difficult to assess, but
available evidence shows that employment rates of people with disability have increased
during the past few years. A major impact of the reforms is the change in signal for people
with disability willing and able to work. More detailed programme evaluation suggests that
of those who participated in the NDDP programme, 35% had moved into work, and that of
those who did, the majority has done so within three months of registration with NDDP
(Orr et al., 2007). However, these results should be seen in context: no more than around 2%
of the eligible population registered for the NDDP programme. Activation spending would
therefore have to be increased considerably in the future to make a real difference through
this route.
B. Redefining rights and responsibilities
Many people with disability can and wish to work, in the United Kingdom more than
elsewhere. With the government offering new, highly individualised and better
streamlined support, it becomes more reasonable to reconsider participation requirements
for people on disability benefits. Requirements of this kind and work tests have been
strengthened considerably in the past 15 years for unemployment benefit recipients. This
has contributed to a fall in unemployment but, possibly and plausibly, also the continued
increase in disability benefit numbers. The most recent and still ongoing Pathways to Work
incapacity benefit reform is a first step towards establishing a new balance of rights and
responsibilities also for incapacity benefit claimants.
The main feature of Pathways to Work at this stage is a series of six monthly and
mandatory work-focused interviews starting eight weeks after the benefit claim. These
interviews are led by the incapacity benefit adviser in the Jobcentre Plus office and result
in a personal action plan.4 In the course of Pathways, a range of programmes can be
accessed known as the Choices package of interventions to support return to work. Choices
SICKNESS, DISABILITY AND WORK: BREAKING THE BARRIERS – VOL. 2 – ISBN 978-92-64-03815-8 – © OECD 200776
2. EVALUATING RECENT AND ONGOING REFORMS
include the existing NDDP programmes but also new instruments such as work-focused
Condition Management Programmes which are developed jointly with the local National
Health Service. Pathways started as a pilot in late-2003 and is currently being rolled out
nationwide, a process which will be complete by April 2008.
So far, Pathways to Work primarily targets new disability benefit customers, and the six
interviews are the only mandatory element of the process. Any action taken in response to
this work-focused dialogue is still non-compulsory. However, people already receiving a
disability benefit can volunteer to go through the Pathways process and would have access
to the whole range of interventions available through the Choices package. In additional
pilots, Pathways to Work has been extended, on a mandatory basis, to some existing
incapacity benefit customers; in a first stage to people whose benefit claim started in the
two years immediately prior to the rollout of Pathways and later on including those whose
claim started up to six years before as well. For these pilots, only three mandatory
interviews are foreseen.
Quantitative evidence on the impact of Pathways suggests that for those participating
in the pilots, the chances of being in employment 18 months after starting the benefit
claim are increased by 7 percentage points (Bewley et al., 2007). This confirms earlier
evidence from the first Pathways cohorts (Adam et al., 2006). The main question now is the
extent to which the Pathways process should be extended by further strengthening the
mandatory elements. There is a good chance that forthcoming welfare reform will go one
step further by introducing a requirement for most new customers to undertake some form
of work-related activity (this is planned to be introduced as resources permit). Yet another
question is the extent to which mandatory elements should be introduced for all or some
existing recipients as well. Currently, there are no definite plans to migrate existing
customers to the new scheme.
C. Improving assessments and work incentives
Making work pay is an important element of the potential success of the new
approach. The Disabled Person’s Tax Credit, a wage top-up for people with disability in low-
paid employment, was introduced in 1999 and merged into the Working Tax Credit in 2002.
However, take-up of the disability element of the Working Tax Credit is very low. Without
claiming the credit, only an estimated one-third of all incapacity benefit claimants would
gain financially from moving into work at 16 hours per week, at the minimum wage
(Blackman, 2006). But even one in five of those claiming the credit would not be better off
upon starting to work, showing that there is further room for improving work incentives.
Alongside Pathways to Work, a new and better-promoted though temporary earnings
supplement was introduced for incapacity benefit recipients who move into paid work.
This Return-to-Work Credit (RTWC) is available for a maximum of 52 weeks for those who
have been receiving benefits for at least 13 weeks and have found a job of no less than
16 hours a week earning no more than GBP 15 000 a year. RTWC has been introduced
stepwise since 2003 and currently covers one-third of the country. Early evidence suggests
that the take-up of this credit is not large but that workers at least do not seem to return to
benefit in large numbers after exhaustion of the entitlement, i.e. after one year (Corden and
Nice, 2006).
SICKNESS, DISABILITY AND WORK: BREAKING THE BARRIERS – VOL. 2 – ISBN 978-92-64-03815-8 – © OECD 2007 77

2. EVALUATING RECENT AND ONGOING REFORMS
Ongoing reform is likely to change the incentives structure for incapacity benefit
recipients more drastically. A comprehensive welfare reform proposal presented in early
2006 has now been passed into law through the Welfare Reform Act 2007 (see also DWP,
2006). It includes a broad range of measures in several areas. In terms of sickness and
disability policy, the key proposal is the introduction of a new Employment and Support
Allowance, which will replace both incapacity benefit and means-tested Income Support
on grounds of disability from 2008 on. The new allowance will consist of three elements:
i) a basic rate, equal to Jobseekers Allowance; ii) a top-up for those fulfilling their activity
requirements; and iii) a top-up for severely hampered persons who are exempt from
activity requirements (these are estimated to account for 10-20% of all customers). The
level of these top-ups, which are mutually exclusive, is yet to be determined. Moving from
unemployment to disability benefit will be less attractive and engaging in work and work-
related activity will pay more than it does today.
A complementary key element of the forthcoming welfare reform is a change in the
assessment procedure. The United Kingdom’s well-structured Personal Capability
Assessment (which was introduced in its current form in 1999) is seen as good practice by
many OECD countries. However, it is no longer adequate for the range of issues it ought to
address. It is a standardised objective assessment of functional limitations resulting from
physical and/or mental health conditions and disability, but it does not measure inability
to work. The main features of the new assessment will be a substantially revised
assessment of mental health, together with some changes to the assessment of physical
conditions, and a new work-focused assessment which will focus on individual’s
capabilities and the interventions which may help them to return to work.
2.5. The likely impact of recent and ongoing reformSickness and disability policy reforms during the past twenty years are essential
explanatory factors for the current outcomes in each country. OECD (2003) developed two
indices of policy – one on integration policy and the other on compensation policy – in order to
illustrate and compare countries’ policy stances and to assess broad trends in policy
development (Box 2.2).
According to this policy typology, compared with the OECD average in 2000, Luxembourg
had a relatively less developed integration policy, with Australia, Spain and the United
Kingdom all being close to the OECD average on this parameter (Figure 2.1, Panel B).
Australia, Luxembourg and Spain had a relatively more generous and/or accessible disability
benefit system than the average, while the opposite held for the United Kingdom.
For three of the four countries, Australia, Luxembourg and the United Kingdom,
Figure 2.1 (Panel A) shows a spectacular policy trend, both before and after the year 2000,
as regards the direction and the level of change. Luxembourg and Australia have gone
through a rather different sequence of policy transformation. In Australia, employment
policy change preceded benefit reform. Integration policy was broadened considerably in
the 1985-2000 period, with an estimated 17-point increase on the 50-point integration
policy dimension. Compensation policies remained largely unchanged in this fifteen-year
period but changed significantly in the past seven years. Luxembourg went through the
reverse sequence, with employment policies only being adjusted and expanded after
significant changes on the benefit system side. The latter consisted of changes in the
implementation of regulations as well as in regulations themselves.
SICKNESS, DISABILITY AND WORK: BREAKING THE BARRIERS – VOL. 2 – ISBN 978-92-64-03815-8 – © OECD 200778

2. EVALUATING RECENT AND ONGOING REFORMS
In the United Kingdom and Spain, employment and benefit policy reform went largely
hand-in-hand. This is unusual in the OECD context, with reforms in many countries being
characterised by a clear strengthening of integration policy elements and a relative lack of
reform on the compensation policy dimension (OECD, 2003). All four countries seem to
have gone through much more change in benefit programmes in the form of stricter and
better-controlled access than the typical OECD country. This should help taking advantage
of new employment policies and procedures and to avoid that, in response to restricted
access to other benefits (such as unemployment, social assistance or early retirement),
disability benefits are used as a last-resort income support. This bolsters the positive work
focus which governments have been trying to follow and which is in the interests of the
majority of those on the benefit.
Despite recent reforms, however, Luxembourg and Spain still belong to those OECD
countries where the compensation policy score exceeds the integration policy score
– noting that this typology says little about both the implementation of regulations and the
effectiveness of policies. Such a situation was characteristic for almost all OECD countries
in 1985, but ever fewer of them today. This suggests that there is room for further policy
change in those two countries in particular. The United Kingdom has recently become an
Box 2.2. Illustration of countries’ policy stances and trends
So many different dimensions of policy matter when assessing the overall stance of asystem that it is easy to get swamped in details. This is particularly the case when lookingat trends over time. In order to get a reasonable overview of what is happening in policyboth over time and across countries, an index of the various policy parameters can beuseful.
Indices in two dimensions have been developed in OECD (2003). The first is the level ofcompensation. The index of compensation takes into account ten policy parameters:i) coverage of the benefit system; ii) the minimum disability level; iii) the disability levelneeded to get a full disability benefit; iv) the maximum benefit level at average earnings;v) the permanence of benefits; vi) the medical assessment; vii) the vocational assessment;viii) the sickness benefit level; ix) the sickness benefit duration; and x) the unemploymentbenefit level and duration in comparison with disability benefits. Each country is rankedon a scale of zero to five on each of these categories. No attempt is made to assess whichof these categories is most important; all have equal weight. A country which has a hightotal score in the compensation dimension is “generous” in supporting people withdisability who are not working.
The second dimension is that of integration. Again, ten sub-dimensions are taken intoaccount: i) access to different programmes; ii) the consistency of the assessmentstructure; iii) employer responsibility; iv) supported employment programmes;v) subsidised employment programmes; vi) the sheltered employment sector;vii) vocational rehabilitation programmes; viii) the timing of rehabilitation; ix) benefitsuspension regulations; and x) work incentives. As with the compensation dimension,each of these sub-dimensions is rated from zero to five and assigned equal weight. Acountry which has a higher integration score is one which has a more active policy inensuring that people with disability can find work. (Details of the points attached to eachaspect of policy and the policy stance of 20 OECD countries in 1985 and 2000 can be foundin OECD, 2003).
SICKNESS, DISABILITY AND WORK: BREAKING THE BARRIERS – VOL. 2 – ISBN 978-92-64-03815-8 – © OECD 2007 79

2. EVALUATING RECENT AND ONGOING REFORMS
opposite example, with a much higher integration than compensation score, i.e. a strong
employment orientation coupled with a stringent benefit system. Such setup bears
considerable potential for much better employment outcomes in the future.
Notes
1. In Australia, Disability Business Services provide “supported employment” (referred to as shelteredemployment in most other OECD countries) to people with disability in an environment thatmatches the open labour market as much as possible.
2. However, employment services are constrained or indirectly capped in Australia by the level of thefee per client: providers, who are subject to Star Rating, have incentives to not provide assistancethat will have no impact on the client’s employment prospects.
3. The Australian government is currently evaluating the effects of the Welfare to Work reforms onpeople with disability, including the question if more of them are assisted into employment, thusreducing their reliance on income support and, thereby, raising their incomes and improvingwell-being and self confidence. Early analysis indicates that there has been a significant increase inthe proportion of people with partial capacity to work leaving income support since requirements tolook for part-time work were introduced through the Welfare to Work reforms in July 2006.
4. At the initial Pathways interview in the United Kingdom, a screening tool is applied to screen outthose who are more likely to leave benefit without additional help. These people do not have toattend further interviews. Similarly, people with more severe health problems are not required toundergo the full assessment and process (Chapter 3). However, all claimants are entitled toparticipate in the programmes on offer or to have further interviews on a voluntary basis.
Figure 2.1. Comparing sickness and disability policies across time and countries
Source: Secretariat update based on OECD (2003), Transforming Disability into Ability, Paris.
�� ��
�
�
�
�� � �� � � ��
)-,�����
)-,����)-,����
+-@�����+-@����
+-@����
49������
49�����
49�����
$,5�����
$,5����
3"�������!"�&!��1'�1!%&!"�"� 3"�������!"�&!��1'�1!%&!"�"�
7!%&�"����!"�&!��1'�1!%&!"�"� 7!%&�"����!"�&!��1'�1!%&!"�"�
+�/����"������A� ��������'�&!��1'��'&!�!�'��"�����/!*��1!*"��������!*"������<������"�������������"������A� ��������'�&!��1'��'&!�!�'��"���6$7 �1!*"��������!*"�����
)*�������)*�����
9����*%7�"���
�"%��;
8��"1�
4��%�"'
3���'+*��%�!*��
B���1!
��������"���!�:�'
5!��"�
5!��*���
,&��"
,:���"
,:��C����"�
=*�;�'
-"�����.�"��!%-"����,�����
6$7 ��
SICKNESS, DISABILITY AND WORK: BREAKING THE BARRIERS – VOL. 2 – ISBN 978-92-64-03815-8 – © OECD 200780
ISBN 978-92-64-03815-8
Sickness, Disability and Work
Breaking the Barriers – Vol. 2
© OECD 2007
Chapter 3
Absence Monitoring and Assessment of Disability
Disability benefit recipiency in most cases is a permanent status fromwhich there is little movement back into employment. This is why policiesaim, and should aim, to reduce the inflow into such benefits. For this to beeffective, it is important to intervene in the early phase of a healthcondition to avoid that it develops into a more serious problem, eventuallyleading to a disability benefit claim. This in turn requires comprehensiveevidence on the pathways into disability, but such evidence is scarce andpartial. It is vital to better identify and assist people with health problems,be it at work, during a sickness absence spell or during unemployment.
Spain and Luxembourg are two good-practice examples with regard tosickness absence monitoring. Such early monitoring is lacking in Australiaand the United Kingdom, but these two countries are in the process ofdeveloping their disability assessment into a strong work capacityassessment tool. In addition, Australia is now better able to discoverhealth-related work barriers of the unemployed, a key issue when somany people are switching from unemployment onto disability. This isalso important because the recent tightening of eligibility criteria forpeople with partially-reduced work capacity, who are now pushed ontounemployment benefits, can only help achieving better outcomes if goodservices and support systems are in place. The example of Luxembourgshows that such an approach can indeed reduce disability benefitdependency and improve work retention, but also that structuralunemployment is likely to increase as well.
81
3. ABSENCE MONITORING AND ASSESSMENT OF DISABILITY
Disability beneficiary rates are high in Luxembourg, Australia and the United Kingdom,
much higher than these countries’ rates of unemployment, and they have continued to
increase until recently in the latter two countries (Chapter 1). This is because, first, people
tend to remain on these benefits once they get them, and secondly, the inflow into
disability benefits continues to be high. This chapter addresses policies in place or needed
to curb the inflow into disability benefits so as to obtain a sustainable reduction in the
number of people receiving such benefits.
The structure of the chapter is as follows. Section 3.1 gives an overview on how
sickness absence and the inflow into disability benefits has developed during the past
decade, and identifies the most frequent pathways into these benefits. Based on this
evidence, Section 3.2 emphasises ways of, and the need for, early identification of health
problems and, where needed, early intervention. It distinguishes policies targeting sick
workers and those aimed at unemployed people with health problems. Section 3.3 looks at
ways of assessing the right to disability benefits and emphasises the importance of a sound
medical and vocational process to deal with emerging health conditions such as mental
illness. The section ends by discussing how countries are dealing with people with
partially-reduced work capacity.
3.1. Inflow into disability: what do we know?
A. Evidence on inflows into disability
The take-up of disability benefits over the past five to ten years varies substantially
across the four countries (Figure 3.1, Panel A). Inflow rates to contributory disability
benefits have been low and constant in Spain, while they have been falling slightly in the
other three countries (more substantially in Luxembourg over 1996-99), but from higher
levels. Despite this fall in inflow rates in Australia, Luxembourg and the United Kingdom,
however, levels continue to be much higher than in Spain.1 On the other hand, Spanish
unemployment rates are substantially higher compared to the other countries and may
therefore include people eligible for disability benefits in other countries.
Inflow rates of women are consistently lower than those of men (Figure 3.1, Panel B).
This gender gap has narrowed over time in the three countries for which gender-specific
information is available, but is still wide, especially in the United Kingdom.
The impact of disability benefit reforms
Reforms in some of the countries may have helped to reduce the inflow rates. The
Australians Working Together package, introduced in 2002, provided a better assessment of
benefit claims. The announcement of stricter eligibility criteria in 2001 most certainly
resulted in a larger number of claims (and grants) the same year.2 Since 2002, the number
of newly-granted benefits has fallen. Inflows are expected to continue to fall as an effect of
the 2006 Welfare to Work reform.
SICKNESS, DISABILITY AND WORK: BREAKING THE BARRIERS – VOL. 2 – ISBN 978-92-64-03815-8 – © OECD 200782

3. ABSENCE MONITORING AND ASSESSMENT OF DISABILITY
Changes in Luxembourg started in 1996 when a series of court rulings eventually lead
to a stricter implementation of legislation. However, it was not until 2002 that the disability
benefit system itself was changed. Developments after 1996 meant that people able to
work, even if not in their previous job, were no longer granted a disability benefit. This
change cut inflow numbers in half over the following three years and these have ever since
remained stable at around five per thousand.
Spain and the United Kingdom have not yet made any major changes to their benefit
schemes. However, the assessment process in the United Kingdom has undergone several
changes since its introduction in 1990. The country is also in the process of introducing a
differentiation between people who are severely disabled and those with severe limitations
but only partially-reduced work ability (see Chapter 2 for a detailed description of the
reform process in the four countries).
Benefit recipiency numbers have so far only fallen in Luxembourg (Chapter 1, Figure 1.8).
The much smaller inflow drop in Australia and the United Kingdom has been more than
compensated by the increasing time people spend on disability benefits. Currently, people
are, on average, in receipt of disability benefits between six and eight years, depending on
the country (Table 3.1). Around one-third of all disability beneficiaries have been recipients
for more than ten years.
The recent trend of a growing share of young people moving into disability benefits
has over the past five years extended the average duration of benefit dependency by one to
two years. If this trend continues, average duration will increase further in the future
because people tend to stay on disability benefits until the age at which they transfer to an
old-age pension (Chapter 5).3
Figure 3.1. Inflows into disability benefits are falling and the gender gap is closingInflows into disability benefit per thousand of the working-age population, 1996-2005
a) Data refer to contributory pensions only but include some people over age 65. This is because a right to claimdisability pensions persists for those older people who do not fulfil the retirement pension eligibility criteria (thisgroup accounts for about 1% of the total inflow).
b) Data refer to the (contributory) Long-term Incapacity Benefit only.c) Data refer to Incapacity Benefit, Severe Disablement Allowance and Income Support.
Source: DEWR for Australia, IGSS for Luxembourg, INSS for Spain, and DWP Work and Pensions Longitudinal Studyfor the United Kingdom.
�
��
�
�
�
����� ���� �� ���
��
���
���
���
����� ������� ���� ��� ��� ���� ���� �� ����� ������� ���� ��� ���
5�"���9��1�������� �������� ��� ���2 ����� �
)*������� +*��%�!*��,&��"� -"�����.�"��!%�
)*������� +*��%�!*��-"�����.�"��!%�
5�"���)��������������������������� � ����%�� ����������
SICKNESS, DISABILITY AND WORK: BREAKING THE BARRIERS – VOL. 2 – ISBN 978-92-64-03815-8 – © OECD 2007 83

3. ABSENCE MONITORING AND ASSESSMENT OF DISABILITY
Regional variation in disability
Significant regional variation in inflow rates into disability benefits is found in many
OECD countries, including Australia and the United Kingdom. At least to some extent, this
results from the discretion of the officer in the local or regional office of the responsible
authority. However, regional labour market conditions also play an important role for the
inflow into disability benefits, as can be seen from comparing variations in
unemployment-population rates with those in disability inflow rates (Figure 3.2): regions
with high unemployment tend to have more disability beneficiaries.
Weak economic performance of a region appears to raise inflows into disability
benefits. Health differentials, however, may not be the main driving factor behind this
empirical correlation. The situation in the United Kingdom, beginning in the mid-1980s, is
a good example of this. During this period, when coal mines started to close down, people
Table 3.1. The time people spend on disability benefits is increasingAverage duration of disability benefit receipt in years, 2000 and 2005
Australia Luxembourg United Kingdom
Men Women Total Men Women
2000 6.9 7.1 6.6 4.1 4.0
2005 8.3 7.9 7.6 6.0 6.0
Share of disability benefit recipients with benefit duration of ten years or more (in %)
2005 32.4 30.9 41.2 28.9 28.1
Source: DEWR for Australia; IGSS for Luxembourg; and DWP Work and Pensions Longitudinal Study for the UnitedKingdom.
Figure 3.2. Disability inflow rates and unemployment-population ratios are highly correlated
Differences in percentage from the overall rate in the country, 2005a
a) The correlation coefficients of the regional deviations from the overall mean between disability inflow rates andunemployment-population ratios are close to 0.8 in both Australia and the United Kingdom (in the latter case onlyif the very special region “London” is excluded).
Source: DEWR for Australia and DWP for the United Kingdom.
��(
��
�
�
#�
#��
#��
��(
��
�
�
#�
#��
#��
��������'��"/�!: -"�%&�!'%�"��&!&*����!"�����
)*��
�����
"7�
&���
�=�
����!
�'
��:
�,!*
��D
����
�!�
����
"=�
����!
�'
E*�
�"��
�"�
,!*�
��)*
����
���
=��%
�"��
F�1�
!���
D��
���"
)*��
�����
��������
$���
�B��
��"�
�
,��� ��-������
$���
�!/�$
"���
"�
+!"�
!"
�!�
���$
���
�!�
���D
���
,1!�
��"�
,!*�
��$�
��
,!*�
��D
���
D��
��
D��
��B��
��"�
�
>!�;
�����
��"�
0*%
����
���
���(
SICKNESS, DISABILITY AND WORK: BREAKING THE BARRIERS – VOL. 2 – ISBN 978-92-64-03815-8 – © OECD 200784

3. ABSENCE MONITORING AND ASSESSMENT OF DISABILITY
did not move to unemployment benefits but rather to sickness or disability benefits. One
explanation was that people may have had health problems prior to the close down of the
mine, but it was not until their job disappeared that the condition became a relevant health
issue.
B. Evidence on sickness absence
Trends in sickness absence over the past decade
Levels of sickness absence, measured as the share of employees absent for a whole
week, are also quite different across the four countries. In the United Kingdom, at close to
2%, for most of the period absence rates appear to be higher than in the other countries
(Figure 3.3, Panel A). Absence rates in Australia are below 1%, but refer to total absence
during two full weeks (rather than one week as in the other countries). Australian sickness
figures may, in fact, be quite similar to those in, for example, the United Kingdom (see
below). The steep increase in Spanish absence rates in 2005 is the result of a new question
to respondents, which is understood to better reflect the “true” situation. This would
suggest that Spain has by far the highest sickness absence rate among the four countries.
Contrary to inflow rates into disability benefits, absence rates are higher for women
than men (Figure 3.3, Panel B). Women in the United Kingdom have always had a 20-60%
higher sickness rate than men. Fluctuations during the period are mainly caused by
variation in sickness behaviour of men. In Spain, women’s sickness rates were below those
of men ten years ago, but are now substantially higher. The gender ratio in Luxembourg
has fluctuated over the period, reflecting large variation in male and female absence rates.
Gender patterns in absence rates largely mirror what is found in the rest of Europe: roughly
30% higher rates for women.4
Figure 3.3. Evolution of sickness absence in the European countriesShare of employees absent from work, 1993-2005a
a) Employed persons reporting not having worked at all during the week prior to the survey, due to illness, injury ortemporary disability.
b) Because of a change in the question in the Active Population Survey in 2005, there is a break in the series between2004 and 2005. Figures for 2005 are a better reflection of the actual situation.
c) Unweighted average of EU19, Iceland, Norway and Switzerland.
Source: EULFS, 2006.
��
��
���
���
���
���� �����
��
���
���
��
���
���
���
���
���
�� � � ���� �� �� �� �� ����� ����� �� � � ���� �� �� �� �� ��
+*��%�!*�� ,&��"� -"�����.�"��!% 6$7 �$*�!&��
5�"���)�������� ����� �� ���� �����3������ ���� �% !�"#�� ���
5�"���9�������� ������ �������� ��� ���2 ����� �
9���;��"�����,&�"����������"����
SICKNESS, DISABILITY AND WORK: BREAKING THE BARRIERS – VOL. 2 – ISBN 978-92-64-03815-8 – © OECD 2007 85

3. ABSENCE MONITORING AND ASSESSMENT OF DISABILITY
An in-depth survey conducted in 2003 in Australia found that the average permanent
employee used six days of sick leave, which corresponded, at that time, to 80% of their
annual sickness leave entitlement (Hallis, 2003). Further, employees on average classified
less than 60% of their absence days as “genuine” sickness, with the majority of the
remaining days being taken for family-related reasons.
Lost working days due to sickness in the United Kingdom added up to 6.6 days per
worker in 2005, a figure very similar to the one found in Australia (CBI, 2006). There is a
large variation across economic sectors, ranging from 2.6 work days lost per employee to
11.4 days. Manual employees’ record higher absence rates than professionals, and absence
in the public sector (8.5 days) is higher than the overall average in the private sector
(6.5 days). The employers in the United Kingdom further believe that less than 15% of all
absence is “non-genuine”, a much lower figure than the 40% reported by employees
themselves in the Australian survey.
Long-term sickness absence
Around 15% of all sickness cases in Spain are absences of more than 60 days. This figure
is close to the overall share of long-term sickness absence in Luxembourg, of 17%, in this case
defined as longer than 30 days. Blue-collar workers in Luxembourg are more absent than
white-collar workers, and this difference becomes much more pronounced for long-term
absence (Table 3.2). Overall, almost one-quarter of all sickness absences for blue-collar
workers turns into long-term absence compared to only one-tenth for white-collar workers
– and this difference is found for all age groups and for men and women alike.
In the United Kingdom, only 5% of all sickness cases are long-term, with the latter
defined as 20 days or more. However, these cases account for 36% of all working days lost,
and even for more than 50% in the public sector where absence duration is much longer
(CBI, 2006). In Australia, data on long-term sickness absence are not available. What is
known is that public sickness benefit (Sickness Allowance) is, on average, received for
almost 200 days. Given the very small number of recipients of such benefits which is
explained by the particular eligibility criteria,5 however, this does not adequately reflect
the problem of long-term sickness absence in this country.
Table 3.2. Long-term absence in Luxembourg is much higher for blue-collar workers
Long-term absence in percentage of all employed persons on sickness absences, 2005
Blue-collar workers White-collar workers All workers
Share of employed absent due to sickness at any time during the year
Total 52.3 46.3 49.3
Long-term absence (> 30 days) as a share of all sickness absence
Total 23.9 10.3 17.4
Age
20-34 18.6 8.0 13.3
35-49 24.5 10.3 17.9
50-64 36.9 19.5 29.8
Gender
Men 22.7 8.4 17.6
Women 26.7 11.7 17.1
Source: Data submitted by the General Inspectorate of Social Security (IGSS).
SICKNESS, DISABILITY AND WORK: BREAKING THE BARRIERS – VOL. 2 – ISBN 978-92-64-03815-8 – © OECD 200786

3. ABSENCE MONITORING AND ASSESSMENT OF DISABILITY
C. Pathways into disability benefits
To devise adequate policy responses to lower the inflow into disability benefits, it is
important to know more about how people enter these benefits. Unfortunately, pathways
into disability benefits are weakly documented. Spain has no information about the origin
of a disability-benefit claimant, while partial information on pathways exists in Australia,
Luxembourg and the United Kingdom.6 However, countries make little use of this
information, either as a monitoring tool or as a tool to intervene early and thereby prevent
unnecessary inflow into disability benefits.
Sickness benefits do not appear to be the main route into disability benefits in any of
the three countries, but the data do not allow for a firm conclusion on this (Table 3.3). In
Luxembourg, up to 2005, workers receiving wage payments while being sick could not be
separated from people working. Similarly, also in Australia, the category “employed or no
income support” includes people who receive continued wage payments from their
employer due to sickness. The low share of people (of less than 2%) transferring from a
public sickness benefit onto disability, therefore, is not a true reflection of the role of
sickness as a passage into disability.7 Only data for the United Kingdom allow for an
evaluation of the role of sickness as an intermediary stage: in this country, one in six of all
transfers into disability go through a long-term sickness phase (usually in the form of
continued wage payment by the employer for six months).
Unemployment is another and maybe even more important passage into disability in
all three countries and in Australia in particular. Unemployment accounts for around
one-quarter of all transfers to disability benefits in Luxembourg and the United Kingdom
and 37% in Australia (Table 3.3). This suggests that unemployment benefit schemes
include a significant share of people with health conditions or partial disability, people
who in other countries might be receiving sickness benefits. This may also be the case in
Spain where the unemployment rate is markedly higher than the disability beneficiary rate
(an opposite situation to most other OECD countries).
The sizable share of people in Australia and the United Kingdom moving from
unemployment benefits into disability could be related to the fact that sick employees can
be fired relatively easily (Chapter 5), but there are no studies available on this subject. In
Table 3.3. Pathways into disability benefits are poorly documentedOrigin of new disability benefit claimants as a percentage of all inflows, most recent available year
Australiaa Luxembourgb United Kingdomc
Employed or no income support 45.3 Employed or sickness benefits 67.4 Employed 40.0
Sickness allowance 1.8 Unemployed/Redeployed 23.4 Statutory sick pay 17.0
Unemployed 37.0 Social assistance 1.9 Unemployed 26.0
Parenting payment 6.3 Other inactives 7.3 Income support 12.0
Other payments 9.6 Other inactives 5.0
Total 100.0 Total 100.0 Total 100.0
a) Based on people entering onto Disability support pension between June 2004 and June 2005.b) Based on people entering into either temporary disability benefit, permanent disability benefit or the tide-over
allowance in 2005.c) Data refer to 2001/2002. Previous benefit status is defined as SSP receipt immediately before commencing an
IB claim but refers to a 90-day period before starting an IB claim in case of Jobseeker Allowance and IncomeSupport.
Source: Data provided by DEWR for Australia; IGSS for Luxembourg; and a 1% sample of annual benefitadministration data for the United Kingdom.
SICKNESS, DISABILITY AND WORK: BREAKING THE BARRIERS – VOL. 2 – ISBN 978-92-64-03815-8 – © OECD 2007 87
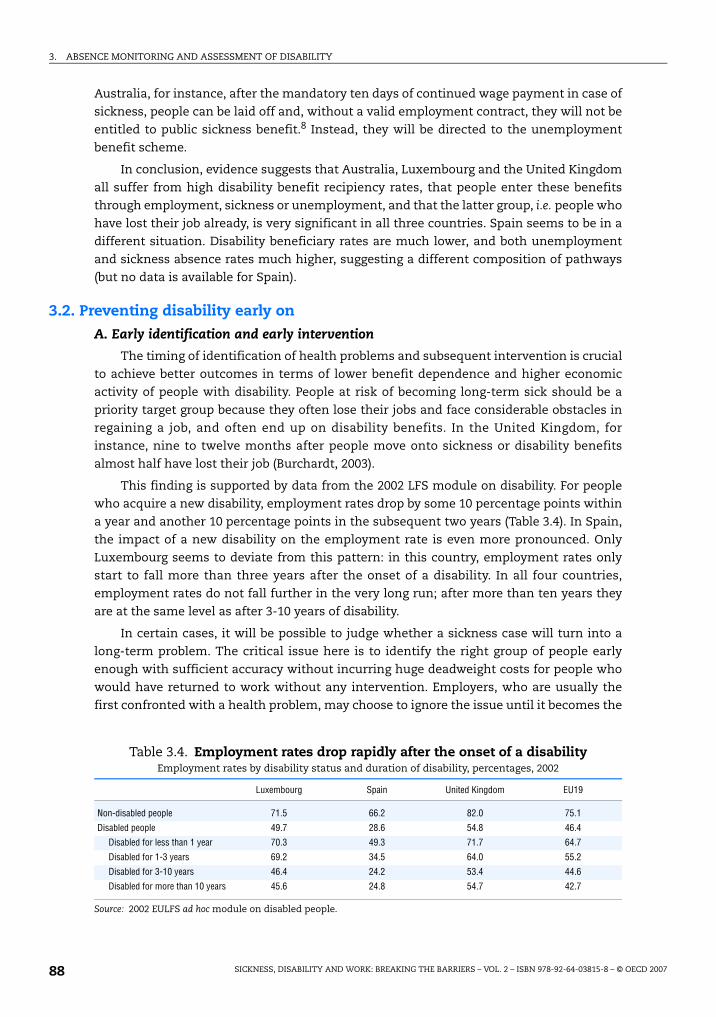
3. ABSENCE MONITORING AND ASSESSMENT OF DISABILITY
Australia, for instance, after the mandatory ten days of continued wage payment in case of
sickness, people can be laid off and, without a valid employment contract, they will not be
entitled to public sickness benefit.8 Instead, they will be directed to the unemployment
benefit scheme.
In conclusion, evidence suggests that Australia, Luxembourg and the United Kingdom
all suffer from high disability benefit recipiency rates, that people enter these benefits
through employment, sickness or unemployment, and that the latter group, i.e. people who
have lost their job already, is very significant in all three countries. Spain seems to be in a
different situation. Disability beneficiary rates are much lower, and both unemployment
and sickness absence rates much higher, suggesting a different composition of pathways
(but no data is available for Spain).
3.2. Preventing disability early on
A. Early identification and early intervention
The timing of identification of health problems and subsequent intervention is crucial
to achieve better outcomes in terms of lower benefit dependence and higher economic
activity of people with disability. People at risk of becoming long-term sick should be a
priority target group because they often lose their jobs and face considerable obstacles in
regaining a job, and often end up on disability benefits. In the United Kingdom, for
instance, nine to twelve months after people move onto sickness or disability benefits
almost half have lost their job (Burchardt, 2003).
This finding is supported by data from the 2002 LFS module on disability. For people
who acquire a new disability, employment rates drop by some 10 percentage points within
a year and another 10 percentage points in the subsequent two years (Table 3.4). In Spain,
the impact of a new disability on the employment rate is even more pronounced. Only
Luxembourg seems to deviate from this pattern: in this country, employment rates only
start to fall more than three years after the onset of a disability. In all four countries,
employment rates do not fall further in the very long run; after more than ten years they
are at the same level as after 3-10 years of disability.
In certain cases, it will be possible to judge whether a sickness case will turn into a
long-term problem. The critical issue here is to identify the right group of people early
enough with sufficient accuracy without incurring huge deadweight costs for people who
would have returned to work without any intervention. Employers, who are usually the
first confronted with a health problem, may choose to ignore the issue until it becomes the
Table 3.4. Employment rates drop rapidly after the onset of a disabilityEmployment rates by disability status and duration of disability, percentages, 2002
Luxembourg Spain United Kingdom EU19
Non-disabled people 71.5 66.2 82.0 75.1
Disabled people 49.7 28.6 54.8 46.4
Disabled for less than 1 year 70.3 49.3 71.7 64.7
Disabled for 1-3 years 69.2 34.5 64.0 55.2
Disabled for 3-10 years 46.4 24.2 53.4 44.6
Disabled for more than 10 years 45.6 24.8 54.7 42.7
Source: 2002 EULFS ad hoc module on disabled people.
SICKNESS, DISABILITY AND WORK: BREAKING THE BARRIERS – VOL. 2 – ISBN 978-92-64-03815-8 – © OECD 200788

3. ABSENCE MONITORING AND ASSESSMENT OF DISABILITY
responsibility of the public authorities, and doctors may prefer to encourage their patients
to stay away from work. The impact of such behaviour on the side of doctors and
employers is that the state may have to carry the costs for expensive rehabilitation
programmes and other employment activation measures that, at the end of the day, may
not be able to avoid a disability benefit claim because action has been initiated too late.
Co-ordination between a number of actors – including occupational health specialists,
the employment service, the employee’s general practitioner, the employer and employees
themselves – is critical for better solutions to these problems. Steps recently taken in
Norway towards early identification and better co-operation between the main actors
provide an example of the difficulty of tackling this problem. The main objective of the
measures taken by the Norwegian government is to find solutions at each workplace
(Box 3.1). So far, however, outcomes from these measures are not very encouraging; for
instance, absence rates which are extraordinarily high have not fallen (OECD, 2006b). An
important lesson from the Norwegian example is that soft improvements of this type can
only work when they are stringently enforced.
Box 3.1. Early identification and co-operation between main actors in Norway
The new early identification measures rely on the co-operation of the National InsuranceOffice, the employee, the employer and the general practitioner. Each of these actors has anumber of new rights and responsibilities to fulfil:
The duties of the general practitioner: If an employee is sick for more than eight weeks,an extended medical certificate must be completed by the general practitioner (GP). The GPshould guide employees in a manner that strengthens their work motivation and assesswhether there are significant medical grounds for a person to be absent from work. GPswho fail to follow the regulations may lose their entitlement to issue medical certificatesthat form the basis for social security benefits.
The duties of the employee: During the first eight weeks of sickness absence, theemployee and the employer must draw up a plan that describes the return to work. Theemployee must contribute information about his/her own functional capacity, so thatnecessary measures can be implemented quickly. The employee must also agree to adialogue with the employer on the possible reorganisation of the workplace. If anemployee refuses collaboration, sickness benefit payments could be reduced or evenstopped.
The duties of the employer: Testing of an employee’s functional ability must be carriedout at the workplace. After 12 weeks of sick leave, if the employee is not in a work-relatedactivity, the National insurance office requests a follow-up plan from the employer. Thisplan should include important documentation to help further monitoring of those on sickleave in preparation for returning to work. The employer is obliged to submit the follow-upplan to the National insurance office on request.
The duties of the National insurance office: In case of non-compliance, the office canimpose enforcement penalties and sanctions on employers, employees and GPs. Moreover,every company can sign a contract with its local social security office and get advice froma regular contact person at the newly-established local Workplace Centres to assist themin taking necessary actions and to follow up employees on sick leave.
SICKNESS, DISABILITY AND WORK: BREAKING THE BARRIERS – VOL. 2 – ISBN 978-92-64-03815-8 – © OECD 2007 89

3. ABSENCE MONITORING AND ASSESSMENT OF DISABILITY
B. The role of employers
Early identification and early intervention mean different things for different groups
of people. For workers with health problems who still hold a job, irrespective of whether
they are on sick leave or not, preventive measures at work will help to retain employment
and avoid transfers onto disability benefits. Employers play an instrumental role in this
context. The range of involvement of employers in the sickness and rehabilitation phase,
their responsibilities towards their workers, and the support given to them to fulfil these
differ widely across countries. Supports and responsibilities of employers are discussed in
more detail in Chapter 5. Their financial incentives towards sick employees are discussed
in the following.
The longer employers have the financial responsibility for sick workers, the larger
their interest should be in keeping workplaces and working conditions healthy and safe.
Helping a sick employee return to work quickly keeps the costs of absenteeism low.
Improving the health of the workforce should also have a positive impact on the company’s
productivity. On the other hand, when the employer has the full responsibility for the sick
worker over a longer period, public authorities are often left uninformed about problematic
sickness cases. If employers fail to take their role as early actor seriously, for instance
because they do not believe in the cost-effectiveness of prevention or early intervention
measures, there is a risk that such a system will instead generate an increasing share of
inactive people and a higher inflow to disability benefits.
The United Kingdom is an interesting case in this regard, because the sickness benefit
system was privatised in several steps over the 1980s and 1990s. In 1983, employers
became responsible for sick pay for the first eight weeks of sickness absence per year, a
period which was extended to 28 weeks in 1986. However, until then this remained a virtual
liability because employer costs were fully reimbursable. Reimbursement was reduced to
80% in 1991 and eventually abolished in 1994 (with exceptions for very large sickness
costs). Unfortunately, employers do not have to keep sick leave records, which is one
reason for the lack of evaluation of these reforms. Data collected by the employer
federation suggest that shifting the responsibility to employers in the 1980s had no impact
but that absence rates dropped in 1991, by over 10%, when employers had to cover parts of
the costs (CBI, 2006). Most of this was due to a decline in short-term absences. On the other
hand, shifting the costs fully to the employer in 1994 had no significant additional effect.
The same CBI study of sickness absence among 10 000 private sector companies and
public sector organisation in the United Kingdom concluded that around 90% of all
employers monitor long-term absence, defined as 20 days or longer (CBI, 2006). In 70% of
all companies this was the responsibility of the line manager and only in 14% a human
resource manager was involved. In cases where the responsibility lies on the latter,
annual sickness absence was, on average, two days shorter. Employers use a range of
practices to manage sickness absence, including discipline procedures, return-to-work
interviews, giving absence statistics to supervisors, and rehabilitation (including
e.g. flexible working hours and counselling). Interestingly, absence was found to be
higher in companies that were taking actions (seven days per year) than in those that did
not (five days). This may suggest that measures taken by employers are still insufficient.
However, it may also indicate that companies with higher absence rates show more
concern for these issues.9
SICKNESS, DISABILITY AND WORK: BREAKING THE BARRIERS – VOL. 2 – ISBN 978-92-64-03815-8 – © OECD 200790

3. ABSENCE MONITORING AND ASSESSMENT OF DISABILITY
Outcomes in the other three countries covered in this review partly confirm the
existence of a relationship between observed absence rates and the length of continued
wage payment by the employer for a sick worker. Spain has the shortest employer period
of only two weeks and the highest absence rates. Luxembourg has a relatively long wage-
payment period for white-collar workers (3.5 months) but no employer involvement for
blue-collar workers, with absence rates being much higher for the latter group (see above).
The picture in Australia is blurred by the fact that the actual wage-payment period varies
from worker to worker, depending on tenure.
To reduce long-term sickness absence of blue-collar workers, the Tripartite
Co-ordinating Committee in Luxembourg decided, in early 2006, that more financial
responsibility should be placed on enterprises employing these workers. This will be made
possible by a broader reform that will remove all differences in regulations between blue-
collar and white-collar workers, the so-called statut unique. Unifying sickness benefit rules
is expected to improve sickness absence management for blue-collar workers and ease the
financial burden on the sickness fund. The government’s plan is to implement the new
rules as from January 2009 (Box 3.2).
Box 3.2. Harmonisation of sickness benefit regulations in Luxembourg
Currently, the Sickness Insurance is responsible for paying sickness benefits for blue-collarworkers from the first day of absence, but only after a period of three and a half months forwhite-collar workers (with employers being responsible for the payment of benefits for thisinitial period). Abolishing the distinction between blue-collar and white-collar statusrequires harmonisation of the two regimes, preferably on the basis of the regulations forwhite-collar workers. This would imply that employers’ labour costs for blue-collar workerswill increase. At the same time, it is expected that the culture of work absenteeism (e.g. in theconstruction sector) will change with improved sickness management.
The changes in regulations are at this stage under negotiation. It does not seempolitically feasible to simply apply the white-collar regulations on blue-collar workers.Ongoing discussions are exploring, for example, the possibility to change the rules in sucha way that the financial impact on employers will be neutral, with no disadvantage foreither blue-collar or white-collar sector employers – an equation that seems extremelydifficult to solve.
A possible solution is that employers of blue-collar workers will benefit from a reductionin social security contribution rates along with the responsibility to pay sickness benefitsfrom day one. Employers of white-collar workers will have to pay higher social securitycontributions, but in turn have a shorter wage-payment period. How long the wage-payment period will be, whether gross wages will have to be reduced for blue-collarworkers (to keep net salaries equal), and how social security contribution rates will changeis yet to be decided.
Harmonising the status of blue and white-collar workers would be a step in the rightdirection since the classification of occupations (or jobs) becomes more and morearbitrary. In addition to changes in sickness rules, regulations for overtime andredundancy payments along with broader changes in the labour law also have to be solvedduring this reform process.
SICKNESS, DISABILITY AND WORK: BREAKING THE BARRIERS – VOL. 2 – ISBN 978-92-64-03815-8 – © OECD 2007 91

3. ABSENCE MONITORING AND ASSESSMENT OF DISABILITY
C. Monitoring absences of sick workers
In all four countries the costs of disability benefits are fully externalised, while costs
during the sickness phase, to different extents, are carried by the employer. It is therefore
to the advantage of governments to identify potential disability cases early so as to avoid
transfers into permanent public benefits. Governments have an interest in monitoring and
reassessing both medical conditions and functional capacity of people on sickness
benefits. Monitoring should also include requesting employers to supply information on
ongoing sickness cases longer than, for example, one month.
A first step to avoid that people fall out of the labour market because of health
problems is to encourage them to stay in work, possibly on more flexible terms or with new
work tasks. In this respect, the role of general practitioners (GPs) is vital since they are
usually the first ones to meet the sick person. But GPs are often trapped in their traditional
caring role and unaware of work-related matters. Evidently, too much work pressure can
result in sickness and deteriorate health. However, the absence of work may also be
unhealthy. Based on both clinical and disability literature, Waddell and Burton (2006)
concluded that having a job is generally good for the physical and mental well-being of
healthy people, many people with disability and most people with common health
problems. Joblessness can have significant adverse effects on health.
In all four countries, temporary work incapacity i.e. sickness absence is in the first
instance certified by GPs. However, in Luxembourg and Spain, GPs have no formal gate-
keeping role as in the United Kingdom and Australia. Luxembourg and Spain have in place
thorough systems for monitoring and reassessing sickness benefit entitlements in order to
avoid long-term absence and subsequent flows onto disability benefits (Box 3.3). Such
absence control by the public authorities could and should also be used in countries where
wage-payment periods are longer. A good-practice country example in this regard is
Austria, where GPs absence certificates are frequently controlled by the Social Security
Authority early on (randomly as well as systematically) despite a wage payment period by
employers that is similar to that for white-collar workers in Luxembourg.
In Spain, work accidents and work-related illnesses are at the full responsibility of
so-called mutual benefit societies, or mutualities.10 However, they are also responsible for
general sickness absence of employees whose employers are covered by a mutuality (this
concerns more than half of all workers). Check-ups, monitoring and reports to GPs are
common practice, and this has also helped to reduced sickness absence growth. Prevention
and medical rehabilitation are also among the responsibilities of these mutualities, which
often have close relationships with employers and an interest to promote a fast return to
work.11 Mutualities have their own doctors who, however, can only recommend a sickness
benefit suspension while the ultimate decision to extend or discontinue a valid absence
certificate rests with the patient’s GP.
Monitoring and reassessing alone is not sufficient to avoid that people return to
sickness benefits or even claim disability benefits at a later stage. Good monitoring
systems like the ones in Luxembourg and Spain should therefore go hand-in-hand with
additional help and assistance to those people who are otherwise likely to stay on (or
return to) long-term sick leave. One way forward is to develop individual action strategies
that involve all the stakeholders, similar to the individual action and follow-up plans in
Norway. Such a process also requires extensive information about people’s health situation
and their employment history, which is already collected in Luxembourg and Spain.12
SICKNESS, DISABILITY AND WORK: BREAKING THE BARRIERS – VOL. 2 – ISBN 978-92-64-03815-8 – © OECD 200792

3. ABSENCE MONITORING AND ASSESSMENT OF DISABILITY
There are various practical difficulties involved with sickness absence controls and the
drawing of early actions plans, especially in regard to the confidentiality of a medical file.
Confidential advice at this stage, to employers and employees alike, would be one
promising solution. Such advice should be provided by occupational health services, which
should have the expertise to identify appropriate workplace adaptation and rehabilitation
needs, also for mental health problems.13
Box 3.3. Ways to re assess and monitor sickness absence in Luxembourg and Spain
Spain: To better monitor and reduce sickness absence, the National Social SecurityInstitute (INSS) established, in 2004, a new executive directorate. The institute hascurrently 400 doctors but will soon hire another 200 to better monitor and reassess ongoingsickness cases. These medical inspectors are superior hierarchically to GPs and canterminate a sickness benefit when appropriate.
For this purpose, INSS operates a very rich individual-based administrative databasewith complete sickness absence histories, including information on the employee, theemployer, the cause for the absence, and the full medical history. Information isautomatically registered through mandatory reporting of employers on every sickness caseas well as all sickness certificates issued by GPs. The INSS then controls people withabsences longer than the average for a specific sickness, specified by very detailed lists forall possible diseases.
INSS is paying for the sickness benefits, but the decision to grant a benefit is taken on aregional level. To maintain the control over spending on sickness benefits, the INSS headoffice is setting up agreements with its 52 regional offices which specify goals andobjectives, such as the number of reassessments per INSS doctor and year. Theseobjectives are then related to costs, duration of absences, and training of GPs to betterassess sickness and work ability. If objectives are not reached, half of the grant to theregion will be withheld. The INSS regional offices send daily reports including detaileddiagnosis on new and terminated sickness cases.
Luxembourg: Since 2005, in case of sickness of at least six weeks within the last 16 weeks,the sick person receives a 4-page form (known as R4) from the Sickness Insurance. Theperson has to forward this form to the attending GP, who in turn has to forward thecompleted form to the Administration of Medical Control (AMC), the public control unit forsocial security institutions. If the form has not been returned within two weeks, a reminderis sent out to the sick person. After another two weeks, benefit payments would be stopped.However, 92% of all forms are returned within the given time frame.
AMC immediately evaluates all the information and makes a statement regarding theperson’s work ability. This statement is sent back to the Sickness Insurance to make adecision. The statement can lead to the following outcomes: i) application for a disabilitybenefit; ii) initiation of the redeployment procedure (see Chapter 2 for more details);iii) extension of the sickness benefit until reassessment at a future date; or iv) terminationof the sickness benefit.
What is said above mainly concerns blue-collar workers. White-collar workers areusually reassessed after four months (i.e. after the employer’s payment period has ended)so that the whole procedure is initiated much later. With the forthcoming harmonisationof sickness benefit rules for blue and white-collar workers, it is foreseen that the AMC willbe monitoring and controlling sick leaves already during the employer payment period.
SICKNESS, DISABILITY AND WORK: BREAKING THE BARRIERS – VOL. 2 – ISBN 978-92-64-03815-8 – © OECD 2007 93

3. ABSENCE MONITORING AND ASSESSMENT OF DISABILITY
Occupational health advice should also be available to GPs, who often lack such
expertise and have little knowledge of their patients’ working conditions and the reasons
for work-related health problems. This is confirmed by a survey by Meager et al. (1998) who
found that 40% of currently inactive people with a disability left their employment after
advice to do so from their health professional. A second opinion by an occupational
therapist or a doctor, as in Luxembourg, is of critical importance for assessing correctly the
work capacity during an ongoing sickness case.14 In the United Kingdom, for instance, the
vast majority of employees in the private sector have no access to an occupational
therapist (Sawney and Challenor, 2003).
D. Health status monitoring of the unemployed
With so many workers transferring to disability via unemployment, it is also vital to
improve the health status monitoring of jobless people and especially those receiving
unemployment benefits. This is the only way of detecting health problems early enough to
avoid “unnecessary” shifts onto disability. Contrary to the group of people who have a job
and are temporarily sick and receiving some form of sick pay, for which employers play a
key role, health screening and monitoring of the unemployed is a responsibility of the
public authorities.
Ongoing research in the United Kingdom on the history of disability benefit claimants
suggests that most of those coming onto benefit through unemployment have lost their job
for reasons not related to their health problem, which is an indication that unemployment
contributes to creating disability. Long-tem unemployment clearly increases the likelihood
of a transfer to disability benefits. In the United Kingdom, in 2001, 22% of people coming
from unemployment to disability benefits had been on unemployment benefits for two
years or more. Although this group had applied for as many jobs as other jobseekers, only
5% had received job offers – compared to 15% for the other unemployed (Bacon, 2002). For
Australia, people coming through unemployment were shown to have the highest
likelihood of long disability benefit durations (Cai, 2004).
All countries have a large and sometimes growing number of people with health
problems on their unemployment benefit rolls. In Australia, for instance, in 2005 one in ten
jobseekers were formally classified as incapacitated unemployment benefit recipients.
This share has fallen somewhat since 2000, but is expected to increase considerably as an
effect of the Welfare to Work reform through which people with partially-reduced work
capacity will be shifted onto the unemployment benefit scheme.
Countries are increasingly addressing the issue of early identification of jobseekers at
risk of transferring onto disability. Since 2006, health problems of the long-term
unemployed in Australia have a higher chance of being detected early on through a
requirement for some groups of unemployed – e.g. jobseekers who ask to be exempt from
job-search activities due to temporary but longer-term sickness – to undergo a Job
Capacity Assessment (see below). New procedures in Luxembourg also aim to prevent
transfers from unemployment onto disability. People, whose sickness benefit is
terminated although they are unable to continue in their current job and whose work
capacity reduction is not serious enough to generate entitlement for a disability benefit,
are classified as a special group of unemployed with detected health problems in need of
special support.15 Health problems developing while being unemployed, however, would
often remain undetected.
SICKNESS, DISABILITY AND WORK: BREAKING THE BARRIERS – VOL. 2 – ISBN 978-92-64-03815-8 – © OECD 200794

3. ABSENCE MONITORING AND ASSESSMENT OF DISABILITY
Despite these efforts, in all countries health problems among the unemployed could
pass undetected for too long, leading to further worsening health while chances of finding
employment continue to fall. This is particularly important in Spain, where mainstreamed
employment programmes contain no measures to ensure participation of unemployed
people with health problems or lighter disability. Health problems of jobseekers are only
formally identified in Spain if a person has successfully applied for a legal disability
certificate; in this case a number of subsidies are available to encourage employers to hire
these workers (Chapter 5).
Chances of detection of health problems by caseworkers are probably higher in
Australia and the United Kingdom, for several reasons. First, placement agencies and
service providers receive a higher payment for disadvantaged jobseekers, including people
with health problems. This increases the incentive of the employment officer to identify
health problems of their customers. Secondly, in both countries the unemployed have
personal advisers, which is not the case in Luxembourg and Spain. In addition, caseloads
are much lower in the United Kingdom and in Australia.
3.3. Disability benefit for those who need itEarly identification will help to prevent and minimise some but not all health
problems. Therefore, comprehensive disability assessment is equally important for a
strategy to lower long-term benefit dependence by raising economic activity. What is
particularly important is to link eligibility for a disability benefit primarily to the remaining
work capacity, not the person’s health problem as such. In assessing the right to a disability
benefit, there is no uniform approach across countries, but looking at the remaining work
capacity is winning ground over the traditional way of assessing the health problem itself.
This will help keeping disability benefit inflow rates low. Too strict eligibility criteria,
however, can lead to exclusions of people in need of such benefit (Chapter 1).
A. Assessing disability
Countries use different approaches to assess eligibility for a disability benefit.
Common to all four countries is that general practitioners are no longer acting as
gatekeepers to disability benefits, or at least only partially. In Australia, GPs’ judgements
and independent medical examinations are used only as one of several inputs in the
decision to grant a benefit. The assessment is also based on a face-to-face meeting of the
personal assessor with the disability benefit claimant. As such, Job Capacity Assessments
(JCAs), which were introduced in 2006, focus on identifying people’s capacity to work and
any barriers or impediments that prevent them from getting a job (Box 3.4). This is a more
comprehensive approach than in the other countries.
However, the other countries have also gone through changes in their assessment
procedures. In 1997, the Spanish National Social Security Institute (INSS) took over
responsibility from GPs for the disability benefit assessment. Since then, the benefit
claimant’s work ability is assessed by INSS doctors who make their own medical
examination.16 After this assessment, the INSS doctor sends a summary statement to a
committee consisting of doctors, labour inspectors and managers of INSS. This committee
proposes whether the person is able to work and, if so, how much.17 The final decision to
grant a benefit is taken by INSS.
SICKNESS, DISABILITY AND WORK: BREAKING THE BARRIERS – VOL. 2 – ISBN 978-92-64-03815-8 – © OECD 2007 95

3. ABSENCE MONITORING AND ASSESSMENT OF DISABILITY
Since 1997, the responsible authorities in Luxembourg no longer grant disability
benefits for people who are able to work, albeit not in their current occupation. Hence,
contrary to Spain, access to disability benefits was closed for people with only partially-
reduced work capacity. The process of examining the right to a disability benefit in
Luxembourg is currently initiated by either a longer period of sickness absence as
described in Box 3.3, or by a personal claim. When a person applies for a disability benefit,
a process very similar to that for long-term sickness absence is started. Once the claimant
has gone through the long-term sickness absence assessment, a second assessment is
done by the Administration of Medical Control (AMC).18 The final decision is taken by the
Pension Insurance.
For 70% of all disability benefit claimants in the United Kingdom the first-entry
assessment is based on the GPs medical examination, while the remainder have to
undergo a Personal Capability Assessment (PCA). After six months on incapacity benefits,
the PCA is applied to the majority of claimants.19 Contrary to the Australian assessment,
the main purpose of the PCA is to determine benefit entitlement, not the remaining work
capacity. This is slowly being changed in the context of broader welfare reform (Chapter 2),
which will introduce a stronger focus on what work people can do despite their health
limitation.20 The decision to grant a benefit is taken at the Jobcentre Plus office, based on
Box 3.4. Innovative Job Capacity Assessment in Australia
The Job Capacity Assessment (JCA) was introduced in 2006 as a key part of the AustralianGovernment’s Welfare to Work package. At the same time, the eligibility to disabilitybenefits was changed: such benefit is now only granted if a person is assessed as unable towork at least 15 hours per week with up to two years of assistance from employmentservices (lowered from 30 hours prior to reform). Moreover, the disability must bepermanent, fully diagnosed, treated (i.e. all reasonable treatment explored) and stabilised(i.e. significant functional improvement unlikely).
All disability benefit applicants, except those considered as “manifestly disabled”, haveto undergo a JCA. JCA has a dual role: to assess the individual’s work capacity and barriersto find work, and to refer the person to appropriate assistance when needed. For thispurpose, the assessor collects medical files, employment-history information and otherrelevant information about the person. The assessment includes a face-to-face meetingbetween the assessor and the person (typically lasting one to two hours).
After the assessment has taken place (generally, within ten working days from thereferral), the assessor prepares a report about the claimant’s ability to work and the possibleactivation support needed to find a job. This report is sent to Centrelink (a one-stop-shopagency responsible for benefit payments and the delivering of a range of Commonwealthservices) and, if appropriate, also to a service provider. The decision to grant a disability (or,if appropriate, unemployment) benefit is taken by Centrelink, not the assessor.
Currently, 80% of all assessments are done by government providers such as Centrelink,CRS Australia, and Health Services Australia. However, in 2008, all providers of JCA will beselected through a competitive tender process. Assessors are and will be mostly healthprofessionals such as psychologists, rehabilitation counsellors, occupational therapistsand physiotherapists. Assessors will have to follow training courses and service guidelinesto ensure that assessments are delivered consistently across the country. For this purpose,assessments will be closely monitored by the staff of the Department of Human Services.
SICKNESS, DISABILITY AND WORK: BREAKING THE BARRIERS – VOL. 2 – ISBN 978-92-64-03815-8 – © OECD 200796

3. ABSENCE MONITORING AND ASSESSMENT OF DISABILITY
information provided by the applicant’s questionnaire, the information provided by the
claimant’s GP and the PCA. A remaining weakness is the almost automatic granting of
provisional disability benefits, often after exhaustion of sick pay, upon calling the contact
centre. Very often, the PCA will only take place several months later. While this helps
bridging any possible periods without earnings, it sends a wrong signal to claimants.21
As for sickness benefits, some countries also monitor health improvements of
disability beneficiaries. In Australia, such a reassessment can take place at any time and
people who volunteer for working are almost certainly reassessed under the JCA. In Spain,
disability beneficiaries are rarely reassessed. If they are, this happens only during the first
two-year period (during which the person has a right to return to the former employer).
Most reassessments are done if the person takes up a job shortly after the granting of the
benefit. Benefit recipients in the United Kingdom can be reassessed under the PCA to
ensure that they still meet the entitlement conditions. These reviews appear to be less
random than in other countries because the doctor who carries out the PCA also has to give
an indication if and when a next reassessment should be conducted. Overall, however,
health monitoring once on disability benefits for a while is fairly sporadic in all four
countries and much less common than, for example, the monitoring of sickness absence in
Luxembourg and Spain.
Some countries use additional types of disability assessments for various purposes.
One is for assessing eligibility for non-contributory disability benefits for people with
insufficient contribution records. Such benefit exists in Spain and the United Kingdom. In
Spain, the level of this benefit is much lower than that of the insurance-based benefit,
while there is little difference in benefit levels in the United Kingdom (Chapter 4). In the
United Kingdom, people claiming a non-contributory benefit (Income Support with a
disability premium) are assessed in exactly the same way as those claiming a contributory
benefit. In Spain, non-contributory disability benefits are managed by authorities of the
autonomous communities (IMSERSO assessment teams), not the National Social Security
Institute.22 Eligibility for these benefits requires a minimum assessed disability of 65%,
without any reference to the remaining work capacity.
Yet another disability assessment is used to determine a legal disability status in Spain
and Luxembourg, mainly for purposes related to these countries’ employment-quota
systems (Chapter 5). To qualify for a legal disability certificate, both countries require a
disability that hampers daily activities by an amount of around one-third (and thus, in the
case of Spain, substantially lower than the limit for non-contributory disability benefit). In
Luxembourg, individuals have to apply for a legal certificate to qualify for the status of
disabled worker. Moreover, the claimant needs to be employed or a registered jobseeker.
The status is granted to those with an assessed disability level of at least 30%. The
assessment is done by the Medical Commission and is in most cases based on the opinion
of the GP. In Spain, a person unable, to a certain degree, to participate in daily life activities
can be granted a legal disability status (irrespective of labour force status). The assessment
is done by IMSERSO assessment teams (as for the non-contributory benefit), based on
standardised WHO classification scales of impairments. To be classified as legally disabled,
the impairment must be at least 25%.
A setup similar to legal disability is used in the United Kingdom for granting a
Disability Living Allowance (DLA). People are eligible if they have care or mobility needs
during at least three months prior to the application and a disability that will last, and not
SICKNESS, DISABILITY AND WORK: BREAKING THE BARRIERS – VOL. 2 – ISBN 978-92-64-03815-8 – © OECD 2007 97

3. ABSENCE MONITORING AND ASSESSMENT OF DISABILITY
improve significantly, for at least the following six months. The eligibility does, however,
not depend on an inability to work. Claims are based on a self-assessment form and
decision makers at the benefit-processing centres are not required to diagnose medical
conditions of claimants (often based on a GP’s certificate).23 Around half of all Incapacity
Benefit (IB) recipients but only one-fifth of all new IB entrants receive DLA. In turn, 80% of
DLA recipients are IB recipients.
B. Health conditions and disability benefits
Disability assessment has come under pressure in the recent past, not the least
because of the very rapid increase in mental illness. Mental health problems account for
almost 40% of all disability benefit recipients in the United Kingdom, including behavioural
disorders, and close to one-third in Australia (Figure 3.4). In all four countries, shares of
mental illness are systematically higher for younger and prime-age people, but particularly
so in the age group 20-34 in the United Kingdom where almost six in ten have a disability
benefit due to mental health problems.
In Spain, mental health problems as a reason for disability benefits are far less
widespread than in the other three countries but also in comparison to most other OECD
countries. Explanations probably include a higher stigma towards mental health problems,
lower acceptance for these conditions among assessors, fewer doctors and specialists
within these disciplines and, hence, lower recognition in general but also, maybe, that this
OECD-wide trend has not yet reached Spain.
In most OECD countries, mental health problems (such as depression, stress and
anxiety) have grown rapidly over the past one to two decades and are currently the fastest
growing health problem – in particular among younger and prime-age people (OECD, 2003;
and OECD, 2006b). Data for the United Kingdom show that the share of all people on
disability benefits with mental health problems is around 15 percentage points higher
today compared to 1995. In Australia, mental illness has increased even more dramatically
from 2% in 1990 to almost 30% in 2005.24
The increasing prevalence of mental health problems necessitates changes in
assessment methods. The reform proposal in the United Kingdom to further improve
the health assessment component of the PCA certainly is a step in the right direction.
More generally, assessments usually focus on current health situations rather than
needs emerging over future months and years. Yet, mental conditions may not always
last a lifetime and, therefore, not require life-long disability benefit entitlement. The
Australian JCA takes persistence of a health condition into account by using the
criterion of being unable to work at least 15 hours per week within the next two years.
This may have a lowering impact on the inflow to disability benefits of people with
mental health conditions. On the other hand, people’s health conditions may improve
beyond this two-years period, implying that they could be pushed into disability
benefits unnecessarily.
Mental health problems and the labour market
Reforms of the assessment process in Australia and the United Kingdom will only
have an impact on the employment situation of people with mental illness and partial
work capacity if claimants receive adequate support to remain in, or return to, work.
Otherwise, there is a considerable chance that the number of unemployed people with
mental health problems will increase. This is likely to happen, or have happened already,
SICKNESS, DISABILITY AND WORK: BREAKING THE BARRIERS – VOL. 2 – ISBN 978-92-64-03815-8 – © OECD 200798

3. ABSENCE MONITORING AND ASSESSMENT OF DISABILITY
in Luxembourg where an increasing number of people with health problems, in many
cases mental health issues, are transferred to unemployment benefits. In Spain, where
mental health problems seem to remain undetected more often than elsewhere, these
people would most certainly end up on unemployment benefits as well.
Unemployed people with mental health problems have much larger difficulties getting
back into work once they lost their job everywhere. Data from the special module of
the 2002 EULFS show that employment rates of people with mental conditions are below
30% in all three European countries, and even as low as 15% in Spain (Table 3.5).
Figure 3.4. Major health conditions of disability benefit recipients vary considerably
Percentage distribution of total benefit recipients, by age group, most recent available yeara
a) 2004 for Luxembourg and Spain, 2005 for Australia and 2006 for the United Kingdom.b) For Luxembourg, data on health reasons for people on disability benefits do not exist. Instead, data are based on
ambulatory treatments and shares are calculated according to the number of visits to a specialist among peoplewith a disability benefit. Data cover the resident population only.
c) Data for Spain refer to a sample of people with legal disability.d) Data on mental disability include learning disabilities which account for approximately 6% of all mental
disabilities.
Source: DEWR for Australia; IGSS for Luxembourg; special tabulations for Spain provided by the University of Madrid,based on linked INSS and IMSERSO data; and DWP Work and Pensions Longitudinal Study for the United Kingdom.
���(
��
��
��
�
��#� �#�� ��#�� =!��� �#� �#�� ��#�� =!���=!���
������� � ��
�����
���� ���
��� ���
�����
(���
��
��
��
�
�
���� �������� ���
����
�� ��
��� ������ ����
���(
��
��
��
�
��#� �#�� ��#�� =!��� �#� �#�� ��#�� =!���=!���
(���
��
��
��
�
�
������ ��
���
��������
������
��� ���� ��� ���
������ ���� ����
���
���
���
����
����
����
�����
B�"���
�������� *�+ ������
B*�1*���#�;������ 6����
������ ,��� ��-�������
SICKNESS, DISABILITY AND WORK: BREAKING THE BARRIERS – VOL. 2 – ISBN 978-92-64-03815-8 – © OECD 2007 99

3. ABSENCE MONITORING AND ASSESSMENT OF DISABILITY
Discrimination legislation will only help to the extent that employers are able to
identify suitable reasonable work adjustments for workers with mental health problems, and
willing to put these into practice. Data from the United Kingdom are disappointing in this
respect: one-third of all people with mental health problems report being laid-off or forced to
resign because of their health conditions and another 40% say they have been denied a job
because of psychiatric treatments (BBC News, 2006). It is therefore even more critical that these
people are identified at an early stage – preferably before they loose their job – and supported in
and into work with appropriate services and rehabilitation programmes.
Unemployment has a clear negative impact on mental wellbeing. In the United
Kingdom, for instance, 27% of those moving from unemployment to disability benefits had
mental health problems. With 15% of all cases, depression was the single most common
category (Bacon, 2002). Figures from the Health and Safety Executive in the United
Kingdom show that, in 2001, 2.3 million Britons had a health condition that was either
caused or made worse by their work. Of these illnesses, close to one-quarter were related
to stress, depression and anxiety (Trade Union Congress, 2005). However, for Australia the
difference in mental well-being between those in “good” and “bad” jobs was found to be
even larger than the difference between those in employment and those unemployed
(Dockery, 2005).25
Recognition and treatment of mental health problems
A critical question is how mental health problems are recognised, treated and
managed by general and mental health care. Sometimes it is claimed that the problem has
always been there and that old taboos concerning mental illness made it possible to keep
disability benefit inflow numbers relatively low. This could also be an explanation for the
very low numbers reported in Spain. Various mental diseases (as well as muscular-skeletal
diseases) that are now increasing in importance were almost unknown two decades ago.
Many of them are treatable now, and more may be in the future.
Common mental health problems are treated almost entirely within primary care in
the United Kingdom. These health conditions may be better addressed by psychologists,
occupational health therapists or other specialists but these professions are in short
supply (British Occupational Health Research Foundation, 2005). This is confirmed by
patients, whose biggest complaint is the lack of psychological therapy. Among people with
depression around one in two receive treatment, only 8% have met a psychiatrist, and 3%
have seen a psychologist. For those who managed to be referred to a psychologist, the
average waiting time was often more than half a year (Layard, 2004).
Table 3.5. Employment rates for people with mental health conditions are extremely low
Employment rates of people with disability by type of health problem, percentages, 2002
Luxembourg Spain United Kingdom EU19
All working-age persons 68.9 62.8 74.3 70.6
Non-disabled people 71.5 66.2 82.0 75.1
All disabled people 49.7 28.6 54.8 46.4
Muscular-skeletal disability 53.2 31.1 50.2 48.0
Mental disability 30.5 14.6 22.5 28.2
Other disabilities 46.8 31.0 62.0 48.2
Source: 2002 EULFS ad hoc module on disabled people.
SICKNESS, DISABILITY AND WORK: BREAKING THE BARRIERS – VOL. 2 – ISBN 978-92-64-03815-8 – © OECD 2007100

3. ABSENCE MONITORING AND ASSESSMENT OF DISABILITY
In Australia, the National Action Plan on Mental Health (2006-2011) aims to address these
issues. This action plan involves a joint package of measures and significant new
investment by all governments that will promote better mental health and provide
additional support to people with mental illness and their families (Council of Australian
Government, 2006). The value of measures for all jurisdictions totals around AUD 4 billion
over five years, almost half of which coming from the federal government. Key measures
include: i) a major increase in clinical and health services available in the community and
new teamwork arrangements for psychiatrists, GPs, psychologists and mental health
nurses; ii) new non-clinical and respite services; iii) an increase in the mental health
workforce; and iv) new programmes for community awareness. These measures
complement a range of existing programmes and initiatives at all government levels
through earlier mental health strategies.
In the United Kingdom, pilot projects on increasing access to psychological therapies
are testing the feasibility of substantially increased provision of these services, and the
extent to which this can improve well-being and employment.
C. Addressing partial work capacity
Most of the changes in sickness monitoring and disability assessment aim to improve
identification of people who are able to work despite a health problem or disability. A
tendency in many OECD countries is to treat those people with a partially-reduced work
capacity like “standard” unemployed. Australia and Luxembourg belong to this group of
countries. Others, including Spain, use a partial disability benefit to encourage people with
partially-reduced work capacity to remain in, or return to, employment. Across the OECD,
there is inconclusive evidence as to whether such partial benefits help reduce or instead
increase benefit recipiency rates, and how they impact on employment rates. This section
recapitulates the main changes in the four countries from the point of view of people with
partially-reduced work capacity.
Partial disability benefit for partial work capacity in Spain
A potential problem with partial disability benefit schemes is that people with minor
disability rather than those with substantially-reduced work capacity leave the labour
market. Another risk is that people tend to apply for the highest possible benefit rate,
which means that more people may end up on full benefits than would otherwise be
justified. In this respect, Norway is a telling example. Not only does this country have one
of the highest disability benefit recipiency rates in the OECD, but also one of the most
detailed partial disability benefit grids starting at 25% reduction of work capacity. Despite
the fine grid of benefit levels, almost three-quarters claim a full benefit (requiring 100%
work capacity loss) and only 3.5% a benefit in the range of 75-99% reduced work capacity
(OECD, 2006b).
Among the four countries in this review, only Spain has a partial disability benefit
scheme. The Spanish system is much less detailed than the Norwegian one and very
similar to the system in Poland (OECD, 2006b), with the big difference of not generating a
massive inflow into these benefits. The system offers two kinds of benefits: full benefits to
people no longer able to carry out any job and a reduced (i.e. partial) benefit of 55% of the
full benefit to those unable to perform their usual work. The partial benefit can be
combined with unlimited income from work in another occupation.
SICKNESS, DISABILITY AND WORK: BREAKING THE BARRIERS – VOL. 2 – ISBN 978-92-64-03815-8 – © OECD 2007 101

3. ABSENCE MONITORING AND ASSESSMENT OF DISABILITY
Partial benefits in Spain account for more than half of all contributory disability
benefits. The employment rate of disability benefit recipients, however, is only 26%
(Figure 3.5). This may seem to be a high proportion the other countries, but it also means
that every second recipient of a partial disability benefit in Spain does not work. Confirming
age patterns of labour market participation and discrimination found earlier, the
proportion of recipients who are employed is by far lowest for people over age 50. This is
probably also a consequence of the 20% supplement those people can get in Spain provided
they are over age 55 and not working (Chapter 4).
The extremely low proportion of employed disability benefit recipients in the United
Kingdom, only about 5%, results from restrictive rules for combining work and benefit
income. For most recipients, the maximum one can earn indefinitely without losing at
least some benefit entitlement is GBP 20 a week, i.e. less than four hours a week at the
minimum wage. For those on contributory benefits only, it is possible to earn up to GBP 85
a week while working for up to 16 hours, without loss of benefit, for up to 12 months, and
in some cases longer.26
The free earnings zone in Australia is considerably higher than this and the taper rate
more generous, as is reflected in the higher employment rate of recipients (around 18%),
which almost doubled from 1998 to 2003. Data for Luxembourg show a share of working
recipients very similar to Australia. This is explained by relatively high earnings disregards:
a disability benefit can be combined with income from work up to pre-disability earnings
(Chapter 4).
Figure 3.5. Employment rates of disability benefit recipients are highest in Spain and lowest in the United Kingdom
In percentage of all disability benefit recipients, by age group, latest available yeara
a) Data includes the following groups: in Australia, disability benefit recipients (DSP) in 2003; in Luxembourg,recipients of sickness, disability and work injury benefits in 2004; in Spain, disability benefit recipients in 2004; inthe United Kingdom, claimants of Incapacity Benefit, Severe Disablement Allowance or Income Support on thebasis of sickness/disability in 2006.
Source: SDAC (Australia); EU-SILC (Luxembourg); special tabulations by the University of Madrid, based on linkedINSS and IMSERSO data (Spain); national LFS (United Kingdom).
��
�#� �#�� ��#�� �#� �#�� ��#�� �#� �#�� ��#���#��
��
��
�
�
��
�
)*������� ,&��" -"�����.�"��!%+*��%�!*��
�#� �#�� ��#�� �#��
SICKNESS, DISABILITY AND WORK: BREAKING THE BARRIERS – VOL. 2 – ISBN 978-92-64-03815-8 – © OECD 2007102

3. ABSENCE MONITORING AND ASSESSMENT OF DISABILITY
Unemployment benefit for partial work capacity in Australia and Luxembourg
Until recently, Australia and Luxembourg also granted (in this case full) disability
benefits to people with minor reduction of their work capacity. To improve workforce
participation of people with reduced work capacity, through different types of changes
both countries chose to close their disability benefit schemes for this group of people.
Instead, people with only partially-reduced work capacity are now referred to the
unemployment benefit scheme, with similar participation requirements as for other
recipients of unemployment benefits. In Luxembourg, this change was achieved through
more stringent administrative practice following a series of court rulings, without a formal
change in regulations, while in Australia this was done in the course of the 2006 Welfare to
Work reform package (Chapter 2).
The impact of this change in Luxembourg is illustrated in Figure 3.6. The number of
people on disability benefits fell continuously, by more than 600 people annually, adding
up to 12% of the entire 2001 number of recipients over a four-year period. Almost 60% of
this decline, however, was compensated by a corresponding growth in “new” forms of
unemployment, i.e. people unemployed due to partial incapacity to work at the last
workplace and those in this status for more than one year who also receive a top-up
payment or waiting allowance. Some 40% of the fall in disability recipients has translated
into more employment, i.e. “redeployed” workers with or without extra compensation.
Whether this result can be interpreted as a success remains to be seen. First, these
data are very preliminary and long-run effects still unknown. Secondly, these data do not
result from a proper evaluation exercise and they are not corrected for any changes, e.g. in
age structures. And thirdly, and most importantly, as the figures also show, in the same
period regular unemployment has increased very fast (by more than 70% in four years) so
that the total number of people on either disability or unemployment benefit has increased
as well. It is unknown to what extent this development is related to the 2002 reform and to
what extent other factors, especially macro-economic developments, have driven this
change. One outcome of the 2002 benefit reform in Luxembourg is that, today, one-third of
Figure 3.6. Unemployment in Luxembourg increased more than disability fellTotal number of people in various statuses, changes since reform in 2001
Source: Social Security Administration.
�����
���
����
����
�����
�
#�����
#����
#�������#�� ���#�� ���#��� ���#���
���������"��*"�%&�!'�� ��������'���"�/�����1�&��"�� G��:H�*"�%&�!'������&�!'���:!�;���
���*����*"�%&�!'��
SICKNESS, DISABILITY AND WORK: BREAKING THE BARRIERS – VOL. 2 – ISBN 978-92-64-03815-8 – © OECD 2007 103
3. ABSENCE MONITORING AND ASSESSMENT OF DISABILITY
all disability and unemployment benefit recipients are unemployed, compared to only
one-sixth four years ago. Potentially this will increase the chances for a reduction of benefit
recipiency in times of labour shortages. However, structural unemployment is likely to
remain higher more permanently.
For Australia, no data is available at this stage to assess the impact of reform simply
because reforms are too recent. However, judging from the results for Luxembourg,
structural unemployment is also at risk of increasing unless labour demand rises
significantly. The United Kingdom is also in the process of introducing a differentiation
between people who are severely disabled and those with severe limitations but only
partially-reduced work ability (Chapter 2). The latter group will, in principle, receive a
lower benefit but with a top-up for those who participate in employment-activation
programmes. Details of this reform are yet to be fixed. However, since in this case reform
will take place within the disability benefit scheme itself, unemployment is unlikely to be
effected by this change very much.27
3.4. Future policy directionsOnce people obtain disability benefits they tend to remain on them for very long. Since
people enter these benefits at an increasingly younger age, average benefit duration is
increasing. As a result, disability beneficiary rates are persistently high. These findings call
for a change in disability benefit inflow policies. Health monitoring of employees and the
unemployed and stringent disability assessment will be crucial to reduce the number of
people moving into these benefits.
Improve health monitoring during the sickness phase…
It is vital to detect a health problem before it develops into a more serious condition.
For workers, good sickness management is the key to disability prevention and work
retention. Employers are key players in this regard, and they should be given as much
support as possible. Absence management should also include systematic controls by
independent medical experts, as in Luxembourg and Spain.
One way to better involve employers during the early sickness and rehabilitation
phase is to increase their financial responsibility by extending the wage-payment period.
This has proven quite effective in a number of countries. Confidential occupational health
advice for employers and employees alike is equally important. Such advice is also needed
for general practitioners who lack the work-related expertise needed to encourage sick
workers to return to work.
… but also of people on unemployment benefits
In all four countries, unemployment benefits are one of the main pathway into
disability benefits. This means that it is extremely important to monitor the health status
of the unemployed and especially the long-term unemployed. Such monitoring is
particularly important for people who are developing mental health problems which pose
particularly severe obstacles to find and keep jobs. Australia in particular has taken
important steps recently in this regard.
Improve the assessment of rights to disability benefits for mental illness
With the exception of Spain, mental illness accounts for 20-40% of all disability benefit
claims. These shares are particularly high for people aged 20-34. This is worrying because
SICKNESS, DISABILITY AND WORK: BREAKING THE BARRIERS – VOL. 2 – ISBN 978-92-64-03815-8 – © OECD 2007104

3. ABSENCE MONITORING AND ASSESSMENT OF DISABILITY
it is in these age groups that inflow rates are increasing fastest. Added to this, employment
rates of people with mental conditions are only around half of the overall employment rate
of people with disability. This situation calls for better ways of taking mental health
problems into account in the assessment of disability and work incapacity.
Moreover, not enough has been done to understand the reasons behind this shift in
health problems. A good start is to recognise these diseases and to make efforts to provide
the right treatment in primary and mental health care. This is often not the case. In all
countries, better co-operation is needed between the social insurance authority, employers
and the health care sector.
Notes
1. The average inflow rate in OECD in 1999 (latest year with data for a sufficiently large number ofcountries) was around six per thousand (OECD, 2003) and, hence, almost twice as high as theSpanish rate. The rates in the other three countries were around the OECD average.
2. The reform proposal in Australia was to lower the requirement of not being able to work more than30 hours per week to 15 hours per week. This reform was in the end postponed to 2006 (Chapter 2).
3. Longer benefit duration may also result from a more restrictive inflow management wherebenefits are only made available to people with severe disability with relatively lower chances offinding jobs.
4. In Australia, absence rates are also slightly higher for women compared to men (The AustralianBureau of Statistics, National Health Survey 2004/5).
5. Employees in Australia unable to perform their usual work due to a temporary incapacity causedby an injury or illness, who have a job to return to, can receive Sickness Allowance (SA). For aperson to be eligible for SA, their temporary incapacity must be (virtually) wholly caused by amedical condition, and it must be likely that the person will be able to return to work within twoyears (but people may remain on SA for up to four years if they are undergoing an approvedvocational rehabilitation programme). The commencement date for SA is affected by the paymentof sick leave, annual leave and other leave payments made by the employer. SA is a non-contributory, means-tested and flat-rate payment at the same rate as unemployment benefit.
6. The United Kingdom is currently running a large quantitative survey of new disability benefitclaimants to improve the evidence base in this field. This is following-up on a recent qualitativestudy on new recipients and their pathways into, as well as off, disability benefits (Sainsbury andDavidson, 2006), which concluded that health dominated most people’s accounts of their route onand either their route off or their continued receipt of a disability benefit.
7. There are other explanations for the infrequent transfer from sickness into disability in Australiaas well. First, since 1996, unemployment benefit recipients with temporary work incapacity are nolonger transferred to sickness benefit. This alone has led to a drop in transfers from sickness todisability benefit from 20% to 6% of the inflow (Cai et al., 2006). Secondly, casual workers, who makeup for one-fourth of the workforce and one-third of all workers with a disability (Chapter 5), are notcovered by sickness benefits. Thirdly, eligibility criteria are very narrow (see note 31).
8. If the stipulated ten days of continued wage payment in Australia are not used they can, sincerecently (i.e. since the introduction of Work Choices), be accumulated over the years as long as theworker stays with the same employer or within the public sector. People who change jobs loosethese days.
9. This mirrors a finding for Norway, where companies with the highest absence rates were thosewhich responded most actively to the recent government initiatives to curb sickness absence(OECD, 2006b).
10. There are around 30 mutualities (Mutuelles des Accidents de Travail et Maladies Professionnelles)across Spain. These are independent not-for-profit institutions, but supervised and audited byINSS.
11. Like in most other OECD countries, however, much of the responsibility for medical rehabilitationin Spain rests with the health care system, which in turn is administered at the level of theautonomous regions, with counselling and supervision from the national level.
SICKNESS, DISABILITY AND WORK: BREAKING THE BARRIERS – VOL. 2 – ISBN 978-92-64-03815-8 – © OECD 2007 105
3. ABSENCE MONITORING AND ASSESSMENT OF DISABILITY
12. A very special problem in Luxembourg, not further elaborated here, is that cross-border workerscan use sickness certificates of a GP in their home country and the control of these certificates isnot in the hands of the IGSS. For further cross-border related policy issues, see Grubb (2007).
13. A recent randomised controlled trial in the United Kingdom tested various interventions(workplace and/or health interventions) aimed at increasing the return-to-work rate of people whowere off sick (Purdon et al., 2006). Surprisingly, the control group had almost the same return rateas the different intervention groups, even though some impact was found for certain subgroups. Itis important to better understand why this experiment showed so little success; the factorsidentified in this study included inappropriateness of the interventions, more pro-activity amongpeople in the control group and non-cooperative employers.
14. In Luxembourg, employers can seek a second opinion from an occupational doctor. If the employerdecides to do so, the employee is obliged to see this doctor, who albeit not being able to control thevalidity of a sick leave certificate can criticise the absence duration and may be able to identifyproblems at the workplace. In the United Kingdom, employers also may choose to refer employeesto their own doctors or to doctors under contract with the public authorities in cases where theirworkers’ temporary work incapacity seems in doubt.
15. The new group of unemployed with detected health problems in Luxembourg remain on theunemployment benefit scheme and receive special support to find another job. After theintroduction of this procedure in 2002, total unemployment rose rapidly and, by 2006, the share ofunemployed people with detected health problems had increased to 17% of total unemployment(ADEM, 2006).
16. The assessment of the INSS in Spain is usually taking place during the first 12 months after onsetof a health problem. The average duration is 50-60 days from the applicant’s visit to the decisiontaken by the assessment team, a fall from around 300 days a few years ago.
17. Spain has two disability benefit levels: a full benefit for those assessed as not being able to work atall and a partial benefit for those assessed as not being able to perform their previous job.
18. Luxembourg’s AMC is a public control unit (consisting of medical doctors with different specialties)under the Ministry of Social Affairs, but independent of the Social Insurance Administration.
19. The PCA in the United Kingdom is required for people who have not worked during the last twomonths or have previously been on public sickness benefits, or on sickness or short-term disabilitybenefits for six months.
20. A similarity with Australia is that the medical service performing the PCA in the United Kingdomis contracted to a private company consisting of PCA-trained medical services doctors.
21. Forthcoming benefit reform in the United Kingdom will do away with this problem in so far asclaimants will, during the initial three months, only receive an amount of benefit equivalent tounemployment benefit and they will only receive the higher rate on completion of the PCA.
22. IMSERSO is an agency in responsible for benefit policies directed towards elderly and dependents,operating at the level of the Spanish autonomous communities.
23. These benefit-processing centres in the United Kingdom deal with all kinds of benefits, includingdealings with the PCA and the companies responsible for PCA assessments.
24. One reason for this rapid growth in mental illness in Australia is a change in the definition ofdisability in 1991, opening the door to people with mental conditions. Prior to this reform, thesepeople tended to be counted towards the long-term unemployed.
25. “Bad” jobs are often defined as jobs with, for example, high job insecurity, unsatisfactory workenvironment and too high work loads.
26. The rules on permitted work also reflect the policy approach in the United Kingdom. Thosecapable of work should be encouraged to leave benefits, so that the low proportion working whileon benefits is to be expected. The risk of increasing this number through more relaxed regulationsis that it might not only concern those currently on benefits and not working, but also some ofthose currently working and not on benefits returning to benefits, e.g. by reducing their hours ofwork.
27. In this context it is worth noting that within the United Kingdom’s unemployment benefit schemethere is provision for disabled people to have restrictions on their job search requirements.
SICKNESS, DISABILITY AND WORK: BREAKING THE BARRIERS – VOL. 2 – ISBN 978-92-64-03815-8 – © OECD 2007106

ISBN 978-92-64-03815-8
Sickness, Disability and Work
Breaking the Barriers – Vol. 2
© OECD 2007
Chapter 4
Financial Incentives and Disincentives for People with Disability
One of the main objectives of current disability benefit reforms in all fourcountries is to increase incentives for persons with disability to take up, orto remain in, work. Disability and other public benefits are an importantsource of income for people with disability, especially in lower incomegroups. Nonetheless, the design of these benefits in combination withincome taxation can create work disincentives. For instance, in a number ofcases (Australia, United Kingdom and above-average income in Spain)disability benefits appear to be more attractive than unemploymentbenefits, which partly explains the frequent transitions fromunemployment into disability. Disability benefits are also being used as apathway into early retirement, particularly in Luxembourg and Spain.Finally, returning to work may be linked to high effective taxation: such“inactivity trap” exists in the United Kingdom. The other three countries arerather facing “low-wage traps”, as increasing working hours sometimesdoes not significantly increase incomes of workers with partially-reducedcapacity.
Recent and on-going benefit reforms reduce slightly the levels of benefitbut do not necessarily decrease disincentive features embedded in thesystem. This is important in view of the low incomes of people withdisability, especially in Australia and the United Kingdom, which arepartly the result of comparatively low disability benefits in thesecountries.
107

4. FINANCIAL INCENTIVES AND DISINCENTIVES FOR PEOPLE WITH DISABILITY
The prime aims of disability benefit policies are to prevent large financial losses and to
reduce poverty risks for people with disability. At the same time, governments need to
ensure that these policies are balanced enough so as to avoid “benefit traps”, i.e. situations
in which a possible take-up of work actually penalises the people concerned. This chapter
looks at the income adequacy versus work incentives dilemma. It shows that, in a number
of cases, benefit systems fail to achieve one or the other of these objectives and highlights
examples how this could be avoided. Section 4.1 looks at the “attractiveness” and adequacy
of disability benefits versus other working-age benefits, in particular unemployment and
social assistance benefits. Section 4.2 examines the extent to which disability benefits are
used as a pathway to early retirement. Section 4.3 analyses the financial consequences for
people with disability who take up work. Section 4.4 discusses the impact of recent and
planned reforms to the benefit scheme in the four countries.
4.1. The “attractiveness” of disability benefits
A. The relative importance of disability benefits
Average disability benefits are set at 22-28% of average national net earnings in
Australia and the United Kingdom, and at 52-58% in Luxembourg and Spain (Chapter 1).
Persons with disability rely, however, on a multitude of income sources. Other public
benefits often play a major role, but other income sources also include own earnings,
capital income, and income from savings and private transfers. Furthermore, the resources
of other household members with whom the person with a disability is living contribute to
(or, in their absence, put a burden on) their economic well-being.
This “income package” differs, however, between countries. In all countries, labour
income plays the most important role, contributing as much as between 64% (Spain) and
71% (Australia and the United Kingdom) to the income of persons with disability (note 4.1).
Moreover, the share of labour income in total incomes increased in the past ten years in
Spain, more so for people with disability (plus 10 percentage points) than for people
without (plus 6 percentage points), reflecting increasing employment rates in that country.
Second, public social transfers are an important source of income; their share in total
income of persons with disability is about twice that for persons without disability. Levels
differ, however: while they make up for 18-19% of all income of people with disability in
Australia and the United Kingdom,1 they constitute 28% in Luxembourg and 34% in Spain,
and these percentages are higher for persons with severe disability. It should be noted that
old-age pensions (including early retirement pensions) are a more important income
source than disability benefits in Luxembourg and Spain, especially when disabilities are
moderate. Third, other income sources such as capital income or private transfers top up
the financial resources of persons with disability. While they play a negligible role on
average in Luxembourg and Spain, they amount to a significant 10-12% in Australia and the
United Kingdom.
SICKNESS, DISABILITY AND WORK: BREAKING THE BARRIERS – VOL. 2 – ISBN 978-92-64-03815-8 – © OECD 2007108

4. FINANCIAL INCENTIVES AND DISINCENTIVES FOR PEOPLE WITH DISABILITY
The fact that labour income constitutes about two-thirds of all disposable household
income of people with disability in all four countries underlines the crucial importance of
employment. While public policy often focuses on benefits, succeeding in increasing
employment seems the best way to economic security for most people with disability. That
said, these results refer to persons who assess themselves as “disabled” and who are to a
large majority (70% to 80%, see Chapter 1) not receiving disability benefit, either because
they are employed or for other reasons.
Given the sizeable share of public transfers and, in particular, disability benefits in the
income package of people with disability, an important question concerns their
redistributive features and the extent to which they provide income security for persons at
the lower end of the income scale. Due to their flat-rate and (partly) means-tested nature,
disability and other social benefits have a much higher redistributive impact in the United
Kingdom and, in particular, in Australia than in the other two countries where they are
more equally distributed – i.e. people in all income deciles receiving more or less the same
Table 4.1. Earnings are the most important income source for persons with disability
Income composition by disability status, 2004a
Moderate disability Severe disability All people with disability No disability
Australia
Labour income . . . . 71 85
Capital income, private transfers . . . . 10 8
Public social transfers . . . . 19 7
Luxembourg
Labour income 72 64 69 83
Capital income, private transfers 2 2 2 2
Public social transfers 26 34 28 15
Disability and sickness benefit 6 14 8 2
Unemployment benefit 1 2 2 1
Social assistance 1 3 2 0
Old-age pension 11 9 10 6
Other benefits 6 5 6 6
Spain
Labour income 69 57 64 84
Capital income, private transfers 2 2 2 2
Public social transfers 29 41 34 14
Disability and sickness benefit 8 19 13 2
Unemployment benefit 3 3 3 2
Social assistance 0 0 0 0
Old-age pension 14 16 15 7
Other benefits 4 3 3 2
United Kindgom
Labour income . . . . 71 88
Capital income, private transfers . . . . 12 7
Public social transfers . . . . 18 5
Disability benefit . . . . 6 1
Old-age pension . . . . 3 1
Other benefits . . . . 9 4
a) Income concept used is equivalised disposable household income per person. Old-age pension includes earlyretirement pension. Other benefits include family benefits and, in the United Kingdom, unemployment benefitsand tax credits.
Source: HILDA 2005 for Australia (calculations were provided by Mark Pearson, OECD); EU-SILC 2004 for Luxembourgand Spain; FRS 2005/06 for the United Kingdom.
SICKNESS, DISABILITY AND WORK: BREAKING THE BARRIERS – VOL. 2 – ISBN 978-92-64-03815-8 – © OECD 2007 109

4. FINANCIAL INCENTIVES AND DISINCENTIVES FOR PEOPLE WITH DISABILITY
share of benefits.2 In Spain, this concerns both disability and other social benefits while, in
Luxembourg, benefits other than for disability are more progressively distributed. That
said, even if less progressively distributed, social benefits alleviate inequalities of other
income sources in all countries (Förster and Mira d’Ercole, 2005).
B. The tax/benefit position of persons with disability
The disability benefit and tax systems differ considerably across the four countries
(Annex Table 4.A1.1 and Box 2.1 in Chapter 2). This has to do with different social protection
traditions. The two continental European countries both rely on contributory benefits for
employed persons, complemented by minor non-contributory schemes for people not
fulfilling the contribution requirements. The contributory benefits are earnings-related but
specify minima and maxima. The United Kingdom, too, relies on a contributory disability
scheme; benefits are, however, flat-rate amounts. As in Spain and Luxembourg, this is
complemented by a non-contributory scheme. Also in Australia disability benefits are flat-
rate payments but the benefit system is non-contributory, universal and household means
and asset-tested.
Table 4.2 compares the tax/benefit position of a 40-year-old single person with average
earnings when working and after going on full disability benefit. The first column for each
country describes the steps from gross to net earnings for a working person. In all three
countries, between one-fifth and one-fourth of gross income is “taxed away”: in Australia
this is done entirely through income taxation, while in Luxembourg and the United
Kingdom social security contributions contribute one-third to the total tax burden.
In Spain, the share between taxes and social security contributions is about balanced.
The second column for each country in Table 4.2 looks at the tax/benefit position of a
single person after having moved from work to a full disability benefit entitlement (main
scheme). The third and fourth columns show the position of a person who moved from
work to other types of disability benefits. The tax weight on benefits is much lower than for
workers, and zero in many cases due to non-taxation of benefits or sufficiently high tax
allowances. Gross replacement rates, i.e. gross benefit levels with regard to former gross
earnings, are therefore generally lower than net replacement rates.
Net replacement rates for single persons who were formerly on average earnings vary
largely across countries but also within countries, depending on the benefit regime and
type. In Luxembourg and Spain, for instance, replacement rates for people on non-
contributory benefits are much lower than for those on contributory disability benefits (the
latter constitute the vast majority of beneficiaries: 96% in Luxembourg, 80% in Spain). By
contrast, in the United Kingdom there is almost no difference in benefit levels (and
therefore replacement rates) between persons with disability on non-contributory Income
Support with a disability premium and those on a contributory Incapacity Benefit.
On the other hand, there appears to be quite a significant difference in the United
Kingdom between short-term and long-term incapacity benefit payments. However, this
difference is mainly explained by the specific model assumptions, i.e. results being very
sensitive to the inclusion of Disability Living allowance (DLA). Reflecting a “typical” case, it
is assumed that a beneficiary will only claim DLA some 1-2 years after claiming disability
benefit (contributory or non-contributory). If this top-up allowance, which is received by
about half of all disability benefit recipients, were to be excluded from the model
calculations, the replacement rate for long-term beneficiaries – be they on Income Support
or on Incapacity Benefit – would fall from 60% to 47%.3
SICKNESS, DISABILITY AND WORK: BREAKING THE BARRIERS – VOL. 2 – ISBN 978-92-64-03815-8 – © OECD 2007110

4. FINANCIAL INCENTIVES AND DISINCENTIVES FOR PEOPLE WITH DISABILITY
Table
4.2.
Gro
ss a
nd
net
rep
lace
men
t ra
tes
for
mai
n d
isab
ilit
y be
nef
it s
chem
es a
re h
igh
er i
n c
onti
nen
tal E
uro
pea
n c
oun
trie
sTa
x-be
nef
it p
osit
ion
of
a si
ngl
e p
erso
n a
t av
erag
e ea
rnin
gs a
nd
wh
en o
ut
of w
ork
on d
isab
ilit
y be
nef
its,
USD
Purc
has
ing
Pow
er P
arit
ies
(PPP
), 20
05a
Aust
ralia
Luxe
mbo
urg
Spai
nUn
ited
King
dom
Wor
king
si
ngle
pers
on
Disa
bilit
y Su
ppor
t Pe
nsio
n
Wor
king
si
ngle
pers
on
Disa
bilit
y be
nefit
Non-
cont
ribut
ory
bene
fit
Wor
king
si
ngle
pe
rson
Parti
al
(“to
tal”)
in
capa
city
be
nefit
Full
(“ab
solu
te”)
in
capa
city
be
nefit
Non-
cont
ribut
ory
bene
fit
Wor
king
si
ngle
pe
rson
Shor
t-ter
m
inca
paci
ty
bene
fit a
fter
28w
eeks
Long
-term
in
capa
city
be
nefit
afte
r 52
wee
ks
Inco
me
supp
ort
disa
bilit
y pr
emiu
m
A.1
Gros
s ea
rnin
gs37
069
4444
126
729
4683
2
A.2
Taxa
ble
bene
fits
Disa
bilit
y/in
capa
city
ben
efits
2722
213
224
1415
95
287
548
66
796
Hous
ing
bene
fits
01
569
B.In
com
e ta
x an
d so
cial
sec
urity
co
ntrib
utio
ns
Inco
me
tax
allo
wan
ces
792
61
558
122
29
282
1085
211
639
780
77
807
780
7
Taxa
ble
inco
me
3706
936
515
2566
513
570
1744
63
307
039
025
00
Inco
me
tax
and
loca
l tax
esb
890
46
072
255
230
73
707
496
08
185
00
Soci
al S
ecur
ity C
ontri
butio
ns6
198
961
501
169
70
04
294
00
Tota
l inc
ome
tax
and
soci
al s
ecur
ity
cont
ribut
ions
890
412
125
345
280
05
404
496
012
479
00
C.No
n-ta
xabl
e be
nefit
s
Disa
bilit
y be
nefit
s8
971
2574
3
Disa
bilit
y re
late
d be
nefit
sc16
74
553
455
3
Inco
me
supp
ort
664
7
Hous
ing
bene
fits
184
69
366
926
99
366
Tota
l non
-taxa
ble
bene
fits
1098
425
743
936
613
822
2056
6
D.Ne
t inc
ome
out o
f wor
k (A
– B
+ C
)10
984
2377
113
992
1366
325
743
528
714
852
2061
920
566
E.Ne
t inc
ome
in w
ork
(A1
– B)
2816
532
316
2132
434
352
F.Gr
oss
repl
acem
ent r
ate
[(A2
+ C
)/A1]
30%
61%
33%
53%
96%
20%
32%
44%
44%
G.Ne
t rep
lace
men
t rat
e (D
/E)
39%
74%
43%
64%
121%
25%
43%
60%
60%
Not
e:G
ross
(net
) rep
lace
men
t ra
tes:
rat
io o
f h
ouse
hol
d g
ross
(net
) in
com
e af
ter
beco
min
g in
acti
ve a
nd
rec
eivi
ng
dis
abil
ity
ben
efit
to
hou
seh
old
gro
ss (n
et) i
nco
me.
a)A
vera
ge e
arn
ings
ref
er t
o av
erag
e w
orke
r (A
W):
AU
D 5
116
9in
Au
stra
lia,
EU
R 4
050
0in
Lu
xem
bou
rg,
EUR
20
439
in S
pai
n a
nd
GB
P 29
364
in t
he
Un
ited
Kin
gdom
. Es
tim
ates
ref
er t
o a
40-y
ear
old
sin
gle
per
son
wit
h a
n e
arn
ings
his
tory
of
22ye
ars
at a
vera
ge e
arn
ings
. Fig
ure
s as
sum
e n
o w
aiti
ng
per
iod
bet
wee
n e
mp
loym
ent
and
th
e be
nef
it s
itu
atio
n.
b)In
clu
des
su
rtax
in L
uxe
mbo
urg
.c)
Phar
mac
euti
cal a
llow
ance
an
d t
elep
hon
e al
low
ance
in A
ust
rali
a, D
isab
ilit
y Li
vin
g A
llow
ance
in t
he
Un
ited
Kin
gdom
.So
urc
e:Sp
ecia
l mod
ule
of
OEC
D t
ax-b
enef
it m
odel
. In
form
atio
n p
rovi
ded
by
nat
ion
al a
uth
orit
ies.
SICKNESS, DISABILITY AND WORK: BREAKING THE BARRIERS – VOL. 2 – ISBN 978-92-64-03815-8 – © OECD 2007 111

4. FINANCIAL INCENTIVES AND DISINCENTIVES FOR PEOPLE WITH DISABILITY
Across contributory disability regimes, net replacement rates for average earners are
lower in Australia (39%) and the United Kingdom (43-60%) than in Luxembourg (74%) and
in Spain where they are estimated at 64% in the case of partial disability (“total incapacity
benefit”) and at 121% in the case of full disability (“absolute incapacity benefit”).
Finally, in terms of absolute benefit levels of the main disability scheme, expressed in
USD in purchasing power parities, these are highest in Luxembourg and lowest in
Australia.
C. Adequacy and generosity of replacement rates
Net replacement rates (NRRs) compare the income situation when moving from paid
work to inactivity. They thus provide indicators of both the adequacy and generosity of
disability benefit schemes. Low NRRs for people who become totally incapacitated for work
in the midst of their professional career may raise concerns about poverty and social
exclusion, especially if the persons have caring obligations towards children. However, a
majority of persons with disability are not fully incapacitated for work but experience
problems of staying in the labour market. In the case of NRRs approaching or exceeding
100%, such schemes may become an attractive alternative to employment (for employees
but also for employers looking to adjust workforce size without causing labour discontent).
Indeed, past OECD work suggests a positive correlation between scores on a synthetic
“benefit generosity indicator” and both beneficiary rates and disability benefit inflows
(OECD, 2003).
Apart from Australia, with its entirely non-contributory social protection system, all
countries have different disability schemes in place, differentiated either by degree of work
incapacity (Spain) or duration of disability (United Kingdom). In addition, there are special
schemes for persons not covered otherwise (a new special social assistance payment in
Luxembourg, non-contributory benefit in Spain and Income Support with disability
premium in the United Kingdom). A first issue is how these disability schemes compare to
each other in terms of replacing earned income.
A second issue is how disability benefits compare, again in terms of replacing earned
income, with other main income support schemes for those of working-age in case of
inactivity: unemployment benefit and social assistance. In theory, these schemes have
been distinct, serving different groups of people. However, there is some evidence that
many persons with health problems – to which social and employment problems often are
added – are being shifted around and, in the end, trapped between increasingly tightened
schemes. Figure 4.1 compares NRRs for different disability, unemployment and social
assistance benefit schemes for single persons (results for other household types are shown
in Annex Figure 4.A1.1). Key findings are summarised in the following.
How do different disability schemes compare within countries?
In general, NRRs are higher for persons and households who receive longer-term or
more severe disability benefits. This is particularly pronounced in the case of Spain where
NRRs in the case of full (“absolute”) incapacity benefits are between 100% and 125% for the
entire range up to twice average earnings, and for all family types. This is mainly due to
non-taxation of these benefits. NRRs in the case of long-term incapacity benefit in the
United Kingdom are also some 20-30 percentage points higher than those for short-term
benefits, due to inclusion of Disability Living Allowance (see above and especially note 3) in
SICKNESS, DISABILITY AND WORK: BREAKING THE BARRIERS – VOL. 2 – ISBN 978-92-64-03815-8 – © OECD 2007112
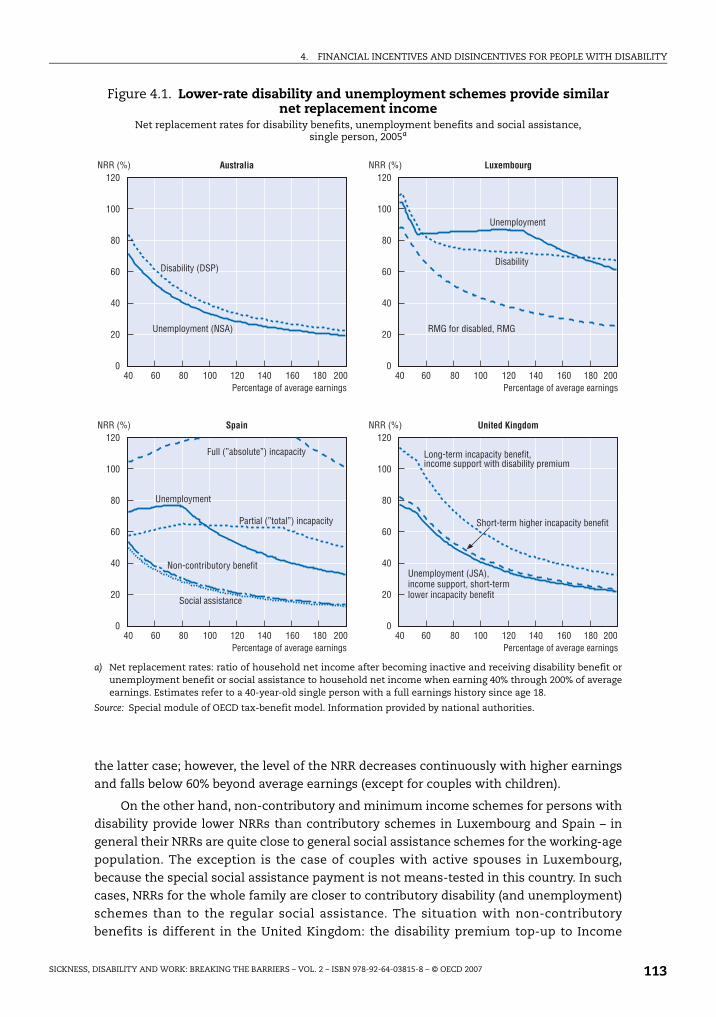
4. FINANCIAL INCENTIVES AND DISINCENTIVES FOR PEOPLE WITH DISABILITY
the latter case; however, the level of the NRR decreases continuously with higher earnings
and falls below 60% beyond average earnings (except for couples with children).
On the other hand, non-contributory and minimum income schemes for persons with
disability provide lower NRRs than contributory schemes in Luxembourg and Spain – in
general their NRRs are quite close to general social assistance schemes for the working-age
population. The exception is the case of couples with active spouses in Luxembourg,
because the special social assistance payment is not means-tested in this country. In such
cases, NRRs for the whole family are closer to contributory disability (and unemployment)
schemes than to the regular social assistance. The situation with non-contributory
benefits is different in the United Kingdom: the disability premium top-up to Income
Figure 4.1. Lower-rate disability and unemployment schemes provide similar net replacement income
Net replacement rates for disability benefits, unemployment benefits and social assistance, single person, 2005a
a) Net replacement rates: ratio of household net income after becoming inactive and receiving disability benefit orunemployment benefit or social assistance to household net income when earning 40% through 200% of averageearnings. Estimates refer to a 40-year-old single person with a full earnings history since age 18.
Source: Special module of OECD tax-benefit model. Information provided by national authorities.
��
���
��
��
��
�
��� �� ��� ��
��
���
��
��
��
�
��� ��� ��� ���� ��� �� ��� ��� �� �� ��� �� ���
��
���
��
��
��
�
��� �� ��� ��
��
���
��
��
��
�
��� ��� ��� ���� ��� �� ��� ��� �� �� ��� �� ���
�����( �����( �������� *�+ �����
5��1�"�����!/������������"�"�� 5��1�"�����!/������������"�"��
�����( �����( ����� ,��� ��-������
5��1�"�����!/������������"�"�� 5��1�"�����!/������������"�"��
��������'�� ,5
-"�%&�!'%�"����,)
��������'
-"�%&�!'%�"�
�B4�/!����������<��B4
8*����H���!�*��H ��"1�&�1��'
-"�%&�!'%�"�
,�!��#���%���������"1�&�1��'���"�/��
-"�%&�!'%�"���I,) <�"1!%���*&&!��<���!��#���%�!:����"1�&�1��'���"�/��
+!"�#���%��"1�&�1��'���"�/��<�"1!%���*&&!���:�������������'�&��%�*%
,!1�����������"1�
5��������H�!���H ��"1�&�1��'
�!"#1!"����*�!�'���"�/��
SICKNESS, DISABILITY AND WORK: BREAKING THE BARRIERS – VOL. 2 – ISBN 978-92-64-03815-8 – © OECD 2007 113
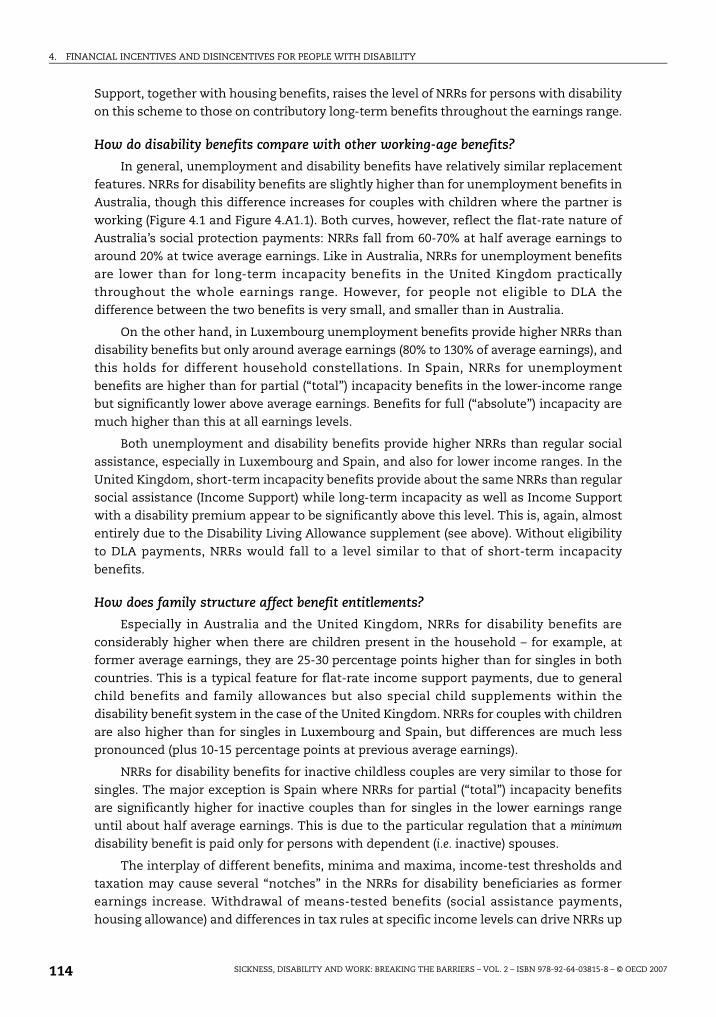
4. FINANCIAL INCENTIVES AND DISINCENTIVES FOR PEOPLE WITH DISABILITY
Support, together with housing benefits, raises the level of NRRs for persons with disability
on this scheme to those on contributory long-term benefits throughout the earnings range.
How do disability benefits compare with other working-age benefits?
In general, unemployment and disability benefits have relatively similar replacement
features. NRRs for disability benefits are slightly higher than for unemployment benefits in
Australia, though this difference increases for couples with children where the partner is
working (Figure 4.1 and Figure 4.A1.1). Both curves, however, reflect the flat-rate nature of
Australia’s social protection payments: NRRs fall from 60-70% at half average earnings to
around 20% at twice average earnings. Like in Australia, NRRs for unemployment benefits
are lower than for long-term incapacity benefits in the United Kingdom practically
throughout the whole earnings range. However, for people not eligible to DLA the
difference between the two benefits is very small, and smaller than in Australia.
On the other hand, in Luxembourg unemployment benefits provide higher NRRs than
disability benefits but only around average earnings (80% to 130% of average earnings), and
this holds for different household constellations. In Spain, NRRs for unemployment
benefits are higher than for partial (“total”) incapacity benefits in the lower-income range
but significantly lower above average earnings. Benefits for full (“absolute”) incapacity are
much higher than this at all earnings levels.
Both unemployment and disability benefits provide higher NRRs than regular social
assistance, especially in Luxembourg and Spain, and also for lower income ranges. In the
United Kingdom, short-term incapacity benefits provide about the same NRRs than regular
social assistance (Income Support) while long-term incapacity as well as Income Support
with a disability premium appear to be significantly above this level. This is, again, almost
entirely due to the Disability Living Allowance supplement (see above). Without eligibility
to DLA payments, NRRs would fall to a level similar to that of short-term incapacity
benefits.
How does family structure affect benefit entitlements?
Especially in Australia and the United Kingdom, NRRs for disability benefits are
considerably higher when there are children present in the household – for example, at
former average earnings, they are 25-30 percentage points higher than for singles in both
countries. This is a typical feature for flat-rate income support payments, due to general
child benefits and family allowances but also special child supplements within the
disability benefit system in the case of the United Kingdom. NRRs for couples with children
are also higher than for singles in Luxembourg and Spain, but differences are much less
pronounced (plus 10-15 percentage points at previous average earnings).
NRRs for disability benefits for inactive childless couples are very similar to those for
singles. The major exception is Spain where NRRs for partial (“total”) incapacity benefits
are significantly higher for inactive couples than for singles in the lower earnings range
until about half average earnings. This is due to the particular regulation that a minimum
disability benefit is paid only for persons with dependent (i.e. inactive) spouses.
The interplay of different benefits, minima and maxima, income-test thresholds and
taxation may cause several “notches” in the NRRs for disability beneficiaries as former
earnings increase. Withdrawal of means-tested benefits (social assistance payments,
housing allowance) and differences in tax rules at specific income levels can drive NRRs up
SICKNESS, DISABILITY AND WORK: BREAKING THE BARRIERS – VOL. 2 – ISBN 978-92-64-03815-8 – © OECD 2007114

4. FINANCIAL INCENTIVES AND DISINCENTIVES FOR PEOPLE WITH DISABILITY
at some earnings levels and down at others. This seems, however, to be much less the case
for the disability schemes in the four countries under review, compared to those reviewed
by OECD in 2006 (Norway, Poland, Switzerland).
A few exceptions are noteworthy. For example, in Luxembourg, a first “notch” appears
in the lower earnings range (42% of average earnings for singles and 63% for inactive
couples) because only at that stage tax/benefit regulations permit net incomes of working
people to increase. From that point, NRRs for disability beneficiaries fall rather steeply until
a second “notch” when housing benefits and social assistance top-up is phased out as
regular disability benefit is high enough that net incomes of disability beneficiaries start
increasing. In Spain, NRRs for full (“absolute”) incapacity benefits increase steadily from
about 100% to 120% (and above) over the earnings range until about one and a half times
previous average earnings, because they are not taxed. They then start decreasing as this
is the point where the maximum disability benefit is reached.
To sum up, income from work dominates the household income package of people
with disability. For those among them who are inactive and on benefit, regulations on taxes
and transfers determine net replacement rates. The latter tend to be lower in Australia and
the United Kingdom than in Luxembourg and Spain but can, under certain conditions, be
topped up by extra allowances, e.g. for daily living expenses, children and inactive spouses.
Moreover, disability benefits provide generally higher net replacement income than
unemployment benefits in Australia and the United Kingdom, but only for previous
earnings above average in Spain and above twice average in Luxembourg.
4.2. Disability benefits as an early retirement pathwayA majority of disability benefit recipients is above age 50, and in some countries high
disability take-up is an early retirement phenomenon more than anything else (e.g. for
Luxembourg, Hartmann-Hirsch 2006). This section looks at the age bias in disability benefit
recipiency and the extent to which such a bias may be explained by either demographic or
policy design features.
A. Age bias in disability benefit recipiency
The age distribution of disability benefit recipiency is indeed biased towards older age
groups, with 50 to 55% of all beneficiaries being aged 50 to 64 in Australia and the United
Kingdom, 65% in Spain and as much as 82% in Luxembourg (Figure 4.2). This means that a
strong age bias exists in all countries, but that there are also large differences across
countries. That said, men dominate the disability benefit rolls everywhere, and the age bias
is larger for men than for women, including in countries where the legal retirement age
is 65 for both men and women.
B. Accounting for disability prevalence
A first explanation for this age bias in disability benefit recipiency is basically
demographic in nature and related to the age structure of disability prevalence: more older
workers have health problems or a disability (or perceive themselves as disabled), hence
presumably more of them should apply for and receive a disability benefit. Such a pattern
may be expected when juxtaposing age-specific recipiency with disability prevalence rates
(Chapter 1, Table 1.11). Indeed, disability prevalence is biased towards older age groups,
too: almost twice as high at age 50-64 as on average in all four countries. Again, the age bias
is larger for men than for women.
SICKNESS, DISABILITY AND WORK: BREAKING THE BARRIERS – VOL. 2 – ISBN 978-92-64-03815-8 – © OECD 2007 115

4. FINANCIAL INCENTIVES AND DISINCENTIVES FOR PEOPLE WITH DISABILITY
There exists an interdependency between these two phenomena and indicators:
people on disability benefit will have a higher likelihood of considering themselves as
being disabled. Such a pattern is suggested by the fall in disability prevalence for women in
the age group 60-64 in the United Kingdom (Figure 4.3) – a group of people who are entitled
to regular old-age pensions because the legal retirement ages are still 60 years for women
and 65 for men (even though the former will gradually be increased to 65 years as well
until 2017).
A simple way to account for the age structure of disability prevalence is to look at
prevalence-adjusted disability benefit recipiency rates, i.e. relating the number of
recipients in each age-gender group to the respective number of people with self-assessed
disability. Results are very telling (Figure 4.4): for men and women in the United Kingdom
and in Australia – and to a lesser extent also for women in Spain – the age bias of disability
benefit recipiency largely disappears. This is not the case for men in Spain and both
genders (men more than women) in Luxembourg. For these countries and population
groups, explanations for the age bias other than demography are needed.
C. Benefit system design and reform
Another explanation for the age bias can be the design features in the disability
benefit system. This may especially be the case for partial disability benefits (“total
incapacity”, i.e. incapacity for the usual occupation) in Spain. This scheme includes a
special top-up of the calculation basis for beneficiaries aged over 55 and out of work
(Annex Table 4.A1.1). This can constitute incentives for some persons to apply for such a
benefit. Figure 4.4 above suggests that this may be one factor driving the adjusted
recipiency rate upwards for those over age 55 and more so for men than for women.
Figure 4.2. Disability beneficiaries significantly biased toward older age groups, in particular in Luxembourg and Spain
Disability recipients by age and gender, as a share of total disability recipients, 2005a
a) Beneficiaries: DSP customers (Australia); permanent and temporary disability pension recipients (Luxembourg);contributory and non-contributory incapacity benefits (Spain); Incapacity Benefit and Severe DisablementAllowance claimants, excluding IB short-term lower rate (United Kingdom).
Source: DEWR (Australia); IGSS (Luxembourg); MTAS (Spain); DWP (United Kingdom).
��
�#�
��
��
��
��
��
�
�
��
��#�� ��#�� �#� �#�� ��#�� �#� �#�� ��#�� �#� �#�� ��#��
B�" D!%�"
)*������� +*��%�!*�� ,&��" -"�����.�"��!%
SICKNESS, DISABILITY AND WORK: BREAKING THE BARRIERS – VOL. 2 – ISBN 978-92-64-03815-8 – © OECD 2007116
4. FINANCIAL INCENTIVES AND DISINCENTIVES FOR PEOPLE WITH DISABILITY
Indeed, net replacement rates for disability benefits above age 55 in Spain are
significantly higher than below that age: 15-20 percentage points higher in the case of a
single person, and 8-12 percentage points in the case of a disability beneficiary living with
an active spouse and two children, depending on the level of prior earnings (Figure 4.5).
More importantly, the replacement level of the topped-up benefit is higher than the
unemployment benefit in the earnings range below average wage.4 This creates incentives
Figure 4.3. United Kingdom: interdependency between age-specific disability recipiency and prevalence rates
Disability recipiency and prevalence by age and gender, 2005a
a) Beneficiaries: Incapacity Benefit and Severe Disablement Allowance claimants, excluding IB short-term lowerrate.
Source: DWP; LFS 2006.
Figure 4.4. Recipiency age bias in Australia and the United Kingdom is explained by the age structure of disability prevalenceDisability adjusted age and gender specific benefit recipiency rates, 2005a
a) See Figure 4.2.
Source: Beneficiary data: DEWR (Australia); IGSS (Luxembourg); MTAS (Spain); DWP (United Kingdom). Prevalencedata: SDAC 2003 (Australia), EU-SILC 2004 (Luxembourg, Spain), LFS 2006 (United Kingdom).
��
�#�
�
��
�
��#� �#� �#� ��#�� ��#�� ��#�� ��#�� ��#��
B����&������"1� B������1�&��"1'8�%����&������"1� 8�%������1�&��"1'
��
���
��
��
�
��#�
��
���
��
�
�
��
�#�� ��#�� �#� �#�� ��#��
4�� �
,&��" -"�����.�"��!%
5 �
)*������� +*��%�!*��
SICKNESS, DISABILITY AND WORK: BREAKING THE BARRIERS – VOL. 2 – ISBN 978-92-64-03815-8 – © OECD 2007 117

4. FINANCIAL INCENTIVES AND DISINCENTIVES FOR PEOPLE WITH DISABILITY
for older persons with weaker labour market attachment to move onto disability benefit
and, moreover, to remain out of work as the supplement would get lost otherwise (while a
partial disability benefit without this supplement can be combined with work).
The higher the age, the higher the level of disability benefit in the other countries as
well, with the exception of Australia. In the United Kingdom, the long-term incapacity
benefit includes age supplements if benefit receipt started before age 35 and 44,
respectively. In Luxembourg, the earnings-related part of the disability benefit formula
refers to total wages earned and, therefore, increases substantially for older workers.
A third possible explanation for the age bias in disability benefit recipiency is features
of and changes in the old-age pension system. In Australia, the minimum age-pension age
for women is currently being increased gradually from 60 to 65 years (it was 61 years in
1999 and 62.5 years in 2004). Moreover, mature age allowance and partner allowance, two
special unemployment allowances for people (de facto mostly women) over age 60 with no
work experience, were both closed to new entrants as of 2003. Figure 4.6 suggests that
these changes lead to a gradually increasing inflow into disability benefits among women
aged 60-64, which runs counter to the trend in other age groups or for men in the 60-64 age
group.
D. Different pathways into retirement
None of the possible explanations described above sufficiently explain the substantial
age bias of disability benefit recipiency in Luxembourg. The most important factor here is
likely to be related to a different way of treating older applicants for a disability benefit, for
example a higher likelihood that the labour market disadvantage of older people with
Figure 4.5. Age top-up to disability benefits in Spain moves net replacement rates above those of unemployment benefits
Net replacement rates of partial (“total”) incapacity benefits at ages 40 and 56 and unemployment benefits, Spain 2005a
a) Net replacement rates: ratio of household net income after becoming inactive and receiving disability benefit orunemployment benefit to household net income when earning 40% through 200% of average earnings. Estimatesrefer to a 40-year-old person (56-year-old in case of top-up IB) with a full earnings history since age 18.
Source: Special module of OECD tax-benefit model. Information provided by national authorities.
��
���
��
��
��
���
��
���
��
�
�
��
�� ��
��
�
��� �� ��� ��� ��� �� �� �� ��� �� ��� ��� ��� ����
/��� ����������� �������� � ������� 67��4$
-"�%&�!'%�"�
���� �� ����
=!�����"1�&�1��'���"�/��<�������
=!�����"1�&�1��'���"�/��<�������
�����(
5��1�"�����!/������������"�"��
�����(
5��1�"�����!/������������"�"��
SICKNESS, DISABILITY AND WORK: BREAKING THE BARRIERS – VOL. 2 – ISBN 978-92-64-03815-8 – © OECD 2007118

4. FINANCIAL INCENTIVES AND DISINCENTIVES FOR PEOPLE WITH DISABILITY
disability is taken into account by gatekeepers – even if this should formally not be the case –
or a continuation of the pre-1997 application of benefit regulations, i.e. a continued
granting of disability benefits to workers over age 55 with partially-reduced work
capacities. Therefore the number of disability beneficiaries aged 50 and over exceeds by
ten times the number of persons on formal early retirement in Luxembourg (Hartmann-
Hirsch, 2006).
Nonetheless, disability benefits are often used as early retirement pathways also in
the other three countries. Blanco (2000), for instance, finds that in Spain the exit to early
retirement via disability insurance is particularly favoured in the public sector and for self-
employed individuals. This is not to say that disability benefits are the only or even the
main instrument to anticipate retirement. All four countries have retirement options
before the legal retirement age in place, such as early retirement, advance retirement with
adjusted benefits, quasi-retirement through the unemployment benefit system, or
retirement through second-pillar pension schemes. Therefore, rather than 65 years, the
earliest possible retirement age is 55 years in Australia,5 57 years in Luxembourg, and
60 years in Spain and the United Kingdom (OECD, 2006c).
Disability benefit is a major pathway to retirement, but not the only one. Table 4.3
looks at the frequency of disability and other benefits among persons with disability aged 50
to 64. The data suggest that disability benefits are the main early exit pathway for men in
Australia and the United Kingdom and women in Luxembourg, while they are only one of
several options for women in Australia and the United Kingdom, men in Luxembourg and
for men and women in Spain.
In sum, both demographic and benefit design features explain much of the age bias in
disability benefit systems. These seem partly be used as a pathway into early retirement,
especially in Luxembourg. Disability benefit is, however, not necessarily a “surrogate” for
early retirement. On the contrary, its use as an early retirement tool is frequent in countries
with an established and widespread early retirement culture.
Figure 4.6. Australia: changes in old-age pension rules influenced disability inflow
Inflow rates into disability benefits (DSP) by age and gender, 2005
Source: Department of Employment and Workplace Relations (DEWR).
��
��
���
���
���
�����
��
��
���
���
�
���
��� ���
��#��
�� �� ��� ���� ��� ��� �� �� ���
��#����#�� ��#��
�#��#� �#� ��#���#�
4�� �5 �
SICKNESS, DISABILITY AND WORK: BREAKING THE BARRIERS – VOL. 2 – ISBN 978-92-64-03815-8 – © OECD 2007 119
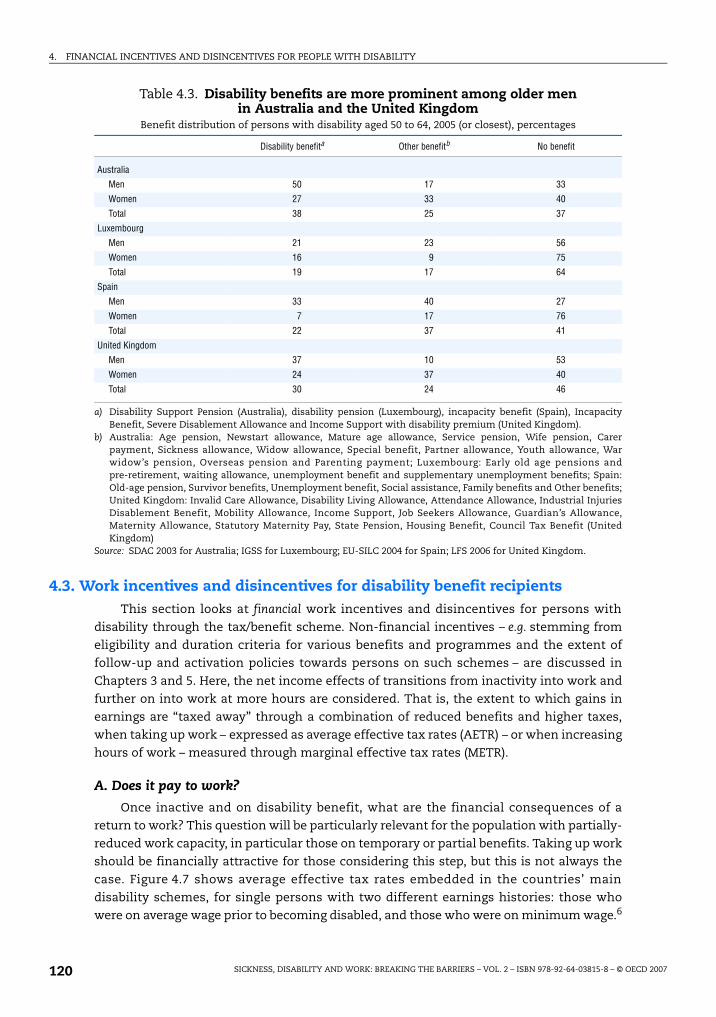
4. FINANCIAL INCENTIVES AND DISINCENTIVES FOR PEOPLE WITH DISABILITY
4.3. Work incentives and disincentives for disability benefit recipientsThis section looks at financial work incentives and disincentives for persons with
disability through the tax/benefit scheme. Non-financial incentives – e.g. stemming from
eligibility and duration criteria for various benefits and programmes and the extent of
follow-up and activation policies towards persons on such schemes – are discussed in
Chapters 3 and 5. Here, the net income effects of transitions from inactivity into work and
further on into work at more hours are considered. That is, the extent to which gains in
earnings are “taxed away” through a combination of reduced benefits and higher taxes,
when taking up work – expressed as average effective tax rates (AETR) – or when increasing
hours of work – measured through marginal effective tax rates (METR).
A. Does it pay to work?
Once inactive and on disability benefit, what are the financial consequences of a
return to work? This question will be particularly relevant for the population with partially-
reduced work capacity, in particular those on temporary or partial benefits. Taking up work
should be financially attractive for those considering this step, but this is not always the
case. Figure 4.7 shows average effective tax rates embedded in the countries’ main
disability schemes, for single persons with two different earnings histories: those who
were on average wage prior to becoming disabled, and those who were on minimum wage.6
Table 4.3. Disability benefits are more prominent among older men in Australia and the United Kingdom
Benefit distribution of persons with disability aged 50 to 64, 2005 (or closest), percentages
Disability benefita Other benefitb No benefit
Australia
Men 50 17 33
Women 27 33 40
Total 38 25 37
Luxembourg
Men 21 23 56
Women 16 9 75
Total 19 17 64
Spain
Men 33 40 27
Women 7 17 76
Total 22 37 41
United Kingdom
Men 37 10 53
Women 24 37 40
Total 30 24 46
a) Disability Support Pension (Australia), disability pension (Luxembourg), incapacity benefit (Spain), IncapacityBenefit, Severe Disablement Allowance and Income Support with disability premium (United Kingdom).
b) Australia: Age pension, Newstart allowance, Mature age allowance, Service pension, Wife pension, Carerpayment, Sickness allowance, Widow allowance, Special benefit, Partner allowance, Youth allowance, Warwidow’s pension, Overseas pension and Parenting payment; Luxembourg: Early old age pensions andpre-retirement, waiting allowance, unemployment benefit and supplementary unemployment benefits; Spain:Old-age pension, Survivor benefits, Unemployment benefit, Social assistance, Family benefits and Other benefits;United Kingdom: Invalid Care Allowance, Disability Living Allowance, Attendance Allowance, Industrial InjuriesDisablement Benefit, Mobility Allowance, Income Support, Job Seekers Allowance, Guardian’s Allowance,Maternity Allowance, Statutory Maternity Pay, State Pension, Housing Benefit, Council Tax Benefit (UnitedKingdom)
Source: SDAC 2003 for Australia; IGSS for Luxembourg; EU-SILC 2004 for Spain; LFS 2006 for United Kingdom.
SICKNESS, DISABILITY AND WORK: BREAKING THE BARRIERS – VOL. 2 – ISBN 978-92-64-03815-8 – © OECD 2007120
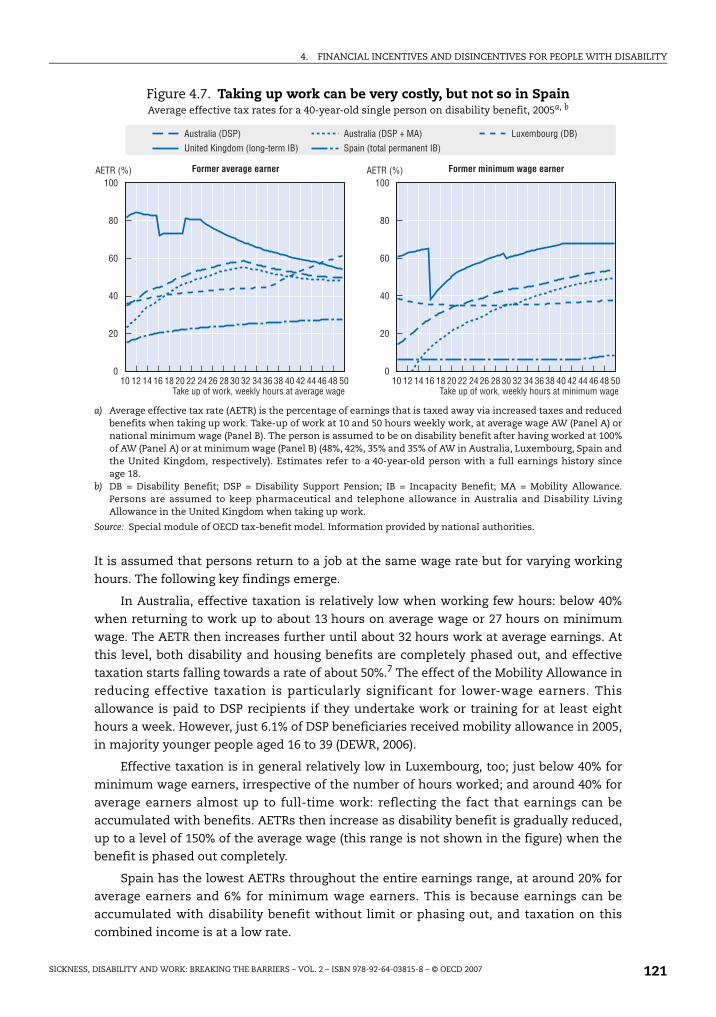
4. FINANCIAL INCENTIVES AND DISINCENTIVES FOR PEOPLE WITH DISABILITY
It is assumed that persons return to a job at the same wage rate but for varying working
hours. The following key findings emerge.
In Australia, effective taxation is relatively low when working few hours: below 40%
when returning to work up to about 13 hours on average wage or 27 hours on minimum
wage. The AETR then increases further until about 32 hours work at average earnings. At
this level, both disability and housing benefits are completely phased out, and effective
taxation starts falling towards a rate of about 50%.7 The effect of the Mobility Allowance in
reducing effective taxation is particularly significant for lower-wage earners. This
allowance is paid to DSP recipients if they undertake work or training for at least eight
hours a week. However, just 6.1% of DSP beneficiaries received mobility allowance in 2005,
in majority younger people aged 16 to 39 (DEWR, 2006).
Effective taxation is in general relatively low in Luxembourg, too; just below 40% for
minimum wage earners, irrespective of the number of hours worked; and around 40% for
average earners almost up to full-time work: reflecting the fact that earnings can be
accumulated with benefits. AETRs then increase as disability benefit is gradually reduced,
up to a level of 150% of the average wage (this range is not shown in the figure) when the
benefit is phased out completely.
Spain has the lowest AETRs throughout the entire earnings range, at around 20% for
average earners and 6% for minimum wage earners. This is because earnings can be
accumulated with disability benefit without limit or phasing out, and taxation on this
combined income is at a low rate.
Figure 4.7. Taking up work can be very costly, but not so in SpainAverage effective tax rates for a 40-year-old single person on disability benefit, 2005a, b
a) Average effective tax rate (AETR) is the percentage of earnings that is taxed away via increased taxes and reducedbenefits when taking up work. Take-up of work at 10 and 50 hours weekly work, at average wage AW (Panel A) ornational minimum wage (Panel B). The person is assumed to be on disability benefit after having worked at 100%of AW (Panel A) or at minimum wage (Panel B) (48%, 42%, 35% and 35% of AW in Australia, Luxembourg, Spain andthe United Kingdom, respectively). Estimates refer to a 40-year-old person with a full earnings history sinceage 18.
b) DB = Disability Benefit; DSP = Disability Support Pension; IB = Incapacity Benefit; MA = Mobility Allowance.Persons are assumed to keep pharmaceutical and telephone allowance in Australia and Disability LivingAllowance in the United Kingdom when taking up work.
Source: Special module of OECD tax-benefit model. Information provided by national authorities.
���
��
��
��
�
���
��
��
�
�
��
�
�� �� � ���� �� ����� � � � �� �� ���� ��� �� � ���� �� ����� � � � �� �� ���� �
8��� ������������� � ��� �8��� ���2 ��� � ��� �
)*��������� ,5
-"�����.�"��!%���!"�#���%�39
)$=���(
=�;��*&�!/�:!�;<�:��;�'��!*��������������:���
)$=���(
=�;��*&�!/�:!�;<�:��;�'��!*������%�"�%*%�:���
)*��������� ,5�?�B) +*��%�!*���� 9
,&��"���!����&��%�"�"��39
SICKNESS, DISABILITY AND WORK: BREAKING THE BARRIERS – VOL. 2 – ISBN 978-92-64-03815-8 – © OECD 2007 121

4. FINANCIAL INCENTIVES AND DISINCENTIVES FOR PEOPLE WITH DISABILITY
Average effective taxation for single average earners is high in the United Kingdom:
around 80% when taking up work up to three days per week, and still around 60% when in
full-time work. The two in-work benefits (WTC, RTWC)8 designed to motivate sizeable
take-up of work come into play only between 16 and 21 hours of work at average earnings.
This is because both tax credits are phased out rather quickly and are terminated at low
earnings limits – around half the average wage level. The effective taxation features are
somewhat more favourable for persons with disability taking up minimum wage jobs. In
particular, the two in-work benefits are now available starting from 16 hours across the
whole earnings range shown in Panel B. Still, AETRs for minimum wage earners at full-time
40 hour work are higher in the United Kingdom than in the other three countries.
Household composition can influence financial work incentives for disability
beneficiaries, especially in case of withdrawal of child or family-related benefits, or
different earnings disregards depending on the activity of the partner. In Australia, for
instance, AETRs are much lower for persons with disability who live with an inactive
spouse because disability benefit is higher and can be combined with earnings slightly
above average earnings (Annex Figure 4.A1.2). In turn, in the United Kingdom, two-earner
couples (with and without children) face lower AETRs than other household groups. There
are no great differences across households in Luxembourg and Spain.
Additional non-contributory disability schemes exist in Luxembourg, Spain and the
United Kingdom. Recipients of these benefits face lower AETRs than contributory benefit
recipients in the former two countries, but higher ones in the United Kingdom, due to
lower earnings disregards.
B. The impact of increasing work efforts
The discussion above has focused on inactive disability benefit recipients and the
consequences when taking up work. A different yet important question arises for those
persons with disability who are in work already drawing a (partial) disability benefit and
considering working more hours. Table 4.4 considers the financial consequences of
increasing working hours for a person with a disability, in four steps: from 0 to 10 hours
(marginal work), from 10 to 20 hours (part-time work), from 20 to 30 hours (considerable
part-time work) and from 30 to 40 hours (full-time work). Again, two cases are considered:
the person is assumed to have worked at average or minimum wage earnings before
having become disabled, and again to be taking up work at this earnings level and receiving
a partial disability benefit, if eligible.
There are a few “zones” of increases in working hours with only limited financial
awards from working more, i.e. with marginal effective tax rates close to 100%. In such
cases, persons are encouraged to stay in their current benefit position despite their wish to
become more active due to, for instance, improvements in their health condition. Such
“zones” often occur when a disability benefit is suspended – taking account of other benefit
reductions and taxation.
First, increasing working hours seems to be more attractive – in that less of additional
earnings are “taxed away” – for minimum than average wage earners. Two exceptions are
noteworthy and they occur in Australia and the United Kingdom: for minimum wage
earners with disability it is less attractive to increase work to full-time hours than is the
case of average earners. In the United Kingdom, as much as 90% of the earnings increase
from 30 to 40 hours is taxed away.9
SICKNESS, DISABILITY AND WORK: BREAKING THE BARRIERS – VOL. 2 – ISBN 978-92-64-03815-8 – © OECD 2007122

4. FINANCIAL INCENTIVES AND DISINCENTIVES FOR PEOPLE WITH DISABILITY
Second, for average earners in Australia, Luxembourg and Spain engaging in work
entails lower METRs than increasing the number of hours worked; hence the issue seems to
be more one of a low-wage (poverty) trap than that of an inactivity trap.10 In the
United Kingdom, however, the opposite situation is found, a diagnosis which is confirmed in
a recent policy study on work incentives for disability benefit claimants (Blackman, 2006).
Third, a few country-specific features emerge. In Spain, METRs are impressively low
throughout the working hours range, again reflecting the unlimited possibility to combine
benefits with earnings from another occupation. In Luxembourg, the level of effective
taxation also seems to be more stable across the earnings range than in the two English-
speaking countries. Finally, for average earners with disability in Australia and the United
Kingdom, a move from part-time to full-time work seems much more attractive than
marginally increasing part-time work.
4.4. The impact of recent and planned benefit reforms on work incentivesAll four countries are in the process of reforming parts of their disability benefit
schemes, focusing in particular on people with partially-reduced work capacities
(Chapters 2 and 3). While these reforms are much broader in scope than simple changes to
benefit parameters, the financial implications of these changes are important for the
attraction of these benefits. This section considers the financial effects of benefit reforms
on replacement incomes and work incentives.11
A. Australia
Since 1st July 2006, persons who are assessed as being able to work for 15 to 29 hours
per week at award wages in the open labour market are no longer entitled to disability
benefit (DSP) but are placed on the Australian unemployment scheme, Newstart Allowance
(NSA). As a financial consequence, these persons receive lower income support payment
rates. Further, and equally important for employment considerations, a lower amount of
earnings can be accumulated with NSA than with DSP, and benefit withdrawal rates (“taper
Table 4.4. Increasing working hours is not always very attractive for workers with disability
Marginal effective tax rates for those receiving full or partial disability benefits, percentage of earnings, 2005a
Increase in working time
0 >> 10 hours 10 >>> 20 hours 20 >>> 30 hours 30 >>> 40 hours
Australia Average earner 35 65 73 38
Minimum wage earner 14 53 61 66
Luxembourg Average earner 36 47 48 70
Minimum wage earner 39 31 35 39
Spain Average earner 15 29 29 33
Minimum wage earner 6 6 6 6
United Kingdom Average earner 81 64 65 33
Minimum wage earner 61 40 79 90
a) Average earnings refer to average wage (AW). Marginal effective tax rate (METR) is the percentage of earnings thatis taxed away via increased taxes and reduced benefits when increasing working hours. The hourly wage is at theAW level (first line) or national minimum wage level (second line). The person is assumed to be on (partial)disability benefit, provided such benefit exists. Estimates refer to a 40-year-old single person with an earningshistory of 22 years at AW respectively minimum wage earnings. Figures in italics refer to situations where nomore disability benefits are granted.
Source: Special module of OECD tax-benefit model. Information provided by national authorities.
SICKNESS, DISABILITY AND WORK: BREAKING THE BARRIERS – VOL. 2 – ISBN 978-92-64-03815-8 – © OECD 2007 123
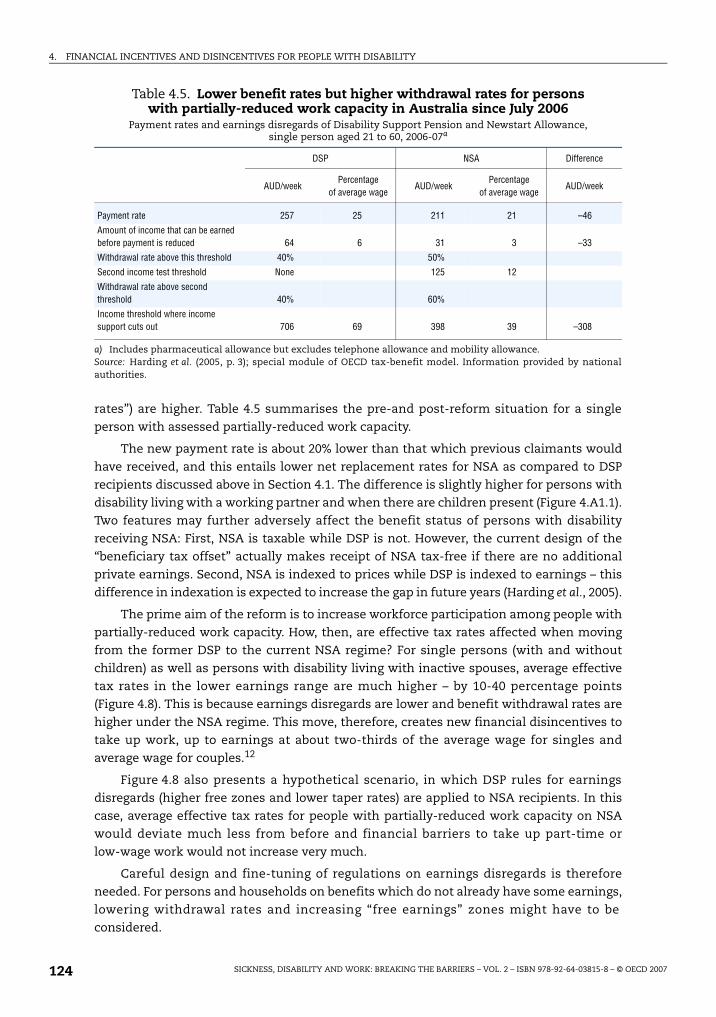
4. FINANCIAL INCENTIVES AND DISINCENTIVES FOR PEOPLE WITH DISABILITY
rates”) are higher. Table 4.5 summarises the pre-and post-reform situation for a single
person with assessed partially-reduced work capacity.
The new payment rate is about 20% lower than that which previous claimants would
have received, and this entails lower net replacement rates for NSA as compared to DSP
recipients discussed above in Section 4.1. The difference is slightly higher for persons with
disability living with a working partner and when there are children present (Figure 4.A1.1).
Two features may further adversely affect the benefit status of persons with disability
receiving NSA: First, NSA is taxable while DSP is not. However, the current design of the
“beneficiary tax offset” actually makes receipt of NSA tax-free if there are no additional
private earnings. Second, NSA is indexed to prices while DSP is indexed to earnings – this
difference in indexation is expected to increase the gap in future years (Harding et al., 2005).
The prime aim of the reform is to increase workforce participation among people with
partially-reduced work capacity. How, then, are effective tax rates affected when moving
from the former DSP to the current NSA regime? For single persons (with and without
children) as well as persons with disability living with inactive spouses, average effective
tax rates in the lower earnings range are much higher – by 10-40 percentage points
(Figure 4.8). This is because earnings disregards are lower and benefit withdrawal rates are
higher under the NSA regime. This move, therefore, creates new financial disincentives to
take up work, up to earnings at about two-thirds of the average wage for singles and
average wage for couples.12
Figure 4.8 also presents a hypothetical scenario, in which DSP rules for earnings
disregards (higher free zones and lower taper rates) are applied to NSA recipients. In this
case, average effective tax rates for people with partially-reduced work capacity on NSA
would deviate much less from before and financial barriers to take up part-time or
low-wage work would not increase very much.
Careful design and fine-tuning of regulations on earnings disregards is therefore
needed. For persons and households on benefits which do not already have some earnings,
lowering withdrawal rates and increasing “free earnings” zones might have to be
considered.
Table 4.5. Lower benefit rates but higher withdrawal rates for persons with partially-reduced work capacity in Australia since July 2006
Payment rates and earnings disregards of Disability Support Pension and Newstart Allowance, single person aged 21 to 60, 2006-07a
DSP NSA Difference
AUD/weekPercentage
of average wageAUD/week
Percentage of average wage
AUD/week
Payment rate 257 25 211 21 –46
Amount of income that can be earned before payment is reduced 64 6 31 3 –33
Withdrawal rate above this threshold 40% 50%
Second income test threshold None 125 12
Withdrawal rate above second threshold 40% 60%
Income threshold where income support cuts out 706 69 398 39 –308
a) Includes pharmaceutical allowance but excludes telephone allowance and mobility allowance.Source: Harding et al. (2005, p. 3); special module of OECD tax-benefit model. Information provided by nationalauthorities.
SICKNESS, DISABILITY AND WORK: BREAKING THE BARRIERS – VOL. 2 – ISBN 978-92-64-03815-8 – © OECD 2007124

4. FINANCIAL INCENTIVES AND DISINCENTIVES FOR PEOPLE WITH DISABILITY
B. Luxembourg
In the course of the new redeployment procedure, persons with partially-reduced
work capacity in Luxembourg who cannot be redeployed within their former firm are
registered as unemployed and entitled to unemployment benefits as well as labour market
programmes (external redeployment). At expiration of unemployment benefit after one
year, the person is entitled to a waiting allowance, paid at the level of a regular disability
benefit.
When being on unemployment benefit, however, taking up paid work is connected
with much higher effective tax rates than when being on disability benefit. A single person
and former average earner on disability benefit who takes up work between one-third and
100% of the average wage loses EUR 4-5 for a gain in gross earnings of EUR 10. The same
person on unemployment benefit loses EUR 8-9 (Figure 4.9). The difference is even higher
for persons with disability living with a partner and children, as the unemployment benefit
in Luxembourg has a top-up for dependent children.
In this respect, the situation in Luxembourg for people with partial work capacities
resembles the one in Australia: they face higher effective tax rates when being on
unemployment rolls and taking up work at certain levels. However, while in Australia this
increased effective taxation is mainly due to lower earnings disregards and higher
withdrawal rates under unemployment, in Luxembourg these are only one part of the
explanation. The other reason is the higher rate of unemployment benefit during the first
year.13
Figure 4.8. Australia: moving from DSP to NSA increases work disincentives for lower-earning singles and inactive couples
Average effective tax rates for people with partially-reduced work capacity in Australia under three scenarios: former full disability benefit (DSP), new benefit (NSA)
and new benefit with former earnings disregardsa, b
a) Average effective tax rate (AETR) is the percentage of earnings that is taxed away via increased taxes and reducedbenefits when taking up work. Take up of work at 33-133% of average wage (AW). The person is assumed to be onbenefit after having worked at 100% of AW.
b) The figures apply 2006/07 rules to 2005 data. Includes pharmaceutical and telephone allowance but not mobilityallowance. NSA and DSP rules for earnings disregards and withdrawal rates as in Table 4.5.
Source: Special module of OECD tax-benefit model. Information provided by national authorities.
���
��
��
��
��
�
���
��
��
�
�
��
�� ��
��
�
�� �� �� �� ���
�
��
��
�
��
��
��
�
��
���
��
�� �� �� �� �� �� �� ��
��
��
��
��
�
9� � ��� ������ ���� �� ����
8*������������'���"�/���� ,5
5���������"�/����1�"���!���,)�/!�����������:���� ,5�����������
)$=���(
5��1�"�����!/������������"�"��
)$=���(
5��1�"�����!/������������"�"��
5����������������'���"�/�����,)�/!����������
SICKNESS, DISABILITY AND WORK: BREAKING THE BARRIERS – VOL. 2 – ISBN 978-92-64-03815-8 – © OECD 2007 125

4. FINANCIAL INCENTIVES AND DISINCENTIVES FOR PEOPLE WITH DISABILITY
After one year, unemployment benefit payments stop and an unemployed person is
entitled to social assistance (RMG), as there is no unemployment assistance scheme in
Luxembourg. AETRs of single social assistance beneficiaries are also very high at the lower-
earnings range because social assistance is phased out much quicker when taking up work.
AETRs for persons with disability living with active partners and without access to either
unemployment or disability benefit are lower because the earnings of the partner (assumed
here at two-thirds of average wage) are incompatible with social assistance eligibility.
These results underline the importance of availability of in-work benefits for those
persons with disability who move from unemployment rolls into work and become
externally redeployed – the compensatory benefits which cover the earnings difference
between the new and the old job (up to five times the social minimum wage) are designed
to fulfil this role. The results also suggest that the relatively high net replacement level of
unemployment benefits may penalise work efforts which could contribute to explaining
the relative failure of the redeployment process in Luxembourg to date.
C. Spain
While there are a number of parametric reforms to the contributory disability benefit
formula under discussion, none of these has so far been implemented. Discussions
concern possible reductions in the insurance period for younger ages; extension of minima
for younger age groups; equivalency of the calculation procedure with that of retirement;
and a new system of calculation of the disability complements in order to improve the
lowest benefits. More generally, an “Agreement on Social Security” reached, in July 2006,
between the government and social partners is expected to lead to an overall reform of
invalidity and other working-age benefits.
Figure 4.9. Luxembourg: being on unemployment rather than disability benefitcan imply doubling of average effective taxation when taking up work
Average effective tax rates for persons on disability and unemployment benefit and social assistance, Luxembourg, 2005a
a) Average effective tax rate (AETR) is the percentage of earnings that is taxed away via increased taxes and reducedbenefits when taking up work. Take up of work at between 33-133% of average wage (AW). Second earner in thetwo-earner couple assumed to work at 67% of AW, children aged four and six.
Source: Special module of OECD tax-benefit model. Information provided by national authorities.
���
��
��
��
��
�
���
��
��
�
�
��
�� ��
��
�
�� �� �� �� ���
�
��
��
�
��
��
��
�
��
���
��
�� �� �� �� �� �� �� ��
��
��
��
��
�
.��� ��� ������ ��������������� ����� �� ����)$=���(
5��1�"�����!/������������"�"��
)$=���(
5��1�"�����!/������������"�"��
��������'���"�/�� -"�%&�!'%�"����"�/���B4���!1�����������"1�
SICKNESS, DISABILITY AND WORK: BREAKING THE BARRIERS – VOL. 2 – ISBN 978-92-64-03815-8 – © OECD 2007126

4. FINANCIAL INCENTIVES AND DISINCENTIVES FOR PEOPLE WITH DISABILITY
At the same time, important changes were recently made to earnings conditions for
people on non-contributory disability benefit. This scheme has been established in 1990 as a
pure subsistence scheme for uncovered persons with disability. Until 1997, take up of work
for these people meant automatic loss of eligibility to this benefit. In that year, unlimited
linking rules were introduced and the persons concerned had a right to return to the
benefit once they stopped working. Finally, in 2005 disregards were introduced, allowing
the combination of benefits with earnings up to the level of the benefit indicator IPREM14
(about EUR 6 600 per year), and at a reduced rate up to 1.5 times this indicator level.
This change lead to a consequent fall in average effective tax rates in the lower
earnings range as shown in Figure 4.10. When taking up work up to one-third the average
wage, non-contributory beneficiaries now lose less than EUR 1 on every EUR 10 gross
earnings gain, while it was EUR 7-9 prior to the reform (working for a marginal amount was
even penalising). When increasing work from one-third to half the average wage, average
effective taxation increases to about 20% but still remains considerably lower than the
50-70% AETRs before the reform.
This new regulation has increased work incentives at low income levels considerably.
For it to be more effective in increasing employment, the new rules need to be advertised to
a much larger extent. Currently, of the 200 000 people on non-contributory disability
benefits, only 2.5% are taking advantage of the new earnings disregard (information provided
by IMSERSO). Moreover, an increase of the earnings disregard, as well as extending the period
of possible accumulation with benefits would further increase the motivating effects of this
measure. In case of permanent disability, the possibility of accumulating benefits with a
certain amount of earnings could be given on a permanent basis.
Figure 4.10. Spain: reform of non-contributory benefits significantly increased work incentives in the lower earnings range
Average effective tax rates for a single person on non-contributory benefits, 2005a, b
a) Average effective tax rate (AETR) is the percentage of earnings that is taxed away via increased taxes and reducedbenefits when taking up work. Take up of work at between 25-100% of average wage (AW).
b) The figures apply pre- and post-2005 rules to 2005 data.
Source: Special module of OECD tax-benefit model. Information provided by national authorities.
���
��
��
��
��
��
��
�
�
��
�� � � �� �� �� �� �� �� �� �� �� �� �� �� ���
)$=���(
�!"#1!"����*�!�'���"�/�� �!"#1!"����*�!�'���"�/�����/!������ ,!1�����������"1�
5��1�"�����!/������������"�"��
SICKNESS, DISABILITY AND WORK: BREAKING THE BARRIERS – VOL. 2 – ISBN 978-92-64-03815-8 – © OECD 2007 127

4. FINANCIAL INCENTIVES AND DISINCENTIVES FOR PEOPLE WITH DISABILITY
D. United Kingdom
A number of structural reforms have been undertaken in the past years. On the tax/
benefit side, these efforts have been supported by the availability of a disability element
and a severe disability element to the basic rate of the Working Tax Credit (WTC), as well as
the introduction of an additional Return to Work Credit (RTWC). It has been estimated that,
without the disability elements of WTC, one-tenth of disability beneficiaries taking up
part-time work at minimum wage would lose out significantly but this falls to 3% when
these elements are considered, and 0% if RTWC is available in addition (Blackman, 2006).
However, take-up of the disability elements of WTC is low.
A major benefit reform is in preparation which will replace the current disability
benefit including supplements by a new Employment and Support Allowance (ESA). This
will also replace current disability premia to social assistance (income support), but not
Disability Living Allowance. ESA will consist of a basic rate which equals the current
unemployment benefit (GBP 56.20 a week in 2005) complemented by an Employment
Component for persons with partially-reduced work capacity which rewards those people
who take steps to make a return to work.
In the following, the OECD model is extended to look at possible effects of such a
benefit change on net replacement and average effective tax rates. Two scenarios for the
level of the employment component are considered: GBP 20 and GBP 30, so that the
assumed levels of total ESA amount to GBP 76.20 and GBP 86.20, respectively, a range often
put forward in policy debates (e.g. Blackman, 2006). It can be seen from Figure 4.11 that
both levels of ESA result in net replacement rates relatively close to those obtained from
long-term incapacity benefit, more so for singles than one-earner couples. Further, the
Figure 4.11. United Kingdom: net replacement income from new Employment and Support Allowance is likely to be similar to incapacity benefit
Net replacement rates for incapacity benefit, possible Employment and Support Allowance(low and high hypothesis) and unemployment benefit, 2005a, b
a) Net replacement rates: ratio of household net income after becoming inactive and receiving disability benefit orunemployment benefit or social assistance to household net income when earning 40-200% of average earnings.Estimates refer to a 40-year-old person with an earnings history of 22 years at average earnings
b) Includes Disability Living Allowance for persons on IB or ESA.
Source: Special module of OECD tax-benefit model. Information provided by national authorities.
��
���
��
��
��
���
��
��
�
�
��
��
�
�� �� ��� �� ��� ��� ��� �� �� �� �� ��� �� ��� ��� ��� ��
9� � ��� ������ �������������� ����� �� ���������(
5��1�"�����!/������������"�"��
�����(
5��1�"�����!/������������"�"��
+!"�#��%�39 I,)��*"�%&�!'%�"� $,)������������$,)��!:�������
SICKNESS, DISABILITY AND WORK: BREAKING THE BARRIERS – VOL. 2 – ISBN 978-92-64-03815-8 – © OECD 2007128

4. FINANCIAL INCENTIVES AND DISINCENTIVES FOR PEOPLE WITH DISABILITY
differences between the lower and higher ESA rate in terms of net replacement are often
negligible: 1-2 percentage points for single persons, and nil for one-earner couples. This
has to do with the interaction with other benefits; in particular, housing benefits and the
(standard) top-up to social assistance may lead to identical replacement rates.
The effects of a possible introduction of the Employment and Support Allowance on
financial incentives to work are clear-cut: average effective tax rates are slightly lower –
around 1-3 percentage points for singles, and around 5-8 percentage points for one-earner
couples, across the whole earnings range considered, i.e. taking up work becomes slightly
more attractive (Figure 4.12). Interestingly, the higher assumed ESA rate does not entail
higher effective tax rates.
Nonetheless, average effective tax rates in the United Kingdom for ESA recipients
would remain at a comparatively high level. Former average earners would still lose more
than 70% of their gains when entering work, except if they earn more than before or if they
earn between 40 and 50% of average wages in order to benefit from the tax credits. Even in
those cases, more than half of additional gross earnings are taxed away.
4.5. ConclusionsTaxes and benefits determine the adequacy of public net transfers provided to people
with disability but also the financial awards for those who take up work, in particular those
with partial work capacities. Across main disability benefit regimes, net replacement rates
are lower in Australia and the United Kingdom than in Luxembourg and Spain: for single
former average earners they amount to some 40 to 50% in the former two countries, and to
Figure 4.12. United Kingdom: taking up work becomes slightly more attractive with the new Employment and Support Allowance
Average effective tax rates for incapacity benefit and a possible Employment and Support Allowance(low and high hypothesis) and unemployment benefit, 2005a, b
a) Average effective tax rate: percentage of earnings that is taxed away via increased taxes and reduced benefitswhen taking up work. Take-up of work at between 33-133% of average earnings (AW). Estimates refer to a 40-year-old person with an earnings history of 22 years at average earnings.
b) It is assumed that (IB and ESA) beneficiaries keep their Disability Living Allowance upon moving into work.
Source: Special module of OECD tax-benefit model. Information provided by national authorities.
���
��
��
��
��
�
���
��
��
�
�
��
�� ��
��
�
�� �� �� �� ���
�
��
��
�
��
��
��
�
��
���
��
�� �� �� �� �� �� �� ��
��
��
��
��
�
9� � ��� ������ �������������� ����� �� ����)$=���(
5��1�"�����!/������������"�"��
)$=���(
5��1�"�����!/������������"�"��
+!"�#���%�39 $,)������������$,)��!:�������
SICKNESS, DISABILITY AND WORK: BREAKING THE BARRIERS – VOL. 2 – ISBN 978-92-64-03815-8 – © OECD 2007 129

4. FINANCIAL INCENTIVES AND DISINCENTIVES FOR PEOPLE WITH DISABILITY
65 to 75% in the latter. However, under certain circumstances and conditions, top-up
payments can significantly increase the net replacement rate: this is the case for persons
with disability who receive a supplement for daily living expenses (DLA in the United
Kingdom), for advanced age (Luxembourg and Spain), for dependent spouses (Spain and
the United Kingdom) and those with children.
In the short run, i.e. upon leaving the labour market, disability benefits appear to be
only slightly more “attractive” than unemployment benefits in the two English speaking
countries and in the higher-incomes part in Spain (above average earnings) and
Luxembourg (above twice average earnings). However, disability benefits are expected to
provide a much more “permanent” source of replacement income than unemployment
benefits.
Even when account is taken for the ageing of populations, disability benefits are
heavily biased toward elder population groups and often used as a pathway into early
retirement. This is particularly the case in Spain and even more so in Luxembourg. In
Spain, this has partly to do with a significant age top-up to the disability benefit from the
age of 56 which is combined with an inactivity condition. In Luxembourg, a widespread
and established “early retirement culture” leads to a take-up of disability benefit after
age 50 which is ten times higher than that of the formal early retirement benefit.
The step to paid work can be costly for a person with a disability (“inactivity trap”), as
can be the decision to increase working hours or earnings (“low-wage trap”). Depending on
the country, between 40% and 65% of the gains in gross earnings are taxed away when
taking up full-time work at either minimum or average earnings. The inactivity trap
appears to be more of an issue in the United Kingdom, despite availability of in-work
benefits: people who formerly earned the average wage returning to part-time (or lower
wage) jobs face effective tax rates of 70% to 80%. In all four countries, marginal effective tax
rates can increase significantly depending on the (additional) work efforts a person with a
disability is undertaking.
Recent and planned policy reforms have only partly responded to these concerns, if at all.
More consideration is needed, in three areas. First, current regulations for combining disability
benefit with earnings need to be redesigned and adapted to the new employment integration
focus. In some cases, the amount of permitted earnings simply seems too low to make work in
excess of marginal work attractive (Australia, United Kingdom). In other cases, take up of
otherwise carefully designed regulations needs to be promoted (non-contributory benefit
in Spain).
Second, benefits paid conditional to employment may prove a powerful tool to
increase work incentives but need to be extended or implemented. There are again
problems of coverage and take-up (Mobility Allowance in Australia, compensatory
allowance for externally redeployed workers in Luxembourg). There are also problems of
design where tax credits to take up work concern only a small part of the possible earnings
range (United Kingdom). No such payments or allowances exist specifically for persons
with disability in Spain.
Third, a better co-ordination of the different benefit schemes is needed. The fact that
the recent move of people with partial work capacities from disability to unemployment
benefit in Australia leads to higher marginal tax rates needs to be given careful attention.
Age specific top-ups to contributory disability benefit (Spain) and early retirement cultures
(Luxembourg) which lead to withdrawal from the labour market need to be reconsidered.
SICKNESS, DISABILITY AND WORK: BREAKING THE BARRIERS – VOL. 2 – ISBN 978-92-64-03815-8 – © OECD 2007130
4. FINANCIAL INCENTIVES AND DISINCENTIVES FOR PEOPLE WITH DISABILITY
Notes
1. The lower average figures for Australia and the United Kingdom are explained by thecharacteristics of these schemes. For persons with disability in the lowest two income deciles inAustralia, for instance, public transfers constitute some 70% of total income.
2. This general conclusion refers to the overall impact of these benefits among the total working-agepopulation in 2000 (Förster and Mira d’Ercole, 2005).
3. In 2005, 41% of all disability benefit recipients in the United Kingdom also received DLA, and thelarge majority of all DLA recipients received a disability benefit. The models assumes that theyreceive the lower-rate mobility component and the middle-rate care component of DLA, becausethis is the single most frequent DLA case (concerning 17% of all DLA recipients in 2005). DLA ratesrange from GBP 15.6 to GBP 99.9 a week in 2005. With higher or lower DLA entitlements, resultscould look quite different. Finally, further down in the chapter it is assumed that, upon movinginto work, long-term disability benefit recipients keep their DLA entitlement.
4. Note that unemployment benefit too has age-specific regulations in Spain in that unemployedpersons aged 52 and above are eligible for unlimited benefit duration. This does, however, notchange the level of the benefit and, thus, the net replacement rate.
5. The possibility to retire at age 55 in Australia refers to mandatory occupational pensions (throughthe superannuation scheme), while age 57 in Luxembourg requires 40 years of actualcontributions.
6. These two earnings groups are considered “typical” and thus most relevant for policyconsiderations. For the United Kingdom, there is some evidence that the majority of those movingfrom disability rolls into work earn around the minimum wage (Blackman, 2006). Note that inearnings-related benefit systems (Luxembourg, Spain), assuming lower past earnings will lead tolower disability benefits. On the other hand, in the United Kingdom, work incentive indicators willbe influenced by the fact that lower limits for working tax credits are specified in terms of hours(13 and 30, respectively) rather than earnings levels while upper limits are expressed in terms ofincome. Therefore, tax credits predominantly cover lower-wage earners.
7. The Australian Disability Support Pension is completely phased out at the level of 67% of AW andrent allowance at 79% of AW.
8. For the United Kingdom, the model assumes full take-up of both the basic and the disabilityelement of Working Tax Credit (WTC) and of RTWC (Return to Work Credit) as well.
9. METRs in this case are equally high for other household constellations, between 70% (two-earnercouples) and 95% (one-earner couple with children).
10. It is commonly believed that elasticities are much higher at the extensive margin (the decisionwhether to work at all or not) than at the intensive margin (once working, whether to increase ordecrease hours). Therefore, there is a good theoretic case for structuring income tests to encouragepeople at the margins of the labour market to take some work.
11. For that, the OECD tax-benefit models for the benchmark year 2005 have been modified to takeaccount of (possible) reforms. The resulting indicators therefore reflect 2005 values under reformassumptions.
12. However, it is worth noting that the situation can be inverse, namely in the case of persons withdisability living with partners who are working (assuming that the spouse works at two-thirds ofthe average wage). In that case, AETRs under the Australian NSA regime are actually lower. This isbecause earnings disregards are counted at the household level.
13. For a single former average earner in Luxembourg with a full employment record, the grossunemployment benefit amounts to EUR 33 708 and the disability benefit to EUR 25 810 (the netvalues are EUR 26 413 and EUR 22 537, respectively).
14. IPREM (Indicador Público de Renta de Efectos Múltiples) is the reference indicator to determine differentsocial benefit amounts in Spain. It is approved each year in the Law of General Budgets of the Stateand corresponded to 32% of the average wage in 2005.
SICKNESS, DISABILITY AND WORK: BREAKING THE BARRIERS – VOL. 2 – ISBN 978-92-64-03815-8 – © OECD 2007 131
4. FINANCIAL INCENTIVES AND DISINCENTIVES FOR PEOPLE WITH DISABILITY
ANNEX 4.A1
Background Tables for Different Household Types
Income positions when persons are in work and when they are out of work are
strongly influenced by the level and design of taxation and available benefits and their
interaction with personal and household incomes. The analysis in Chapter 4 is based on
estimations from an additional module to the OECD tax-benefit model (OECD, 2005b), for
different groups of people with disability: those living alone, those living with inactive
spouses and those living with working spouses (with and without children for all three
constellations).
Table 4.A1.1 summarises the main features of the three countries’ disability benefit
systems, their taxation and the rules for combining benefits with labour earnings.*
Figure 4.A1.1 complements the results for single persons shown in Figure 4.1, with
estimates on net replacement rates for disability benefits, unemployment benefits and
social assistance for two other household types: a person with a disability living with an
inactive spouse and one living with a lower-wage earning spouse and two children.
Figure 4.A1.2 presents average effective tax rates for different household types.
It should be noted that the incentive indicators presented in Chapter 4 do not take into
account a range of disability-related monetary and non-monetary policy instruments to
support living expenses which are available in all four countries. This concerns, in
particular, allowances or vouchers for public transport and preferential prices for special
equipment. The system of indirect support measures is perhaps most generalised in
Australia where all disability beneficiaries receive a “pensioner concession card” which
entitles them to a number of benefits, such as reductions in property and water rates,
reductions in energy bills, reduced fares on public transport or reductions on motor vehicle
registration. This concession card is linked to the benefit status while in the
United Kingdom the Disability Living Allowance, which fulfils a similar purpose, is not
discontinued should a person with a disability get off benefit rolls.
* A detailed description of the country-specific parameters of the disability systems that have beenused for the models is available at www.oecd.org/els/disability.
SICKNESS, DISABILITY AND WORK: BREAKING THE BARRIERS – VOL. 2 – ISBN 978-92-64-03815-8 – © OECD 2007132

4. FINANCIAL INCENTIVES AND DISINCENTIVES FOR PEOPLE WITH DISABILITY
Table
4.A
1.1.
Mai
n c
har
acte
rist
ics
of d
isab
ilit
y be
nef
it a
nd
tax
atio
n s
yste
ms,
as
at 1
stJu
ly20
05
Aust
ralia
Luxe
mbo
urg
Spai
nUn
ited
King
dom
Bene
fit s
chem
es
(cov
ered
in m
odel
)1.
DSP
(dis
abili
ty s
uppo
rt pe
nsio
n): u
nive
rsal
fla
t-rat
e be
nefit
, mea
ns a
nd a
sset
-test
ed
unle
ss b
lind.
1.Co
ntrib
utor
y DB
for e
mpl
oyee
s an
d se
lf-em
ploy
ed; b
enef
its d
epen
ding
on
the
dura
tion
of th
e af
filia
tion
(flat
-rat
e)
and
on c
ontri
butio
ns (e
arni
ngs-
rela
ted)
.
2.Sp
ecia
l min
imum
inco
me
sche
me
for
seve
rely
dis
able
d pe
rson
s (r
even
u po
ur
pers
onne
s gr
avem
ent h
andi
capé
es).
Four
type
s of
con
tribu
tory
DB
in c
ase
of p
erm
anen
t inc
apac
ity:
1a.
Parti
al p
erm
anen
t inc
apac
ity fo
r the
usu
al
occu
patio
n: lu
mp
sum
. 1b
.To
tal p
erm
anen
t inc
apac
ity fo
r the
usu
al
occu
patio
n: 5
5% o
f cal
cula
tion
basi
s (7
5% if
ove
r 55
and
out o
f wor
k).
1c.
Abso
lute
per
man
ent i
ncap
acity
: 10
0% o
f cal
cula
tion
basi
s.
1d.
Seve
re in
capa
city
: 150
% o
f cal
cula
tion
basi
s.
2.No
n-co
ntrib
utor
y fla
t-rat
e be
nefit
: EU
R 4
043.
06/y
ear f
or 6
5% d
isab
ility
; EU
R 6
064.
59/y
ear f
or 7
5% d
isab
ility
.
Two
type
s of
con
tribu
tory
inca
paci
ty b
enef
it (IB
) fo
r tho
se n
ot o
r no
long
er e
ligib
le to
sta
tuto
ry
sick
pay
: 1a
a.Sh
ort-t
erm
IB, l
ower
rate
:GB
P 55
.90/
wee
k (fi
rst 2
8w
eeks
). 1a
b.Sh
ort-t
erm
IB, h
ighe
r rat
e:
GBP
66.1
5/w
eek
(wee
ks 2
9-52
); el
igib
ility
su
bjec
t to
pers
onal
cap
abili
ty a
sses
smen
t. 1b
.Lo
ng-te
rm IB
: GBP
74.
15/w
eek
afte
r w
eek
522.
Inco
me
Supp
ort (
IS) i
nclu
ding
pre
mia
fo
r low
-inco
me
peop
le n
ot e
ligib
le fo
r IB,
or
as
a to
p-up
to IB
.
Bene
fit fo
rmul
aSi
ngle
, 21
or o
lder
: AUD
476
.30/
fortn
ight
; Co
uple
: AUD
397
.70/
fortn
ight
eac
h.Fl
at-r
ate
part:
EUR
344
.75
per m
onth
fo
r 40
year
s in
sura
nce;
inco
me-
rela
ted
part:
1.
85%
of t
otal
wag
e. Sp
ecia
l RM
G: s
ame
rate
s as
RM
G bu
t not
mea
ns-te
sted
DB p
aid
mon
thly
14
times
/yea
r. Ca
lcul
atio
n ba
sis
is th
e qu
otie
nt re
sulti
ng fr
om d
ivid
ing
the
base
s of
con
tribu
tion
durin
g th
e 96
mon
ths
prio
r to
the
one
in w
hich
the
even
t occ
urs
by 1
12. B
ases
co
rres
pond
ing
to th
e 24
mon
ths
prio
r to
the
even
t are
cal
cula
ted
at th
eir v
alue
, the
rem
aini
ng
are
upda
ted
with
the
CPI.
1.Fl
at ra
te a
mou
nts
(see
abov
e).
2.Am
ount
s un
til re
sour
ces
reac
h “a
pplic
able
am
ount
” whi
ch in
clud
es p
rem
ia in
cas
e of
di
sbilit
y, se
vere
dis
abilit
y or
enh
ance
d di
sabi
lity.
Min
ima
and
max
ima
–Fl
at ra
te, n
o m
inim
um.
–Fl
at ra
te, n
o m
axim
um.
–M
inim
um: 9
0% o
f the
refe
renc
e am
ount
(E
UR 1
320)
. If i
nsur
ed d
oes
not q
ualif
yfo
r ful
l DB,
redu
ced
prop
ortio
nate
ly.
–M
axim
um:
of fi
ve ti
mes
the
refe
renc
e am
ount
(E
UR 6
111)
.
–M
inim
a: E
UR 4
38 (E
UR 5
24w
ith s
pous
e) fo
r ab
solu
te in
capa
city
; EUR
658
(EUR
786
with
sp
ouse
) for
sev
ere
inca
paci
ty.
–M
axim
um D
B: E
UR 2
159.
12.
–Fl
at ra
te, n
o m
inim
um.
– F
lat r
ate,
no
max
imum
.
Spec
ial s
uppl
emen
ts
(cov
ered
) –
Phar
mac
eutic
al a
llow
ance
: Sin
gle
AUD
5.80
/fo
rtnig
ht; C
oupl
e: A
UD 2
.90/
fortn
ight
eac
h.
–Te
leph
one
allo
wan
ce: A
UD 1
9.80
per q
uarte
r. –
Mob
ility
allo
wan
ce if
und
erta
king
pai
d or
vo
lunt
ary
wor
k or
voc
atio
nal t
rain
ing
for
32ho
urs
ever
y fo
ur w
eeks
: AUD
69.
40/
fortn
ight
. –
Rent
ass
ista
nce,
dep
endi
ng o
n re
nt p
aid
and
fam
ily s
ituat
ion.
–Fl
at-r
ate
age
supp
lem
ents
of 1
/40
for e
ach
year
be
twee
n co
mm
ence
men
t and
age
65.
–
Inco
me-
rela
ted
age
supp
lem
ent f
or e
ach
year
fro
m c
omm
ence
men
t unt
il ag
e 55
(1.8
5% o
f sa
lary
). –
End-
of-y
ear a
llow
ance
of E
UR 5
64 (i
n ca
seof
a c
ompl
ete
care
er; o
ther
wis
e pr
opor
tiona
l re
duct
ion)
.
Only
in c
ase
of m
inim
um D
B: fo
r dep
ende
nt
spou
ses.
–Ch
ild in
crea
se (l
ong-
term
IB):
GBP
9.55
for
1st c
hild
, GBP
11.
35fo
r eac
h ad
ditio
nal c
hild
. –
Adul
t dep
ende
ncy
incr
ease
: GBP
34.
60(s
hort-
term
IB),
GBP
44.3
5 (lo
ng-te
rm IB
). –
Disa
bilit
y Li
ving
Allo
wan
ce (D
LA):
thre
e ra
tes
for c
are
need
s (G
BP 1
5.55
/39.
35/5
8.80
); tw
o ra
tes
for m
obili
ty n
eeds
(GBP
15.
55/4
1.05
). M
odel
use
s GB
P 39
.35
+15
.55.
–
Age
supp
lem
ents
: GBP
15.
55 (G
BP 7
.80)
if
inca
paci
ty b
egan
bef
ore
age
35 (a
ge 3
5-44
).
Grad
uatio
n of
ben
efits
No g
radu
atio
n. M
inim
um c
ondi
tion
for r
ecei
pt is
be
ing
unab
le to
wor
k fo
r 15
or m
ore
hour
s.No
gra
duat
ion.
Min
imum
con
ditio
n fo
r rec
eipt
of D
B is
33%
in
capa
city
. Deg
ree
of s
ever
ity d
eter
min
es D
B am
ount
.
No g
radu
atio
n.
Bene
fit s
chem
es
(not
cov
ered
)1a
and
1d
abov
e ar
e no
t mod
eled
.
SICKNESS, DISABILITY AND WORK: BREAKING THE BARRIERS – VOL. 2 – ISBN 978-92-64-03815-8 – © OECD 2007 133

4. FINANCIAL INCENTIVES AND DISINCENTIVES FOR PEOPLE WITH DISABILITY
Spec
ial s
uppl
emen
ts
(not
cov
ered
) –
Conc
essi
onal
pric
es fo
r ser
vice
s lin
ked
to P
ensi
oner
Con
cess
ion
Card
. –
Pens
ione
r edu
catio
n su
pple
men
t. –
Rem
ote
Area
Allo
wan
ce.
–El
igib
ility
for m
axim
um ra
te o
f chi
ld c
are
bene
fit.
–Si
x da
ys a
dditi
onal
hol
iday
s fo
r dis
able
d w
orke
rs.
–M
obili
ty a
llow
ance
for j
ob s
eeke
rs.
Vario
us su
bsid
ies a
nd ta
x red
uctio
ns (e
.g.v
ehic
le
tax
and
wat
er/e
lect
ricity
/gas
tarif
fs).
–He
lp to
war
ds c
ost o
f equ
ipm
ent;
VAT
relie
f. –
Vouc
hers
for p
ublic
tran
spor
t. –
Coun
cil t
ax re
duct
ions
. –
IS re
cipi
ents
are
exe
mpt
from
pre
scrip
tion
char
ges.
Taxa
tion
of b
enef
itsNo
t tax
ed (e
xcep
t if a
t pen
sion
age
).Ge
nera
l tax
atio
n ru
les,
no
spec
ial r
elie
ffo
r ben
efits
.Pa
rtial
and
tota
l inc
apac
ity D
B is
taxe
d; a
bsol
ute
and
seve
re in
capa
city
DB
is n
ot ta
xed.
Low
er-r
ate
shor
t-ter
m IB
not
taxe
d; h
ighe
r-ra
te
shor
t-ter
m IB
and
long
-term
IB a
re s
ubje
ctto
nor
mal
taxa
tion;
IS n
ot ta
xed;
DL
A ne
ither
taxe
d no
r mea
ns-te
sted
.
Soci
al s
ecur
ity c
ontri
butio
nsNo
ne.
Cons
tribu
tions
for h
ealth
car
e an
d lo
ng-te
rm c
are
insu
ranc
e.No
con
tribu
tions
on
inca
paci
ty b
enef
its.
No c
ontri
butio
ns o
n in
capa
city
ben
efits
.
Accu
mul
atio
n of
ben
efits
w
ith e
arni
ngs
Inco
me
test
: for
tnig
htly
inco
me
over
bel
ow
amou
nts
redu
ces
the
DSP
rate
by
AUD
0.40
for e
very
dol
lar (
sing
le p
erso
n) o
r by
AUD
0.20
fo
r eve
ry d
olla
r (ea
ch p
artn
er).
Figu
res
in b
rack
ets:
inco
me
leve
l at
whi
ch p
ensi
on c
ease
s to
be
paid
:–
Sing
le: A
UD 2
0.00
(AUD
126
6.50
) –
Sing
le +
1ch
ild: A
UD 1
44.6
0 (A
UD 1
291.
10)
–Co
uple
(com
bine
d) :
AUD
212.
00
(AUD
211
6.50
)–
Addi
tiona
l chi
ldre
n: A
dd A
UD 2
4.60
per c
hild
–Ea
rnin
gs m
ay b
e cu
mul
ated
with
DB
up to
a ce
iling
com
pris
ing
the
aver
age
of th
e fiv
e hi
ghes
t ann
ual s
alar
ies
durin
g th
e pe
riod
of in
sura
nce.
DB
is re
duce
d by
the
amou
nt
of in
com
e ex
ceed
ing
this
cei
ling.
–No
lim
it. F
or to
tal p
erm
anen
t inc
apci
ty:
wor
king
in a
noth
er o
ccup
atio
n al
low
ed.
–Fo
r non
-con
tribu
tory
ben
efic
iary
(> 6
5% d
isab
led)
tota
l ear
ning
s up
to IP
REM
(EUR
469.
8 in
2005
) up
tofo
urye
ars.
Pe
nsio
n re
duce
d by
50%
of e
xcee
ding
am
ount
for e
arni
ngs
up to
hig
hest
lim
it:
1.5
times
IPRE
M.
–Un
der p
erm
itted
wor
k ru
les
up to
GBP
81/
wee
k (1
.1.2
006)
or G
BP 8
6 (1
.10.
2006
), w
hen
wor
king
less
than
16
hour
s, fo
r one
yea
r. –
Up to
GBP
20/w
eek
inde
finite
ly.
Tax
cred
its–
Empl
oym
ent E
ntry
Pay
men
t: on
e-of
f pay
men
t of
AUD
312
if ea
rnin
gs d
isqu
alify
fro
m p
aym
ent.
–Lo
w-In
com
e Ta
x Of
fset
.
–W
orki
ng T
ax C
redi
t: ba
sic
elem
ent G
BP 3
0.17
, se
cond
adu
lt el
emen
t GBP
29.
68, d
isab
ility
su
pple
men
t GBP
40.
32, s
ever
e di
sabi
lity
supp
lem
ent G
BP 1
7.08
. Nee
d to
wor
k at
leas
t 16
hour
s/w
eek.
–
Retu
rn to
Wor
k Cr
edit:
GBP
40/
wee
k, p
ayab
le
for 5
2w
eeks
pro
vide
d ea
rnin
gs a
re b
elow
GB
P 15
000/
year
and
wor
ks 1
6ho
urs/
wee
k.
Retu
rn-to
-ben
efit
(link
ing
rule
s)Tw
o ye
ars
for g
rand
fath
ered
ben
efic
iarie
s, e
xcep
t if
they
und
ergo
a n
ew a
sses
smen
t.Fo
ur y
ears
for n
on-c
ontri
buto
ry b
enef
icia
ries.
Eigh
t wee
ks fo
r low
er-r
ate
shor
t-ter
m IB
; 10
4w
eeks
for h
ighe
r-ra
te a
nd lo
ng-te
rm IB
.
Com
bina
tion
with
oth
er b
enef
itsOn
ly p
ossi
ble
in c
onju
nctio
n w
ith fa
mily
ben
efits
.W
ith in
jury
pen
sion
up
to c
eilin
g (a
vera
geof
five
hig
hest
ann
ual e
arni
ngs,
or e
arni
ngs
on w
hich
inju
ry p
ensi
on is
bas
ed).
No c
ombi
natio
n w
ith o
ther
ben
efits
and
pens
ions
exc
ept w
idow
’s pe
nsio
ns.
IB u
naffe
cted
by
DLA,
At
tend
ance
Allo
wan
ce, b
asic
war
or
indu
stria
l inj
urie
s di
sabl
emen
t pen
sion
.
Sou
rce:
OEC
D (2
005b
), M
ISSO
C, M
ISSC
EO a
nd
info
rmat
ion
pro
vid
ed b
y n
atio
nal
au
thor
itie
s.
Tabl
e 4.
A1.
1.M
ain
ch
arac
teri
stic
s of
dis
abil
ity
ben
efit
an
d t
axat
ion
sys
tem
s, a
s at
1st
July
2005
(co
nt.)
Aust
ralia
Luxe
mbo
urg
Spai
nUn
ited
King
dom
SICKNESS, DISABILITY AND WORK: BREAKING THE BARRIERS – VOL. 2 – ISBN 978-92-64-03815-8 – © OECD 2007134

4. FINANCIAL INCENTIVES AND DISINCENTIVES FOR PEOPLE WITH DISABILITY
Figure
4.A
1.1.
Net
rep
lace
men
t ra
tes
for
dis
abil
ity
ben
efit
s, u
nem
plo
ymen
t be
nef
its
and
soc
ial a
ssis
tan
ce, c
oup
le h
ouse
hol
ds,
200
5a
a)N
et r
epla
cem
ent
rate
s: r
atio
of
hou
seh
old
net
in
com
e af
ter
beco
min
g in
acti
ve a
nd
rec
eivi
ng
dis
abil
ity
ben
efit
or
un
emp
loym
ent
ben
efit
or
soci
al a
ssis
tan
ce t
o h
ouse
hol
d n
et i
nco
me
wh
en e
arn
ing
40-2
00%
of
aver
age
earn
ings
. Est
imat
es r
efer
to
a40
-yea
r-ol
d p
erso
n w
ith
an
ear
nin
gs h
isto
ry o
f 22
year
s at
ave
rage
ear
nin
gs. P
erce
nta
ge o
f av
erag
e ea
rnin
gs r
efer
s to
pre
-d
isab
ilit
y ea
rnin
gs o
f th
e fi
rst
earn
er.
Sou
rce:
Spec
ial m
odu
le o
f O
ECD
tax
-ben
efit
mod
el. I
nfo
rmat
ion
pro
vid
ed b
y n
atio
nal
au
thor
itie
s.
��
��� �� �� �� � �
����
����
��
���
���
���
��
�
��
��� �� �� �� � �
����
����
��
���
���
���
��
�
��
��� �� �� �� � �
����
����
��
���
���
���
��
�
��
��� �� �� �� � �
����
����
��
���
���
���
��
�
��
��� �� �� �� � �
����
����
��
���
���
���
��
�
��
��� �� �� �� � �
����
����
��
���
���
���
��
�
��
��� �� �� �� � �
����
����
��
���
���
���
��
�
��
��� �� �� �� � �
����
����
��
���
���
���
��
�
�����(
�,)
��*"�
%&�
!'%
�"�
,5
��������
/���
�����
��������� ��
��&!
*���
�"�1
����
5��1
�"��
���!
/����
����
����
"�"�
�
�����(
*�
+ ��
���
5��1
�"��
���!
/����
����
����
"�"�
�
�����(
��
���
5��1
�"��
���!
/����
����
����
"�"�
�
�����(
,��� ��-���
���
5��1
�"��
���!
/����
����
����
"�"�
�
,!1�
����
����
��"1
�
�!"
#1!"
����
*�!�
'���
"�/��
,�!�
�#��
�%��
����
��39
,�!�
�#��
�%��!
:��
�39
I,)�
�*"�
%&�
!'%
�"�
+!"�
#���
%�39
3,�:
�����
����
��&��
%�*
%3,
-"�
%&�
!'%
�"�
)��!
�*��
�&��
%�"
�"���
"1�&
�1��'
=!��
��&��
%�"
�"���
"1�&
�1��'
�B
4
�B
4�/!
�����
����
�
-"�
%&�
!'%
�"�
��
�����
�'
�����(
��
������
/���
�����
���������
� ��
��&!
*���
:!�
;�"�
�����
:!#
�����
�!/��
����
���:
���
5��1
�"��
���!
/����
����
����
"�"�
�
�����(
*�
+ ��
���
5��1
�"��
���!
/����
����
����
"�"�
�
�����(
��
���
5��1
�"��
���!
/����
����
����
"�"�
�
�����(
,��� ��-���
���
5��1
�"��
���!
/����
����
����
"�"�
�
SICKNESS, DISABILITY AND WORK: BREAKING THE BARRIERS – VOL. 2 – ISBN 978-92-64-03815-8 – © OECD 2007 135
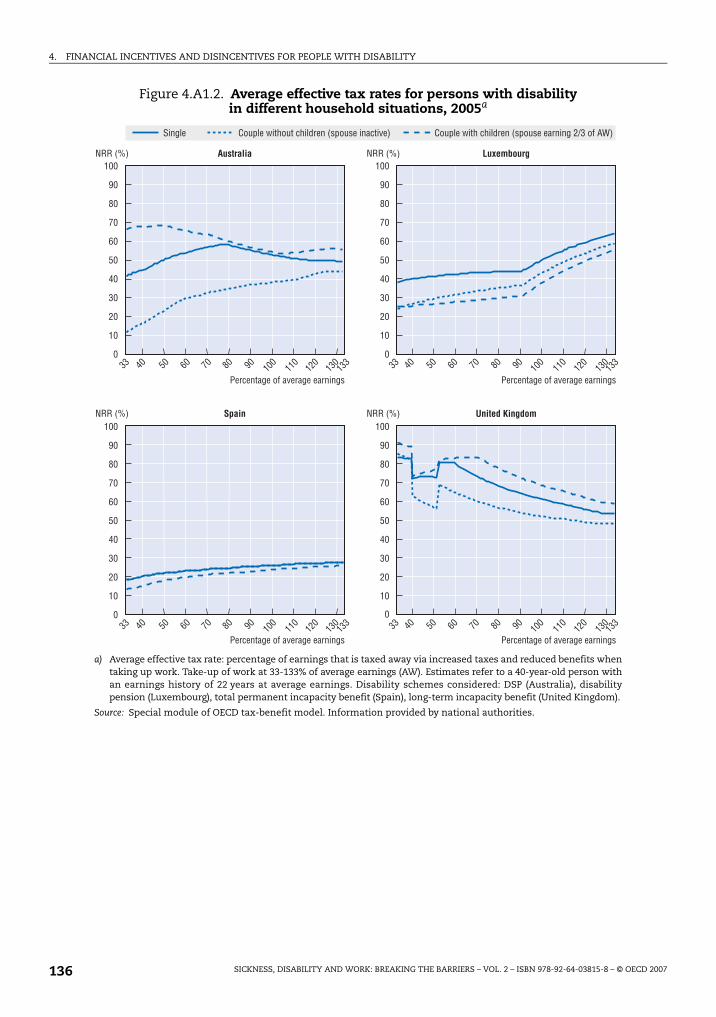
4. FINANCIAL INCENTIVES AND DISINCENTIVES FOR PEOPLE WITH DISABILITY
Figure 4.A1.2. Average effective tax rates for persons with disability in different household situations, 2005a
a) Average effective tax rate: percentage of earnings that is taxed away via increased taxes and reduced benefits whentaking up work. Take-up of work at 33-133% of average earnings (AW). Estimates refer to a 40-year-old person withan earnings history of 22 years at average earnings. Disability schemes considered: DSP (Australia), disabilitypension (Luxembourg), total permanent incapacity benefit (Spain), long-term incapacity benefit (United Kingdom).
Source: Special module of OECD tax-benefit model. Information provided by national authorities.
�
���
��
��
��
��
�
�
�
��
��
��
�
���
��
��
��
��
�
��
��
��
�
�
���
��
��
��
��
�
��
��
��
�
���
��
��
��
��
�
��
��
��
�
�� �� �� �� �� �� ���
�
���
��
�� �� �� �� �� �� �� ��
��
��
��
��
�
�� �� �� �� �� �� ���
�
���
��
�� �� �� �� �� �� �� ��
��
��
��
��
�
�����( �����( �������� *�+ �����
5��1�"�����!/������������"�"�� 5��1�"�����!/������������"�"��
�����( �����( ����� ,��� ��-������
5��1�"�����!/������������"�"�� 5��1�"�����!/������������"�"��
,�"��� 7!*&���:���!*��1������"���&!*����"�1���� 7!*&���:����1������"���&!*������"�"����!/�)D
SICKNESS, DISABILITY AND WORK: BREAKING THE BARRIERS – VOL. 2 – ISBN 978-92-64-03815-8 – © OECD 2007136

ISBN 978-92-64-03815-8
Sickness, Disability and Work
Breaking the Barriers – Vol. 2
© OECD 2007
Chapter 5
Employment Policy – New Challenges and Directions
Employment rates of people with disability are far below those of personswithout disability. Partly this is because severe health impairmentsprevent people from working. However, there are many other factorsincluding a lack of appropriate skills, discrimination, weak incentives tolook for work and accept a job offer, and ineffective re-integrationmeasures. Anti-discrimination legislation (Australia, United Kingdom),employment quotas (Luxembourg, Spain) and other forms of employerresponsibilities and supports have proven to be insufficient. Measures toimprove the employability of people with reduced work capacity and tohelp those workers stay in and find employment are needed.
Spain and Luxembourg have only just started to acknowledge the need forsuch change. Australia and the United Kingdom have recently made bigsteps away from what used to be extremely passive benefit systems, andthey are both setting new standards in outcome-based funding of services,individual case management and streamlined service delivery. Yet, overallinvestments in these areas are still lagging behind and, despite verywelcome advances in the United Kingdom, there is a general lack ofrigorous evaluation and cost-benefit analysis of employmentprogrammes. To improve the situation, a range of steps have been takenrecently in all countries with the aim to raise the involvement andresponsibilities of the main actors: workers with disability, theiremployers and the public authorities supporting them.
137

5. EMPLOYMENT POLICY – NEW CHALLENGES AND DIRECTIONS
In all countries, employment rates of people with a disability are low. This is
disappointing because work has been found to be good for people’s health and re-entering
work associated with improvements in income, socio-economic status and well-being.
Higher employment rates of people with reduced work capacity are also vital to boost
economic growth and to lower public spending. This chapter focuses on how employment
rates could be increased.
The chapter starts by describing employment and education characteristics of people
with disability, and the extent to which they differ from those of people without disability.
Section 5.2 considers suitable activation measures for people with reduced work capacity
in relation to their needs and skill levels. It compares available support measures across
countries, the possibilities to access them and their success in helping people with health
problems back to work. Section 5.3 examines the new balance between rights and
responsibilities for various actors the four countries are aiming to achieve: the role of
public authorities, with a focus on the timing of intervention, obligations to provide special
services and new funding concepts; the rights and responsibilities of people with disability
themselves and of benefit recipients in particular; and the responsibilities of and support
for employers, also in terms of anti-discrimination legislation and employment quotas.
5.1. Employment and disability: where do we stand?In all four countries, employment rates of (self-assessed) persons with disability are
substantially below those of persons without disability (Chapter 1 and Table 5.1). The gap
is almost 40 percentage points in Australia, Spain and the United Kingdom, but much lower
in Luxembourg. Unemployment rates are also higher for people with disability everywhere.
In this case, the gap is around 4 percentage points in Australia, Luxembourg and the United
Kingdom, and 8 percentage points in Spain. Spain also has the highest unemployment
level, for people with and without disability.
Table 5.1 also compares employment characteristics. Some differences are worth
highlighting, such as the higher incidence of part-time employment of workers with
disability in Australia and the United Kingdom (one-third and one-quarter of all workers
with disability, respectively), both compared to Luxembourg and Spain and compared to
people without disability in Australia and the United Kingdom. The low share of part-time
work of people with disability in Spain and Luxembourg suggests room for further
improvement in employment rates of this group in line with increasing acceptance of
part-time employment.1
In all countries, persons with disability do not appear to be overrepresented in
temporary jobs. In Spain, however, the lack of any difference in the incidence of temporary
employment between people with and without disability is partly a result of different age
structures among these two groups. In fact, in each age group workers with disability are
more likely to be employed on temporary contracts.
SICKNESS, DISABILITY AND WORK: BREAKING THE BARRIERS – VOL. 2 – ISBN 978-92-64-03815-8 – © OECD 2007138

5. EMPLOYMENT POLICY – NEW CHALLENGES AND DIRECTIONS
Table 5.1. Employment characteristics of people with disability are different from those of people without disability
Employment structures and characteristics, by age and disability status, percentages, latest available yeara
Australia Luxembourg Spain United Kingdom
20-34 35-49 50-64 Total 20-34 35-49 50-64 Total 20-34 35-49 50-64 Total 20-34 35-49 50-64 Total
Employment(% of population)
Disabled 50 49 32 40 58 70 32 50 46 46 24 35 49 53 39 45
Non-disabled 80 84 72 79 69 80 53 70 70 74 54 68 79 88 76 81
Unemployment (% of labour force)
Disabled 13 7 5 8 9 8 6 7 27 15 14 18 11 8 5 7
Non-disabled 6 3 3 4 6 3 1 4 13 9 7 11 6 3 3 4
Public sector employment
Disabled 14 22 16 18 . . . . . . . . 10 25 23 20 21 31 28 28
Non-disabled 16 22 20 19 . . . . . . . . 11 26 26 19 20 28 29 25
Part-time employmentb
Disabled 34 28 37 33 8 16 11 13 10 9 10 10 27 25 30 27
Non-disabled 21 20 21 21 10 15 12 13 9 7 6 7 18 20 23 20
Temporary employment
Disabled 10 10 8 9 4 2 0 2 48 30 19 31 5 4 6 5
Non-disabled 9 8 10 9 7 2 2 4 44 23 14 31 7 4 4 5
Casual employmentc
Disabled 36 23 43 33 . . . . . . . . . . . . . . . . . . . . . . . .
Non-disabled 28 19 25 24 . . . . . . . . . . . . . . . . . . . . . . . .
Self-employedd
Disabled 9 19 23 19 4 3 9 5 6 19 31 21 9 13 18 15
Non-disabled 8 16 19 14 4 9 11 8 10 20 29 17 8 14 17 13
Share by industry
Agriculture
Disabled 2 7 7 6 2 2 4 3 7 8 14 10 1 1 1 1
Non-disabled 3 4 5 4 1 3 3 2 4 6 9 6 1 1 1 1
Industry
Disabled 23 20 21 21 30 30 44 34 34 30 28 30 17 20 22 20
Non-disabled 22 23 22 22 17 20 20 19 33 29 31 31 21 24 23 23
Services
Disabled 75 74 73 74 68 68 52 63 59 62 58 60 82 79 77 78
Non-disabled 76 73 72 74 82 78 77 79 62 65 59 63 78 75 76 76
Hiring ratee
Disabled 32 17 17 22 16 8 . . 7 34 19 9 18 29 14 16 16
Non-disabled 31 17 9 21 17 9 6 12 31 14 7 19 27 10 28 20
Job retention ratef
Disabled 21 53 55 43 50 81 93 77 25 60 79 59 30 58 53 54
Non-disabled 24 51 68 43 39 72 85 60 26 66 82 52 31 70 26 47
a) Employment and unemployment for Luxembourg and Spain refers to 2004, employment characteristics to 2002.
b) Part-time work is defined as less than 30 hours per week.
c) Share of casual employees using the ABS definition (i.e. people without paid sick leave or holiday leave).
d) In Australia, it includes own account workers, employers and contributing family workers.
e) The hiring rate is calculated as the share of employees with tenure less than one year.
f) Job retention rate is defined as the share of employees with tenure with the same employer for five years or longer.Source: OECD calculations based on national surveys: SDAC 2003 for Australia, except for temporary, casual employment andhiring and retention rates from HILDA 2007 (Wave 5); EULFS 2002 for Luxembourg and Spain, except for employment andunemployment rates from EU-SILC 2004, and LFS 2006 for the United Kingdom; for hiring and retention rates in Luxembourg,Spain and the United Kingdom, EULFS (2002) ad hoc module on disabled persons.
SICKNESS, DISABILITY AND WORK: BREAKING THE BARRIERS – VOL. 2 – ISBN 978-92-64-03815-8 – © OECD 2007 139
5. EMPLOYMENT POLICY – NEW CHALLENGES AND DIRECTIONS
Similarly, people with disability are over-represented among casual workers in
Australia.2 One-third of all workers with disability are holding casual contracts compared
to one-quarter of their peers without disability; especially large differences are found in the
age group 50-64. Casual workers tend to work in lower-skilled occupations and in
industries with substantial fluctuations in demand over the year, e.g. service sectors such
as accommodation or cafes and restaurants (ABS, 2006). There is also a strong correlation
in Australia between casual work and part-time work.
The high incidence of casual and temporary employment contracts in Australia and
Spain is probably one reason for the higher hiring rates in these two countries. Hiring rates
of people with disability are relatively lower in the United Kingdom and in particular in
Luxembourg, where rates are almost half of those of people without disability. On the other
hand, job retention rates of five years or more (as well as average job tenure) are higher for
people with disability in all countries. Partly, this is a reflection of the lower likelihood to
switch to a new job – as indicated by the lower hiring rates. However, the higher job tenure
of workers with disability is also a result of a selection effect: those with shorter tenure are
probably more likely to lose their job in case of health problems.
Differences by industry are only observable in Luxembourg, where workers with
disability are strongly overrepresented in the industry sector, and in Spain, where they are
overrepresented in the agricultural sector. Moreover, contrary to earlier findings (OECD,
2006b), in these four countries workers with disability seem to be equally represented in
the public and the private sector.
In conclusion, therefore, differences between workers with and without disability are
much larger in terms of employment and unemployment rates than in terms of
employment distributions and characteristics. Even among workers with insecure
contracts (temporary workers in Spain and casual workers in Australia), workers with
disability are only somewhat overrepresented. This makes tackling low rates of
employment and high rates of unemployment even more important.
Poor overall labour market outcomes of people with disability are partly a result of
their lower average skill levels. In all four countries, educational attainment is, on average,
substantially lower among persons with disability, both in employment and if unemployed
(Table 5.2). The share of persons with disability with a tertiary education level, for instance,
is only one-half or one-third that of people with no disability, and the share having primary
education is correspondingly much higher. Most worryingly, the education gap between
people with and without disability is not closing for the younger age groups, but instead
widening in all four countries.
Overall, education levels of people with disability compare best to those of inactive
people without disability, the group with the lowest level of qualifications among all people
without disability. In Spain and the United Kingdom, people with disability have even lower
qualification levels than inactives without disability. Only in Luxembourg, unemployed
people without disability have lower levels of qualification than inactives, with the
educational distribution among people with disability being even worse. Employed people
with disability are much better qualified though still lagging far behind employees without
disability.
Research in the United Kingdom has demonstrated that, at the age of 16, educational
aspirations of those with and without disability are very similar. Ten years later, at age 26,
almost 70% of those without disability had reached their higher education goal, while the
SICKNESS, DISABILITY AND WORK: BREAKING THE BARRIERS – VOL. 2 – ISBN 978-92-64-03815-8 – © OECD 2007140

5. EMPLOYMENT POLICY – NEW CHALLENGES AND DIRECTIONS
re
Total
49
30
21
100
55
37
8
100
81
10
9
100
72
16
12
100
Total
28
37
34
100
35
46
19
100
53
21
26
100
51
22
27
100
other
isabled
Table 5.2. Qualification levels of people with disability are lagging far behind everywheDistribution (in percentage) of all people in each category by age, most recent years availablea
Panel A. People with disability
Employed Unemployed Inactive Total
20-34 35-49 50-64 Total 20-34 35-49 50-64 Total 20-34 35-49 50-64 Total 20-34 35-49 50-64
Australia
Less than upper secondary education 26 34 37 34 . . . . . . 49 52 64 60 60 40 49 52
Upper secondary education 50 31 34 36 . . . . . . 29 38 22 25 26 43 27 28
Tertiary 24 34 29 30 . . . . . . 22 10 14 15 14 17 24 20
100 100 100 100 . . . . . . 100 100 100 100 100 100 100 100
Luxembourg
Less than upper secondary education 40 43 46 43 100 64 53 69 56 57 70 66 44 48 62
Upper secondary education 46 43 41 43 0 36 47 31 44 40 28 31 45 42 32
Tertiary 14 14 13 14 0 0 0 0 0 3 3 3 11 10 6
100 100 100 100 . . . . . . 100 100 100 100 100 100 100 100
Spain
Less than upper secondary education 57 63 82 69 68 77 87 77 76 82 90 86 68 75 89
Upper secondary education 22 17 8 15 16 13 10 13 15 11 5 8 18 14 6
Tertiary 22 20 10 16 16 9 4 10 10 7 5 6 15 12 6
100 100 100 100 . . . . . . 100 100 100 100 100 100 100 100
United Kingdom
Less than upper secondary education 39 59 71 61 65 72 71 70 66 79 88 82 53 68 81
Upper secondary education 32 25 15 22 23 18 17 19 18 14 7 10 26 20 10
Tertiary 29 17 13 17 12 10 12 11 15 7 5 7 22 12 9
100 100 100 100 100 100 100 100 100 100 100 100 100 100 100
Panel B. People without disability
Employed Unemployed Inactive Total
20-34 35-49 50-64 Total 20-34 35-49 50-64 Total 20-34 35-49 50-64 Total 20-34 35-49 50-64
Australia
Less than upper secondary education 17 27 34 24 . . . . . . 41 31 47 55 44 21 30 40
Upper secondary education 46 35 31 39 . . . . . . 35 44 28 24 32 46 34 29
Tertiary 36 38 35 37 . . . . . . 23 25 25 21 23 34 36 31
100 100 100 100 . . . . . . 100 100 100 100 100 100 100 100
Luxembourg
Less than upper secondary education 29 33 32 31 53 60 62 56 31 45 52 44 30 36 42
Upper secondary education 50 44 40 46 27 31 23 29 54 46 39 45 50 44 40
Tertiary 21 23 28 23 20 9 15 15 15 8 9 11 19 20 18
100 100 100 100 100 100 100 100 100 100 100 100 100 100 100
Spain
Less than upper secondary education 41 50 68 50 43 65 84 55 30 73 86 62 39 55 76
Upper secondary education 24 21 11 20 24 19 10 21 46 16 8 24 29 20 10
Tertiary 36 30 21 30 33 16 6 24 24 11 6 14 33 25 14
100 100 100 100 100 100 100 100 100 100 100 100 100 100 100
United Kingdom
Less than upper secondary education 34 53 62 49 47 63 72 56 40 58 77 59 36 54 65
Upper secondary education 27 24 18 23 22 20 16 21 18 23 12 17 25 24 16
Tertiary 39 23 21 28 31 17 12 23 42 19 11 24 39 22 18
100 100 100 100 100 100 100 100 100 100 100 100 100 100 100
a) In Australia, persons with disability are defined as those who have at least a mild restriction of their core activities. In thecountries, it is defined as persons with long-lasting health problems that limit their daily life activities.
Source: For Australia, ABS, Disability, Ageing and Carers Survey 2003; for Luxembourg and Spain, EULFS 2002 Special module on Dpeople; and for the United Kingdom, Labour Force Survey 2006.
SICKNESS, DISABILITY AND WORK: BREAKING THE BARRIERS – VOL. 2 – ISBN 978-92-64-03815-8 – © OECD 2007 141

5. EMPLOYMENT POLICY – NEW CHALLENGES AND DIRECTIONS
corresponding share was only 56% for people with disability (Burchardt, 2005). In Australia,
around one-fifth of all people with a disability attended school only for eight years or less,
compared to one in twenty among people with no disability (Lattimore, 2007). These
findings point to a lack of support for people with disability to access (higher) education. A
lower education level, in particular among those people with disability, adds to the
difficulty in staying in or finding work – a situation that, relatively speaking, has worsened
in the past decade and may exacerbate further in the future, because of continuous
technical progress and a falling demand for low-skilled jobs (FaCS, 2003).3
5.2. More and better targeted employment servicesRecognising the difficulties people with health problems have in staying in, or
returning to, the labour market, countries have put in place a number of employment
support and rehabilitation programmes. The success of these, however, is modest, and in
particular these measures have not been very successful in helping people on disability
benefits back to the labour market. Today, with the exception of Spain, the number of
people on disability benefits is two to three times larger than the number of people on
unemployment benefits. And in all countries, the number of jobseekers with impaired
health is growing. Significant efforts will be needed to achieve a real change in outcomes,
including better tailoring to people’s needs and skills and recognising their disadvantages
in terms of qualification levels. This section first outlines the necessary elements of
adequate support programmes before moving on to describe available measures and the
resulting employment outcomes. It concludes with a discussion on the restricted access to
employment support.
A. What support is suitable for people with disability
Proper activation measures require well-targeted assistance including individual
vocational rehabilitation, training, and employment support. To achieve sustainable
employment outcomes, both programmes and individuals have to meet the demands from
employers, and measures need to be better tailored to help meet these labour market
demands (Work Directions, 2006).
What has also proven important is a close contact between the jobseeker with a
disability and the employment adviser. Preferably, the same adviser should work with the
jobseeker throughout their contact. Outcomes also improve when advisers use a more
proactive approach in their contacts with clients, also after a job has been found (Lewis
et al., 2005). In this respect, individual action plans are a good way of setting up goals and
targets that can be followed up and modified if and when needed.
In general, programmes closely linked to the labour market, e.g. apprenticeship, wage
subsidies or in-work benefits, tend to be more successful than general training measures.
Martin and Grubb (2001) concluded that the most important factors for employment
measures to be successful are the following four: i) the need for tight targeting on
participants; ii) the need to keep the programmes relatively small in scale; iii) the need for
programmes to result in a qualification or certificate that is recognised and valued by the
market; and iv) the need to have a strong on-the-job component and to establish strong
links with local employers.
Although these conclusions refer to activation measures for the “ordinary” unemployed,
there is no reason why they would be less valid for jobseekers with impaired health or for
SICKNESS, DISABILITY AND WORK: BREAKING THE BARRIERS – VOL. 2 – ISBN 978-92-64-03815-8 – © OECD 2007142

5. EMPLOYMENT POLICY – NEW CHALLENGES AND DIRECTIONS
measures to help people on long-term sickness benefits to remain in the labour market. This
is supported in OECD (2006d) which emphasises the scope to apply activation strategies to
persons receiving income support other than unemployment benefits if appropriate
modifications are made to account for the specific characteristics of each group of people.
B. What support is available for people with disability
The use of individualised support
The regional Public Employment Service (PES) in Spain has no special advisers for
jobseekers with disability (but special hiring subsidies are available for jobseekers with a
legal disability certificate). In Luxembourg, the central PES office has a small unit of
caseworkers that deals with people with disability and each caseworker assists around
400 persons with disability per year. In both countries, caseloads for PES officers are high
and they act on the principle of first-come first-served.
In the United Kingdom, all new disability benefit claimants have to attend an initial
work-focused interview with an Incapacity Benefit Personal Adviser (IBPA) at their local
Jobcentre Plus. Most claimants will continue with another five interviews with the same
adviser at (roughly) monthly intervals. These advisers are work facilitators who discuss
ways to identify and deal with personal work barriers and support the claimant through
the whole phase to overcome these barriers. Because of their very low caseloads of around
35 clients, they are well aware of their clients’ needs and problems. A personal action plan
is agreed between the client and the adviser that specifies the activities that will be
undertaken. This plan is reviewed at each meeting.
In case of more severe health conditions, IBPAs can refer their clients to a Disability
Employment Adviser or a Work Psychologist. Nevertheless, with the growing number of
claimants with complex health problems, many IBPAs report a stressful work environment
and lacking support and knowledge, especially in dealing with mental illness (Knight
et al., 2005). The House of Commons (2006) concluded that IBPAs would benefit from
improved training and sharing of best practice.
Also in Australia, activation measures are increasingly tailored to individual needs
based on the level of disadvantage in the labour market. Unlike the United Kingdom,
however, personal guidance only starts once a service provider has been identified and
selected, with the type of service most adequate for the person being determined through
the Job Capacity Assessment. Average caseloads for service providers for people with
disability are very low in an international perspective in both Australia and the United
Kingdom. Work Directions, for instance, a larger private provider operating in both
countries, reports caseloads around and sometimes below 50 clients. Such low caseloads
allow for a service tailored very closely to the needs and abilities of the client (Box 5.1).
Assistance for people with disability differs
Employment measures for people with health problems differ considerably between
the four countries. In Luxembourg and Spain, except for hiring subsidies activation
programmes are still in their infancy, while they are more widespread in Australia and the
United Kingdom. The latter two countries have recently made several important changes
to their services. Delivery of programmes in Australia and the United Kingdom also differs
substantially from most other OECD countries because increasing parts of the employment
activation service are being privatised (see below).
SICKNESS, DISABILITY AND WORK: BREAKING THE BARRIERS – VOL. 2 – ISBN 978-92-64-03815-8 – © OECD 2007 143

5. EMPLOYMENT POLICY – NEW CHALLENGES AND DIRECTIONS
In the United Kingdom, soon everyone making a new claim for a disability benefit will
automatically be part of Pathways to Work.4 The aim of Pathways is to improve the work focus
of disability benefit claimants by providing: i) a better framework for support in the early
stages of a claim (e.g. through IBPAs); ii) direct access to a wide range of provision (e.g. the
New Deal for Disabled people and the Condition Management Programme); iii) improved
financial incentives through the Return to Work Credit); and iv) better support for people
with health problems who move from disability benefits to unemployment benefits.
In mid-2006, when the Australian government launched its Welfare to Work approach,
activity-test requirements became mandatory for an increasing share of people with
health problems (Chapter 3). People who no longer qualify for a disability benefit have to
actively seek work compatible with their capacity and participate in certain activities as a
condition of unemployment benefit receipt. There are four broad activation routes for
these people: the Job Network (JN), the Disability Employment Network (DEN), Vocational
Rehabilitation (VR), and the Personal Support Programme (PSP). People with moderate to
profound disability who qualify for a disability benefit or another income support payment
can also access Disability Business Services. Some of the more important measures in
Australia and the United Kingdom are described in Box 5.2.
Box 5.1. Personalised employment service of Work Directions United Kingdom
Work Directions is a private employment service, or Job Broker in UK terms. Originallyfounded in Australia, it started its operation in the United Kingdom in 2001, with theintroduction of the NDDP. Since 2004, Work Directions has been delivering the UnitedKingdom’s largest single NDDP contract (in Birmingham). In 2007, Work Directions won asignificant proportion of the contracts in the first phase of outsourcing of the Pathways toWork programme (in London, Nottinghamshire, Birmingham and Edinburgh). In thiscontext, they will work with over 80 000 clients over the next three years.
Their NDDP office in Birmingham serves a potential clientele of around 60 000 people onhealth-related benefits (most of them on Incapacity Benefit). However, as NDDP is anentirely voluntary scheme, reaching clients is one of the biggest challenges. 45% of theirclients are referred by the public authorities, 15% by charity organisations, doctors, etc.,30% are reached through active outreach and 5% are walk-in clients. 80% of all theirparticipants have been out of work for at least one year, and many for much longer.
They have 19 employment advisers with different backgrounds, one psychologist and aphysiotherapist. Employment advisers are quite free to use whatever approach they want,and by and large they do not match jobseekers with vacancies but rather focus ondeveloping personal skills and the interest for work, i.e. on breaking patterns of completeinactivity. The current caseload is 35 clients (to be increased to 40-45), and the target foreach caseworker is one placement per week, i.e. 4.3 placements per month. Currentaverage placement is 3.8 per month, which is similar to the performance of caseworkersdealing with jobseekers without disability.
As all NDDP providers, Work Directions is funded on the basis of outcomes: they receiveGPB 300 upon registration of a client and GPB 4 100 for a full-time job after 13 weeks. Theirrecent statistics show that 4 400 people showed interest to participate, while only some3 000 registered with them. Of these, 1 300 found a job (83% of them remained on the jobfor at least 13 weeks), 600 continued to search for a job and 1 100 left the programme. Theaverage time length to place a person is ten weeks. The success rate does not correlatewith the duration of inactivity.
SICKNESS, DISABILITY AND WORK: BREAKING THE BARRIERS – VOL. 2 – ISBN 978-92-64-03815-8 – © OECD 2007144

5. EMPLOYMENT POLICY – NEW CHALLENGES AND DIRECTIONS
Box 5.2. Specialised employment measures in Australia and the United Kingdom
Measures in Australia
Job Network (JN) aims to help jobseekers into sustainable employment throughpersonalised employment assistance involving job-search and employment-focusedactivities. Services are tailored to the person, based on individual needs, level ofdisadvantage in the labour market and duration of unemployment. JN is primarily aimedat providing assistance to jobseekers who are job-ready. If needed, JN providers can accessthe Job Seeker Account, a quarantined pool of funds that is used to purchase employment-related assistance such as employment-related training, work clothes and equipmentrequired to accept a job offer, wage subsidies and interpreter services. JN is not targeted atjobseekers with disability but several JN providers are specialist in this field.
Vocational Rehabilitation (VR) provides specialist rehabilitation from health professionalswith employment assistance to help participants find or keep a job. The focus of VR is onassisting people in understanding and managing their limitations imposed by theirdisability. The programme has a stronger focus on capacity building in the beginning andjob search and placement typically come at the end. The programme is primarily deliveredby health professionals. To be eligible, a client must be assessed as being able to workindependently in the workplace after less than six months support.
Disability Employment Network (DEN) typically aims to find jobs for clients as quickly aspossible, in accordance with their capacities and barriers. Assistance includes capacitybuilding, training, counselling and improving motivation as well as job matching,employer support and on-the-job support for the worker and their co-workers. DENproviders can purchase vocational training and employment-related assistance for theclient. To be eligible for uncapped services, a client must be assessed as likely to need morethan six months but less than 24 months support after placement in a job. In the cappedstream, resources permitting assistance can be provided for as long as it is required bythe client.
The Personal Support Programme (PSP) provides up to two years assistance to people whoare facing multiple non-vocational barriers (such as homelessness, mental health issues,drug problems, or social isolation) that prevent them from finding and keeping a job orbenefiting from programmes delivered through JN or DEN. PSP can provide a range ofservices, including individual counselling, group work and specialist assistance. Outcomesmay include employment, transfer to an employment assistance programme, or study.Like JN, PSP is not targeted at jobseekers with disability but many of the users do havehealth problems also.
Disability Business Services are commercial enterprises that provide supported/shelteredemployment assistance to people with disability who are unlikely to be able to work in theopen labour market at or above the federal minimum wage and who need ongoing supportfor a substantial period to obtain or retain paid employment. (However, transfers betweenthis service and all other services are possible in both directions). Tasks in such a businessinvolve packaging, assembly, production, recycling, garden maintenance and landscaping,screen printing, cleaning services, laundry services and food services. Workers receive thesame working conditions as those in the general workforce, including pro rata wageslinked to their productivity.
SICKNESS, DISABILITY AND WORK: BREAKING THE BARRIERS – VOL. 2 – ISBN 978-92-64-03815-8 – © OECD 2007 145

5. EMPLOYMENT POLICY – NEW CHALLENGES AND DIRECTIONS
In Spain, the employment service is mainstreamed and measures for jobseekers with
a disability cannot be separated from services offered to regular jobseekers. After the
decentralisation of labour market services in 2002, activation measures now differ
considerably between regions and monitoring of outcomes has become more complex.
Programme development is based on agreements with the social partners and lately also
with some disability organisations. Participation in these programmes is low in general,
and even more so for people with disability.
In Luxembourg, as in Spain, the use of specialised and tailored activation measures for
people with disability is rare. Persons with a health condition who are classified as
Box 5.2. Specialised employment measures in Australia and the United Kingdom (cont.)
Measures in the United Kingdom
New Deal for Disabled People (NDDP) was introduced as a pilot in 1998, and as a nationalprogramme in 2001. It was the first programme to target people with disability. Theprogramme is voluntary and delivered through a network of private, public and voluntary-sector Job Brokers who have been chosen by Jobcentre Plus. The target group for NDDP ispeople on a qualifying benefit who are relatively close to the labour market but needinge.g. job-search advice, matching skills to jobs, confidence building, help with completingapplication forms, and interview preparation.
Condition Management Programme (CMP) is a medical rehabilitation scheme with a strongwork focus and only available under Pathways to Work. The primary goal is to help peopleback to work by enabling them to deal with or overcome their health problems. Theprogramme starts by a medical assessment that focuses on the impact of the person’shealth problems and personal situation. A team of health specialists is then setting up anaction plan that is discussed with the client. CMP fills the gap between medical treatmentin the health sector and work-readiness. The average programme duration is 14 weeks.Participants have often lost their labour market attachment and are not ready to bereferred to a Job Broker.
Work Preparation is a programme to help identify the most suitable type of work byproviding work experience and by developing new or existing skills through courses andtraining. This scheme is targeting people that either wish to return to work or are at risk oflosing their job due to a disability. Participants join this programme by referral from aDisability Employment Adviser.
Access to Work provides practical advice and support to help people with disability enteror stay in paid employment. It is aiming at overcoming work-related barriers through asystem of grants to buy special equipment, and it also covers additional travel costs. It canalso cover contributions to adaptations of premises, and the provision of support workers.
Workstep provides tailored support to find or secure jobs for those who have morecomplex barriers (often more severe disabilities). It provides financial support and canreimburse the full wage of persons while taking up employment with the view to obtain anon-subsidised job.
Remploy is similar to Workstep, with the difference being that people on the Remployscheme work directly for Remploy Ltd (normally in a factory). Participants usually join thisscheme by referral from a Disability Employment Adviser. Remploy have recentlyannounced plans to modernise their provision, with a reduction in the number offactories.
SICKNESS, DISABILITY AND WORK: BREAKING THE BARRIERS – VOL. 2 – ISBN 978-92-64-03815-8 – © OECD 2007146

5. EMPLOYMENT POLICY – NEW CHALLENGES AND DIRECTIONS
externally re-deployable are treated as ordinary jobseekers but with access to a wider range
of training options. In addition, there is a semi-vocational rehabilitation programme.
Although the majority of all rehabilitation cases are medical, there is a strong link to labour
market returns (similar to the Condition Management Programme in the United Kingdom).
People usually come to the (only) rehabilitation centre through referral from a doctor, an
occupational therapist or a hospital. However, the PES has recently started to send people
to the centre for orientation; there is also a plan to have a regular co-operation with the
rehabilitation centre.
Sheltered work
Countries also use sheltered employment, which is targeted at people with severe
disability. Often sheltered work is oriented towards a therapeutic function instead of work
tasks. It also relies heavily on public subsidies.5 The United Kingdom uses this more
traditional approach to an extent: while the preferred approach now is for supported
employment in open workplaces, there remain a number of sheltered workplaces,
including the factories operated by Remploy, although these are being reduced. Spain also
has a number of traditional sheltered workplaces, but has recently introduced a new
measure to help people with disability to move from sheltered employment into jobs in the
open labour market. Sheltered workplaces can outsource certain activities to ordinary
companies for up to three years (so-called enclave contracts). During this period, the
person with a disability continues to be employed by the sheltered workplace.
Australia uses a more market-oriented approach of sheltered/supported work. In
2005-06, 21 250 Australians (around 3% of all disability benefit recipients) were employed in
Disability Business Services. Wages paid are productivity based with an average salary of
AUD 3 per hour (which is 25% of the minimum wage). Of all those workers, 97% receive a
disability benefit. Employers receive funding for each worker with a disability based on an
assessment using the Disability Maintenance Instrument. The funding depends on the
support needs of the individual and does not exceed AUD 12 000 per year (almost half of all
workers generate the highest subsidy). The funding covers the costs of support
(e.g. training, costs of a support worker, etc.), but not the wage costs since workers are paid
according to their productivity, which is adjusted every second year. The annual turnover
of workers is around 3 000, of which around 450 transfer to the open labour market.
However, Disability Business Services do not place people with disability in open labour
market positions.
C. Participation in activation measures
Information on participation in employment or activation measures is only available
for Australia and the United Kingdom (Table 5.3). Overall, even though different indicators
are being used, there appears to be less age-targeting in employment service delivery in the
United Kingdom compared to Australia.6 Every second programme participant in Australia
is younger than 40, and even six out of ten of the clients in the Disability Employment
Network. In the United Kingdom, Workstep is the programme which is most strongly
targeting young workers (in this case jobseekers younger than 25).
Spending on employment support for people with disability is low
Data on overall public spending on Active Labour Market Programmes (ALMP) show
that none of the four countries belong to those OECD countries with a strong emphasis on
SICKNESS, DISABILITY AND WORK: BREAKING THE BARRIERS – VOL. 2 – ISBN 978-92-64-03815-8 – © OECD 2007 147

5. EMPLOYMENT POLICY – NEW CHALLENGES AND DIRECTIONS
rehabilitation and employment measures. In 2005, Australia, Luxembourg and the United
Kingdom had similar unemployment rates of around 5%. Expenditures on activation
measures for the unemployed and for workers with disability amounted to 0.5% of GDP
in the United Kingdom, 0.4% in Australia and 0.3% in Luxembourg. In Spain, the
unemployment rate was almost twice as high as in the other three countries, while
spending amounted to 0.7% of GDP (OECD, 2006d).7
Spending on employment measures for people with disability as a share of GDP in
Australia, Luxembourg and the United Kingdom is only around one-tenth of total ALPM
spending.8 This is substantially lower than in, for example, Norway and Switzerland
(Figure 5.1). Interestingly, in the United Kingdom total expenditures are less than half of
those in Australia, despite similar rates of inflow into disability benefits. Activation of
people with disability is predominantly focused on regular labour market interventions. A
smaller share of total spending in both Australia and the United Kingdom is used for
sheltered employment measures.
Annual spending on employment measures per person corrected for differences in
purchasing power in Australia and the United Kingdom come at similar costs (Table 5.4).
The exceptions are the two programmes Remploy and Workstep in the United Kingdom,
which are heavily based on wage subsidies. The low per capita spending on PSP in
Australia, on the other hand, can be explained by the focus on individual counselling and
group therapy with a very limited use of training and other more costly activities. The
relatively lower costs for NDDP compared to Job Network is partly explained by the fact that
people are probably more job-ready when they voluntarily participate in NDDP, which is
why they only need less costly support.9
Table 5.3. Participation in employment measures in Australia and the United Kingdom
Age distribution by type of programme, percentage, 2005a
20-39 40-49 50-64 Total
Australiab
Programme participants 76 225 40 423 33 772 150 420
Disability Employment Service 61.5 23.0 15.5 100.0
Personal Support Programme 43.7 28.3 28.0 100.0
Vocational Rehabilitation 43.0 30.9 26.1 100.0
All programmes 50.7 26.9 22.5 100.0
For comparison: current DSP recipients 22.2 22.1 55.7 100.0
18-24 25-49 50+ Total
United Kingdomc
Programme commencements 20 750 90 240 40 560 151 550
Pathways to Work 10.4 63.4 26.2 100.0
NDDP 15.2 56.9 27.9 100.0
Workstep 27.3 56.4 16.4 100.0
All programmes 13.7 59.5 26.8 100.0
For comparison: inflows into incapacity benefit 13.6 54.1 32.3 100.0
a) Data refer to current programme participants in Australia and programme commencements in the UnitedKingdom. Therefore, different items for comparison are used.
b) Data are not available for Job Network providers (because distinction with and without disability is not possible).The age groups for the Personal Support Programme (PSP) are 20-34, 35-44 and 45-64.
c) The lower age limit for disability inflow data is 20 and not 18 and the upper limit is 64.Source: DEWR for Australia and DWP for the United Kingdom.
SICKNESS, DISABILITY AND WORK: BREAKING THE BARRIERS – VOL. 2 – ISBN 978-92-64-03815-8 – © OECD 2007148
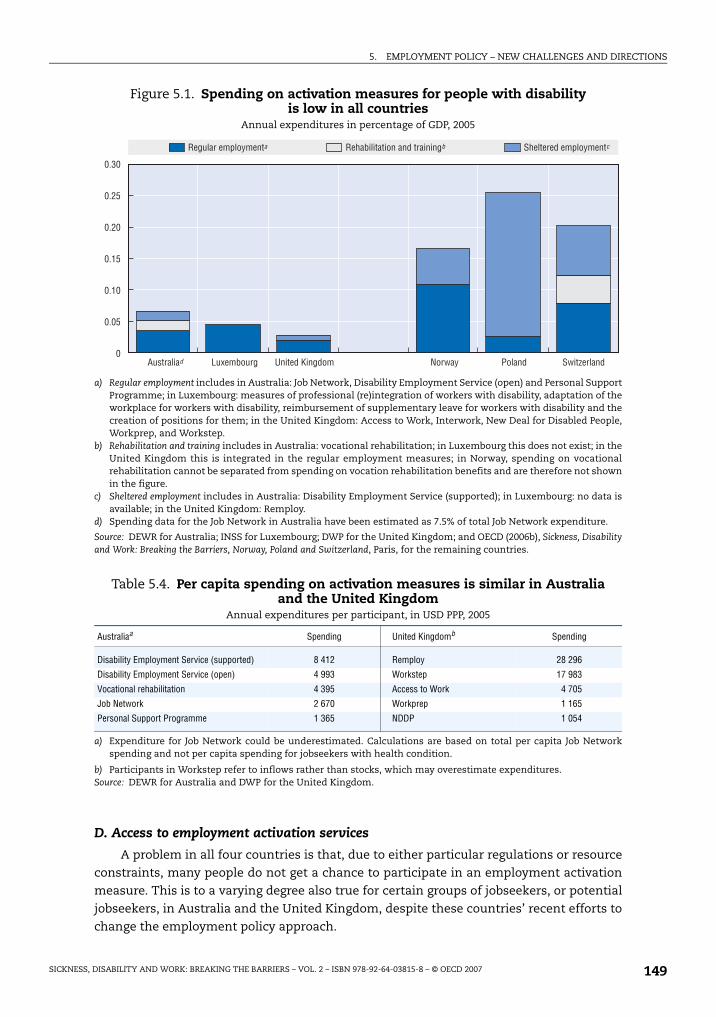
5. EMPLOYMENT POLICY – NEW CHALLENGES AND DIRECTIONS
D. Access to employment activation services
A problem in all four countries is that, due to either particular regulations or resource
constraints, many people do not get a chance to participate in an employment activation
measure. This is to a varying degree also true for certain groups of jobseekers, or potential
jobseekers, in Australia and the United Kingdom, despite these countries’ recent efforts to
change the employment policy approach.
Figure 5.1. Spending on activation measures for people with disability is low in all countries
Annual expenditures in percentage of GDP, 2005
a) Regular employment includes in Australia: Job Network, Disability Employment Service (open) and Personal SupportProgramme; in Luxembourg: measures of professional (re)integration of workers with disability, adaptation of theworkplace for workers with disability, reimbursement of supplementary leave for workers with disability and thecreation of positions for them; in the United Kingdom: Access to Work, Interwork, New Deal for Disabled People,Workprep, and Workstep.
b) Rehabilitation and training includes in Australia: vocational rehabilitation; in Luxembourg this does not exist; in theUnited Kingdom this is integrated in the regular employment measures; in Norway, spending on vocationalrehabilitation cannot be separated from spending on vocation rehabilitation benefits and are therefore not shownin the figure.
c) Sheltered employment includes in Australia: Disability Employment Service (supported); in Luxembourg: no data isavailable; in the United Kingdom: Remploy.
d) Spending data for the Job Network in Australia have been estimated as 7.5% of total Job Network expenditure.
Source: DEWR for Australia; INSS for Luxembourg; DWP for the United Kingdom; and OECD (2006b), Sickness, Disabilityand Work: Breaking the Barriers, Norway, Poland and Switzerland, Paris, for the remaining countries.
Table 5.4. Per capita spending on activation measures is similar in Australia and the United Kingdom
Annual expenditures per participant, in USD PPP, 2005
Australiaa Spending United Kingdomb Spending
Disability Employment Service (supported) 8 412 Remploy 28 296
Disability Employment Service (open) 4 993 Workstep 17 983
Vocational rehabilitation 4 395 Access to Work 4 705
Job Network 2 670 Workprep 1 165
Personal Support Programme 1 365 NDDP 1 054
a) Expenditure for Job Network could be underestimated. Calculations are based on total per capita Job Networkspending and not per capita spending for jobseekers with health condition.
b) Participants in Workstep refer to inflows rather than stocks, which may overestimate expenditures.Source: DEWR for Australia and DWP for the United Kingdom.
���
���
���
����
����
����
�)*�������� -"�����.�"��!% �!�:�' 5!��"� ,:��C����"�+*��%�!*��
���*�����%&�!'%�"�� ������������!"��"������"�"�� ,����������%&�!'%�"��
SICKNESS, DISABILITY AND WORK: BREAKING THE BARRIERS – VOL. 2 – ISBN 978-92-64-03815-8 – © OECD 2007 149

5. EMPLOYMENT POLICY – NEW CHALLENGES AND DIRECTIONS
How are activation measures assigned?
Participation in activation measures in Luxembourg and Spain is usually decided
between the employment adviser at the PES and the client. In Spain, however, there are
also other ways to access services. The 17 autonomous communities and the 57 provinces
have a network of (currently 244) Evaluation and Orientation Teams. One of the roles of
these teams is to evaluate a person’s capacity and professional orientation. These teams
are multi-professional and can include, for example, rehabilitation doctors, psychologists,
vocational experts and social workers. They co-operate with the PES offices of the
autonomous communities in determining support needs, and they make sure to exploit
the person’s own capacities and resources as well as the social resources available in the
person’s milieu. Notably, this service can be accessed by every citizen, irrespective of the
labour force status (e.g. registered as unemployed, or not).
In the United Kingdom, the Incapacity Benefit Personal Adviser (IBPA) proposes
support through a range of programmes within Jobcentre Plus as described above. When
clients meet with the IBPA, the adviser identifies those who need substantial help and who
should go through the Pathways to Work interview process (70-80% of all people with health
problems fall in this category). The remaining “lighter” cases are referred to a Job Broker
directly to get help in finding a job. The specialised Disability Employment Advisers (DEA)
can access additional programmes (such as Work Preparation and Workstep). They conduct
employment assessments to identify the type of work or support that would be most
suitable for the person. Hence, the IBPA and the DEA are gatekeepers to most activation
programmes unless the person is referred to a Job Broker directly.
The support needs of a jobseeker in Australia are identified at Centrelink by using the
Job Seekers Classification Instrument (JSCI). The JSCI is performed when a client first
registers for employment assistance. It recognises the labour market disadvantage of a
jobseeker based on responses to a questionnaire and identifies persons who, because of
their personal circumstances, are likely to become long-term unemployed. The instrument
also provides eligible people with early access to more intensive employment supports
through the Job Network. For disadvantaged jobseekers (e.g. people with disability), the JSCI
may trigger the need for a Job Capacity Assessment (JCA), which, in addition to assessing
the capability to work, determines the most appropriate service for the person. The specific
activities within the respective service, however, are decided by the provider.
Employment service, but not for all
In the United Kingdom, Pathways to Work is primarily aiming at new incapacity benefit
recipients, but it is also available to existing disability beneficiaries – mainly on a voluntary
basis. To encourage existing recipients to consider leaving benefit rolls and take up work, a
pilot was launched in early 2005 that extended the work-focused interviews (under the
Pathways process) to people who claim incapacity benefits for less than two years – on a
mandatory basis. A further extension of this pilot took place in 2006 for recipients in
certain areas who had claimed disability benefits between two and six years (Blyth, 2006).10
In Luxembourg and Spain, jobseekers with health problems – whether receiving
income support or not – can always register with the PES and thereby, in theory, receive
available employment services. The biggest problem in these countries is that service
supply is quite limited.
SICKNESS, DISABILITY AND WORK: BREAKING THE BARRIERS – VOL. 2 – ISBN 978-92-64-03815-8 – © OECD 2007150

5. EMPLOYMENT POLICY – NEW CHALLENGES AND DIRECTIONS
Australia is different from the other countries because most services are divided
between a capped and an uncapped stream. The uncapped or demand-driven stream is
available for jobseekers with an assessed capacity to work of 15-29 hours per week. Capped
services operate with a fixed supply and therefore tend to have long waiting lists; these
services are offered to those with a capacity to work of less than 15 hours or more than
30 hours (i.e. where they have a current capacity to work of less than 30 hours per week but
will be able to work more than 30 hours per week within two years with assistance). People
on disability benefits who want to participate in an activation measure to increase their
chances of finding a job will also be directed to capped services, unless the JCA identifies a
remaining work capacity of more than 15 hours per week, or 30 hours per week for the
grandfathered group (Australian Government, 2005); in this case they would lose their
disability benefit and be transferred to the unemployment benefit scheme – and such
become eligible for uncapped employment services.
Demand for service in the capped stream is in most regions higher than the actual
supply. ACOSS (2005) concluded that a key reason for low employment rates of disability
benefit recipients is the limited amount of help and support they receive. This is
particularly critical for unemployed people with (permanent) disability not on income
support who are only eligible for capped places in disability employment and vocational
rehabilitation services, and for basic employment assistance through the Job Network. For
the Personal Support Programme (PSP) in particular waiting times are very long. This
creates an additional problem for those people who would benefit from a period in PSP
prior to entering the Disability Employment Network or Vocational Rehabilitation services,
but who have no access to PSP within a reasonable time period.
Available evidence suggests that less restrictive access to employment services might
help to raise employment participation of people with disability currently outside the labour
force (even though no information is available about cost-efficiency of such an approach). As
Box 5.3 describes, Australia’s Job Network Disability Support Pension Pilot demonstrated that
job placements of current benefit recipients – even long-term recipients – can have positive
outcomes (DEWR, 2005). More generally, therefore, employment assistance should be open to
all groups of jobseekers, including those who do not qualify for benefits and who are not
subject to any participation requirements (OECD, 2006d).
Box 5.3. Australia’s Job Network Disability Support Pension Pilot
Between December 2003 and June 2004, the Australian government conducted a pilot toexplore possibilities for existing disability benefit recipients to obtain employment withavailable Job Network (JN) employment services. 788 recipients joined the pilot on avoluntarily basis. Of these, 679 started intensive support customised assistance (a moreintensive support available at JN).
By June 2005, 45% had been placed in employment and 3% in training. Of the remainder, 24%were still receiving employment support at JN; 5% had been referred onto more specialisedemployment services; and 23% had exited Job Network services. Among participants withpsychiatric or psychological conditions, 42% had obtained a job. However, the probability ofeither gaining or sustaining employment was lower than the average for this group.
Of those people who obtained a job, 80% had been receiving disability benefits for morethan two years and over half of this group had been recipients for more than five years.
SICKNESS, DISABILITY AND WORK: BREAKING THE BARRIERS – VOL. 2 – ISBN 978-92-64-03815-8 – © OECD 2007 151
5. EMPLOYMENT POLICY – NEW CHALLENGES AND DIRECTIONS
5.3. A new balance of rights and responsibilitiesIn spite of a range of supports, employment rates of people with disability are low and
have even decreased relative to the population without disability in Australia and
Luxembourg. Why is this so? Part of the explanation is changes in labour market
requirements that may have made it more difficult for workers with health problems to
stay in, or to find, work (Chapter 1). This is especially true for the increasing number of
people with mental health conditions.
Another reason for the low employment rates of people with partially-reduced work
capacity are inadequate policies. Assessment procedures and benefit systems often pull
workers with disability into long-term benefit dependency. Countries are increasingly
aware of this problem. Australia and Luxembourg have chosen to suppress access to
disability benefits for people with partially-reduced work capacity, while Australia and the
United Kingdom, in particular, are rethinking employment and rehabilitation policies.
This section describes the latest developments on the employment and rehabilitation
policy side. To a large recent changes these are driven by increased expectations on three
main actors: public authorities, workers with disability and employers. The expectations
relate to: i) the type and quality of support public authorities should be providing; ii) the
form of participation and job-search efforts one can expect from workers with disability in
exchange for more and better employment support; and iii) the extent of involvement of
employers in the process.
A. New directions for the state to help people with health problems back to work
Since recently, the governments of Australia and the United Kingdom are taking a
more active role in supporting people with partial work capacity back into work. In
Australia, this is being done mainly by investing more resources in activation and
rehabilitation of those no longer eligible for disability benefits (i.e. jobseekers able to work
15-29 hours per week), while the United Kingdom has in addition introduced new
voluntary activities for current recipients along with in-work benefits to enhance
incentives to move into employment. Luxembourg and Spain have to a lesser extent
reoriented their expenditures towards active support for people with partial work capacity.
However, Luxembourg is using in-work compensation payments to people with partial
work capacity moving into lower-paid jobs.
Timing of identification and intervention is crucial
In Australia and the United Kingdom, employment services are often not available
before a person claims or receives income support. In both countries, services are
predominantly (and sometimes exclusively) focused on people on (qualifying) benefits.
And in both countries, little is offered during the employer-paid sickness period (which is
six months in the United Kingdom, but often quite short in Australia). Early identification
and support to both the employee and the employer are necessary to preserve labour
market attachment (Bambra et al., 2005). Work motivation decreases rapidly: evidence from
the United Kingdom suggests that longer-term benefit recipients have much lower
expectations to return to work in the future than shorter-term recipients (Pires et al., 2006).
Early identification of health problems is practiced in both Luxembourg and Spain
through close monitoring of the sickness phase. In both countries, people have a possibility
to return to their former employer: in Luxembourg through the (internal) redeployment
SICKNESS, DISABILITY AND WORK: BREAKING THE BARRIERS – VOL. 2 – ISBN 978-92-64-03815-8 – © OECD 2007152

5. EMPLOYMENT POLICY – NEW CHALLENGES AND DIRECTIONS
process and in Spain because of a legal right to do so within a two-year period following the
onset of a health problem. What these two countries lack, however, are better supports for
these people to keep their jobs when they return and the supply of adequate employment
services for those who cannot go back to their job.
The forthcoming reform of the disability benefit scheme in Switzerland is a good
example of how to introduce early identification and activation. The key focus of this
reform is to get in contact as early as possible with people at risk of moving onto disability
benefits. To facilitate this, a process involving three actions has been developed, all of them
under the responsibility of the cantonal disability insurance office: i) early identification of
health problems, ideally after a period of four weeks, to prevent long-term work incapacity;
ii) early and short-duration intervention, if needed, to avoid job loss (i.e. relatively cheap
but effective intervention that does not require a comprehensive assessment process, for
instance adaptation of the workplace); and iii) provision of new types of integration
measures predominantly aimed at preparing people for subsequent vocational
rehabilitation and reintegration, targeted to persons who had been at least 50% work-
incapacitated for a period of at least six months (OECD, 2006b).
A better focus on existing benefit recipients is needed
Early intervention is important for new potential beneficiaries. With high disability
benefit recipiency levels, however, it is also necessary to increase the outflow from these
long-lasting benefits into jobs. Reform processes in Australia and Luxembourg are mainly
focusing on curbing high inflow rates onto disability benefits. Similarly, little is done about
existing benefit recipients in Spain. Only the United Kingdom has started to take some
steps towards this group; so far mainly on a voluntary basis, but mandatory involvement of
existing customers is also tested in some Pathways areas.
The low ambitions of policy makers to assist existing recipients in leaving benefit rolls
are contributing to the very low outflow from disability benefits. Not only are there hardly
any policy initiatives towards this group of people, but there are several barriers for those
who want to work. These include the award of more or less permanent life-time benefits;
no (or few) obligations to participate in employment measures; low financial incentives to
take up work; and a high risk of losing eligibility for the benefit if work is tried.
Among the four countries, there are three very different approaches on how to deal
with existing beneficiaries in terms of helping them back to work. Reforms in Australia
have so far avoided to address current recipients (commonly known as grandfathering). In
the United Kingdom, existing recipients are increasingly targeted by policy through stricter
participation requirements and better financial incentives for those taking up work. The
new benefit reform will go further in this respect and differentiate benefit levels between
those who participate in activation and those who do not (Chapters 2 and 4). A neutral
approach is used by Luxembourg and Spain: These countries have few policies targeted to
existing beneficiaries, but they are generally not excluded from participating either.
In Australia, the fear of losing the benefit and associated concessions was shown to be
a major disincentive for beneficiaries to take up work (DEWR, 2005). The Australian Human
Rights and Equal Opportunity Commission found that barriers were also arising from
worries about the impact on benefits and the lack of accessible and comprehensive
services (Human Rights and Equal Opportunity Commission, 2006). In the United Kingdom,
barriers to and bridges into work were surveyed among participants in the NDDP programme.
SICKNESS, DISABILITY AND WORK: BREAKING THE BARRIERS – VOL. 2 – ISBN 978-92-64-03815-8 – © OECD 2007 153

5. EMPLOYMENT POLICY – NEW CHALLENGES AND DIRECTIONS
66% responded that the single most important factor to consider taking up work was to
have the possibility to return to their former benefit if needed. Being able to decide on the
number of hours worked, mentioned by 60%, came second (Stafford et al., 2006).
The fear of benefit-eligibility loss could be overcome by giving recipients the
possibility to return to their former benefit within a period of several years – a possibility
that exists in several countries including Australia (two years) and the United Kingdom (up
to two years). In the United Kingdom, however, linking rules have a more limited logic:
benefit eligibility would always be reassessed and benefit entitlement only upheld for
people passing the Personal Capability Assessment test. The low outflow from benefits of
longer-term recipients in both countries suggests that these regulations are not very
effective and, possibly, too restrictive. Time limits may be too short, a problem which could
perhaps be solved by relating the time limit to the number of years already on disability
benefit (i.e. the longer the recipiency period, the longer the time limit for benefit
suspension).
Financial incentives for beneficiaries to take up work should include in-work benefits
and better possibilities to combine benefits with income from work (Chapter 4). In
addition, eligibility for employment activation measures should be broadened to include
those who want and can work but are currently on disability benefits. Along these lines,
reassessing of younger and prime-age beneficiaries, who tend to have a much higher work
motivation, should be considered.
Improving the quality of employment service
More and better evaluations are needed in all countries. Luxembourg and Spain lack
any rigorous evaluations of their employment service as a whole. Australia’s employment
programmes are only evaluated occasionally. Evaluations in the United Kingdom are
considerably more extensive, although cost-benefit analyses are less common.
Employment outcomes for jobseekers with disability in the United Kingdom depend
strongly on the measure used. Overall, outcomes appear to be poor – less than one-third of
all new participants find a job, with little variation across age groups (Table 5.5). Outcomes
from NDDP measures, however, are much better, with one job entry for every two new
participants. Also in this programme, variation across groups of clients is limited; most
importantly, participants with mental conditions appear to have similar success rates as
those with other problems. In 2005, more than 60 000 people entered the NDDP
programme. However, this only accounted for 2.4% of the population flowing onto
qualifying benefits (with the take-up rate in Pathways pilot areas being almost three times
higher than elsewhere). As NDDP participation is voluntary, participants were probably
more job-ready than the average benefit recipient (Stafford et al., 2006).
The very high outcome rates for Workstep are mainly explained by the fact that it is
aimed at providing support at work. Moreover, two-thirds of these employment outcomes
are into sheltered jobs in an ordinary enterprise or into sheltered-work companies.11
In 2001, a target was introduced to raise the proportion of participants transferring from
Workstep into mainstream employment without support to 30% over a two-year period;
however, this target was dropped in 2004 (Meah and Thornton, 2005).
Limited available information on outcomes from activation measures in Luxembourg
suggests that of all persons with disability below the age of 50 (who are obliged to accept
training and re-integration measures) only 12-13% move into a job. One reason for the low
SICKNESS, DISABILITY AND WORK: BREAKING THE BARRIERS – VOL. 2 – ISBN 978-92-64-03815-8 – © OECD 2007154

5. EMPLOYMENT POLICY – NEW CHALLENGES AND DIRECTIONS
success rate may be that the Ministry of Education does not recognise diplomas received
from these training programmes. Very partial information on employment outcomes exists
for Spain: each year around 12 000 people with disability are hired on permanent contracts
in the open labour market (compared to 47 000 registered jobseekers with disability);
however, this is less than 15% of the number of people granted a disability benefit each year.
For the Disability Employment Network in Australia, no outcome measures are
available. For Job Network providers, however, success rates can be calculated, with a split
between participants with and without disability. Results depend very much on the
indicator used (Table 5.6). The government defines successful outcomes as the number of
positive outcomes over the number of exits from the service, with positive outcomes being
employment, training or education three months after programme completion. This
results in success rates for jobseekers with disability of 49%, which is lower but not much
lower than the figure for those without disability of 62%. Success rates are higher for job
placement measures than for intensive support. Outcomes from Vocational Rehabilitation
Table 5.5. Employment outcomes from activation programmes in the United Kingdom are promising
Job entries as a percentage of new participants in employment measures, 2005
Programme
NDDP Pathways to Work Workstep Total
Total 48 16 77 31
Age
18-24 46 14 70 28
25-49 49 17 78 33
50 and over 48 13 84 29
Health condition
Mental 48 16 85 33
Muscular-skeletal 51 15 . . 33
Cardio vascular 50 . . . . 50
Other 47 16 76 30
Source: Department for Work and Pensions (DWP).
Table 5.6. Employment outcomes for jobseekers with disability in Australia are slightly worse than for those without disability
In percentage of those who commenced and completed a Job Network service, 2005
Number of commencements
Numberof exits
Positive outcomes
Positiveoutcomes as
a share of exits
As a share of commencements
Exits Positive outcomes
Jobseekers with a disability
Job placements 27 160 4 452 2 636 59% 16% 10%
Intensive support: Customised assistance 46 728 18 984 8 695 46% 47% 19%
Intensive support: Job search training 2 907 1 538 53%
Total 73 888 26 343 12 868 49% 36% 17%
All jobseekers
Job placements 518 008 121 815 90 630 74% 24% 17%
Intensive support: Customised assistance 614 842 185 126 98 117 53% 52% 16%
Intensive support: Job search training 133 136 84 009 63%
Total 1 132 850 440 077 272 756 62% 39% 24%
Note: Data refer to period July 2003-June 2004 and outcomes achieved up to September 2004.Source: DEWR (2004) for commencements; Australian Institute of Health and Welfare (2005) for exits.
SICKNESS, DISABILITY AND WORK: BREAKING THE BARRIERS – VOL. 2 – ISBN 978-92-64-03815-8 – © OECD 2007 155

5. EMPLOYMENT POLICY – NEW CHALLENGES AND DIRECTIONS
services (not shown in the table) are not so different from Job Network outcomes: 44% of
those who exit the programme are either in employment or education three months later.
Privatising the employment service – outcome-based funding
One way to improve the quality of employment services is to monitor better what
service providers, especially the PES, are doing and delivering. An innovative route to this
is to change the system from input-based block grants to outcome-based funding. Such
funding system is now in force in Australia for most service providers.12 A similar move
has also been taken a while ago in the United Kingdom for Job Brokers that are delivering
the NDDP.
Outcome-based funding in Australia and the United Kingdom means that authorities
purchase employment and rehabilitation services for people with disability from the
private sector. Instead of reimbursing these providers upfront, both countries are making
efforts to ensure that providers have incentives to deliver employment outcomes. Hence,
the bulk of the payment for taking on jobseekers is received for successful transfers into
jobs. In this way the system has a built-in self-selection process; those providers who fail
to deliver will not stay in business.
Payments to providers in Australia are split up in several phases: a certain amount is
paid in the service phase, while most of the payment is conditional on employment
outcomes where a small fee is paid for the placement, a second fee when the person has
remained in work for 13 weeks and a third fee after 26 weeks of work. The largest part of
the payment is received for persons being placed in a job (or training) for at least
13 weeks.13 Payments are also substantially higher when people have been referred to
providers by either Centrelink or a Job Capacity assessor. Persons volunteering for service
(e.g. those already on disability benefits) receive less support from providers because these
people would only generate the providers AUD 65 for a placement. This is very different
from the situation in the United Kingdom, where Job Brokers actively try to promote their
service to attract disability benefit recipients to register and use their service.
The funding structure differs between the two countries in many ways. In Australia,
fees are differentiated between clients depending on their disadvantage in the labour
market. This system helps to make cherry-picking among service providers (or parking of
more difficult clients) less appealing. In the early stage of Job Network, providers were
often accused of providing fewer services to jobseekers that were more difficult to place
(including people with disability). These jobseekers are now receiving a higher weighting in
the Job Seekers Classification Instrument (JSCI) which is also used to determine service
fees. Success in placing more difficult clients also results in higher points in the evaluation
process – the so-called Star Ratings system. This system is currently used to monitor
performance of Job Network members and a good rating is crucial to be included in the
next round of tenders and, thereby, for staying in business.14 A similar system, also based
on relative success of providers, for Disability Employment Network providers has been
developed recently and is currently being implemented. A Star Ratings system for
Vocational Rehabilitation services is also in the early stages of development.
Provider funding in the United Kingdom is also defined in terms of job placements, but
without taking the degree of disability (or disadvantage) into account. This absence of
differentiation between easier and more difficult clients creates a risk that Job Brokers
become more concentrated on job-ready people (Lewis et al., 2005). This may aggravate
SICKNESS, DISABILITY AND WORK: BREAKING THE BARRIERS – VOL. 2 – ISBN 978-92-64-03815-8 – © OECD 2007156

5. EMPLOYMENT POLICY – NEW CHALLENGES AND DIRECTIONS
further along with rising caseloads because of successful implementation of Pathways to
Work and, hence, more referrals.
Payments for service also differ across providers in the United Kingdom. The reason is
that the government is negotiating different payment rates for different providers.
Providers asking for too low payments may obtain similar outcome results, but what is
important is sustainability of a placement. This should also be taken into account when
negotiating payment fees. Work Directions, the most expensive service provider in the
United Kingdom, receives GBP 4 100 for a full-time job lasting 13 weeks or longer. More
generally, for NDDP providers, 12% of the negotiated amount is received as an upfront
payment, another 44% after a placement in a job and the remaining 44% if the person
remains employed for at least 13 weeks.
In the United Kingdom in particular, the definition of sustainable employment
outcomes of 13 weeks is too short and should be changed, for example, along the lines of a
House of Commons report (2006), which proposed that contracts with providers should
reward job retention lasting for at least 12 months. In addition, some people may need to
upgrade their skills or to be retrained; these possibilities are not well covered in the current
funding procedures in the United Kingdom. Ways should therefore be sought to better
reward intermediate outcomes and inputs, an issue also raised in the recent Freud Report
on welfare reform (Freud, 2007).
Strengthening institutional co-operation and co-ordination of services
Another issue that countries are facing to a different degree is the need for co-ordination
of services across different layers of government. For Spain, this is a relatively new situation
following the process of decentralisation of a whole range of responsibilities (Chapter 2).
Along these lines, the purpose of the Australian Commonwealth State Territory Disability
Agreements is to define the roles of the different government layers in the provision of
services for people with disability. Better co-operation across institutions is another way to
improve delivery of programmes and employment outcomes, but also to avoid unnecessary
shifting of people between different benefit schemes.
In this respect, the non-stop-shop approach in Australia (via Centrelink) and
especially the United Kingdom (via the new Jobcentre Plus, which resulted from merging
the employment service with the benefit institution) is important. Offering employment
and insurance services at one place helps to avoid that people move between different
types of income support payments and services, enables a better-streamlined and more
client-oriented service delivery and increases efficiency by pursuing common objectives.
Customer responses in the United Kingdom reveal that a majority of clients reported to be
satisfied with the new Jobcentre Plus service. Also the staff expressed very positive views
about the office environment, which may have helped them to provide a better service to
customers (Corkett et al., 2005).
In all countries, there is still a need to better involve the national health sector with
the employment service. Steps in this direction have already been taken in the United
Kingdom through the introduction of Condition Management Programmes and in
Luxembourg through closer co-operation between the national insurance authority, the
PES and the health-related rehabilitation service. In Spain, the social insurance authority
(INSS) is also improving its collaboration with the autonomous communities and hospitals
through bilateral agreements and special funds.
SICKNESS, DISABILITY AND WORK: BREAKING THE BARRIERS – VOL. 2 – ISBN 978-92-64-03815-8 – © OECD 2007 157
5. EMPLOYMENT POLICY – NEW CHALLENGES AND DIRECTIONS
B. Increasing responsibilities for individuals with health problems
If more financial resources are made available for employment integration of benefit
claimants, existing disability benefit recipients as well as those inactive people with
disability outside the benefit system, it becomes more reasonable to expect people with
remaining work capacity to make better use of them. Using some forms of mutual
responsibilities for some of these groups is therefore a reasonable step taken by an
increasing number of countries.
Are stricter responsibilities for people with disability the way forward?
A group that in many countries is no longer eligible for disability benefits are those
with partially-reduced work capacity. In Australia, Luxembourg and the United Kingdom
these people are covered by unemployment benefits and obliged to enrol in re-integration
measures to continue to receive their unemployment payments. Although they will be
subject to activity requirements, these will, in many cases, be less strict than for “standard”
unemployed people.
In Australia, requirements for jobseekers to look for work are clearly defined. People
with partial work capacity are required to look for suitable part-time work, consistent with
their assessed capacity, or to participate in appropriate services. However, the new
regulations introduced by the Welfare to Work reform are so far only directed towards new
claimants, while there are no changes for those people with partial work capacity already
on disability benefit.
The United Kingdom’s Pathways to Work process is another example of a first step
towards establishing a new balance between rights and responsibilities for disability
benefit claimants. However, at this stage the work-focused interviews, aiming for a
personal action plan, are the only mandatory element of the new process. Any action taken
in response to these interviews is still non-compulsory. A further strengthening of
responsibilities is currently being discussed, but the whole process is likely to remain
voluntary for longer-term claimants.
In Luxembourg, obligations are in place through the redeployment process with either
internal redeployment in the previous job, possibly with fewer hours or in another job with
the same employer, or external redeployment with another employer (Chapter 2). However,
actual job-search requirements and supports for those people classified as externally
re-deployable are very limited.
As mentioned earlier, activation support in Spain is limited and in particular so for people
with reduced work capacity. This can be explained, at least partly, by the use of partial
disability benefits for people with partially-reduced work capacity and by the weak obligations
for people to participate. Indeed, participation in available programmes is very low.
A critical issue is whether benefit sanctions should be introduced for those who refuse
to participate in activation programmes. On the one hand, participation requirements
cannot be enforced without sanctions. On the other hand, countries tend to shy away from
using sanctions, even if these are in place on paper. Enforcing sanctions on people with
health problems is often perceived as socially questionable. In addition, some clients with
health conditions may be more likely to get activated in voluntary measures to which they
have a right rather than in obligatory and enforced programmes. Sanctions, such as
withheld benefit payments, exist in Australia for those who are not fulfilling the
participation requirement for unemployment benefits. In the United Kingdom, similar
SICKNESS, DISABILITY AND WORK: BREAKING THE BARRIERS – VOL. 2 – ISBN 978-92-64-03815-8 – © OECD 2007158

5. EMPLOYMENT POLICY – NEW CHALLENGES AND DIRECTIONS
sanctions are in place for disability beneficiaries in Pathways areas who fail to attend their
work-focused interviews. In both countries, some forms of sanctions also exist for people
not showing up for the capacity assessments.
There is no obvious right or wrong in imposing stricter responsibilities and sanctions
on individuals. In any case, stricter eligibility for disability benefits should go hand-in-
hand with more and better targeted support for those people who no longer qualify for the
benefit. This is important in countries such as Australia and Luxembourg (for people with
partially-reduced work capacity) where the unemployment benefit scheme is open-ended.
However, even in countries with time-limited unemployment benefits, when people would
be taken off the benefit roll, they would instead transfer to social assistance or similar
income support. The likelihood that these people end up on a disability benefit in the long
run is high, which might be an argument for stricter requirements on individuals.
Very few people leave disability benefits rolls for employment
The lack of any requirements for people already on disability benefits is one of the
explanations for the very low share of recipients leaving these benefits for reasons other
than deaths and transfers to retirement (Table 5.7). Overall outflow rates vary from 4.5% in
Australia to 7% in the United Kingdom. These figures include flows not only into
employment but also into inactivity, unemployment or other social benefits. In all three
countries outflow rates fall with age, but less so in Australia. A positive sign in Luxembourg
and the United Kingdom is that outflow rates in the two younger age groups are fairly high:
two to three times higher than in the oldest age group. However, in terms of total numbers,
this has little impact especially in Luxembourg where recipiency rates are strongly skewed
towards the age group 50-64.
Six out of ten people in Australia and the United Kingdom who leave disability benefits
for other reasons than death and old-age retirement do so non-voluntarily (Table 5.8).
Among those who leave benefits, only 12% in Australia and 22% in the United Kingdom
move into jobs. These figures correspond to 0.6% of all recipients in Australia and to 1.6%
in the United Kingdom. Analysis of Australian administrative data from 1990 to 2002
concluded that, each year, less than 1% of men on disability benefits transferred into jobs
Table 5.7. Outflows from disability benefits are relatively low everywhereOutflows to other statuses than death or retirement in percentage of disability benefit recipients, 2005a
20-34 35-49 50-64 Total
Australia Total 6.7 5.5 3.6 4.6
Men 6.8 5.1 3.5 4.5
Women 6.5 6.0 3.8 4.9
Luxembourgb Total 11.4 12.7 5.3 6.1
Men 12.7 12.3 4.8 5.5
Women 9.7 13.4 6.4 7.2
United Kingdomc Total 15.4 10.2 4.5 7.3
Men 17.2 10.9 4.4 7.2
Women 13.2 9.4 4.7 7.4
a) Data for Luxembourg refer to 2004.
b) Information on the number of deaths among disability benefit recipients are unavailable. These were imputed byusing five-year age- and gender-specific death rates for Norwegian disability benefit recipients.
c) Data refer to the long-term incapacity benefit only.Source: OECD estimates based on data supplied by national authorities.
SICKNESS, DISABILITY AND WORK: BREAKING THE BARRIERS – VOL. 2 – ISBN 978-92-64-03815-8 – © OECD 2007 159

5. EMPLOYMENT POLICY – NEW CHALLENGES AND DIRECTIONS
(Cai et al., 2006). Hence, low outcomes into jobs appear to have been stable over time.
Leaving the disability benefit scheme in Australia (like in most countries) because of death
is much more likely than to re-engage with the labour force (Lattimore, 2007).
To raise the low outflow rates, disability beneficiaries could be reassessed more
systematically. But reassessing all disability beneficiaries would be expensive and time-
consuming and probably not very effective since many of them would not find their way
back to employment. For this reason, certain criteria such as severity of the disability, age
or time on benefits will have to be used in identifying cases for reassessment.15 For
example, the share of people in receipt of benefits for less than two years ranges from 15%
to 23% in the three countries for which such data is available (Table 5.9). If the duration is
extended to five years, the corresponding figure reaches around 40% in all three countries.
An additional approach would be to introduce a mandatory full reassessment after a few
years for all future inflows, especially those younger than, say, 55 years of age.16
If support and assistance is improved, outcomes might well be more significant, as was
shown by the voluntary Job Network Disability Support Pension Pilot in Australia (DEWR, 2005).
In Pathways areas in the United Kingdom, the share of benefit recipients leaving benefit rolls is
8 percentage points higher compared to the national average (Blyth, 2006).
However, if former beneficiaries do not return to work but move onto other benefits,
their mental health often deteriorates as do quality of life and overall well-being. Only
interventions which encourage and support beneficiaries to come off benefits and
Table 5.8. The majority of recipients in Australia and the United Kingdom leave disability benefits involuntarily
Reason for leaving disability benefits in percentage of outflows other than death and old-age retirement, 2005
Reason Share in total terminations Reason Share in total terminations
Australia United Kingdoma
Employment 12.5 Employment 22.2
Compliance Issues 44.1 Compliance Issues 8.7
Customer request 3.7 Customer request 11.1
Overseas 9.7 Closed certificate 15.9
Residency issues 4.6 Failed capacity test 39.6
Other 25.3 Other 2.4
Total 100.0 Total 100.0
a) Data refer to beneficiaries aged 18 to 64 on long-term incapacity benefits.Source: DEWR for Australia and DWP for the United Kingdom.
Table 5.9. Share of disability benefit recipients in receipt of a benefit for less than two years
In percentage of all persons receiving a disability pension, 2005
Australia Luxembourg United Kingdom
Share withineach age group
Share of the total
Share within each age group
Share of the total
Share within each age group
Share of the total
20-34 16.0 15.1 47.3 6.0 36.3 29.7
35-49 15.5 29.5 27.1 29.8 23.3 35.5
50-64 15.5 55.4 11.8 64.3 16.6 34.7
20-64 15.6 100.0 15.0 100.0 22.6 100.0
Source: DEWR for Australia, IGSS for Luxembourg, and DWP for the United Kingdom.
SICKNESS, DISABILITY AND WORK: BREAKING THE BARRIERS – VOL. 2 – ISBN 978-92-64-03815-8 – © OECD 2007160
5. EMPLOYMENT POLICY – NEW CHALLENGES AND DIRECTIONS
successfully assist them back into work are likely to improve health and well-being.
Interventions which simply force recipients off benefits are more likely to harm their
health and well-being (Waddell and Burton, 2006).
A similar situation appears for rejected benefit claimants. Because most of these
applicants have, at the time of rejection, lost their job, they need additional support. Unless
these people find a new job, they are likely to transfer to another scheme (such as
unemployment benefits or social welfare benefits) and possibly end up on disability
benefits in the long run.
C. New ways to better involve employers
Activation measures and stricter participation requirements on individuals are not
enough to raise employment rates of people with disability. There is also a need to
encourage employers to increase their hiring and retention of people with health problems
or disability.
Raising employers’ responsibilities
Experience-rating of employer premiums. Employers’ responsibility for assisting
workers and jobseekers with health problems can be raised by transferring more
responsibilities to employers for the sickness phase. In the United Kingdom, employers are
responsible for paying the costs of sickness benefits for six months and in Luxembourg for
three and a half months for white-collar workers (similar rules will soon be introduced for
blue-collar workers). In Australia and Spain, employers have few responsibilities during
this phase and periods are substantially shorter (Chapter 3).
Extending the length of continuous wage payment for employers in case of sickness is
one form of experience-rating. Another way is to raise contribution rates (or, in the case of
Australia, taxes) to public sickness or disability schemes for employers who generate a
higher incidence of sickness absence or disability benefit inflows. Such systems exist
already in many work injury schemes across the OECD, but are still rare in sickness and
disability insurance schemes.17 Obviously, it is not desirable to penalise employers who are
willing to engage workers with health problems, but to hold responsible those employers
who generate more sick workers and workers with disability than other employers in
similar circumstances, e.g. in the same sector, for the extra costs involved.
A disadvantage with experience-rated contributions is that, although it most certainly
improves health management in firms, it is likely to create adverse effects when it comes
to new hires of persons with disability or persons with fragile health. Experience-rated
systems should be carefully designed so to minimise this risk. This can be in the form of
exemptions for employers hiring a chronically sick person or a person with a disability, or
by combining experience-rating with a reduction in overall employers’ social security
contributions (or taxes), thereby rewarding employers investing in sickness management
and prevention.
Employment protection legislation. Strict employment protection legislation (EPL) is
another way of placing responsibilities on employers. In Australia and the United Kingdom,
EPL is more flexible than in most other OECD countries, while in Spain it is one of the
strictest (OECD, 2004).18 The effect of EPL, and its enforcement, on the employment of
workers with health problems is complex. In general, too strict EPL discourages layoffs,
thus increasing job security for incumbent employees, and reduces hiring when labour
SICKNESS, DISABILITY AND WORK: BREAKING THE BARRIERS – VOL. 2 – ISBN 978-92-64-03815-8 – © OECD 2007 161
5. EMPLOYMENT POLICY – NEW CHALLENGES AND DIRECTIONS
demand increases (OECD, 2006d). The strict EPL in Spain is also a reason why the country
has the highest incidence of temporary jobs in the OECD area.
Casual or temporary jobs may help workers with disability to find, and remain in,
employment and such be a bridge into more stable and regular jobs. The higher hiring rates
for workers with and without disability in Australia and Spain (Table 5.1) suggest that this
may be the case. Research also shows that 42% of all casual workers in Australia in 2002
held a non-casual job in 2004 (Melbourne Institute of Applied Economic and Social
Research, 2005). To what extent these figures vary by disability status is unknown.
However, among the four countries, employment rates of people with disability are lower
in Australia and Spain compared to Luxembourg and United Kingdom where temporary or
casual work is rarely used. Hence, casual or temporary employment contracts could also be
an additional barrier to stable employment for workers with disability.
Casual and temporary jobs also tend to reduce these workers’ chances to participate
in training. This was found for Australia in 2001: Among casual employees, 34% had
attended training in the previous 12 months compared with 58% of regular full-time
employees (OECD, 2005d). The National Strategy for VET 2004-2010 also stressed the
importance to continuously upgrade workers’ skills and to give workers in part-time,
casual contracts and occasional employment equal opportunities for learning (Australian
National Training Authority, 2003).
Since the 1980s, the main employment strategy of Spanish governments has been to
expand the legal scope for the use of fixed-term contracts and, in the 1990s, to legalise the
use of temporary work agencies (OECD, 2007b). These changes may have trapped some
workers with disability in short and successive temporary contracts and thus have
hindered the upgrading of human capital through work-related training, with negative
effects on career progression and productivity. Given the short average duration of
temporary contracts, incentives to invest in job-specific training are very limited for both
employers and temporary employees (OECD, 2007b).
In March 2006, Australia deregulated its labour market further by amending the
Workplace Relations Act. Employers with up to 100 workers are now exempt from unfair
dismissal laws and have more freedom in laying off workers (although they are still subject
to unlawful dismissal laws which do not allow them to dismiss an employee for
discriminatory reasons). This may increase incentives for employers to take on new staff
but also to reduce their use of casual workers.19 Statistics show that, in the past 12 months,
96% of all jobs created were full-time compared to around 60% in the two previous years
(Prime Minister of Australia, 2007). The new rules also introduced the right for workers,
who have not used all their ten annual sick leave days, to cash out their remaining days.
Employment quotas. Another way to raise the responsibility of employers is by using an
employment quota for people with disability, thereby forcing employers to hire a certain
share of people with disability. Luxembourg and Spain use such a system; in Luxembourg
the quota is set to 3% of the workforce and in Spain to 2%.20 However, in Luxembourg the
levy on companies not fulfilling their quota is low and in Spain the quota is not enforced.21
The employment effect of these schemes is therefore very limited.
Estimated overall employment quota fulfilment is 96% in Spain and 44% in
Luxembourg (Table 5.10).22 The higher fulfilment in Spain is partly explained by a lower
requirement for a legal disability certificate in combination with the lower employment
SICKNESS, DISABILITY AND WORK: BREAKING THE BARRIERS – VOL. 2 – ISBN 978-92-64-03815-8 – © OECD 2007162
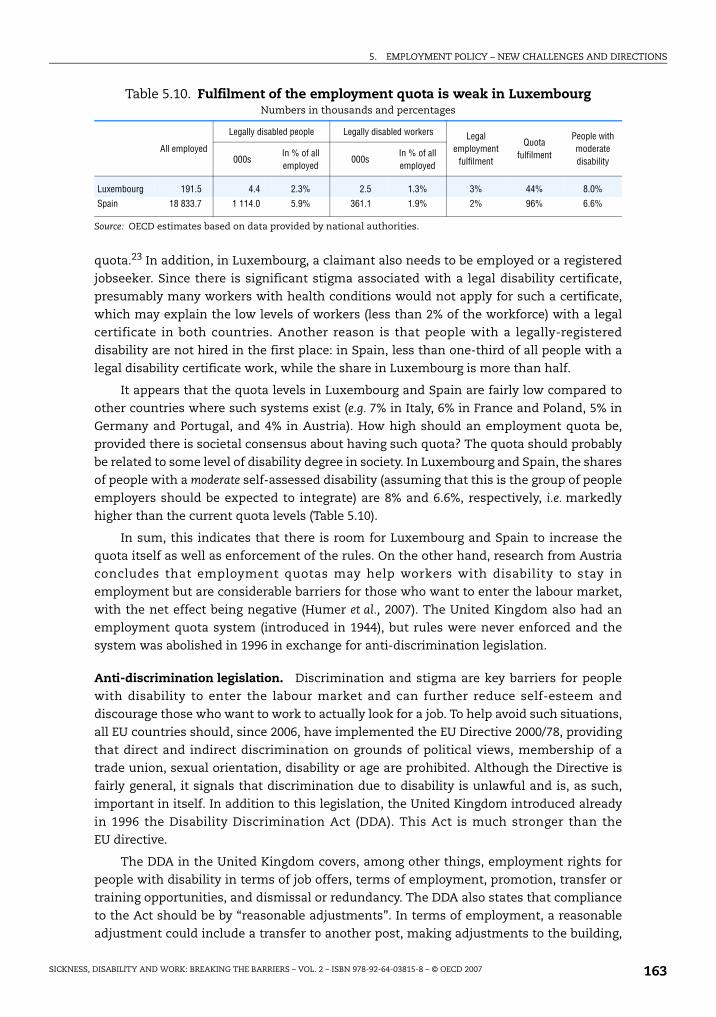
5. EMPLOYMENT POLICY – NEW CHALLENGES AND DIRECTIONS
quota.23 In addition, in Luxembourg, a claimant also needs to be employed or a registered
jobseeker. Since there is significant stigma associated with a legal disability certificate,
presumably many workers with health conditions would not apply for such a certificate,
which may explain the low levels of workers (less than 2% of the workforce) with a legal
certificate in both countries. Another reason is that people with a legally-registered
disability are not hired in the first place: in Spain, less than one-third of all people with a
legal disability certificate work, while the share in Luxembourg is more than half.
It appears that the quota levels in Luxembourg and Spain are fairly low compared to
other countries where such systems exist (e.g. 7% in Italy, 6% in France and Poland, 5% in
Germany and Portugal, and 4% in Austria). How high should an employment quota be,
provided there is societal consensus about having such quota? The quota should probably
be related to some level of disability degree in society. In Luxembourg and Spain, the shares
of people with a moderate self-assessed disability (assuming that this is the group of people
employers should be expected to integrate) are 8% and 6.6%, respectively, i.e. markedly
higher than the current quota levels (Table 5.10).
In sum, this indicates that there is room for Luxembourg and Spain to increase the
quota itself as well as enforcement of the rules. On the other hand, research from Austria
concludes that employment quotas may help workers with disability to stay in
employment but are considerable barriers for those who want to enter the labour market,
with the net effect being negative (Humer et al., 2007). The United Kingdom also had an
employment quota system (introduced in 1944), but rules were never enforced and the
system was abolished in 1996 in exchange for anti-discrimination legislation.
Anti-discrimination legislation. Discrimination and stigma are key barriers for people
with disability to enter the labour market and can further reduce self-esteem and
discourage those who want to work to actually look for a job. To help avoid such situations,
all EU countries should, since 2006, have implemented the EU Directive 2000/78, providing
that direct and indirect discrimination on grounds of political views, membership of a
trade union, sexual orientation, disability or age are prohibited. Although the Directive is
fairly general, it signals that discrimination due to disability is unlawful and is, as such,
important in itself. In addition to this legislation, the United Kingdom introduced already
in 1996 the Disability Discrimination Act (DDA). This Act is much stronger than the
EU directive.
The DDA in the United Kingdom covers, among other things, employment rights for
people with disability in terms of job offers, terms of employment, promotion, transfer or
training opportunities, and dismissal or redundancy. The DDA also states that compliance
to the Act should be by “reasonable adjustments”. In terms of employment, a reasonable
adjustment could include a transfer to another post, making adjustments to the building,
Table 5.10. Fulfilment of the employment quota is weak in LuxembourgNumbers in thousands and percentages
All employed
Legally disabled people Legally disabled workers Legal employment
fulfilment
Quota fulfilment
People with moderate disability000s
In % of all employed
000sIn % of all employed
Luxembourg 191.5 4.4 2.3% 2.5 1.3% 3% 44% 8.0%
Spain 18 833.7 1 114.0 5.9% 361.1 1.9% 2% 96% 6.6%
Source: OECD estimates based on data provided by national authorities.
SICKNESS, DISABILITY AND WORK: BREAKING THE BARRIERS – VOL. 2 – ISBN 978-92-64-03815-8 – © OECD 2007 163

5. EMPLOYMENT POLICY – NEW CHALLENGES AND DIRECTIONS
having a possibility to work flexible hours, providing training, or modifying work
equipment. However, there is no clear distinction of what a reasonable adjustment is.
Instead, the Disability Rights Commission (DRC) provides detailed guidance and advice for
persons with disability and their employers. The absence of binding directions makes it
very complicated to judge what is reasonable or not, especially in cases of mental illness.
According to the DRC in the United Kingdom, the DDA has had a positive impact on
employers’ behaviour. In larger enterprises recruitment procedures have changed in
favour of people with disability. However, the extension of DDA to small and medium
sized enterprises in 2004 has not yet resulted in any major changes. One explanation
for this is the lack of information regarding this legislation. For this reason, DRC
undertook an information campaign in 2004. Overall, DDA appears to have had a
positive effect on employment rates of people with disability. Still, more could be done:
while 90% of employers have a policy to support race equality and 74% to support
gender equality, only 43% of them have a policy to support disability equality (The
Employers’ Forum, 2005).
In Australia, anti-discrimination provisions in relation to disability are regulated in the
Commonwealth Disability Discrimination Act (CDDA) from 1992. The CDDA provides a
national framework and covers also Australian government departments and agencies.
The Act provides that a person with disability has a right to the same employment
opportunities as a person without disability and people with disability are protected
against discrimination in all aspects of the recruitment process, in the terms and
conditions of employment, in the promotion process, and in dismissal or retrenchment. In
addition, all states and territories have some form of anti-discrimination legislation, which
in most areas complement Commonwealth legislation.
In a report by the Productivity Commission (2004), the effectiveness of the CDDA was
reviewed. The review concluded that, overall, the CDDA had been reasonably effective in
reducing discrimination. However, not all objectives had been achieved: in particular,
people with mental disability had been excluded. Moreover, success has been greater in
terms of access to public transport and education compared to improvements in
employment opportunities. Employment rates for people with disability fell between 1998
and 2003, while these increased for people without disability. One possible reason for this
may be that the CDDA does not include the obligation to make reasonable adjustments (like
in the United Kingdom).
Similar to the employment quota system, evidence on employment effects of anti-
discrimination legislation on people with disability is inconclusive. Empirically it appears
that employment rates of people with disability increased after the introduction of the
DDA in the United Kingdom, but causalities are difficult to establish. Evidence for the
United States points in the opposite direction; after the introduction of the Americans with
disability Act in 1990, until 1995 employment rates of men with disability dropped by more
than 7 percentage points despite a very strong labour market (DeLeire, 2000). However, it is
generally concluded that this drop was not caused by the new legislation but rather by
earlier changes in the benefit system which have eased access to disability benefits
(Burkhauser and Stapleton, 2004).
SICKNESS, DISABILITY AND WORK: BREAKING THE BARRIERS – VOL. 2 – ISBN 978-92-64-03815-8 – © OECD 2007164

5. EMPLOYMENT POLICY – NEW CHALLENGES AND DIRECTIONS
Providing better support to employers
Financial supports available for employers. Along with these responsibilities for
employers, it is also important to consider measures that encourage hiring and retention
of workers with health problems through, for example, the use of subsidised work,
accommodation schemes and personalised support from either the PES or the social
insurance institution. All four countries have some form of support to employers.
Australia has two main schemes that encourage employers to hire people with
disability: the Workplace Modifications Scheme and the Wage Subsidy Scheme. The
Workplace Modifications Scheme reimburses employers for the costs involved in
modifying the workplace or purchasing special equipment to allow workers with disability
to work, e.g. by building a wheelchair ramp. To qualify for assistance, companies must
employ the person for at least eight hours a week in a job that is expected to last for at least
three months. Between 1998 and 2002, the average amount paid per worker was AUD 2 200
(Productivity Commission, 2004). The Wage Subsidy Scheme provides incentives for
employers to hire workers with disability under normal labour market conditions and is
available to jobseekers participating in DEN and VR services. These subsidies are paid for a
maximum period of 13 weeks and the maximum subsidy is AUD 1 500 per person.24
In Luxembourg, an employer who hires or retains a legally-disabled worker may receive a
wage subsidy of up to 100% of the salary (usually 40%) and a 10% reduction of social security
contributions. The subsidy is received if the employer can prove that the worker with a
disability has a reduced productivity. In this case, an allowance can also be granted for special
equipment or accommodation of the workplace (this happened in only 13 cases in 2005). The
employer may also be reimbursed of the additional six vacation days for which workers with
legally recognised disability are entitled. Several private companies do, however, indicate that
– although they are informed about wage subsidies and other financial privileges for
employing workers with disability – these incentives are not important for their considerations
to hire such a worker. The PES is also using wage subsidies. These are temporary, but usually
last for three years or longer. To prolong these subsidies, the employer has to re-apply and
prove that the productivity of the person is still reduced.
In Spain, subsidies to employers hiring a worker with a legally-certified disability can
take different forms, including reduced social security contributions, subsidies to
accommodate the workplace, or annual lump-sum payments varying with age, gender and
the severity of the disability. The government also promotes the transfer of temporary
employment contracts into permanent ones for workers with disability. Work
accommodation subsidies amount to EUR 900 and lump-sum payments (which are paid
during the entire duration of the work contract) range from EUR 3 500 per year for a men
younger than 45 hired on a temporary contract to EUR 6 300 per year for a person over age
45 with a severe disability and hired on a permanent contract. In addition, there are tax
advantages for employers such as the corporate tax deduction of EUR 6 000 per year for
each hired person.
Contrary to the other countries, the United Kingdom has no large-scale employment
subsidies available to employers who hire or retain workers with reduced productivity
(except for Workstep, see above). Some smaller wage-subsidy schemes exist on local levels,
but these are not specifically targeted at persons with disability.
SICKNESS, DISABILITY AND WORK: BREAKING THE BARRIERS – VOL. 2 – ISBN 978-92-64-03815-8 – © OECD 2007 165
5. EMPLOYMENT POLICY – NEW CHALLENGES AND DIRECTIONS
Free and easy access to information. Equally important is easily accessible information
for employers about what supports are available and about what an employer can do to
help a sick worker or to hire a jobseeker with reduced work capacity. Often employers
complain about lacking information on this, but also about very complex procedures for
applying to subsidies and supports.
A good-practice example in this regard is Australia’s JobAccess initiative. JobAccess is
a one-stop information shop for all matters relating to the employment and retention of
people with disability, and addresses employers but also jobseekers with disability,
co-workers and employment service providers. It includes a comprehensive website
(www.jobaccess.gov.au), a free telephone advice service (handled by trained JobAccess
advisers), an online workplace adjustment tool giving a range of practical ideas and
solutions for workplace modifications and adjustments, and an online claims process for
the payment of workplace modifications.
Spain also has an increasing focus on workplace adaptation services, set up in 1997
under the umbrella of the National Centre for Personal Autonomy and Technical Aids
(CEAPAT). CEAPAT is linked to IMSERSO and operates at the level of the autonomous
regions. Multi-professional teams consist of experts in such fields as architecture,
engineering, psychology, occupational therapy, computing and management. Services
offered by CEAPAT include assessment and advice for workplace adaptations, production
and adaptation of technical tools, training activities and information and advice on
universal accessibility. CEAPAT also operates a comprehensive website on assistive
technology and accessibility (www.ceapat.org).
In the United Kingdom, practical advice and support to help people with disability
enter or stay in employment is provided by the Access to Work scheme (see above). What has
been found to be of particular importance to motivate employers to hire workers with
disability, is information based on experience from other employers. This is one of the aims
of the United Kingdom’s Employers’ Forum on Disability, a charity organisation funded by
voluntary contributions from its members (mainly large private companies). The Forum
advises employers through regular exchange and conferences, produces relevant
publications, such as a guidebook on sickness management, and benchmarks its members
other members.
In Australia, the (still much smaller) Employers Network on Disability has a similar
role, by helping small and medium-sized enterprises to improve their record in hiring or
retaining workers with disability. The main tool of the network is the promotion of good
practice. One of the network’s founding members is Benbro Electronics, a small company
in the electronics business with very dedicated leadership. 40% of their workers have a
disability, which is why Benbro Electronics has repeatedly won employers’ awards. The key
factor is that the management is convinced about the business case of employing workers
with disability (Box 5.4). This is one of the greatest challenges for the future: especially for
smaller companies, it is often difficult to make a business case based on hard evidence,
although anecdotal evidence suggests that workers with disability tend to be sick less
often, a extremely reliable and have a high retention rate. According to the management of
Benbro Electronics, the key challenge is to convince employers to hire one worker with
disability: once employers have the experience, i.e. once “they got over the line”, they are
far more likely to hire another worker with disability.
SICKNESS, DISABILITY AND WORK: BREAKING THE BARRIERS – VOL. 2 – ISBN 978-92-64-03815-8 – © OECD 2007166

5. EMPLOYMENT POLICY – NEW CHALLENGES AND DIRECTIONS
5.4. Future policy directionsIn all four countries, employment rates of people with disability are far below those of
persons without disability. In addition, their unemployment rates are almost twice as high.
This chapter has tried to shed some light on how this situation can be improved by
changing the role of employers, public authorities as well as workers and jobseekers with
disability themselves. This section outlines some of the more important policy directions
resulting from the analysis.
Improve assistance to individuals to seek and find work
People with health problems who can and want to work, but are currently inactive,
should as far as possible be supported and encouraged by the public authorities to do so.
Currently, this is not sufficiently the case in the four countries. Explanations for this
include the predominant focus on new or soon-to-be benefit recipients as well as limited
and unsuitable services. Employment services and support should be equally accessible for
all persons assessed with reasonable employment chances.
To reach sustainable job outcomes from this support, employment programmes need
to be better tailored to meet current labour market demands on the one hand and the
needs of the persons who participate in these programmes on the other. Preferably,
participants should have an individual action plan that details the steps that have been
taken and those that will be taken to improve chances of finding employment. Such action
plan could, for example, be developed together with the jobseeker’s personal adviser (like
in the United Kingdom).
This requires not only changes of the current approach to deal with jobseekers, but in
some cases also to develop new and better employment programmes. Unfortunately, little
is known currently about what works and for whom and, in particular, about the cost-
efficiency of existing employment programmes. In this respect, a first step countries need
to take is to introduce, or further develop in the case of the United Kingdom, their methods
to monitor implementations and outcomes of their employment-activation strategies – in
particular when the responsibility is decentralised to regional offices. The innovative
Box 5.4. Benbro Electronics: A recurrent best-practice price winnerin Australia
Benbro Electronics is a small company with 20 workers, eight of whom with intellectualdisability. The company won various national and state employers’ awards, most recentlythe Prime Minister’s disability employer of the year award 2006. Tasks of workers withdisability include, for instance, assembling electronic equipment (which is then sold to theMinistry of Defence) – this is a very repetitive work perfectly suited for their intellectuallychallenged. Workers.
Benbro refuses any public subsidies for hiring workers with disability so as to avoidcreating two types of workers, normal workers on one end and subsidised workers on theother, thereby avoiding to devaluate the latter group. Salaries are slightly above marketlevel, with no difference between workers with and without disability. They do not monitorabsence rates, but their perception is that there are no differences between differentgroups of workers. The average tenure of their workers is 10.7 years, compared to anationwide average in comparable businesses of hardly more than two years.
SICKNESS, DISABILITY AND WORK: BREAKING THE BARRIERS – VOL. 2 – ISBN 978-92-64-03815-8 – © OECD 2007 167

5. EMPLOYMENT POLICY – NEW CHALLENGES AND DIRECTIONS
outcome-based funding of services in Australia and the United Kingdom is a step in the
right direction which should be further fine-tuned.
Improve services and incentives for employers to help them retain and hire workers with disability
Employers have a key role to play when it comes to raising employment rates of people
with disability. Employers should be encouraged to hire these workers. First and foremost
this requires closer co-operation of caseworkers and employers and better matching of
workers skills and the demands of the labour market. In addition, better financial incentives
for employers may be needed that outweigh any potential (be it actual or perceived) hiring
costs. This should in particular include targeted work-accommodation programmes.
Employers should also be encouraged to retain workers that develop a health problem.
To do so they need appropriate support and assistance at an early stage by, for example,
occupational health therapists from the social insurance office. This would avoid that
many workers are left alone with their health problems that later develop into long-term
benefit recipiency. What is important for employers to improve their hiring and retention
records for workers with health problems is free and easily accessible one-stop
information about existing schemes, as is provided by Australia’s Job Access initiative.
Raise involvement and responsibilities among individuals and employers
Improved and extended employment support to people with health problems may
have little impact on employment rates unless these people actively look for work. In
particular, this is the case if support is extended to certain groups of existing beneficiaries
who are currently outside the focus of employment assistance. The introduction of new
and better-tailored employment programmes, such as vocational rehabilitation, should
therefore go hand-in-hand with strong financial incentives to work and stricter
requirements on individuals to participate in such programmes.
Again, this may only be helpful if employers have an interest to increase their efforts
to hire and retain workers with health problems. Support and assistance to employers
should therefore be complemented with certain obligations. Employers need to take a
larger responsibility for monitoring sickness absences of their employees, to seek advice
from occupational health specialists, and to inform national insurance offices at an early
stage to help prevent that people fall out of the labour market. Such prevention can, for
example, include the development of a rehabilitation plan jointly with the employee, use
of flexible working hours, or new work tasks. For such approach to be effective, proper
financial incentives have to be in place.
Improve co-operation between stakeholders
Better co-operation and co-ordination of policy and services across different public
authorities is another way to improve delivery of programmes and employment outcomes.
It is also a way to avoid that people fall between chairs. In this respect, the non-stop-shop
approaches in Australia and the United Kingdom are good examples. However, this alone
does not do away with large regional variation in take-up rates of disability benefits or
employment outcomes from support programmes. Hence, policy at a regional level has to
be better implemented and monitored so as to reduce local discretion in the decision
process. Finally, in all countries, there is still a need to better involve the national health
sector with the employment service.
SICKNESS, DISABILITY AND WORK: BREAKING THE BARRIERS – VOL. 2 – ISBN 978-92-64-03815-8 – © OECD 2007168
5. EMPLOYMENT POLICY – NEW CHALLENGES AND DIRECTIONS
Notes
1. Firms tend to offer part-time job opportunities to workers without rather than those withdisability. In the United Kingdom, 27% of people with disability work part-time, but only 18% ofemployers with part-time employees hire people with disability in such positions. In Spain, 10% ofall employees with disability work part-time, which is 2.5 times higher than the share of employershiring workers with disability (EFILWC, 2007b).
2. Casual workers in Australia are employees who are not entitled to paid holiday or sick leave, have noexpectation of ongoing employment and have a new contract of employment for each engagementwith their employer. They receive a higher rate of pay (casual loading) to compensate for a lack of jobsecurity. Due to measurement problems, the Australian Bureau of Statistics defines casualemployees simply as those employees who do not receive paid sick or holiday leave (ABS, 1999).
3. In Australia, for instance, between 1990 and 2000, the net loss of low-skilled full-time permanentjobs amounted to 200 000, while the net increase of full-time permanent professional jobs was387 000 (ACOSS, 2005).
4. The United Kingdom’s Pathways to Work is a process to better assist people with disability back towork. For a detailed description of this process see DWP (2002).
5. For a more detailed discussion of pros and cons of sheltered employment see OECD (2006b).
6. This is a crude and illustrative comparison, for two reasons. First, data refer to current programmeparticipants in Australia and programme commencements in the United Kingdom. Secondly,neither are programme starts a subset of benefit inflows nor are programme participants a subsetof current benefit recipients. While people are more likely to join programmes in the early stagesof a benefit claim, there are starters who have been on benefit for years; nothing is known aboutthe share of the latter, and how this differs between the countries.
7. For comparison, figures were 1% of GDP in Norway, 0.75% in Switzerland and 0.4% in Poland. Thecorresponding unemployment rates were around 4% in Norway and Switzerland, and 20% in Poland.
8. No data are available for Spain because of mainstreaming of employment schemes and the lack ofa possibility to identify people with disability on mainstream programmes.
9. For comparison, corresponding per capita spending figures on activations measures in Switzerlandare around 13 000 USD PPP, while spending in Norway is around 4 000 USD PPP (OECD, 2006b).
10. Initial evaluation results for the United Kingdom are so far based on qualitative research andshows that personal advisers welcomed this extension of the Pathways process but that, asexpected, existing customers require significantly greater input than new customers (Barnes andHudson, 2006).
11. The number of Workstep participants in the United Kingdom is around one-tenth of the numberof participants in NDDP.
12. Outcome-based funding in Australia was introduced for the Job Network in 1998, for the DisabilityEmployment Network in July 2005, and for Vocational Rehabilitation services in July 2006.
13. The information given in this paragraph applies only to Australia’s Job Network. DEN and VRproviders receive a monthly service fee for each client. Therefore, unless a person moves intoemployment very quickly after commencing with the service, the service fee received over timewill amount to more than the outcome fees. The largest single payment for DEN and VR services,however, is the 26 week employment outcome payment. Moreover, contrary to Job Network,outcome fees are not dependant on how jobseekers have been referred to employment services.
14. One effect of these changes in Australia appears to be that the system has becomeadministratively more costly and cumbersome for Job Network providers. Some providersindicated that 30-40% of their working day was spent on trying to achieve a high star-rating,i.e. finding jobs for a “perfect mix” of immigrants, people with disability, older and other jobseekersalong with the filling out of the new administrative forms required by Centrelink (OECD, 2005c).
15. Changes in this regard are less needed in the United Kingdom, where part of the output of eachdisability assessment is a recommendation on when a person’s status should be reviewed.
16. This is the approach taken in Poland, where benefits are only granted temporarily and, uponexpiration of a temporary benefit (usually after three years), payments are terminated, individualshave to re-apply and their case will be fully re-examined. Together with a changed assessmentprocess, this has reduced the number of disability benefits substantially in all age groups.However, many have transferred into other benefit schemes rather than moving into work(OECD, 2006b).
SICKNESS, DISABILITY AND WORK: BREAKING THE BARRIERS – VOL. 2 – ISBN 978-92-64-03815-8 – © OECD 2007 169

5. EMPLOYMENT POLICY – NEW CHALLENGES AND DIRECTIONS
17. In the Netherlands, employers are responsible for paying the costs of sickness benefits for as longas two years. They are also paying for most of the costs of the first five years of disability benefitreceipt of their former workers. Experience-rating has recently been introduced in the Swisssecond-pillar disability insurance as well as in the private sickness benefit insurance(OECD, 2006b). Experience-rating also exist in the United States where employers’ contributions tothe unemployment insurance system depend on their firing behaviour.
18. Information for Luxembourg is not available.
19. The reason is that the old unfair dismissal laws did not apply to the majority of casual workers.
20. The reservation quota in Spain applies to public and private companies with 50 or more employees(in the entire company, not just the single office). In exceptional cases, companies may be partiallyor totally exempt from the quota provided that some of the substitute measures are appliedinstead. Substitute measures can include contracts with special employment centres or a self-employed worker with disability as well as donations to associations engaged in disabilityemployment. Grounds for exemption include issues of productive, organisational, technical orfinancial nature on the one hand, and the inability of the PES to fill a vacancy with a qualifiedworker with disability on the other.
21. More generally, in Spain, it appears that, if a labour law is not included or referred to in thecollective agreements, it is rarely enforced.
22. In 1999, in Spain, the estimated number of private companies that fulfilled the quota was 25% andin the public sector 30%. In France, Austria and Germany, the corresponding fulfillment ratesranged between 57% and 67% (OECD, 2003).
23. Such certificate requires that people have an incapacity level of at least 30% in Luxembourg and25% in Spain (see Chapter 3 for a discussion of the assessment process of legal disability).
24. In Australia, wage subsidies are also available through the Job Seeker Account, which is availableto people, such as people with disability, who are receiving intensive support through Job Network.
SICKNESS, DISABILITY AND WORK: BREAKING THE BARRIERS – VOL. 2 – ISBN 978-92-64-03815-8 – © OECD 2007170

ISBN 978-92-64-03815-8
Sickness, Disability and Work
Breaking the Barriers – Vol. 2
© OECD 2007
Bibliography
ABS – Australian Bureau of Statistics (1999), Labour Force, Australia, Cat. No. 6203.0.
ABS (2006), “Casual Employees, No. 1301.0 – Year Book Australia”, Canberra.
ACOSS – Australian Council of Social Service (2005), “Ten Myths and Facts about the Disability SupportPension (DSP)”, Info 362.
Adam, S., C. Emmerson, C. Frayne and A. Goodman (2006), “Early Quantitative Evidence on the Impactof the Pathways to Work Pilots”, Research Report No. 354, Department for Work and Pensions,London.
ADEM (2006), “Bulletin luxembourgeois de l’emploi”, No. 08, August.
Australian Government (2005), The Welfare to Work Reforms Overview.
Australian Institute of Health and Welfare (2005), Australia’s Welfare 2005, Canberra.
Australian National Training Authority (2003), Shaping our Future: Australia’s National Strategy forVET 2004-2010, Brisbane.
Bacon, J. (2002), “Moving between Sickness and Unemployment”, Social Research Branch, Departmentfor Work and Pensions, London.
Bambra, C., M. Whitehead and V. Hamilton (2005), “Does ‘Welfare-to-work’ Work? A systematic reviewof the effectiveness of the UK’s ‘welfare-to-work’ programmes for people with a disability orchronic illness”, Social Science and Medicine, Vol. 60(9), pp. 1905-1918.
Barnes, H. and M. Hudson (2006), “Pathways to Work – Extension to Some existing customers: earlyfindings from qualitative research”, Research Report No. 323, Department for Work and Pensions,London.
BBC News (2006), “Mental Illness Now ‘last taboo’”, http://news.bbc.co.uk/1/hi/health/6038570.stm.
Bewley, H., R. Dorsett and G. Haile (2007), “The Impact of Pathways to Work”, Research Report No. 435,Department for Work and Pensions, London.
Blackman, S. (2006), “Financial Incentives to Work for the IB Caseload and the Take-up of the DisabilityElement of the Working Tax Credit”, mimeo, Department for Work and Pensions, London.
Blanco, A. (2000), “The Decision of Early Retirement in Spain”, mimeo, Universidad del País Vasco,Bilbao.
Blyth, B. (2006), “Incapacity Benefit Reforms – Pathways to Work Pilots Performance and Analysis”,Working Paper No. 26, Department for Work and Pensions, London.
British Occupational Health Research Foundation (2005), Workplace Interventions for People with CommonMental Health Problems: Evidence Review and Recommendations, London.
Burchardt, T. (2003), “Employment Retention Following Onset of Sickness or Disability: Evidence fromthe Labour Force Survey Longitudinal Data”, Department for Work and Pensions In-House Report,London.
Burchardt, T. (2005), The Education and Employment of Disabled Young People: Frustrated Ambition, LondonSchool of Economics, London.
Burkhauser, R. and D. Stapleton (2004), “The Decline in the Employment Rate for People withDisabilities: bad data, bad health, or bad policy”, Journal of Vocational Rehabilitation, Vol. 20, No. 3,pp. 185-201.
Cai L. (2004), “An Analysis of Durations on the Disability Support Pension (DSP) Program”, WorkingPaper No. 8/04, Melbourne Institute of Applied Economic and Social Research.
171

Cai, L., H. Vu and R. Wilkins (2006), “Disability Support Pension Recipients: Who Gets Off (and Stays Off)Payments?”, Working Paper No. 18/06, Melbourne Institute of Applied Economic and SocialResearch.
CBI – Confederation of British Industry (2006), “Absence Minded: Absence and Labour Turnover 2006”,London.
Coleman, N. and L. Kennedy (2004), “Destination of Benefit Leavers 2004”, Research Report No. 244 onbehalf of the Department for Work and Pensions, London.
Confédération syndicale indépendante du Luxembourg (2006), Enquête sur le stress professionnel –rapport complet, Stimulus/Capital-Santé, Paris.
Corden, A. and K. Nice (2006), “Pathways to Work from Incapacity Benefits: A Study of Experience andUse of Return to Work Credit”, Research Report No. 353, Department for Work and Pensions,London.
Corkett, J., S. Bennett, J. Stafford, M. Frogner and K. Shrapnell (2005), “Jobcentre Plus Evaluation:Summary of Evidence”, Research Report No. 252, Department for Work and Pensions, London.
Council of Australian Government (2006), National Action Plan on Mental Health: 2006-2011, Canberra.
DeLeire, T. (2000), “The Wage and Employment Effects of the Americans with Disabilities Act”, Journalof Human Resources, Vol. 35, No. 4, pp. 693-715.
DEWR – Department of Employment and Workplace Relations (2004), Annual Report 2003-04, Canberra.
DEWR (2005), “Job Network Disability Support Pension Pilot: Progress Report”, Canberra.
DEWR (2006), Characteristics of Mobility Allowance Recipients – June 2005, Canberra.
Dockery, A.M. (2005), “Mental Health and Labour Force Status in Australia”, Curtin Business School,Curtin University of Technology, Perth.
DWP – Department for Work and Pensions (2002), Pathways to Work: Helping People into Employment,London.
DWP (2006), A New Deal for Welfare: Empowering People to Work, Green Paper presented to Parliament inJanuary 2006, London.
EFILWC – European Foundation for the Improvement of Living and Working Conditions (2007a), FourthEuropean Working Conditions Survey, Dublin.
EFILWC (2007b), Part-time Work in European Companies: Establishment Survey on Working Time 2004-2005,Dublin.
FaCS – Department of Family and Community Services (2003), “Improving Employment Opportunitiesfor People with a Disability: Report of the Review of the Employer Incentives Strategy”, Canberra.
FaCS (2004), “Survey of New Disability Support Pension Customers”, Canberra.
Förster, M.F. and M. Mira d’Ercole (2005), “Income Distribution and Poverty in OECD Countries in theSecond Half of the 1990s”, OECD Social, Employment and Migration Working Paper, No. 22, OECD,Paris.
Freud, D. (2007), “Reducing Dependency, Increasing Opportunity: options for the future of welfare towork”, An independent report, Department for Work and Pensions, London.
Grubb, D. (2006), “Australia’s Quasi-market Delivery of Case Management”, Paper presented at the ISSAworkshop on Unemployment Insurance and Employment Maintenance, 10-11 April, Brussels.
Grubb, D. (2007), “Audit du service public de l’emploi au Luxembourg”, OECD Social, Employment andMigration Working Papers, OECD, Paris.
Hallis (2003), “The Hallis 2003-2004 Turnover and Absenteeism Survey”, Melbourne.
Harding, A., Q.Ng Vu and R. Percival (2005), “The Distributional Impact of the Welfare-to-Work ReformsUpon Australians with Disabilities”, NATSEM Working Paper, Canberra.
Hartmann-Hirsch, C. (2006), “L’incapacité de travail. Une mesure de maintien à l’emploi aux effetspervers ?”, Population et Emploi, No. 19, CEPS/INSTEAD, Luxembourg.
Health and Safety Executive (2006), Tackling Stress: the Management Standards Approach, London.
House of Commons (2006), “Work and Pensions – Third Report”, London.
SICKNESS, DISABILITY AND WORK: BREAKING THE BARRIERS – VOL. 2 – ISBN 978-92-64-03815-8 – © OECD 2007172

Human Rights and Equal Opportunity Commission (2006), “National Enquiry into Disability andEmployment”, Final Report.
Humer, B., J.P. Wuellrich and J. Zweimüller (2007), “Integrating Severely Disabled Individuals into theLabour Market: The Austrian Case”, IZA Discussion Paper No. 2649, Bonn.
Jones, A. and O. O’Donnell (1995), “Equivalence Scales and the Costs of Disability”, Journal of PublicEconomics, Vol. 56, pp. 273-289.
Knight, T., S. Dickens, M. Mitchell and K. Woodfield (2005), “Incapacity Benefit reforms – The PersonalAdviser role and practices: Stage Two”, Research Report No. 278, Department for Work andPensions, London.
Lattimore, R. (2007), Men Not at Work: An Analysis of Men outside the Labour Force, ProductivityCommission Staff Working Paper, Canberra.
Layard, R. (2004), “Mental Health: Britain’s Biggest Social Problem?”, Paper prepared for a seminarhosted by the DWP Strategy Unit, London.
Lewis, J., A. Corden, L. Dillon, K. Hill, K. Kellard, R. Sainsbury and P. Thornton (2005), “New Deal forDisabled People: An In-depth Study of Job Broker Service Delivery”, Research Report No. 246,Department for Work and Pensions, London.
Martin, J. and D. Grubb (2001), “What Works and for Whom: a Review of OECD Countries’ Experienceswith Active Labour Market Policies”, Working Paper No. 14, IFAU, Stockholm.
Meager, N., P. Bates, S. Dench, S. Honey and M. Williams (1998), Employment of Disabled People: Assessingthe Extent of Participation, Research Report No. 69, Department for Education and Employment,London.
Meah, A. and P. Thornton (2005), “Desirable Outcomes of WORKSTEP: User and Provider Views”,Research Report No. 279, Department for Work and Pensions, London.
Melbourne Institute of Applied Economic and Social Research (2005), “Hilda Survey Annual Report”.
OECD (1999), Economic Survey: Belgium/Luxembourg, OECD, Paris.
OECD (2001), Innovations in Labour Market Policies: The Australian Way, OECD, Paris.
OECD (2003), Transforming Disability into Ability: Policies to Promote Work and Income Security for DisabledPeople, OECD, Paris.
OECD (2004a), Quarterly National Accounts, Vol. 4-2003, OECD, Paris.
OECD (2004), Employment Outlook, OECD, Paris.
OECD (2005a), Economic Survey: Spain, OECD, Paris.
OECD (2005b), Benefits and Wages 2004, OECD, Paris.
OECD (2005c), Ageing and Employment Policies: Australia, OECD, Paris.
OECD (2006a), Economic Outlook No. 80, OECD, Paris, December.
OECD (2006b), Sickness, Disability and Work: Breaking the Barriers: Norway, Poland and Switzerland, Vol. 1,OECD, Paris.
OECD (2006c), Live Longer, Work Longer, OECD, Paris.
OECD (2006d), Employment Outlook, OECD, Paris.
OECD (2007a), Taxing Wages 2005/2006: 2006 edition, OECD, Paris.
OECD (2007b), Jobs for Youth: Spain, Paris.
Orr, L., S. Bell and K. Lam (2007), “Long-term Impacts of the New Deal for Disabled People”, ResearchReport No. 432, Department for Work and Pensions, London.
Pires, C., A. Kazimirski, A. Shaw, R. Sainsbury and A. Meah (2006), “New Deal for Disabled People:Eligible Population Survey, Wave Three”, Research Report No. 324, Department for Work andPensions, London.
Prime Minister of Australia (2007), www.pm.gov.au/media/Interview/2007/Interview24247.cfm.
Productivity Commission (2004), Review of the Disability Discrimination Act 199, Inquiry Report, ReportNo. 30, Australian Government.
SICKNESS, DISABILITY AND WORK: BREAKING THE BARRIERS – VOL. 2 – ISBN 978-92-64-03815-8 – © OECD 2007 173

Purdon, S., N. Stratford, R. Taylor, L. Natarajan, S. Bell and D. Wittenburg (2006), “Impacts of the JobRetention and Rehabilitation Pilot”, Research Report No. 342, Department for Work and Pensions,London.
Sainsbury, R. and J. Davidson (2006), “Routes onto incapacity benefits: Findings from QualitativeResearch”, Research Report No. 350, Department for Work and Pensions. London.
Sawney, P. and J. Challenor (eds) (2003), “Poor Communication Between Health Professionals is aBarrier to Rehabilitation”, Occupational Medicine, Vol. 53, pp. 246-248.
Stafford, B. and colleagues (2006), “New Deal for Disabled People: Second Synthesis Report – interimfindings from the evaluation”, Research Report No. 377, Department for Work and Pensions,London.
The Employers’ Forum (2005), The Disability Standard 2005: Benchmark Report, London.
Trade Union Congress (2005), “Countering an Urban Legend: Sicknote Britain?”, Economic and SocialAffairs, London.
Waddell, G. and A.K. Burton (2006), “Is Work Good for your Health and Well-being?”, The StationeryOffice, commissioned by the Department for Work and Pensions, London, September.
Wagener, R. (2003), “The New Benefit Strategy being Implemented in Luxembourg”, in B. Marin,C. Prinz and M. Queisser (eds.), Transforming Disability Welfare Policies, Ashgate, Aldershot.
Work Directions (2006), “Buying Quality Performance: Procuring Effective Employment Services”,United Kingdom.
Zaidi, A. and T. Burchardt (2005), “Comparing Incomes when Needs Differ”, Review of Income and Wealth,Vol. 51-1, pp. 89-114.
SICKNESS, DISABILITY AND WORK: BREAKING THE BARRIERS – VOL. 2 – ISBN 978-92-64-03815-8 – © OECD 2007174

LIST OF ACRONYMS
List of Acronyms
ABS Australian Bureau of Statistics
ACOSS Australian Council of Social Services
AETR Average Effective Tax Rate
ALMP Active Labour Market Programmes
AMC Administration of Medical Control (Luxembourg)
AUD Australian Dollar
AW Average Worker
CBI Confederation of British Industry
CEAPAT Natinal Centre for Personal Autonomy and Technical Aids (Spain)
CMP Condition Management Programme (UK)
CRS Commonwealth Rehabilitation Service (Australia)
DB Disability Benefit
DDA Disability Discrimination Act (UK)
DEA Disability Employment Adviser (UK)
DEN Disability Employment Network (Australia)
DEWR Department of Employment and Workplace Relations (Australia)
DLA Disability Living Allowance (UK)
DSP Disability Support Pension (Australia)
DWP Department for Work and Pensions (UK)
ECHP European Community Household Panel
EFILWC European Foundation for the Improvement of Living and Working Conditions
EPL Employment Protection Legislation
ESA Employment and Support Allowance (UK)
EULFS European Union Labour Force Survey
EUR Euros
EU-SILC European Union Statistics on Income and Living Conditions
FaCS Department of Family and Community Services (Australia; nowadays FaCSIA)
FRS Family Resources Survey (UK)
GBP British Pound
GDP Gross Domestic Product
GP General Practicioner
HB Housing Benefit
HILDA Household, Income and Labour Dynamics in Australia
IB Incapacity Benefit
IBPA Incapacity Benefit Personal Adviser (UK)
IGSS Social Insurance Administration (Luxembourg)
IMSERSO Institute for Migrations and Social Services (Spain)
INSS National Social Security Institute (Spain)
SICKNESS, DISABILITY AND WORK: BREAKING THE BARRIERS – VOL. 2 – ISBN 978-92-64-03815-8 – © OECD 2007 175

LIST OF ACRONYMS
IS Income Support (UK)
JCA Job Capacity Assessment (Australia)
JN Job Network (Australia)
JSCI Job Seekers Classification Instrument (Australia)
MA Mobility Allowance (Australia)
METR Marginal Effective Tax Rates
MISSOC Mutual Information System on Social Protection in the EU Member States
MTAS Ministry of Employment and Social Affairs (Spain)
NDDP New Deal for Disabled People (UK)
NRR Net Replacement Rates
NSA Newstart Allowance (Australia)
PCA Personal Capability Assessment (UK)
PES Public Employment Service
PPP Purchasing Power Parities
PSP Personal Support Programme (Australia)
RMG Guaranteed Minimum Income (Luxembourg)
RTWC Return-to-Work Credit (UK)
SDA Severe Disablement Allowance (UK)
SDAC Survey of Disability, Ageing and Carers (Australia)
SSP Statuatory Sick Pay (UK)
USD United States Dollar
VR Vocational Rehabilitation service (Australia)
WHO World Health Organisation
WTC Working Tax Credit (UK)
SICKNESS, DISABILITY AND WORK: BREAKING THE BARRIERS – VOL. 2 – ISBN 978-92-64-03815-8 – © OECD 2007176

OECD PUBLICATIONS, 2, rue André-Pascal, 75775 PARIS CEDEX 16
PRINTED IN FRANCE
(81 2007 15 1 P) ISBN 978-92-64-03815-8 – 55865 2007