sicilia, giovanna and davis, adrienne l. and spain...
TRANSCRIPT
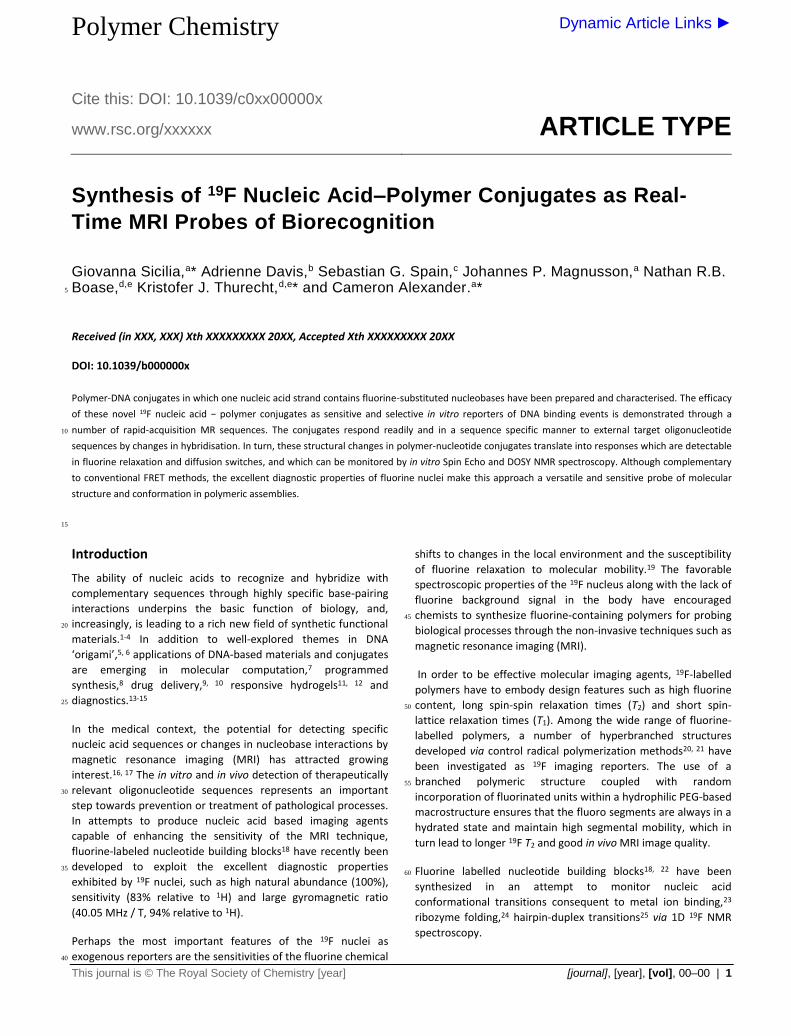
Polymer Chemistry
Cite this: DOI: 10.1039/c0xx00000x
www.rsc.org/xxxxxx
Dynamic Article Links ►
ARTICLE TYPE
This journal is © The Royal Society of Chemistry [year] [journal], [year], [vol], 00–00 | 1
Synthesis of 19F Nucleic Acid–Polymer Conjugates as Real-
Time MRI Probes of Biorecognition
Giovanna Sicilia,a* Adrienne Davis,b Sebastian G. Spain,c Johannes P. Magnusson,a Nathan R.B. Boase,d,e Kristofer J. Thurecht,d,e* and Cameron Alexander.a* 5
Received (in XXX, XXX) Xth XXXXXXXXX 20XX, Accepted Xth XXXXXXXXX 20XX
DOI: 10.1039/b000000x
Polymer-DNA conjugates in which one nucleic acid strand contains fluorine-substituted nucleobases have been prepared and characterised. The efficacy
of these novel 19F nucleic acid − polymer conjugates as sensitive and selective in vitro reporters of DNA binding events is demonstrated through a
number of rapid-acquisition MR sequences. The conjugates respond readily and in a sequence specific manner to external target oligonucleotide 10
sequences by changes in hybridisation. In turn, these structural changes in polymer-nucleotide conjugates translate into responses which are detectable
in fluorine relaxation and diffusion switches, and which can be monitored by in vitro Spin Echo and DOSY NMR spectroscopy. Although complementary
to conventional FRET methods, the excellent diagnostic properties of fluorine nuclei make this approach a versatile and sensitive probe of molecular
structure and conformation in polymeric assemblies.
15
Introduction
The ability of nucleic acids to recognize and hybridize with
complementary sequences through highly specific base-pairing
interactions underpins the basic function of biology, and,
increasingly, is leading to a rich new field of synthetic functional 20
materials.1-4 In addition to well-explored themes in DNA
‘origami’,5, 6 applications of DNA-based materials and conjugates
are emerging in molecular computation,7 programmed
synthesis,8 drug delivery,9, 10 responsive hydrogels11, 12 and
diagnostics.13-15 25
In the medical context, the potential for detecting specific
nucleic acid sequences or changes in nucleobase interactions by
magnetic resonance imaging (MRI) has attracted growing
interest.16, 17 The in vitro and in vivo detection of therapeutically
relevant oligonucleotide sequences represents an important 30
step towards prevention or treatment of pathological processes.
In attempts to produce nucleic acid based imaging agents
capable of enhancing the sensitivity of the MRI technique,
fluorine-labeled nucleotide building blocks18 have recently been
developed to exploit the excellent diagnostic properties 35
exhibited by 19F nuclei, such as high natural abundance (100%),
sensitivity (83% relative to 1H) and large gyromagnetic ratio
(40.05 MHz / T, 94% relative to 1H).
Perhaps the most important features of the 19F nuclei as
exogenous reporters are the sensitivities of the fluorine chemical 40
shifts to changes in the local environment and the susceptibility
of fluorine relaxation to molecular mobility.19 The favorable
spectroscopic properties of the 19F nucleus along with the lack of
fluorine background signal in the body have encouraged
chemists to synthesize fluorine-containing polymers for probing 45
biological processes through the non-invasive techniques such as
magnetic resonance imaging (MRI).
In order to be effective molecular imaging agents, 19F-labelled
polymers have to embody design features such as high fluorine
content, long spin-spin relaxation times (T2) and short spin-50
lattice relaxation times (T1). Among the wide range of fluorine-
labelled polymers, a number of hyperbranched structures
developed via control radical polymerization methods20, 21 have
been investigated as 19F imaging reporters. The use of a
branched polymeric structure coupled with random 55
incorporation of fluorinated units within a hydrophilic PEG-based
macrostructure ensures that the fluoro segments are always in a
hydrated state and maintain high segmental mobility, which in
turn lead to longer 19F T2 and good in vivo MRI image quality.
Fluorine labelled nucleotide building blocks18, 22 have been 60
synthesized in an attempt to monitor nucleic acid
conformational transitions consequent to metal ion binding,23
ribozyme folding,24 hairpin-duplex transitions25 via 1D 19F NMR
spectroscopy.
2 | Journal Name, [year], [vol], 00–00 This journal is © The Royal Society of Chemistry [year]
The elegant work of Mirkin et al.26 is perhaps the first example of
a smart fluorine-DNA based nanosensor that utilised fluorine
labelled nucleic acids as in vitro MR reporters. In this system
DNA strands functionalised with a tail of five 5-fluoro-uridines
were hybridized to complementary DNA sequences immobilized 5
on the surface of gold nanoparticles (AuNP). The close proximity
of the 19F nucleobases to the AuNP surface decreased
significantly the 19F NMR signal. In contrast, release of the 19F
probes upon toehold-mediated strand displacement induced by
target DNA strands resulted in a detectable fluorine peak. 10
Inspired by the work of Mirkin et al., we embarked on a
fundamental investigation of how molecular structure can be
manipulated to influence the relaxation properties of the DNA
probes. This was driven by the knowledge that although the
presence of a single switchable 19F signal can be advantageous in 15
the in vitro NMR detection of DNA binding events, it does not
guarantee success of imaging via 19F MRI. Importantly, the
relaxation of 19F nuclei plays an important role in magnetic
resonance imaging and is a powerful parameter for manipulating
19F MR signals. 20
In this report a new example of 19F-nucleic acid polymer
conjugate material is described. This polymer consists of a linear
methacrylamide backbone functionalised with single stranded
DNAs that act as anchors to graft partially complementary 2′-
fluoro labelled oligonucleotides. The insertion of fluorine nuclei 25
in the 2′ position of the ribose ring has been demonstrated to
enhance the serum stability27 and the binding affinity to RNA
targets.28 The choice of using a linear acrylic-type polymer was
based on its ease of synthesis and functionalization through
controlled radical polymerisation techniques. In the present 30
work the aim was to demonstrate first the efficacy of a 2′-fluoro
nucleic acid-polymer conjugate to respond in a sequence specific
manner to external ‘trigger’ oligonucleotide sequences. The
second aim was to translate such responses into detectable
fluorine relaxation and diffusion switches that can be monitored 35
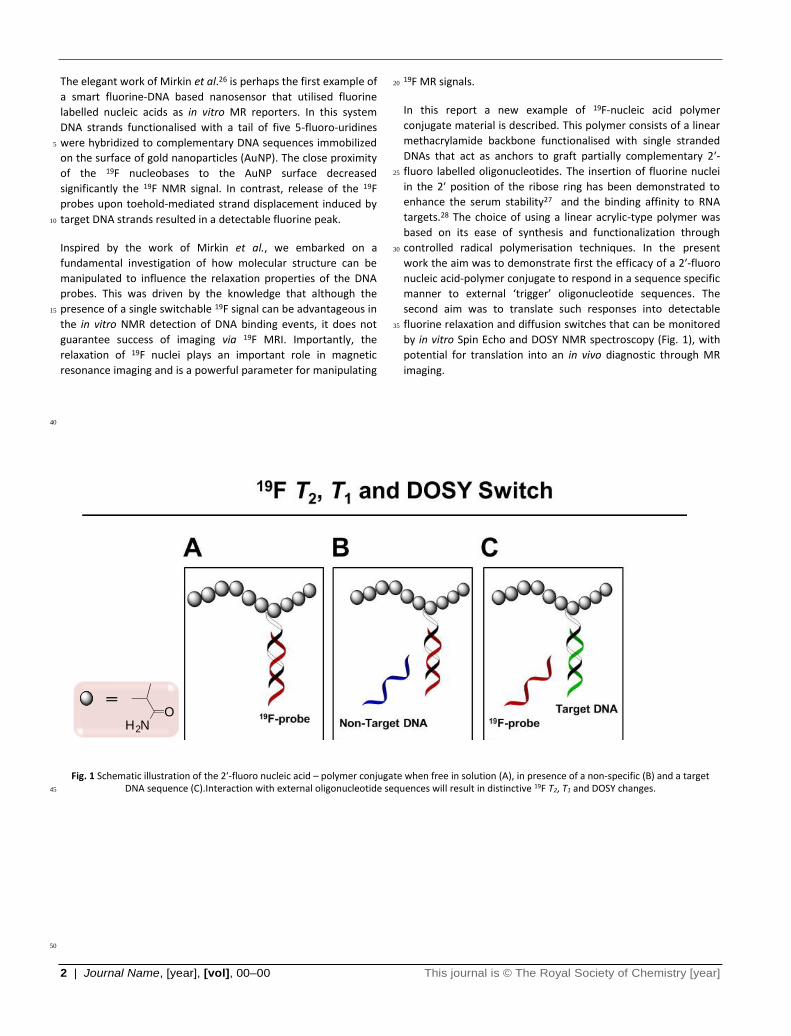
by in vitro Spin Echo and DOSY NMR spectroscopy (Fig. 1), with
potential for translation into an in vivo diagnostic through MR
imaging.
40
Fig. 1 Schematic illustration of the 2′-fluoro nucleic acid – polymer conjugate when free in solution (A), in presence of a non-specific (B) and a target DNA sequence (C).Interaction with external oligonucleotide sequences will result in distinctive 19F T2, T1 and DOSY changes. 45
50
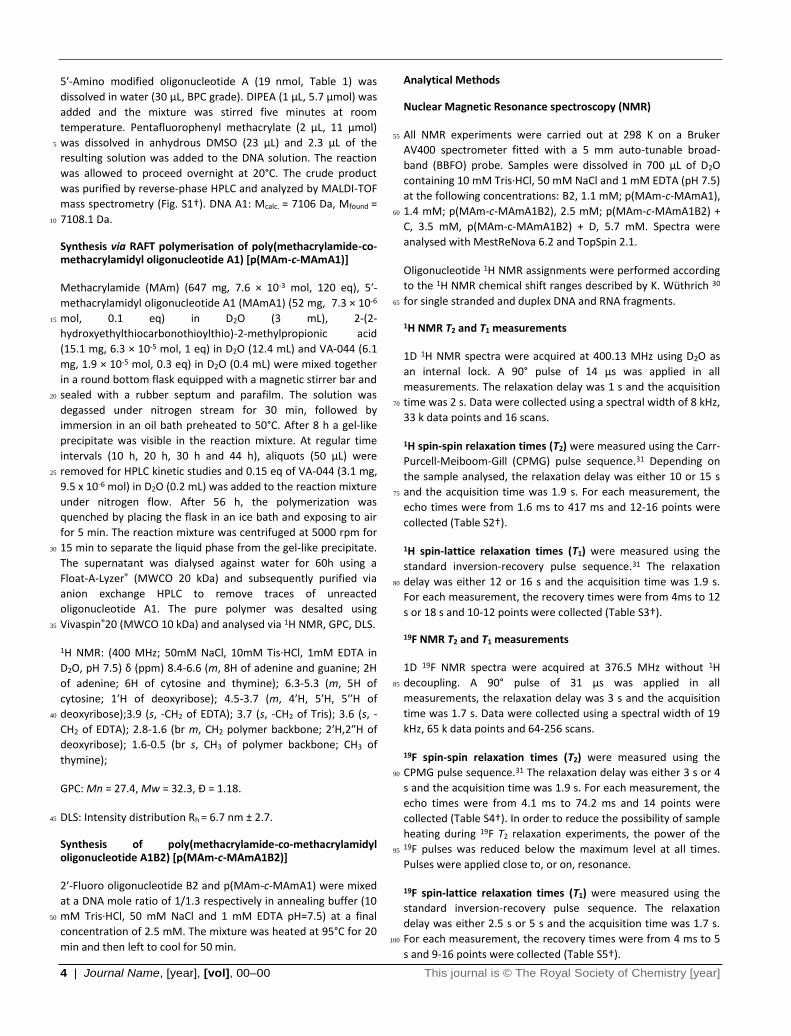
=
H2NO
This journal is © The Royal Society of Chemistry [year] Journal Name, [year], [vol], 00–00 | 3
Experimental Section
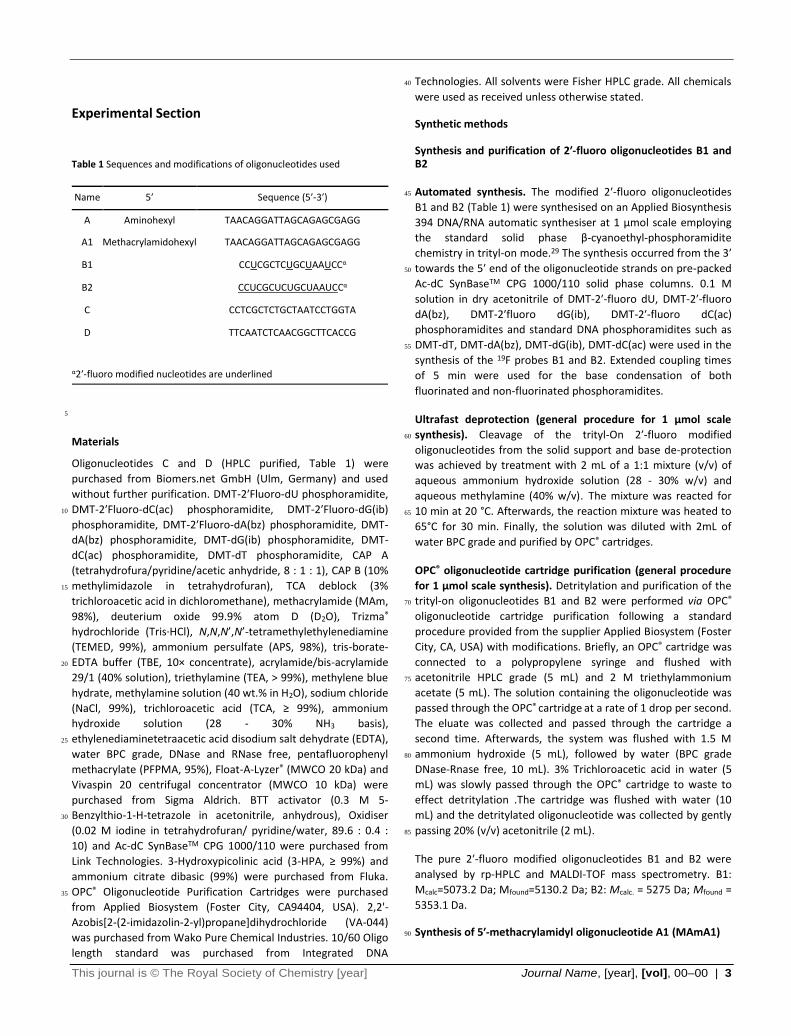
Table 1 Sequences and modifications of oligonucleotides used
Name 5′ Sequence (5′-3′)
A Aminohexyl TAACAGGATTAGCAGAGCGAGG
A1 Methacrylamidohexyl TAACAGGATTAGCAGAGCGAGG
B1 CCUCGCTCUGCUAAUCCα
B2 CCUCGCUCUGCUAAUCCα
C CCTCGCTCTGCTAATCCTGGTA
D TTCAATCTCAACGGCTTCACCG
α2′-fluoro modified nucleotides are underlined
5
Materials
Oligonucleotides C and D (HPLC purified, Table 1) were
purchased from Biomers.net GmbH (Ulm, Germany) and used
without further purification. DMT-2′Fluoro-dU phosphoramidite,
DMT-2′Fluoro-dC(ac) phosphoramidite, DMT-2′Fluoro-dG(ib) 10
phosphoramidite, DMT-2′Fluoro-dA(bz) phosphoramidite, DMT-
dA(bz) phosphoramidite, DMT-dG(ib) phosphoramidite, DMT-
dC(ac) phosphoramidite, DMT-dT phosphoramidite, CAP A
(tetrahydrofura/pyridine/acetic anhydride, 8 : 1 : 1), CAP B (10%
methylimidazole in tetrahydrofuran), TCA deblock (3% 15
trichloroacetic acid in dichloromethane), methacrylamide (MAm,
98%), deuterium oxide 99.9% atom D (D2O), Trizma®
hydrochloride (Tris∙HCl), N,N,N’,N’-tetramethylethylenediamine
(TEMED, 99%), ammonium persulfate (APS, 98%), tris-borate-
EDTA buffer (TBE, 10× concentrate), acrylamide/bis-acrylamide 20
29/1 (40% solution), triethylamine (TEA, > 99%), methylene blue
hydrate, methylamine solution (40 wt.% in H2O), sodium chloride
(NaCl, 99%), trichloroacetic acid (TCA, ≥ 99%), ammonium
hydroxide solution (28 - 30% NH3 basis),
ethylenediaminetetraacetic acid disodium salt dehydrate (EDTA), 25
water BPC grade, DNase and RNase free, pentafluorophenyl
methacrylate (PFPMA, 95%), Float-A-Lyzer® (MWCO 20 kDa) and
Vivaspin 20 centrifugal concentrator (MWCO 10 kDa) were
purchased from Sigma Aldrich. BTT activator (0.3 M 5-
Benzylthio-1-H-tetrazole in acetonitrile, anhydrous), Oxidiser 30
(0.02 M iodine in tetrahydrofuran/ pyridine/water, 89.6 : 0.4 :
10) and Ac-dC SynBaseTM CPG 1000/110 were purchased from
Link Technologies. 3-Hydroxypicolinic acid (3-HPA, ≥ 99%) and
ammonium citrate dibasic (99%) were purchased from Fluka.
OPC® Oligonucleotide Purification Cartridges were purchased 35
from Applied Biosystem (Foster City, CA94404, USA). 2,2'-
Azobis[2-(2-imidazolin-2-yl)propane]dihydrochloride (VA-044)
was purchased from Wako Pure Chemical Industries. 10/60 Oligo
length standard was purchased from Integrated DNA
Technologies. All solvents were Fisher HPLC grade. All chemicals 40
were used as received unless otherwise stated.
Synthetic methods
Synthesis and purification of 2ʹ-fluoro oligonucleotides B1 and B2
Automated synthesis. The modified 2′-fluoro oligonucleotides 45
B1 and B2 (Table 1) were synthesised on an Applied Biosynthesis
394 DNA/RNA automatic synthesiser at 1 μmol scale employing
the standard solid phase β-cyanoethyl-phosphoramidite
chemistry in trityl-on mode.29 The synthesis occurred from the 3′
towards the 5′ end of the oligonucleotide strands on pre-packed 50
Ac-dC SynBaseTM CPG 1000/110 solid phase columns. 0.1 M
solution in dry acetonitrile of DMT-2′-fluoro dU, DMT-2′-fluoro
dA(bz), DMT-2′fluoro dG(ib), DMT-2′-fluoro dC(ac)
phosphoramidites and standard DNA phosphoramidites such as
DMT-dT, DMT-dA(bz), DMT-dG(ib), DMT-dC(ac) were used in the 55
synthesis of the 19F probes B1 and B2. Extended coupling times
of 5 min were used for the base condensation of both
fluorinated and non-fluorinated phosphoramidites.
Ultrafast deprotection (general procedure for 1 μmol scale
synthesis). Cleavage of the trityl-On 2′-fluoro modified 60
oligonucleotides from the solid support and base de-protection
was achieved by treatment with 2 mL of a 1:1 mixture (v/v) of
aqueous ammonium hydroxide solution (28 - 30% w/v) and
aqueous methylamine (40% w/v). The mixture was reacted for
10 min at 20 °C. Afterwards, the reaction mixture was heated to 65
65°C for 30 min. Finally, the solution was diluted with 2mL of
water BPC grade and purified by OPC® cartridges.
OPC® oligonucleotide cartridge purification (general procedure
for 1 μmol scale synthesis). Detritylation and purification of the
trityl-on oligonucleotides B1 and B2 were performed via OPC® 70
oligonucleotide cartridge purification following a standard
procedure provided from the supplier Applied Biosystem (Foster
City, CA, USA) with modifications. Briefly, an OPC® cartridge was
connected to a polypropylene syringe and flushed with
acetonitrile HPLC grade (5 mL) and 2 M triethylammonium 75
acetate (5 mL). The solution containing the oligonucleotide was
passed through the OPC® cartridge at a rate of 1 drop per second.
The eluate was collected and passed through the cartridge a
second time. Afterwards, the system was flushed with 1.5 M
ammonium hydroxide (5 mL), followed by water (BPC grade 80
DNase-Rnase free, 10 mL). 3% Trichloroacetic acid in water (5
mL) was slowly passed through the OPC® cartridge to waste to
effect detritylation .The cartridge was flushed with water (10
mL) and the detritylated oligonucleotide was collected by gently
passing 20% (v/v) acetonitrile (2 mL). 85
The pure 2′-fluoro modified oligonucleotides B1 and B2 were
analysed by rp-HPLC and MALDI-TOF mass spectrometry. B1:
Mcalc=5073.2 Da; Mfound=5130.2 Da; B2: Mcalc. = 5275 Da; Mfound =
5353.1 Da.
Synthesis of 5ʹ-methacrylamidyl oligonucleotide A1 (MAmA1) 90
4 | Journal Name, [year], [vol], 00–00 This journal is © The Royal Society of Chemistry [year]
5′-Amino modified oligonucleotide A (19 nmol, Table 1) was
dissolved in water (30 µL, BPC grade). DIPEA (1 µL, 5.7 µmol) was
added and the mixture was stirred five minutes at room
temperature. Pentafluorophenyl methacrylate (2 µL, 11 µmol)
was dissolved in anhydrous DMSO (23 µL) and 2.3 µL of the 5
resulting solution was added to the DNA solution. The reaction
was allowed to proceed overnight at 20°C. The crude product
was purified by reverse-phase HPLC and analyzed by MALDI-TOF
mass spectrometry (Fig. S1†). DNA A1: Mcalc. = 7106 Da, Mfound =
7108.1 Da. 10
Synthesis via RAFT polymerisation of poly(methacrylamide-co-methacrylamidyl oligonucleotide A1) [p(MAm-c-MAmA1)]
Methacrylamide (MAm) (647 mg, 7.6 × 10⁻³ mol, 120 eq), 5′-
methacrylamidyl oligonucleotide A1 (MAmA1) (52 mg, 7.3 × 10⁻⁶
mol, 0.1 eq) in D2O (3 mL), 2-(2-15
hydroxyethylthiocarbonothioylthio)-2-methylpropionic acid
(15.1 mg, 6.3 × 10⁻⁵ mol, 1 eq) in D2O (12.4 mL) and VA-044 (6.1
mg, 1.9 × 10⁻⁵ mol, 0.3 eq) in D2O (0.4 mL) were mixed together
in a round bottom flask equipped with a magnetic stirrer bar and
sealed with a rubber septum and parafilm. The solution was 20
degassed under nitrogen stream for 30 min, followed by
immersion in an oil bath preheated to 50°C. After 8 h a gel-like
precipitate was visible in the reaction mixture. At regular time
intervals (10 h, 20 h, 30 h and 44 h), aliquots (50 μL) were
removed for HPLC kinetic studies and 0.15 eq of VA-044 (3.1 mg, 25
9.5 x 10⁻⁶ mol) in D2O (0.2 mL) was added to the reaction mixture
under nitrogen flow. After 56 h, the polymerization was
quenched by placing the flask in an ice bath and exposing to air
for 5 min. The reaction mixture was centrifuged at 5000 rpm for
15 min to separate the liquid phase from the gel-like precipitate. 30
The supernatant was dialysed against water for 60h using a
Float-A-Lyzer® (MWCO 20 kDa) and subsequently purified via
anion exchange HPLC to remove traces of unreacted
oligonucleotide A1. The pure polymer was desalted using
Vivaspin®20 (MWCO 10 kDa) and analysed via 1H NMR, GPC, DLS. 35
1H NMR: (400 MHz; 50mM NaCl, 10mM Tis∙HCl, 1mM EDTA in
D2O, pH 7.5) δ (ppm) 8.4-6.6 (m, 8H of adenine and guanine; 2H
of adenine; 6H of cytosine and thymine); 6.3-5.3 (m, 5H of
cytosine; 1′H of deoxyribose); 4.5-3.7 (m, 4′H, 5′H, 5′′H of
deoxyribose);3.9 (s, -CH2 of EDTA); 3.7 (s, -CH2 of Tris); 3.6 (s, -40
CH2 of EDTA); 2.8-1.6 (br m, CH2 polymer backbone; 2′H,2″H of
deoxyribose); 1.6-0.5 (br s, CH3 of polymer backbone; CH3 of
thymine);
GPC: Mn = 27.4, Mw = 32.3, Ð = 1.18.
DLS: Intensity distribution Rh = 6.7 nm ± 2.7. 45
Synthesis of poly(methacrylamide-co-methacrylamidyl oligonucleotide A1B2) [p(MAm-c-MAmA1B2)]
2′-Fluoro oligonucleotide B2 and p(MAm-c-MAmA1) were mixed
at a DNA mole ratio of 1/1.3 respectively in annealing buffer (10
mM Tris∙HCl, 50 mM NaCl and 1 mM EDTA pH=7.5) at a final 50
concentration of 2.5 mM. The mixture was heated at 95°C for 20
min and then left to cool for 50 min.
Analytical Methods
Nuclear Magnetic Resonance spectroscopy (NMR)
All NMR experiments were carried out at 298 K on a Bruker 55
AV400 spectrometer fitted with a 5 mm auto-tunable broad-
band (BBFO) probe. Samples were dissolved in 700 μL of D2O
containing 10 mM Tris∙HCl, 50 mM NaCl and 1 mM EDTA (pH 7.5)
at the following concentrations: B2, 1.1 mM; p(MAm-c-MAmA1),
1.4 mM; p(MAm-c-MAmA1B2), 2.5 mM; p(MAm-c-MAmA1B2) + 60
C, 3.5 mM, p(MAm-c-MAmA1B2) + D, 5.7 mM. Spectra were
analysed with MestReNova 6.2 and TopSpin 2.1.
Oligonucleotide 1H NMR assignments were performed according
to the 1H NMR chemical shift ranges described by K. Wüthrich 30
for single stranded and duplex DNA and RNA fragments. 65
1H NMR T2 and T1 measurements
1D 1H NMR spectra were acquired at 400.13 MHz using D2O as
an internal lock. A 90° pulse of 14 μs was applied in all
measurements. The relaxation delay was 1 s and the acquisition
time was 2 s. Data were collected using a spectral width of 8 kHz, 70
33 k data points and 16 scans.
1H spin-spin relaxation times (T2) were measured using the Carr-
Purcell-Meiboom-Gill (CPMG) pulse sequence.31 Depending on
the sample analysed, the relaxation delay was either 10 or 15 s
and the acquisition time was 1.9 s. For each measurement, the 75
echo times were from 1.6 ms to 417 ms and 12-16 points were
collected (Table S2†).
1H spin-lattice relaxation times (T1) were measured using the
standard inversion-recovery pulse sequence.31 The relaxation
delay was either 12 or 16 s and the acquisition time was 1.9 s. 80
For each measurement, the recovery times were from 4ms to 12
s or 18 s and 10-12 points were collected (Table S3†).
19F NMR T2 and T1 measurements
1D 19F NMR spectra were acquired at 376.5 MHz without 1H
decoupling. A 90° pulse of 31 μs was applied in all 85
measurements, the relaxation delay was 3 s and the acquisition
time was 1.7 s. Data were collected using a spectral width of 19
kHz, 65 k data points and 64-256 scans.
19F spin-spin relaxation times (T2) were measured using the
CPMG pulse sequence.31 The relaxation delay was either 3 s or 4 90
s and the acquisition time was 1.9 s. For each measurement, the
echo times were from 4.1 ms to 74.2 ms and 14 points were
collected (Table S4†). In order to reduce the possibility of sample
heating during 19F T2 relaxation experiments, the power of the 19F pulses was reduced below the maximum level at all times. 95
Pulses were applied close to, or on, resonance.
19F spin-lattice relaxation times (T1) were measured using the
standard inversion-recovery pulse sequence. The relaxation
delay was either 2.5 s or 5 s and the acquisition time was 1.7 s.
For each measurement, the recovery times were from 4 ms to 5 100
s and 9-16 points were collected (Table S5†).
This journal is © The Royal Society of Chemistry [year] Journal Name, [year], [vol], 00–00 | 5
1H and 19F T2, T1 curve fitting
Spin-spin (T2) and spin-lattice (T1) relaxation times of 1H and 19F
nuclei were described either by single exponential functions or
by the sum of two exponential relaxation decays when short and
long decay rates were present.31, 32 T2 and T1 decay curves were 5
analysed with SigmaPlot version 10.0, from Systat Software, Inc.,
San Jose, California, USA (Table S6). Accordingly, for single
exponential decay rates T1 and T2 were calculated using equation
S1. For double exponential decay rates T1Short, T2
Short, T1Long and
T2Long were calculated using equation S2 and S3. 10
Measurement of self-diffusion coefficients
1H diffusion experiments were carried out using a stimulated
echo sequence employing bipolar gradient pulse pairs33-35 (the
standard Bruker AU program ledbpgppr2s). Presaturation was
employed during the relaxation delay for water suppression. For 15
each FID, 16 scans were collected with 5 s relaxation delays; 32k
data points were collected and 8 or 16 experiments were
acquired at increasing gradient strengths covering a spectral
width of 20 ppm. Prior to Fourier transformation, exponential
multiplication was applied with 2 or 5 Hz line broadening. The 20
diffusion time (∆) and the gradient length (𝛿) were set to 200
ms and 5ms respectively, while the recovery delay after gradient
pulses (τ) was 200 μs.
19F diffusion experiments were carried out using the standard
Bruker pulse program ledbpgp2s. The pulse program applied 25
stimulated echoes using bipolar gradient pulses for diffusion and
2 spoil gradients.34, 35 For each FID, 1024 scans were collected
with 4 s relaxation delays; 32k data points were collected and 8
experiments were acquired at increasing gradient strengths.
Prior to Fourier transformation exponential multiplication was 30
applied with 50 or 150 Hz line broadening. The diffusion time (∆)
and the gradient length were set to 200 and 5 ms respectively,
while the recovery delay (τ) after gradient pulses was 5 ms.
In order to minimise convection effects, the VT air flows in the
probe were increased to 535 L/h in all diffusion experiments. 35
1H and 19F diffusion curve fitting. The integrals of selected
regions in the 1D 1H and 19F spectra were measured at different
gradient strengths and fitted to the Equations S5-S8.34
2D 1H DOSY spectra. 2D 1H diffusion spectra were elaborated
with the DOSY module of Bruker’s TopSpin 2.1 selecting as 40
processing method “exponential”, two fitting components and a
line broadening factor of 3.0.
Strand displacement experiments
PAGE assay. The hybrid p(MAm-c-MAmA1B2) was combined
with 1or 2 mole equiv. of either complementary (strand C) or 45
scrambled (strand D) DNA in annealing buffer at a final
concentration of 90-117 μM. Samples were incubated for 30 min
at room temperature and then analysed by native PAGE as
previously described.
NMR assay. The NMR sample containing the hybrid p(MAm-c-50
MAmA1B2) (2.5mM) in 700 μL of deuterated annealing buffer
(50mM NaCl, 10 mM Tris∙HCl and 1mM EDTA in D2O, pH 7.5) was
used to dissolve either 1 mole equiv. of the complementary
(strand C) or scrambled (strand D) DNA affording a final
concentration of 3.6 mM. Specifically, 200 μL of p(MAm-c-55
MAmA1B2) were transferred with a 200 μL micropipette fitted
with sterile tips from a glass NMR tube (5 mm) to a centrifuge
tube containing lyophilised strand C or D. The solution was
mixed and transferred back to the NMR tube. The samples,
p(MAm-c-MAmA1B2)+C and p(MAm-c-MAmA1B2)+D, were 60
incubated for 30 min at room temperature and then analysed by
NMR.
This process was repeated for p(MAm-c-MAmA1B2)+D to
incorporate additional amounts of strand D (2 mole equiv.) and
strand C (5 mole equiv.). 65
Results and Discussion
Design, Synthesis and 19F relaxation analysis of 2ʹ-fluoro
modified oligonucleotides B1 and B2
Two 17-mer 2′-fluoro-modified oligonucleotide sequences B1
and B2 were synthesised via automated solid-phase chemistry 70
using commercially available DMT-2′-deoxy and DMT-2′-fluoro
modified phosphoramidites as building blocks. The synthesis of
both oligonucleotides gave satisfactory yields with ~95%
coupling efficiency. As shown in Table 1, B1 contained 4 2′-
fluoro-uridines whereas B2 consisted of 16 2′-fluoro nucleotides. 75
Fast deprotection of the 2′-fluoro containing oligonucleotides
was achieved by treatment with aqueous methylamine and
ammonium hydroxide at 55°C for 30 min. Detritylation and
removal of failure sequences from the full length products were
performed via OPC® oligonucleotide cartridge purification. The 80
purity of the 2′-fluoro modified oligonucleotides B1 and B2, was
confirmed by MALDI-TOF mass spectrometry and rp-HPLC
(Figure S2†).
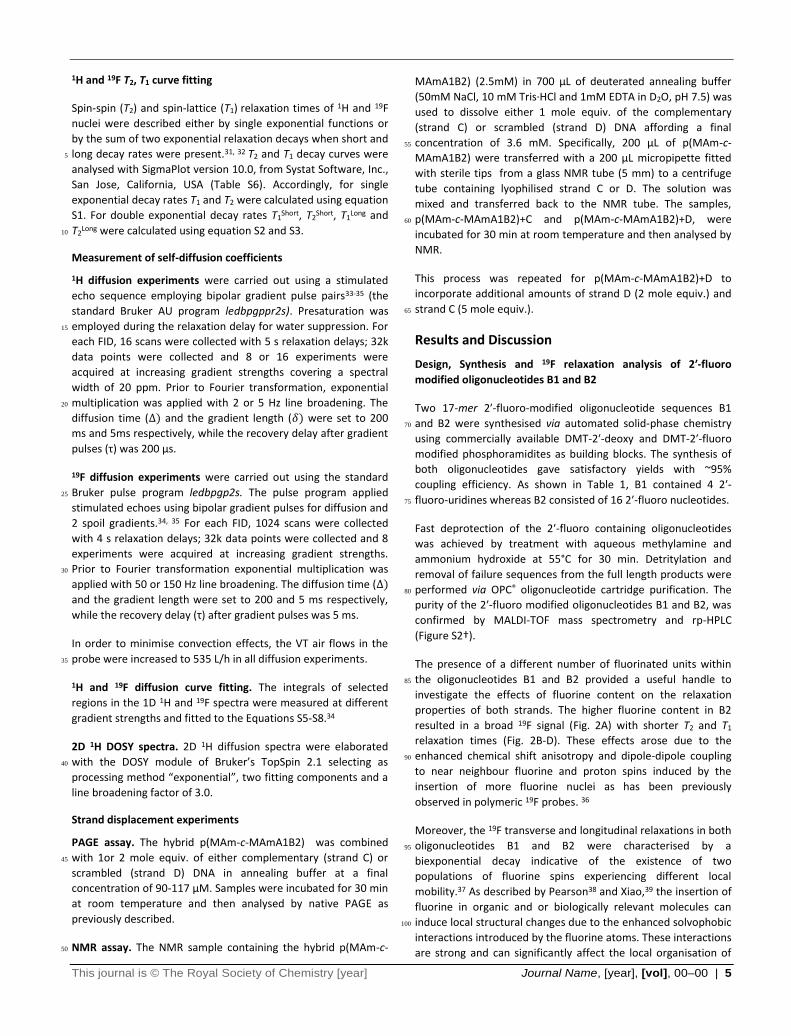
The presence of a different number of fluorinated units within
the oligonucleotides B1 and B2 provided a useful handle to 85
investigate the effects of fluorine content on the relaxation
properties of both strands. The higher fluorine content in B2
resulted in a broad 19F signal (Fig. 2A) with shorter T2 and T1
relaxation times (Fig. 2B-D). These effects arose due to the
enhanced chemical shift anisotropy and dipole-dipole coupling 90
to near neighbour fluorine and proton spins induced by the
insertion of more fluorine nuclei as has been previously
observed in polymeric 19F probes. 36
Moreover, the 19F transverse and longitudinal relaxations in both
oligonucleotides B1 and B2 were characterised by a 95
biexponential decay indicative of the existence of two
populations of fluorine spins experiencing different local
mobility.37 As described by Pearson38 and Xiao,39 the insertion of
fluorine in organic and or biologically relevant molecules can
induce local structural changes due to the enhanced solvophobic 100
interactions introduced by the fluorine atoms. These interactions
are strong and can significantly affect the local organisation of
6 | Journal Name, [year], [vol], 00–00 This journal is © The Royal Society of Chemistry [year]
the fluorinated moieties leading to localised aggregation.
As noted above, the attractive interactions between fluorine
atoms promoted aggregation of the oligonucleotide strands.
5
Fig. 2 (A) 1D 19F NMR of oligonucleotides B1 (black) and B2 (red) in D2O containing 50 mM NaCl, 10 mM Tris∙HCl, 2mM EDTA pH 7.5. (B) 19F spin-spin (T2) relaxation times measurements for oligonucleotide B1 (black circles) and oligonucleotide B2 (red circles) fitted with biexponential decay curves. (C) 19F
spin-lattice (T1) relaxation times measurements of oligonucleotide B1 (black circles) and B2 (red circles) fitted with biexponential decay curves. (D) List of short and long 19F T2 and 19F T1 relaxation times with relative standard error and abundance (%) measured for oligonucleotides B1 and B2. 10
The electrophoretic migration of B1 and B2 along a 30% native
PAGE was characterised by two separate bands (Fig. S3†). By
comparison with a DNA standard comprising a set of eight
oligonucleotide fragments of different length ranging from 10 to 15
60 base pairs, it could be observed that part of the B1 and B2
strands were migrating at the same rate as 30 and 40 base pair
oligonucleotides. Therefore, from the PAGE analysis we
hypothesise that the fast spin-spin (T2s) and spin-lattice
relaxation times (T1s) arose from fluorine nuclei of aggregated 20
strands experiencing restricted mobility while the long T2s and
T1s involved fluorine nuclei of less entangled strands
encountering higher mobility.
Oligonucleotide B2 as a strand of choice
In order to be imaged successfully, a 19F tracking agent needs to 25
display high signal intensity, high fluorine content, long spin-spin
relaxation times (T2) and short spin-lattice relaxation times (T1).40
As shown in Figure 2D, 70% of the total fluorine spins of the 2′-
fluoro modified oligonucleotides B1 and B2 displayed sufficiently
short spin-lattice relaxation times with T1sLong of 460.8 ms and 30
453.9 ms respectively, such that experiments could be
conducted within a useful timeframe. In contrast, the T2s
measured for both strands were close to the detection limit of
the MRI technique, leading to a decrease in intensity of the
measured samples. More than 80% of the fluorine spins of both 35
B1 and B2 were characterised by fast spin-spin relaxation
processes with T2Short values in the range of 6.2 and 3.9 ms
respectively.
The data discussed refers only to the T2Short and T1
Long values as
these are the populations that gave a significant contribution to 40
the fluorine spin-spin and spin-lattice relaxation processes in
both oligonucleotide B1 and B2.
Considering the similarity between probes, in the present study
oligonucleotide B2 was selected as a model 19F probe due to its
higher fluorine content that could guarantee a stronger signal to 45
noise ratio during the in vitro NMR acquisitions.
1H spin-spin and spin-lattice relaxation of oligonucleotide B2
In order to gain more information about the relationship
between relaxation rates and structural features of the fluorine-
labelled probe B2, 1H spin relaxations were analysed. 1H spin-50
spin and spin-lattice relaxations were evaluated only for proton
nuclei resonating at 8.5-7.6 ppm and 6.4-5.5 ppm due to their
This journal is © The Royal Society of Chemistry [year] Journal Name, [year], [vol], 00–00 | 7
distance from the strong water peak in the spectrum that
confounds analysis of neighbouring peaks (Fig. S4†). In contrast
to the 19F nuclei, the observed 1H spins displayed longer T2
(120.5 - 116.3 ms) and T1 (1.68 s) relaxation times. This effect can
be explained by consideration of the relaxation mechanisms that 5
govern 1H and 19F nuclei. Both spins relax via dipole-dipole
coupling to near neighbour nuclei. However, 19F spins receive an
additional contribution to relaxation from the chemical shift
anisotropy that promotes transverse and longitudinal relaxation
resulting in shorter T2 and T1 values.41 Moreover, 1H spin-spin 10
(T2) and spin-lattice (T1) relaxations exhibited single exponential
decay rates, as described in Equations 1 and 2. This effect was
possibly a consequence of the different position occupied by 1H
and 19F spins within the nucleotides of the B2 strand. Protons
resonating at 8.5-7.6 ppm and 6.4-5.5 ppm were located on the 15
nucleobases and therefore distant enough from the sugar ring
containing the fluorine nuclei to be influenced by the local
mobility changes occurring in the vicinity of the fluorine spins.
Finally, the spin-spin relaxation times observed for 1H resonating
at 8.5-7.6 ppm and 6.4-5.5 ppm (T2s of 120.5 and 116.3 ms, Fig. 20
S4†) were 13-14 fold lower than the relative spin-lattice
relaxation times (T1 = 1.68 s). Longitudinal relaxation occurs in
presence of local magnetic fields that fluctuate at the Larmor
frequency of the observed nuclear spin. Large molecules tumble
slowly in solution generating local magnetic fields that fluctuate 25
at a rate that does not allow spin-lattice relaxation and therefore
resulting in long T1 relaxation times. However, the slow tumbling
rate of large molecules is capable of favouring spin-spin
relaxation due to the sensitivity of T2 to low frequency
fluctuations.31 30
1H and 19F diffusion analysis of oligonucleotide B2
1H and 19F diffusion ordered spectroscopy experiments were
carried out to gain information on the molecular dynamics of the
2′-fluoro modified oligonucleotide B2 in solution, and to provide
confirmation of molecular structure. As shown in Figure S5†, 1H 35
resonating at 8.5-7.6 ppm and 6.4-5.5 ppm and 19F spins
displayed similar self-diffusion coefficients in the range of 5.2 ×
10-9 and 5.8 × 10⁻⁹ m2s-1 demonstrating that all the nuclei
analysed were part of the same molecular structure.
Synthesis and characterisation of p(MAm-c-MAmA1) 40
In order to introduce the nucleic acid functionality into a linear
polymeric platform, polymerizable DNA strand A1 (Table 1) was
synthesised by reacting 5′-amino oligonucleotide A (Table 1)
with pentafluorophenyl methacrylate. The strand A1 was
characterised by a 17-mer sequence complementary to the 45
fluorine labelled probe B2 and a 5-base overhang to enable
strand displacement by a target oligonucleotide sequence. The
linear copolymer p(MAm-c-MAmA1) was synthesised via RAFT
technique. 5′-Methacrylamidyl DNA A1 (MAmA1) was
copolymerised with methacrylamide (MAm) in water at 50°C 50
using 2-(2-hydroxyethylthiocarbonothioylthio)-2-
methylpropionic acid and VA-044 as RAFT chain transfer agent
(CTA) and initiator respectively (Figure S6†).
The above mentioned reagents were mixed to obtain a final
molar ratio of 120 : 0.1 : 1 : 0.3 (MAm : MAmA1 : CTA : VA-044). 55
The molar concentration of 5′-methacrylamidyl oligonucleotide
A1 was kept lower than the methacrylamide monomer in an
attempt to balance the length of the polymer backbone and the
oligonucleotide side chains. Moreover, the low degree of DNA
functionalization per polymer chain was considered to be 60
advantageous as it would reduce the steric hindrance in the
following hybridization step, making the strand A1 more
accessible to the fluorinated probe B2.
Because of its short half-life of 10 h at 40 °C, 0.15 eq of VA-044
was added to the reaction mixture every 10 h for 40 h in order to 65
keep constant the source of radicals. After 8 h, a gel like
precipitate was visible in the reaction chamber. The gel
consisted of only methacrylamide as shown by the 1D 1H NMR
acquired after gel solubilisation in D2O (Figure S7†). No trace of
MAmA1 could be detected by 1H NMR and UV-vis spectroscopy. 70
This gave an insight into the kinetics of the polymerization
progress with MAm reacting faster than MAmA1 due to its less
bulky structure. The consumption of MAmA1 during the
polymerisation was monitored via anion exchange HPLC. As
shown in Figure S8†, 58% of MAmA1 reacted after 44 h. As the 75
polymerisation rate of MAmA1 became very slow in the
following hours, the reaction was stopped after 56 h when 59%
of the initial oligonucleotide A1 was polymerised.
The reaction mixture was first dialysed against water for 60 h
with MW cut off of 20 kDa, however unreacted MAmA1 80
remained. Consequently, it was then purified via anion exchange
HPLC to remove the unreacted 5′-methacrylamidyl
oligonucleotide A1.
The final copolymer composition was calculated from the 1H
NMR acquired on the pure polymer by comparing the integrals 85
of the protons of MAm (5H, -CH2 and -CH3 per monomer unit)
and MAmA1 [5H,-CH2 and -CH3; 30H, DNA A1 (signals between
8.5-6.9 ppm] (for details see ESI, Fig. S9† and Eqn. S5-S7). As part
of the initial fraction of methacrylamide was lost in the formed
gel, the final composition percentage of MAm (99.6%) was 90
slightly lower than the target value (99.9%, Fig. S9†).
The pure polymer was characterised by aqueous phase GPC and
DLS. As shown in Figure S9†, p(MAm-c-MAmA1) displayed an Mn
of 27.4 kDa and a Ð of 1.18. The DLS intensity distribution
showed one population with Rh ~ 6.7 nm (Fig. S10†). 95
1H spin-spin and spin-lattice relaxation analysis of p(MAm-c-
MAmA1)
As described for oligonucleotide B2, spin-spin (T2) and spin-
lattice (T1) relaxation times were measured for proton nuclei
resonating in region of the 1D 1H NMR spectrum distant from 100
the water peak (Figure S11†). Therefore, 1H T2 and 1H T1
relaxation processes were investigated for protons belonging to
the methyl side chain (CH3, 1.4-0.8ppm) the methylene groups
(CH2) constituting the polymer backbone (2.0-1.6 ppm) and the
nucleobases of the oligonucleotide A1 (8.5-7.6 ppm and 6.4-5.5 105
ppm).
8 | Journal Name, [year], [vol], 00–00 This journal is © The Royal Society of Chemistry [year]
All the 1H T2 measured displayed biexponential decay rates with
two populations of 1H T2s. As shown in Figure S10†, the long T2
component was dominant (≥ 52%) for the oligonucleotide
protons resonating at 8.5-7.6 ppm (T2Long = 114.9 ms) and 6.4-5.5
ppm (T2Long = 57.1 ms), whereas the short T2 component was 5
dominant (≥ 77%) for the methylene (T2Short = 2.5 ms) and methyl
groups
10
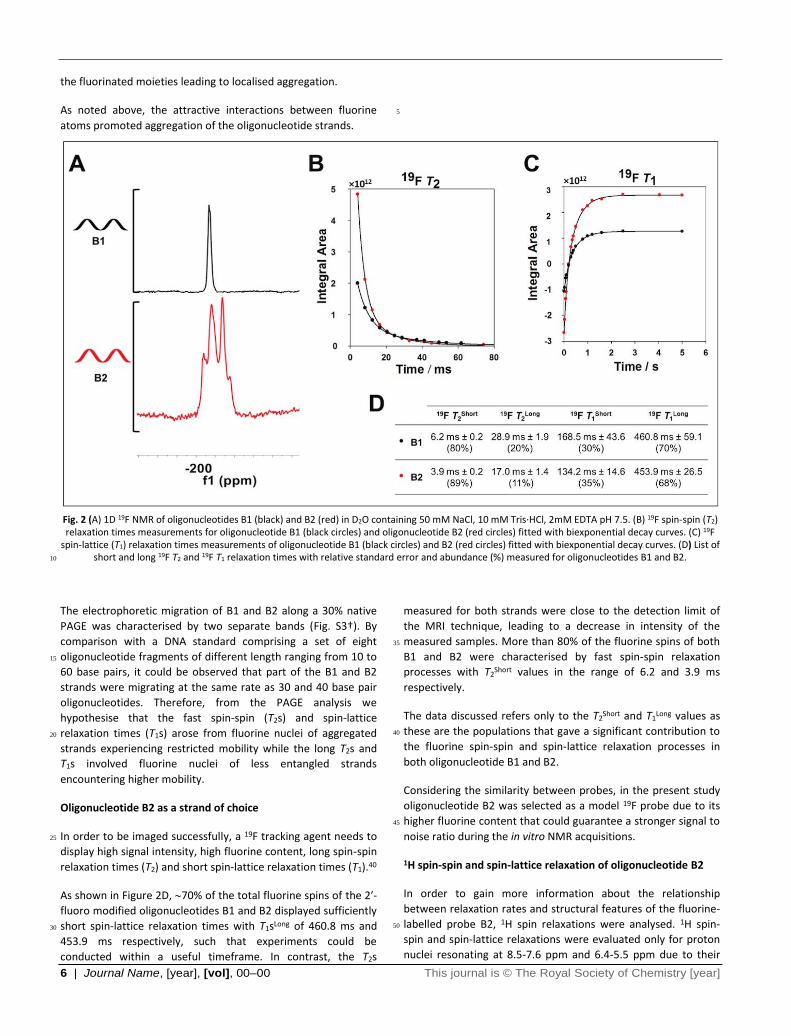
Fig. 3 (A) 1D 19F NMR spectra of oligonucleotide B2 (red), p(MAm-c-MAmA1B2) (black) and p(MAm-c-MamA1B2)+C (green). (B) 19F T2 and (C) 19F T1
relaxation times measuraments for oligonucleotide B2 (red filled circles), p(MAm-c-MAmA1B2) (black open circles) and p(Mam-c-MAmA1B2)+C (green filled circles) fitted with biexponential decay curves. (D) List of short and long 19F T2 and 19F T1 relaxation times with relative standard errors. The
percentage of 19F spins displaying short and long relaxation times is reported in brackets.
15
(T2Short = 2.9 ms). These observations were indicative of the fact
that the protons belonging to the long side chain represented by
the oligonucleotide A1 were experiencing a different local
mobility from the protons constituting the polymer backbone
(CH2 groups) and the methyl side chains. The 1H T2 is mainly 20
influenced by the dipole-dipole interactions of nuclear spins. As
described by Claridge et al.,31 the proton dipolar relaxation
mechanism has a strong distance dependence and is affected by
the motion of the polymer chain. Here, the short inter-nuclear
distances between the proton of the methylene and methyl 25
groups and the slow tumbling rate along the polymer backbone
enhanced the dipole-dipole relaxation and hence promoted
faster spin-spin relaxation processes that resulted in two broad
signals in the 1D 1H NMR spectrum (Figure S11†). In contrast, the
higher internuclear distance between the protons located on the 30
nucleobases resulted in longer spin-spin relaxation times.
Moreover, the different molecular mobility of the analysed
protons also had notable effects on the 1H spin-lattice
relaxations (T1). The oligonucleotide protons resonating at 8.5-
7.6 ppm and 6.4-5.5 ppm were characterised by long T1s in the 35
range of 1.7-1.8 s. In contrast, the proton of methylene and
methyl groups forming the polymer backbone were
characterised by fast spin-lattice relaxation processes with T1
values in the range of 652.8 – 631.6 ms.
1H diffusion analysis of p(MAm-c-MAmA1) 40
1H nuclei resonating at 8.5-7.6 ppm, 6.4-5.5 ppm, 2.0-1.6 ppm
and 1.4-0.8 ppm displayed similar self-diffusion coefficients in
the range of 6.4 - 6.7 × 10⁻¹⁰ m2s-1 (Figure S12†).
These data indicated that the entire polymer chains, with and
without DNA A1, were diffusing at the same rate. These results 45
were in agreement with the GPC and DLS data and hence gave
further confirmation of the low-dispersity of p(MAm-c-MAmA1).
Synthesis of p(MAm-c-MAmA1B2)
The poly(methacrylamide-co-methacrylamidyl oligonucleotide
A1B2) [p(MAm-c-MAmA1B2)] was produced by hybridization of 50
the 2′-fluoro modified strand B2 to the nucleic acid functionality
A1 of p(MAm-c-MAmA1) under standard conditions.
The oligonucleotide annealing ratio was screened via PAGE
This journal is © The Royal Society of Chemistry [year] Journal Name, [year], [vol], 00–00 | 9
analysis. As shown in Figure S13†, B2 and p(MAm-c-MAmA1)
were annealed at different DNA molar ratios of 1:1.3, 1:1.5 and
1:2 respectively. The electrophoretic migration along a 20%
native PAGE revealed the presence of traces of unbound strand
B2 (Figure S13†, dashed rectangle) in all the ratios screened. 5
Because the traces of unbound B2 resulted in bands of similar
intensity in all the samples analysed, the lower annealing ratio of
1:1.3 (B2: p(MAm-c-MAmA1) was selected as the standard
experimental
10
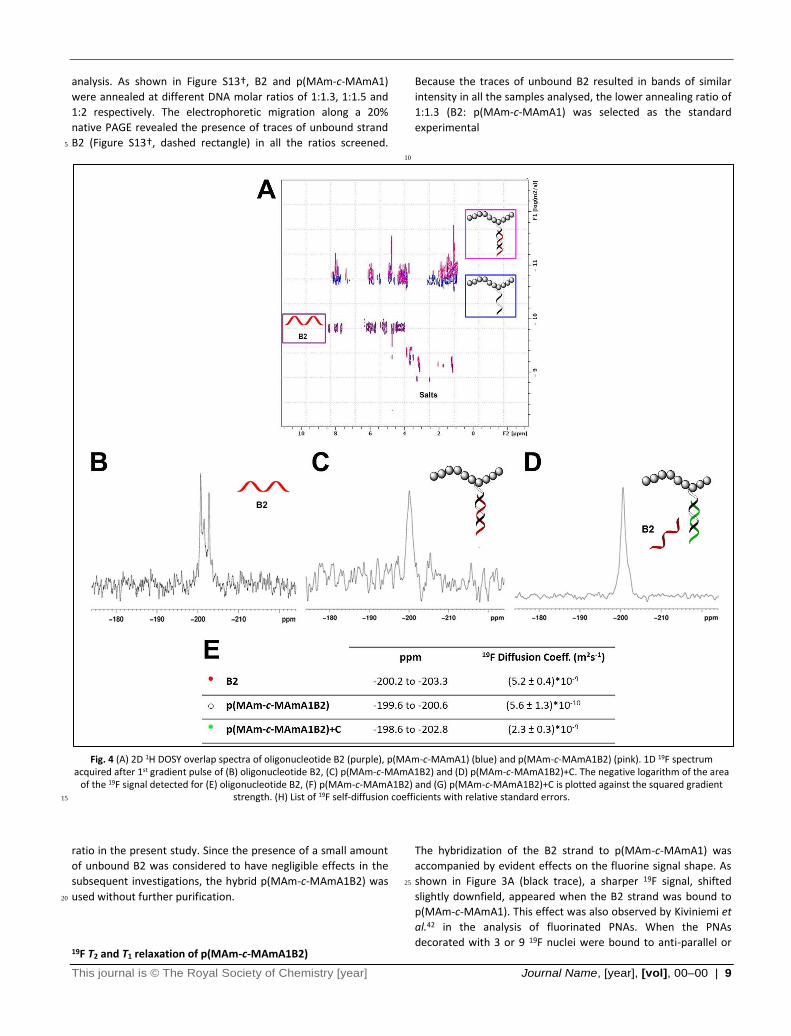
Fig. 4 (A) 2D 1H DOSY overlap spectra of oligonucleotide B2 (purple), p(MAm-c-MAmA1) (blue) and p(MAm-c-MAmA1B2) (pink). 1D 19F spectrum acquired after 1st gradient pulse of (B) oligonucleotide B2, (C) p(MAm-c-MAmA1B2) and (D) p(MAm-c-MAmA1B2)+C. The negative logarithm of the area
of the 19F signal detected for (E) oligonucleotide B2, (F) p(MAm-c-MAmA1B2) and (G) p(MAm-c-MAmA1B2)+C is plotted against the squared gradient strength. (H) List of 19F self-diffusion coefficients with relative standard errors. 15
ratio in the present study. Since the presence of a small amount
of unbound B2 was considered to have negligible effects in the
subsequent investigations, the hybrid p(MAm-c-MAmA1B2) was
used without further purification. 20
19F T2 and T1 relaxation of p(MAm-c-MAmA1B2)
The hybridization of the B2 strand to p(MAm-c-MAmA1) was
accompanied by evident effects on the fluorine signal shape. As
shown in Figure 3A (black trace), a sharper 19F signal, shifted 25
slightly downfield, appeared when the B2 strand was bound to
p(MAm-c-MAmA1). This effect was also observed by Kiviniemi et
al.42 in the analysis of fluorinated PNAs. When the PNAs
decorated with 3 or 9 19F nuclei were bound to anti-parallel or
10 | Journal Name, [year], [vol], 00–00 This journal is © The Royal Society of Chemistry [year]
parallel DNAs or RNAs a sharper signal appeared in the 19F
spectrum. Kiviniemi inferred the change in peak shape to the
formation of a more defined structure consequent to the
hybridization of complementary oligonucleotides. This highlights
the sensitivity of 19F nuclei to neighbouring groups, and also the 5
potential to extract far more information from acquired 19F NMR
spectra than just a change in intensity of the peak following a
switch. However, the hybridization of the 2′-fluoro modified
strand B2 to p(MAm-c-MAmA1) did not cause any significant
changes in the 19F spin-spin (T2) relaxation times (Fig. 3B). In 10
contrast, notable changes could be observed in the longitudinal
relaxation times T1. By comparison with the oligonucleotide B2,
88% of the total fluorine spins of the hybrid p(MAm-c-
MAmA1B2) displayed a longer spin-lattice relaxation time of ~
513 ms (Fig. 3C-D), providing a potential mechanism for probing 15
molecular hybridization changes through monitoring T1.
1H T2 and T1 relaxation analysis of p(MAm-c-MAmA1B2)
1H T2 and T1 relaxation times and relative decay curves were
analysed for protons belonging to the methyl side chains (CH3,
1.16-1.08 ppm) constituting the polymer backbone and the 20
protons located on the nucleobases of the oligonucleotide
duplex A1B2 (Fig. S14†).
Comparing the 1H T2 relaxation times of the hybrid p(MAm-c-
MAmA1B2) with the fluoro labelled probe B2 when free in
solution, significant changes could be observed for the 25
oligonucleotide protons. Specifically, the 1H T2 decreased to
about 72 ms and 87 ms for protons resonating at 8.5-7.6 ppm
and 6.4-5.5 ppm respectively. These results were a direct
consequence of conformational changes in the oligonucleotide
strands, with restricted molecular motion induced by the 30
formation of a more rigid double helix structure enhancing the 1H spin-spin relaxation (T2).
In contrast, the protons of methyl side chain did not undergo any
significant change, displaying values in the same range as those
observed for p(MAm-c-MAmA1) (Fig. S13†). These results were 35
in agreement with the values expected as the major relaxation
changes should only affect the oligonucleotide protons during
the hybridization process.
The binding of B2 to p(MAm-c-MAmA1) influenced also the
longitudinal relaxation times of the oligonucleotide 1H spins 40
causing a decrease of ~ 580 ms and ~ 330 ms of T1 for proton
resonating at 8.5-7.6 ppm and 6.4-5.5 ppm respectively.
1H and 19F self-diffusion coefficients of p(MAm-c-MAmA1B2)
Protons belonging either to the oligonucleotide nucleobases and
the methylene side chains of the hybrid p(MAm-c-MAmA1B2) 45
displayed similar self-diffusion coefficients in the range of 5.1 ×
10-10 m2 s-1 (Fig. S15†). As shown by the 2D 1H DOSY spectrum
reported in Figure 4A, the hybridised copolymer diffused at the
same rate as the polymeric platform p(MAm-c-MAmA1) and
approximately 10 times slower than the B2 strand. These data 50
confirmed the success of the hybridization process. Traces of
unbound strand B2 observed in the PAGE analysis could not be
detected in the 2D DOSY experiments due to their low
abundance.
Although the 19F spins seemed to diffuse at the same rate as the 55
protons with a self-diffusion coefficient of 5.6 × 10⁻¹⁰ m2 s–1, the 19F DOSY measurements resulted in a poor curve fitting (Fig.
S16† B) due to significant loss of signal intensity during the
analysis. As shown in Figure 4C, the 1D 19F NMR of p(MAm-c-
MAmA1B2) recorded after the 1st pulse gradient was 60
characterised by a low intensity signal. In contrast, the strand B2
when free in solution exhibited a good signal to noise ratio after
application of the 1st gradient pulse (Fig. 4B and Fig. S16† A).
These results were as a consequence of the change in 19F spin-
lattice relaxation times induced by the hybridization of the 65
fluorinated probe B2 to the polymer p(MAm-c-MAmA1).
Fluorine self-diffusion coefficients were measured using the
bipolar pulse pair longitudinal eddy current delay sequence
(BPP-LED)34 which has a strong dependence on longitudinal
relaxation (T1). As described by Claridge et al.,31 signal losses 70
generally occur in the presence of slow longitudinal relaxation
rates. Here, the hybrid p(MAm-c-MAmA1B2) displayed longer T1
relaxation times (19F T1Long = 513.4 ms; 88%) than the
oligonucleotide B2 (19F T1Long = 453.9 ms; 68%) that lead to
signal loss during the DOSY acquisition. Nonetheless, the DOSY 75
data clearly showed the potential of this technique for
monitoring hybridization and strand displacement in this system.
Strand displacement of p(MAm-c-MAmA1B2)
The ability of a target DNA strand C to displace the fluorinated
probe B2 from the hybrid p(MAm-c-MAmA1B2) could not be 80
evaluated by gel electrophoresis because the bands
corresponding to the fluorinated probe B2 and the target
sequence C migrated at the same rate (Fig. S17†). Therefore, the
hybrid p(MAm-c-MAmA1B2) was analysed by both 1H and 19F
NMR after 30 minutes incubation at room temperature with 1 85
molar equivalent of oligonucleotide C. The interpretation of 1H
T2, T1 relaxation times (Fig. S18†) and self-diffusion coefficients
(Fig. S19†) measured for the oligonucleotide protons resonating
at 8.5-7.6 ppm and 6.4-5.5 ppm was experimentally complex as
these regions contained overlapping signals from a mixture of 90
oligonucleotide strands such as B2, A1 and C. Therefore, the
relaxation and diffusion coefficients observed for the
oligonucleotide protons were average values reflecting the
molecular mobility of both single and double stranded
oligonucleotide species. 95
In contrast, 19F spin echo and DOSY experiments provided the
possibility to monitor the effects that the incubation of the
hybrid p(MAm-c-MAmA1) with the target DNA sequence C had
on the molecular mobility of the fluorinated probe B2 only. By
comparison with the hybrid p(MAm-c-MAmA1B2), the addition 100
of strand C significantly altered the peak shape of the fluorine
signal (Fig. 3 A, green trace), increased the percentage (Fig. 3, B-
D) of fluorine spins experiencing longer transverse relaxation
times (23 ms) from 8% to 50% and, importantly, promoted faster
longitudinal relaxation. The long 19F T1 component observed for 105
the hybrid p(MAm-c-MAmA1B2) decreased from 513.4 ms to
This journal is © The Royal Society of Chemistry [year] Journal Name, [year], [vol], 00–00 | 11
400 ms after addition of the target sequence C. These changes in
fluorine relaxivity were indicative of an increase in the molecular
mobility of B2 following displacement.
As shown in Figure 4 E, the fluorinated probe B2 was found to
diffuse 4 times faster than when bound to the hybrid p(MAm-c-5
MAmA1B2). Therefore, the fluorine Spin Echo and DOSY data
strongly suggested that the target sequence C was able to
displace the fluorinated probe from the polymeric platform
10
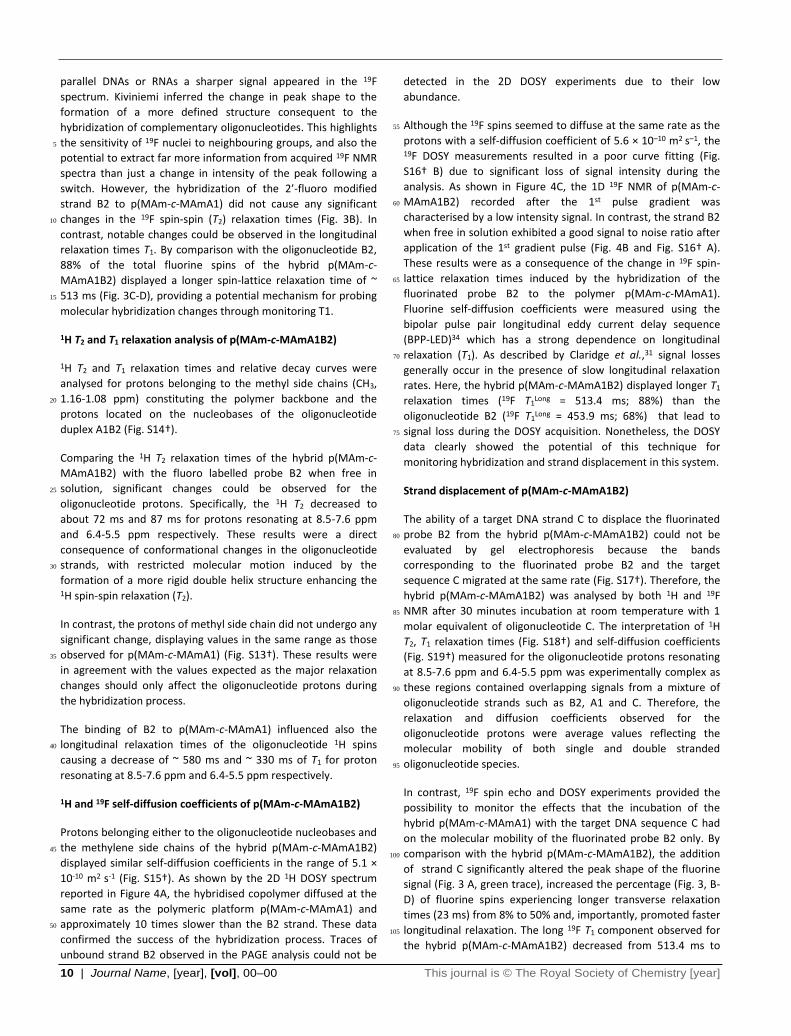
Fig. 5 (A) 30% native PAGE testing the strand displacement process in presence of a non-specific DNA strand D. Lanes: 1. B2, 2. p(MAm-c-MAmA1), 3. p(MAm-c-MAmA1B2) (1:1.3), 4. D, 5. p(MAm-c-MAmA1B2)D (1:1.3:1), 6. p(MAm-c-MAmA1B2)D (1:1.3:2). (B) Stacked plot of 1D 19F NMR spectra of
p(MAm-c-MAmA1B2) (black), p(MAm-c-MAmA1B2) after 30 min from the addition of 1 eq and 3 eq of strand D respectively (blue). (C) Stacked plot of 1D 19F NMR spectra of p(MAm-c-MAmA1B2) recorded after 30 min from the addition of D (3eq) (blue) and subsequent treatment with increasing
amount of strand C (green). 15
p(MAm-c-MAmA1). However, the fact that the strand B2 did not
(re)gain exactly the same mobility as when it was fully free in
solution, can be inferred to either temporary interactions
between the displaced strand B2 and the oligonucleotide species 20
present in solution or to a partial displacement of the fluorinated
probe. While this last hypothesis could have been probed
further by incubating the hybrid p(MAm-c-MAmA1B2) with a
larger excess of strand C, this experiment was not performed
due to the expected increase in sample viscosity induced by the 25
high DNA concentration that could affect spin echo and DOSY
experiments. Finally, the decrease of 19F T1 registered upon
addition of the strand C, improved the intensity of the 19F signal
during DOSY acquisition (Fig. 4D and Fig. S16† C). As shown in
Figure 4 B-D, the changes in 19F T1 observed for the hybrid 30
p(MAm-c-MAmA1B2) before and after addition of the target
DNA sequence C, constituted an apparent “off-on” signal switch
during the DOSY experiments. These data accordingly showed
the efficacy of the DOSY technique in probing nucleic acid
binding and recognition events. 35
Targeting strand selectivity of p(MAm-c-MAmA1B2)
In order to prove the ability of p(Mm-c-MAmA1B2) to respond
only to target oligonucleotides, the hybrid p(MAm-c-MAmA1B2)
was incubated with increasing concentration of a non-specific
DNA sequence D of the same length as the target DNA strand C 40
(Table 1). The strand selectivity of p(MAm-c-MAmA1B2) was
monitored by PAGE and 19F NMR.
In contrast to what was observed for oligonucleotide C, the non-
specific sequence D and the fluorine labelled probe B2 were
characterised by a different electrophoretic mobility that 45
enabled the investigation of strand selectivity by native PAGE. As
shown in Figure 5A, any traces of single stranded B2 could be
clearly detected in the hybrids p(MAm-c-MAmA1B2) incubated
with either 1 or 2 molar equivalent of D (Figure 5A, lanes 5 and
12 | Journal Name, [year], [vol], 00–00 This journal is © The Royal Society of Chemistry [year]
6). The PAGE analysis thus indicated that the strand D was
incapable of displacing the fluorinated probe from the hybrid
p(MAm-c-MAmA1B2). These results were further confirmed by 19F NMR. As shown in Figure 5B (blue traces), the addition of
increasing amount of strand D to the hybrid p(MAm-c-5
MAmA1B2) did not cause any significant change to either the
fluorine signal shape and chemical shift.
In order to prove the capability of p(MAm-c-MAmA1B2) to
respond only to target sequences even when surrounded by a
pool of non-specific oligonucleotides (in this case, strand D), the 10
hybrid p(MAm-c-MAmA1B2) was titrated with increasing
amounts of target DNA C after being incubated initially with 3
molar equivalents of strand D. As shown in Figure 5C (green
traces), the addition of strand D had a minimal effect on the 19F
spectrum, while the addition of C had an immediate effect on 15
the fluorine signal shape. Therefore, this experiment provided
evidence that the polymer nucleic acid conjugates respond
selectively to target oligonucleotide strands and more
importantly the ability of 19F NMR spectroscopy to probe nucleic
acid binding events even in complex mixtures (Figure 5C). 20
Conclusions
In this work, the synthesis of a novel 2′-fluoro modified nucleic
acid-polymer conjugate p(MAm-c-MAmA1B2) was described.
Furthermore, the capability of the hybrid conjugate to bind to
target oligonucleotide sequences was demonstrated via 2D Spin 25
Echo and DOSY 19F NMR spectroscopy.
An in depth analysis on the effects that nucleic acid binding
events have on fluorine relaxation and diffusivity was carried out
on the hybrid p(MAm-c-MAmA1B2) before and after incubation
with specific and non-specific DNA strands. The binding to target 30
DNA sequences occurring via toehold mediated strand
displacement process was demonstrated to alter significantly the
relaxivity and diffusivity of the fluorine labelled oligonucleotide
probe B2. These alterations resulted in measurable 19F T2 and T1
relaxation times and self-diffusion coefficients. On the basis of 35
the 19F Spin Echo and DOSY NMR results obtained, it is
reasonable to suggest that the 2′-fluoro modified nucleic acid-
polymer conjugate p(MAm-c-MAmA1B2) has some potential as
an in vitro NMR reporter of nucleic acids recognition and binding
events, but limited applicability as in vivo imaging agent due to 40
the low sensitivity of the magnetic resonance imaging technique
to fast fluorine transverse relaxation.
The fluorine signal to noise ratio can be improved either by increasing the number of scans or the concentration of the fluorine labelled oligonucleotide probes. Unfortunately, the first 45
approach requires long acquisition times and the second evokes cost penalties. Nonetheless, this report provides a potential route towards developing diagnostic probes for DNA strand displacement by 19F NMR. Importantly, the high sensitivity of the 19F nuclei to local environment provides a very powerful 50
technique for monitoring subtle changes in the displacement reaction and hence enables in situ observation of dynamic processes. This could be utilised in both in vitro and in vivo diagnostics and provides advantages over traditional FRET
approaches. The FRET method can require complex probe design 55
and is often characterized by poor conjugation efficiency of the FRET pair to oligonucleotide sequences. Importantly, when applied to in vivo diagnostics, FRET methods suffer from low tissue penetration depths (< 1cm) which lead to poor spatial resolution images. Accordingly, the use of fluorine NMR probes 60
offers the possibility to observe biomolecule binding phenomena in complex solutions and in tissue environments where specific disease markers may otherwise be undetectable.
Notes and references aSchool of Pharmacy, bSchool of Chemistry, University of Nottingham, 65
University Park, Nottingham, NG7 2RD. Fax: : 0115 951 5122; Tel: 0115 846 7678; E-mail: [email protected], [email protected].
c Department of Chemistry, Dainton Building, University of Sheffield, Sheffield, S3 7HF. 70
dAustralian Institute for Bioengineering and Nanotechnology and eCentre for Advanced Imaging, The University of Queensland, St Lucia, Queensland, 4072, Australia.
We thank the UK EPSRC (Grants EP/H005625/1, EP/G042462/1) and the University of Nottingham for a Scholarship (GS). KJT acknowledges the 75
Australian Research Council for funding (FT110100284, DP140100951) and is part of the Centre of Excellence in Convergent BioNano Science and Technology (CE140100036). We also thank Professor Chris Hayes (School of Chemistry, University of Nottingham) for assistance with DNA modification and Christine Grainger-Boultby, Tom Booth and Paul 80
Cooling for technical support.
† Electronic Supplementary Information (ESI) available: full experimental procedures and additional supporting figures are included in the supporting information. See DOI: 10.1039/b000000x/
85
1. M. Ye, J. Guillaume, Y. Liu, R. Sha, R. Wang, N. C. Seeman and J. W. Canary, Chemical Science, 2013, 4, 1319-1329.
2. C. K. McLaughlin, G. D. Hamblin and H. F. Sleiman, Chemical Society Reviews, 2011, 40, 5647-5656.
3. S. M. Douglas, H. Dietz, T. Liedl, B. Hogberg, F. Graf and W. 90
M. Shih, Nature, 2009, 459, 414-418. 4. E. S. Andersen, M. Dong, M. M. Nielsen, K. Jahn, R.
Subramani, W. Mamdouh, M. M. Golas, B. Sander, H. Stark,
C. L. P. Oliveira, J. S. Pedersen, V. Birkedal, F. Besenbacher, K. V. Gothelf and J. Kjems, Nature, 2009, 459, 73-76. 95
5. M. Endo, Y. Yang and H. Sugiyama, Biomaterials Science,
2013. 6. G. Zhang, S. P. Surwade, F. Zhou and H. Liu, Chemical
Society Reviews, 2013.
7. B. Chakraborty, N. Jonoska and N. C. Seeman, Chemical 100
Science, 2012, 3, 168-176.
8. P. J. Milnes, M. L. McKee, J. Bath, L. Song, E. Stulz, A. J.
Turberfield and R. K. O'Reilly, Chemical Communications, 2012, 48, 5614-5616.
9. Y.-X. Zhao, A. Shaw, X. Zeng, E. Benson, A. M. Nystrom and 105
B. Hogberg, Acs Nano, 2012, 6 8684–8691. 10. G. Yasayan, J. P. Magnusson, G. Sicilia, S. G. Spain, S. Allen,
M. C. Davies and C. Alexander, Physical Chemistry Chemical
Physics, 2013, 15, 16263-16274.
11. G. Sicilia, C. Grainger-Boultby, N. Francini, J. P. Magnusson, 110
A. O. Saeed, F. Fernandez-Trillo, S. G. Spain and C.
Alexander, Biomaterials Science, 2014, 2, 203-211. 12. Y. Murakami and M. Maeda, Biomacromolecules, 2005, 6,
2927-2929.
This journal is © The Royal Society of Chemistry [year] Journal Name, [year], [vol], 00–00 | 13
13. E. D. Goluch, J. M. Nam, D. G. Georganopoulou, T. N.
Chiesl, K. A. Shaikh, K. S. Ryu, A. E. Barron, C. A. Mirkin
and C. Liu, Lab Chip, 2006, 6, 1293-1299. 14. K. J. Watson, S. J. Park, J. H. Im, S. T. Nguyen and C. A.
Mirkin, Journal of the American Chemical Society, 2001, 123, 5
5592-5593. 15. J. P. Magnusson, F. Fernandez-Trillo, G. Sicilia, S. G. Spain
and C. Alexander, Nanoscale, 2014, 6, 2368-2374.
16. L. Josephson, J. M. Perez and R. Weissleder, Angewandte Chemie International Edition, 2001, 40, 3204-3206. 10
17. J. M. Perez, L. Josephson and R. Weissleder, ChemBioChem, 2004, 5, 261-264.
18. P. Liu, A. Sharon and C. K. Chu, Journal of fluorine
chemistry, 2008, 129, 743-766. 19. S. D. Warren, Journal of Medicinal Chemistry, 2009, 52, 15
6503-6503.
20. B. E. Rolfe, I. Blakey, O. Squires, H. Peng, N. R. B. Boase, C. Alexander, P. G. Parsons, G. M. Boyle, A. K. Whittaker and
K. J. Thurecht, Journal of the American Chemical Society,
2014, 136, 2413-2419. 20
21. M. Ogawa, S. Nitahara, H. Aoki, S. Ito, M. Narazaki and T.
Matsuda, Macromolecular Chemistry and Physics, 2010, 211,
1602-1609. 22. K. W. Pankiewicz, Carbohydrate research, 2000, 327, 87-105.
23. M. Olejniczak, Z. Gdaniec, A. Fischer, T. Grabarkiewicz, Ł. 25
Bielecki and R. W. Adamiak, Nucleic Acids Research, 2002, 30, 4241-4249.
24. J. C. Penedo, T. J. Wilson, S. D. Jayasena, A. Khvorova and
D. M. J. Lilley, RNA, 2004, 10, 880-888. 25. J. R. P. Arnold and J. Fisher, Journal of Biomolecular 30
Structure and Dynamics, 2000, 17, 843-856.
26. A. Kieger, M. J. Wiester, D. Procissi, T. B. Parrish, C. A. Mirkin and C. S. Thaxton, Small, 2011, 7, 1977-1981.
27. M. J. Damha, C. J. Wilds, A. Noronha, I. Brukner, G. Borkow,
D. Arion and M. A. Parniak, Journal of the American 35
Chemical Society, 1998, 120, 12976-12977.
28. T. Dowler, D. Bergeron, A.-L. Tedeschi, L. Paquet, N. Ferrari
and M. J. Damha, Nucleic Acids Res, 2006, 34, 1669-1675. 29. S. L. Beaucage and M. H. Caruthers, Tetrahedron Letters,
1981, 22, 1859-1862. 40
30. F. Wüthrich, NMR of Proteins and Nucleic Acids, 1st Edition edn., 1986.
31. T. D. W. Claridge, in Tetrahedron Organic Chemistry Series,
ed. D. W. C. Timothy, Elsevier, 2009, vol. Volume 27, pp. 11-34. 45
32. S. Z. Mao, X. D. Zhang, J. M. Dereppe and Y. R. Du, Colloid
Polym Sci, 2000, 278, 264-269. 33. G. Wider, Journal of Magnetic Resonance, Series A, 1994,
108, 255-258.
34. D. H. Wu, A. D. Chen and C. S. Johnson, Journal of Magnetic 50
Resonance, Series A, 1995, 115, 260-264.
35. S. J. Gibbs and C. S. Johnson Jr, Journal of Magnetic
Resonance (1969), 1991, 93, 395-402. 36. H. Peng, I. Blakey, B. Dargaville, F. Rasoul, S. Rose and A.
K. Whittaker, Biomacromolecules, 2009, 10, 374-381. 55
37. L. Nurmi, H. Peng, J. Seppala, D. M. Haddleton, I. Blakey and A. K. Whittaker, Polymer Chemistry, 2010, 1, 1039-1047.
38. J. F. Parsons, G. Xiao, G. L. Gilliland and R. N. Armstrong,
Biochemistry, 1998, 37, 6286-6294. 39. G. Xiao, J. F. Parsons, K. Tesh, R. N. Armstrong and G. L. 60
Gilliland, Journal of Molecular Biology, 1998, 281, 323-339. 40. R. E. Hendrick, Magnetic Resonance Imaging, 1987, 5, 31-37.
41. R. E. Banks and J. C. Tatlow, Journal of Fluorine chemistry,
1986, 33, 227-346. 42. A. Kiviniemi, M. Murtola, P. Ingman and P. Virta, The 65
Journal of Organic Chemistry, 2013, 78, 5153-5159.