sia snow sports participant study · sia/physical activity council 2013 participation study. all...
TRANSCRIPT

2012-2013
SIA SNOW SPORTS
PARTICIPANT STUDY

TABLE OF CONTENTS
Section Page Number
Participation Demographics 5
Gender and Age Demographics 27
Income and Education Demographics 38
Ethnic Demographics 54
Geographic Demographics 62
Cross Participation 73
Participation Trends 91
2
SIA/Physical Activity Council 2013 Participation Study. ALL RIGHTS RESERVED.

METHODOLOGY
• During January and February of 2013, a total of 42,356 online interviews were carried out with a nationwide sample of individuals and households from the US Online Panel of over one million people operated by Synovate/IPSOS. A total of 15,770 individual and 26,593 household surveys were completed. The total panel is maintained to be representative of the US population for people ages 6 and older. Over sampling of ethnic groups took place to boost response from typically under responding groups.
• The 2013 participation survey sample size of 42,356 completed interviews provides a high degree of statistical accuracy. All surveys are subject to some level of standard error — that is, the degree to which the results might differ from those obtained by a complete census of every person in the US. A sport with a participation rate of five percent has a confidence interval of plus or minus 0.21 percentage points at the 95 percent confidence level. This translates to plus or minus four percent of participants.
• A weighting technique was used to balance the data to reflect the total US population ages six and above. The following variables were used: gender, age, income, household size, region, population density and panel join date. The total population figure used was 287,138,000 people ages six and older.
• In this year’s report we have changed the definition of “inactivity.” In the past, we had included only those participants who report no activity in any of the 126 activities listed for the data year. This year we included 19 sports/fitness activities that require minimal to no physical exertion. We also added a “calorie burning” component.
• The results of this study were validated by correlation with retail data (SIA RetailTRAK™ produced by the Leisure Trends Group), sales and orders data (aggregated by Sports Marketing Services for SIA), and skier rider visit data (from the Kottke End of Season report produced by the National Ski Areas Association). The results of that validation exercise indicated that survey respondents were reporting activity for the current season when questioned about 2011. The participation data is therefore presented as activity for the 2012/2013 season in its entirety.
3
SIA/Physical Activity Council 2013 Participation Study. ALL RIGHTS RESERVED.

KEY FINDINGS
• The total number of participants across all six disciplines totaled 19,286,000 in 2012/2013, down
2%.
• Alpine skiers and snowboarders make up 49% of all snow sports participants.
• 54% of snow sports participants make more than $75K a year.
• Telemark skiers (avg. 13 days) and snowboarders (avg. 11.3 days) participated the most this
season.
• Snowshoeing is the most popular snow sport amongst women, representing 46% of snowshoers.
• Freeskiing is the most diverse snow sport, with minorities representing half of its participants.
• Over 39% of snowboarders are under age 24.
• 74% of snow sports participants are homeowners.
• 43% of snow sports participants are very interested in the winter Olympics.
• The majority of skiers (18%) and snowboarders (27%) live in the Pacific region.
4
SIA/Physical Activity Council 2013 Participation Study. ALL RIGHTS RESERVED.

PARTICIPATION DEMOGRAPHICS
5
SIA/Physical Activity Council 2013 Participation Study. ALL RIGHTS RESERVED.

SNOW SPORTS PARTICIPANT PROFILE
Average Age
13% ages 6-12, 10% ages 13-17, 17%
ages 18-24, 24% ages 25-34, 18% ages
35-44, 12% ages 45-54, 4% ages 55-64
and 2% ages 65+
Gender of Participants 62% Male, 38% Female
Percentage of participants currently in college or in possession of a
bachelor's degree or higher certification (i.e. PHD, M.D., J.D., etc.) 50%
Most Popular Snow Sport Activity Alpine Ski (8,243,000 participants)
State with most participants California
State with most participation per capita Maine
Total number of snow sports participants 19,286,000 (▼2%)
Total number that identify themselves as skier/riders/snowshoers
but did not participate in the 2011/12 season. 6.6M
Most common reasons for not participating No one to go with.
Most common non-snow sport crossover activity Walking for fitness
Household income above $75K per year 54%
6
SIA/Physical Activity Council 2013 Participation Study. ALL RIGHTS RESERVED.

ALPINE SKI PARTICIPANT PROFILE
Total Alpine Ski Participation 8,243,000 (▼19.2%)
Age 2% are ages 6-17, 57% are between 18-44, 16% are 45-
64 and 2% are 65+
Gender 60% Male, 40% Female
% with Household Income >$75k 63%
% of Core Alpine Skiers with Household Incomes >$100K 45%
Bachelor’s Degree or Higher 56%
States with the Most Alpine Ski Participants CA, NY, CO, TX, MN
% of Alpine Skiers that also Ride a Snowboard 17%
Avg. Price paid for Flat Skis (bindings sold separately) at
a Specialty Shop $420.24
Avg. Price paid for Ski Systems at a Specialty Shop $426.31
Avg. Price paid for Alpine Boots at a Specialty Shop $320.98
Avg. Number of Days Alpine Skiing in 2012/2013 7.6
7
*Note – Due to the timing of this year’s survey, alpine ski participation occurring after the first week in February was not counted in the total.
Snowfall patterns this season resulted in heavier participation in the late season, after this survey had been conducted. Retail sales data and
NSAA’s Kottke End of Season (skier/rider visits) report indicate that participation numbers were much healthier in the February to April time
frame missed by this year’s participation survey mitigating the reported decline in participation indicated by the data in this year’s survey. SIA/Physical Activity Council 2013 Participation Study. ALL RIGHTS RESERVED.

SNOWBOARD PARTICIPANT PROFILE
Total Snowboard Participation 7,351,000 (▼3%)
Age 29% are under 17, 51% ages 18-34, 19% between 35 and
54 and only 1% over age 55
Gender 67% Male, 33% Female
Bachelor’s Degree or Higher 42%
Avg. Price paid at Specialty for a Snowboard $307.96
Avg. Price paid at Specialty for Snowboard Boots $160.29
Avg. Price paid at Specialty for a Snowboard Bindings $148.22
States with the Most Snowboarders CA, NY, WA, CO, PA
Average Number of Days Riding 11.3
Percentage of Riders who also Alpine Ski 19%
Percentage of Snowboarders of Asian/Pacific Island Decent 10%
Percentage of Snowboarders of Hispanic Decent 9%
Percentage of Snowboarders of African American/Black
Decent 10%
Household Income Above $75K per Year 48%
8
*Note – Due to the timing of this year’s survey, snowboard participation occurring after the first week in February was not counted in the total.
Snowfall patterns this season resulted in heavier participation in the late season, after this survey had been conducted. Retail sales data and
NSAA’s Kottke End of Season (skier/rider visits) report indicate that participation numbers were much healthier in the February to April time
frame missed by this year’s participation survey mitigating the reported decline in participation indicated by the data in this year’s survey. SIA/Physical Activity Council 2013 Participation Study. ALL RIGHTS RESERVED.

CROSS COUNTRY PARTICIPANT PROFILE
9
Total Cross Country Ski Participation 3,307,000 (▼23%)
Age 33% are under age 24, 42% are between 25 and 44, 20%
ages 45-64 and 5% ages 65+
Gender 60% Male, 40% Female
% with Household Income >$75k 49%
Bachelor’s Degree or Higher 59%
% of XC Skiers that also Alpine Ski 41%
Where XC Skiers Participate Public Nordic Centers
Avg. Price paid for XC Skis at a Specialty Shop $170.43
Avg. Price paid for XC Boots at a Specialty Shop $119.37
Avg. Number of Days XC Skiing in 2012/2013 9.4
% of XC Skiers who are very interested in the Winter
Olympics 54%
SIA/Physical Activity Council 2013 Participation Study. ALL RIGHTS RESERVED.

FREESKI PARTICIPANT PROFILE
10
Total Freeski Participation 5,357,000 (▲47%)
Age 23% under 17, 50% between 18 and 34, 27% over age 35
Gender 64% Male, 36% Female
% with Household Income >$75k 60%
Bachelor’s Degree or Higher 49%
Percentage of Freeskiers of Asian/Pacific Island Decent 15%
Percentage of Freeskiers of Hispanic Decent 15%
Percentage of Freeskiers of African American/Black
Decent 18%
Regions with the Most Freeskiers Mid-Atlantic (25%) and Pacific (21%)
Percent who also Alpine Ski 42%
Avg. Price paid at Specialty for Twin-Tip Skis $420.74
Avg. Number of Days Freeskiing in 2012/2013 9.8
SIA/Physical Activity Council 2013 Participation Study. ALL RIGHTS RESERVED.

SNOWSHOE PARTICIPANT PROFILE
11
Total Snowshoe Participation 4,029,000 (▼2%)
Age 20% under 17, 39% 18-34, 29% 35-54 and 12% ages 55+
Gender 54% Male, 46% Female
% with Household Income >$75k 46%
Bachelor’s Degree or Higher 57%
Regions with the Most Snowshoe Participants Mid-Atlantic and Mountain (17%)
Avg. Price paid for Snowshoes at a Specialty Shop $131.88
Biggest Economic Concern Earning Less
Avg. Number of Days Snowshoeing in 2012/2013 9.2
SIA/Physical Activity Council 2013 Participation Study. ALL RIGHTS RESERVED.

TELEMARK PARTICIPANT PROFILE
12
Total Telemark Ski Participation 2,766,000 (▲32%)
Age 29% are under 17, 45% are between ages 18 and 35,
24% are ages 35-54, and 3% are ages 55+
Gender 61% Male, 39% Female
% with Household Income >$75k 51%
Bachelor’s Degree or Higher 54%
Region with the Most Telemark Skiers Mid-Atlantic (29%)
% of Telemark Skiers that also XC Ski 50%
Percentage of Telemark Skiers of Asian/Pacific Island
Decent 9%
Percentage of Telemark Skiers of Hispanic Decent 13%
Percentage of Telemark Skiers of African American/Black
Decent 21%
Avg. Number of Days Telemark Skiing in 2012/2013 13
SIA/Physical Activity Council 2013 Participation Study. ALL RIGHTS RESERVED.

BACKCOUNTRY SKIERS
Resort Backcountry Skiers
Age
23% between ages 6
and 24, 35% ages 25
to 34, 24% 35 to 44
and 18% over 45
Gender 76% Male, 24%
Female
Bachelor’s Degree or
Higher 59%
Region 30% Pacific, 17% West
North Central
Income over $75K 65%
Non-Resort Backcountry Skiers
13
Age
24% between 18 and
24, 36% ages 25 to 34,
17% 35 to 44 and 20%
over age 45
Gender 73% Male, 27%
Female
Bachelor’s Degree or
Higher 60%
Region 22% Pacific, 19% West
North Central
Income over $75K 60%
SIA/Physical Activity Council 2013 Participation Study. ALL RIGHTS RESERVED.

BACKCOUNTRY SNOWBOARDERS Resort Backcountry
Snowboarders
Age
11% under age 17,
21% between 18 and
24, 46% ages 25 to 34
and 22% over 35
Gender 68% Male, 32%
Female
Bachelor’s Degree or
Higher 55%
Region 27% Pacific, 20% Mid-
Atlantic
Income over $75K 56%
Non-Resort Backcountry
Snowboarders
14
Age
18% under 17, 22%
between 18 and 24,
45% ages 25 to 34 and
15% over 35
Gender 82% Male, 18%
Female
Bachelor’s Degree or
Higher 52%
Region 26% Mid-Atlantic, 17%
Pacific
Income over $75K 54%
SIA/Physical Activity Council 2013 Participation Study. ALL RIGHTS RESERVED.

SNOW SPORTS PARTICIPATION BY DISCIPLINE
15
0
1,000
2,000
3,000
4,000
5,000
6,000
7,000
8,000
9,000
Alpine Skiers Snowboarders Cross CountrySkiers
Freeskiers Snowshoers TelemarkSkiers
Participants 8,243 7,351 3,307 5,357 4,029 2,766
Part
icip
an
ts (
000's
)
SIA/Physical Activity Council 2013 Participation Study. ALL RIGHTS RESERVED.
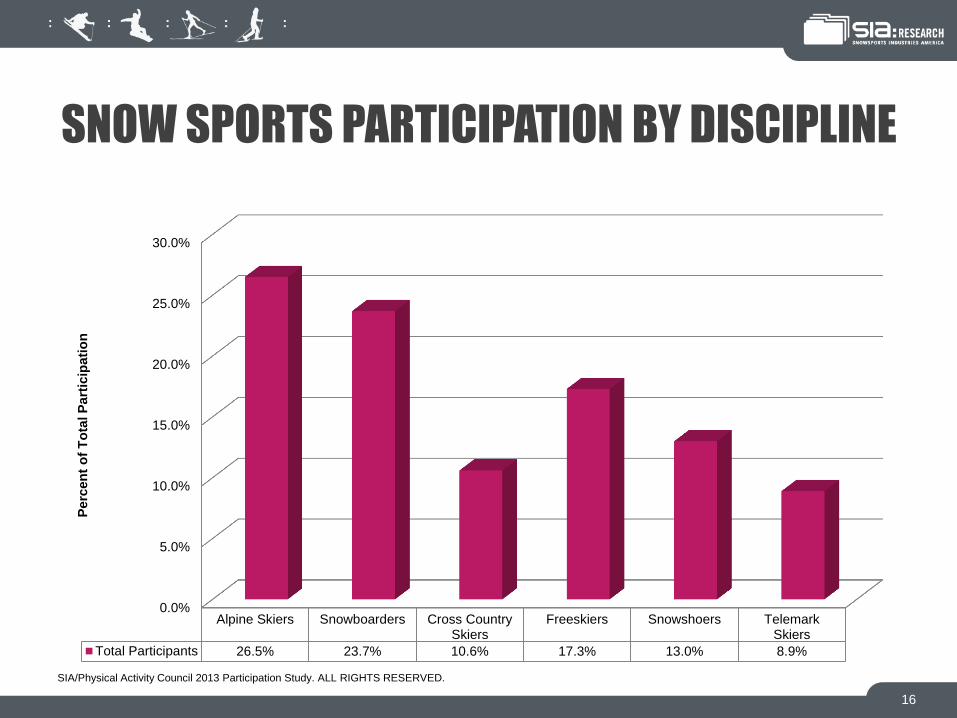
SNOW SPORTS PARTICIPATION BY DISCIPLINE
16
0.0%
5.0%
10.0%
15.0%
20.0%
25.0%
30.0%
Alpine Skiers Snowboarders Cross CountrySkiers
Freeskiers Snowshoers TelemarkSkiers
Total Participants 26.5% 23.7% 10.6% 17.3% 13.0% 8.9%
Perc
en
t o
f T
ota
l P
art
icip
ati
on
SIA/Physical Activity Council 2013 Participation Study. ALL RIGHTS RESERVED.
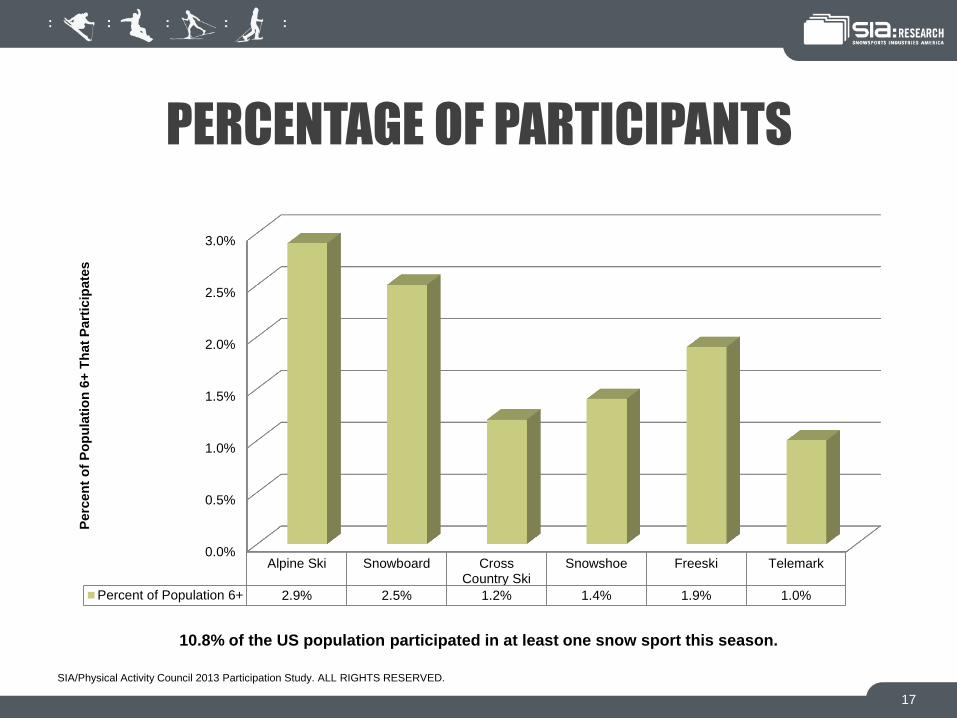
PERCENTAGE OF PARTICIPANTS
17
0.0%
0.5%
1.0%
1.5%
2.0%
2.5%
3.0%
Alpine Ski Snowboard CrossCountry Ski
Snowshoe Freeski Telemark
Percent of Population 6+ 2.9% 2.5% 1.2% 1.4% 1.9% 1.0%
Pe
rce
nt
of
Po
pu
lati
on
6+
Th
at
Pa
rtic
ipa
tes
SIA/Physical Activity Council 2013 Participation Study. ALL RIGHTS RESERVED.
10.8% of the US population participated in at least one snow sport this season.

SNOW SPORTS PARTICIPATION TRENDS BY DISCIPLINE
18
Alpine Ski SnowboardCross Country
SkiFreeski Snowshoe Telemark Ski
2008/2009 Season 10,346 7,159 3,848 2,711 4,922 1,435
2009/2010 Season 10,919 7,421 4,157 2,950 3,431 1,482
2010/2011 Season 11,504 8,196 4,530 3,647 3,823 1,821
2011/2012 Season 10,201 7,579 4,318 3,641 4,111 2,099
2012/2013 Season 8,243 7,351 3,307 5,357 4,029 2,766
0
2,000
4,000
6,000
8,000
10,000
12,000
14,000
Nu
mb
er
of
Part
icip
an
ts (
000's
)
SIA/Physical Activity Council 2013 Participation Study. ALL RIGHTS RESERVED.
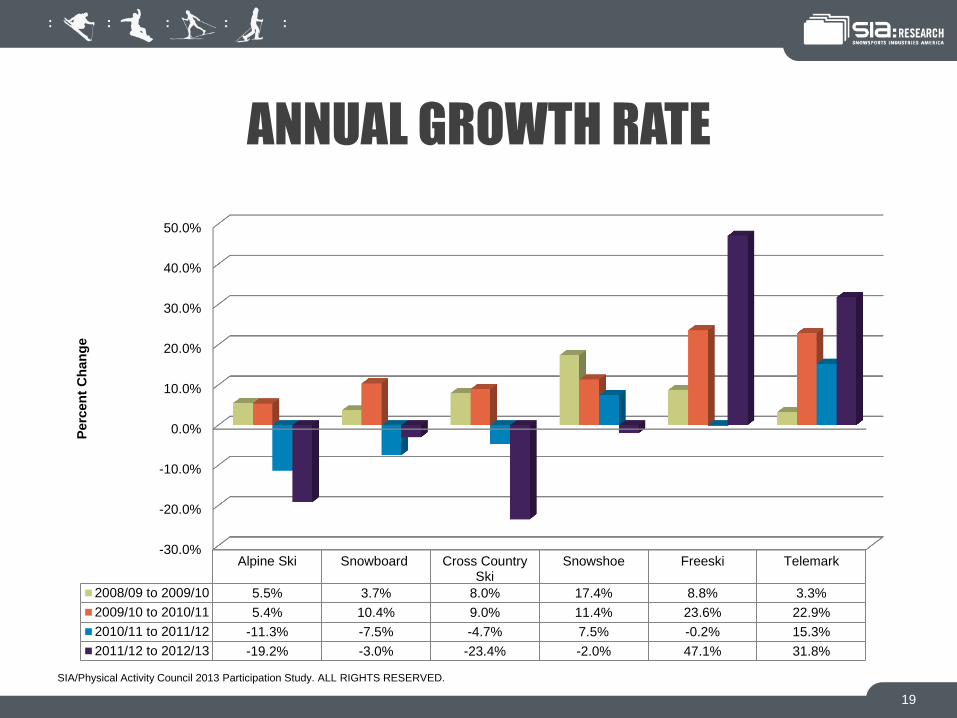
ANNUAL GROWTH RATE
19
-30.0%
-20.0%
-10.0%
0.0%
10.0%
20.0%
30.0%
40.0%
50.0%
Alpine Ski Snowboard Cross CountrySki
Snowshoe Freeski Telemark
2008/09 to 2009/10 5.5% 3.7% 8.0% 17.4% 8.8% 3.3%
2009/10 to 2010/11 5.4% 10.4% 9.0% 11.4% 23.6% 22.9%
2010/11 to 2011/12 -11.3% -7.5% -4.7% 7.5% -0.2% 15.3%
2011/12 to 2012/13 -19.2% -3.0% -23.4% -2.0% 47.1% 31.8%
Perc
en
t C
ha
ng
e
SIA/Physical Activity Council 2013 Participation Study. ALL RIGHTS RESERVED.
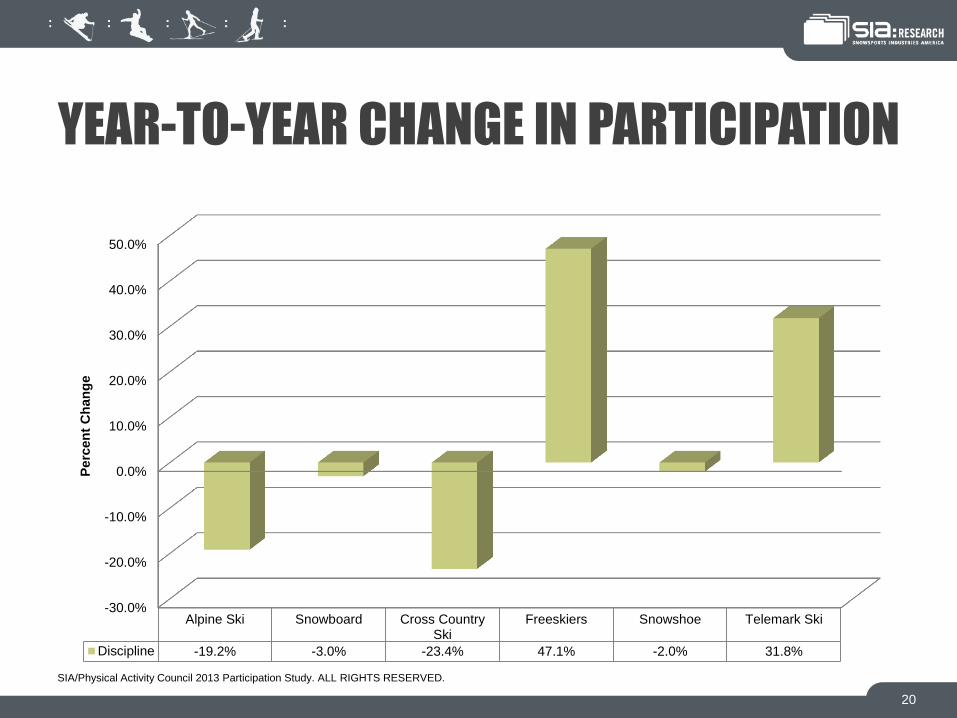
YEAR-TO-YEAR CHANGE IN PARTICIPATION
20
-30.0%
-20.0%
-10.0%
0.0%
10.0%
20.0%
30.0%
40.0%
50.0%
Alpine Ski Snowboard Cross CountrySki
Freeskiers Snowshoe Telemark Ski
Discipline -19.2% -3.0% -23.4% 47.1% -2.0% 31.8%
Perc
en
t C
han
ge
SIA/Physical Activity Council 2013 Participation Study. ALL RIGHTS RESERVED.

SINGLE AND MULTI-DISCIPLINE PARTICIPANTS
0
1,000
2,000
3,000
4,000
5,000
6,000
7,000
8,000
9,000
Alpine Skiers Snowboarders Cross CountrySkiers
Snowshoers FreestyleSkiers
TelemarkSkiers
Multi Discipline Participants 3,895 3,124 2,235 2,939 4,461 2,632
Single Discipline Participants 4,348 4,227 1,072 1,090 896 134
Part
icip
an
ts
21
SIA/Physical Activity Council 2013 Participation Study. ALL RIGHTS RESERVED.

SINGLE DISCIPLINE PARTICIPATION
0.0%
5.0%
10.0%
15.0%
20.0%
25.0%
30.0%
35.0%
40.0%
Alpine Skiers Snowboarders Cross CountrySkiers
Snowshoers FreestyleSkiers
TelemarkSkiers
Single Discipline Participants 37.0% 35.9% 9.1% 9.3% 7.6% 1.1%
Perc
en
t o
f T
ota
l P
art
icip
ati
on
22
SIA/Physical Activity Council 2013 Participation Study. ALL RIGHTS RESERVED.

AVERAGE NUMBER OF DAYS PARTICIPATED
23
Alpine Ski SnowboardCross Country
SkiFreeskiers Snowshoe Telemark Ski
Average Days Participated 7.6 11.3 9.4 9.8 9.2 13.0
0.0
2.0
4.0
6.0
8.0
10.0
12.0
14.0
Av
era
ge N
um
ber
of
Days
SIA/Physical Activity Council 2013 Participation Study. ALL RIGHTS RESERVED.

PARTICIPATION VS. NON-PARTICIPATION
19,286,000
6,614,000
Participants Considers Themselves Participants
Total projected participation for the 2012/2013 season was 19,286,000 people; 6,614,000 people consider themselves
skiers, riders and snowshoers but did not make it to the mountain this season.
24
SIA/Physical Activity Council 2013 Participation Study. ALL RIGHTS RESERVED.

REASONS FOR NOT PARTICIPATING
5.7%
7.4%
7.4%
8.9%
8.9%
11.5%
12.2%
13.4%
17.3%
18.9%
0.0% 2.0% 4.0% 6.0% 8.0% 10.0% 12.0% 14.0% 16.0% 18.0% 20.0%
Unfit
Ill Health
Don't Want to Get Injured
Prefer Other Sports/Vacation
Prefer Activities Closer to Home
Changed Residences
Poor Weather
Other
Age
No One to Go With
25
SIA/Physical Activity Council 2013 Participation Study. ALL RIGHTS RESERVED.

WHAT ENCOURAGES PARTICIPATION
HavingSomeone toTake Part
With
Tax Break onEquipmentand Fees
Availablity toParticipate in
myCommunity
NewEquipment
IntroductoryLesson/Outing
Having aFriend Take
Me Along
Having aFriend Instruct
me
Being inBetter Health
More VacationTime
Fewer WorkCommitments
Cross Country 61.9% 26.1% 24.8% 23.7% 23.2% 39.4% 25.9% 21.7% 29.0% 21.9%
Alpine 60.2% 25.2% 20.7% 20.8% 27.2% 41.8% 23.7% 17.4% 31.6% 25.9%
Freestyle 51.7% 30.9% 29.3% 42.5% 32.2% 38.7% 37.2% 24.3% 29.4% 23.2%
Snowboard 59.6% 23.9% 18.8% 24.1% 26.5% 42.0% 28.2% 23.1% 26.0% 24.0%
Snowshoe 65.6% 19.9% 26.3% 26.8% 29.6% 44.1% 31.7% 31.3% 26.9% 26.7%
Telemark 45.2% 30.3% 27.5% 23.3% 24.4% 38.9% 26.3% 24.4% 28.0% 15.3%
0.0%
10.0%
20.0%
30.0%
40.0%
50.0%
60.0%
70.0%
26
SIA/Physical Activity Council 2013 Participation Study. ALL RIGHTS RESERVED.

GENDER AND AGE DEMOGRAPHICS
27
SIA/Physical Activity Council 2013 Participation Study. ALL RIGHTS RESERVED.

GENDER DEMOGRAPHICS MALE VS. FEMALE BY DISCIPLINE
28
0.0%
10.0%
20.0%
30.0%
40.0%
50.0%
60.0%
70.0%
Cross Country Alpine Freeski Snowboard Snowshoe Telemark
Male 59.9% 59.9% 63.7% 67.4% 53.7% 61.3%
Female 40.1% 40.1% 36.3% 32.6% 46.3% 38.7%
Perc
en
t o
f T
ota
l P
art
icip
ati
on
SIA/Physical Activity Council 2013 Participation Study. ALL RIGHTS RESERVED.

AGE DEMOGRAPHICS SKI VS. SNOWBOARD
6~12 13~17 18~24 25~34 35~44 45~54 55~64 65+
Ski 12.8% 11.3% 15.1% 21.7% 20.4% 12.3% 4.1% 2.3%
Snowboard 12.4% 16.2% 24.6% 26.6% 14.2% 5.2% 0.6% 0.2%
0.0%
5.0%
10.0%
15.0%
20.0%
25.0%
30.0%
Perc
en
t o
f T
ota
l P
art
icip
ati
on
29
SIA/Physical Activity Council 2013 Participation Study. ALL RIGHTS RESERVED.

AGE DEMOGRAPHICS CROSS COUNTRY, FREESKI, SNOWSHOE & TELEMARK
30
6~12 13~17 18~24 25~34 35~44 45~54 55~64 65+
Cross Country 11.5% 5.7% 15.4% 25.6% 16.5% 13.4% 6.6% 5.3%
Freeski 13.2% 10.1% 21.6% 28.6% 15.3% 8.6% 2.3% 0.5%
Snowshoe 13.0% 6.9% 14.2% 25.1% 14.9% 13.7% 8.9% 3.3%
Telemark 12.8% 16.2% 20.3% 24.4% 14.3% 9.4% 1.7% 0.8%
0.0%
5.0%
10.0%
15.0%
20.0%
25.0%
30.0%
35.0%
Perc
en
t o
f T
ota
l P
art
icip
ati
on
SIA/Physical Activity Council 2013 Participation Study. ALL RIGHTS RESERVED.

AGE DEMOGRAPHICS CASUAL VS. CORE ALPINE SKIERS
6~12 13~17 18~24 25~34 35~44 45~54 55~64 65+
Casual 1+ Days 9.9% 5.2% 14.9% 36.3% 18.3% 10.7% 3.2% 1.4%
Core 9+ Days 16.3% 16.9% 12.4% 11.2% 16.7% 16.1% 6.8% 3.6%
0.0%
5.0%
10.0%
15.0%
20.0%
25.0%
30.0%
35.0%
40.0%
Perc
en
t o
f A
lpin
e P
art
icip
an
ts
31
SIA/Physical Activity Council 2013 Participation Study. ALL RIGHTS RESERVED.

AGE DEMOGRAPHICS CASUAL VS. CORE SNOWBOARDERS
6~12 13~17 18~24 25~34 35~44 45~54 55~64 65+
Casual 1+ Days 7.7% 7.4% 22.0% 42.9% 13.0% 4.1% 1.5% 1.5%
Core 9+ Days 19.1% 19.3% 24.1% 18.7% 11.2% 5.5% 2.1% 0.0%
0.0%
5.0%
10.0%
15.0%
20.0%
25.0%
30.0%
35.0%
40.0%
45.0%
50.0%
Perc
en
t o
f S
no
wb
oard
Part
icip
an
ts
32
SIA/Physical Activity Council 2013 Participation Study. ALL RIGHTS RESERVED.

AGE DEMOGRAPHICS MALE VS. FEMALE ALPINE SKIERS
6~12 13~17 18~24 25~34 35~44 45~54 55~64 65+
Male Alpine Skiers 10.4% 10.0% 13.6% 21.1% 22.1% 14.2% 5.9% 2.7%
Female Alpine Skiers 16.5% 13.2% 17.3% 22.6% 18.0% 9.3% 1.4% 1.7%
0.0%
5.0%
10.0%
15.0%
20.0%
25.0%
Perc
en
t o
f A
lpin
e P
art
icip
ati
on
33
SIA/Physical Activity Council 2013 Participation Study. ALL RIGHTS RESERVED.

AGE DEMOGRAPHICS MALE VS. FEMALE SNOWBOARDERS
6~12 13~17 18~24 25~34 35~44 45~54 55~64 65+
Male Snowboarders 12.8% 18.7% 21.7% 25.3% 14.1% 6.3% 0.8% 0.2%
Female Snowboarders 11.6% 11.0% 30.5% 29.2% 14.4% 2.9% 0.3% 0.1%
0.0%
5.0%
10.0%
15.0%
20.0%
25.0%
30.0%
35.0%
Perc
en
t o
f S
no
wb
oard
Part
icip
ati
on
34
SIA/Physical Activity Council 2013 Participation Study. ALL RIGHTS RESERVED.

AGE DEMOGRAPHICS MALE VS. FEMALE CROSS COUNTRY SKIERS
6~12 13~17 18~24 25~34 35~44 45~54 55~64 65+
Male XC Skiers 11.1% 5.2% 13.4% 25.9% 19.1% 12.8% 7.3% 5.1%
Female XC Skiers 12.0% 6.4% 18.4% 25.1% 12.5% 14.4% 5.6% 5.6%
0.0%
5.0%
10.0%
15.0%
20.0%
25.0%
30.0%
Perc
en
t o
f C
ross C
ou
ntr
y P
art
icip
ati
on
35
SIA/Physical Activity Council 2013 Participation Study. ALL RIGHTS RESERVED.

AGE DEMOGRAPHICS MALE VS. FEMALE FREESKIERS
36
6~12 13~17 18~24 25~34 35~44 45~54 55~64 65+
Male Freeskiers 12.6% 10.4% 19.2% 28.4% 15.8% 10.3% 2.6% 0.8%
Female Freeskiers 14.3% 9.4% 25.8% 28.9% 14.4% 5.5% 1.7% 0.0%
0.0%
5.0%
10.0%
15.0%
20.0%
25.0%
30.0%
35.0%
Perc
en
t o
f F
reeski
Part
icip
ati
on
SIA/Physical Activity Council 2013 Participation Study. ALL RIGHTS RESERVED.
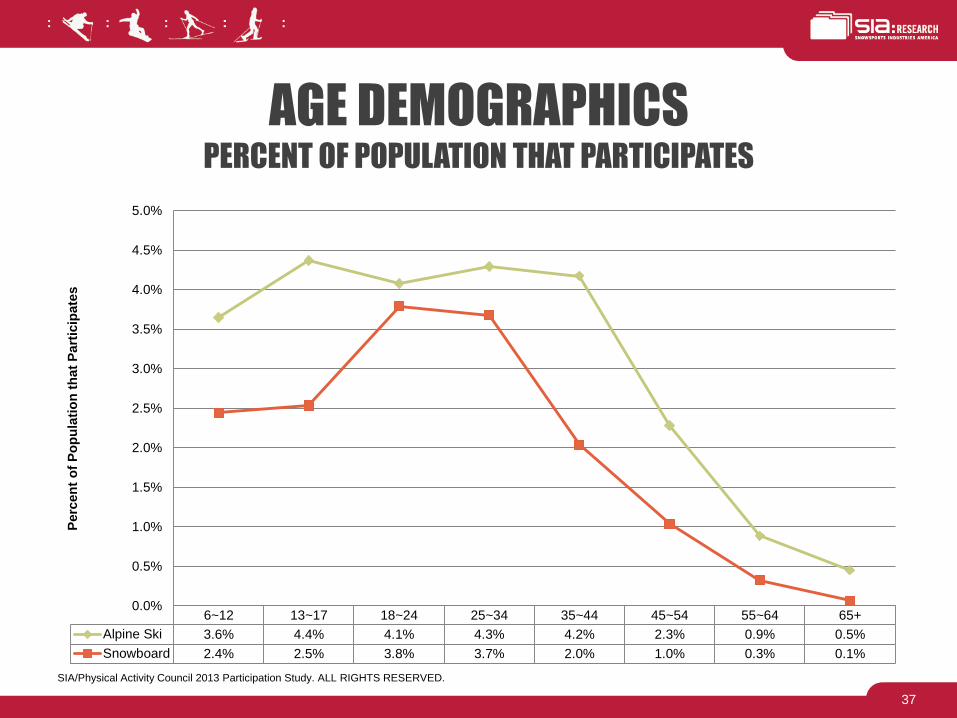
AGE DEMOGRAPHICS PERCENT OF POPULATION THAT PARTICIPATES
6~12 13~17 18~24 25~34 35~44 45~54 55~64 65+
Alpine Ski 3.6% 4.4% 4.1% 4.3% 4.2% 2.3% 0.9% 0.5%
Snowboard 2.4% 2.5% 3.8% 3.7% 2.0% 1.0% 0.3% 0.1%
0.0%
0.5%
1.0%
1.5%
2.0%
2.5%
3.0%
3.5%
4.0%
4.5%
5.0%
Perc
en
t o
f P
op
ula
tio
n t
hat
Part
icip
ate
s
37
SIA/Physical Activity Council 2013 Participation Study. ALL RIGHTS RESERVED.

INCOME AND EDUCATION DEMOGRAPHICS
38
SIA/Physical Activity Council 2013 Participation Study. ALL RIGHTS RESERVED.

INCOME DEMOGRAPHICS ALPINE VS. SNOWBOARD
Under $25,000 $25,000 to $49,999 $50,000 to $74,999 $75,000 to $99,999 $100,000+
Ski 6.7% 14.6% 15.7% 17.0% 46.1%
Snowboard 17.9% 17.5% 16.7% 12.1% 35.7%
0.0%
5.0%
10.0%
15.0%
20.0%
25.0%
30.0%
35.0%
40.0%
45.0%
50.0%
Perc
en
t o
f T
ota
l P
art
icip
ati
on
39
SIA/Physical Activity Council 2013 Participation Study. ALL RIGHTS RESERVED.
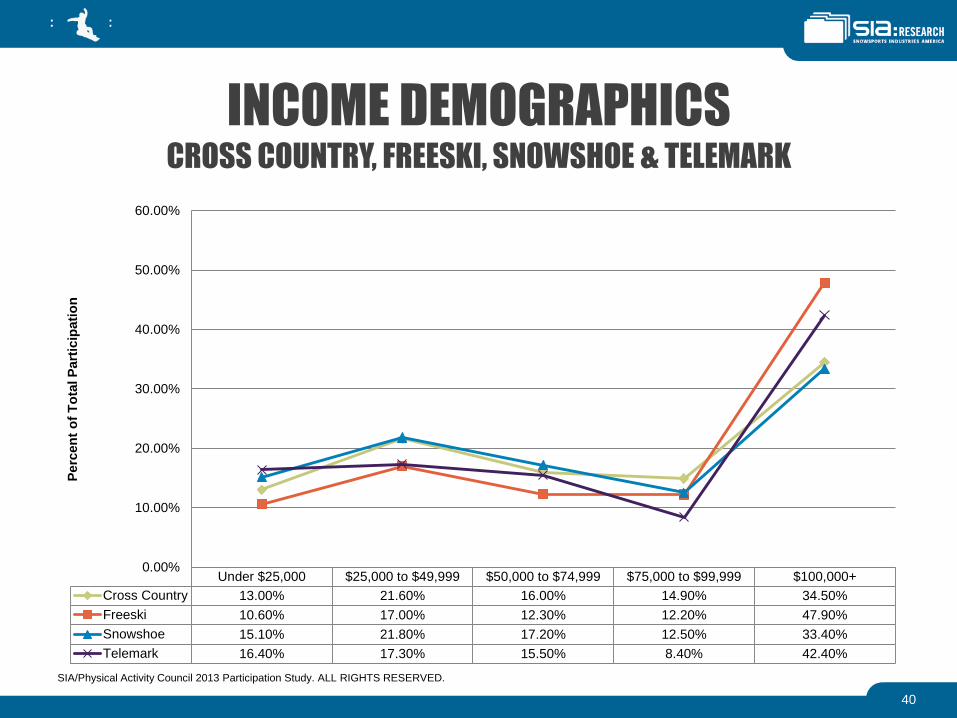
INCOME DEMOGRAPHICS CROSS COUNTRY, FREESKI, SNOWSHOE & TELEMARK
40
Under $25,000 $25,000 to $49,999 $50,000 to $74,999 $75,000 to $99,999 $100,000+
Cross Country 13.00% 21.60% 16.00% 14.90% 34.50%
Freeski 10.60% 17.00% 12.30% 12.20% 47.90%
Snowshoe 15.10% 21.80% 17.20% 12.50% 33.40%
Telemark 16.40% 17.30% 15.50% 8.40% 42.40%
0.00%
10.00%
20.00%
30.00%
40.00%
50.00%
60.00%
Perc
en
t o
f T
ota
l P
art
icip
ati
on
SIA/Physical Activity Council 2013 Participation Study. ALL RIGHTS RESERVED.

INCOME DEMOGRAPHICS CASUAL VS. CORE ALPINE SKIERS
Under $25,000 $25,000 to $49,999 $50,000 to $74,999 $75,000 to $99,999 $100,000+
Casual 1+ Days 9.4% 19.9% 15.9% 11.8% 42.9%
Core 9+ Days 13.8% 12.2% 16.7% 12.5% 44.8%
0.0%
5.0%
10.0%
15.0%
20.0%
25.0%
30.0%
35.0%
40.0%
45.0%
50.0%
Perc
en
t o
f A
lpin
e P
art
icip
ati
on
41
SIA/Physical Activity Council 2013 Participation Study. ALL RIGHTS RESERVED.
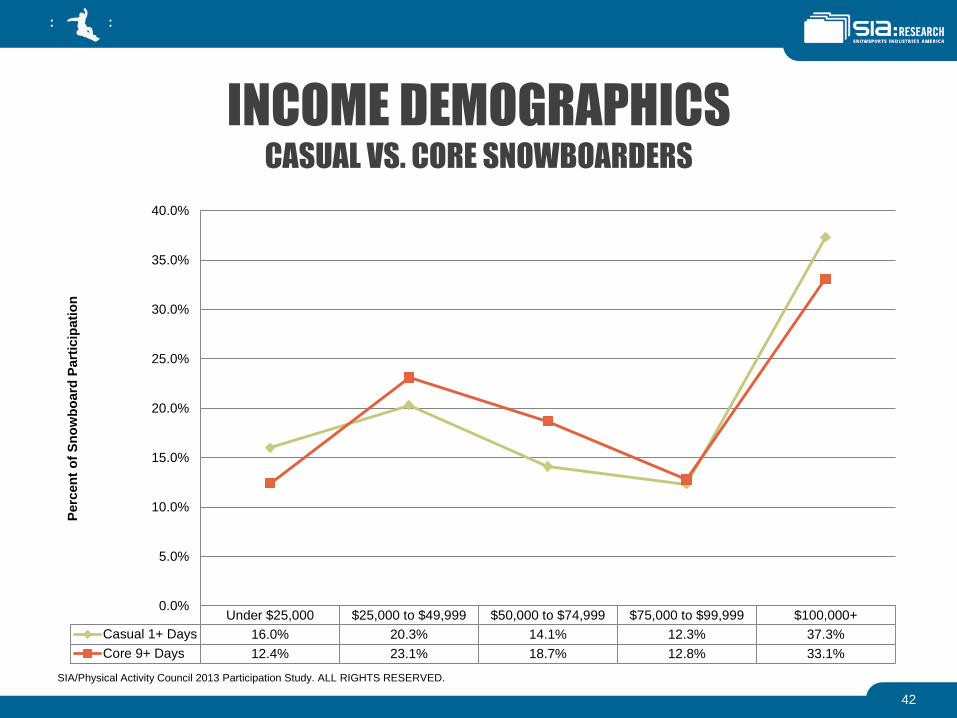
INCOME DEMOGRAPHICS CASUAL VS. CORE SNOWBOARDERS
Under $25,000 $25,000 to $49,999 $50,000 to $74,999 $75,000 to $99,999 $100,000+
Casual 1+ Days 16.0% 20.3% 14.1% 12.3% 37.3%
Core 9+ Days 12.4% 23.1% 18.7% 12.8% 33.1%
0.0%
5.0%
10.0%
15.0%
20.0%
25.0%
30.0%
35.0%
40.0%
Perc
en
t o
f S
no
wb
oard
Part
icip
ati
on
42
SIA/Physical Activity Council 2013 Participation Study. ALL RIGHTS RESERVED.

INCOME DEMOGRAPHICS MALE VS. FEMALE ALPINE SKIERS
0.00%
5.00%
10.00%
15.00%
20.00%
25.00%
30.00%
35.00%
40.00%
45.00%
50.00%
Under $25,000 $25,000 to$49,999
$50,000 to$74,999
$75,000 to$99,999
$100,000+
Male Alpine Skiers 7.50% 14.30% 15.40% 16.50% 46.30%
Female Alpine Skiers 5.30% 15.00% 16.20% 17.70% 45.70%
Perc
en
t o
f T
ota
l P
art
icip
ati
on
43
SIA/Physical Activity Council 2013 Participation Study. ALL RIGHTS RESERVED.

INCOME DEMOGRAPHICS MALE VS. FEMALE SNOWBOARDERS
0.0%
5.0%
10.0%
15.0%
20.0%
25.0%
30.0%
35.0%
40.0%
Under $25,000 $25,000 to$49,999
$50,000 to$74,999
$75,000 to$99,999
$100,000+
Male Snowboarders 19.3% 17.3% 15.5% 11.8% 36.0%
Female Snowboarders 15.0% 18.0% 19.3% 12.7% 34.9%
Perc
en
t o
f T
ota
l P
art
icip
ati
on
44
SIA/Physical Activity Council 2013 Participation Study. ALL RIGHTS RESERVED.

SNOW SPORTS SPENDING HABITS
45
More Same Less No spending
Cross Country 19.1% 57.7% 10.5% 12.7%
Alpine 23.7% 53.5% 11.7% 11.2%
Freeski 30.4% 42.5% 12.6% 14.5%
Snowboard 19.0% 52.1% 11.1% 17.7%
Snowshoe 20.9% 44.0% 8.7% 26.3%
Telemark 23.3% 57.6% 14.1% 5.0%
0.0%
10.0%
20.0%
30.0%
40.0%
50.0%
60.0%
70.0%
SIA/Physical Activity Council 2013 Participation Study. ALL RIGHTS RESERVED.

ECONOMIC CONCERNS
46
Recent JobLoss
ConcernedAbout
Potential JobLoss
Earning Less
Increase inMedical/
HealthcareExpenses
Increase inHouseholdExpenses
Buying a NewHome
Cutting Backon Non-
Essentials
Cutting Backon Dining/
Entertainment
Cutting Backon Donationsto Charities
None of theAbove
Cross Country 22.3% 18.3% 27.8% 20.3% 21.7% 15.7% 26.4% 27.2% 13.0% 28.3%
Alpine 9.8% 14.0% 22.8% 21.4% 21.5% 12.2% 30.6% 23.0% 12.5% 35.1%
Freeski 19.4% 27.4% 30.2% 30.4% 32.0% 18.9% 23.1% 21.4% 11.8% 26.0%
Snowboard 13.0% 12.6% 24.0% 14.7% 18.0% 11.8% 29.0% 22.8% 10.5% 38.4%
Snowshoe 13.9% 15.6% 38.3% 24.3% 23.0% 12.1% 33.8% 28.6% 15.9% 29.6%
Telemark 19.5% 21.9% 30.8% 28.9% 17.7% 34.3% 17.1% 17.5% 14.6% 19.3%
0.0%
5.0%
10.0%
15.0%
20.0%
25.0%
30.0%
35.0%
40.0%
45.0%
SIA/Physical Activity Council 2013 Participation Study. ALL RIGHTS RESERVED.

EDUCATION DEMOGRAPHICS ALPINE VS. SNOWBOARD
8th Grade orLess
1-3 Years ofHigh School
High SchoolGrad
1-3 YearsCollege
College GradPost-Grad
StudiesOther
Ski 15.2% 6.9% 6.1% 15.5% 34.4% 18.6% 3.2%
Snowboard 16.3% 9.9% 11.4% 20.7% 30.1% 8.8% 2.9%
0.0%
5.0%
10.0%
15.0%
20.0%
25.0%
30.0%
35.0%
40.0%
Perc
en
t o
f T
ota
l P
art
icip
ati
on
47
SIA/Physical Activity Council 2013 Participation Study. ALL RIGHTS RESERVED.
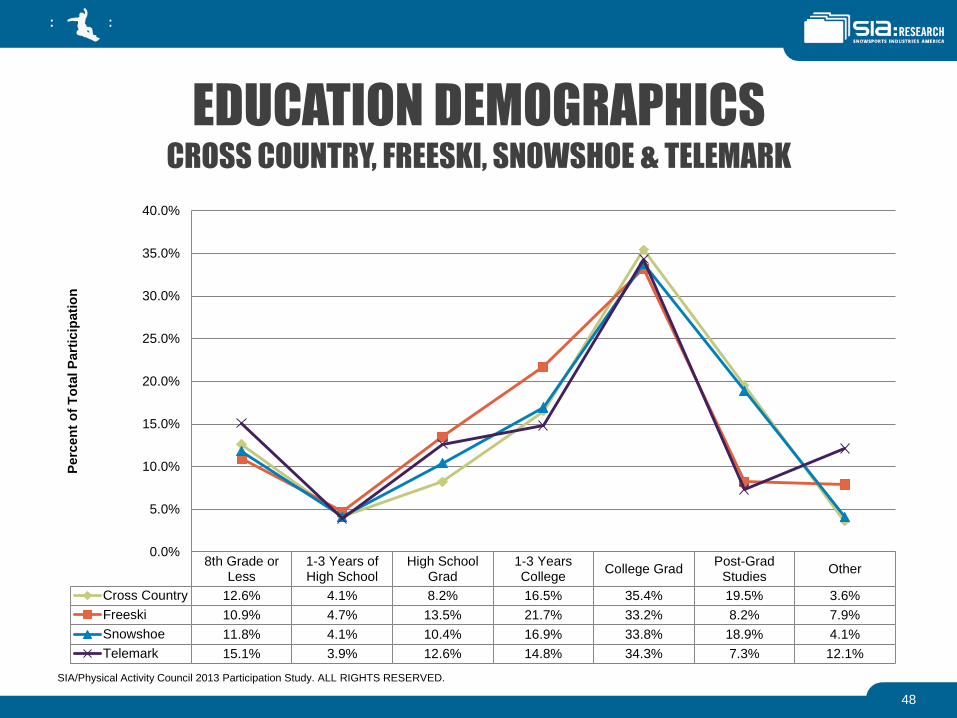
EDUCATION DEMOGRAPHICS CROSS COUNTRY, FREESKI, SNOWSHOE & TELEMARK
48
8th Grade orLess
1-3 Years ofHigh School
High SchoolGrad
1-3 YearsCollege
College GradPost-Grad
StudiesOther
Cross Country 12.6% 4.1% 8.2% 16.5% 35.4% 19.5% 3.6%
Freeski 10.9% 4.7% 13.5% 21.7% 33.2% 8.2% 7.9%
Snowshoe 11.8% 4.1% 10.4% 16.9% 33.8% 18.9% 4.1%
Telemark 15.1% 3.9% 12.6% 14.8% 34.3% 7.3% 12.1%
0.0%
5.0%
10.0%
15.0%
20.0%
25.0%
30.0%
35.0%
40.0%
Perc
en
t o
f T
ota
l P
art
icip
ati
on
SIA/Physical Activity Council 2013 Participation Study. ALL RIGHTS RESERVED.

EDUCATION DEMOGRAPHICS ALL SNOW SPORTS AGE 18+
49
8th Grade orLess
1-3 Years of HighSchool
High SchoolGrad
1-3 YearsCollege
College GradPost-Grad
Studies
Cross Country 4.0% 1.4% 8.6% 19.8% 42.8% 23.5%
Alpine 2.1% 1.0% 6.7% 20.3% 45.4% 24.6%
Freestyle 2.2% 1.0% 15.0% 27.8% 43.3% 10.7%
Snowboard 0.7% 2.2% 14.1% 28.6% 42.1% 12.3%
Snowshoe 1.4% 1.5% 11.1% 20.4% 42.1% 23.6%
Telemark 4.2% 4.3% 12.0% 20.8% 48.3% 10.3%
0.0%
10.0%
20.0%
30.0%
40.0%
50.0%
60.0%
Perc
en
t o
f P
art
icip
ati
on
SIA/Physical Activity Council 2013 Participation Study. ALL RIGHTS RESERVED.

EDUCATION DEMOGRAPHICS MALE VS. FEMALE ALPINE SKIERS
0.0%
5.0%
10.0%
15.0%
20.0%
25.0%
30.0%
35.0%
8th Gradeor Less
1-3 Years ofHigh School
High SchoolGrad
1-3 YearsCollege
CollegeGrad
Post-GradStudies
Other
Male Alpine Skiers 12.7% 6.2% 7.1% 16.5% 34.7% 19.1% 3.7%
Female Alpine Skiers 18.8% 8.1% 4.6% 14.1% 34.1% 17.9% 2.5%
Perc
en
t o
f T
ota
l P
art
icip
ati
on
50
SIA/Physical Activity Council 2013 Participation Study. ALL RIGHTS RESERVED.
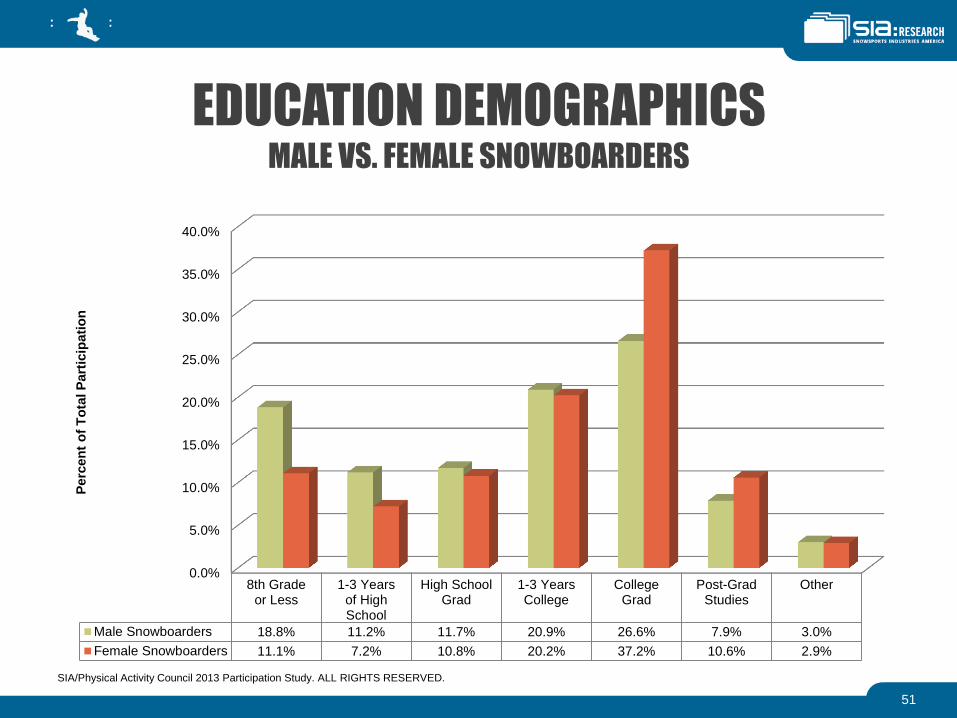
EDUCATION DEMOGRAPHICS MALE VS. FEMALE SNOWBOARDERS
0.0%
5.0%
10.0%
15.0%
20.0%
25.0%
30.0%
35.0%
40.0%
8th Gradeor Less
1-3 Yearsof HighSchool
High SchoolGrad
1-3 YearsCollege
CollegeGrad
Post-GradStudies
Other
Male Snowboarders 18.8% 11.2% 11.7% 20.9% 26.6% 7.9% 3.0%
Female Snowboarders 11.1% 7.2% 10.8% 20.2% 37.2% 10.6% 2.9%
Perc
en
t o
f T
ota
l P
art
icip
ati
on
51
SIA/Physical Activity Council 2013 Participation Study. ALL RIGHTS RESERVED.

EMPLOYMENT STATUS: ALL PARTICIPANTS
52
Work forsomeone else
full-time
Temporarilyunemployed
Self-employedWork for
someone elsepart-time
Retired andnot employed
Disabled andnot employed
Student andnot employed
Full-timehomemaker
and notemployed
Cross Country 44.8% 2.4% 7.4% 13.0% 5.6% 1.4% 18.5% 3.4%
Alpine 47.1% 3.9% 5.0% 6.9% 4.2% 0.7% 26.6% 3.6%
Freeski 53.5% 1.9% 5.3% 8.0% 1.6% 0.4% 19.6% 4.2%
Snowboard 38.7% 7.7% 4.8% 10.3% 0.7% 1.4% 31.3% 3.1%
Snowshoe 49.5% 3.2% 4.8% 5.7% 6.0% 0.5% 22.4% 4.2%
Telemark 49.1% 2.2% 6.6% 6.7% 1.9% 7.3% 11.7% 4.4%
0.0%
10.0%
20.0%
30.0%
40.0%
50.0%
60.0%
Perc
en
t o
f P
art
icip
an
ts
SIA/Physical Activity Council 2013 Participation Study. ALL RIGHTS RESERVED.

EMPLOYMENT STATUS: PARTICIPANTS 25+
53
Work forsomeone else
full-time
Temporarilyunemployed
Self-employedWork for
someone elsepart-time
Retired andnot employed
Disabled andnot employed
Student andnot employed
Full-timehomemaker
and notemployed
Cross Country 58.4% 2.6% 9.3% 11.3% 8.1% 2.0% 4.1% 4.2%
Alpine 66.3% 4.4% 7.5% 5.5% 6.8% 0.9% 3.1% 5.4%
Freeski 76.4% 2.3% 6.6% 6.8% 2.5% 0.0% 0.0% 5.4%
Snowboard 64.3% 9.3% 8.5% 7.5% 1.3% 0.5% 2.6% 5.9%
Snowshoe 61.2% 4.5% 6.6% 7.2% 9.1% 0.8% 4.8% 5.8%
Telemark 75.1% 2.7% 7.9% 7.1% 2.8% 0.0% 0.0% 4.4%
0.0%
10.0%
20.0%
30.0%
40.0%
50.0%
60.0%
70.0%
80.0%
90.0%
Perc
en
t o
f P
art
icip
an
ts
SIA/Physical Activity Council 2013 Participation Study. ALL RIGHTS RESERVED.

ETHNIC DEMOGRAPHICS
54
SIA/Physical Activity Council 2013 Participation Study. ALL RIGHTS RESERVED.

ETHNIC DEMOGRAPHICS: BY DISCIPLINE
55
AfricanAmerican/Black
Asian/Pacific IslanderCaucasian/White,
non-HispanicHispanic Other
Alpine 7.3% 10.6% 72.1% 5.9% 4.1%
Snowboard 10.2% 10.4% 67.1% 9.1% 3.2%
Cross Country 13.0% 7.3% 69.5% 4.9% 5.3%
Freeski 17.8% 15.2% 50.4% 14.6% 1.9%
Snowshoe 9.8% 5.7% 75.3% 6.7% 2.6%
Telemark 20.8% 8.9% 54.0% 13.1% 3.2%
0.0%
10.0%
20.0%
30.0%
40.0%
50.0%
60.0%
70.0%
80.0%
Perc
en
t o
f T
ota
l P
art
icip
ati
on
SIA/Physical Activity Council 2013 Participation Study. ALL RIGHTS RESERVED.

ETHNIC DEMOGRAPHICS
66%
12%
10%
9%
3%
Caucasian/White, Non-Hispanic
Asian/Pacific Islander
Hispanic
African American/Black
Other
56
SIA/Physical Activity Council 2013 Participation Study. ALL RIGHTS RESERVED.

YEAR-TO-YEAR CHANGE IN ETHNICITY: ALPINE SKI
0%
10%
20%
30%
40%
50%
60%
70%
80%
90%
Caucasian/White,non-Hispanic
Asian/PacificIslander
Hispanic AfricanAmerican/Black
Other
Alpine 2009/10 81% 9% 6% 2% 2%
Alpine 2010/11 71% 12% 10% 5% 3%
Alpine 2011/12 80% 9% 6% 3% 3%
Alpine 2012/13 72% 11% 6% 7% 4%
Four-Year Average 76% 10% 7% 4% 3%
Perc
en
t o
f A
lpin
e S
kie
rs
57
SIA/Physical Activity Council 2013 Participation Study. ALL RIGHTS RESERVED.
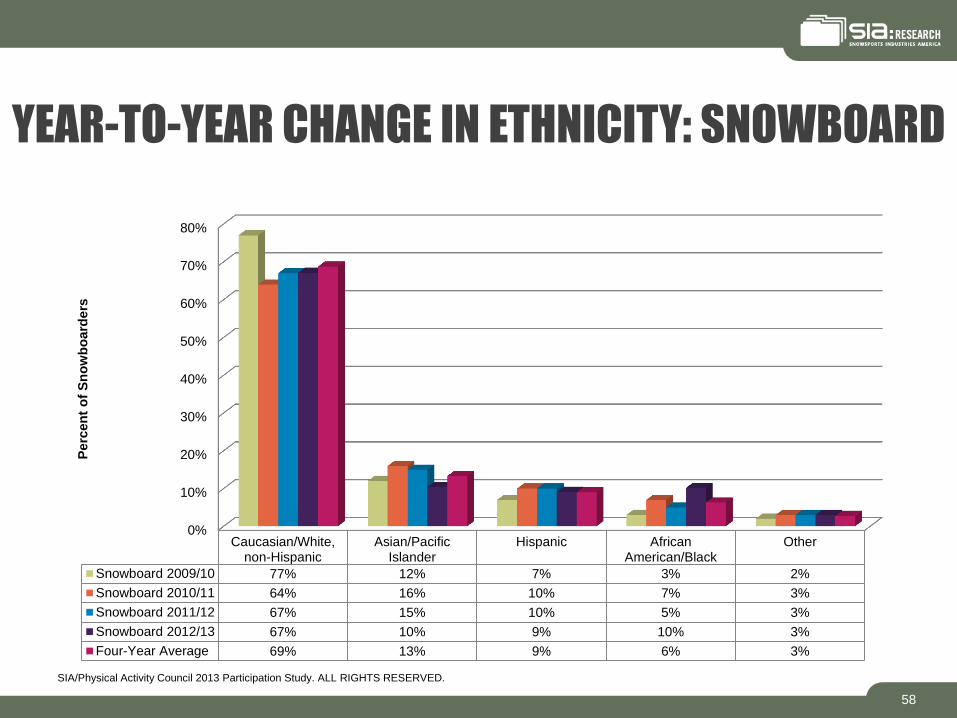
YEAR-TO-YEAR CHANGE IN ETHNICITY: SNOWBOARD
0%
10%
20%
30%
40%
50%
60%
70%
80%
Caucasian/White,non-Hispanic
Asian/PacificIslander
Hispanic AfricanAmerican/Black
Other
Snowboard 2009/10 77% 12% 7% 3% 2%
Snowboard 2010/11 64% 16% 10% 7% 3%
Snowboard 2011/12 67% 15% 10% 5% 3%
Snowboard 2012/13 67% 10% 9% 10% 3%
Four-Year Average 69% 13% 9% 6% 3%
Perc
en
t o
f S
no
wb
oard
ers
58
SIA/Physical Activity Council 2013 Participation Study. ALL RIGHTS RESERVED.

YEAR-TO-YEAR CHANGE IN ETHNICITY:
CROSS COUNTRY SKI
0%
10%
20%
30%
40%
50%
60%
70%
80%
Caucasian/White,non-Hispanic
Asian/PacificIslander
Hispanic AfricanAmerican/Black
Other
Cross Country 2009/10 79% 11% 4% 3% 4%
Cross Country 2010/11 68% 11% 9% 9% 4%
Cross Country 2011/12 74% 11% 8% 4% 3%
Cross Country 2012/13 70% 7% 5% 13% 5%
Four-Year Average 73% 10% 7% 7% 4%
Perc
en
t o
f C
ross C
ou
ntr
y S
kie
rs
59
SIA/Physical Activity Council 2013 Participation Study. ALL RIGHTS RESERVED.
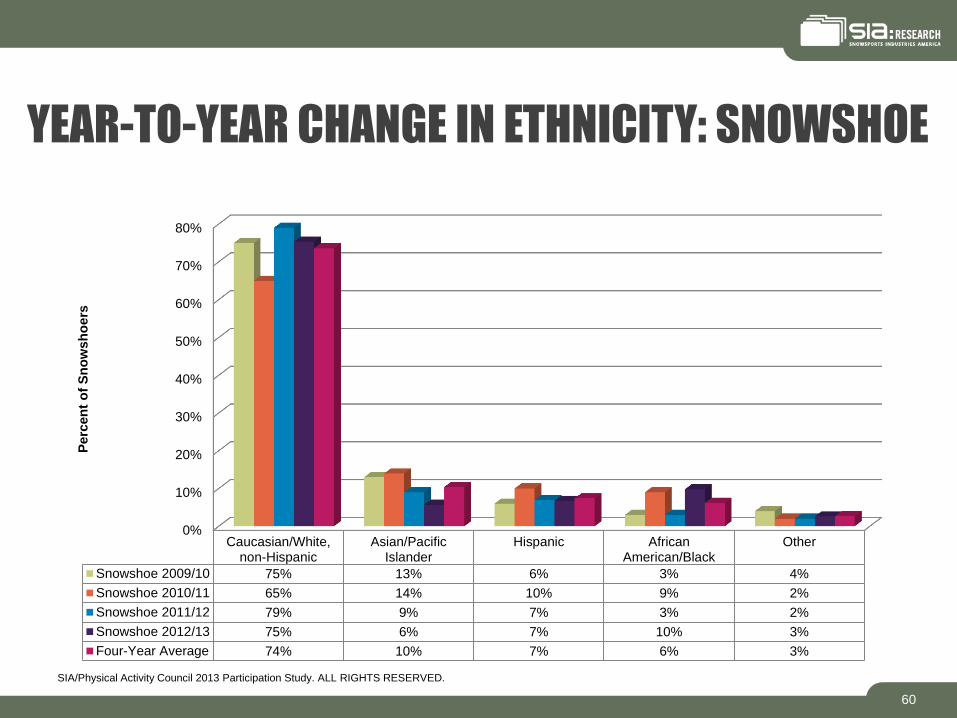
YEAR-TO-YEAR CHANGE IN ETHNICITY: SNOWSHOE
0%
10%
20%
30%
40%
50%
60%
70%
80%
Caucasian/White,non-Hispanic
Asian/PacificIslander
Hispanic AfricanAmerican/Black
Other
Snowshoe 2009/10 75% 13% 6% 3% 4%
Snowshoe 2010/11 65% 14% 10% 9% 2%
Snowshoe 2011/12 79% 9% 7% 3% 2%
Snowshoe 2012/13 75% 6% 7% 10% 3%
Four-Year Average 74% 10% 7% 6% 3%
Perc
en
t o
f S
no
wsh
oers
60
SIA/Physical Activity Council 2013 Participation Study. ALL RIGHTS RESERVED.

YEAR-TO-YEAR CHANGE IN ETHNICITY: FREESKI
61
0%
10%
20%
30%
40%
50%
60%
70%
Caucasian/White,non-Hispanic
Asian/PacificIslander
Hispanic AfricanAmerican/Black
Other
Freeski 2009/10 64% 18% 10% 6% 2%
Freeski 2010/11 53% 16% 14% 15% 2%
Freeski 2011/12 65% 18% 9% 7% 2%
Freeski 2012/13 50% 15% 15% 18% 2%
Four-Year Average 58% 17% 12% 12% 2%
Perc
en
t o
f F
reesty
le S
kie
rs
SIA/Physical Activity Council 2013 Participation Study. ALL RIGHTS RESERVED.
GEOGRAPHIC DEMOGRAPHICS
62
SIA/Physical Activity Council 2013 Participation Study. ALL RIGHTS RESERVED.

GEOGRAPHIC DEMOGRAPHICS ALPINE VS. SNOWBOARD
0.0%
5.0%
10.0%
15.0%
20.0%
25.0%
30.0%
NewEngland
MiddleAtlantic
East NorthCentral
WestNorth
Central
SouthAtlantic
EastSouth
Central
WestSouth
Central
Mountain Pacific
Ski 8.5% 15.6% 12.8% 7.8% 11.0% 3.6% 7.3% 15.8% 17.6%
Snowboard 7.4% 16.3% 14.4% 7.2% 10.7% 1.7% 4.5% 11.1% 26.8%
Perc
en
t o
f T
ota
l P
art
icip
ati
on
63
SIA/Physical Activity Council 2013 Participation Study. ALL RIGHTS RESERVED.
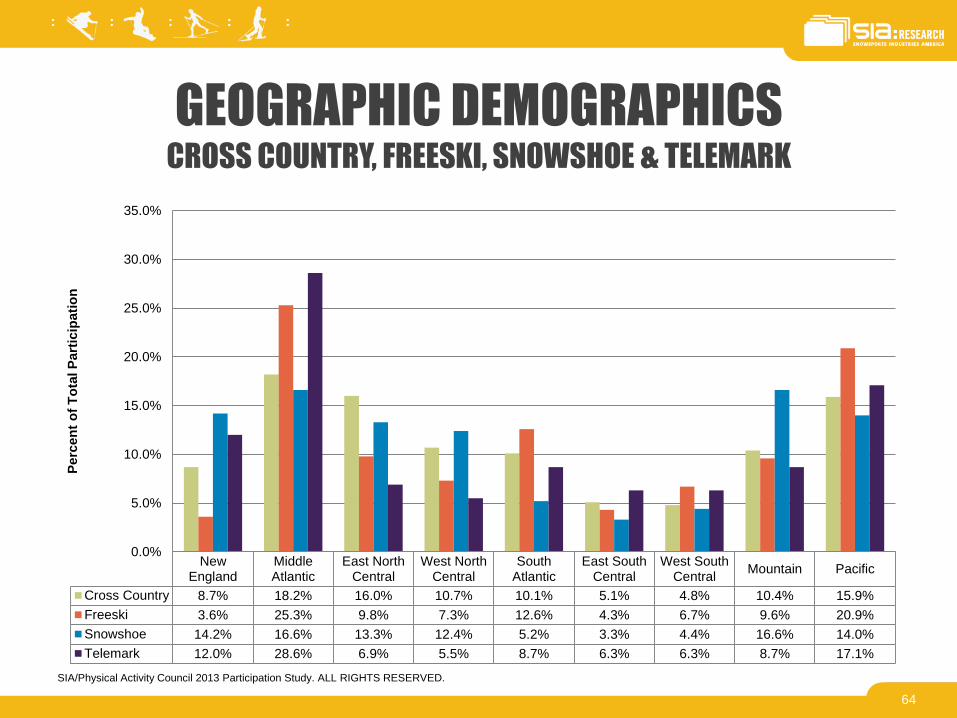
GEOGRAPHIC DEMOGRAPHICS CROSS COUNTRY, FREESKI, SNOWSHOE & TELEMARK
64
NewEngland
MiddleAtlantic
East NorthCentral
West NorthCentral
SouthAtlantic
East SouthCentral
West SouthCentral
Mountain Pacific
Cross Country 8.7% 18.2% 16.0% 10.7% 10.1% 5.1% 4.8% 10.4% 15.9%
Freeski 3.6% 25.3% 9.8% 7.3% 12.6% 4.3% 6.7% 9.6% 20.9%
Snowshoe 14.2% 16.6% 13.3% 12.4% 5.2% 3.3% 4.4% 16.6% 14.0%
Telemark 12.0% 28.6% 6.9% 5.5% 8.7% 6.3% 6.3% 8.7% 17.1%
0.0%
5.0%
10.0%
15.0%
20.0%
25.0%
30.0%
35.0%
Perc
en
t o
f T
ota
l P
art
icip
ati
on
SIA/Physical Activity Council 2013 Participation Study. ALL RIGHTS RESERVED.

PERCENT OF ALPINE PARTICIPANTS PER STATE California 13.60%
New York 8.90%
Colorado 6.60%
Texas 5.30%
Minnesota 4.30%
Massachusetts 4.20%
New Jersey 3.90%
Michigan 3.80%
Illinois 3.30%
Pennsylvania 2.90%
Washington 2.90%
Florida 2.70%
Ohio 2.50%
Utah 2.50%
Montana 2.20%
North Carolina 2.20%
Connecticut 2.10%
Georgia 1.90%
Missouri 1.80%
Virginia 1.80%
Tennessee 1.70%
Indiana 1.60%
Wisconsin 1.50%
Idaho 1.40%
Arizona 1.30%
Nevada 1.20%
Oregon 1.20%
Maryland 1.00%
Alabama 0.90%
Maine 0.90%
New Hampshire 0.90%
Kentucky 0.80%
Louisiana 0.80%
South Carolina 0.80%
Iowa 0.60%
Oklahoma 0.60%
Arkansas 0.50%
Delaware 0.50%
Kansas 0.50%
New Mexico 0.50%
Nebraska 0.40%
Vermont 0.30%
District of Columbia 0.10%
Mississippi 0.10%
Rhode Island 0.10%
South Dakota 0.10%
West Virginia 0.10%
Wyoming 0.10%
Alaska -
Hawaii -
North Dakota -
65
SIA/Physical Activity Council 2013 Participation Study. ALL RIGHTS RESERVED.

TOP TEN STATES WHERE ALPINE SKIERS LIVE
CA 13.6%
NY 8.9%
CO 6.6%
TX 5.3%
MN 4.3%
MA 4.2%
NJ 3.9%
MI 3.8%
IL 3.3% PA 2.9%
66
SIA/Physical Activity Council 2013 Participation Study. ALL RIGHTS RESERVED.

SKIER DENSITY PERCENT OF POPULATION THAT ALPINE SKIS BY STATE
Montana 19.0%
Colorado 11.3%
Minnesota 7.5%
Utah 6.7%
Idaho 6.5%
New Hampshire 6.2%
Massachusetts 5.9%
Connecticut 5.1%
Maine 5.0%
Vermont 4.8%
New York 4.2%
Delaware 4.1%
Michigan 3.6%
New Jersey 3.5%
Washington 3.4%
Nevada 3.3%
California 3.2%
Indiana 2.9%
New Mexico 2.9%
Wyoming 2.6%
Missouri 2.4%
Oregon 2.3%
Tennessee 2.3%
Illinois 2.1%
Nebraska 2.1%
Pennsylvania 2.1%
Wisconsin 2.1%
Arizona 2.0%
Iowa 1.9%
Louisiana 1.9%
North Carolina 1.9%
Ohio 1.9%
Texas 1.8%
Virginia 1.8%
Alabama 1.7%
South Carolina 1.7%
Georgia 1.6%
Oklahoma 1.6%
Arkansas 1.5%
Kansas 1.5%
Kentucky 1.5%
Maryland 1.5%
Florida 1.4%
District of Columbia 1.3%
South Dakota 1.2%
Rhode Island 0.8%
West Virginia 0.5%
Mississippi 0.4%
Alaska 0.0%
Hawaii 0.0%
North Dakota 0.0%
67
SIA/Physical Activity Council 2013 Participation Study. ALL RIGHTS RESERVED.

SKIER DENSITY PERCENT OF POPULATION THAT ALPINE SKIS BY STATE
MT 19.0%
CO 11.3%
MN 7.5%
UT 6.7%
ID 6.5%
NH 6.2%
MA 5.9%
CT 5.1%
ME 5.0%
VT 4.8%
68
SIA/Physical Activity Council 2013 Participation Study. ALL RIGHTS RESERVED.

PERCENT OF SNOWBOARD PARTICIPANTS PER STATE
California 18.8%
New York 9.4%
Washington 5.1%
Colorado 4.0%
Pennsylvania 4.0%
Michigan 3.9%
Ohio 3.7%
Texas 3.2%
Illinois 3.1%
New Jersey 3.0%
Oregon 2.8%
Utah 2.8%
Massachusetts 2.5%
Minnesota 2.5%
Virginia 2.4%
Connecticut 2.2%
Florida 2.2%
North Carolina 2.0%
Indiana 1.9%
Wisconsin 1.8%
Georgia 1.6%
Maine 1.5%
Maryland 1.5%
Missouri 1.3%
Iowa 1.2%
Nevada 1.2%
Idaho 1.0%
New Mexico 1.0%
Arizona 0.9%
South Dakota 0.9%
Kansas 0.8%
Louisiana 0.7%
Tennessee 0.7%
Alabama 0.5%
South Carolina 0.5%
Vermont 0.5%
Kentucky 0.4%
Nebraska 0.4%
Rhode Island 0.4%
Arkansas 0.3%
New Hampshire 0.3%
Oklahoma 0.3%
West Virginia 0.3%
District of Columbia 0.2%
Montana 0.2%
Mississippi 0.1%
North Dakota 0.1%
Delaware 0.0%
Alaska 0.0%
Hawaii 0.0%
Wyoming 0.0%
69
SIA/Physical Activity Council 2013 Participation Study. ALL RIGHTS RESERVED.

TOP TEN STATES WHERE SNOWBOARDERS LIVE
CA 18.8%
NY 9.4%
WA 5.1%
CO 4.0% PA 4.0%
MI 3.9%
OH 3.7%
TX 3.2%
IL 3.1% NJ 3.0%
70
SIA/Physical Activity Council 2013 Participation Study. ALL RIGHTS RESERVED.
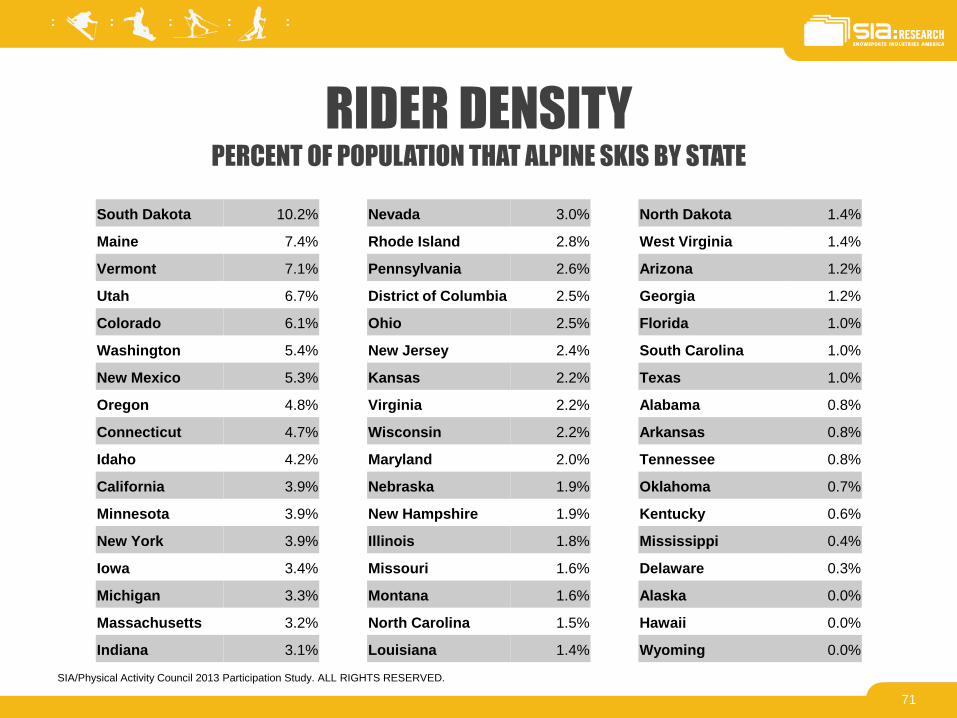
RIDER DENSITY PERCENT OF POPULATION THAT ALPINE SKIS BY STATE
South Dakota 10.2%
Maine 7.4%
Vermont 7.1%
Utah 6.7%
Colorado 6.1%
Washington 5.4%
New Mexico 5.3%
Oregon 4.8%
Connecticut 4.7%
Idaho 4.2%
California 3.9%
Minnesota 3.9%
New York 3.9%
Iowa 3.4%
Michigan 3.3%
Massachusetts 3.2%
Indiana 3.1%
Nevada 3.0%
Rhode Island 2.8%
Pennsylvania 2.6%
District of Columbia 2.5%
Ohio 2.5%
New Jersey 2.4%
Kansas 2.2%
Virginia 2.2%
Wisconsin 2.2%
Maryland 2.0%
Nebraska 1.9%
New Hampshire 1.9%
Illinois 1.8%
Missouri 1.6%
Montana 1.6%
North Carolina 1.5%
Louisiana 1.4%
North Dakota 1.4%
West Virginia 1.4%
Arizona 1.2%
Georgia 1.2%
Florida 1.0%
South Carolina 1.0%
Texas 1.0%
Alabama 0.8%
Arkansas 0.8%
Tennessee 0.8%
Oklahoma 0.7%
Kentucky 0.6%
Mississippi 0.4%
Delaware 0.3%
Alaska 0.0%
Hawaii 0.0%
Wyoming 0.0%
71
SIA/Physical Activity Council 2013 Participation Study. ALL RIGHTS RESERVED.

RIDER DENSITY PERCENT OF POPULATION THAT SNOWBOARDS BY STATE
SD 10.2%
ME 7.4%
VT 7.1%
UT 6.7% CO 6.1%
WA 5.4%
NM 5.3%
OR 4.8%
CT 4.7% ID 4.2%
72
SIA/Physical Activity Council 2013 Participation Study. ALL RIGHTS RESERVED.

CROSS PARTICIPATION
73
SIA/Physical Activity Council 2013 Participation Study. ALL RIGHTS RESERVED.
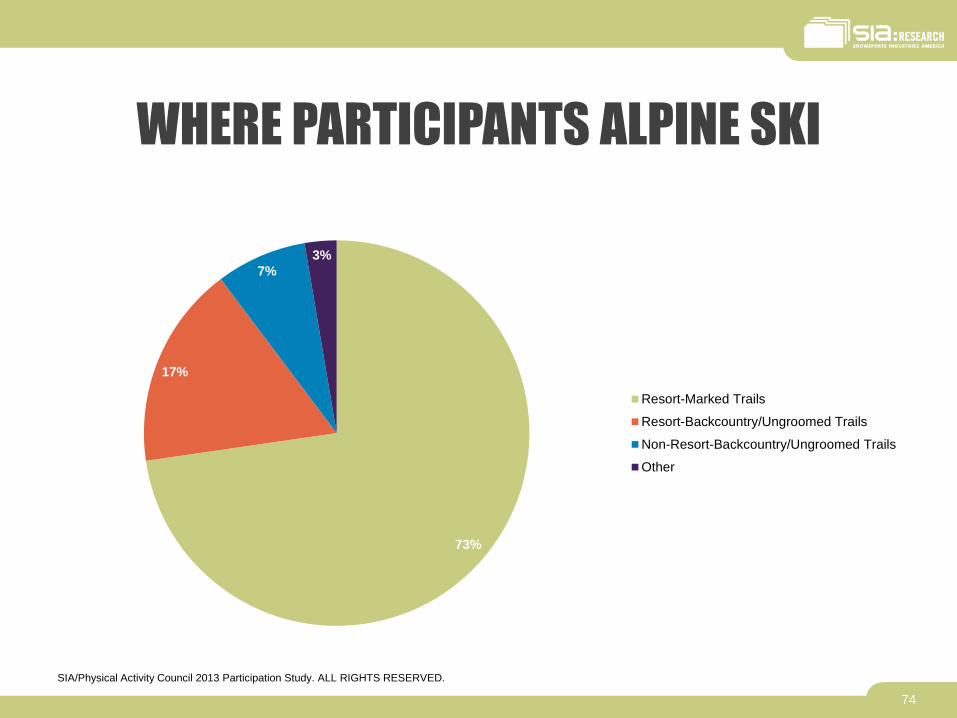
WHERE PARTICIPANTS ALPINE SKI
73%
17%
7%
3%
Resort-Marked Trails
Resort-Backcountry/Ungroomed Trails
Non-Resort-Backcountry/Ungroomed Trails
Other
74
SIA/Physical Activity Council 2013 Participation Study. ALL RIGHTS RESERVED.

TYPES OF SKIS ALPINE SKIERS PREFER
Twin-Tips Telemark AT/Randonee None of These
Type of Ski 30.8% 12.80% 19.40% 37.1%
0.0%
5.0%
10.0%
15.0%
20.0%
25.0%
30.0%
35.0%
40.0%
Perc
en
t o
f T
ota
l
75
SIA/Physical Activity Council 2013 Participation Study. ALL RIGHTS RESERVED.
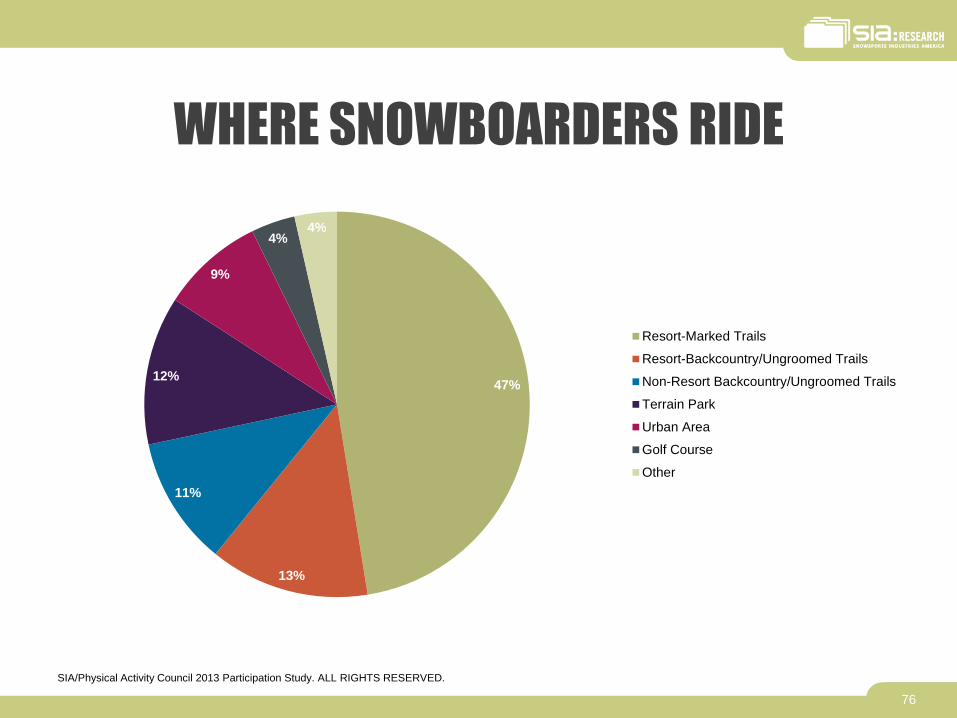
WHERE SNOWBOARDERS RIDE
47%
13%
11%
12%
9%
4% 4%
Resort-Marked Trails
Resort-Backcountry/Ungroomed Trails
Non-Resort Backcountry/Ungroomed Trails
Terrain Park
Urban Area
Golf Course
Other
76
SIA/Physical Activity Council 2013 Participation Study. ALL RIGHTS RESERVED.

WHERE CROSS COUNTRY SKIERS SKI
35%
37%
20%
8%
Private Nordic Center
Public Nordic Center
Backcountry
Other Non-Groomed Terrain
77
SIA/Physical Activity Council 2013 Participation Study. ALL RIGHTS RESERVED.

TYPES OF SKIS CROSS COUNTRY SKIERS PREFER
70%
12%
12%
6%
Classic Cross Country Skis
AT/Randonee Skis
Telemark Skis
Other Skis
78
SIA/Physical Activity Council 2013 Participation Study. ALL RIGHTS RESERVED.

WHERE FREESKIERS PARTICIPATE
38%
32%
13%
11%
6%
Resort
Terrain Park
Urban Area
Golf Course
Other
79
SIA/Physical Activity Council 2013 Participation Study. ALL RIGHTS RESERVED.

CROSS PARTICIPATION PERCENT OF ALPINE SKIERS IN OTHER DISCIPLINES
80
0.0%
2.0%
4.0%
6.0%
8.0%
10.0%
12.0%
14.0%
16.0%
18.0%
Cross Country Freeski Snowboard Snowshoe Telemark
Percent of Alpine Skiers 17.0% 14.2% 16.7% 11.5% 5.8%
Perc
en
t o
f T
ota
l P
art
icip
ati
on
SIA/Physical Activity Council 2013 Participation Study. ALL RIGHTS RESERVED.

CROSS PARTICIPATION PERCENT OF SNOWBOARDERS IN OTHER DISCIPLINES
81
0.0%
2.0%
4.0%
6.0%
8.0%
10.0%
12.0%
14.0%
16.0%
18.0%
20.0%
Cross Country Alpine Freeski Snowshoe Telemark
Percent of Snowboarders 10.0% 18.9% 12.7% 9.0% 7.2%
Perc
en
t o
f T
ota
l P
art
icip
ati
on
SIA/Physical Activity Council 2013 Participation Study. ALL RIGHTS RESERVED.
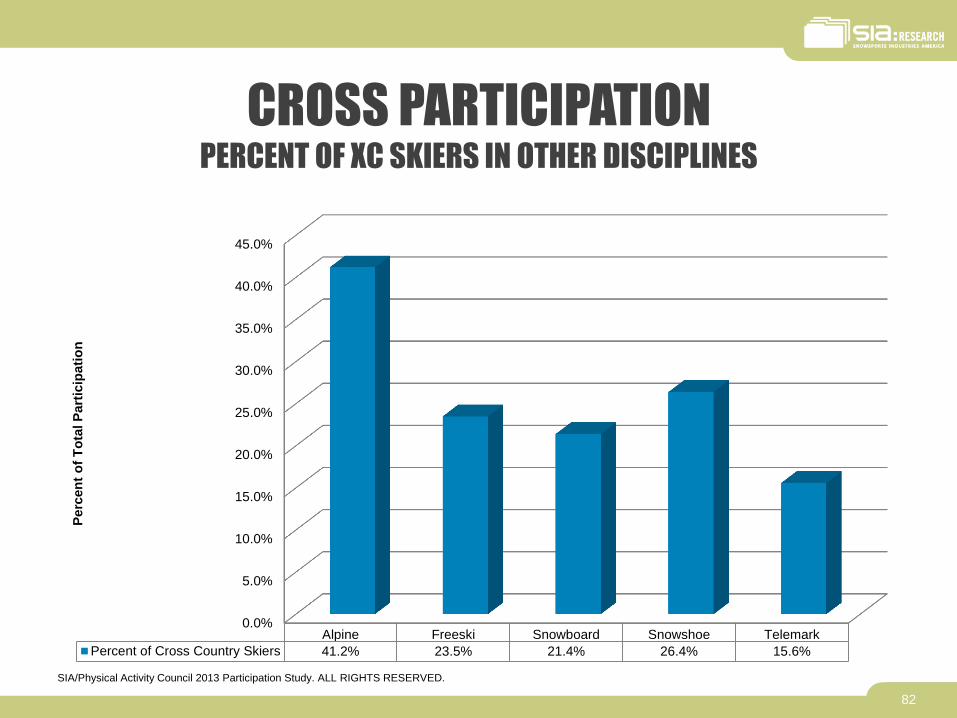
CROSS PARTICIPATION PERCENT OF XC SKIERS IN OTHER DISCIPLINES
82
0.0%
5.0%
10.0%
15.0%
20.0%
25.0%
30.0%
35.0%
40.0%
45.0%
Alpine Freeski Snowboard Snowshoe Telemark
Percent of Cross Country Skiers 41.2% 23.5% 21.4% 26.4% 15.6%
Perc
en
t o
f T
ota
l P
art
icip
ati
on
SIA/Physical Activity Council 2013 Participation Study. ALL RIGHTS RESERVED.

CROSS PARTICIPATION PERCENT OF FREESKIERS IN OTHER DISCIPLINES
83
0.0%
5.0%
10.0%
15.0%
20.0%
25.0%
30.0%
35.0%
40.0%
45.0%
Cross Country Alpine Snowboard Snowshoe Telemark
Percent of Freeskiers 28.6% 41.9% 33.00% 19.60% 18.20%
Perc
en
t o
f T
ota
l P
art
icip
ati
on
SIA/Physical Activity Council 2013 Participation Study. ALL RIGHTS RESERVED.

CROSS PARTICIPATION PERCENT OF TELEMARK SKIERS IN OTHER DISCIPLINES
84
43.0%
44.0%
45.0%
46.0%
47.0%
48.0%
49.0%
50.0%
51.0%
Cross Country Alpine Freeski Snowboard Snowshoe
Percent of Telemark Skiers 50.4% 45.7% 48.4% 49.9% 48.1%
Perc
en
t o
f T
ota
l P
art
icip
ati
on
SIA/Physical Activity Council 2013 Participation Study. ALL RIGHTS RESERVED.

CROSS PARTICIPATION ALPINE SKIERS THAT PARTICIPATE IN OTHER SPORTS
SIA/Physical Activity Council 2013 Participation Study. ALL RIGHTS RESERVED.
85
0.00%
5.00%
10.00%
15.00%
20.00%
25.00%
30.00%
35.00%
40.00%
45.00%
50.00%
Running/Jogging
Walkingfor Fitness
Bicycling(Road/Paved
Surface)
Bowling Hiking(Day)
Billiards/Pool
Camping(Within 1/4
Mile ofVehicle/Home)
Treadmill Weight/ResistanceMachines
FreeWeights(Hand
Weights)
Participation Rate 47.70% 44.70% 38.60% 38.30% 37.10% 35.60% 34.00% 32.50% 31.70% 29.50%
Perc
en
t o
f A
lpin
e S
kie
rs

CROSS PARTICIPATION SNOWBOARDERS THAT PARTICIPATE IN OTHER SPORTS
SIA/Physical Activity Council 2013 Participation Study. ALL RIGHTS RESERVED.
86
0.00%
5.00%
10.00%
15.00%
20.00%
25.00%
30.00%
35.00%
40.00%
45.00%
50.00%
Running/Jogging
Walkingfor Fitness
Bowling Billiards/Pool
Bicycling(Road/Paved
Surface)
Camping(Within 1/4
Mile ofVehicle/Home)
FreeWeights(Hand
Weights)
FreeWeights
(Dumbells)
Weight/ResistanceMachines
Treadmill
Participation Rate 49.80% 42.80% 40.30% 40.20% 35.20% 35.00% 34.60% 34.50% 32.70% 32.20%
Perc
en
t o
f S
no
wb
oard
ers

CROSS PARTICIPATION CROSS COUNTRY SKIERS THAT PARTICIPATE IN OTHER SPORTS
SIA/Physical Activity Council 2013 Participation Study. ALL RIGHTS RESERVED.
87
0.0%
5.0%
10.0%
15.0%
20.0%
25.0%
30.0%
35.0%
40.0%
45.0%
50.0%
Walking forFitness
Skiing(Alpine/
Downhill)
Hiking(Day)
Running/Jogging
Camping(Within 1/4
Mile ofVehicle/Home)
Bicycling(Road/Paved
Surface)
Bowling Billiards/Pool
Snowshoe Aerobics(High-
Impact)
Participation Rate 49.3% 45.8% 43.4% 42.9% 39.9% 38.7% 35.9% 34.3% 34.2% 33.0%
Perc
en
t o
f X
C S
kie
rs

CROSS PARTICIPATION FREESKIERS THAT PARTICIPATE IN OTHER SPORTS
SIA/Physical Activity Council 2013 Participation Study. ALL RIGHTS RESERVED.
88
0.00%
10.00%
20.00%
30.00%
40.00%
50.00%
60.00%
Skiing(Cross
Country)
Skiing(Alpine/
Downhill)
Running/Jogging
Snowboard Bowling Billiards/Pool
Walking forFitness
Snowmobile Bicycling(Road/Paved
Surface)
Camping(Within 1/4
Mile ofVehicle/Home)
Participation Rate 53.60% 50.10% 42.60% 42.50% 42.50% 41.70% 38.10% 36.60% 35.40% 34.20%
Perc
en
t o
f F
reeskie
rs

CROSS PARTICIPATION SNOWSHOERS THAT PARTICIPATE IN OTHER SPORTS
SIA/Physical Activity Council 2013 Participation Study. ALL RIGHTS RESERVED.
89
0.00%
10.00%
20.00%
30.00%
40.00%
50.00%
60.00%
Walking forFitness
Hiking (Day) Fishing(Freshwater
/Other)
Skiing(Cross
Country)
Camping(Within 1/4
Mile ofVehicle/Home)
Bicycling(Road/Paved
Surface)
Bowling Running/Jogging
WildlifeViewing
More Than1/4 Mile
FromHome/Vehicle
Skiing(Alpine/
Downhill)
Participation Rate 56.90% 49.00% 44.80% 44.50% 42.70% 41.20% 40.20% 39.20% 38.30% 36.30%
Perc
en
t o
f S
no
wsh
oers
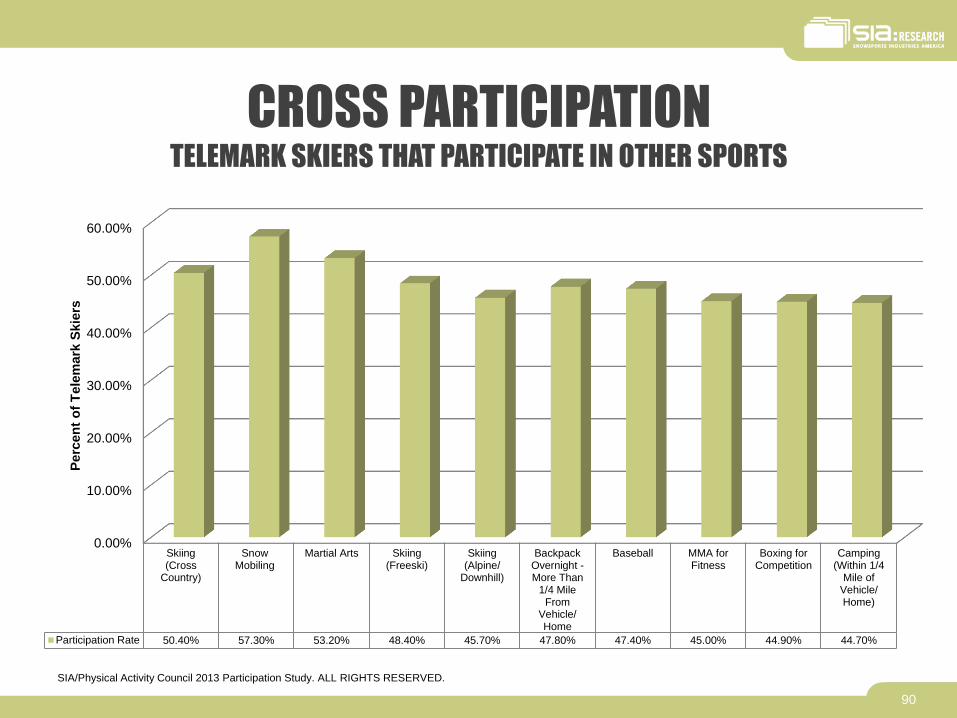
CROSS PARTICIPATION TELEMARK SKIERS THAT PARTICIPATE IN OTHER SPORTS
SIA/Physical Activity Council 2013 Participation Study. ALL RIGHTS RESERVED.
90
0.00%
10.00%
20.00%
30.00%
40.00%
50.00%
60.00%
Skiing(Cross
Country)
SnowMobiling
Martial Arts Skiing(Freeski)
Skiing(Alpine/
Downhill)
BackpackOvernight -More Than
1/4 MileFrom
Vehicle/Home
Baseball MMA forFitness
Boxing forCompetition
Camping(Within 1/4
Mile ofVehicle/Home)
Participation Rate 50.40% 57.30% 53.20% 48.40% 45.70% 47.80% 47.40% 45.00% 44.90% 44.70%
Perc
en
t o
f T
ele
mark
Skie
rs

PARTICIPANT TRENDS
91
SIA/Physical Activity Council 2013 Participation Study. ALL RIGHTS RESERVED.

HOME OWNERSHIP
92
0.0%
10.0%
20.0%
30.0%
40.0%
50.0%
60.0%
70.0%
80.0%
Owned Rented Occupied with No Rent Paid
Cross Country 75.8% 22.0% 2.2%
Alpine 76.8% 20.8% 2.3%
Freeski 72.8% 26.2% 1.0%
Snowboard 72.3% 26.4% 1.3%
Snowshoe 74.0% 25.3% 0.7%
Telemark 69.6% 30.4% 0.0%
Perc
en
t o
f P
art
icip
an
ts
SIA/Physical Activity Council 2013 Participation Study. ALL RIGHTS RESERVED.
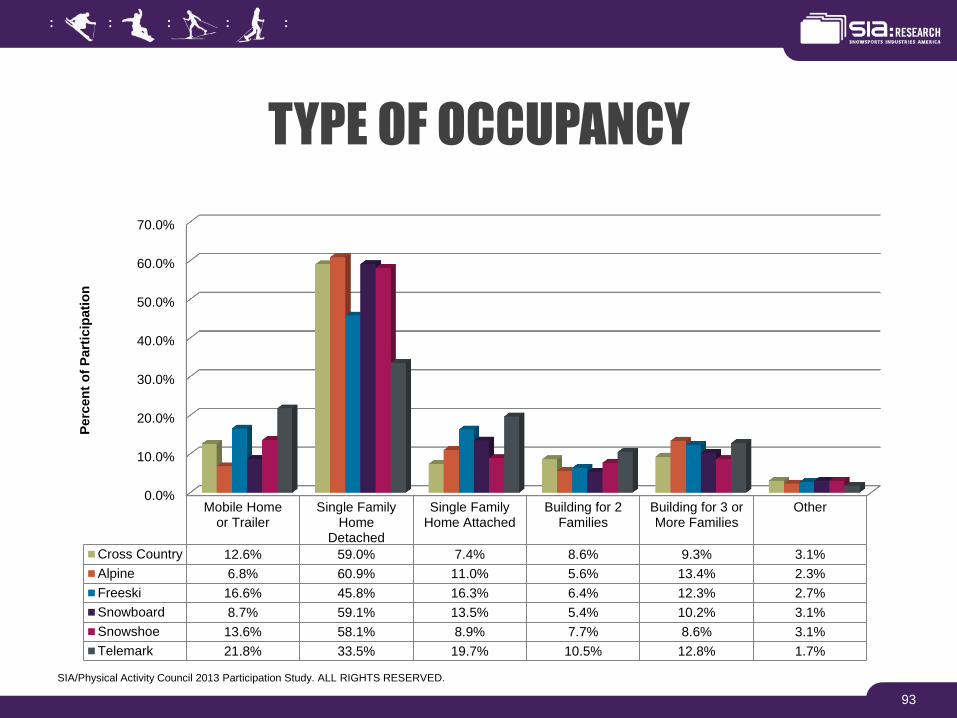
TYPE OF OCCUPANCY
93
0.0%
10.0%
20.0%
30.0%
40.0%
50.0%
60.0%
70.0%
Mobile Homeor Trailer
Single FamilyHome
Detached
Single FamilyHome Attached
Building for 2Families
Building for 3 orMore Families
Other
Cross Country 12.6% 59.0% 7.4% 8.6% 9.3% 3.1%
Alpine 6.8% 60.9% 11.0% 5.6% 13.4% 2.3%
Freeski 16.6% 45.8% 16.3% 6.4% 12.3% 2.7%
Snowboard 8.7% 59.1% 13.5% 5.4% 10.2% 3.1%
Snowshoe 13.6% 58.1% 8.9% 7.7% 8.6% 3.1%
Telemark 21.8% 33.5% 19.7% 10.5% 12.8% 1.7%
Perc
en
t o
f P
art
icip
ati
on
SIA/Physical Activity Council 2013 Participation Study. ALL RIGHTS RESERVED.

INTEREST IN WINTER OLYMPICS
94
0.0%
10.0%
20.0%
30.0%
40.0%
50.0%
60.0%
Cross Country Alpine Freeski Snowboard Snowshoe Telemark
Not at all interested 10.4% 9.5% 11.0% 19.2% 12.3% 10.6%
A little bit interested 16.9% 14.6% 14.8% 18.2% 17.7% 19.2%
Somewhat interested 18.7% 26.9% 30.5% 28.5% 29.2% 32.6%
Very interested 54.1% 49.0% 43.7% 34.1% 40.8% 37.7%
Perc
en
t o
f P
art
icip
an
ts
SIA/Physical Activity Council 2013 Participation Study. ALL RIGHTS RESERVED.

INTEREST IN SUMMER OLYMPICS
95
0.0%
5.0%
10.0%
15.0%
20.0%
25.0%
30.0%
35.0%
40.0%
45.0%
50.0%
Cross Country Alpine Freeski Snowboard Snowshoe Telemark
Not at all interested 12.4% 10.8% 11.2% 19.5% 11.4% 10.1%
A little bit interested 16.3% 15.6% 14.7% 18.6% 19.3% 26.9%
Somewhat interested 24.3% 25.4% 30.8% 24.3% 27.2% 27.9%
Very interested 47.0% 48.2% 43.3% 37.6% 42.1% 35.0%
Perc
en
t o
f P
art
icip
an
ts
SIA/Physical Activity Council 2013 Participation Study. ALL RIGHTS RESERVED.

INTEREST IN THE X GAMES
96
0.0%
5.0%
10.0%
15.0%
20.0%
25.0%
30.0%
35.0%
40.0%
45.0%
Cross Country Alpine Freeski Snowboard Snowshoe Telemark
Not at all interested 27.8% 40.0% 19.1% 26.7% 41.4% 9.6%
A little bit interested 25.8% 21.0% 18.5% 23.3% 21.9% 32.9%
Somewhat interested 24.0% 21.8% 24.8% 26.2% 21.7% 28.8%
Very interested 22.4% 17.2% 37.6% 23.8% 15.0% 28.7%
Perc
en
t o
f P
art
icip
ati
on
SIA/Physical Activity Council 2013 Participation Study. ALL RIGHTS RESERVED.
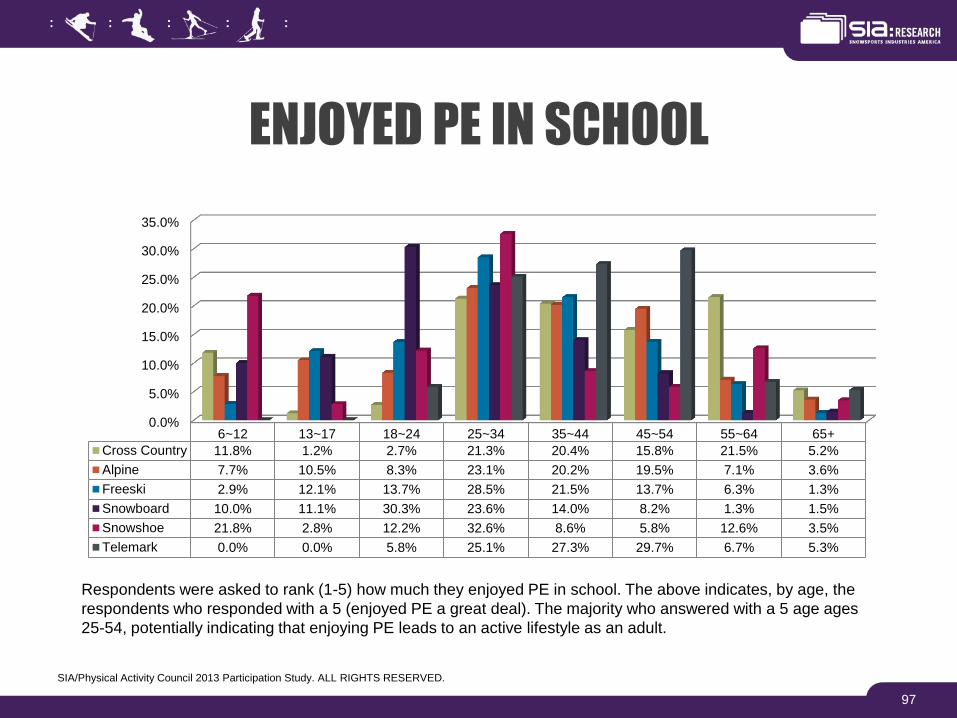
ENJOYED PE IN SCHOOL
Respondents were asked to rank (1-5) how much they enjoyed PE in school. The above indicates, by age, the
respondents who responded with a 5 (enjoyed PE a great deal). The majority who answered with a 5 age ages
25-54, potentially indicating that enjoying PE leads to an active lifestyle as an adult.
97
0.0%
5.0%
10.0%
15.0%
20.0%
25.0%
30.0%
35.0%
6~12 13~17 18~24 25~34 35~44 45~54 55~64 65+
Cross Country 11.8% 1.2% 2.7% 21.3% 20.4% 15.8% 21.5% 5.2%
Alpine 7.7% 10.5% 8.3% 23.1% 20.2% 19.5% 7.1% 3.6%
Freeski 2.9% 12.1% 13.7% 28.5% 21.5% 13.7% 6.3% 1.3%
Snowboard 10.0% 11.1% 30.3% 23.6% 14.0% 8.2% 1.3% 1.5%
Snowshoe 21.8% 2.8% 12.2% 32.6% 8.6% 5.8% 12.6% 3.5%
Telemark 0.0% 0.0% 5.8% 25.1% 27.3% 29.7% 6.7% 5.3%
SIA/Physical Activity Council 2013 Participation Study. ALL RIGHTS RESERVED.

Table 1: Cross Tabulation for
2013 Snow Sports Participation

1+ DAYS
Skiing (Alpine/Downhill)
Total # of
Part. (000s)Segment %
Participation
Rate by Group
Index vs. Total
Population
Total 8,243 2.9%
Male 4,938 59.9% 3.5% 123
Female 3,305 40.1% 2.2% 78
6~12 1,055 12.8% 3.6% 127
13~17 931 11.3% 4.4% 152
18~24 1,245 15.1% 4.1% 142
25~34 1,789 21.7% 4.3% 150
35~44 1,682 20.4% 4.2% 145
45~54 1,014 12.3% 2.3% 80
55~64 338 4.1% 0.9% 31
65+ 190 2.3% 0.5% 16
Under $25000 522 6.3% 1.0% 34
$25000 to $49999 1,204 14.6% 1.8% 62
$50000 to $74999 1,294 15.7% 2.4% 85
$75000 to $99999 1,401 17.0% 3.7% 128
$100000+ 3,800 46.1% 5.1% 176
New England 701 8.5% 5.2% 181
Middle Atlantic 1,286 15.6% 3.4% 118
East North Central 1,055 12.8% 2.5% 86
West North Central 643 7.8% 3.4% 118
South Atlantic 907 11.0% 1.6% 57
East South Central 297 3.6% 1.8% 61
West South Central 602 7.3% 1.8% 62
Mountain 1,302 15.8% 6.3% 220
Pacific 1,451 17.6% 3.1% 108
Non-MSA 321 3.9% 2.5% 88
MSA <500,000 1,715 20.8% 2.3% 81
MSA 500,000 - 2,499,999 2,242 27.2% 2.6% 92
MSA 2,500,000+ 3,965 48.1% 3.4% 119
8th Grade or Less 1,253 15.2% 3.5% 122
1-3 years of High School 569 6.9% 3.0% 105
High School Grad 503 6.1% 1.0% 33
1-3 years of College 1,278 15.5% 1.9% 65
College Grad 2,836 34.4% 4.0% 139
Post-Grad Studies 1,533 18.6% 4.0% 141
Other 264 3.2% 12.0% 417

Skiing (Cross-Country)
Total # of
Part. (000s)Segment %
Participation
Rate by Group
Index vs. Total
Population
Total 3,307 1.2%
Male 1,981 59.9% 1.4% 123
Female 1,326 40.1% 0.9% 78
6~12 380 11.5% 1.3% 114
13~17 189 5.7% 0.9% 77
18~24 509 15.4% 1.7% 145
25~34 847 25.6% 2.0% 177
35~44 546 16.5% 1.4% 118
45~54 443 13.4% 1.0% 87
55~64 218 6.6% 0.6% 50
65+ 175 5.3% 0.4% 36
Under $25000 430 13.0% 0.8% 70
$25000 to $49999 714 21.6% 1.1% 92
$50000 to $74999 529 16.0% 1.0% 86
$75000 to $99999 493 14.9% 1.3% 112
$100000+ 1,141 34.5% 1.5% 132
New England 288 8.7% 2.1% 186
Middle Atlantic 602 18.2% 1.6% 137
East North Central 529 16.0% 1.2% 108
West North Central 354 10.7% 1.9% 163
South Atlantic 334 10.1% 0.6% 52
East South Central 169 5.1% 1.0% 87
West South Central 159 4.8% 0.5% 41
Mountain 344 10.4% 1.7% 145
Pacific 526 15.9% 1.1% 98
Non-MSA 175 5.3% 1.4% 119
MSA <500,000 893 27.0% 1.2% 105
MSA 500,000 - 2,499,999 1,002 30.3% 1.2% 103
MSA 2,500,000+ 1,237 37.4% 1.1% 92
8th Grade or Less 417 12.6% 1.2% 101
1-3 years of High School 136 4.1% 0.7% 63
High School Grad 271 8.2% 0.5% 45
1-3 years of College 546 16.5% 0.8% 69
College Grad 1,171 35.4% 1.6% 143
Post-Grad Studies 645 19.5% 1.7% 148
Other 119 3.6% 5.4% 468

Skiing (Freestyle)
Total # of
Part. (000s)Segment %
Participation
Rate by Group
Index vs. Total
Population
Total 5,357 1.9%
Male 3,412 63.7% 2.4% 131
Female 1,945 36.3% 1.3% 71
6~12 707 13.2% 2.4% 131
13~17 541 10.1% 2.5% 136
18~24 1,157 21.6% 3.8% 203
25~34 1,532 28.6% 3.7% 197
35~44 820 15.3% 2.0% 109
45~54 461 8.6% 1.0% 56
55~64 123 2.3% 0.3% 17
65+ 27 0.5% 0.1% 3
Under $25000 568 10.6% 1.1% 57
$25000 to $49999 911 17.0% 1.3% 72
$50000 to $74999 659 12.3% 1.2% 66
$75000 to $99999 654 12.2% 1.7% 92
$100000+ 2,566 47.9% 3.4% 183
New England 193 3.6% 1.4% 77
Middle Atlantic 1,355 25.3% 3.6% 191
East North Central 525 9.8% 1.2% 66
West North Central 391 7.3% 2.1% 111
South Atlantic 675 12.6% 1.2% 65
East South Central 230 4.3% 1.4% 73
West South Central 359 6.7% 1.1% 57
Mountain 514 9.6% 2.5% 134
Pacific 1,120 20.9% 2.4% 129
Non-MSA 96 1.8% 0.8% 40
MSA <500,000 948 17.7% 1.3% 69
MSA 500,000 - 2,499,999 1,446 27.0% 1.7% 92
MSA 2,500,000+ 2,866 53.5% 2.5% 132
8th Grade or Less 584 10.9% 1.6% 87
1-3 years of High School 252 4.7% 1.3% 72
High School Grad 723 13.5% 1.4% 74
1-3 years of College 1,162 21.7% 1.7% 90
College Grad 1,779 33.2% 2.5% 134
Post-Grad Studies 439 8.2% 1.2% 62
Other 432 8.1% 19.6% 1049

Snowboarding
Total # of
Part. (000s)Segment %
Participation
Rate by Group
Index vs. Total
Population
Total 7,351 2.6%
Male 4,955 67.4% 3.5% 138
Female 2,396 32.6% 1.6% 64
6~12 1,055 14.4% 3.6% 142
13~17 931 12.7% 4.4% 171
18~24 1,245 16.9% 4.1% 159
25~34 1,788 24.3% 4.3% 168
35~44 1,682 22.9% 4.2% 163
45~54 1,014 13.8% 2.3% 89
55~64 338 4.6% 0.9% 35
65+ 190 2.6% 0.5% 18
Under $25000 1,316 17.9% 2.5% 97
$25000 to $49999 1,286 17.5% 1.9% 74
$50000 to $74999 1,228 16.7% 2.3% 90
$75000 to $99999 889 12.1% 2.3% 91
$100000+ 2,624 35.7% 3.5% 136
New England 544 7.4% 4.0% 158
Middle Atlantic 1,198 16.3% 3.1% 123
East North Central 1,059 14.4% 2.5% 97
West North Central 529 7.2% 2.8% 109
South Atlantic 787 10.7% 1.4% 55
East South Central 125 1.7% 0.7% 29
West South Central 330 4.5% 1.0% 38
Mountain 816 11.1% 4.0% 154
Pacific 1,970 26.8% 4.2% 165
Non-MSA 243 3.3% 1.9% 74
MSA <500,000 1,514 20.6% 2.1% 80
MSA 500,000 - 2,499,999 2,286 31.1% 2.7% 106
MSA 2,500,000+ 3,308 45.0% 2.8% 111
8th Grade or Less 1,198 16.3% 3.3% 131
1-3 years of High School 728 9.9% 3.9% 151
High School Grad 838 11.4% 1.6% 63
1-3 years of College 1,522 20.7% 2.2% 86
College Grad 2,213 30.1% 3.1% 121
Post-Grad Studies 647 8.8% 1.7% 67
Other 213 2.9% 9.7% 377

Snowshoeing
Total # of
Part. (000s)Segment %
Participation
Rate by Group
Index vs. Total
Population
Total 4,029 1.4%
Male 2,164 53.7% 1.5% 110
Female 1,865 46.3% 1.3% 90
6~12 524 13.0% 1.8% 129
13~17 278 6.9% 1.3% 93
18~24 572 14.2% 1.9% 134
25~34 1,011 25.1% 2.4% 173
35~44 600 14.9% 1.5% 106
45~54 552 13.7% 1.2% 89
55~64 359 8.9% 0.9% 67
65+ 133 3.3% 0.3% 23
Under $25000 608 15.1% 1.1% 82
$25000 to $49999 878 21.8% 1.3% 93
$50000 to $74999 693 17.2% 1.3% 93
$75000 to $99999 504 12.5% 1.3% 94
$100000+ 1,346 33.4% 1.8% 128
New England 572 14.2% 4.2% 303
Middle Atlantic 669 16.6% 1.8% 125
East North Central 536 13.3% 1.3% 89
West North Central 500 12.4% 2.6% 188
South Atlantic 210 5.2% 0.4% 27
East South Central 133 3.3% 0.8% 56
West South Central 177 4.4% 0.5% 37
Mountain 669 16.6% 3.2% 231
Pacific 564 14.0% 1.2% 86
Non-MSA 326 8.1% 2.6% 182
MSA <500,000 1,426 35.4% 1.9% 138
MSA 500,000 - 2,499,999 987 24.5% 1.2% 83
MSA 2,500,000+ 1,289 32.0% 1.1% 79
8th Grade or Less 475 11.8% 1.3% 95
1-3 years of High School 165 4.1% 0.9% 62
High School Grad 419 10.4% 0.8% 57
1-3 years of College 681 16.9% 1.0% 71
College Grad 1,362 33.8% 1.9% 136
Post-Grad Studies 761 18.9% 2.0% 143
Other 165 4.1% 7.5% 533

Telemarking (Downhill)
Total # of
Part. (000s)Segment %
Participation
Rate by Group
Index vs. Total
Population
Total 2,766 1.0%
Male 1,696 61.3% 1.2% 126
Female 1,070 38.7% 0.7% 76
6~12 354 12.8% 1.2% 127
13~17 448 16.2% 2.1% 218
18~24 561 20.3% 1.8% 191
25~34 675 24.4% 1.6% 168
35~44 396 14.3% 1.0% 102
45~54 260 9.4% 0.6% 61
55~64 47 1.7% 0.1% 13
65+ 22 0.8% 0.1% 5
Under $25000 454 16.4% 0.9% 89
$25000 to $49999 479 17.3% 0.7% 74
$50000 to $74999 429 15.5% 0.8% 84
$75000 to $99999 232 8.4% 0.6% 63
$100000+ 1,173 42.4% 1.6% 162
New England 332 12.0% 2.5% 256
Middle Atlantic 791 28.6% 2.1% 215
East North Central 191 6.9% 0.4% 46
West North Central 152 5.5% 0.8% 83
South Atlantic 241 8.7% 0.4% 45
East South Central 174 6.3% 1.0% 107
West South Central 174 6.3% 0.5% 53
Mountain 241 8.7% 1.2% 121
Pacific 473 17.1% 1.0% 105
Non-MSA 113 4.1% 0.9% 92
MSA <500,000 636 23.0% 0.9% 90
MSA 500,000 - 2,499,999 929 33.6% 1.1% 114
MSA 2,500,000+ 1,087 39.3% 0.9% 97
8th Grade or Less 418 15.1% 1.2% 121
1-3 years of High School 108 3.9% 0.6% 59
High School Grad 349 12.6% 0.7% 69
1-3 years of College 409 14.8% 0.6% 62
College Grad 949 34.3% 1.3% 138
Post-Grad Studies 202 7.3% 0.5% 55
Other 335 12.1% 15.2% 1576
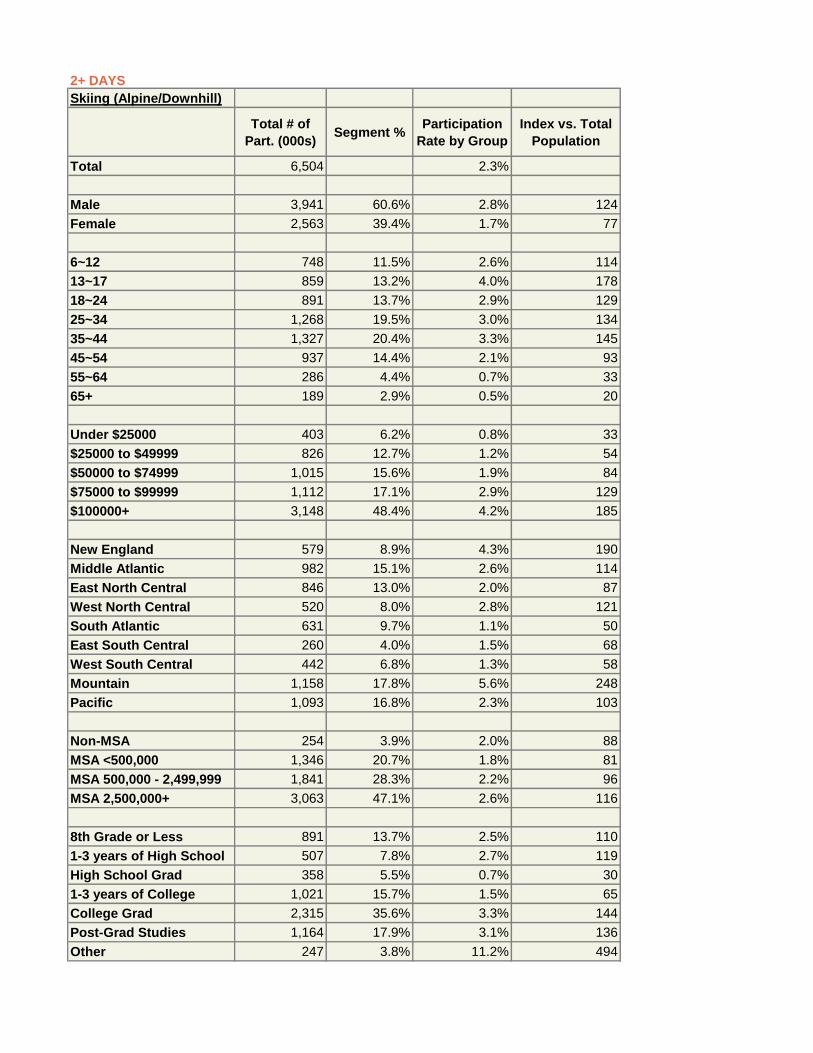
2+ DAYS
Skiing (Alpine/Downhill)
Total # of
Part. (000s)Segment %
Participation
Rate by Group
Index vs. Total
Population
Total 6,504 2.3%
Male 3,941 60.6% 2.8% 124
Female 2,563 39.4% 1.7% 77
6~12 748 11.5% 2.6% 114
13~17 859 13.2% 4.0% 178
18~24 891 13.7% 2.9% 129
25~34 1,268 19.5% 3.0% 134
35~44 1,327 20.4% 3.3% 145
45~54 937 14.4% 2.1% 93
55~64 286 4.4% 0.7% 33
65+ 189 2.9% 0.5% 20
Under $25000 403 6.2% 0.8% 33
$25000 to $49999 826 12.7% 1.2% 54
$50000 to $74999 1,015 15.6% 1.9% 84
$75000 to $99999 1,112 17.1% 2.9% 129
$100000+ 3,148 48.4% 4.2% 185
New England 579 8.9% 4.3% 190
Middle Atlantic 982 15.1% 2.6% 114
East North Central 846 13.0% 2.0% 87
West North Central 520 8.0% 2.8% 121
South Atlantic 631 9.7% 1.1% 50
East South Central 260 4.0% 1.5% 68
West South Central 442 6.8% 1.3% 58
Mountain 1,158 17.8% 5.6% 248
Pacific 1,093 16.8% 2.3% 103
Non-MSA 254 3.9% 2.0% 88
MSA <500,000 1,346 20.7% 1.8% 81
MSA 500,000 - 2,499,999 1,841 28.3% 2.2% 96
MSA 2,500,000+ 3,063 47.1% 2.6% 116
8th Grade or Less 891 13.7% 2.5% 110
1-3 years of High School 507 7.8% 2.7% 119
High School Grad 358 5.5% 0.7% 30
1-3 years of College 1,021 15.7% 1.5% 65
College Grad 2,315 35.6% 3.3% 144
Post-Grad Studies 1,164 17.9% 3.1% 136
Other 247 3.8% 11.2% 494

Skiing (Cross-Country)
Total # of
Part. (000s)Segment %
Participation
Rate by Group
Index vs. Total
Population
Total 2,533 0.9%
Male 1,477 58.3% 1.1% 119
Female 1,056 41.7% 0.7% 81
6~12 294 11.6% 1.0% 115
13~17 167 6.6% 0.8% 89
18~24 370 14.6% 1.2% 137
25~34 555 21.9% 1.3% 151
35~44 410 16.2% 1.0% 115
45~54 393 15.5% 0.9% 100
55~64 193 7.6% 0.5% 57
65+ 152 6.0% 0.4% 41
Under $25000 306 12.1% 0.6% 65
$25000 to $49999 534 21.1% 0.8% 90
$50000 to $74999 420 16.6% 0.8% 90
$75000 to $99999 418 16.5% 1.1% 124
$100000+ 854 33.7% 1.1% 129
New England 284 11.2% 2.1% 239
Middle Atlantic 443 17.5% 1.2% 132
East North Central 451 17.8% 1.1% 120
West North Central 334 13.2% 1.8% 200
South Atlantic 167 6.6% 0.3% 34
East South Central 79 3.1% 0.5% 53
West South Central 124 4.9% 0.4% 42
Mountain 261 10.3% 1.3% 143
Pacific 390 15.4% 0.8% 95
Non-MSA 152 6.0% 1.2% 135
MSA <500,000 735 29.0% 1.0% 113
MSA 500,000 - 2,499,999 712 28.1% 0.8% 95
MSA 2,500,000+ 937 37.0% 0.8% 91
8th Grade or Less 289 11.4% 0.8% 91
1-3 years of High School 124 4.9% 0.7% 75
High School Grad 172 6.8% 0.3% 37
1-3 years of College 408 16.1% 0.6% 67
College Grad 907 35.8% 1.3% 144
Post-Grad Studies 532 21.0% 1.4% 159
Other 106 4.2% 4.8% 546

Skiing (Freestyle)
Total # of
Part. (000s)Segment %
Participation
Rate by Group
Index vs. Total
Population
Total 3,595 1.3%
Male 2,240 62.3% 1.6% 128
Female 1,355 37.7% 0.9% 74
6~12 518 14.4% 1.8% 143
13~17 471 13.1% 2.2% 176
18~24 762 21.2% 2.5% 200
25~34 859 23.9% 2.1% 165
35~44 561 15.6% 1.4% 111
45~54 320 8.9% 0.7% 58
55~64 86 2.4% 0.2% 18
65+ 22 0.6% 0.1% 4
Under $25000 370 10.3% 0.7% 56
$25000 to $49999 503 14.0% 0.7% 60
$50000 to $74999 500 13.9% 0.9% 75
$75000 to $99999 507 14.1% 1.3% 106
$100000+ 1,715 47.7% 2.3% 182
New England 187 5.2% 1.4% 111
Middle Atlantic 917 25.5% 2.4% 192
East North Central 385 10.7% 0.9% 72
West North Central 252 7.0% 1.3% 106
South Atlantic 410 11.4% 0.7% 59
East South Central 140 3.9% 0.8% 66
West South Central 205 5.7% 0.6% 48
Mountain 439 12.2% 2.1% 170
Pacific 669 18.6% 1.4% 114
Non-MSA 97 2.7% 0.8% 61
MSA <500,000 626 17.4% 0.8% 68
MSA 500,000 - 2,499,999 978 27.2% 1.2% 92
MSA 2,500,000+ 1,895 52.7% 1.6% 130
8th Grade or Less 374 10.4% 1.0% 83
1-3 years of High School 226 6.3% 1.2% 96
High School Grad 439 12.2% 0.8% 67
1-3 years of College 676 18.8% 1.0% 78
College Grad 1,276 35.5% 1.8% 143
Post-Grad Studies 262 7.3% 0.7% 55
Other 342 9.5% 15.5% 1,236
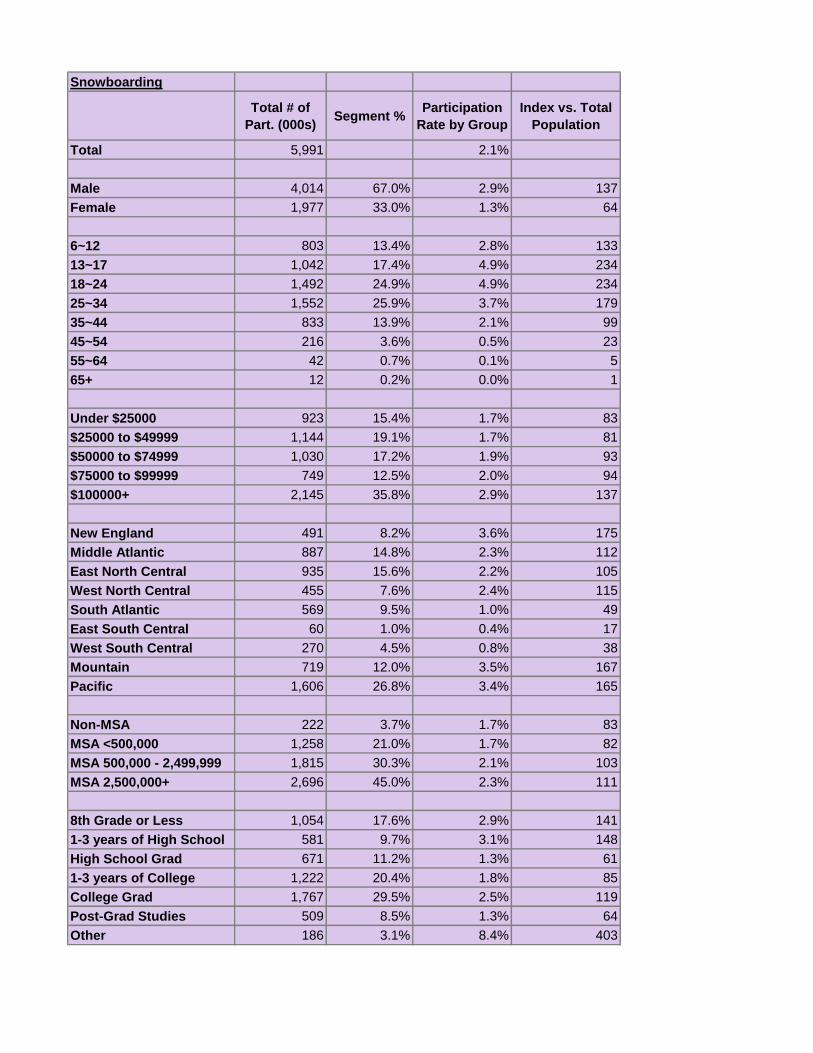
Snowboarding
Total # of
Part. (000s)Segment %
Participation
Rate by Group
Index vs. Total
Population
Total 5,991 2.1%
Male 4,014 67.0% 2.9% 137
Female 1,977 33.0% 1.3% 64
6~12 803 13.4% 2.8% 133
13~17 1,042 17.4% 4.9% 234
18~24 1,492 24.9% 4.9% 234
25~34 1,552 25.9% 3.7% 179
35~44 833 13.9% 2.1% 99
45~54 216 3.6% 0.5% 23
55~64 42 0.7% 0.1% 5
65+ 12 0.2% 0.0% 1
Under $25000 923 15.4% 1.7% 83
$25000 to $49999 1,144 19.1% 1.7% 81
$50000 to $74999 1,030 17.2% 1.9% 93
$75000 to $99999 749 12.5% 2.0% 94
$100000+ 2,145 35.8% 2.9% 137
New England 491 8.2% 3.6% 175
Middle Atlantic 887 14.8% 2.3% 112
East North Central 935 15.6% 2.2% 105
West North Central 455 7.6% 2.4% 115
South Atlantic 569 9.5% 1.0% 49
East South Central 60 1.0% 0.4% 17
West South Central 270 4.5% 0.8% 38
Mountain 719 12.0% 3.5% 167
Pacific 1,606 26.8% 3.4% 165
Non-MSA 222 3.7% 1.7% 83
MSA <500,000 1,258 21.0% 1.7% 82
MSA 500,000 - 2,499,999 1,815 30.3% 2.1% 103
MSA 2,500,000+ 2,696 45.0% 2.3% 111
8th Grade or Less 1,054 17.6% 2.9% 141
1-3 years of High School 581 9.7% 3.1% 148
High School Grad 671 11.2% 1.3% 61
1-3 years of College 1,222 20.4% 1.8% 85
College Grad 1,767 29.5% 2.5% 119
Post-Grad Studies 509 8.5% 1.3% 64
Other 186 3.1% 8.4% 403

Snowshoeing
Total # of
Part. (000s)Segment %
Participation
Rate by Group
Index vs. Total
Population
Total 3,005 1.0%
Male 1,602 53.3% 1.1% 109
Female 1,403 46.7% 1.0% 91
6~12 346 11.5% 1.2% 114
13~17 246 8.2% 1.2% 110
18~24 436 14.5% 1.4% 136
25~34 697 23.2% 1.7% 160
35~44 406 13.5% 1.0% 96
45~54 466 15.5% 1.0% 100
55~64 291 9.7% 0.8% 73
65+ 117 3.9% 0.3% 27
Under $25000 382 12.7% 0.7% 69
$25000 to $49999 688 22.9% 1.0% 97
$50000 to $74999 490 16.3% 0.9% 88
$75000 to $99999 391 13.0% 1.0% 98
$100000+ 1,058 35.2% 1.4% 134
New England 430 14.3% 3.2% 305
Middle Atlantic 496 16.5% 1.3% 124
East North Central 406 13.5% 1.0% 91
West North Central 403 13.4% 2.1% 203
South Atlantic 108 3.6% 0.2% 18
East South Central 99 3.3% 0.6% 56
West South Central 144 4.8% 0.4% 41
Mountain 562 18.7% 2.7% 260
Pacific 358 11.9% 0.8% 73
Non-MSA 288 9.6% 2.3% 216
MSA <500,000 1,196 39.8% 1.6% 155
MSA 500,000 - 2,499,999 691 23.0% 0.8% 78
MSA 2,500,000+ 832 27.7% 0.7% 68
8th Grade or Less 267 8.9% 0.7% 71
1-3 years of High School 141 4.7% 0.7% 72
High School Grad 328 10.9% 0.6% 60
1-3 years of College 520 17.3% 0.8% 72
College Grad 1,016 33.8% 1.4% 136
Post-Grad Studies 568 18.9% 1.5% 143
Other 162 5.4% 7.4% 703

Telemarking (Downhill)
Total # of
Part. (000s)Segment %
Participation
Rate by Group
Index vs. Total
Population
Total 1,953 0.7%
Male 1,156 59.2% 0.8% 121
Female 797 40.8% 0.5% 80
6~12 346 17.7% 1.2% 176
13~17 404 20.7% 1.9% 279
18~24 361 18.5% 1.2% 174
25~34 240 12.3% 0.6% 85
35~44 352 18.0% 0.9% 128
45~54 203 10.4% 0.5% 67
55~64 33 1.7% 0.1% 13
65+ 14 0.7% 0.0% 5
Under $25000 385 19.7% 0.7% 106
$25000 to $49999 332 17.0% 0.5% 72
$50000 to $74999 275 14.1% 0.5% 76
$75000 to $99999 137 7.0% 0.4% 53
$100000+ 822 42.1% 1.1% 161
New England 299 15.3% 2.2% 326
Middle Atlantic 512 26.2% 1.3% 197
East North Central 174 8.9% 0.4% 60
West North Central 135 6.9% 0.7% 105
South Atlantic 100 5.1% 0.2% 26
East South Central 109 5.6% 0.6% 95
West South Central 123 6.3% 0.4% 53
Mountain 199 10.2% 1.0% 142
Pacific 303 15.5% 0.6% 95
Non-MSA 113 5.8% 0.9% 130
MSA <500,000 451 23.1% 0.6% 90
MSA 500,000 - 2,499,999 699 35.8% 0.8% 121
MSA 2,500,000+ 689 35.3% 0.6% 87
8th Grade or Less 369 18.9% 1.0% 152
1-3 years of High School 47 2.4% 0.2% 37
High School Grad 254 13.0% 0.5% 71
1-3 years of College 219 11.2% 0.3% 47
College Grad 684 35.0% 1.0% 141
Post-Grad Studies 78 4.0% 0.2% 30
Other 303 15.5% 13.7% 2,017

9+ DAYS
Skiing (Alpine/Downhill)
Total # of
Part. (000s)Segment %
Participation
Rate by Group
Index vs. Total
Population
Total 1,822 0.6%
Male 1,090 59.8% 0.8% 123
Female 732 40.2% 0.5% 78
6~12 184 10.1% 0.6% 100
13~17 190 10.4% 0.9% 140
18~24 274 15.0% 0.9% 142
25~34 145 8.0% 0.3% 55
35~44 273 15.0% 0.7% 107
45~54 224 12.3% 0.5% 79
55~64 113 6.2% 0.3% 47
65+ 79 4.3% 0.2% 30
Under $25000 182 10.0% 0.3% 54
$25000 to $49999 189 10.4% 0.3% 44
$50000 to $74999 350 19.2% 0.7% 104
$75000 to $99999 255 14.0% 0.7% 105
$100000+ 845 46.4% 1.1% 177
New England 206 11.3% 1.5% 241
Middle Atlantic 251 13.8% 0.7% 104
East North Central 302 16.6% 0.7% 112
West North Central 153 8.4% 0.8% 128
South Atlantic 184 10.1% 0.3% 52
East South Central 46 2.5% 0.3% 42
West South Central 106 5.8% 0.3% 49
Mountain 339 18.6% 1.6% 259
Pacific 233 12.8% 0.5% 79
Non-MSA 173 9.5% 1.4% 213
MSA <500,000 434 23.8% 0.6% 93
MSA 500,000 - 2,499,999 537 29.5% 0.6% 100
MSA 2,500,000+ 678 37.2% 0.6% 92
8th Grade or Less 297 16.3% 0.8% 131
1-3 years of High School 133 7.3% 0.7% 111
High School Grad 115 6.3% 0.2% 35
1-3 years of College 335 18.4% 0.5% 77
College Grad 612 33.6% 0.9% 136
Post-Grad Studies 275 15.1% 0.7% 114
Other 53 2.9% 2.4% 377

Skiing (Cross-Country)
Total # of
Part. (000s)Segment %
Participation
Rate by Group
Index vs. Total
Population
Total 939 0.3%
Male 562 59.9% 0.4% 123
Female 377 40.1% 0.3% 78
6~12 140 14.9% 0.5% 148
13~17 54 5.8% 0.3% 78
18~24 180 19.2% 0.6% 181
25~34 181 19.3% 0.4% 133
35~44 168 17.9% 0.4% 128
45~54 118 12.6% 0.3% 81
55~64 51 5.4% 0.1% 41
65+ 48 5.1% 0.1% 35
Under $25000 214 22.8% 0.4% 123
$25000 to $49999 192 20.4% 0.3% 87
$50000 to $74999 167 17.8% 0.3% 96
$75000 to $99999 148 15.8% 0.4% 119
$100000+ 217 23.1% 0.3% 88
New England 107 11.4% 0.8% 243
Middle Atlantic 136 14.5% 0.4% 109
East North Central 167 17.8% 0.4% 120
West North Central 118 12.6% 0.6% 191
South Atlantic 65 6.9% 0.1% 35
East South Central 23 2.5% 0.1% 42
West South Central 41 4.4% 0.1% 37
Mountain 141 15.0% 0.7% 209
Pacific 141 15.0% 0.3% 92
Non-MSA 69 7.3% 0.5% 164
MSA <500,000 354 37.7% 0.5% 147
MSA 500,000 - 2,499,999 201 21.4% 0.2% 73
MSA 2,500,000+ 316 33.7% 0.3% 83
8th Grade or Less 131 13.9% 0.4% 111
1-3 years of High School 54 5.8% 0.3% 88
High School Grad 82 8.7% 0.2% 48
1-3 years of College 146 15.5% 0.2% 65
College Grad 324 34.5% 0.5% 139
Post-Grad Studies 153 16.3% 0.4% 123
Other 49 5.2% 2.2% 677

Skiing (Freestyle)
Total # of
Part. (000s)Segment %
Participation
Rate by Group
Index vs. Total
Population
Total 1,125 0.4%
Male 712 63.3% 0.5% 130
Female 413 36.7% 0.3% 72
6~12 226 20.1% 0.8% 200
13~17 142 12.6% 0.7% 170
18~24 347 30.8% 1.1% 290
25~34 114 10.1% 0.3% 70
35~44 105 9.3% 0.3% 66
45~54 140 12.4% 0.3% 80
55~64 37 3.3% 0.1% 25
65+ 15 1.3% 0.0% 9
Under $25000 230 20.4% 0.4% 110
$25000 to $49999 110 9.8% 0.2% 42
$50000 to $74999 150 13.3% 0.3% 72
$75000 to $99999 111 9.9% 0.3% 74
$100000+ 524 46.6% 0.7% 178
New England 88 7.8% 0.7% 166
Middle Atlantic 264 23.5% 0.7% 177
East North Central 122 10.8% 0.3% 73
West North Central 105 9.3% 0.6% 141
South Atlantic 147 13.1% 0.3% 67
East South Central 32 2.8% 0.2% 48
West South Central 35 3.1% 0.1% 26
Mountain 199 17.7% 1.0% 246
Pacific 136 12.1% 0.3% 74
Non-MSA 34 3.0% 0.3% 67
MSA <500,000 232 20.6% 0.3% 80
MSA 500,000 - 2,499,999 233 20.7% 0.3% 70
MSA 2,500,000+ 628 55.8% 0.5% 138
8th Grade or Less 131 11.6% 0.4% 93
1-3 years of High School 106 9.4% 0.6% 143
High School Grad 147 13.1% 0.3% 72
1-3 years of College 185 16.4% 0.3% 68
College Grad 378 33.6% 0.5% 136
Post-Grad Studies 64 5.7% 0.2% 43
Other 114 10.1% 5.1% 1,314

Snowboarding
Total # of
Part. (000s)Segment %
Participation
Rate by Group
Index vs. Total
Population
Total 2,132 0.7%
Male 1,488 69.8% 1.1% 143
Female 644 30.2% 0.4% 59
6~12 339 15.9% 1.2% 158
13~17 469 22.0% 2.2% 296
18~24 650 30.5% 2.1% 287
25~34 384 18.0% 0.9% 124
35~44 203 9.5% 0.5% 68
45~54 77 3.6% 0.2% 23
55~64 9 0.4% 0.0% 3
65+ 2 0.1% 0.0% 1
Under $25000 371 17.4% 0.7% 94
$25000 to $49999 518 24.3% 0.8% 103
$50000 to $74999 352 16.5% 0.7% 89
$75000 to $99999 275 12.9% 0.7% 97
$100000+ 614 28.8% 0.8% 110
New England 203 9.5% 1.5% 203
Middle Atlantic 277 13.0% 0.7% 98
East North Central 371 17.4% 0.9% 117
West North Central 164 7.7% 0.9% 117
South Atlantic 179 8.4% 0.3% 43
East South Central 19 0.9% 0.1% 15
West South Central 109 5.1% 0.3% 43
Mountain 273 12.8% 1.3% 178
Pacific 537 25.2% 1.2% 155
Non-MSA 109 5.1% 0.9% 115
MSA <500,000 497 23.3% 0.7% 91
MSA 500,000 - 2,499,999 531 24.9% 0.6% 84
MSA 2,500,000+ 994 46.6% 0.9% 115
8th Grade or Less 535 25.1% 1.5% 201
1-3 years of High School 207 9.7% 1.1% 148
High School Grad 215 10.1% 0.4% 55
1-3 years of College 394 18.5% 0.6% 77
College Grad 535 25.1% 0.8% 101
Post-Grad Studies 168 7.9% 0.4% 60
Other 79 3.7% 3.6% 481

Snowshoeing
Total # of
Part. (000s)Segment %
Participation
Rate by Group
Index vs. Total
Population
Total 766 0.3%
Male 399 52.1% 0.3% 107
Female 367 47.9% 0.2% 94
6~12 97 12.7% 0.3% 126
13~17 48 6.3% 0.2% 85
18~24 171 22.3% 0.6% 210
25~34 159 20.7% 0.4% 143
35~44 53 6.9% 0.1% 49
45~54 170 22.2% 0.4% 143
55~64 46 6.0% 0.1% 45
65+ 23 3.0% 0.1% 21
Under $25000 104 13.6% 0.2% 73
$25000 to $49999 247 32.3% 0.4% 137
$50000 to $74999 156 20.4% 0.3% 110
$75000 to $99999 81 10.6% 0.2% 80
$100000+ 177 23.1% 0.2% 88
New England 100 13.1% 0.7% 279
Middle Atlantic 117 15.3% 0.3% 115
East North Central 107 14.0% 0.3% 94
West North Central 89 11.6% 0.5% 176
South Atlantic 33 4.3% 0.1% 22
East South Central 15 1.9% 0.1% 32
West South Central 26 3.4% 0.1% 29
Mountain 215 28.1% 1.0% 391
Pacific 64 8.3% 0.1% 51
Non-MSA 53 6.9% 0.4% 155
MSA <500,000 346 45.2% 0.5% 176
MSA 500,000 - 2,499,999 178 23.3% 0.2% 79
MSA 2,500,000+ 188 24.6% 0.2% 61
8th Grade or Less 64 8.4% 0.2% 67
1-3 years of High School 48 6.3% 0.3% 96
High School Grad 127 16.6% 0.2% 91
1-3 years of College 82 10.7% 0.1% 45
College Grad 307 40.1% 0.4% 162
Post-Grad Studies 81 10.6% 0.2% 80
Other 57 7.4% 2.6% 963

Telemarking (Downhill)
Total # of
Part. (000s)Segment %
Participation
Rate by Group
Index vs. Total
Population
Total 863 0.3%
Male 540 62.6% 0.4% 128
Female 323 37.4% 0.2% 73
6~12 180 20.9% 0.6% 207
13~17 230 26.7% 1.1% 360
18~24 243 28.1% 0.8% 264
25~34 38 4.4% 0.1% 30
35~44 82 9.5% 0.2% 68
45~54 60 7.0% 0.1% 45
55~64 24 2.8% 0.1% 21
65+ 5 0.6% 0.0% 4
Under $25000 344 39.9% 0.6% 216
$25000 to $49999 115 13.3% 0.2% 57
$50000 to $74999 115 13.3% 0.2% 72
$75000 to $99999 44 5.1% 0.1% 38
$100000+ 245 28.4% 0.3% 108
New England 236 27.4% 1.8% 584
Middle Atlantic 120 13.9% 0.3% 105
East North Central 32 3.7% 0.1% 25
West North Central 47 5.4% 0.2% 82
South Atlantic 40 4.6% 0.1% 24
East South Central 46 5.3% 0.3% 90
West South Central 36 4.2% 0.1% 36
Mountain 173 20.0% 0.8% 278
Pacific 134 15.5% 0.3% 95
Non-MSA 50 5.8% 0.4% 130
MSA <500,000 342 39.6% 0.5% 155
MSA 500,000 - 2,499,999 327 37.9% 0.4% 129
MSA 2,500,000+ 145 16.8% 0.1% 42
8th Grade or Less 261 30.3% 0.7% 243
1-3 years of High School 14 1.6% 0.1% 24
High School Grad 90 10.4% 0.2% 57
1-3 years of College 41 4.7% 0.1% 20
College Grad 295 34.2% 0.4% 138
Post-Grad Studies 25 2.9% 0.1% 22
Other 138 16.0% 6.3% 2,082

MALE
Skiing (Alpine/Downhill)
Total # of
Part. (000s)Segment %
Participation
Rate by Group
Index vs. Total
Population
Total 4,938 3.5%
6~12 514 10.4% 3.5% 100
13~17 494 10.0% 4.5% 128
18~24 672 13.6% 5.1% 145
25~34 1,042 21.1% 4.9% 141
35~44 1,091 22.1% 5.4% 152
45~54 701 14.2% 3.1% 89
55~64 291 5.9% 1.6% 45
65+ 133 2.7% 0.7% 19
Under $25000 370 7.5% 1.4% 41
$25000 to $49999 706 14.3% 2.1% 61
$50000 to $74999 760 15.4% 3.0% 85
$75000 to $99999 815 16.5% 4.4% 125
$100000+ 2,286 46.3% 6.1% 174
New England 370 7.5% 5.5% 156
Middle Atlantic 691 14.0% 3.8% 107
East North Central 736 14.9% 3.6% 101
West North Central 410 8.3% 4.4% 124
South Atlantic 583 11.8% 2.2% 63
East South Central 148 3.0% 1.8% 52
West South Central 336 6.8% 2.0% 58
Mountain 825 16.7% 7.9% 223
Pacific 844 17.1% 3.6% 101
Non-MSA 173 3.5% 2.8% 80
MSA <500,000 1,091 22.1% 3.1% 88
MSA 500,000 - 2,499,999 1,318 26.7% 3.2% 90
MSA 2,500,000+ 2,355 47.7% 4.1% 117
8th Grade or Less 627 12.7% 3.5% 98
1-3 years of High School 306 6.2% 3.1% 89
High School Grad 351 7.1% 1.4% 41
1-3 years of College 815 16.5% 2.4% 69
College Grad 1,713 34.7% 5.0% 143
Post-Grad Studies 943 19.1% 4.9% 138
Other 183 3.7% 14.8% 411

Skiing (Cross-Country)
Total # of
Part. (000s)Segment %
Participation
Rate by Group
Index vs. Total
Population
Total 1,981 1.4%
6~12 220 11.1% 1.5% 107
13~17 103 5.2% 0.9% 67
18~24 265 13.4% 2.0% 143
25~34 513 25.9% 2.4% 173
35~44 378 19.1% 1.9% 132
45~54 254 12.8% 1.1% 81
55~64 145 7.3% 0.8% 56
65+ 101 5.1% 0.5% 37
Under $25000 283 14.3% 1.1% 77
$25000 to $49999 426 21.5% 1.3% 91
$50000 to $74999 335 16.9% 1.3% 93
$75000 to $99999 273 13.8% 1.5% 105
$100000+ 664 33.5% 1.8% 126
New England 158 8.0% 2.4% 167
Middle Atlantic 378 19.1% 2.1% 146
East North Central 341 17.2% 1.6% 117
West North Central 204 10.3% 2.2% 154
South Atlantic 242 12.2% 0.9% 65
East South Central 73 3.7% 0.9% 64
West South Central 101 5.1% 0.6% 44
Mountain 190 9.6% 1.8% 128
Pacific 293 14.8% 1.2% 88
Non-MSA 55 2.8% 0.9% 64
MSA <500,000 569 28.7% 1.6% 114
MSA 500,000 - 2,499,999 592 29.9% 1.4% 100
MSA 2,500,000+ 763 38.5% 1.3% 95
8th Grade or Less 256 12.9% 1.4% 99
1-3 years of High School 103 5.2% 1.1% 74
High School Grad 182 9.2% 0.8% 53
1-3 years of College 307 15.5% 0.9% 65
College Grad 616 31.1% 1.8% 128
Post-Grad Studies 436 22.0% 2.3% 159
Other 81 4.1% 6.6% 456

Skiing (Freestyle)
Total # of
Part. (000s)Segment %
Participation
Rate by Group
Index vs. Total
Population
Total 3,412 2.4%
6~12 430 12.6% 2.9% 121
13~17 355 10.4% 3.2% 133
18~24 655 19.2% 5.0% 204
25~34 969 28.4% 4.6% 189
35~44 539 15.8% 2.7% 109
45~54 351 10.3% 1.6% 65
55~64 89 2.6% 0.5% 20
65+ 27 0.8% 0.1% 6
Under $25000 321 9.4% 1.2% 51
$25000 to $49999 461 13.5% 1.4% 57
$50000 to $74999 420 12.3% 1.7% 68
$75000 to $99999 461 13.5% 2.5% 102
$100000+ 1,747 51.2% 4.7% 192
New England 116 3.4% 1.7% 71
Middle Atlantic 863 25.3% 4.7% 193
East North Central 365 10.7% 1.8% 73
West North Central 317 9.3% 3.4% 139
South Atlantic 556 16.3% 2.1% 87
East South Central 96 2.8% 1.2% 48
West South Central 232 6.8% 1.4% 58
Mountain 266 7.8% 2.5% 104
Pacific 604 17.7% 2.5% 105
Non-MSA 61 1.8% 1.0% 41
MSA <500,000 645 18.9% 1.8% 75
MSA 500,000 - 2,499,999 973 28.5% 2.3% 96
MSA 2,500,000+ 1,730 50.7% 3.0% 125
8th Grade or Less 389 11.4% 2.1% 88
1-3 years of High School 181 5.3% 1.9% 76
High School Grad 423 12.4% 1.7% 72
1-3 years of College 816 23.9% 2.4% 100
College Grad 1,061 31.1% 3.1% 128
Post-Grad Studies 283 8.3% 1.5% 60
Other 263 7.7% 21.2% 856

Snowboarding
Total # of
Part. (000s)Segment %
Participation
Rate by Group
Index vs. Total
Population
Total 4,955 3.5%
6~12 634 12.8% 4.3% 123
13~17 927 18.7% 8.5% 240
18~24 1,075 21.7% 8.2% 231
25~34 1,254 25.3% 5.9% 169
35~44 699 14.1% 3.4% 97
45~54 312 6.3% 1.4% 40
55~64 40 0.8% 0.2% 6
65+ 10 0.2% 0.1% 1
Under $25000 956 19.3% 3.7% 104
$25000 to $49999 857 17.3% 2.6% 73
$50000 to $74999 768 15.5% 3.0% 86
$75000 to $99999 585 11.8% 3.2% 89
$100000+ 1,784 36.0% 4.8% 135
New England 436 8.8% 6.5% 183
Middle Atlantic 778 15.7% 4.2% 120
East North Central 788 15.9% 3.8% 108
West North Central 357 7.2% 3.8% 107
South Atlantic 540 10.9% 2.1% 58
East South Central 55 1.1% 0.7% 19
West South Central 208 4.2% 1.3% 36
Mountain 560 11.3% 5.3% 151
Pacific 1,234 24.9% 5.2% 147
Non-MSA 183 3.7% 3.0% 84
MSA <500,000 1,100 22.2% 3.1% 88
MSA 500,000 - 2,499,999 1,650 33.3% 4.0% 112
MSA 2,500,000+ 2,021 40.8% 3.5% 100
8th Grade or Less 931 18.8% 5.1% 145
1-3 years of High School 555 11.2% 5.7% 160
High School Grad 580 11.7% 2.4% 68
1-3 years of College 1,036 20.9% 3.1% 88
College Grad 1,318 26.6% 3.9% 109
Post-Grad Studies 391 7.9% 2.0% 57
Other 149 3.0% 12.0% 333

Snowshoeing
Total # of
Part. (000s)Segment %
Participation
Rate by Group
Index vs. Total
Population
Total 2,164 1.5%
6~12 294 13.6% 2.0% 131
13~17 173 8.0% 1.6% 103
18~24 316 14.6% 2.4% 155
25~34 586 27.1% 2.8% 181
35~44 290 13.4% 1.4% 92
45~54 227 10.5% 1.0% 66
55~64 201 9.3% 1.1% 71
65+ 74 3.4% 0.4% 24
Under $25000 264 12.2% 1.0% 66
$25000 to $49999 532 24.6% 1.6% 104
$50000 to $74999 415 19.2% 1.6% 106
$75000 to $99999 251 11.6% 1.4% 88
$100000+ 703 32.5% 1.9% 122
New England 240 11.1% 3.6% 231
Middle Atlantic 363 16.8% 2.0% 128
East North Central 238 11.0% 1.2% 75
West North Central 338 15.6% 3.6% 233
South Atlantic 151 7.0% 0.6% 37
East South Central 65 3.0% 0.8% 52
West South Central 130 6.0% 0.8% 51
Mountain 290 13.4% 2.8% 179
Pacific 348 16.1% 1.5% 95
Non-MSA 160 7.4% 2.6% 168
MSA <500,000 790 36.5% 2.2% 145
MSA 500,000 - 2,499,999 506 23.4% 1.2% 79
MSA 2,500,000+ 707 32.7% 1.2% 80
8th Grade or Less 266 12.3% 1.5% 95
1-3 years of High School 110 5.1% 1.1% 73
High School Grad 182 8.4% 0.7% 49
1-3 years of College 461 21.3% 1.4% 89
College Grad 671 31.0% 2.0% 128
Post-Grad Studies 368 17.0% 1.9% 123
Other 106 4.9% 8.6% 544
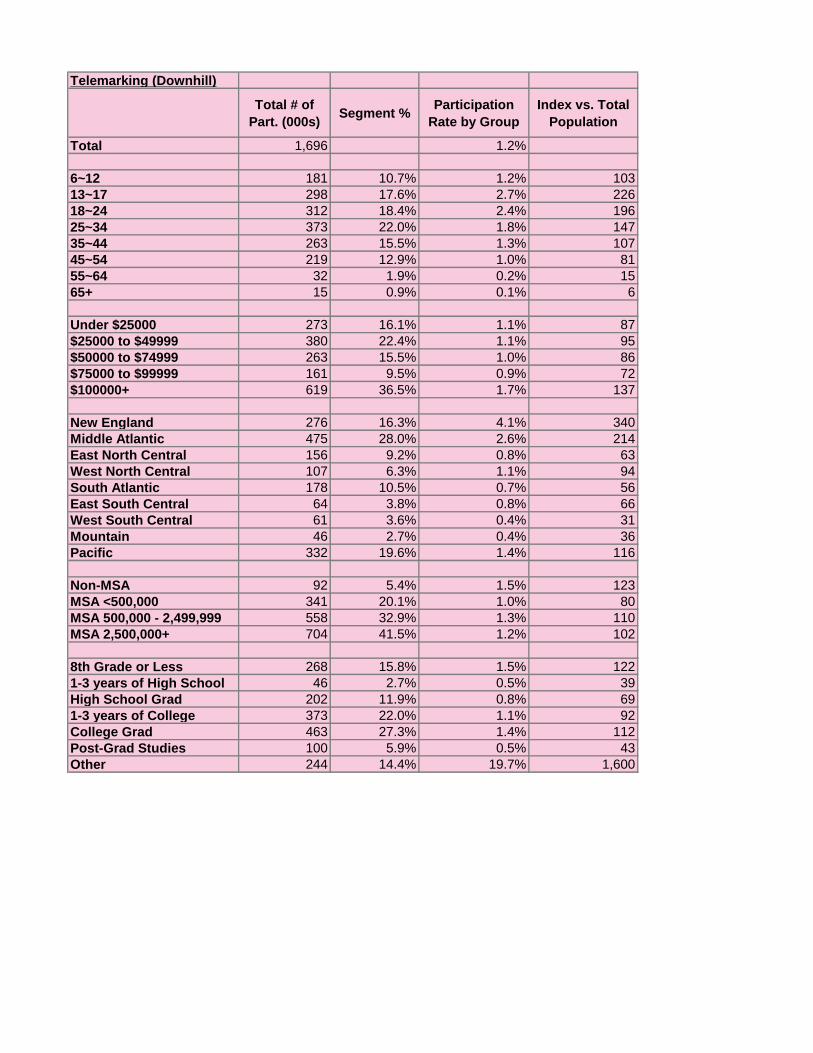
Telemarking (Downhill)
Total # of
Part. (000s)Segment %
Participation
Rate by Group
Index vs. Total
Population
Total 1,696 1.2%
6~12 181 10.7% 1.2% 103
13~17 298 17.6% 2.7% 226
18~24 312 18.4% 2.4% 196
25~34 373 22.0% 1.8% 147
35~44 263 15.5% 1.3% 107
45~54 219 12.9% 1.0% 81
55~64 32 1.9% 0.2% 15
65+ 15 0.9% 0.1% 6
Under $25000 273 16.1% 1.1% 87
$25000 to $49999 380 22.4% 1.1% 95
$50000 to $74999 263 15.5% 1.0% 86
$75000 to $99999 161 9.5% 0.9% 72
$100000+ 619 36.5% 1.7% 137
New England 276 16.3% 4.1% 340
Middle Atlantic 475 28.0% 2.6% 214
East North Central 156 9.2% 0.8% 63
West North Central 107 6.3% 1.1% 94
South Atlantic 178 10.5% 0.7% 56
East South Central 64 3.8% 0.8% 66
West South Central 61 3.6% 0.4% 31
Mountain 46 2.7% 0.4% 36
Pacific 332 19.6% 1.4% 116
Non-MSA 92 5.4% 1.5% 123
MSA <500,000 341 20.1% 1.0% 80
MSA 500,000 - 2,499,999 558 32.9% 1.3% 110
MSA 2,500,000+ 704 41.5% 1.2% 102
8th Grade or Less 268 15.8% 1.5% 122
1-3 years of High School 46 2.7% 0.5% 39
High School Grad 202 11.9% 0.8% 69
1-3 years of College 373 22.0% 1.1% 92
College Grad 463 27.3% 1.4% 112
Post-Grad Studies 100 5.9% 0.5% 43
Other 244 14.4% 19.7% 1,600

FEMALE
Skiing (Alpine/Downhill)
Total # of
Part. (000s)Segment %
Participation
Rate by Group
Index vs. Total
Population
Total 3,305 2.2%
6~12 545 16.5% 3.8% 170
13~17 436 13.2% 4.2% 189
18~24 572 17.3% 3.3% 147
25~34 747 22.6% 3.6% 161
35~44 595 18.0% 3.0% 132
45~54 307 9.3% 1.4% 62
55~64 46 1.4% 0.2% 10
65+ 56 1.7% 0.3% 11
Under $25000 175 5.3% 0.6% 29
$25000 to $49999 496 15.0% 1.4% 64
$50000 to $74999 535 16.2% 1.9% 86
$75000 to $99999 585 17.7% 3.0% 132
$100000+ 1,510 45.7% 4.0% 177
New England 331 10.0% 4.9% 217
Middle Atlantic 602 18.2% 3.0% 135
East North Central 321 9.7% 1.5% 65
West North Central 228 6.9% 2.4% 106
South Atlantic 327 9.9% 1.1% 49
East South Central 155 4.7% 1.8% 78
West South Central 268 8.1% 1.5% 69
Mountain 479 14.5% 4.7% 210
Pacific 605 18.3% 2.6% 117
Non-MSA 149 4.5% 2.2% 100
MSA <500,000 621 18.8% 1.6% 72
MSA 500,000 - 2,499,999 925 28.0% 2.2% 96
MSA 2,500,000+ 1,610 48.7% 2.7% 121
8th Grade or Less 621 18.8% 3.5% 157
1-3 years of High School 268 8.1% 2.9% 131
High School Grad 152 4.6% 0.5% 24
1-3 years of College 466 14.1% 1.3% 58
College Grad 1,127 34.1% 3.0% 135
Post-Grad Studies 592 17.9% 3.2% 142
Other 83 2.5% 8.5% 357

Skiing (Cross-Country)
Total # of
Part. (000s)Segment %
Participation
Rate by Group
Index vs. Total
Population
Total 1,326 0.9%
6~12 159 12.0% 1.1% 124
13~17 85 6.4% 0.8% 91
18~24 244 18.4% 1.4% 156
25~34 333 25.1% 1.6% 179
35~44 166 12.5% 0.8% 92
45~54 191 14.4% 0.9% 96
55~64 74 5.6% 0.4% 41
65+ 74 5.6% 0.3% 37
Under $25000 146 11.0% 0.5% 59
$25000 to $49999 289 21.8% 0.8% 93
$50000 to $74999 194 14.6% 0.7% 77
$75000 to $99999 219 16.5% 1.1% 123
$100000+ 479 36.1% 1.3% 140
New England 130 9.8% 1.9% 213
Middle Atlantic 223 16.8% 1.1% 124
East North Central 191 14.4% 0.9% 96
West North Central 150 11.3% 1.6% 174
South Atlantic 94 7.1% 0.3% 35
East South Central 95 7.2% 1.1% 120
West South Central 57 4.3% 0.3% 36
Mountain 153 11.5% 1.5% 167
Pacific 233 17.6% 1.0% 112
Non-MSA 121 9.1% 1.8% 202
MSA <500,000 325 24.5% 0.8% 94
MSA 500,000 - 2,499,999 408 30.8% 1.0% 105
MSA 2,500,000+ 472 35.6% 0.8% 89
8th Grade or Less 162 12.2% 0.9% 102
1-3 years of High School 32 2.4% 0.4% 39
High School Grad 90 6.8% 0.3% 36
1-3 years of College 237 17.9% 0.7% 74
College Grad 557 42.0% 1.5% 167
Post-Grad Studies 210 15.8% 1.1% 125
Other 40 3.0% 4.1% 429

Skiing (Freestyle)
Total # of
Part. (000s)Segment %
Participation
Rate by Group
Index vs. Total
Population
Total 1,945 1.3%
6~12 278 14.3% 1.9% 147
13~17 183 9.4% 1.8% 134
18~24 502 25.8% 2.9% 219
25~34 562 28.9% 2.7% 206
35~44 280 14.4% 1.4% 106
45~54 107 5.5% 0.5% 37
55~64 33 1.7% 0.2% 13
65+ 0 0.0% 0.0% 0
Under $25000 247 12.7% 0.9% 69
$25000 to $49999 449 23.1% 1.3% 99
$50000 to $74999 241 12.4% 0.9% 66
$75000 to $99999 193 9.9% 1.0% 74
$100000+ 817 42.0% 2.2% 163
New England 76 3.9% 1.1% 85
Middle Atlantic 492 25.3% 2.5% 187
East North Central 159 8.2% 0.7% 55
West North Central 72 3.7% 0.8% 57
South Atlantic 117 6.0% 0.4% 30
East South Central 134 6.9% 1.5% 115
West South Central 126 6.5% 0.7% 55
Mountain 249 12.8% 2.5% 186
Pacific 517 26.6% 2.2% 169
Non-MSA 33 1.7% 0.5% 38
MSA <500,000 303 15.6% 0.8% 60
MSA 500,000 - 2,499,999 474 24.4% 1.1% 84
MSA 2,500,000+ 1,134 58.3% 1.9% 145
8th Grade or Less 193 9.9% 1.1% 83
1-3 years of High School 70 3.6% 0.8% 58
High School Grad 298 15.3% 1.1% 80
1-3 years of College 346 17.8% 1.0% 74
College Grad 721 37.1% 1.9% 147
Post-Grad Studies 156 8.0% 0.8% 63
Other 159 8.2% 16.5% 1,171
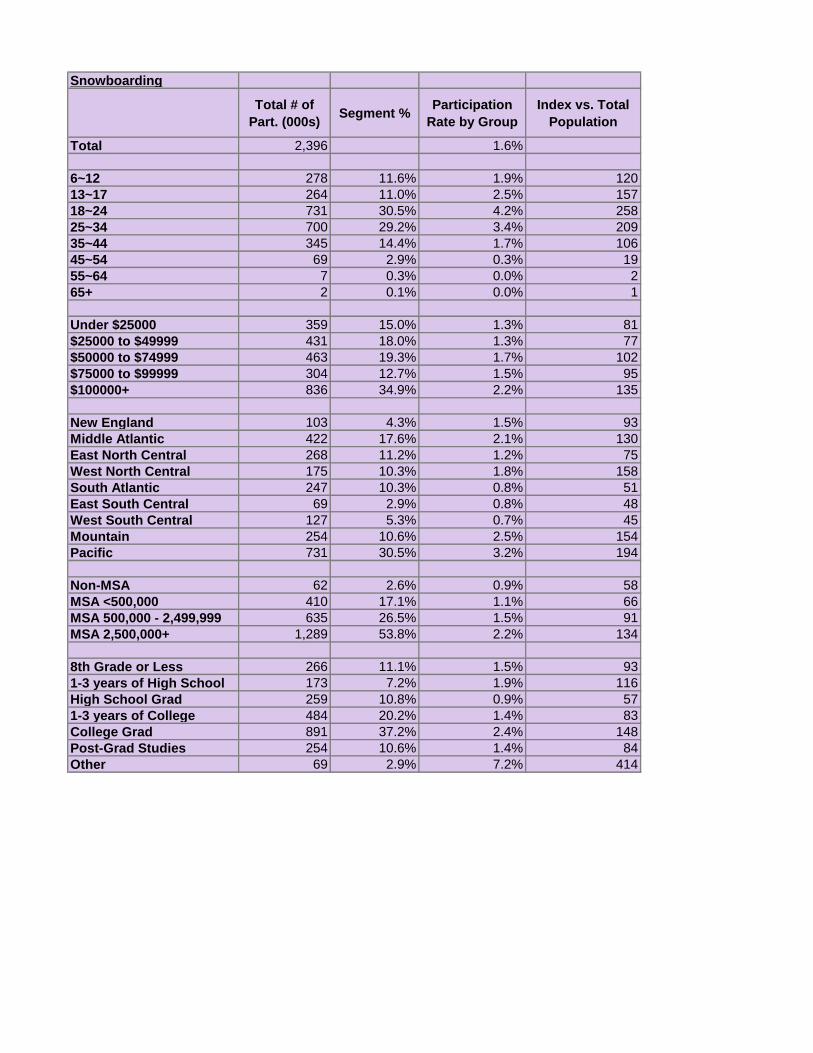
Snowboarding
Total # of
Part. (000s)Segment %
Participation
Rate by Group
Index vs. Total
Population
Total 2,396 1.6%
6~12 278 11.6% 1.9% 120
13~17 264 11.0% 2.5% 157
18~24 731 30.5% 4.2% 258
25~34 700 29.2% 3.4% 209
35~44 345 14.4% 1.7% 106
45~54 69 2.9% 0.3% 19
55~64 7 0.3% 0.0% 2
65+ 2 0.1% 0.0% 1
Under $25000 359 15.0% 1.3% 81
$25000 to $49999 431 18.0% 1.3% 77
$50000 to $74999 463 19.3% 1.7% 102
$75000 to $99999 304 12.7% 1.5% 95
$100000+ 836 34.9% 2.2% 135
New England 103 4.3% 1.5% 93
Middle Atlantic 422 17.6% 2.1% 130
East North Central 268 11.2% 1.2% 75
West North Central 175 10.3% 1.8% 158
South Atlantic 247 10.3% 0.8% 51
East South Central 69 2.9% 0.8% 48
West South Central 127 5.3% 0.7% 45
Mountain 254 10.6% 2.5% 154
Pacific 731 30.5% 3.2% 194
Non-MSA 62 2.6% 0.9% 58
MSA <500,000 410 17.1% 1.1% 66
MSA 500,000 - 2,499,999 635 26.5% 1.5% 91
MSA 2,500,000+ 1,289 53.8% 2.2% 134
8th Grade or Less 266 11.1% 1.5% 93
1-3 years of High School 173 7.2% 1.9% 116
High School Grad 259 10.8% 0.9% 57
1-3 years of College 484 20.2% 1.4% 83
College Grad 891 37.2% 2.4% 148
Post-Grad Studies 254 10.6% 1.4% 84
Other 69 2.9% 7.2% 414

Snowshoeing
Total # of
Part. (000s)Segment %
Participation
Rate by Group
Index vs. Total
Population
Total 1,865 1.3%
6~12 228 12.2% 1.6% 126
13~17 108 5.8% 1.0% 83
18~24 257 13.8% 1.5% 117
25~34 423 22.7% 2.1% 162
35~44 308 16.5% 1.5% 121
45~54 323 17.3% 1.5% 115
55~64 159 8.5% 0.8% 63
65+ 60 3.2% 0.3% 21
Under $25000 343 18.4% 1.3% 99
$25000 to $49999 349 18.7% 1.0% 80
$50000 to $74999 280 15.0% 1.0% 79
$75000 to $99999 254 13.6% 1.3% 101
$100000+ 642 34.4% 1.7% 133
New England 330 17.7% 4.9% 385
Middle Atlantic 306 16.4% 1.5% 121
East North Central 297 15.9% 1.3% 106
West North Central 162 8.7% 1.7% 134
South Atlantic 56 3.0% 0.2% 15
East South Central 69 3.7% 0.8% 62
West South Central 50 2.7% 0.3% 23
Mountain 379 20.3% 3.7% 294
Pacific 216 11.6% 0.9% 74
Non-MSA 168 9.0% 2.5% 200
MSA <500,000 636 34.1% 1.7% 131
MSA 500,000 - 2,499,999 479 25.7% 1.1% 88
MSA 2,500,000+ 584 31.3% 1.0% 78
8th Grade or Less 211 11.3% 1.2% 94
1-3 years of High School 56 3.0% 0.6% 48
High School Grad 235 12.6% 0.8% 66
1-3 years of College 222 11.9% 0.6% 49
College Grad 690 37.0% 1.9% 147
Post-Grad Studies 392 21.0% 2.1% 167
Other 60 3.2% 6.2% 457

Telemarking (Downhill)
Total # of
Part. (000s)Segment %
Participation
Rate by Group
Index vs. Total
Population
Total 1,070 0.7%
6~12 173 16.2% 1.2% 167
13~17 151 14.1% 1.5% 201
18~24 249 23.3% 1.4% 197
25~34 303 28.3% 1.5% 202
35~44 134 12.5% 0.7% 92
45~54 42 3.9% 0.2% 26
55~64 13 1.2% 0.1% 9
65+ 5 0.5% 0.0% 3
Under $25000 182 17.0% 0.7% 92
$25000 to $49999 97 9.1% 0.3% 39
$50000 to $74999 166 15.5% 0.6% 82
$75000 to $99999 71 6.6% 0.4% 49
$100000+ 553 51.7% 1.5% 200
New England 55 5.1% 0.8% 111
Middle Atlantic 317 29.6% 1.6% 219
East North Central 34 3.2% 0.2% 21
West North Central 46 4.3% 0.5% 66
South Atlantic 61 5.7% 0.2% 28
East South Central 109 10.2% 1.2% 170
West South Central 113 10.6% 0.7% 90
Mountain 195 18.2% 1.9% 264
Pacific 140 13.1% 0.6% 83
Non-MSA 21 2.0% 0.3% 44
MSA <500,000 294 27.5% 0.8% 105
MSA 500,000 - 2,499,999 373 34.8% 0.9% 119
MSA 2,500,000+ 382 35.7% 0.6% 89
8th Grade or Less 150 14.0% 0.8% 117
1-3 years of High School 61 5.7% 0.7% 92
High School Grad 147 13.7% 0.5% 72
1-3 years of College 35 3.3% 0.1% 14
College Grad 485 45.3% 1.3% 180
Post-Grad Studies 103 9.6% 0.6% 76
Other 90 8.4% 9.3% 1,200

Table 2: "All Sports" Cross
Tabulation for 2013 Snow
Sports Participation

Number of
Participants (000's)Participation Rate Index
Aerobics (High-Impact) 1,706 20.7% 180
Aerobics (Low-Impact) 1,682 20.4% 111
Aerobics (Step) 956 11.6% 168
Other Exercise to Music 1,360 16.5% 93
Aquatic Exercise 882 10.7% 162
Calisthenics 857 10.4% 144
Cardio Kickboxing 800 9.7% 202
Pilates Training 808 9.8% 175
Stretching 2,209 26.8% 103
Yoga 1,756 21.3% 128
Free Weights (Barbells) 2,044 24.8% 132
Free Weights (Dumbells) 2,415 29.3% 111
Free Weights (Hand Weights) 2,432 29.5% 94
Weight/Resistance Machines 2,613 31.7% 121
Home Gym Exercise 1,591 19.3% 109
Abdominal Machine/Device 1,533 18.6% 141
Rowing Machine 1,006 12.2% 172
Stationary Cycling (Upright) 1,723 20.9% 122
Stationary Cycling (Group) 981 11.9% 202
Stationary Cycling (Recumbent) 783 9.5% 122
Treadmill 2,679 32.5% 97
Stair-Climbing Machine 1,269 15.4% 177
Elliptical Motion Trainer 1,846 22.4% 125
Cross-Country Ski Machine 445 5.4% 270
Walking for Fitness 3,684 44.7% 55
Running/Jogging 3,932 47.7% 131
Triathlon (Traditional/Road) 585 7.1% 473
Triathlon (Non-Traditional/Off Road) 445 5.4% 491
Adventure Racing 462 5.6% 373
Swimming for Fitness 1,921 23.3% 126
Bicycling (Road/Paved Surface) 3,182 38.6% 140
Bicycling (Mountain/Non-Paved
Surface) 1,616 19.6% 332
Bicycling (BMX) 354 4.3% 239
Golf (on a Golf Course) 2,201 26.7% 169
Golf (Hitting Balls at a Practice Facility) 2,102 25.5% 193
Ultimate Frisbee 956 11.6% 264
Gymnastics 569 6.9% 164
Baseball 1,195 14.5% 136
Basketball 2,077 25.2% 134
Cheerleading 626 7.6% 262
Ice Hockey 709 8.6% 410
Field Hockey 486 5.9% 454
Football (Touch) 931 11.3% 179
Alpine Ski Crossover Activities

Football (Tackle) 651 7.9% 149
Lacrosse 528 6.4% 492
Paintball 709 8.6% 287
Rugby 462 5.6% 560
Soccer (Indoor) 709 8.6% 215
Soccer (Outdoor) 1,393 16.9% 176
Softball (Slow-Pitch) 783 9.5% 164
Softball (Fast-Pitch) 429 5.2% 248
Track and Field 585 7.1% 222
Volleyball (Court) 866 10.5% 198
Volleyball (Grass) 618 7.5% 214
Volleyball (Beach) 758 9.2% 219
Badminton 948 11.5% 183
Racquetball 940 11.4% 345
Squash 519 6.3% 485
Tennis 2,011 24.4% 205
Birdwatching More Than 1/4 Mile From
Home/Vehicle1,146 13.9% 140
Wildlife Viewing More Than 1/4 Mile
From Home/Vehicle1,690 20.5% 128
Camping (Within 1/4 Mile of
Vehicle/Home)2,803 34.0% 163
Backpacking Overnight - More Than
1/4 Mile From Vehicle/Home1,508 18.3% 290
Camping (RV) 1,393 16.9% 161
Canoeing 1,500 18.2% 268
Climbing (Sport/Indoor/Boulder) 874 10.6% 279
Climbing
(Traditional/Ice/Mountaineering) 536 6.5% 361
Kayaking (White Water) 569 6.9% 431
Kayaking (Sea/Touring) 552 6.7% 372
Kayaking (Recreational) 1,253 15.2% 245
Rafting 709 8.6% 297
Hiking (Day) 3,058 37.1% 154
Horseback Riding 1,014 12.3% 202
Trail Running 1,105 13.4% 273
Fishing (Fly) 659 8.0% 170
Fishing (Freshwater/Other) 2,357 28.6% 104
Fishing (Saltwater) 857 10.4% 114
Skiing (Cross Country) 1,401 17.0% 239
Skiing (Alpine/Downhill) 8,243 100.0% 1,163
Skiing (Freeski) 1,171 14.2% 330
Snowboarding 1,377 16.7% 229
Snowmobiling 1,459 17.7% 340
Snowshoeing 948 11.5% 256
Telemarking (Downhill) 478 5.8% 187
Boxing 882 10.7% 238
Martial Arts 816 9.9% 220
Wrestling 503 6.1% 359

Billiards/Pool 2,935 35.6% 129
Bowling 3,157 38.3% 111
Darts 1,772 21.5% 164
Table Tennis 1,896 23.0% 183
Roller Hockey 602 7.3% 562
Roller Skating (2x2 Wheel) 783 9.5% 176
Roller Skating (In-line) 1,129 13.7% 269
Scooter Riding (Non-Motorized) 659 8.0% 222
Skateboarding 849 10.3% 224
Ice Skating 1,715 20.8% 267
Archery 800 9.7% 176
Hunting (Rifle) 940 11.4% 158
Hunting (Shotgun) 907 11.0% 193
Hunting (Handgun) 577 7.0% 269
Hunting (Bow) 552 6.7% 239
Shooting (Sport Clay) 742 9.0% 257
Shooting (Trap/Skeet) 717 8.7% 311
Target Shooting (Rifle) 1,344 16.3% 161
Target Shooting (Handgun) 1,302 15.8% 140
Boardsailing/Windsurfing 544 6.6% 471
Jet Skiing 1,583 19.2% 362
Sailing 1,072 13.0% 419
Scuba Diving 890 10.8% 470
Snorkeling 1,467 17.8% 318
Surfing 758 9.2% 460
Wakeboarding 684 8.3% 361
Water Skiing 1,302 15.8% 527
Tai Chi 445 5.4% 193
Football (Flag) 882 10.7% 218
Cardio Tennis 396 4.8% 436
Stand Up Paddling 519 6.3% 525
Boxing for Competition 552 6.7% 558
MMA for fitness 593 7.2% 360
MMA for competition 503 6.1% 678
'Boot Camp' Style Cross-Training 1,022 12.4% 243
Swimming on a Team 453 5.5% 262
Golf Instruction (Taken Professional
Instruction)536 6.5% 295

Number of
Participants (000's)Participation Rate Index
Aerobics (High-Impact) 1,091 33.0% 287
Aerobics (Low-Impact) 1,012 30.6% 166
Aerobics (Step) 645 19.5% 283
Other Exercise to Music 734 22.2% 125
Aquatic Exercise 532 16.1% 244
Calisthenics 460 13.9% 193
Cardio Kickboxing 516 15.6% 325
Pilates Training 526 15.9% 284
Stretching 860 26.0% 100
Yoga 942 28.5% 171
Free Weights (Barbells) 883 26.7% 142
Free Weights (Dumbells) 896 27.1% 103
Free Weights (Hand Weights) 909 27.5% 87
Weight/Resistance Machines 853 25.8% 98
Home Gym Exercise 694 21.0% 119
Abdominal Machine/Device 516 15.6% 118
Rowing Machine 483 14.6% 206
Stationary Cycling (Upright) 767 23.2% 136
Stationary Cycling (Group) 608 18.4% 312
Stationary Cycling (Recumbent) 446 13.5% 173
Treadmill 1,015 30.7% 91
Stair-Climbing Machine 602 18.2% 209
Elliptical Motion Trainer 698 21.1% 118
Cross-Country Ski Machine 321 9.7% 485
Walking for Fitness 1,630 49.3% 61
Running/Jogging 1,419 42.9% 118
Triathlon (Traditional/Road) 397 12.0% 800
Triathlon (Non-Traditional/Off Road) 364 11.0% 1,000
Adventure Racing 377 11.4% 760
Swimming for Fitness 863 26.1% 141
Bicycling (Road/Paved Surface) 1,280 38.7% 141
Bicycling (Mountain/Non-Paved
Surface) 784 23.7% 402
Bicycling (BMX) 284 8.6% 478
Golf (on a Golf Course) 1,081 32.7% 207
Golf (Hitting Balls at a Practice Facility) 784 23.7% 180
Ultimate Frisbee 516 15.6% 355
Gymnastics 327 9.9% 236
Baseball 804 24.3% 227
Basketball 900 27.2% 145
Cheerleading 427 12.9% 445
Ice Hockey 364 11.0% 524
Field Hockey 387 11.7% 900
Cross Country Crossover Activities

Football (Touch) 579 17.5% 278
Football (Tackle) 367 11.1% 209
Lacrosse 321 9.7% 746
Paintball 394 11.9% 397
Rugby 383 11.6% 1,160
Soccer (Indoor) 374 11.3% 283
Soccer (Outdoor) 592 17.9% 186
Softball (Slow-Pitch) 420 12.7% 219
Softball (Fast-Pitch) 265 8.0% 381
Track and Field 367 11.1% 347
Volleyball (Court) 480 14.5% 274
Volleyball (Grass) 407 12.3% 351
Volleyball (Beach) 430 13.0% 310
Badminton 552 16.7% 265
Racquetball 496 15.0% 455
Squash 334 10.1% 777
Tennis 823 24.9% 209
Birdwatching More Than 1/4 Mile From
Home/Vehicle972 29.4% 297
Wildlife Viewing More Than 1/4 Mile
From Home/Vehicle1,048 31.7% 198
Camping (Within 1/4 Mile of
Vehicle/Home)1,319 39.9% 192
Backpacking Overnight - More Than
1/4 Mile From Vehicle/Home946 28.6% 454
Camping (RV) 737 22.3% 212
Canoeing 794 24.0% 353
Climbing (Sport/Indoor/Boulder) 513 15.5% 408
Climbing
(Traditional/Ice/Mountaineering) 413 12.5% 694
Kayaking (White Water) 344 10.4% 650
Kayaking (Sea/Touring) 433 13.1% 728
Kayaking (Recreational) 618 18.7% 302
Rafting 417 12.6% 434
Hiking (Day) 1,435 43.4% 180
Horseback Riding 473 14.3% 234
Trail Running 671 20.3% 414
Fishing (Fly) 519 15.7% 334
Fishing (Freshwater/Other) 883 26.7% 97
Fishing (Saltwater) 437 13.2% 145
Skiing (Cross Country) 3,307 100.0% 1,408
Skiing (Alpine/Downhill) 1,362 41.2% 479
Skiing (Freeski) 777 23.5% 547
Snowboarding 708 21.4% 293
Snowmobiling 1,012 30.6% 588
Snowshoeing 873 26.4% 587
Telemarking (Downhill) 516 15.6% 503
Boxing 661 20.0% 444
Martial Arts 681 20.6% 458

Wrestling 380 11.5% 676
Billiards/Pool 1,134 34.3% 125
Bowling 1,187 35.9% 104
Darts 827 25.0% 191
Table Tennis 823 24.9% 198
Roller Hockey 446 13.5% 1,038
Roller Skating (2x2 Wheel) 582 17.6% 326
Roller Skating (In-line) 605 18.3% 359
Scooter Riding (Non-Motorized) 417 12.6% 350
Skateboarding 427 12.9% 280
Ice Skating 708 21.4% 274
Archery 635 19.2% 349
Hunting (Rifle) 589 17.8% 247
Hunting (Shotgun) 628 19.0% 333
Hunting (Handgun) 539 16.3% 627
Hunting (Bow) 486 14.7% 525
Shooting (Sport Clay) 489 14.8% 423
Shooting (Trap/Skeet) 476 14.4% 514
Target Shooting (Rifle) 608 18.4% 182
Target Shooting (Handgun) 523 15.8% 140
Boardsailing/Windsurfing 466 14.1% 1,007
Jet Skiing 711 21.5% 406
Sailing 698 21.1% 681
Scuba Diving 546 16.5% 717
Snorkeling 734 22.2% 396
Surfing 489 14.8% 740
Wakeboarding 397 12.0% 522
Water Skiing 675 20.4% 680
Tai Chi 377 11.4% 407
Football (Flag) 453 13.7% 280
Cardio Tennis 308 9.3% 845
Stand Up Paddling 344 10.4% 867
Boxing for Competition 433 13.1% 1,092
MMA for fitness 549 16.6% 830
MMA for competition 394 11.9% 1,322
'Boot Camp' Style Cross-Training 529 16.0% 314
Swimming on a Team 248 7.5% 357
Golf Instruction (Taken Professional
Instruction)387 11.7% 532
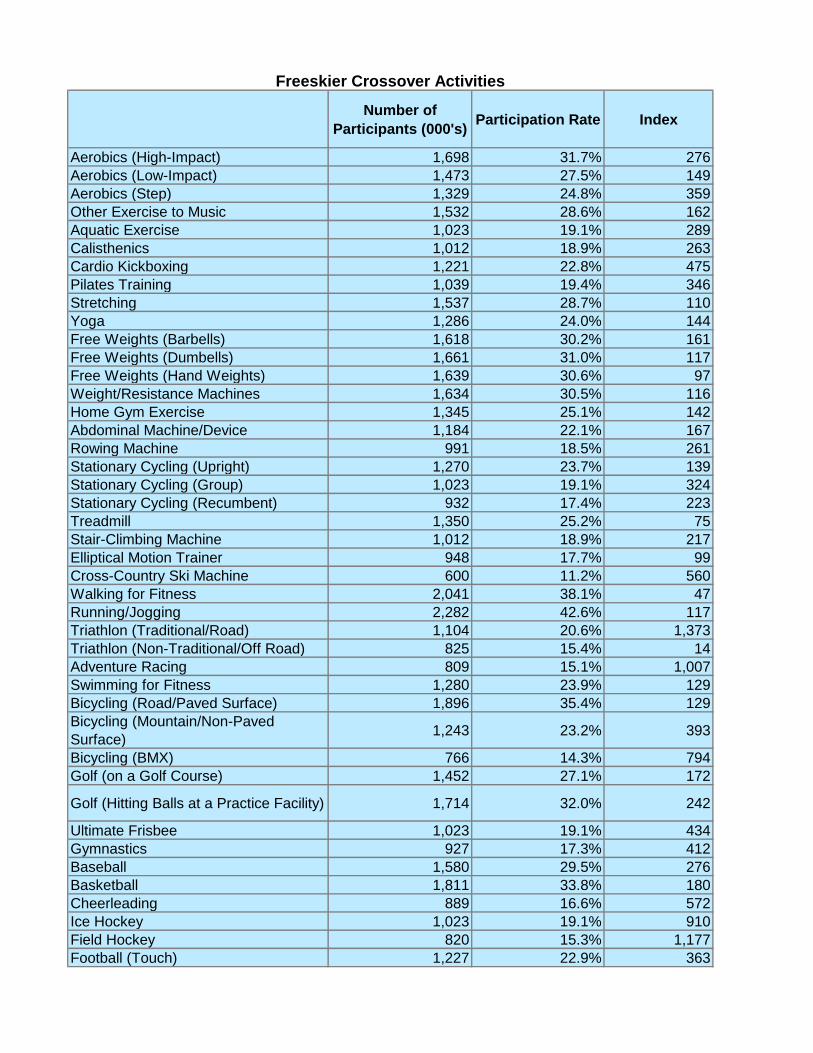
Number of
Participants (000's)Participation Rate Index
Aerobics (High-Impact) 1,698 31.7% 276
Aerobics (Low-Impact) 1,473 27.5% 149
Aerobics (Step) 1,329 24.8% 359
Other Exercise to Music 1,532 28.6% 162
Aquatic Exercise 1,023 19.1% 289
Calisthenics 1,012 18.9% 263
Cardio Kickboxing 1,221 22.8% 475
Pilates Training 1,039 19.4% 346
Stretching 1,537 28.7% 110
Yoga 1,286 24.0% 144
Free Weights (Barbells) 1,618 30.2% 161
Free Weights (Dumbells) 1,661 31.0% 117
Free Weights (Hand Weights) 1,639 30.6% 97
Weight/Resistance Machines 1,634 30.5% 116
Home Gym Exercise 1,345 25.1% 142
Abdominal Machine/Device 1,184 22.1% 167
Rowing Machine 991 18.5% 261
Stationary Cycling (Upright) 1,270 23.7% 139
Stationary Cycling (Group) 1,023 19.1% 324
Stationary Cycling (Recumbent) 932 17.4% 223
Treadmill 1,350 25.2% 75
Stair-Climbing Machine 1,012 18.9% 217
Elliptical Motion Trainer 948 17.7% 99
Cross-Country Ski Machine 600 11.2% 560
Walking for Fitness 2,041 38.1% 47
Running/Jogging 2,282 42.6% 117
Triathlon (Traditional/Road) 1,104 20.6% 1,373
Triathlon (Non-Traditional/Off Road) 825 15.4% 14
Adventure Racing 809 15.1% 1,007
Swimming for Fitness 1,280 23.9% 129
Bicycling (Road/Paved Surface) 1,896 35.4% 129
Bicycling (Mountain/Non-Paved
Surface) 1,243 23.2% 393
Bicycling (BMX) 766 14.3% 794
Golf (on a Golf Course) 1,452 27.1% 172
Golf (Hitting Balls at a Practice Facility) 1,714 32.0% 242
Ultimate Frisbee 1,023 19.1% 434
Gymnastics 927 17.3% 412
Baseball 1,580 29.5% 276
Basketball 1,811 33.8% 180
Cheerleading 889 16.6% 572
Ice Hockey 1,023 19.1% 910
Field Hockey 820 15.3% 1,177
Football (Touch) 1,227 22.9% 363
Freeskier Crossover Activities

Football (Tackle) 895 16.7% 315
Lacrosse 793 14.8% 1,138
Paintball 873 16.3% 543
Rugby 771 14.4% 1,440
Soccer (Indoor) 857 16.0% 400
Soccer (Outdoor) 1,382 25.8% 269
Softball (Slow-Pitch) 825 15.4% 266
Softball (Fast-Pitch) 873 16.3% 776
Track and Field 841 15.7% 491
Volleyball (Court) 1,039 19.4% 366
Volleyball (Grass) 852 15.9% 454
Volleyball (Beach) 1,018 19.0% 452
Badminton 1,200 22.4% 356
Racquetball 1,329 24.8% 752
Squash 980 18.3% 1,408
Tennis 1,334 24.9% 209
Birdwatching More Than 1/4 Mile From
Home/Vehicle1,141 21.3% 215
Wildlife Viewing More Than 1/4 Mile
From Home/Vehicle1,280 23.9% 149
Camping (Within 1/4 Mile of
Vehicle/Home)1,832 34.2% 164
Backpacking Overnight - More Than
1/4 Mile From Vehicle/Home1,296 24.2% 384
Camping (RV) 1,189 22.2% 211
Canoeing 986 18.4% 271
Climbing (Sport/Indoor/Boulder) 980 18.3% 482
Climbing
(Traditional/Ice/Mountaineering) 804 15.0% 833
Kayaking (White Water) 766 14.3% 894
Kayaking (Sea/Touring) 755 14.1% 783
Kayaking (Recreational) 921 17.2% 277
Rafting 734 13.7% 472
Hiking (Day) 1,511 28.2% 117
Horseback Riding 846 15.8% 259
Trail Running 836 15.6% 318
Fishing (Fly) 1,130 21.1% 449
Fishing (Freshwater/Other) 1,559 29.1% 106
Fishing (Saltwater) 1,061 19.8% 218
Skiing (Cross Country) 1,532 28.6% 403
Skiing (Alpine/Downhill) 2,245 41.9% 487
Skiing (Freeski) 5,357 100.0% 2,326
Snowboarding 1,768 33.0% 452
Snowmobiling 1,961 36.6% 704
Snowshoeing 1,050 19.6% 436
Telemarking (Downhill) 975 18.2% 587
Boxing 1,146 21.4% 476
Martial Arts 1,436 26.8% 596
Wrestling 852 15.9% 935

Billiards/Pool 2,234 41.7% 152
Bowling 2,277 42.5% 124
Darts 1,779 33.2% 253
Table Tennis 1,479 27.6% 219
Roller Hockey 911 17.0% 1,308
Roller Skating (2x2 Wheel) 1,125 21.0% 389
Roller Skating (In-line) 1,286 24.0% 471
Scooter Riding (Non-Motorized) 1,087 20.3% 564
Skateboarding 1,066 19.9% 433
Ice Skating 1,259 23.5% 301
Archery 991 18.5% 336
Hunting (Rifle) 1,104 20.6% 286
Hunting (Shotgun) 1,071 20.0% 351
Hunting (Handgun) 1,136 21.2% 815
Hunting (Bow) 895 16.7% 596
Shooting (Sport Clay) 991 18.5% 529
Shooting (Trap/Skeet) 991 18.5% 661
Target Shooting (Rifle) 1,468 27.4% 271
Target Shooting (Handgun) 1,264 23.6% 209
Boardsailing/Windsurfing 964 18.0% 1,286
Jet Skiing 1,811 33.8% 638
Sailing 1,355 25.3% 816
Scuba Diving 1,098 20.5% 891
Snorkeling 1,307 24.4% 436
Surfing 980 18.3% 915
Wakeboarding 841 15.7% 683
Water Skiing 1,120 20.9% 697
Tai Chi 846 15.8% 564
Football (Flag) 921 17.2% 351
Cardio Tennis 616 11.5% 1,045
Stand Up Paddling 680 12.7% 1,058
Boxing for Competition 1,018 19.0% 1,583
MMA for fitness 1,195 22.3% 1,115
MMA for competition 970 18.1% 2,011
'Boot Camp' Style Cross-Training 1,216 22.7% 445
Swimming on a Team 552 10.3% 490
Golf Instruction (Taken Professional
Instruction)841 15.7% 714

Number of
Participants (000's)Participation Rate Index
Aerobics (High-Impact) 1,492 20.3% 177
Aerobics (Low-Impact) 1,617 22.0% 120
Aerobics (Step) 926 12.6% 183
Other Exercise to Music 1,242 16.9% 95
Aquatic Exercise 823 11.2% 170
Calisthenics 912 12.4% 172
Cardio Kickboxing 992 13.5% 281
Pilates Training 735 10.0% 179
Stretching 1,911 26.0% 100
Yoga 1,536 20.9% 125
Free Weights (Barbells) 2,257 30.7% 163
Free Weights (Dumbells) 2,536 34.5% 131
Free Weights (Hand Weights) 2,543 34.6% 110
Weight/Resistance Machines 2,404 32.7% 124
Home Gym Exercise 1,838 25.0% 141
Abdominal Machine/Device 1,331 18.1% 137
Rowing Machine 970 13.2% 186
Stationary Cycling (Upright) 1,323 18.0% 105
Stationary Cycling (Group) 919 12.5% 212
Stationary Cycling (Recumbent) 662 9.0% 115
Treadmill 2,367 32.2% 96
Stair-Climbing Machine 1,103 15.0% 172
Elliptical Motion Trainer 1,286 17.5% 98
Cross-Country Ski Machine 522 7.1% 355
Walking for Fitness 3,146 42.8% 53
Running/Jogging 3,661 49.8% 137
Triathlon (Traditional/Road) 581 7.9% 527
Triathlon (Non-Traditional/Off Road) 419 5.7% 518
Adventure Racing 507 6.9% 460
Swimming for Fitness 1,610 21.9% 118
Bicycling (Road/Paved Surface) 2,588 35.2% 128
Bicycling (Mountain/Non-Paved
Surface) 1,389 18.9% 320
Bicycling (BMX) 581 7.9% 439
Golf (on a Golf Course) 1,867 25.4% 161
Golf (Hitting Balls at a Practice Facility) 1,669 22.7% 172
Ultimate Frisbee 1,095 14.9% 339
Gymnastics 742 10.1% 240
Baseball 1,448 19.7% 184
Basketball 2,110 28.7% 153
Cheerleading 500 6.8% 234
Ice Hockey 720 9.8% 467
Field Hockey 551 7.5% 577
Football (Touch) 1,191 16.2% 257
Snowboard Crossover Activities

Football (Tackle) 1,169 15.9% 300
Lacrosse 647 8.8% 677
Paintball 1,081 14.7% 490
Rugby 507 6.9% 690
Soccer (Indoor) 838 11.4% 285
Soccer (Outdoor) 1,404 19.1% 199
Softball (Slow-Pitch) 875 11.9% 205
Softball (Fast-Pitch) 551 7.5% 357
Track and Field 691 9.4% 294
Volleyball (Court) 978 13.3% 251
Volleyball (Grass) 853 11.6% 331
Volleyball (Beach) 897 12.2% 290
Badminton 1,066 14.5% 230
Racquetball 735 10.0% 303
Squash 537 7.3% 562
Tennis 1,823 24.8% 208
Birdwatching More Than 1/4 Mile From
Home/Vehicle838 11.4% 115
Wildlife Viewing More Than 1/4 Mile
From Home/Vehicle1,294 17.6% 110
Camping (Within 1/4 Mile of
Vehicle/Home)2,573 35.0% 168
Backpacking Overnight - More Than
1/4 Mile From Vehicle/Home1,397 19.0% 302
Camping (RV) 1,441 19.6% 187
Canoeing 1,154 15.7% 231
Climbing (Sport/Indoor/Boulder) 1,117 15.2% 400
Climbing
(Traditional/Ice/Mountaineering) 720 9.8% 544
Kayaking (White Water) 573 7.8% 488
Kayaking (Sea/Touring) 676 9.2% 511
Kayaking (Recreational) 1,051 14.3% 231
Rafting 551 7.5% 259
Hiking (Day) 2,146 29.2% 121
Horseback Riding 867 11.8% 193
Trail Running 1,088 14.8% 302
Fishing (Fly) 720 9.8% 209
Fishing (Freshwater/Other) 2,213 30.1% 109
Fishing (Saltwater) 978 13.3% 146
Skiing (Cross Country) 731 10.0% 141
Skiing (Alpine/Downhill) 1,389 18.9% 220
Skiing (Freeski) 934 12.7% 295
Snowboarding 5,357 100.0% 1,370
Snowmobiling 1,669 22.7% 437
Snowshoeing 662 9.0% 200
Telemarking (Downhill) 529 7.2% 232
Boxing 1,095 14.9% 331
Martial Arts 1,286 17.5% 389
Wrestling 713 9.7% 571

Billiards/Pool 2,955 40.2% 146
Bowling 2,962 40.3% 117
Darts 1,926 26.2% 200
Table Tennis 1,838 25.0% 198
Roller Hockey 654 8.9% 685
Roller Skating (2x2 Wheel) 867 11.8% 219
Roller Skating (In-line) 1,139 15.5% 304
Scooter Riding (Non-Motorized) 978 13.3% 369
Skateboarding 1,727 23.5% 511
Ice Skating 1,308 17.8% 228
Archery 1,044 14.2% 258
Hunting (Rifle) 1,250 17.0% 236
Hunting (Shotgun) 1,088 14.8% 260
Hunting (Handgun) 728 9.9% 381
Hunting (Bow) 662 9.0% 321
Shooting (Sport Clay) 956 13.0% 371
Shooting (Trap/Skeet) 889 12.1% 432
Target Shooting (Rifle) 1,558 21.2% 210
Target Shooting (Handgun) 1,367 18.6% 165
Boardsailing/Windsurfing 573 7.8% 557
Jet Skiing 1,529 20.8% 392
Sailing 889 12.1% 390
Scuba Diving 794 10.8% 470
Snorkeling 1,117 15.2% 271
Surfing 934 12.7% 635
Wakeboarding 1,095 14.9% 648
Water Skiing 1,228 16.7% 557
Tai Chi 551 7.5% 268
Football (Flag) 1,088 14.8% 302
Cardio Tennis 470 6.4% 582
Stand Up Paddling 404 5.5% 458
Boxing for Competition 662 9.0% 750
MMA for fitness 1,095 14.9% 745
MMA for competition 500 6.8% 756
'Boot Camp' Style Cross-Training 970 13.2% 259
Swimming on a Team 412 5.6% 267
Golf Instruction (Taken Professional
Instruction)625 8.5% 386

Number of
Participants (000's)Participation Rate Index
Aerobics (High-Impact) 1,003 24.9% 217
Aerobics (Low-Impact) 1,176 29.2% 159
Aerobics (Step) 733 18.2% 264
Other Exercise to Music 1,056 26.2% 148
Aquatic Exercise 886 22.0% 333
Calisthenics 701 17.4% 242
Cardio Kickboxing 624 15.5% 323
Pilates Training 677 16.8% 300
Stretching 1,249 31.0% 119
Yoga 1,120 27.8% 166
Free Weights (Barbells) 1,120 27.8% 148
Free Weights (Dumbells) 1,334 33.1% 125
Free Weights (Hand Weights) 1,394 34.6% 110
Weight/Resistance Machines 1,201 29.8% 113
Home Gym Exercise 943 23.4% 132
Abdominal Machine/Device 935 23.2% 176
Rowing Machine 681 16.9% 238
Stationary Cycling (Upright) 1,044 25.9% 151
Stationary Cycling (Group) 725 18.0% 305
Stationary Cycling (Recumbent) 608 15.1% 194
Treadmill 1,354 33.6% 100
Stair-Climbing Machine 774 19.2% 221
Elliptical Motion Trainer 822 20.4% 114
Cross-Country Ski Machine 371 9.2% 460
Walking for Fitness 2,293 56.9% 70
Running/Jogging 1,579 39.2% 108
Triathlon (Traditional/Road) 532 13.2% 880
Triathlon (Non-Traditional/Off Road) 451 11.2% 1,018
Adventure Racing 620 15.4% 1,027
Swimming for Fitness 1,100 27.3% 148
Bicycling (Road/Paved Surface) 1,660 41.2% 150
Bicycling (Mountain/Non-Paved
Surface) 991 24.6% 417
Bicycling (BMX) 407 10.1% 561
Golf (on a Golf Course) 1,056 26.2% 166
Golf (Hitting Balls at a Practice Facility) 1,088 27.0% 205
Ultimate Frisbee 709 17.6% 400
Gymnastics 596 14.8% 352
Baseball 786 19.5% 182
Basketball 995 24.7% 131
Cheerleading 443 11.0% 379
Ice Hockey 608 15.1% 719
Field Hockey 475 11.8% 908
Football (Touch) 806 20.0% 317
Snowshoe Crossover Activities

Football (Tackle) 463 11.5% 217
Lacrosse 391 9.7% 746
Paintball 568 14.1% 470
Rugby 375 9.3% 930
Soccer (Indoor) 463 11.5% 288
Soccer (Outdoor) 689 17.1% 178
Softball (Slow-Pitch) 689 17.1% 295
Softball (Fast-Pitch) 330 8.2% 390
Track and Field 524 13.0% 406
Volleyball (Court) 600 14.9% 281
Volleyball (Grass) 600 14.9% 426
Volleyball (Beach) 669 16.6% 395
Badminton 766 19.0% 302
Racquetball 532 13.2% 400
Squash 451 11.2% 862
Tennis 991 24.6% 207
Birdwatching More Than 1/4 Mile From
Home/Vehicle1,035 25.7% 260
Wildlife Viewing More Than 1/4 Mile
From Home/Vehicle1,543 38.3% 239
Camping (Within 1/4 Mile of
Vehicle/Home)1,720 42.7% 205
Backpacking Overnight - More Than
1/4 Mile From Vehicle/Home1,100 27.3% 433
Camping (RV) 991 24.6% 234
Canoeing 1,100 27.3% 401
Climbing (Sport/Indoor/Boulder) 725 18.0% 474
Climbing
(Traditional/Ice/Mountaineering) 552 13.7% 761
Kayaking (White Water) 564 14.0% 875
Kayaking (Sea/Touring) 568 14.1% 783
Kayaking (Recreational) 979 24.3% 392
Rafting 584 14.5% 500
Hiking (Day) 1,974 49.0% 203
Horseback Riding 560 13.9% 228
Trail Running 717 17.8% 363
Fishing (Fly) 733 18.2% 387
Fishing (Freshwater/Other) 1,805 44.8% 163
Fishing (Saltwater) 653 16.2% 178
Skiing (Cross Country) 1,253 31.1% 438
Skiing (Alpine/Downhill) 1,326 32.9% 383
Skiing (Freeski) 766 19.0% 442
Snowboarding 915 22.7% 311
Snowmobiling 1,257 31.2% 600
Snowshoeing 4,029 100.0% 2,222
Telemarking (Downhill) 705 17.5% 565
Boxing 745 18.5% 411
Martial Arts 753 18.7% 416
Wrestling 540 13.4% 788
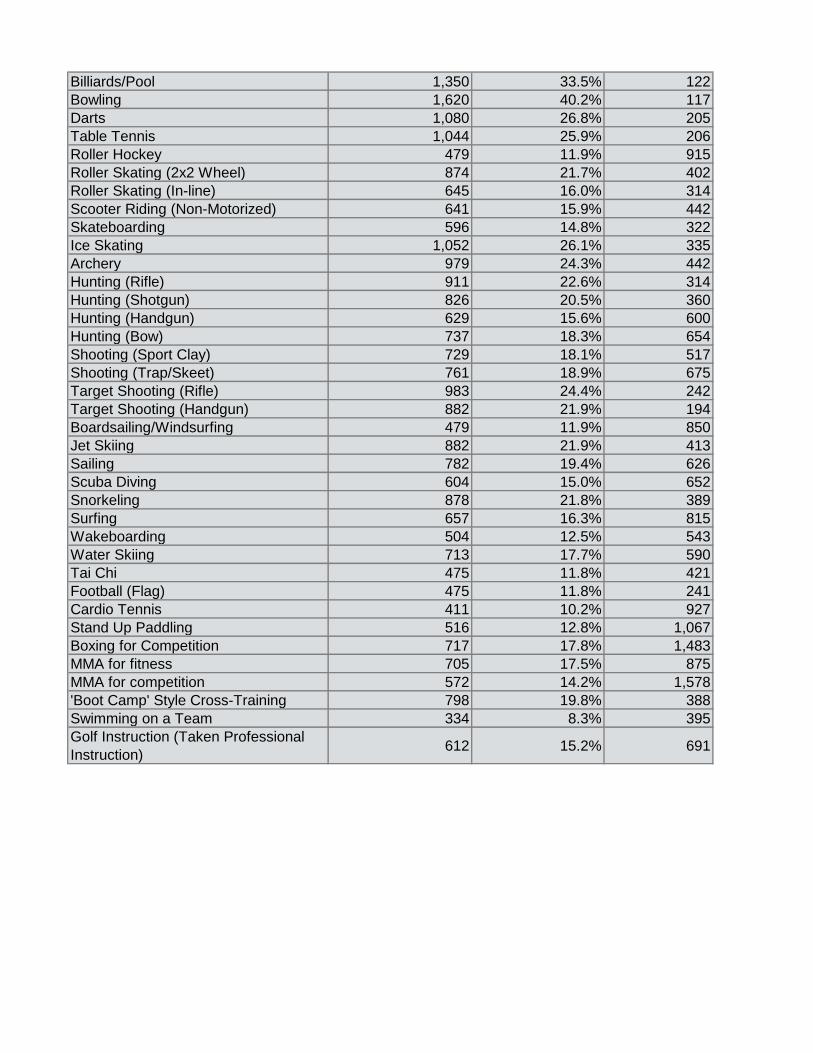
Billiards/Pool 1,350 33.5% 122
Bowling 1,620 40.2% 117
Darts 1,080 26.8% 205
Table Tennis 1,044 25.9% 206
Roller Hockey 479 11.9% 915
Roller Skating (2x2 Wheel) 874 21.7% 402
Roller Skating (In-line) 645 16.0% 314
Scooter Riding (Non-Motorized) 641 15.9% 442
Skateboarding 596 14.8% 322
Ice Skating 1,052 26.1% 335
Archery 979 24.3% 442
Hunting (Rifle) 911 22.6% 314
Hunting (Shotgun) 826 20.5% 360
Hunting (Handgun) 629 15.6% 600
Hunting (Bow) 737 18.3% 654
Shooting (Sport Clay) 729 18.1% 517
Shooting (Trap/Skeet) 761 18.9% 675
Target Shooting (Rifle) 983 24.4% 242
Target Shooting (Handgun) 882 21.9% 194
Boardsailing/Windsurfing 479 11.9% 850
Jet Skiing 882 21.9% 413
Sailing 782 19.4% 626
Scuba Diving 604 15.0% 652
Snorkeling 878 21.8% 389
Surfing 657 16.3% 815
Wakeboarding 504 12.5% 543
Water Skiing 713 17.7% 590
Tai Chi 475 11.8% 421
Football (Flag) 475 11.8% 241
Cardio Tennis 411 10.2% 927
Stand Up Paddling 516 12.8% 1,067
Boxing for Competition 717 17.8% 1,483
MMA for fitness 705 17.5% 875
MMA for competition 572 14.2% 1,578
'Boot Camp' Style Cross-Training 798 19.8% 388
Swimming on a Team 334 8.3% 395
Golf Instruction (Taken Professional
Instruction)612 15.2% 691

Number of
Participants (000's)Participation Rate Index
Aerobics (High-Impact) 1,106 40.0% 223
Aerobics (Low-Impact) 1,082 39.1% 2,607
Aerobics (Step) 1,131 40.9% 122
Other Exercise to Music 752 27.2% 1,183
Aquatic Exercise 1,082 39.1% 211
Calisthenics 1,001 36.2% 683
Cardio Kickboxing 974 35.2% 1,006
Pilates Training 1,131 40.9% 470
Stretching 1,159 41.9% 317
Yoga 946 34.2% 543
Free Weights (Barbells) 993 35.9% 1,197
Free Weights (Dumbells) 943 34.1% 501
Free Weights (Hand Weights) 1,029 37.2% 348
Weight/Resistance Machines 827 29.9% 586
Home Gym Exercise 857 31.0% 689
Abdominal Machine/Device 631 22.8% 1,900
Rowing Machine 1,057 38.2% 242
Stationary Cycling (Upright) 705 25.5% 1,275
Stationary Cycling (Group) 976 35.3% 1,681
Stationary Cycling (Recumbent) 578 20.9% 410
Treadmill 824 29.8% 648
Stair-Climbing Machine 514 18.6% 886
Elliptical Motion Trainer 680 24.6% 502
Cross-Country Ski Machine 705 25.5% 1,109
Walking for Fitness 1,104 39.9% 1,995
Running/Jogging 1,032 37.3% 888
Triathlon (Traditional/Road) 949 34.3% 165
Triathlon (Non-Traditional/Off Road) 628 22.7% 1,892
Adventure Racing 935 33.8% 1,878
Swimming for Fitness 819 29.6% 1,138
Bicycling (Road/Paved Surface) 1,012 36.6% 1,262
Bicycling (Mountain/Non-Paved
Surface) 822 29.7% 413
Bicycling (BMX) 703 25.4% 847
Golf (on a Golf Course) 1,159 41.9% 590
Golf (Hitting Balls at a Practice Facility) 741 26.8% 479
Ultimate Frisbee 918 33.2% 535
Gymnastics 976 35.3% 1,103
Baseball 1,311 47.4% 182
Basketball 938 33.9% 892
Cheerleading 824 29.8% 382
Ice Hockey 907 32.8% 538
Field Hockey 952 34.4% 215
Football (Touch) 871 31.5% 606
Football (Tackle) 838 30.3% 2,331
Telemark Ski Crossover Activities

Lacrosse 896 32.4% 689
Paintball 849 30.7% 112
Rugby 891 32.2% 117
Soccer (Indoor) 827 29.9% 831
Soccer (Outdoor) 791 28.6% 817
Softball (Slow-Pitch) 987 35.7% 372
Softball (Fast-Pitch) 797 28.8% 1,029
Track and Field 589 21.3% 2,367
Volleyball (Court) 932 33.7% 1,872
Volleyball (Grass) 683 24.7% 882
Volleyball (Beach) 913 33.0% 1,138
Badminton 982 35.5% 612
Racquetball 880 31.8% 740
Squash 963 34.8% 292
Tennis 1,023 37.0% 197
Birdwatching More Than 1/4 Mile From
Home/Vehicle1,084 39.2% 3,564
Wildlife Viewing More Than 1/4 Mile
From Home/Vehicle971 35.1% 836
Camping (Within 1/4 Mile of
Vehicle/Home)1,236 44.7% 142
Backpacking Overnight - More Than
1/4 Mile From Vehicle/Home1,322 47.8% 854
Camping (RV) 1,048 37.9% 861
Canoeing 965 34.9% 1,058
Climbing (Sport/Indoor/Boulder) 863 31.2% 693
Climbing
(Traditional/Ice/Mountaineering) 888 32.1% 353
Kayaking (White Water) 791 28.6% 1,021
Kayaking (Sea/Touring) 852 30.8% 684
Kayaking (Recreational) 791 28.6% 283
Rafting 849 30.7% 89
Hiking (Day) 902 32.6% 665
Horseback Riding 617 22.3% 1,115
Trail Running 824 29.8% 542
Fishing (Fly) 852 30.8% 1,812
Fishing (Freshwater/Other) 946 34.2% 326
Fishing (Saltwater) 783 28.3% 2,021
Skiing (Cross-Country) 1,394 50.4% 285
Skiing (Alpine/Downhill) 1,264 45.7% 274
Skiing (Freestyle) 1,339 48.4% 672
Snowboarding 1,380 49.9% 756
Snowmobiling 1,585 57.3% 311
Snowshoeing 1,330 48.1% 1,002
Telemarking (Downhill) 2,766 100.0% 870
Boxing 1,225 44.3% 168
Martial Arts 1,472 53.2% 771
Wrestling 885 32.0% 451
Billiards/Pool 1,148 41.5% 703
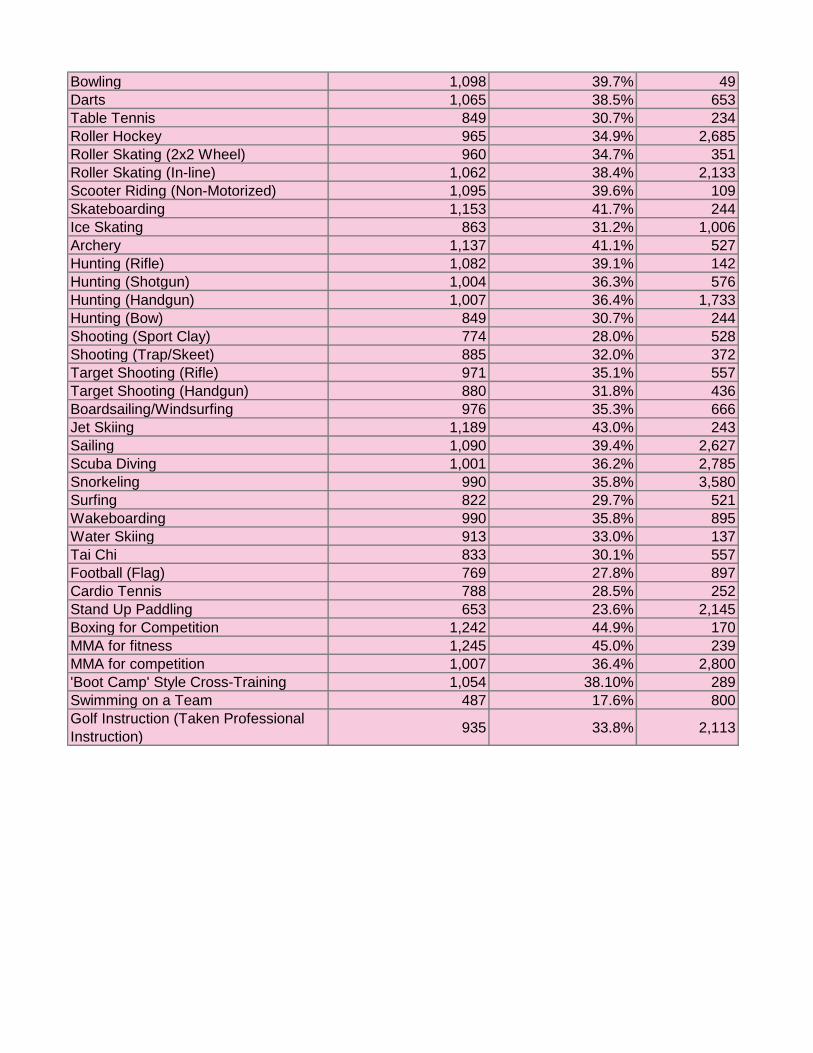
Bowling 1,098 39.7% 49
Darts 1,065 38.5% 653
Table Tennis 849 30.7% 234
Roller Hockey 965 34.9% 2,685
Roller Skating (2x2 Wheel) 960 34.7% 351
Roller Skating (In-line) 1,062 38.4% 2,133
Scooter Riding (Non-Motorized) 1,095 39.6% 109
Skateboarding 1,153 41.7% 244
Ice Skating 863 31.2% 1,006
Archery 1,137 41.1% 527
Hunting (Rifle) 1,082 39.1% 142
Hunting (Shotgun) 1,004 36.3% 576
Hunting (Handgun) 1,007 36.4% 1,733
Hunting (Bow) 849 30.7% 244
Shooting (Sport Clay) 774 28.0% 528
Shooting (Trap/Skeet) 885 32.0% 372
Target Shooting (Rifle) 971 35.1% 557
Target Shooting (Handgun) 880 31.8% 436
Boardsailing/Windsurfing 976 35.3% 666
Jet Skiing 1,189 43.0% 243
Sailing 1,090 39.4% 2,627
Scuba Diving 1,001 36.2% 2,785
Snorkeling 990 35.8% 3,580
Surfing 822 29.7% 521
Wakeboarding 990 35.8% 895
Water Skiing 913 33.0% 137
Tai Chi 833 30.1% 557
Football (Flag) 769 27.8% 897
Cardio Tennis 788 28.5% 252
Stand Up Paddling 653 23.6% 2,145
Boxing for Competition 1,242 44.9% 170
MMA for fitness 1,245 45.0% 239
MMA for competition 1,007 36.4% 2,800
'Boot Camp' Style Cross-Training 1,054 38.10% 289
Swimming on a Team 487 17.6% 800
Golf Instruction (Taken Professional
Instruction)935 33.8% 2,113