si table 1: guinea worm case data by country or … · web viewthe countries with the starkest...
TRANSCRIPT

Supplemental Information
1. Background on Guinea worm case data1-7
The country-level annual case reports enumerate the number of individuals with Guinea worm
disease in a calendar year (January-December). These individuals were typically counted as a case only
once in a given year, when the first Guinea worm emerged; if that individual went on to experience
subsequent cases in that calendar year those were not counted separately. To ensure that cases were
attributed to the burden of Guinea worm disease in the country in which the case was detected, both
indigenous and imported cases were included.
Case data in the early 1990s suggests under-reporting. To account for implausible case reports, the
data were reviewed longitudinally. If there is an order of magnitude difference in the case series, the
lower year was outliered from the main analysis. For example, Niger: 1991: 32,829 cases; 1992: 500
cases; 1993: 25,346 cases). Table 2 presents the year annual case searches were complete, as well as
reporting rates from 1995 to justify exclusion of data points from the early 1990s.
By design, the Guinea worm eradication programmatic infrastructure covers the entire at-risk
population in endemic countries. Since case containment is a key intervention designed to not only
interrupt transmission but also monitor progress towards eradication, incident cases of guinea worm
disease are generally considered nationally representative. Case reporting occurs at the village level on a
monthly basis; case data are then aggregated within the national Guinea Worm Eradication Program and
reported to the World Health Organization. In settings where annual case reports are low (suggesting no
transmission) or transmission has been interrupted, cash rewards are promoted to enhance surveillance
activities until national elimination is certified. Containment is defined as: detection within 24 hours of
the worm's emergence; the patient did not contaminate any water source; the patient received proper
wound care and health education on not entering any water source; a supervisor verified the case as
dracunculiasis within seven days; and Abate® is used if there is any uncertainty about contamination of
water sources or known contamination of water sources.

SI Table 1: Guinea worm case data by country or subnational division, by year
Geography 1990 1991 1992 1993 1994 1995 1996 1997 1998 1999Benin 37417 4006* 4315* 16334 4302 2273 1427 855 695 492Burkina Faso 42187 * 11784 8281 6861 6281 3241 2477 2227 2184Cameroon 742 393 127 72 30 15 17 19 23 8Central African Republic
* * * * * 18 9* 5* 34 26
Chad * * 156* 1231 640 149 127 25 3 1Cote d’Ivoire 1360* 12690 * 8034 5061 3801 2794 1254 1414 476Ethiopia 2333 * 303* 1120 1252 514 371 451 366 249Ghana 123793 66697 33464 17918 8432 8894 4877 8921 5473 9027India Andhra Pradesh 207 120 26 0 0 0 0 0 0 0 Gujarat 22 0 0 0 0 0 0 0 0 0 Karnataka 634 226 167 29 10 0 0 0 0 0 Madhya Pradesh 333 120 91 179 13 0 0 0 0 0 Maharashtra 209 0 1 0 0 0 0 0 0 0 Rajasthan 3376 1712 792 547 348 60 90 0 0 0 Tamil Nadu 0 1 0 0 0 0 0 0 0 0 Telangana 17 6 4 0 0 0 0 0 0 0Kenya Turkana County 6* * * 35 37 23 0 6 7 1Mali 884* 16024 * 12011 5581 4218 2402 1099 650 410Mauritania 8036 * 1557* 5882 5029 1762 562 388 379 255Niger * 32829 500* 25346 18562 13821 2956 3030 2700 1920Nigeria 394082 281937 183169 75752 39774 16374 12282 12590 13420 13237Pakistan 160 106 23 2 0 0 0 0 0 0Senegal 38* 1341 728 815 195 76 19 4 0 0South Sudan** * * * * 53139 60555 116844* 42944 47126 65805Sudan * * 2447 2984 132* 4053 1734 652 851 292Togo 3042* 5118* 8179 10349 5044 2073 1626 1762 2128 1589Uganda 4704* * 126369* 42852 10425 4810 1455 1374 1061 321Yemen * * * * 106 82 62 7 0 0
*Years for which data were missing or considered implausible.**Although South Sudan was not independent until 2011, the GBD estimates disease burden using current political boundaries and applies those boundaries retrospectively.

SI Table 1 (continued): Guinea worm case data by country or subnational division, by year
Geography 2000 2001 2002 2003 2004 2005 2006 2007 2008 2009Benin 186 172 181 30 3 1 0 0 0 0Burkina Faso 1956 1032 591 203 60 30 5 3 1 0Cameroon 5 5 3 0 0 0 0 0 0 0Central African Republic
35 36 * 0 0 0 0 0 0 0
Chad 3 0 0 0 0 0 0 0 0 0Cote d’Ivoire 297 231 198 42 21 10 5 0 0 0Ethiopia 60 29 47 28 17 37 3 3 41 24Ghana 7402 4739 5611 8290 7275 3981 4136 3358 501 242India Andhra Pradesh 0 0 0 0 0 0 0 0 0 0 Gujarat 0 0 0 0 0 0 0 0 0 0 Karnataka 0 0 0 0 0 0 0 0 0 0 Madhya Pradesh 0 0 0 0 0 0 0 0 0 0 Maharashtra 0 0 0 0 0 0 0 0 0 0 Rajasthan 0 0 0 0 0 0 0 0 0 0 Tamil Nadu 0 0 0 0 0 0 0 0 0 0 Telangana 0 0 0 0 0 0 0 0 0 0Kenya Turkana County 4 8 17 12 7 2 0 0 0 0Mali 290 718 861 829 357 659 329 313 417 186Mauritania 136 94 42 13 3 0 0 0 0 0Niger 1166 417 248 293 240 183 110 14 3 5Nigeria 7869 5355 3820 1459 495 120 16 73 38 0Pakistan 0 0 0 0 0 0 0 0 0 0Senegal 0 1 0 0 0 0 0 0 0 0South Sudan** 54800 49339 41403 20270 7255 5569 20582 5815 3618 2733Sudan 90 132 90 29 11 0 0 0 0 0Togo 1354 1502 669 278 73 29 2 0 0 0Uganda 96 55 24 26 4 9 2 4 0 0Yemen 0 1 0 0 0 0 0 0 0 0
*Years for which data were missing or considered implausible. **Although South Sudan was not independent until 2011, the GBD estimates disease burden using current political boundaries and applies those boundaries retrospectively.

SI Table 1 (continued): Guinea worm case data by country or subnational division, by year
Geography 2010 2011 2012 2013 2014 2015 2016Benin 0 0 0 0 0 0 0Burkina Faso 0 0 0 0 0 0 0Cameroon 0 0 0 0 0 0 0Central African Republic
0 0 0 0 0 0 0
Chad 10 10 10 14 13 9 16Cote d’Ivoire 0 0 0 0 0 0 0Ethiopia 21 8 4 7 3 3 3Ghana 8 0 0 0 0 0 0India Andhra Pradesh 0 0 0 0 0 0 0 Gujarat 0 0 0 0 0 0 0 Karnataka 0 0 0 0 0 0 0 Madhya Pradesh 0 0 0 0 0 0 0 Maharashtra 0 0 0 0 0 0 0 Rajasthan 0 0 0 0 0 0 0 Tamil Nadu 0 0 0 0 0 0 0 Telangana 0 0 0 0 0 0 0Kenya Turkana County 0 0 0 0 0 0 0Mali 57 12 4 11 40 5 0Mauritania 0 0 0 0 0 0 0Niger 3 0 3 0 0 0 0Nigeria 0 0 0 0 0 0 0Pakistan 0 0 0 0 0 0 0Senegal 0 0 0 0 0 0 0South Sudan** 1698 1028 521 113 70 5 6Sudan 0 0 0 3 0 0 0Togo 0 0 0 0 0 0 0Uganda 0 0 0 0 0 0 0Yemen 0 0 0 0 0 0 0
*Years for which data were missing or considered implausible. **Although South Sudan was not independent until 2011, the GBD estimates disease burden using current political boundaries and applies those boundaries retrospectively.

2. Summary of country-level Guinea worm case searches and reporting
SI Table 2: National case search completion and reporting rate
CountryNational case search
completedReporting rate 19958
(%)Benin 19909 81Burkina Faso 19909 80Cameroon 199010 86Central African Republic 19919 NR*Chad 199411 99Cote d’Ivoire 19919 95Ethiopia 199312 86Ghana 198910 88India 198013 100Kenya 199414 NR*Mali 199215 87Mauritania 19919 96Niger 19919 88Nigeria 199016 79Pakistan 198713 -Senegal 19919 100South Sudan** - NR*Sudan 199312 NR*Togo 19919 94Uganda 199217 95Yemen 199518 99
*NR: Not reported.
**South Sudan and Sudan Guinea worm eradication program data were reported under one national program until 2006. Case searches and annual reporting in the 1990s was limited to accessible areas.

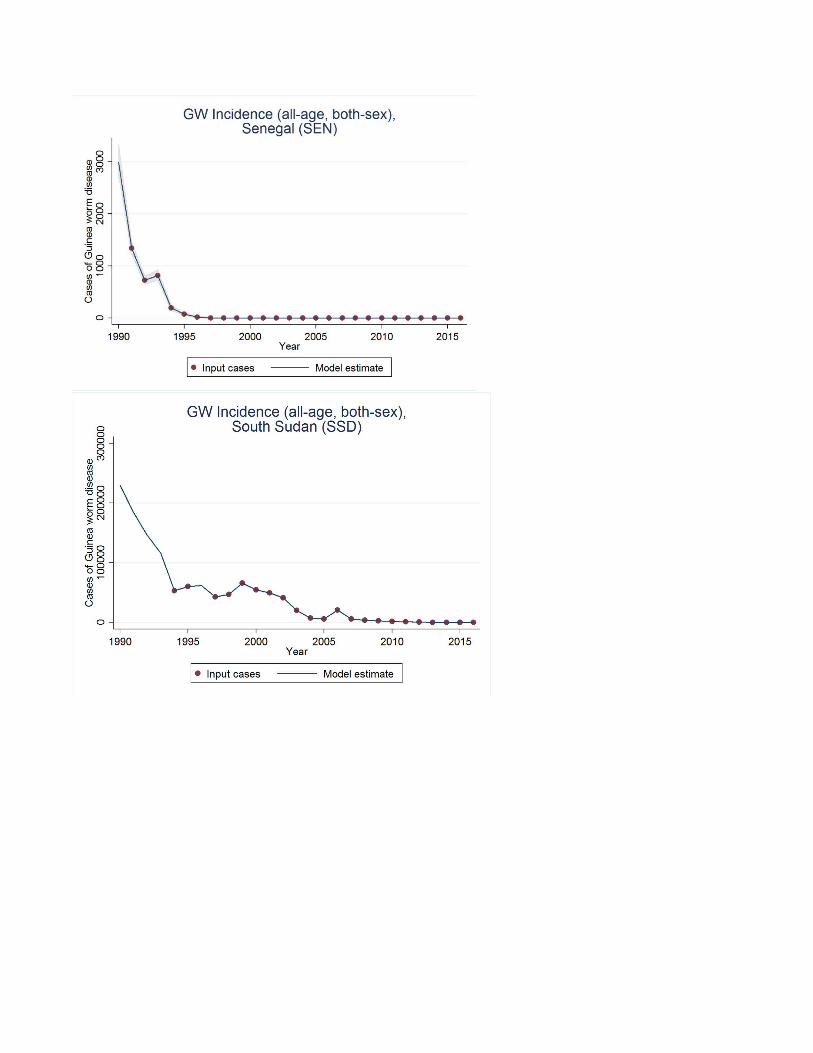
3. Country-specific model results
The countries with the starkest difference between reported cases and cases predicted by the model
were Uganda and South Sudan, largely due to either the high case burden or sequential years of
missing data. In the case of Uganda, the 1992 case data were set to missing because their inclusion
resulted in over 1 million cases predicted in 1990, which upon review of preliminary results was
considered a gross over-prediction. For South Sudan, inclusion of the 1996 data point of 116,844
cases also resulted in vast over-prediction of cases in the early 1990s. While we do not dispute the
case burden in these two countries was likely quite high, in order to generate stable model estimates
overall, these points were treated as outliers in the analysis. In contrast, Central African Republic
(CAR) and Kenya model predictions did not fit the data well due to the extremely low numbers (<30
cases) as well as several years of missing data.


References 1. Biswas G, Sankara DP, Agua-Agum J, Maiga A. Dracunculiasis (guinea worm disease): eradication without a drug or a vaccine. Philos Trans R Soc Lond B Biol Sci 2013;368:20120146.2. Richards F, Hopkins D. Surveillance: the foundation for control and elimination of dracunculiasis in Africa. Int J Epidemiol 1989;18:934-43.3. Hopkins DR, Ruiz-Tiben E, Weiss A, Withers PC, Jr., Eberhard ML, Roy SL. Dracunculiasis eradication: and now, South Sudan. Am J Trop Med Hyg 2013;89:5-10.4. Hopkins DR, Ruiz-Tiben E, Ruebush TK, Diallo N, Agle A, Withers PC, Jr. Dracunculiasis eradication: delayed, not denied. Am J Trop Med Hyg 2000;62:163-8.5. Hopkins DR, Ruiz-Tiben E. Strategies for dracunculiasis eradication. Bull World Health Organ 1991;69:533-40.6. Hopkins DR. Disease eradication. N Engl J Med 2013;368:54-63.7. Hopkins DR. The Guinea worm eradication effort: lessons for the future. Emerg Infect Dis 1998;4:414-5.8. Dracunculiasis. Wkly Epidemiol Rec 1996;71:141-8.9. WHO Collaborating Center for Research TaEoD. Guinea Worm Wrap-Up. Atlanta, GA: Centers for Disease Control and Prevention; 1991 December 31, 1991.10. WHO Collaborating Center for Research TaEoD. Guinea Worm Wrap-Up. Atlanta, GA: Centers for Disease Control and Prevention; 1990 December 31, 1990.11. WHO Collaborating Center for Research TaEoD. Guinea Worm Wrap-Up. Atlanta, GA: Centers for Disease Control and Prevention; 1994 April 20, 1994.12. WHO Collaborating Center for Research TaEoD. Guinea Worm Wrap-Up. Atlanta, GA: Centers for Disease Control and Prevention; 1993 October 18, 1993.13. WHO Collaborating Center for Research TaEoD. Guinea Worm Wrap-Up. Atlanta, GA: Centers for Disease Control and Prevention; 1990 April 15, 1990.14. WHO Collaborating Center for Research TaEoD. Guinea Worm Wrap-Up. Atlanta, GA: Centers for Disease Control and Prevention; 1994 December 30, 1994.15. WHO Collaborating Center for Research TaEoD. Guinea Worm Wrap-Up. Atlanta, GA: Centers for Disease Control and Prevention; 1993 January 20, 1993.16. WHO Collaborating Center for Research TaEoD. Guinea Worm Wrap-Up. Atlanta, GA: Centers for Disease Control and Prevention; 1989 April 15, 1989.17. WHO Collaborating Center for Research TaEoD. Guinea Worm Wrap-Up. Atlanta, GA: Centers for Disease Control and Prevention; 1992 September 18, 1992.18. WHO Collaborating Center for Research TaEoD. Guinea Worm Wrap-Up. Atlanta, GA: Centers for Disease Control and Prevention; 1995 July 14, 1995.