shrp ii r-11 strategic approaches at the corridor and network levels to minimize disruptions from...
TRANSCRIPT
SHRP II R-11Strategic Approaches at the Corridor and Network Levels
to Minimize Disruptions From the Renewal Process
June 10, 2014 Webinar
Project Purpose
• Phase I of this project identified widely varying levels of effort and sophistication in sequencing renewal projects.
• A need for a software tool was identified.
Primary Target Audiences
• DOT Program Managers in moderately and densely urbanized States, experiencing congestion, and with an active Renewal program.
• Planners and Program Managers in moderate and large MPO’s, with an active Renewal program.
Primary Requirements
• The tool MUST NOT require user to abandon work done on management systems (PMS, BMS, etc.)
• The tool MUST NOT require user to collect new data or require additional personnel
Phases II & III– Software Development
Workzone Implementation Strategies Estimator(WISE)
An Engine in Two Parts
• Planning (Project Sequencing Optimization Engine).
• Operational Software• A converted Network and data sets are the
only pre-requisites.
Microsimulation software is used to create diversion estimates to feed back into the Planning Module- described in Phase IV
Common Terms• Program : One complete instance of WISE consisting of the Strategies,
Planning Characteristics, Project information, Planning analysis and Operation Analysis.
• WorkSpace : The folder which contains all of the material for ONE Program(from above). This is an active directory for all activity within the current Program.
• Project : One instance of construction with a Program. Each Program must have between 2 and 5 Projects.
• NeXTA: Network Explorer for Traffic Analysis which is used to import Networks to WISE.
• Network : The NeXTA generated network which contains the model where the WISE Program exists.
• Planning Mode : Mode which allows user to generate a Program and run WISE Analysis Engine
• Operation Mode : Mode which allows users to interface with microcomputer software to run Base Scenario and individual Project Scenarios to determine Work Zone Volumes with and without Projects. Diversion Results are fed back to Planning Mode.
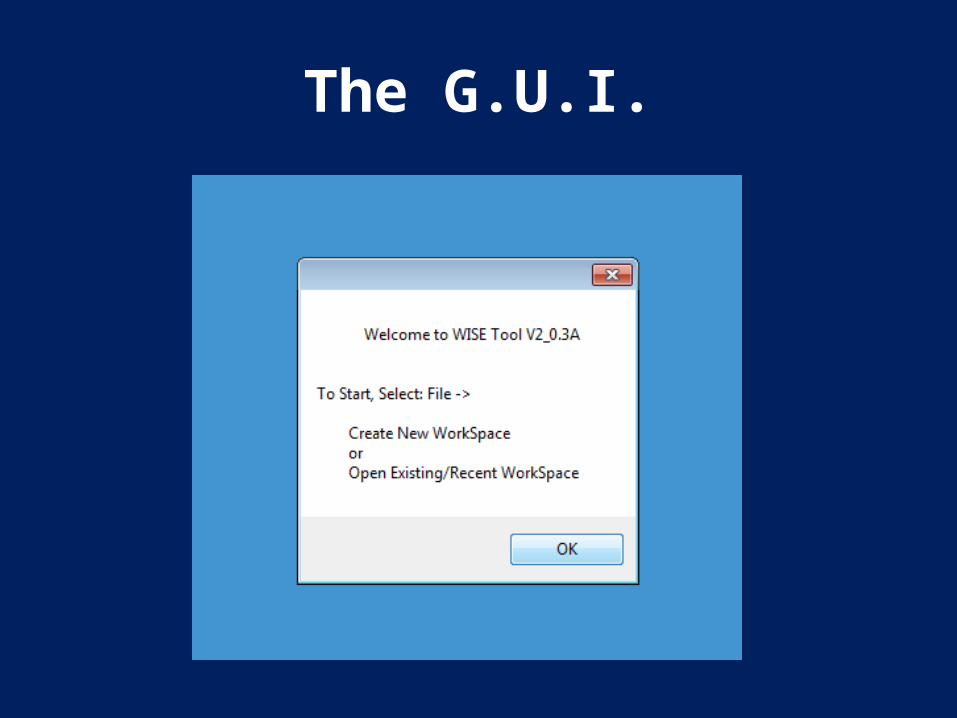
The G.U.I.
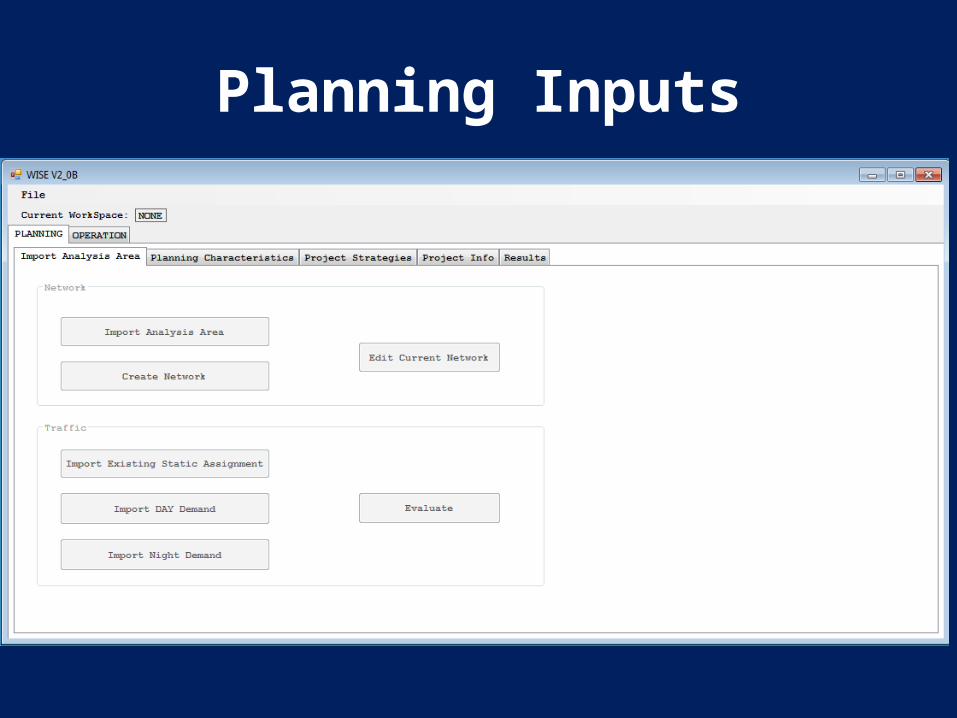
Planning Inputs
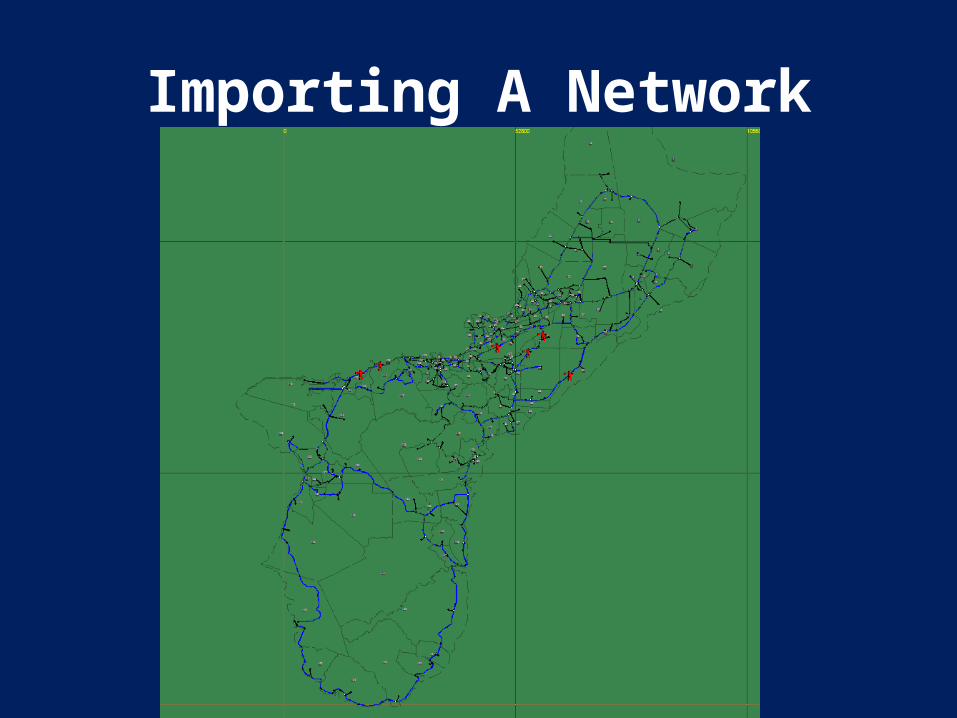
Importing A Network
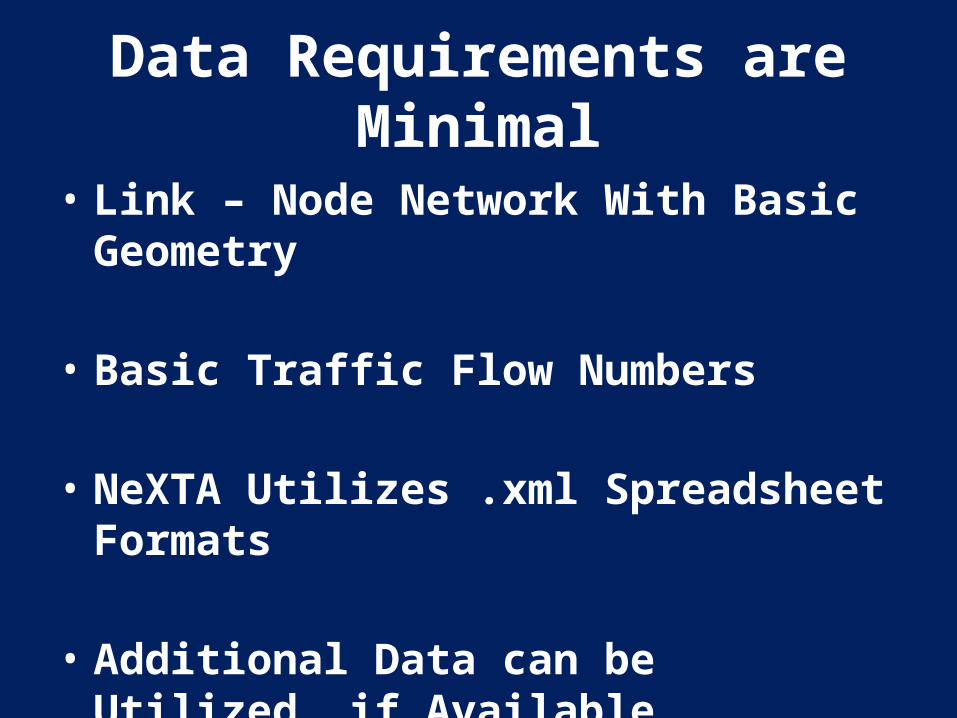
Data Requirements are Minimal
• Link – Node Network With Basic Geometry
• Basic Traffic Flow Numbers
• NeXTA Utilizes .xml Spreadsheet Formats
• Additional Data can be Utilized, if Available
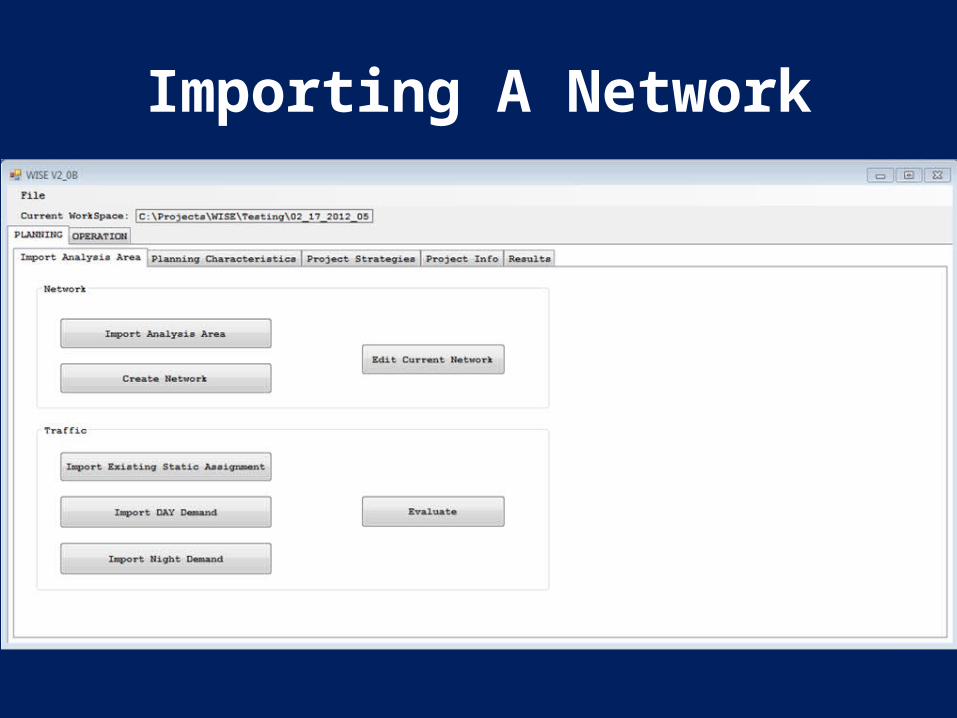
Importing A Network

Planning Inputs
• Planning Characteristics
• Project Strategies
• Project Info
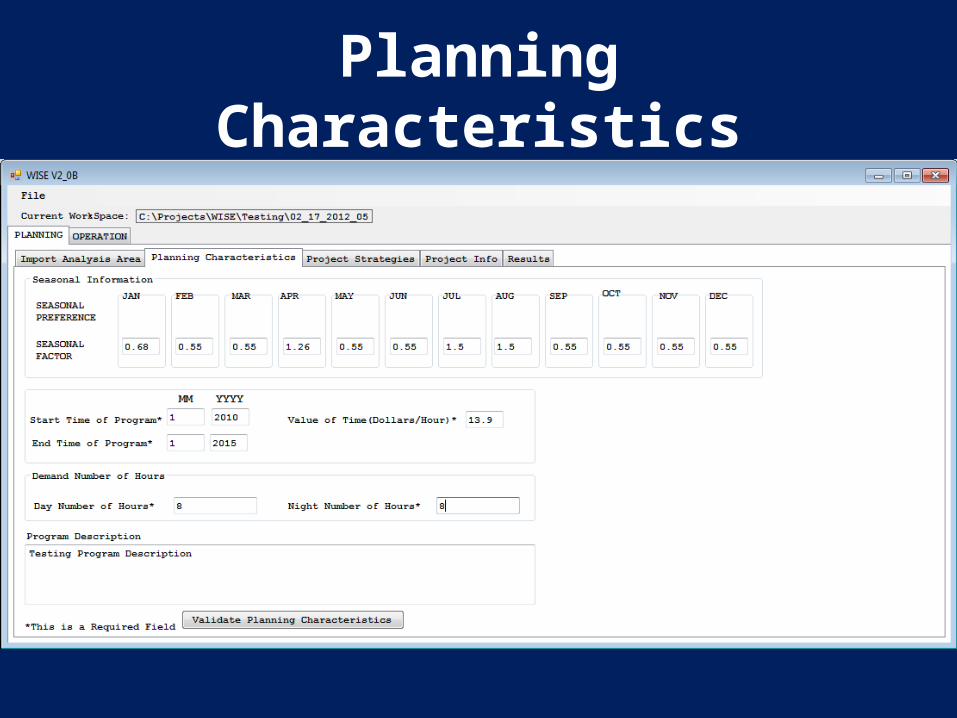
Planning Characteristics
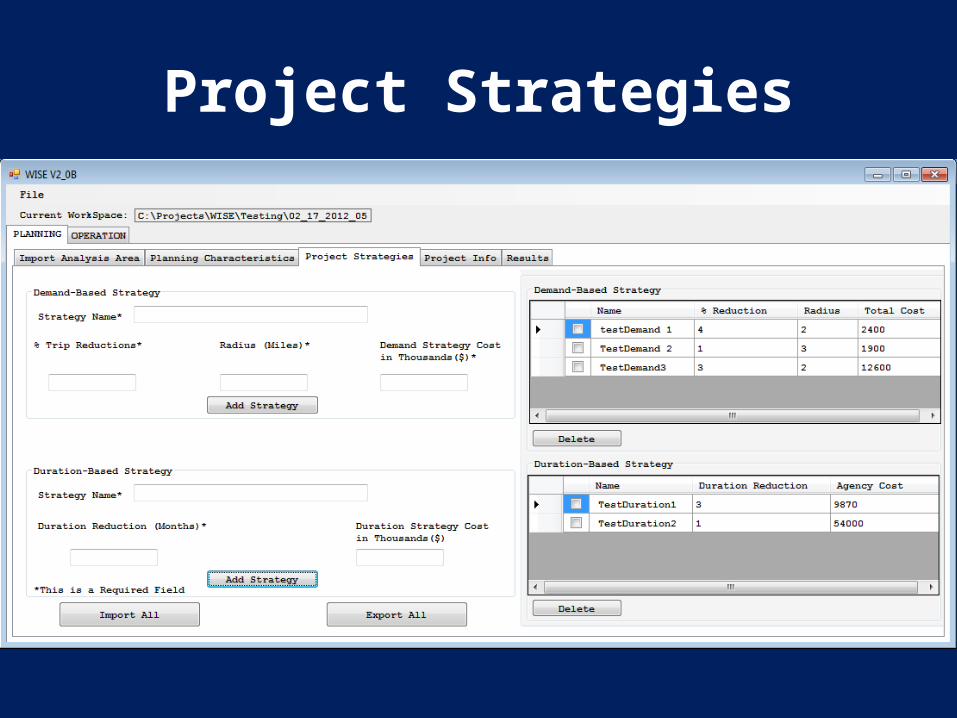
Project Strategies
Identified in Phase I
• Demand Based Strategies: designed to reduce the demand upon a given link
• Duration Based Strategies: designed to reduce the duration of the disruption
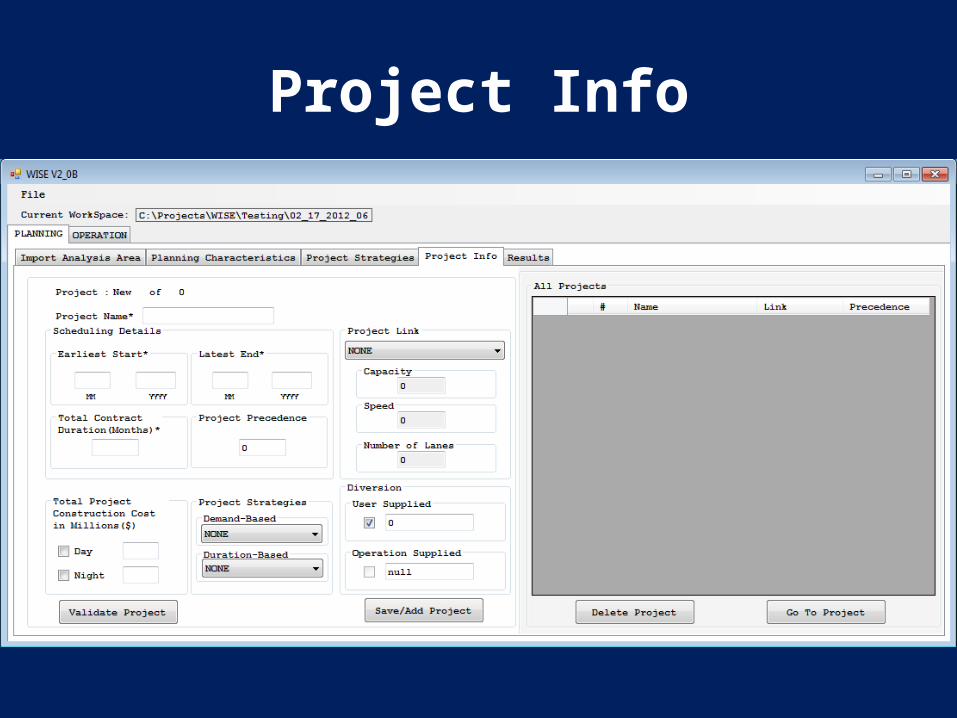
Project Info
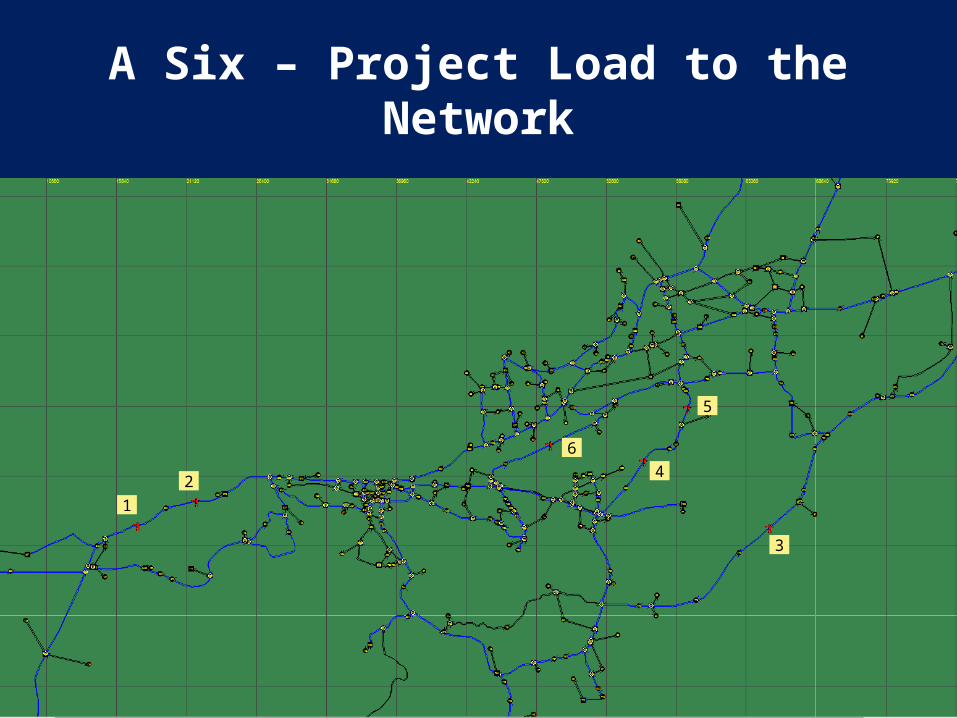
A Six – Project Load to the Network
12
3
4
5
6
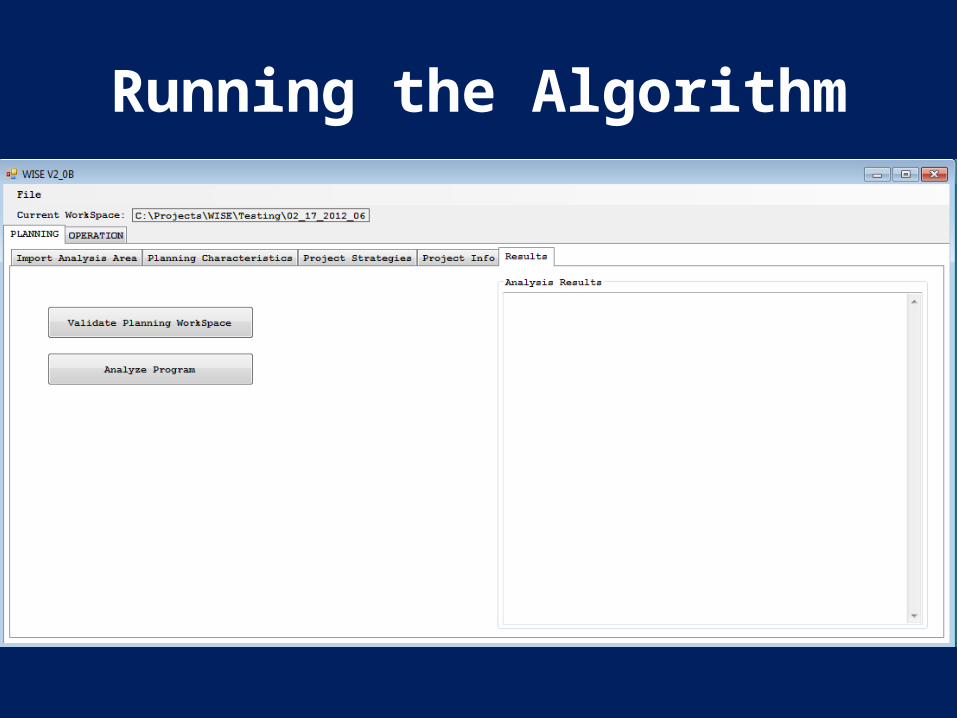
Running the Algorithm
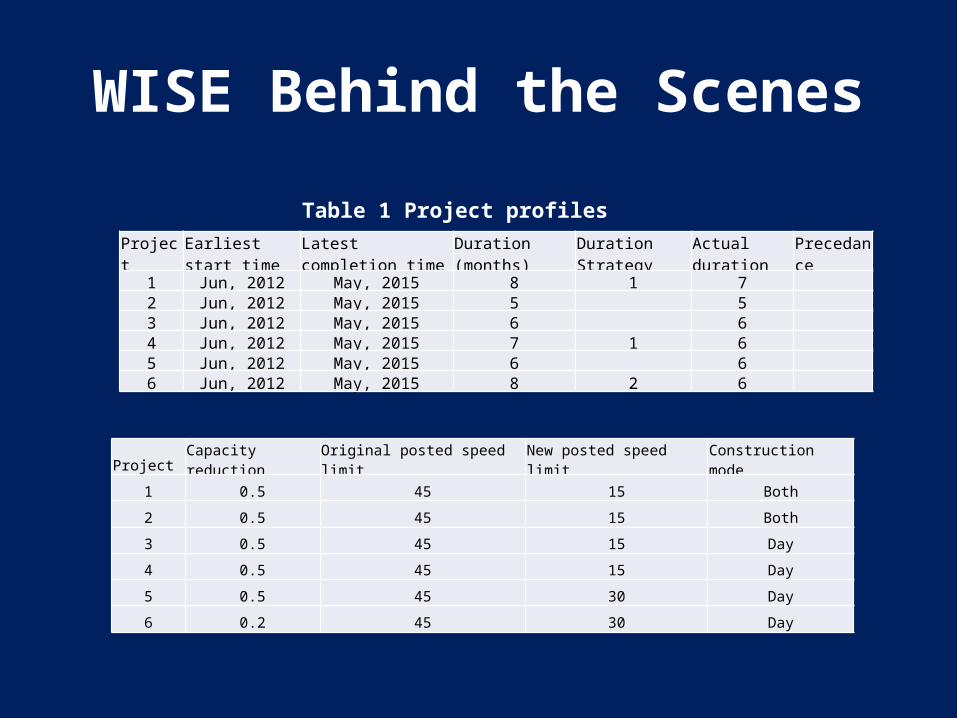
WISE Behind the Scenes
Table 1 Project profiles
Project Earliest start time Latest completion time Duration (months)Duration Strategy Actual duration Precedance
1 Jun, 2012 May, 2015 8 1 72 Jun, 2012 May, 2015 5 53 Jun, 2012 May, 2015 6 64 Jun, 2012 May, 2015 7 1 65 Jun, 2012 May, 2015 6 66 Jun, 2012 May, 2015 8 2 6
Project Capacity reduction Original posted speed limit New posted speed limit Construction mode
1 0.5 45 15 Both
2 0.5 45 15 Both
3 0.5 45 15 Day
4 0.5 45 15 Day
5 0.5 45 30 Day
6 0.2 45 30 Day
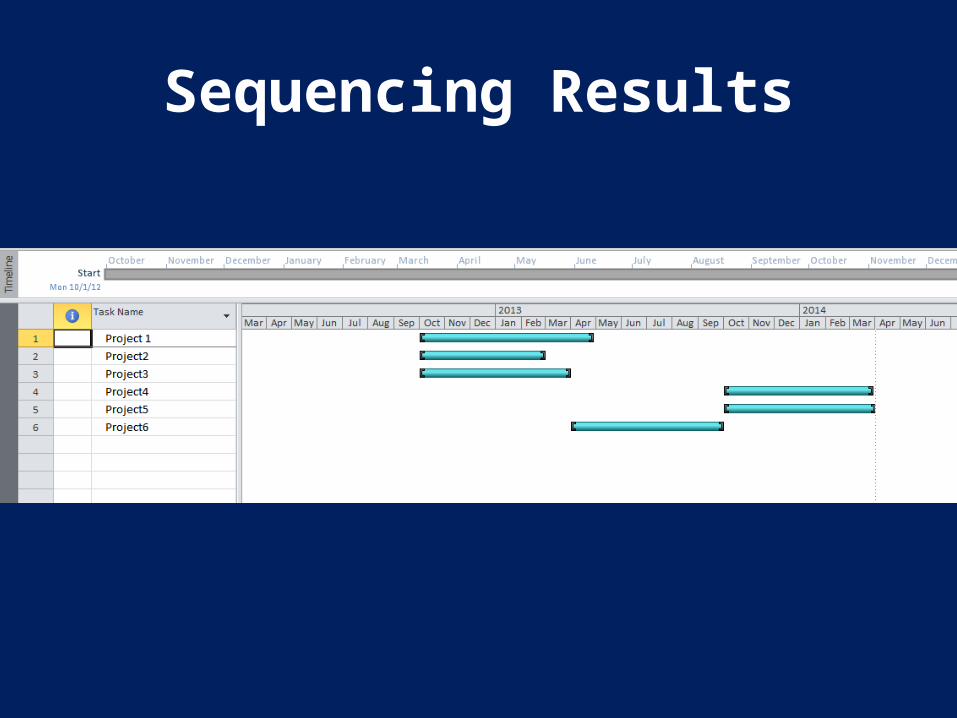
Sequencing Results
The Operations Engine *
* Users can employ their own traffic simulation models to estimate diversion as explained in Phase IV. In such a case, diversion estimates would be entered into the Planning Module manually.
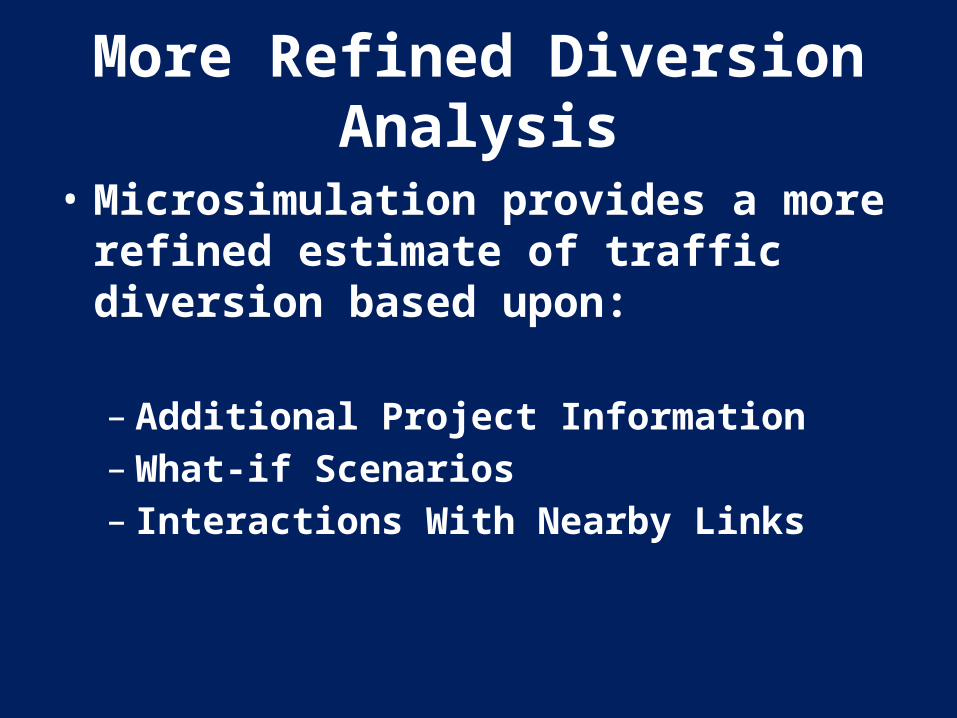
More Refined Diversion Analysis
• Microsimulation provides a more refined estimate of traffic diversion based upon:
– Additional Project Information– What-if Scenarios– Interactions With Nearby Links
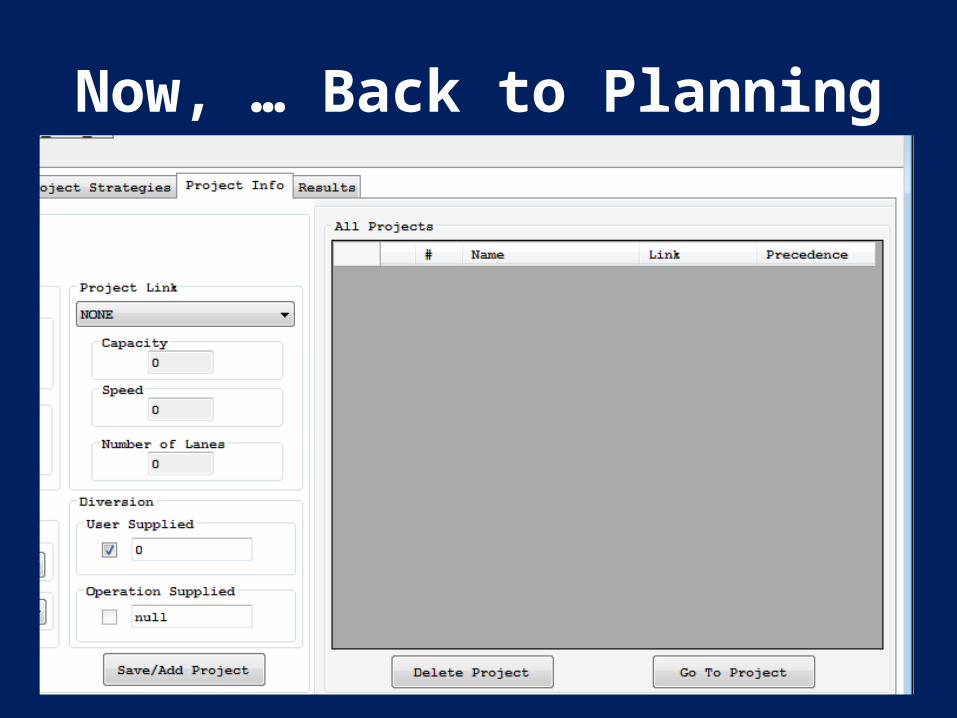
Now, … Back to Planning
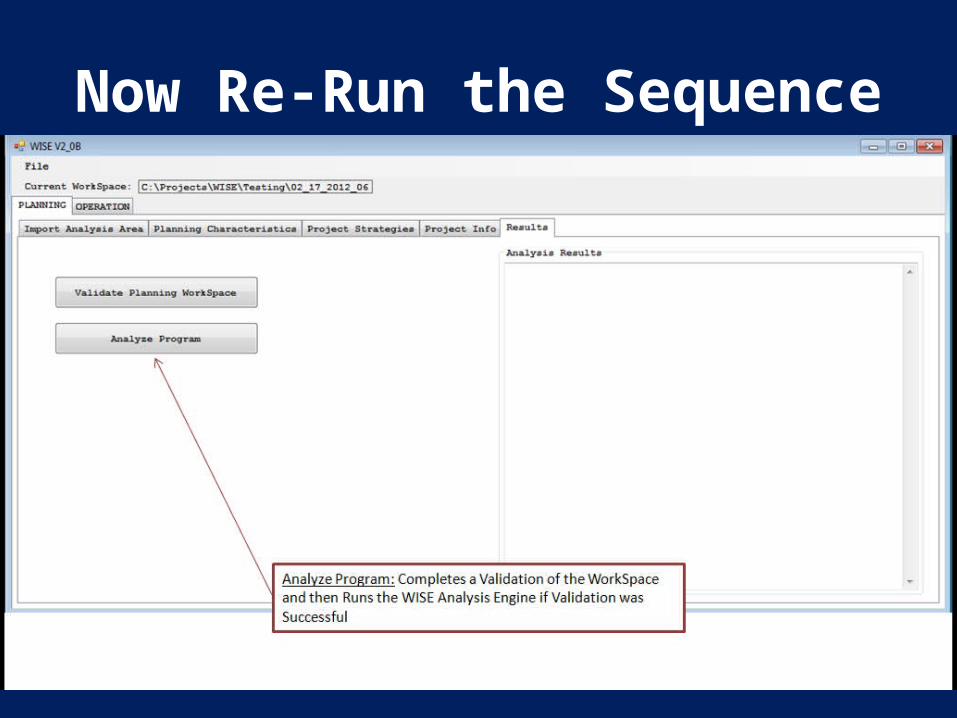
Now Re-Run the Sequence
Phase IV- Field Validation and Calibration
• Field Validation and Calibration– Validation- test in locations with completed
projects• Des Moines, IA• Phoenix, AZ
– Pilot tests- test in locations with project plans• Orlando, FL• Worcester, MA
• Continued Testing and Code Stabilization
DesMoines, Iowa Validation
• Project Description– I-235 through DesMoines- reconstruction,
median widening, operational improvement• WISE Application– Parallel Route 6 defined as alternate route– Reconstruction re-defined as 6 segments– 8 scenarios tested
DesMoines, Iowa Validation (cont.)
• WISE Data Preparation (same as other cases)– Coded network and TAZ file obtained from travel
analysis model (in this case iTRAM)– Links and TAZs for study area selected (in this case
using Transcad)– Links and TAZs consolidated to meet WISE
limitations – in this case ~ 55; redefine centroids & connectors
– Convert all one-way roads to 2-way roads– Re-number centroids and nodes sequentially
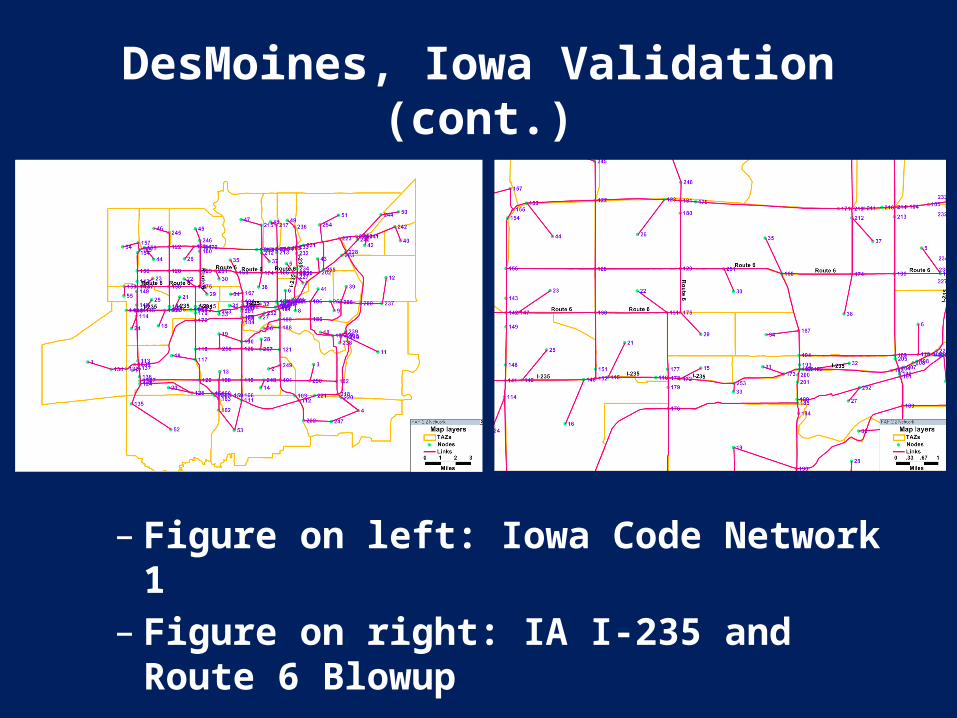
DesMoines, Iowa Validation (cont.)
– Figure on left: Iowa Code Network 1– Figure on right: IA I-235 and Route 6 Blowup
DesMoines, Iowa Validation (cont.)
• Software & GUI Modifications– Re-write code to preserve user and agency costs
for each scenario– Modify user costs comparable to agency costs
• 8 Scenarios Tested– User-supplied diversion @ 0, 5%, 10%, 20%, 40%– Day or Night construction for 1 segment (4 each)– Public information strategies for 3 segments– Shorten time for 1 segment with 10% > cost
DesMoines, Iowa Validation (cont.)
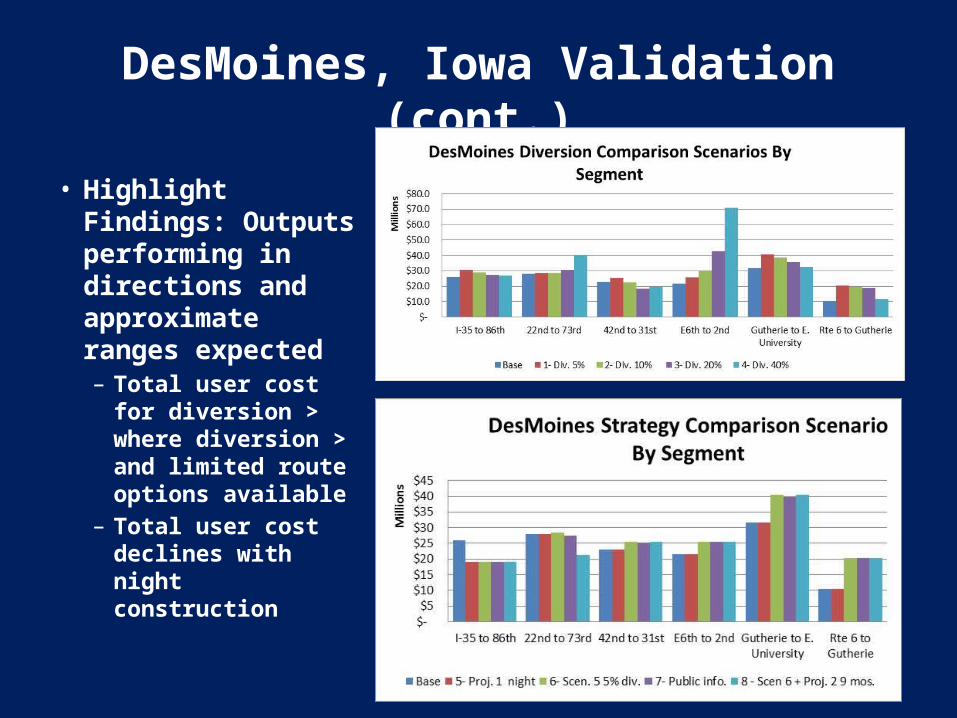
• Highlight Findings: Outputs performing in directions and approximate ranges expected– Total user cost for
diversion > where diversion > and limited route options available
– Total user cost declines with night construction
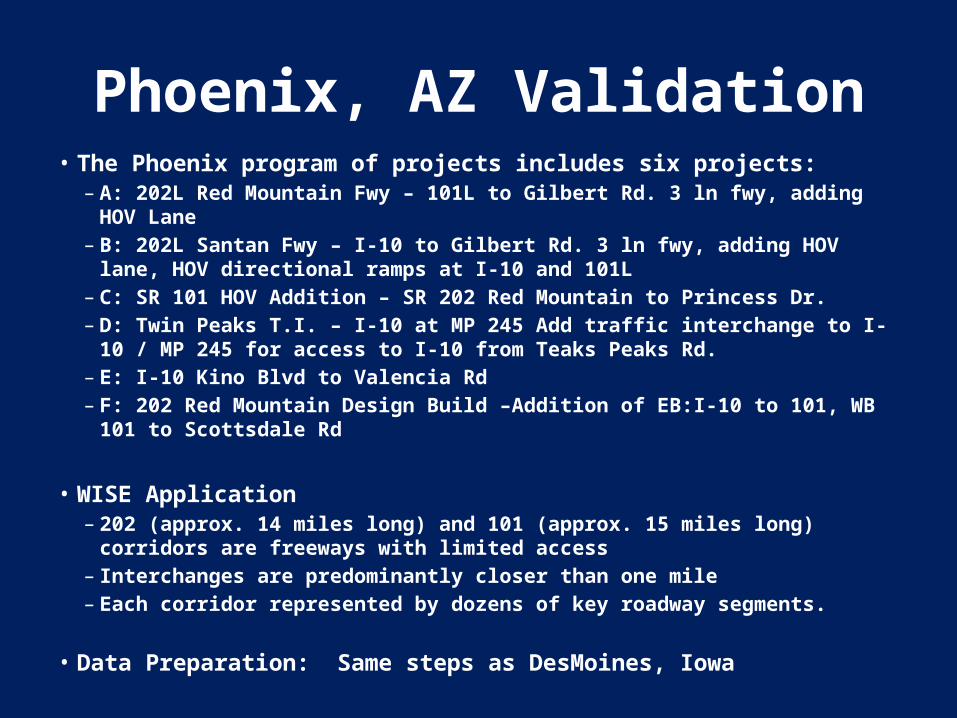
Phoenix, AZ Validation• The Phoenix program of projects includes six projects:
– A: 202L Red Mountain Fwy – 101L to Gilbert Rd. 3 ln fwy, adding HOV Lane– B: 202L Santan Fwy – I-10 to Gilbert Rd. 3 ln fwy, adding HOV lane, HOV directional
ramps at I-10 and 101L– C: SR 101 HOV Addition – SR 202 Red Mountain to Princess Dr.– D: Twin Peaks T.I. – I-10 at MP 245 Add traffic interchange to I-10 / MP 245 for
access to I-10 from Teaks Peaks Rd.– E: I-10 Kino Blvd to Valencia Rd– F: 202 Red Mountain Design Build –Addition of EB:I-10 to 101, WB 101 to Scottsdale
Rd
• WISE Application– 202 (approx. 14 miles long) and 101 (approx. 15 miles long) corridors are freeways
with limited access– Interchanges are predominantly closer than one mile– Each corridor represented by dozens of key roadway segments.
• Data Preparation: Same steps as DesMoines, Iowa
Phoenix, AZ Validation (cont.)
• 6 Scenarios Tested– Daytime Base Scenario– Scheduling Project 1 after Project 8 with
diversion @ 5%, 10%, 5%, 15% with demand strategy for Project 8
– Diversion developed in TransModeler and fed back into WISE for comparison of scenarios
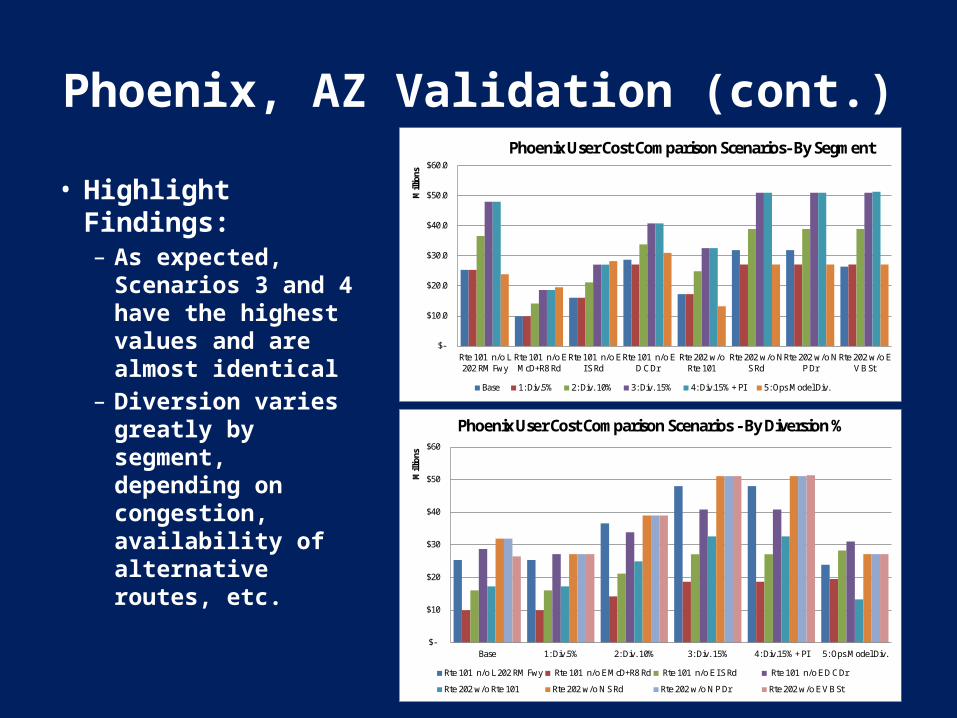
Phoenix, AZ Validation (cont.)
• Highlight Findings: – As expected,
Scenarios 3 and 4 have the highest values and are almost identical
– Diversion varies greatly by segment, depending on congestion, availability of alternative routes, etc.
$-
$10.0
$20.0
$30.0
$40.0
$50.0
$60.0
Rte 101 n/o L202 RM Fwy
Rte 101 n/o EMcD+R8 Rd
Rte 101 n/o EI S Rd
Rte 101 n/o ED C Dr
Rte 202 w/oRte 101
Rte 202 w/o NS Rd
Rte 202 w/o NP Dr
Rte 202 w/o EV B St
Mill
ions
Phoenix User Cost Comparison Scenarios- By Segment
Base 1: Div.5% 2: Div. 10% 3: Div. 15% 4: Div.15% + PI 5: Ops.Model Div.
$-
$10
$20
$30
$40
$50
$60
Base 1: Div.5% 2: Div. 10% 3: Div. 15% 4: Div.15% + PI 5: Ops.Model Div.
Mill
ions
Phoenix User Cost Comparison Scenarios - By Diversion %
Rte 101 n/o L 202 RM Fwy Rte 101 n/o E McD+R8 Rd Rte 101 n/o E I S Rd Rte 101 n/o E D C Dr
Rte 202 w/o Rte 101 Rte 202 w/o N S Rd Rte 202 w/o N P Dr Rte 202 w/o E V B St
Orlando, FL Pilot Test
• Project Description– Reconstruction of I-4, SR 400 to accommodate 3
General Use Lanes, auxiliary lanes, and 2 Managed Lanes for eastbound and westbound (affects 14 interchanges, 5 bridges). Project corridor is approx. 20 miles long.
• WISE Application– 4 key roadway segments selected from project corridor.
• Data Preparation- same steps as DesMoines and Phoenix
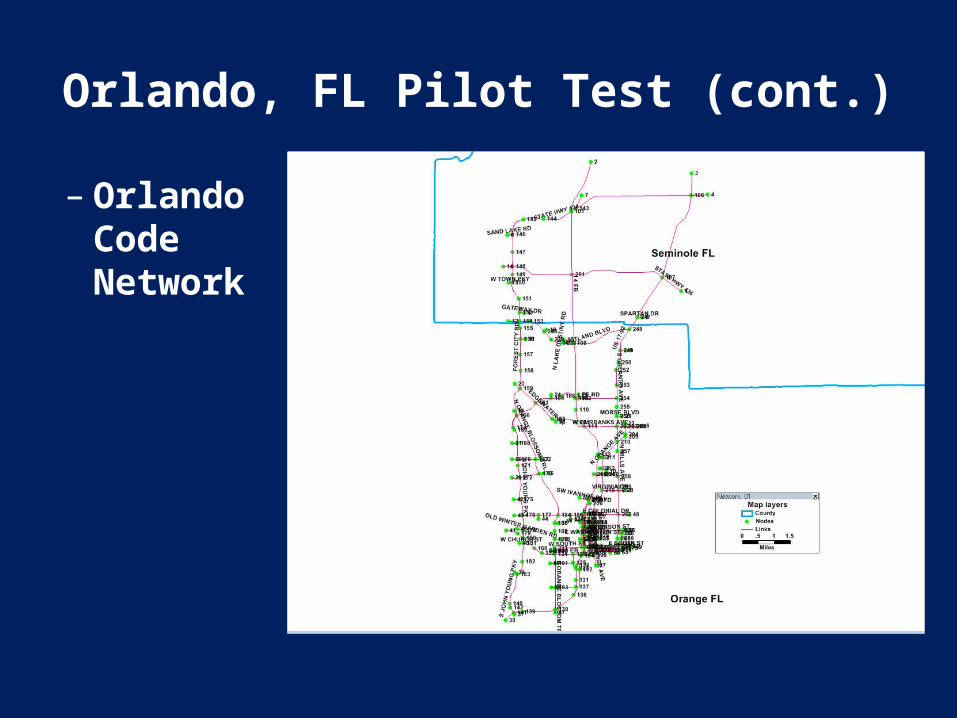
Orlando, FL Pilot Test (cont.)
– Orlando Code Network
Orlando, FL Pilot Test (cont.)
• 5 Scenarios Tested– Base Scenario– Project 1 and 3 with user-supplied diversion @
5%– Project 1 and 3 with user-supplied diversion @
5% and 2% demand reductions for 5 mile radius– Project 1 and 3 with night construction – Diversion calculated by TransModeler
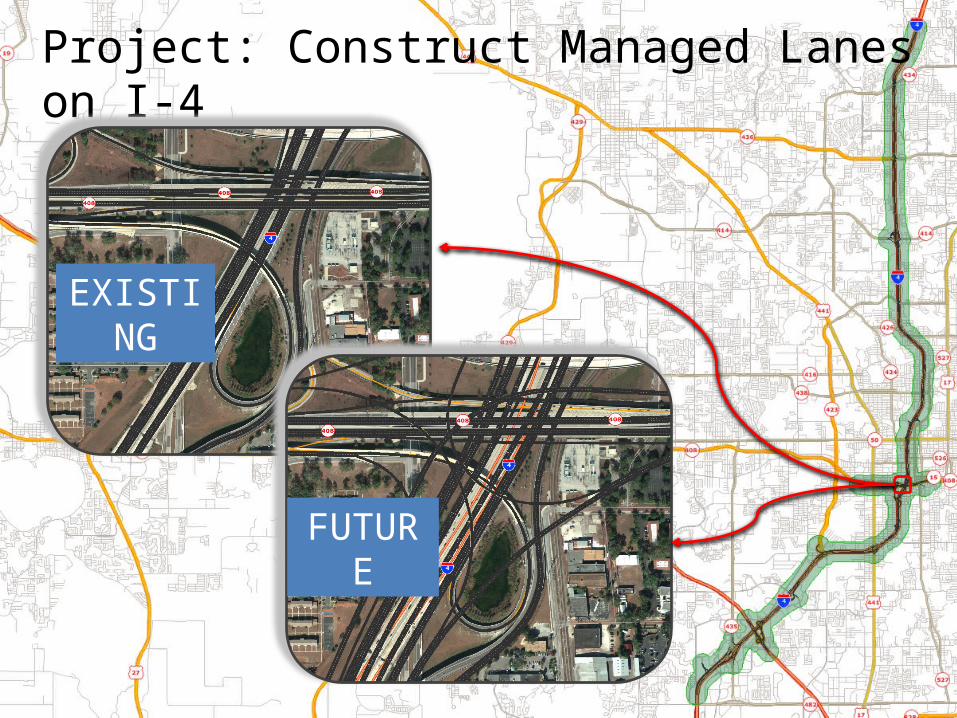
Project: Construct Managed Lanes on I-4
EXISTING
FUTURE
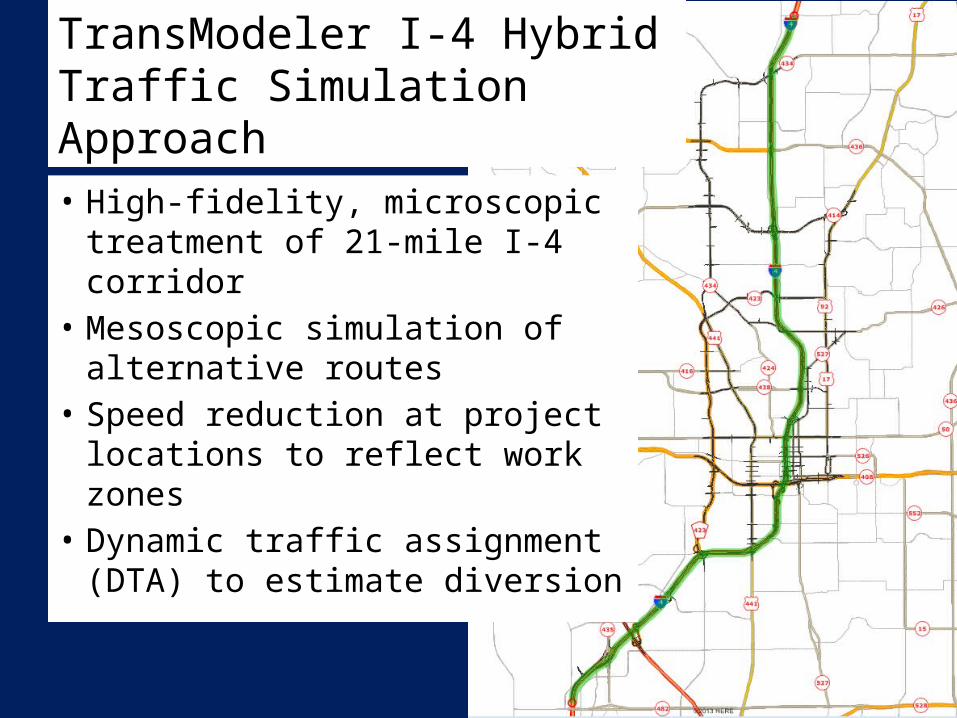
• High-fidelity, microscopic treatment of 21-mile I-4 corridor
• Mesoscopic simulation of alternative routes
• Speed reduction at project locations to reflect work zones
• Dynamic traffic assignment (DTA) to estimate diversion
TransModeler I-4 Hybrid Traffic Simulation Approach
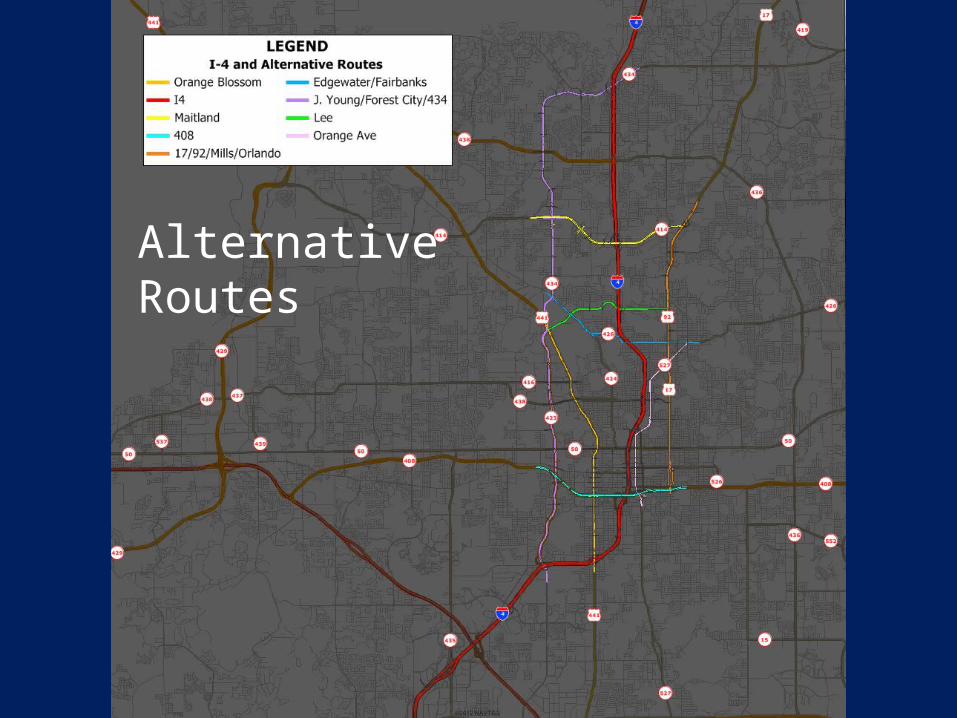
Alternative Routes
Potential Extensions of the Analysis
• Analyze impacts of work zone and work zone scheduling
• Test ITS strategies to mitigate their effects• Assess needs on alternative, parallel facilities during
construction• Analyze performance and operation of managed
lanes after construction
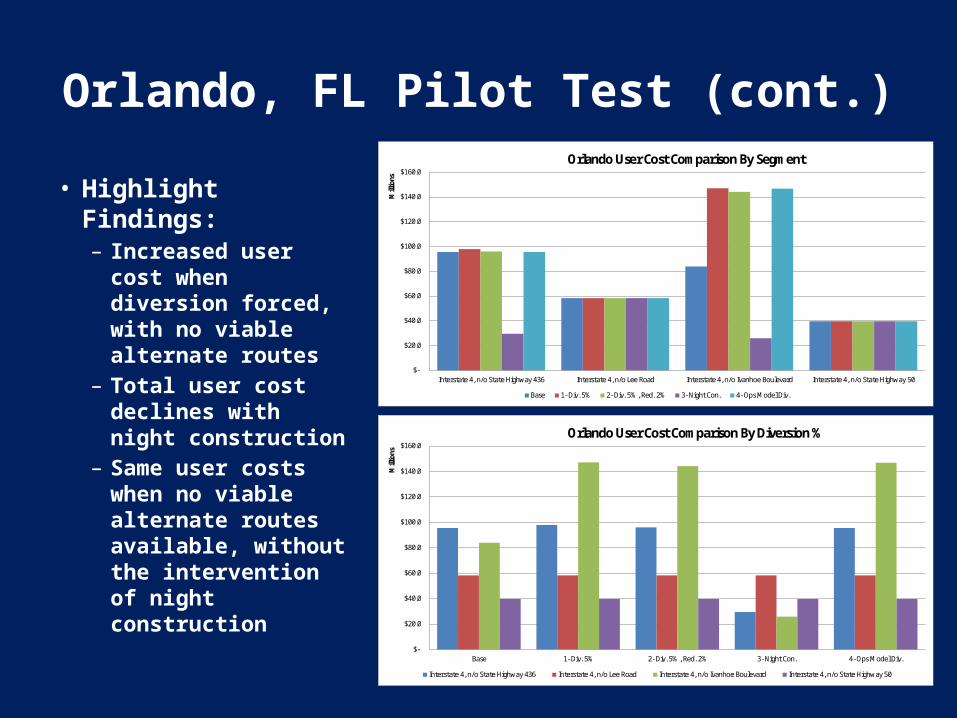
Orlando, FL Pilot Test (cont.)• Highlight Findings:
– Increased user cost when diversion forced, with no viable alternate routes
– Total user cost declines with night construction
– Same user costs when no viable alternate routes available, without the intervention of night construction
$-
$20.0
$40.0
$60.0
$80.0
$100.0
$120.0
$140.0
$160.0
Interstate 4, n/o State Highway 436 Interstate 4, n/o Lee Road Interstate 4, n/o Ivanhoe Boulevard Interstate 4, n/o State Highway 50
Mill
ions
Orlando User Cost Comparison By Segment
Base 1- Div. 5% 2- Div. 5% , Red. 2% 3- Night Con. 4- Ops.Model Div.
$-
$20.0
$40.0
$60.0
$80.0
$100.0
$120.0
$140.0
$160.0
Base 1- Div. 5% 2- Div. 5% , Red. 2% 3- Night Con. 4- Ops.Model Div.
Mill
ions
Orlando User Cost Comparison By Diversion %
Interstate 4, n/o State Highway 436 Interstate 4, n/o Lee Road Interstate 4, n/o Ivanhoe Boulevard Interstate 4, n/o State Highway 50
Worcester, MA Pilot Test
• Project Description– Reconstruction of 4 areas along Route 9: re-docking or
replacement of bridges, intersection improvement• WISE Application– Washington Square traffic circle defined as
intersection– I-290 coded as 2-way intersections instead of
interchange• Data Preparation- Same steps as other pilot and
validations
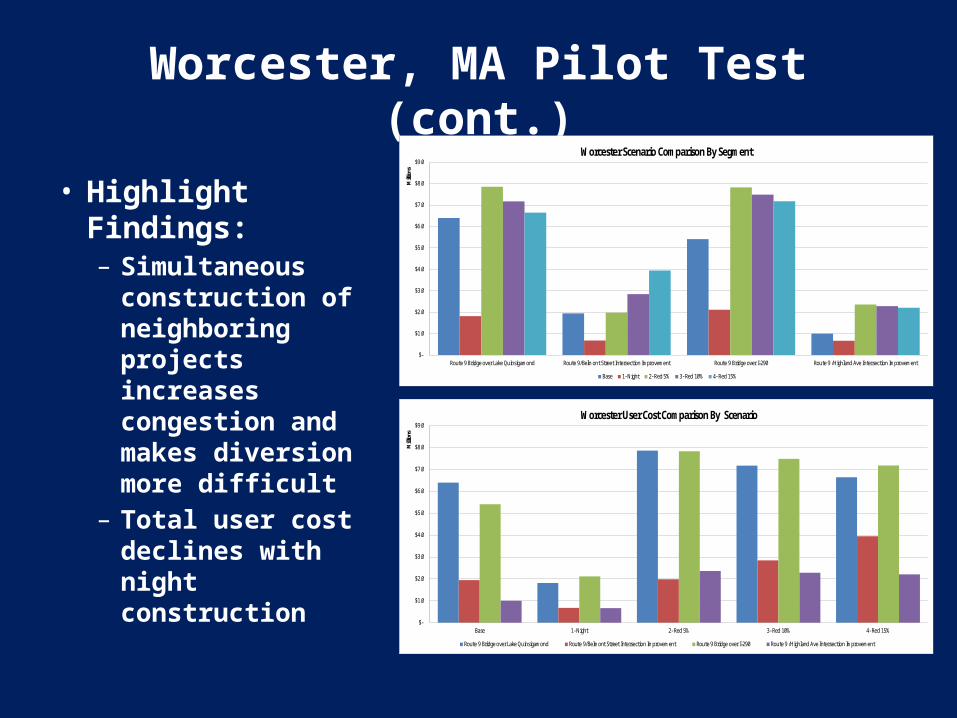
Worcester, MA Pilot Test (cont.)
• Highlight Findings: – Simultaneous
construction of neighboring projects increases congestion and makes diversion more difficult
– Total user cost declines with night construction
$-
$1.0
$2.0
$3.0
$4.0
$5.0
$6.0
$7.0
$8.0
$9.0
Route 9 Bridge over Lake Quinsigamond Route 9/Belmont Street Intersection Improvement Route 9 Bridge over I-290 Route 9 /Highland Ave Intersection Improvement
Milli
ons
Worcester Scenario Comparison By Segment
Base 1- Night 2- Red 5% 3- Red 10% 4- Red 15%
$-
$1.0
$2.0
$3.0
$4.0
$5.0
$6.0
$7.0
$8.0
$9.0
Base 1- Night 2- Red 5% 3- Red 10% 4- Red 15%
Milli
ons
Worcester User Cost Comparison By Scenario
Route 9 Bridge over Lake Quinsigamond Route 9/Belmont Street Intersection Improvement Route 9 Bridge over I-290 Route 9 /Highland Ave Intersection Improvement
Summary Findings
• WISE adequately optimizes the sequence of a program of projects across a network
• WISE facilitates testing of different scenarios and strategies, permitting comparison of user and agency costs and customization of agency-defined values and inputs
• WISE NexTA limitations (e.g. 2-way road stick network) inhibits its easy application, as identified in the Phase IV Validation and Pilot
Implementation Recommendations
• Modify the WISE tool to interface directly with virtually any commercial or non-proprietary network system, rather than require conversion to meet WISE specifications
• Increase WISE flexibility to define construction projects/ roadway segments
• Increase WISE capacity to handle more zones• Improve Planning Module’s diversion estimates,
with feedback from network models if available

Questions?