shri ram bajiya contol ppt
TRANSCRIPT

Presentation on
TYPICAL EXAMPLE OF 1st ORDERSYSTEM AND EFFECT OF TIME CONSTANT ON SYSTEM REPONSE
By
SHRI RAM BAJIYA
100104123
Content
Example of 1st order system
Cruise Control
Velocity of car on the road
Level control of a tank
Effect of time constant on system response

Typical example of 1st order System Velocity of car on the road
• Control of velocity of rotating system
• Electric systems where energy is essentially stored in one component
• Incompressible fluid flow in a pipe
• Level control of a tank
• Pressure control in a gas tank
• Temperature in a body with essentially uniform temperature distribution e.g., a vessel filled with a mixture of steam and water.

Velocity of car on the road
Cruise ControlThe purpose of cruise control is to keep the velocityof a car constant. The driver drives the car at thedesired speed, the cruise control system is activated by pushing a button and the system then keeps thespeed constant. The major disturbance comes from changes of the slope of theroad which generates forces on the car due to gravity. The cruise control system measures the difference between the desired and the actual velocity and generates a feedback signal which attempts to keep the error small inspite of changes in the slope of the road. The feedback signal is sent toan actuator which influences the throttle and thus the force generated bythe engine.

the momentum balance can be written as
mdv/dt + cv = F − mgθ
where the term cv describes the momentum loss due to air resistance and
rolling and F is the force generated by the engine.
Level control of a tank
The couple tank is used as a control system, the input flowrate (qi) is controlled by
adjusting the applied voltage to the pump motor amplifier (vi). The liquid level is sensed
by a pressure transducer that produces an output voltage (y1), which is proportional to
the liquid level (h1).
DesiredVelocity
∑ ∑ControllervelocityThrottle
bodyEngineF
Slope of road

PP
v1 q1 h1 y1
PUMP TANK SYSTEM MODEL
LEVELSENSOR
Schematic Diagram of the overall system
Where;
vi = applied voltage to the pump motor amplifier qi= input flow rate h1= liquid level y1=output voltage
The pump flow rate, qi and the input voltage, vi, are related by an actuator characteristic that is assumed to be linear as shown in figure. The same is true of the level sensor characteristic.

.
Flow rate
Slope=Ki
Pump input voltage Vi
qi
Sensor output
Slope=Ks
y1
Liquid Level h1
Pump and Level Sensor Characteristic
If Ki and Ks are the pump and sensor gain constants respectively, thenqi = ki . vi
y1=ks . h1
H1(s)= {kb/(Ts+1)}.q1(s)
From above equation can takes from the modeling of tank system.Combined these with the system transfer function equation gives the standard first order system transfer function,

(Y1/Vi)= G/(Ts+1)
G = ki.ks.kb
Where, G = the system gain T = the system time constant Ki = pump characteristic Ks = sensor characteristic
Vi
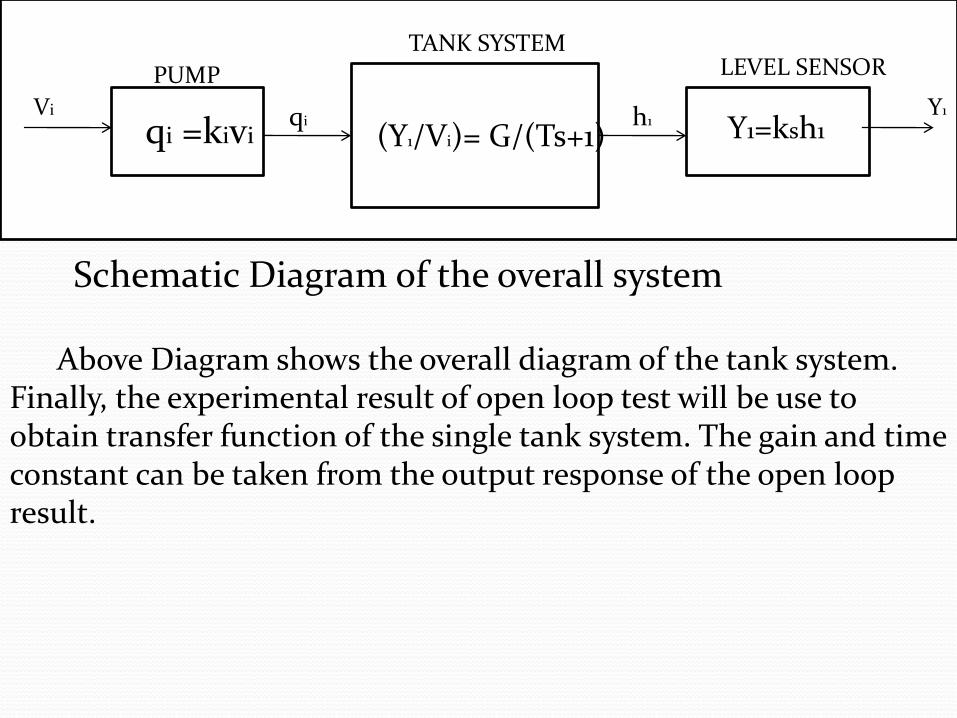
qi =kivi (Y1/Vi)= G/(Ts+1) Y1=ksh1Y1h1qi
LEVEL SENSORTANK SYSTEM
PUMP
Schematic Diagram of the overall system
Above Diagram shows the overall diagram of the tank system. Finally, the experimental result of open loop test will be use to obtain transfer function of the single tank system. The gain and time constant can be taken from the output response of the open loop result.

Effect of time constant on system response Time constant is the time it takes for the step response to rise 63%
of its final value. Consider the step response of fig. 1
By the figure we get that at t=T1 the
response will be 63% of its maximum
value i.e. time constant of this response
is T1
Consider the step response of fig 2
By the figure we get that at t=T2 the
response will be 63% of its maximum value
i.e. time constant of this response is T2
Fig. 1
Fig 2

Now comparing the two responses
As it is clear form the figure that T1 is smaller than T2 and figure also clear that the first response is faster then the second step response .
Therefore because of this , the time constant is use to measure how fast a system can respond
Smaller the time constant, faster is the system response.

..
THANK YOU