showtime audience research summary report · showtime audience research. this is the largest ever...
TRANSCRIPT

© The Audience Agency 2012
SHOWTIME Audience Research
Summary report November 2012

1
© The Audience Agency 2012
Introduction This report provides a summary of results from the SHOWTIME audience research carried out by
The Audience Agency (formally Audiences London). The results have been summarised under
the specific evaluation themes from the wider evaluation carried out by Tom Fleming Creative
Consultancy (TFCC).
There were two key components to the audience research:
Audience survey - In total, 2128 face to face surveys were carried out for the
SHOWTIME audience research. This is the largest ever outdoor arts survey carried out
using this approach.
Estimation of audience size – Using a number of techniques we were able to estimate
the size of the total audience that attended the SHOWTIME programme.
The audience research encompasses events from the touring programme of core SHOWTIME
packages. The Audience Agency did not sample the local programme, 99 Tiny Games,
Bandstand Marathon or pop up film events.
Audience survey results for Secrets: Hidden London (SECRETS) have been summarised in
additional analysis files provided to TFCC.

2
© The Audience Agency 2012
1%
1%
5%
41%
53%
Very poor
Poor
Neither goodnor poor
Good
Very good
Audience survey full sample - weighted base 1990
Qu. How would you rate this event?
Evaluation themes - SHOWTIME This section contains detailed results for each of the evaluation themes.
1. Reach and engagement – bringing excellent outdoor arts to all communities across London
1.1 SHOWTIME seen as excellent outdoor art
1.2 Geographical reach of SHOWTIME across all London boroughs and in unexpected parts of the boroughs over the 7 weeks
1.3 750,000 people attending SHOWTIME events across London over the 7 weeks
1.4 Extending reach to a new audience and participants
1.5 SHOWTIME events reaching all sections on London’s population
1.6 Showcase a diversity of acts and artists (link to GLA sustainability target)
The audience research informs outcomes 1.1, 1.2, 1.3, 1.4, 1.5.
1.1 SHOWTIME seen as excellent outdoor art
Overall ratings – When asked how they would rate the SHOWTIME event that they
attended, 94% of the respondents said it was ‘Very good’ or ‘Good’.
Describing their experience - Respondents were also asked what three words they
would use to describe their experience at the SHOWTIME event. These have been
summarised in the word cloud on the next page. Responses were very positive, with

3
© The Audience Agency 2012
words such as ‘fun’, ‘exciting’, ‘interesting’ and ‘vibrant’ featuring strongly. The word
‘community’ also appears at the centre of the word cloud.
Outcome 1.1 - Audience comments from the survey
“Fab atmosphere, loads of excellent free to enjoy activities”
“The children were entertained by very wonderful people, who were very creative”
“Very interesting and fun, promotes the arts”
“It has brightened up my day”
“Relaxing, stress reducing, drawn in can't pass by and not watch it. Attracted like a magnet”
Qu. What three words would you use to describe you experience of today’s event?

4
© The Audience Agency 2012
1.2 Geographical reach of SHOWTIME across all London boroughs and in unexpected parts
of the boroughs over the 7 weeks
SHOWTIME
The audience research focussed on the Touring elements of the SHOWTIME programme.
This consisted of 44 events, 24 of which were in Inner London and 20 Outer London.
Where a particular festival included SHOWTIME elements on more than one day, it was
counted as more than one ‘event’ in the analysis. The Victoria Park Live Site, for
example, presented SHOWTIME packages on 5 consecutive days, so this was counted as
5 events.
31 of the 33 London Boroughs had a SHOWTIME event.
SECRETS
We have included the SECRETS event details in this report for comparison.
There were four elements to the SECRETS programme as follows:
o Like a Fish out of Water – Multiple performances at two locations, both in Outer
London.
o Owl and the Pussycat – Six performances, four of which were in Inner London and
two which were in Outer London.
o Northala – Installation running from 8th to the 27th August.
o Nothing is Set in Stone – Installation running from 21st June to 30th September.
EVENT LOCATIONS
The following map shows the location of the SHOWTIME and SECRETS events. Where an
event had multiple locations on one day a central point was chosen.

5
© The Audience Agency 2012
Map showing SHOWTIME and SECRETS event locations

6
© The Audience Agency 2012
1.3 750,000 people attending SHOWTIME events across London over the 7 weeks
SHOWTIME
As part of the audience research carried out by The Audience Agency, an estimation of
the audience size at each event was made.
In total, SHOWTIME was attended by 145,352 people at an average of 3,303 per event.
Inner London Boroughs accounted for 94,314 attenders at an average of 3,930 per
event.
Outer London Boroughs accounted for 51,038 attenders at an average of 2,552 per
event.
SECRETS
We have included the SECRETS figures in here for comparison.
In total, SECRETS was attended by an estimated audience of 30,437.
This consisted of 13,155 to events in Inner London and 17,282 to events in Outer
London.
1.4 Extending reach to a new audience and participants
New audiences – When respondents were asked whether they had been in an event like
this before, 52% said that they had and 48% said that they had not (based on a weighted
sample of 2,096).
This percentage equates to 69,769 new audience members attending this type of work
(using the overall estimated audience size).
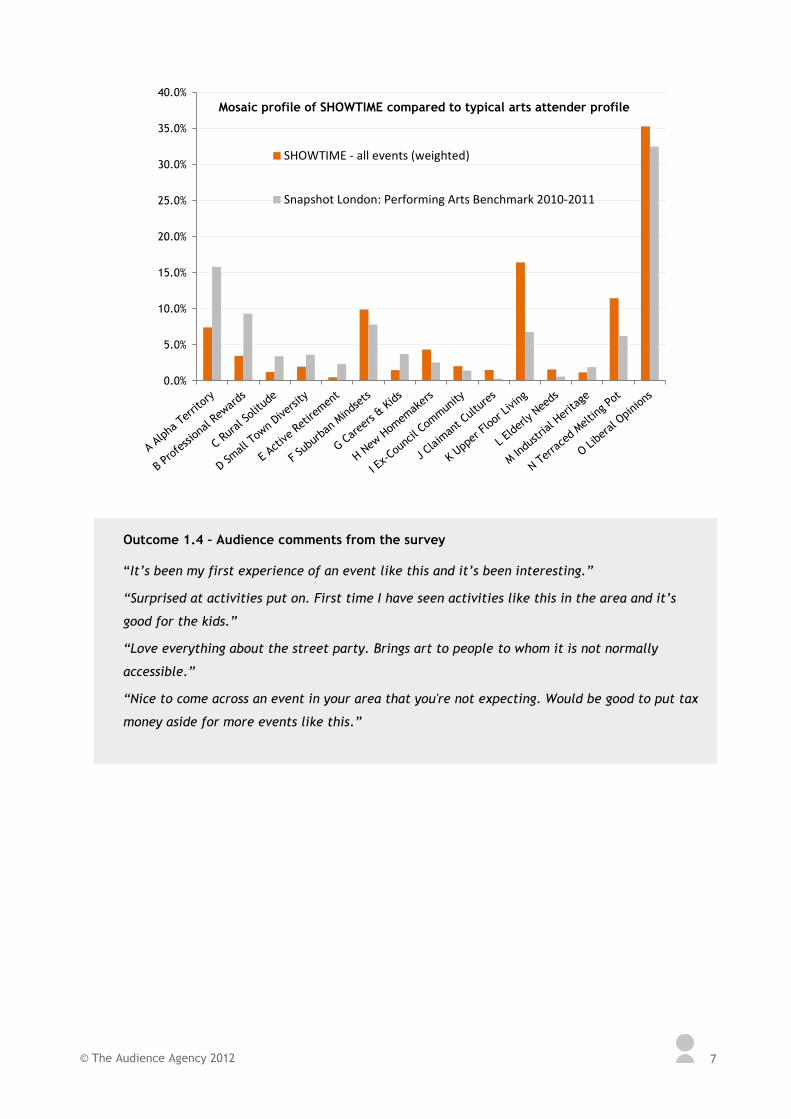
Comparing profiles to arts attenders - The postcodes that were collected in the survey
were profiled using the Mosaic geo-demographic segmentation tool. This can be used to
compare the profile of the SHOWTIME audiences with the profile of typical arts
attenders (based on Snapshot London: Performing Arts engagement indicator).
The following chart shows that there were some key differences between the audiences
at SHOWTIME and typical attenders to the performing arts. There were much less
attenders from affluent segments such as ‘Alpha Territory’ and ‘Professional Rewards’
and higher proportions from more mixed segments such as ‘Upper Floor Living’ and
‘Terraced Melting Pot’.
7
© The Audience Agency 2012
0.0%
5.0%
10.0%
15.0%
20.0%
25.0%
30.0%
35.0%
40.0%
Mosaic profile of SHOWTIME compared to typical arts attender profile
SHOWTIME - all events (weighted)
Snapshot London: Performing Arts Benchmark 2010-2011
Outcome 1.4 – Audience comments from the survey
“It’s been my first experience of an event like this and it’s been interesting.”
“Surprised at activities put on. First time I have seen activities like this in the area and it’s
good for the kids.”
“Love everything about the street party. Brings art to people to whom it is not normally
accessible.”
“Nice to come across an event in your area that you're not expecting. Would be good to put tax
money aside for more events like this.”

8
© The Audience Agency 2012
I live in London 79%
I live elsewhere in the UK
16%
I’m visiting from overseas
5%
1.5 SHOWTIME events reaching all sections on London’s population
Where they were from – Respondents were asked whether they lived in London,
elsewhere in the UK or abroad. The chart below shows that the majority (79%) were
from London, 16% from elsewhere in the UK and the remainder from abroad.
Audiences by local authority – In a separate analysis, the postcodes given by
respondents were used to calculate whether they lived in the same local authority as
the event that they attended. Although sample sizes were small for each event, it is
possible to get an indicative figure.
Of the 20 local authorities that were sampled, on average 36% of the respondents were
from that Borough. This was calculated by averaging the figures for each local
authority.
The highest three figures were; Merton (59%), Croydon (57%) and Hillingdon (57%).
Merton and Hillingdon are shown on maps later in this section.
The lowest three figures were; City of London (0%), Southwark (3%) and Tower Hamlets
(5%). Both the Southwark and Tower Hamlets locations were Live Sites.
Audience survey full sample – Weighted base 2074
Qu. Do you live in London or elsewhere in the UK, or are you visiting from overseas?

9
© The Audience Agency 2012
Audience maps – The following pin point maps show where the SHOWTIME audience
were from, based on their postcode given in the audience survey. Mapping is only
available for Great Britain.
Audience survey full sample – Weighted base 1337
SHOWTIME
respondents
Location of survey respondents – London area
Audience survey full sample – Weighted base 1337

10
© The Audience Agency 2012
Adult single visitor 21%
Adult group no under 16s
29%
Group including under 16s
37%
Unknown group 9%
Unknown 4%
Group profile of the SHOWTIME audience
The London area map shows that respondents were drawn from across London with
clusters of respondents in particular areas.
To further illustrate the local nature of the audiences, maps for two of the Outer
London events have been shown below. On the left are the respondents from the
SHOWTIME event in Hillingdon and on the right, those from Merton. The maps clearly
show how audiences were clustered around the event locations for particular events.
Audience age and group profile – By combining the age of the respondents with
additional questions on who they have visited with, we can produce a group profile for
the SHOWTIME audience. This is illustrated on the pie chart below.
The chart shows that the 37% of the SHOWTIME audience were visiting in a group that
included at least one person under 16. Only 21% of the respondents were attending the
event on their own.
Audience survey full sample – Weighted base 2129
SHOWTIME Hillingdon respondents SHOWTIME Merton respondents
11
© The Audience Agency 2012
White: British 54%
White: Irish / Gypsy or Irish Traveller /
Other 18%
Mixed 7%
Asian or Asian British 12%
Black or Black British
7% Other
2%
Qu. What is your ethnic group?
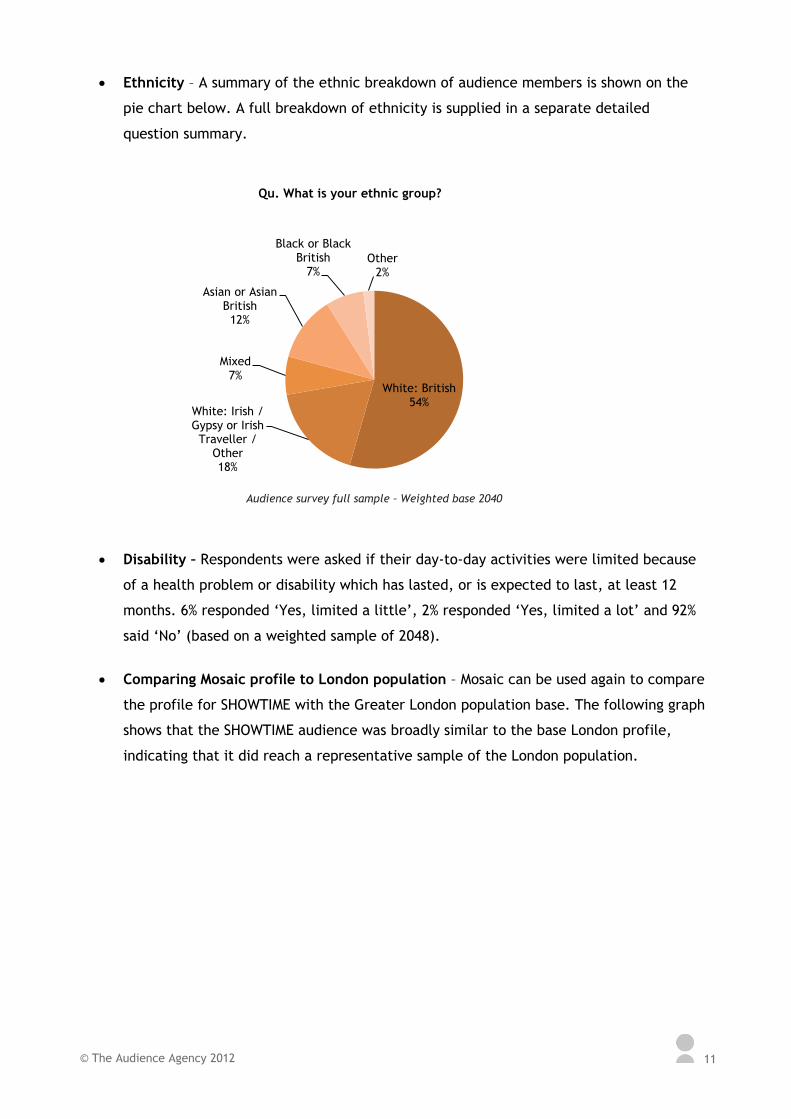
Ethnicity – A summary of the ethnic breakdown of audience members is shown on the
pie chart below. A full breakdown of ethnicity is supplied in a separate detailed
question summary.
Disability – Respondents were asked if their day-to-day activities were limited because
of a health problem or disability which has lasted, or is expected to last, at least 12
months. 6% responded ‘Yes, limited a little’, 2% responded ‘Yes, limited a lot’ and 92%
said ‘No’ (based on a weighted sample of 2048).
Comparing Mosaic profile to London population – Mosaic can be used again to compare
the profile for SHOWTIME with the Greater London population base. The following graph
shows that the SHOWTIME audience was broadly similar to the base London profile,
indicating that it did reach a representative sample of the London population.
Audience survey full sample – Weighted base 2040

12
© The Audience Agency 2012
0.0%
5.0%
10.0%
15.0%
20.0%
25.0%
30.0%
35.0%
40.0% Mosaic profile of SHOWTIME audience compared to London profile
SHOWTIME - all events (weighted)
London mid year 2008 15+ population

13
© The Audience Agency 2012
0%
0%
15%
49%
35%
Much less likely to go
Slightly less likely to go to
Made no difference
Slightly more likely to go
Much more likely to go
Audience survey full sample - weighted base 2088
0%
0%
10%
54%
35%
Much more likely to go
Slightly more likely to go
Made no difference
Slightly less likely to go to
Much less likely to go
Audience survey partial sample - weighted base 956
2. Sustainability of outdoor arts sector and infrastructure
2.1 Changing perception of the role and value of outdoor arts
2.2 New and lasting collaborations
2.3 Capacity and aspiration of local arts organisations and artists raised through working alongside professionals
2.4 SHOWTIME adding value to local programmes and showcasing outdoor arts as tool to deliver across multiple agendas
The audience research informs outcomes 2.1.
2.1 Changing perception of the role and value of outdoor arts
Attend again? – When respondents were asked if the event made them more or less
likely to attend outdoor arts in the future, 84% said that they were more likely to
attend in the future. This is based on adding the ‘Much more likely’ and ‘Slightly more
likely’ percentages.
For those that hadn’t attended an event like SHOWTIME before, an even higher
proportion (89%) said that they were more likely to attend in the future.
Qu. Has this even made you more or less likely to attend outdoor arts in the future?
Qu. Has this even made you more or less likely to attend outdoor arts in the future?

14
© The Audience Agency 2012
Outcome 2.1 - Audience comments from the survey
“Very refreshing to see an outdoor event like this - seeing the enjoyment on the faces of
children and adults alike. Tottenham should have more events like this.”
“Really well organised, great for families, lovely to be outdoors and its free so accessible by
everyone.”
“They should have more events, anything to get people out and sharing experiences”

15
© The Audience Agency 2012
3. Skills Development
3.1 Local authority capacity for evaluating impacts, sustainability and access at outdoor events enhanced
3.2 Five new outdoor festival co-ordinators trained
3.3 Professional development of artists
3.4 Volunteers skills in audience surveying, festival stewarding developed
The audience research does not inform any of the outcomes in this theme.
4. Economic Benefit
4.1 Economic impact
The audience research informs outcome 4.1.
4.1 Economic impact
Audience spend - Respondents were asked how much they had spent or intend to spend
in the area that day (i.e. within a mile of the event).The average spend per person was
£24.76. Using the estimated audience figure for the whole of SHOWTIME of 145,352 this
equates to £3,598,916 across the whole touring programme. This is an average of
£81,794 per event.
The respondents were also asked whether the amount was more, less or about the same
as they would normally spend in the area. 33% said that they had spent more, 52% about
the same and 15% less (based on weighted base of 1,894). By combining these responses
with the financial figures we were able to provide an overall net effect of SHOWTIME on
spend. This is shown on the table below.
Based on the total estimated audience size of 145,352, £5.47 increase in spend equates
to £795,453 in total. This is an average of £18,078 per event.
Overall averages per respondent Spend £
Usual spend
£19.29
Spend on SHOWTIME day
£24.76
Increase due to SHOWTIME
£5.47
Audience survey full sample – Weighted base 1894

16
© The Audience Agency 2012
0%
1%
4%
44%
52%
Strongly disagree
Disagree
Neither agree nordisagree
Agree
Strongly agree
Audience survey full sample - weighted base 2089
1%
2%
9%
45%
43%
Strongly disagree
Disagree
Neither agree nordisagree
Agree
Strongly agree
Audience survey full sample- weighted base 2088
5. Promoting London and connecting people to the Olympic and Paralympic games
5.1 SHOWTIME contributing to raising the profile of London as vibrant and exciting city
5.2 SHOWTIME connecting residents to the Olympic and Paralympic games
The audience research informs outcomes 5.1, 5.2.
5.1 SHOWTIME contributing to raising the profile of London as vibrant and exciting city
Respondents were asked whether they agreed or disagreed with the statement ‘This
event makes London feel vibrant’. Over half of the respondents ‘Strongly agreed’ with
this statement and a further 44% ‘Agreed’.
When asked whether the event has brought excellent outdoor art to the area 43%
‘Strongly agreed’ and 45% ‘Agreed’.
Qu. This event makes London feel vibrant
Qu. This event has brought excellent outdoor art to this area
17
© The Audience Agency 2012
0%
0%
37%
34%
29%
Much worse than I thought
Slightly worse than I thought
Made no difference
Slightly better than I thought
Much better than I thought
Audience survey full sample - weighted base 2094
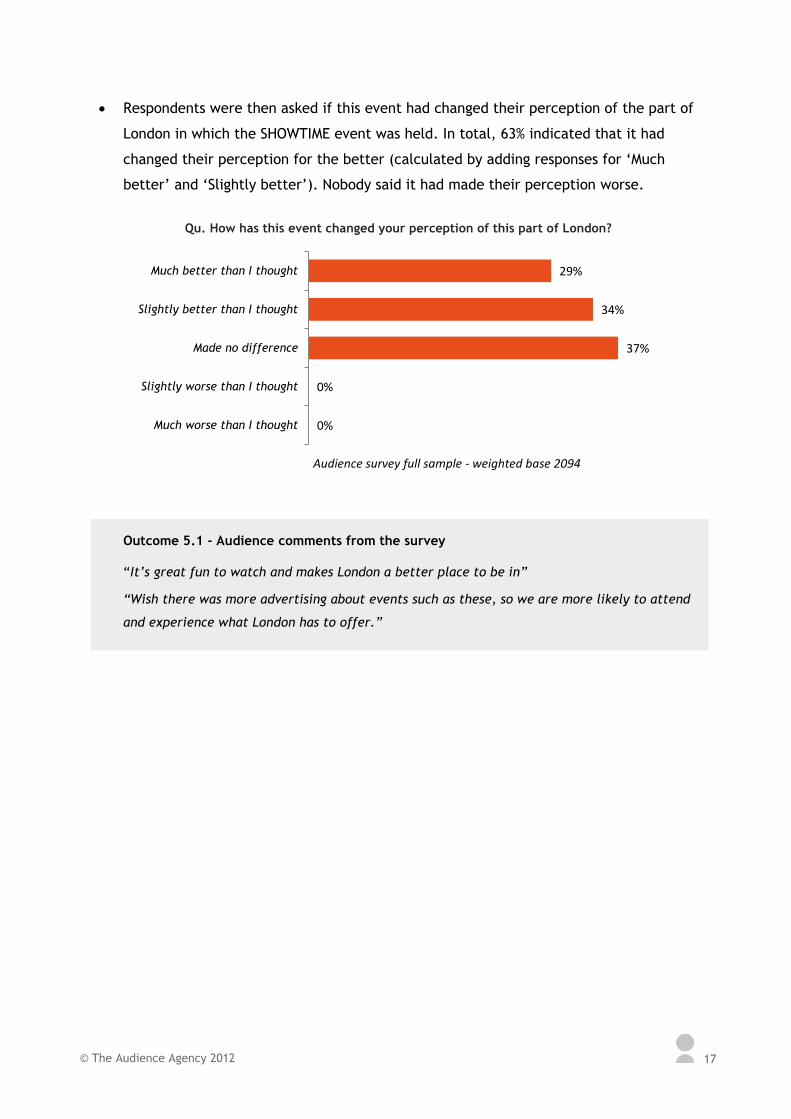
Respondents were then asked if this event had changed their perception of the part of
London in which the SHOWTIME event was held. In total, 63% indicated that it had
changed their perception for the better (calculated by adding responses for ‘Much
better’ and ‘Slightly better’). Nobody said it had made their perception worse.
Outcome 5.1 - Audience comments from the survey
“It’s great fun to watch and makes London a better place to be in”
“Wish there was more advertising about events such as these, so we are more likely to attend
and experience what London has to offer.”
Qu. How has this event changed your perception of this part of London?

18
© The Audience Agency 2012
4%
12%
18%
34%
31%
Strongly disagree
Disagree
Neither agree nordisagree
Agree
Strongly agree
Audience survey full sample - weighted base 2088
5.2 SHOWTIME connecting residents to the Olympic and Paralympic games
When asked whether they agreed of disagreed with the statement ‘This event makes me
feel part of the Olympic and Paralympic celebrations’, 31% ‘Strongly agreed’ and 34%
‘Agreed’.
Outcome 5.2 - Audience comments from the survey
“It’s a really nice thing to happen. Good to see the Olympics stretching away from East”
“Gives the park a bit of a buzz everyone coming together to share the Olympics”
“Very well planned and organised. Good security. They should do it again. Exceeded anyone’s
expectations (Olympics). Proud to be British!”
“Day like today puts the "great" in GB, great atmosphere and very enjoyable show”
Qu. This event makes me feel part of the Olympic and Paralympic celebrations