(show hubel and wiesel’s simple cell...
TRANSCRIPT

Striate Cortex (Primary Visual Cortex)
• Called ‘Area 17’ in the cat, and ‘V1’ in primates.• Simple cortical cells
– Side-by-side receptive fields– Respond to spots of light– Respond best to bar of light oriented along the length of the
receptive field• Orientation tuning curves
– Shows response of simple cortical cell for orientations of stimuli
(show Hubel and Wiesel’s simple cell movie)

How to build a simple cell from center/surround cells
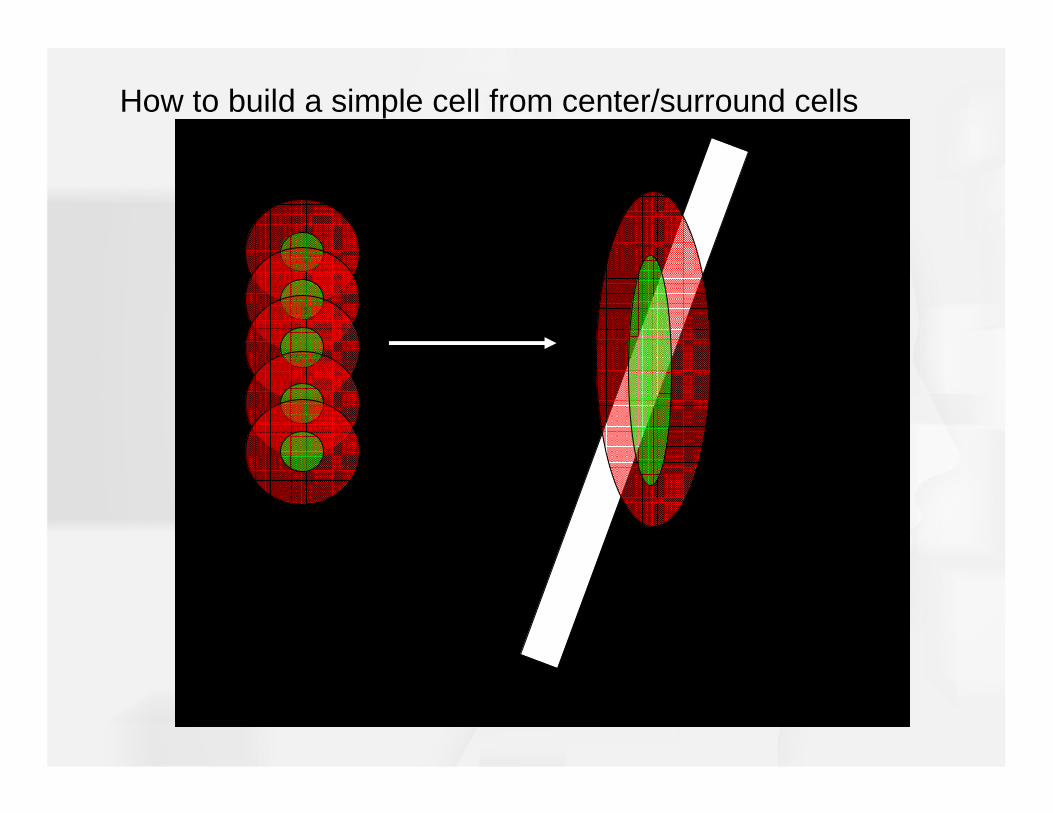
How to build a simple cell from center/surround cells


V1 (Primary Visual Cortex) - continued
• Complex cells– Like simple cells
• Respond to spots of light• Respond to bars of light
– Unlike simple cells
• respond to a stimulus of the appropriate orientation regardless
of position within the receptive field.
(show Hubel and Wiesel’s complex cell movie)

V1 (Primary Visual Cortex) - continued
• Some complex cells are directionally-selective
• Responses depend on the direction of the bar
(show Hubel and Wiesel’s directionally selective complex cell movie)
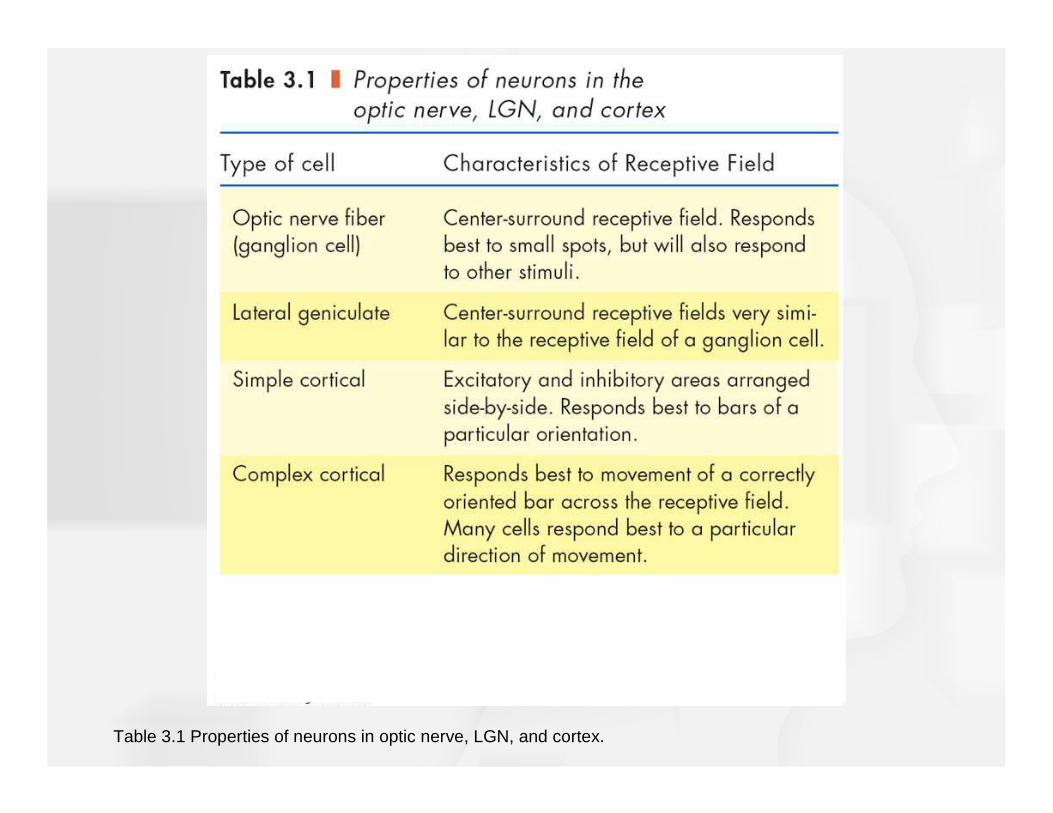
Table 3.1 Properties of neurons in optic nerve, LGN, and cortex.

How can we use psychophysics to see if humans have orientation-selective cells?
Answer: “Selective Adaptation”
• Neurons tuned to specific stimuli fatigue when exposure is long
• Fatigue causes adaptation to stimulus
– Neuron’s firing rate decreases– Neuron will fire less when stimulus presented again
• Selective means that only those neurons that respond to the specific stimulus adapt

‘Grating’ stimuli used for studying orientation and contrast
Orientation
Con
tras
t
20%
40%
60%
80%
100%
9060300 180 (0)150120

0 5 10 15 20 25 300
10
20
30
40
50
60
Time (seconds)
Fir
ing
Ra
te (
Hz)
Typical adaptation curve
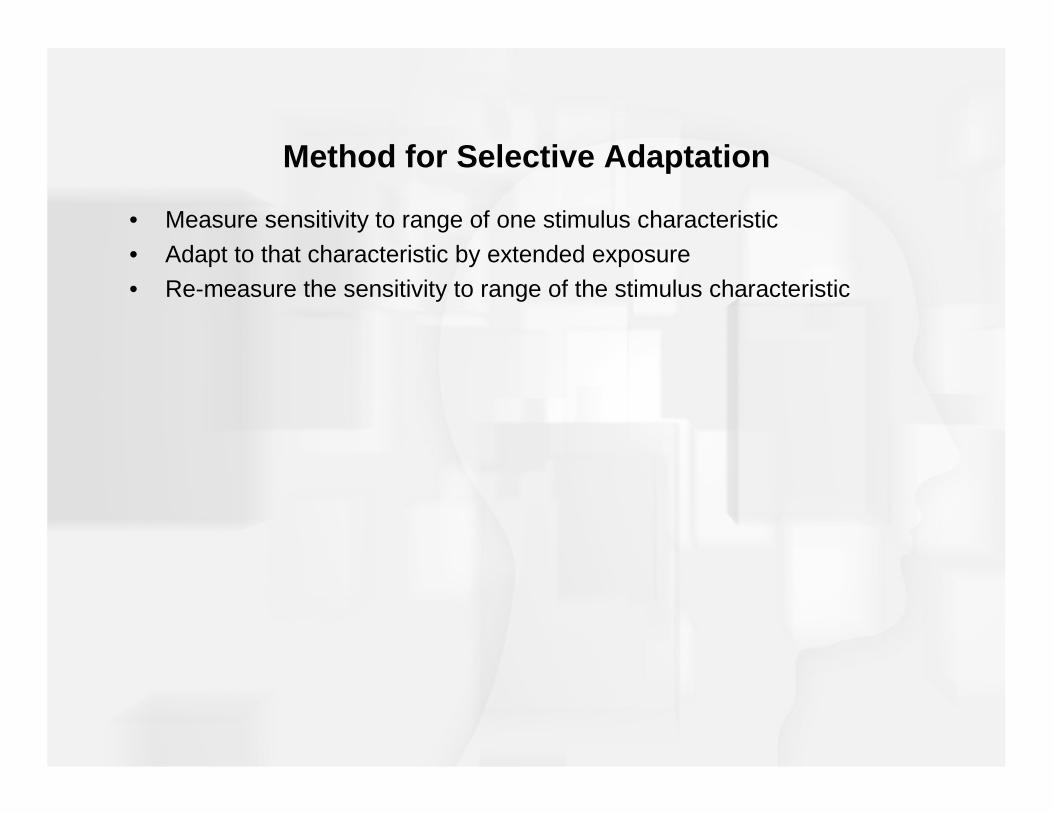
Method for Selective Adaptation
• Measure sensitivity to range of one stimulus characteristic
• Adapt to that characteristic by extended exposure
• Re-measure the sensitivity to range of the stimulus characteristic

Method for Contrast Sensitivity
• Measure contrast threshold by decreasing intensity of grating until person can just see it
• Calculate the contrast sensitivity by taking 1/threshold
• If threshold is low, person has high contrast sensitivity

Method for Orientation Sensitivity
• Use a high contrast grating
• Measure sensitivity to different orientations
• Adapt person to one orientation • Re-measure sensitivity to all orientations
• Psychophysical curve should show selective adaptation for specific orientation if neurons are tuned to this characteristic

0 45 90 135 1800
1
2
3
4
5
6
Orientation (degrees)
Sen
sitiv
ity
Before adaptation: equal sensitivity to all orientations

Adapt to a 90 degree (horizontal) grating for several minutes

0 45 90 135 1800
1
2
3
4
5
6
Orientation (degrees)
Sen
sitiv
ity
After adaptation, you’re less sensitive to 90 degree gratings
Adapt here

0 45 90 135 1800
1
2
3
4
5
6
Orientation (degrees)
Sen
sitiv
ity
0 45 90 135 1800
1
2
3
4
5
6
Orientation (degrees)
Sen
sitiv
ity
Before adaptation
After adaptation
Before - after
0 45 90 135 1800
0.2
0.4
0.6
0.8
1
Orientation (degrees)
Cha
nge
in S
ensi
tivity
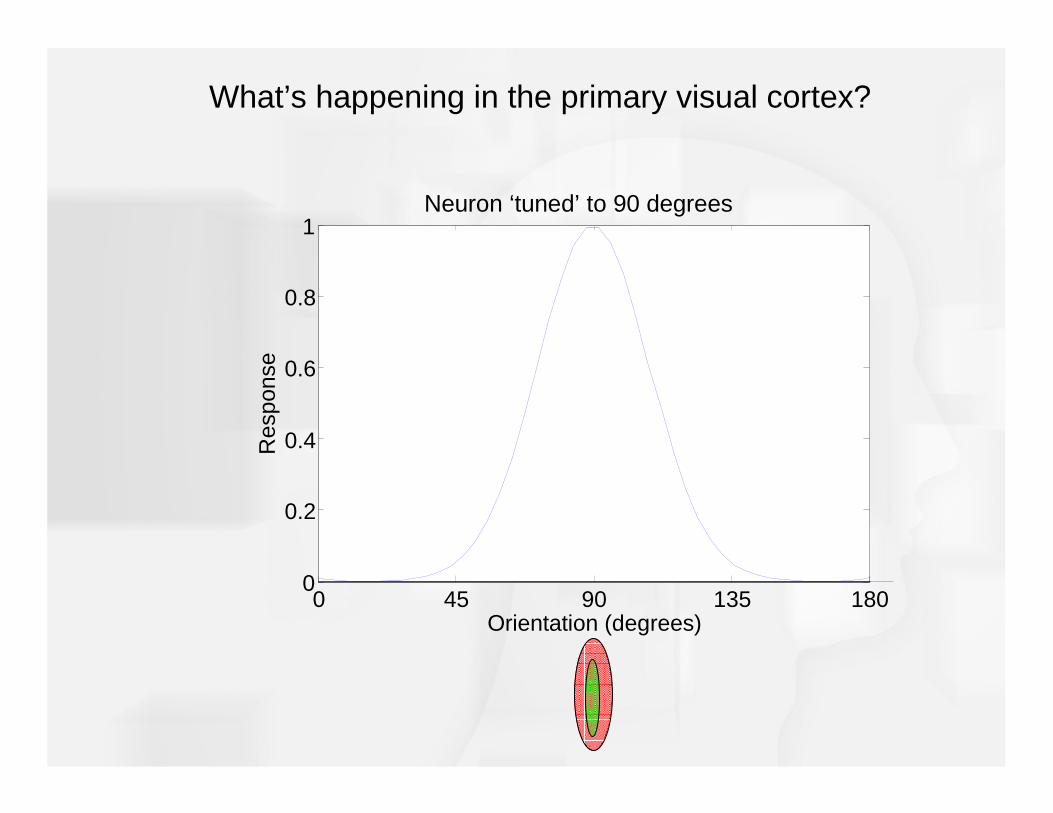
What’s happening in the primary visual cortex?
Neuron ‘tuned’ to 90 degrees
0 45 90 135 1800
0.2
0.4
0.6
0.8
1
Orientation (degrees)
Res
pons
e
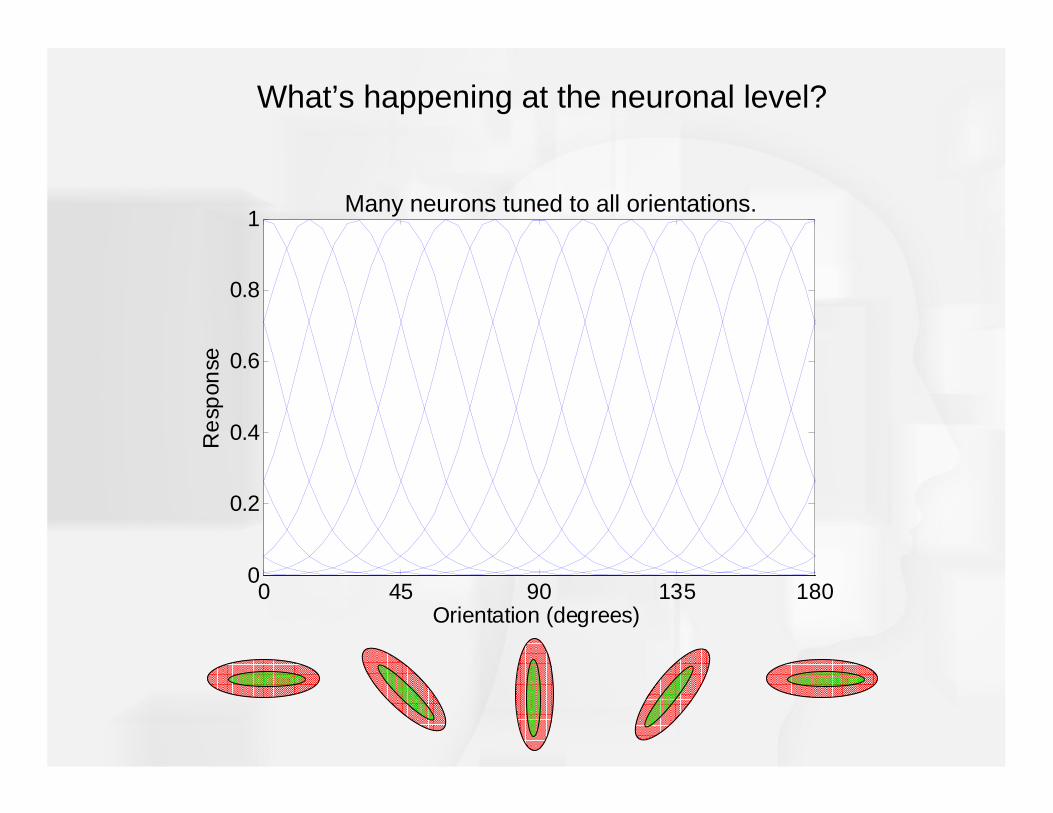
What’s happening at the neuronal level?
Many neurons tuned to all orientations.
0 45 90 135 1800
0.2
0.4
0.6
0.8
1
Orientation (degrees)
Re
spon
se
0 45 90 135 1800
0.2
0.4
0.6
0.8
1
Orientation (degrees)
Re
spon
se
0 45 90 135 1800
1
2
3
4
5
6
Orientation (degrees)
Sen
sitiv
ity
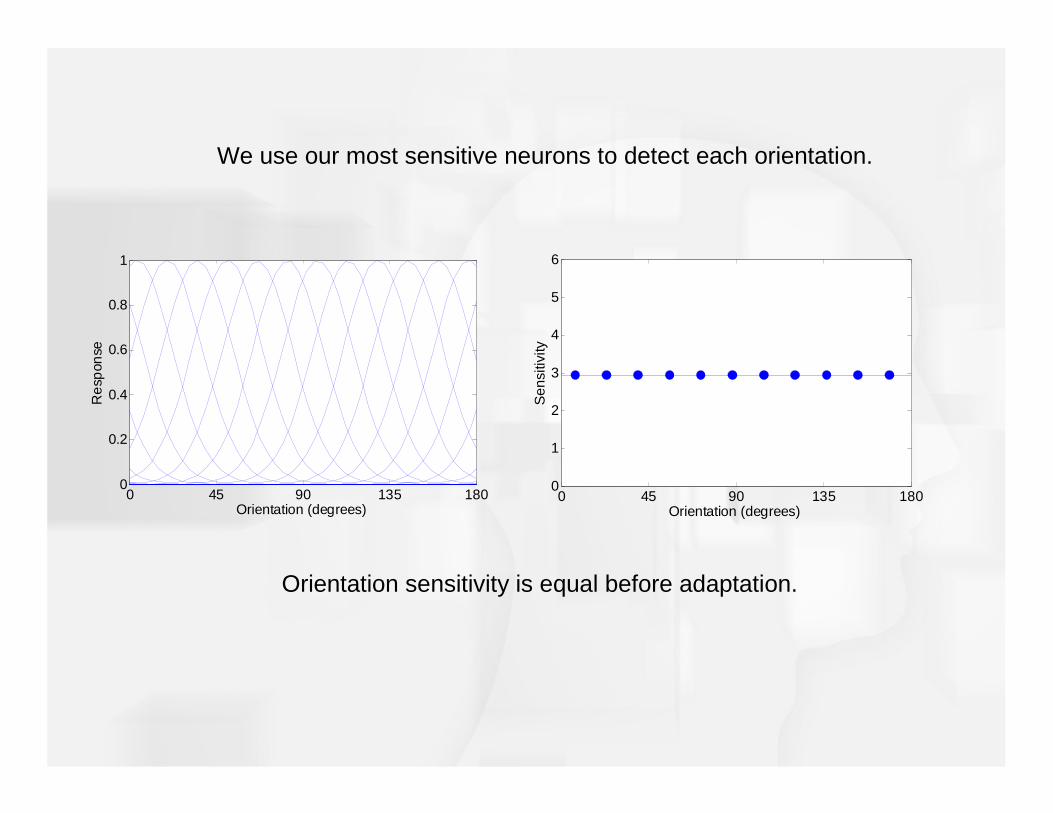
We use our most sensitive neurons to detect each orientation.
Orientation sensitivity is equal before adaptation.
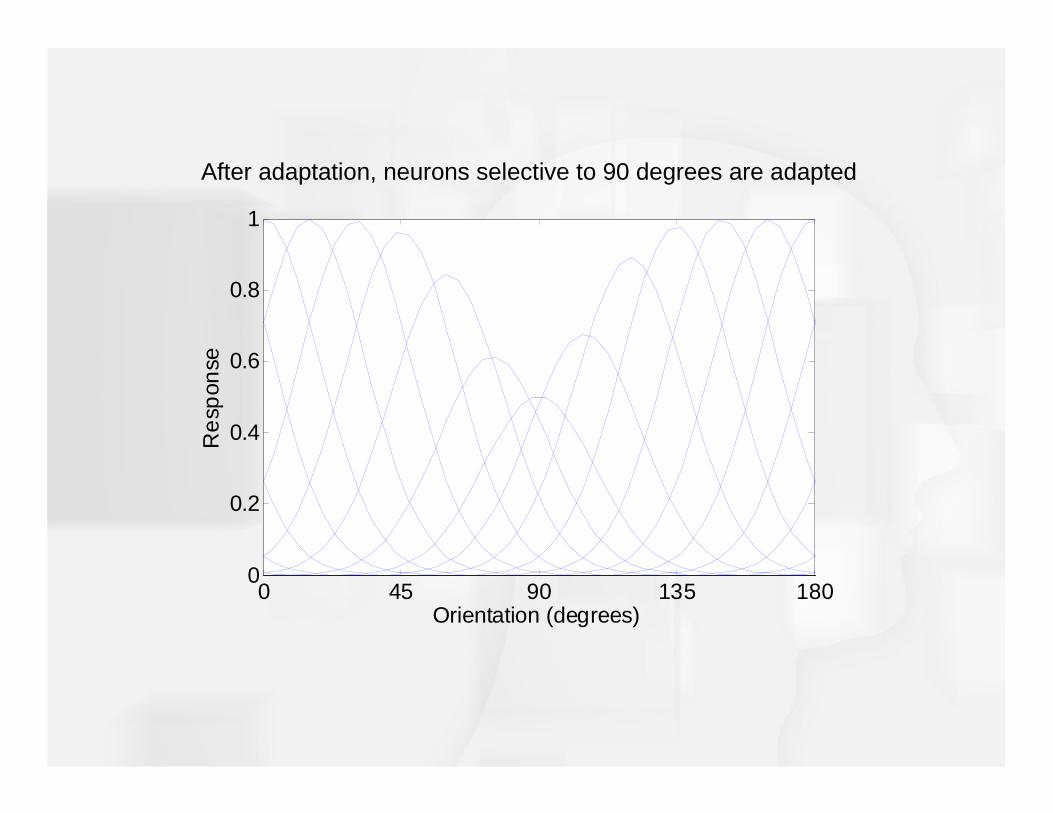
After adaptation, neurons selective to 90 degrees are adapted
0 45 90 135 1800
0.2
0.4
0.6
0.8
1
Orientation (degrees)
Re
spon
se
0 45 90 135 1800
0.2
0.4
0.6
0.8
1
Orientation (degrees)
Re
spon
se
0 45 90 135 1800
1
2
3
4
5
6
Orientation (degrees)S
ensi
tivity
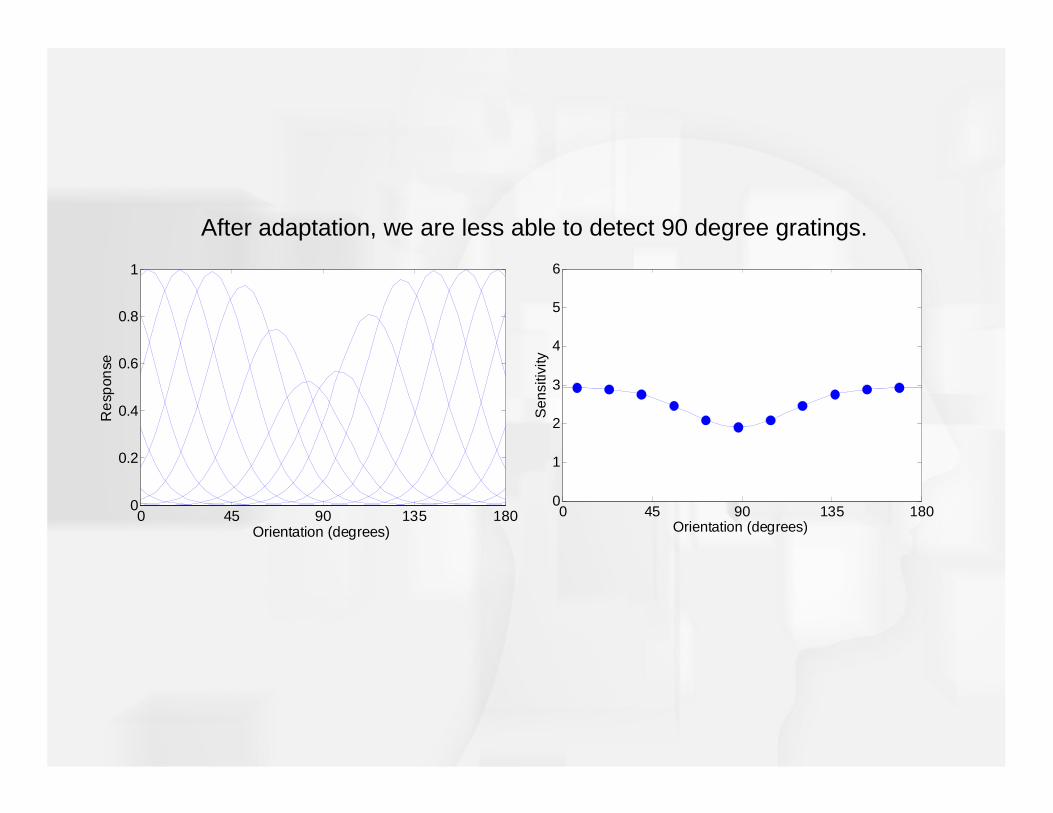
After adaptation, we are less able to detect 90 degree gratings.

Figure 3.27 (a) Results of a psychophysical selective adaptation experiment. This graph shows that the participant’s adaptation to the vertical grating causes a large decrease in her ability to detect the vertical grating when it is presented again, but has less effect on gratings that are tilted to either side of the vertical. (b) Orientation tuning curve of the simple cortical neuron from Figure 3.23b.

Other evidence of orientation tuned neurons:
Tilt illusionEvidence of orientation-selective lateral inhibition?
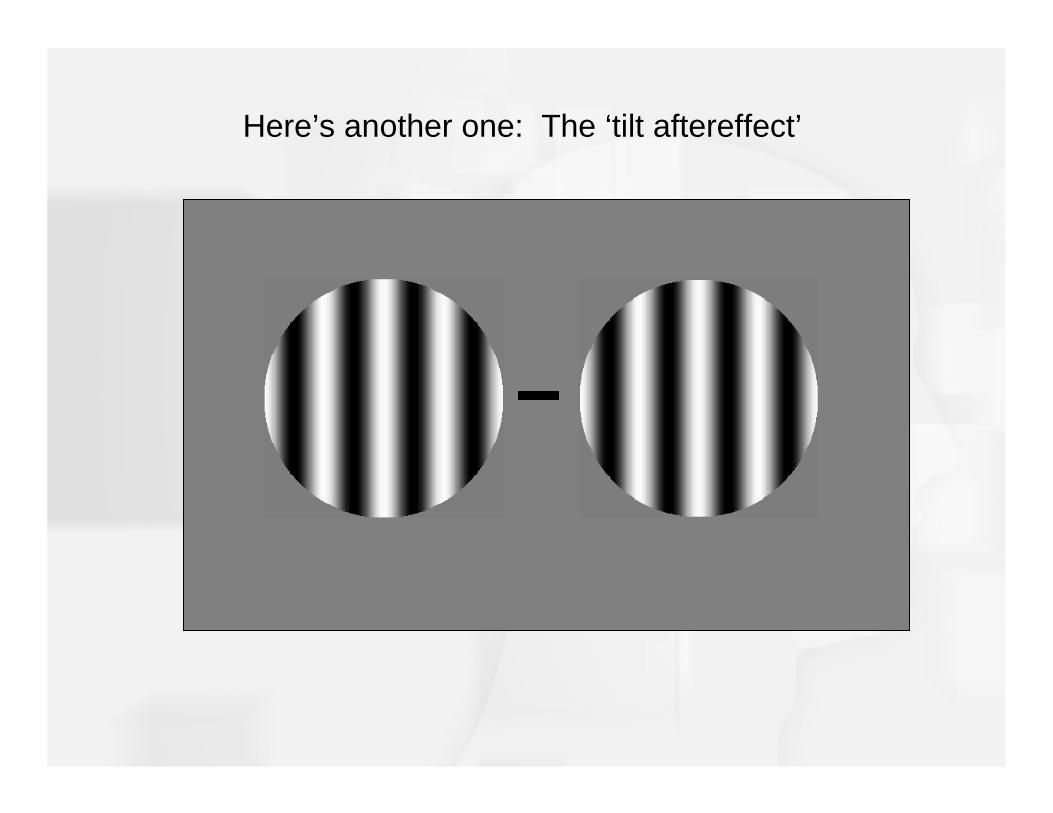
Here’s another one: The ‘tilt aftereffect’

Here’s another one: The ‘tilt aftereffect’
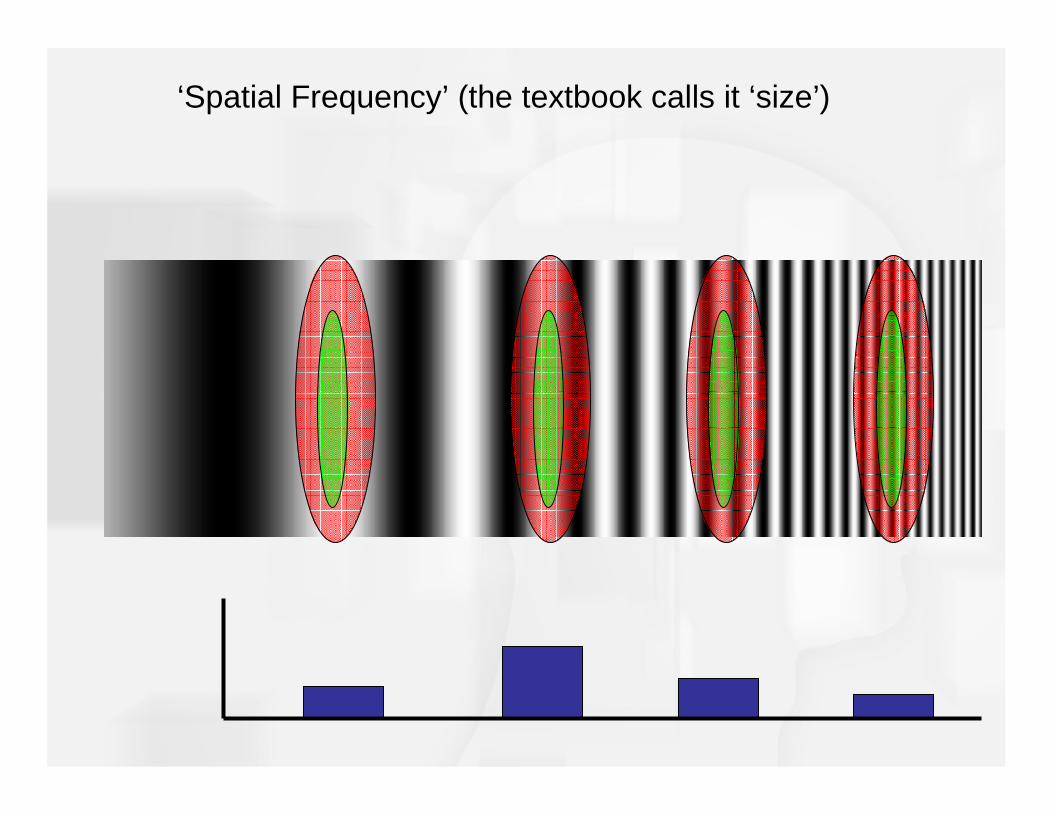
‘Spatial Frequency’ (the textbook calls it ‘size’)
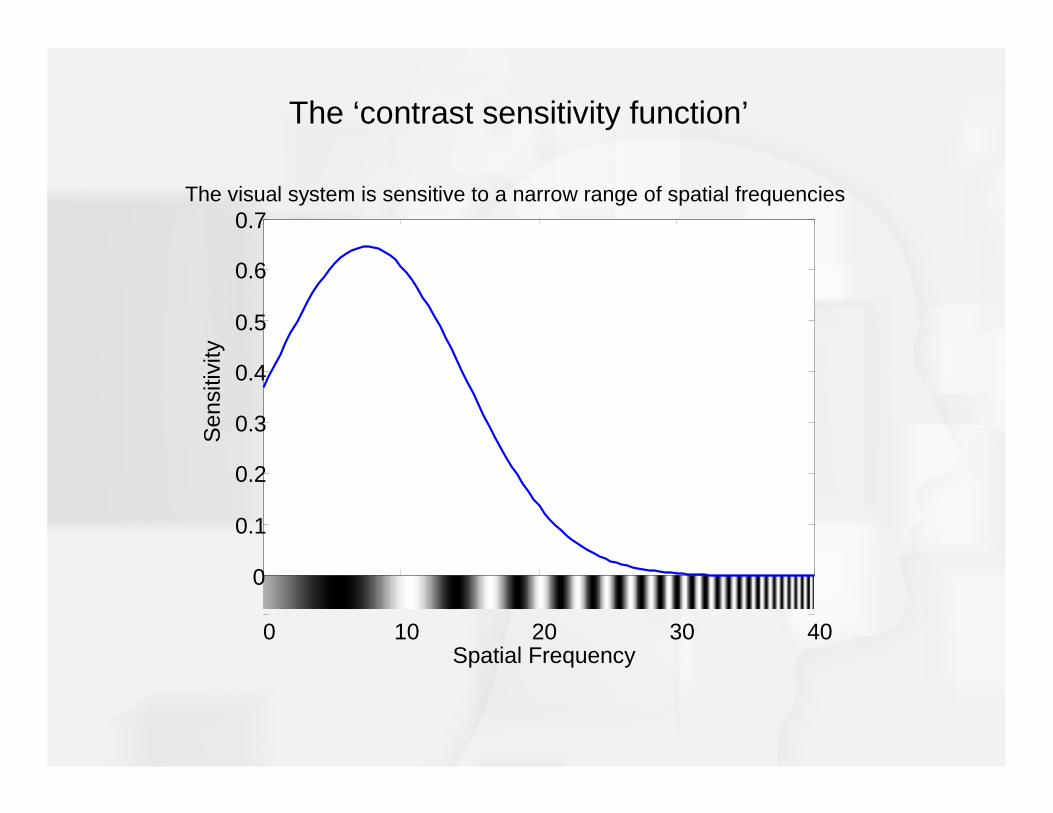
The visual system is sensitive to a narrow range of spatial frequencies
0 10 20 30 40
0
0.1
0.2
0.3
0.4
0.5
0.6
0.7
Spatial Frequency
Sen
sitiv
ity
The ‘contrast sensitivity function’

0 10 20 30 400
0.1
0.2
0.3
0.4
0.5
0.6
0.7
Spatial Frequency
Sen
sitiv
ity
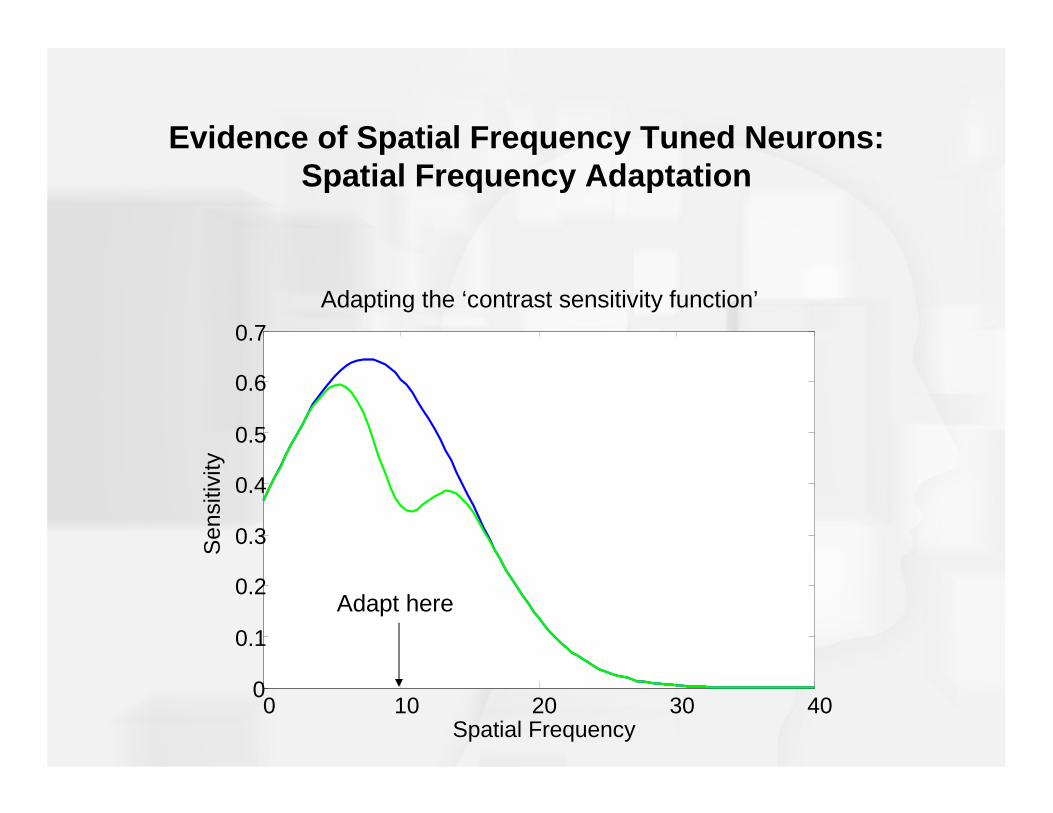
Adapt here
Adapting the ‘contrast sensitivity function’
Evidence of Spatial Frequency Tuned Neurons:Spatial Frequency Adaptation

0 10 20 30 400
0.05
0.1
0.15
0.2
0.25
Spatial Frequency
Ch
ange
in S
ens
itivi
ty 0 10 20 30 400
0.1
0.2
0.3
0.4
0.5
0.6
0.7
Spatial Frequency
Sen
sitiv
ity
Adapting the ‘contrast sensitivity function’
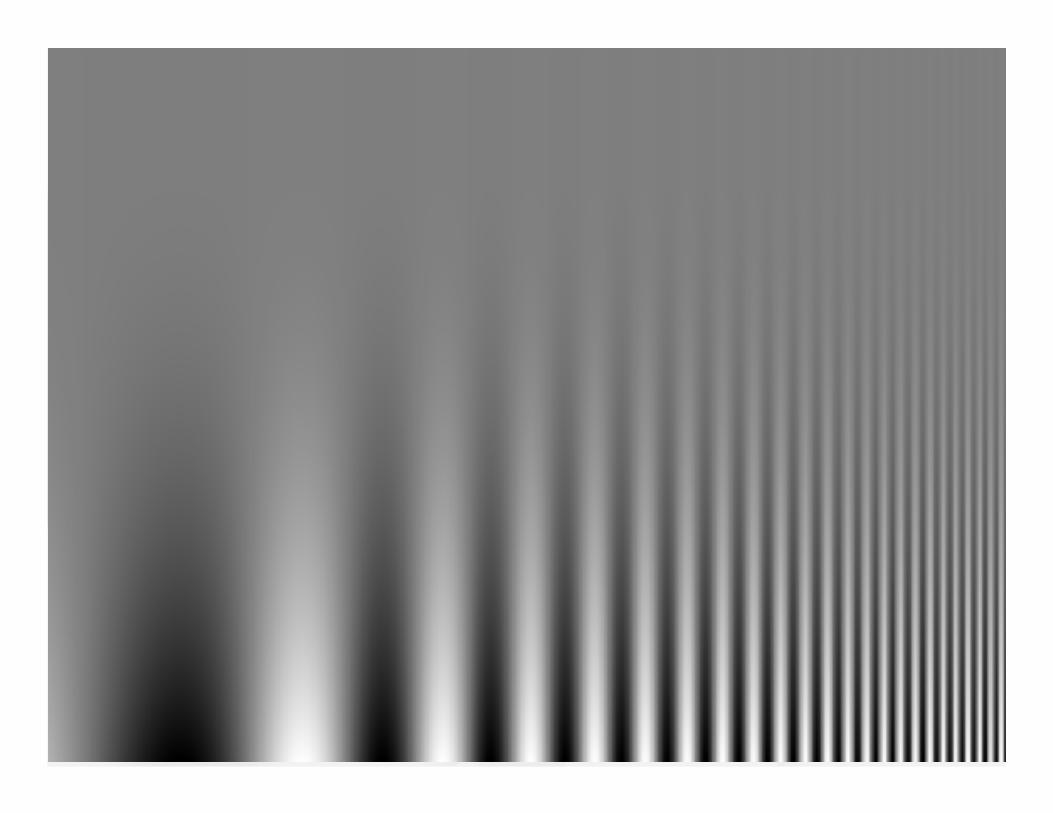

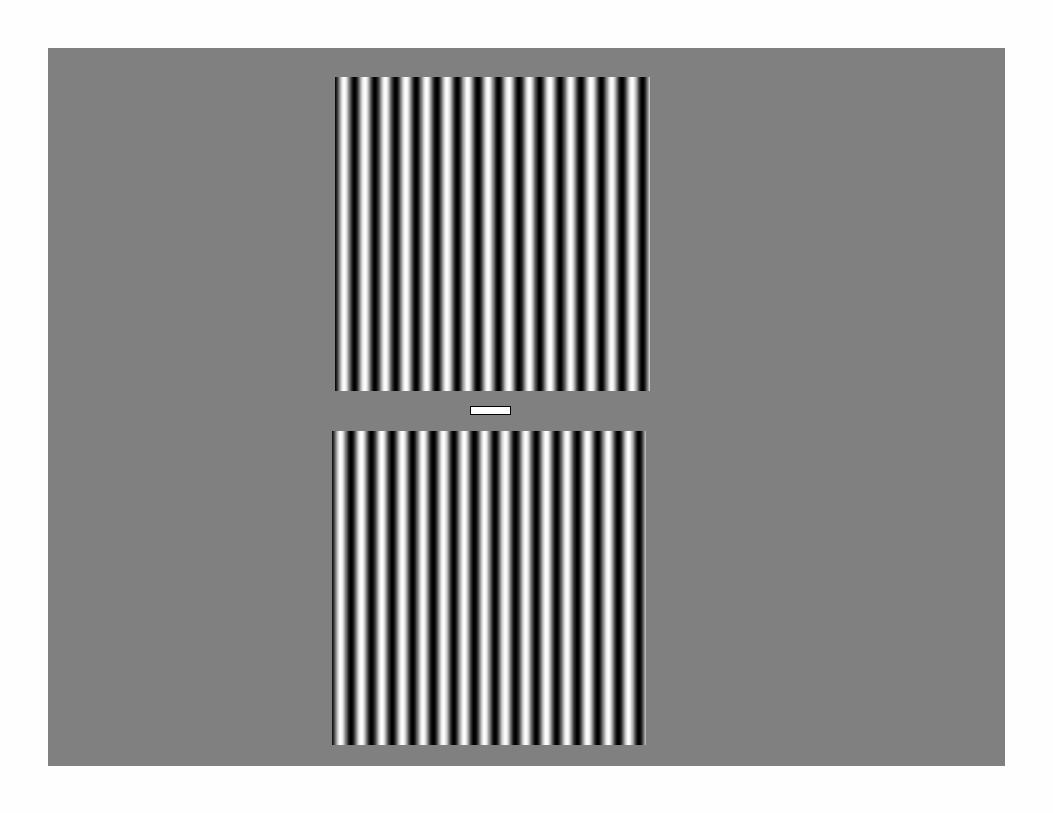


Figure 3.30 How neurons that respond best to narrow (N), medium (M), and wide (W) bars respond to the medium-bar grating on the right of Figure 3.28. (a-b): Response before adaptation. (c) Response after adaptation to the wide-bar grating at the top left. (d) Response after adaptation to the narrow-bar grating on the bottom left.
Selective Rearing
• Animals reared in specific environment
– Limits type of stimuli present
– Neural plasticity would result in lack of ability to see characteristics unavailable in environment
– Shows that neurons need environment to develop fully

Figure 3.31 (a) Striped tube used in Blakemore and Cooper’s (1970) selective rearing experiments. (b) Distribution of optimal orientations for 52 cells from a cat reared in an environment of horizontal stripes, on the left, and for 72 cells from a cat reared in an environment of vertical stripes, on the right. (Blakemore & Cooper, 1970).
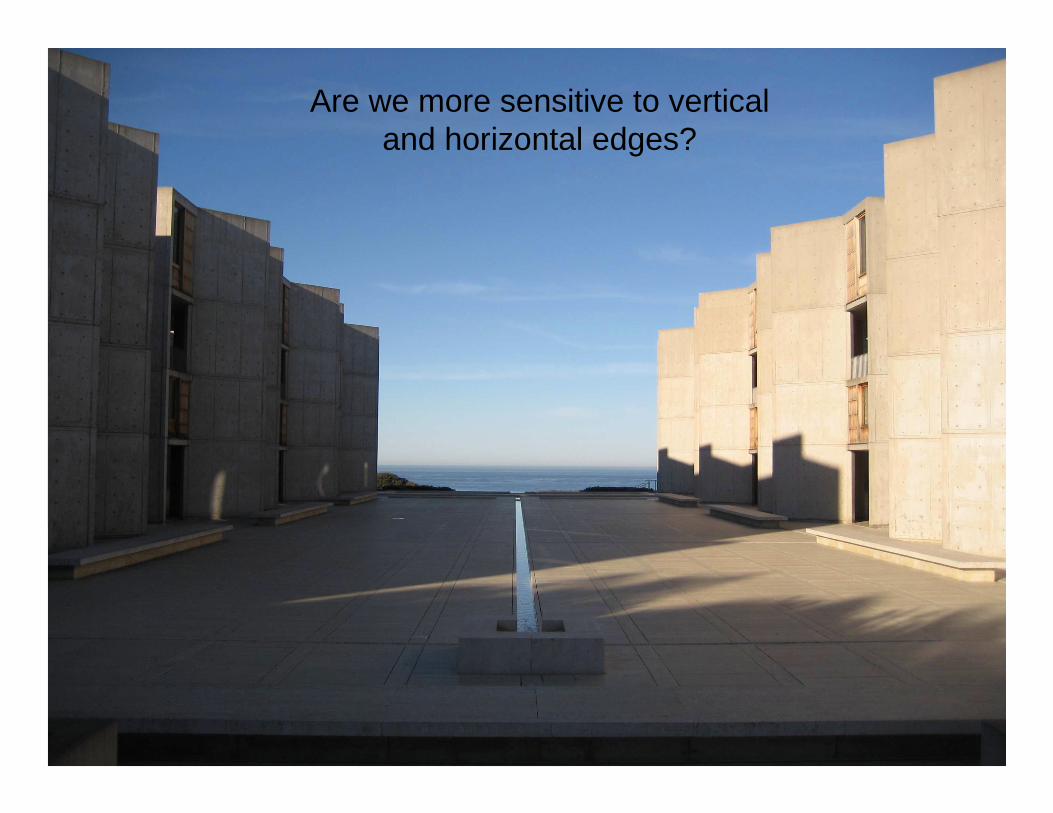
Are we more sensitive to verticaland horizontal edges?