should dietary fat guidelines have been...
TRANSCRIPT

Should dietary fat guidelines have been introduced?
Breckenridge
February 2017
Dr. Zoë Harcombe, Ph.D

Agenda
• The Dietary Fat Guidelines: When? What? Why?
• Did RCT evidence support the DFGs at the time?
• Did epidemiological evidence support the DFGs at the time?
• Does RCT evidence support them now?
• Does epidemiological evidence support them now?
• Other reviews of the evidence
• Conclusion • Refs are on http://www.zoeharcombe.com/phd-thesis/references/
2 © Dr. Zoë Harcombe, Ph.D. www.zoeharcombe.com

The Dietary Fat Guidelines
• 1977 Dietary Goals for the USA
• 1980 Dietary Guidelines for Americans
• 1983 Proposals for nutritional guidelines for health education in Britain (NACNE)
• 1984 Diet & cardiovascular disease policy paper (COMA)
• We did a U-turn in our diet advice...
Refs 15, 16 ,18, 248, 258
When?
3 © Dr. Zoë Harcombe, Ph.D. www.zoeharcombe.com

The Dietary Fat Guidelines
• From: “Farinaceous and vegetable foods are fattening, and saccharine
matters are especially so.” (Tanner 1869 – page 213)
• To: “Base your meals on starchy foods.” (UK gov. 1984)
“The previous nutritional advice in the UK to limit the intake of all carbohydrates as a means of weight control now runs counter to current thinking … The problem then becomes one of achieving both a reduction
in fat intake to 30% of total energy and a fall in saturated fatty acid intake to 10%.”
• Note: We don’t tell people to eat carbs because we know they’re
healthy...
Refs 244, 258
What?
4 © Dr. Zoë Harcombe, Ph.D. www.zoeharcombe.com

The Dietary Fat Guidelines
• 1950 US death rate 1.45% (1,446 per 100,000)
• Heart deaths 0.59% (589 per 100,000) OR
• Heart deaths = 589/1,446 = 40%
Refs 55-75
5
Why?
© Dr. Zoë Harcombe, Ph.D. www.zoeharcombe.com
The Dietary Fat Guidelines
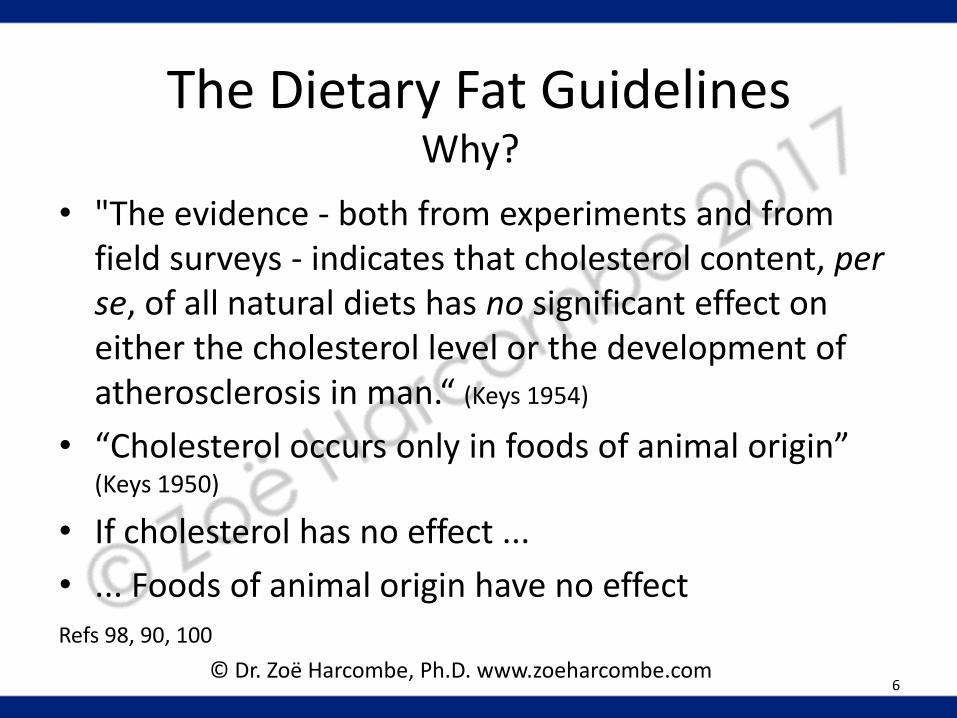
• "The evidence - both from experiments and from field surveys - indicates that cholesterol content, per se, of all natural diets has no significant effect on either the cholesterol level or the development of atherosclerosis in man.“ (Keys 1954)
• “Cholesterol occurs only in foods of animal origin” (Keys 1950)
• If cholesterol has no effect ...
• ... Foods of animal origin have no effect
Why?
6
Refs 98, 90, 100
© Dr. Zoë Harcombe, Ph.D. www.zoeharcombe.com
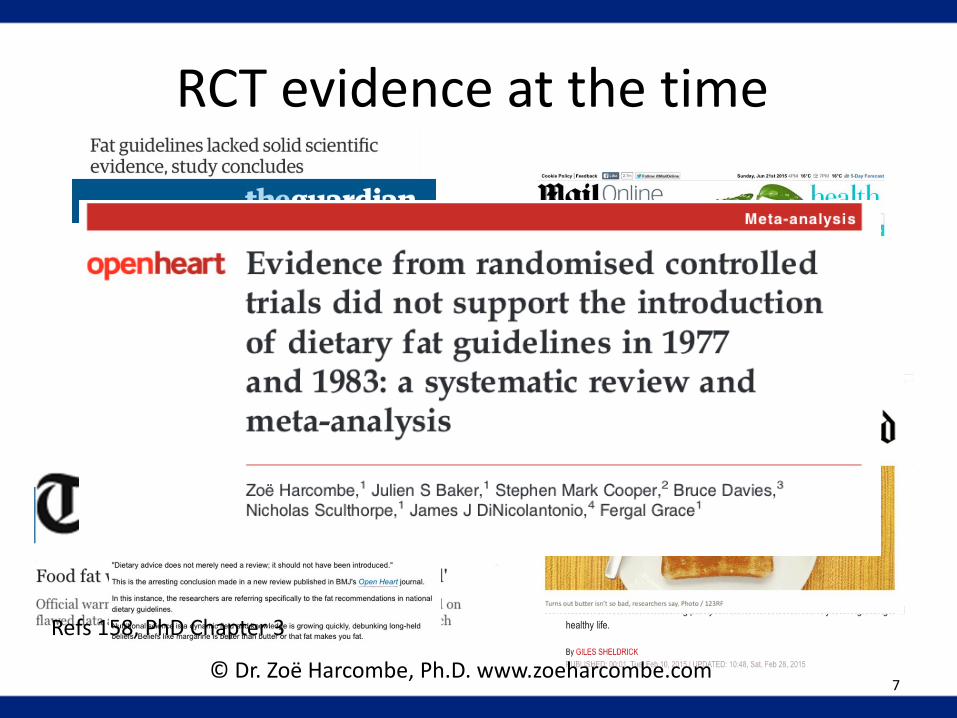
RCT evidence at the time
7
Refs 158, PhD Chapter 3
© Dr. Zoë Harcombe, Ph.D. www.zoeharcombe.com

RCT evidence at the time
8
Refs 158, PhD Chapter 3
© Dr. Zoë Harcombe, Ph.D. www.zoeharcombe.com
RCT evidence at the time
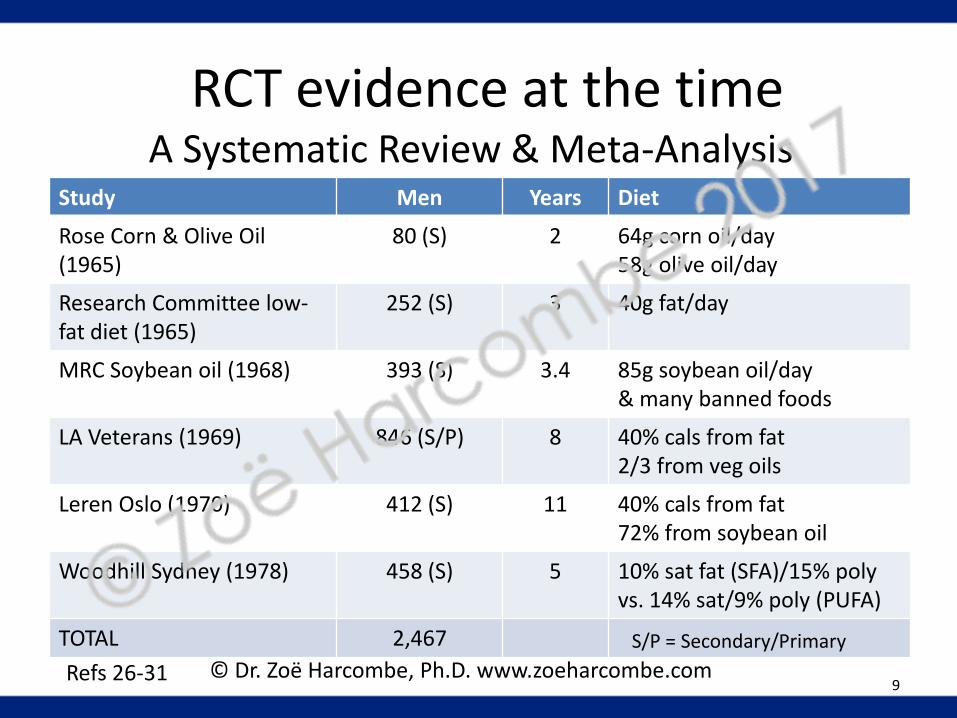
Study Men Years Diet
Rose Corn & Olive Oil (1965)
80 (S) 2 64g corn oil/day 58g olive oil/day
Research Committee low-fat diet (1965)
252 (S) 3 40g fat/day
MRC Soybean oil (1968) 393 (S) 3.4 85g soybean oil/day & many banned foods
LA Veterans (1969) 846 (S/P) 8 40% cals from fat 2/3 from veg oils
Leren Oslo (1970) 412 (S) 11 40% cals from fat 72% from soybean oil
Woodhill Sydney (1978) 458 (S) 5 10% sat fat (SFA)/15% poly vs. 14% sat/9% poly (PUFA)
TOTAL 2,467
Refs 26-31 9
A Systematic Review & Meta-Analysis
S/P = Secondary/Primary
© Dr. Zoë Harcombe, Ph.D. www.zoeharcombe.com
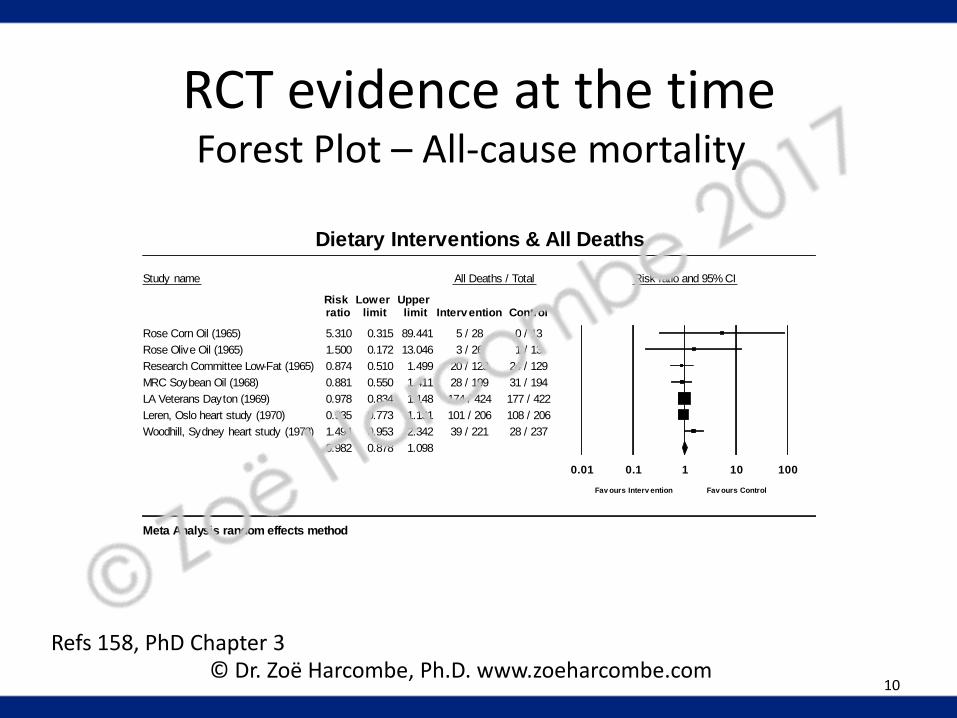
RCT evidence at the time Forest Plot – All-cause mortality
10
Study name All Deaths / Total Risk ratio and 95% CI
Risk Lower Upper ratio limit limit Intervention Control
Rose Corn Oil (1965) 5.310 0.315 89.441 5 / 28 0 / 13
Rose Olive Oil (1965) 1.500 0.172 13.046 3 / 26 1 / 13
Research Committee Low-Fat (1965) 0.874 0.510 1.499 20 / 123 24 / 129
MRC Soybean Oil (1968) 0.881 0.550 1.411 28 / 199 31 / 194
LA Veterans Dayton (1969) 0.978 0.834 1.148 174 / 424 177 / 422
Leren, Oslo heart study (1970) 0.935 0.773 1.131 101 / 206 108 / 206
Woodhill, Sydney heart study (1978) 1.494 0.953 2.342 39 / 221 28 / 237
0.982 0.878 1.098
0.01 0.1 1 10 100
Fav ours Interv ention Fav ours Control
Dietary Interventions & All Deaths
Meta Analysis random effects method
Refs 158, PhD Chapter 3 © Dr. Zoë Harcombe, Ph.D. www.zoeharcombe.com

RCT evidence at the time Forest Plot – CHD deaths
11
Study name Heart Deaths / Total Risk ratio and 95% CI
Risk Lower Upper ratio limit limit Intervention Control
Rose Corn Oil (1965) 5.310 0.315 89.441 5 / 28 0 / 13
Rose Olive Oil (1965) 1.500 0.172 13.046 3 / 26 1 / 13
Research Committee Low-Fat (1965) 0.891 0.490 1.620 17 / 123 20 / 129
MRC Soybean Oil (1968) 1.053 0.634 1.748 27 / 199 25 / 194
LA Veterans Dayton (1969) 0.816 0.552 1.206 41 / 424 50 / 422
Leren, Oslo heart study (1970) 0.840 0.669 1.056 79 / 206 94 / 206
Woodhill, Sydney heart study (1978) 1.501 0.930 2.425 35 / 221 25 / 237
0.951 0.784 1.155
0.01 0.1 1 10 100
Fav ours Interv ention Fav ours Control
Dietary Interventions & CHD Deaths
Meta Analysis random effects method
Refs 158, PhD Chapter 3
© Dr. Zoë Harcombe, Ph.D. www.zoeharcombe.com
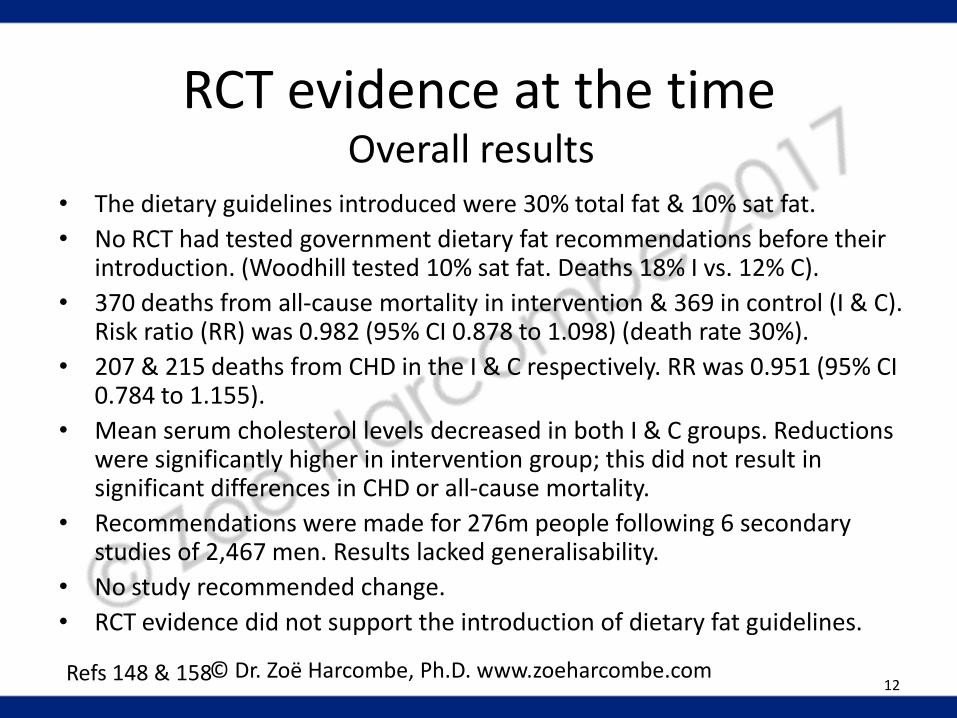
• The dietary guidelines introduced were 30% total fat & 10% sat fat.
• No RCT had tested government dietary fat recommendations before their introduction. (Woodhill tested 10% sat fat. Deaths 18% I vs. 12% C).
• 370 deaths from all-cause mortality in intervention & 369 in control (I & C). Risk ratio (RR) was 0.982 (95% CI 0.878 to 1.098) (death rate 30%).
• 207 & 215 deaths from CHD in the I & C respectively. RR was 0.951 (95% CI 0.784 to 1.155).
• Mean serum cholesterol levels decreased in both I & C groups. Reductions were significantly higher in intervention group; this did not result in significant differences in CHD or all-cause mortality.
• Recommendations were made for 276m people following 6 secondary studies of 2,467 men. Results lacked generalisability.
• No study recommended change.
• RCT evidence did not support the introduction of dietary fat guidelines.
12 Refs 148 & 158
RCT evidence at the time Overall results
© Dr. Zoë Harcombe, Ph.D. www.zoeharcombe.com

Epidemiological evidence at the time
13 Ref 277 © Dr. Zoë Harcombe, Ph.D. www.zoeharcombe.com

Epidemiological evidence at the time
Refs 19, 22-24 14
Significant associations with CHD...
Study Men (age) Years Chol. Fat Other
Western Electric Study (1963)
1,989 (40-55)
4 Y Total N Sat N
Smoking/age of death of father/coffee
Seven Countries Study (1970)
12,770 (2% CHD) (40-59)
5 Y Total N Sat Y
NO association with smoking/activity/weight
London bank & bus men (1977)
337 (30-67)
20 N Total N Sat N/A
Smoking/Inverse with higher calorie intake
Framingham (1970 & 1981)
859 (45-64)
4 N/A Total N Sat N
Inverse with higher calorie & higher alcohol intake
Honolulu (1974 & 1981)
7,272 (45-64)
6 N/A Total N Sat N
Inverse with higher calorie & higher alcohol intake
Puerto Rico (1969 & 1981)
8,218 (45-64)
6 N/A Total N Sat N
Inverse with higher calorie intake & rural living
A Systematic Review
© Dr. Zoë Harcombe, Ph.D. www.zoeharcombe.com

Epidemiological evidence at the time
• 1970; 7 countries (Finland, Greece, Italy, Japan, Netherlands, USA & Yugoslavia); 16 cohorts; 12,770 men aged 40-59 in 1956
1) CHD tends to be related to cholesterol
2) Cholesterol tends to be related to sat fat
3) CHD is as closely related to sat fat as it is to cholesterol
• r = 0.72 for CHD deaths at 25 years & cholesterol at start (0.52 = r2 )
• r = 0.96 for CHD deaths & latitude (0.92 = r2 ) Refs 19, 208
The Seven Countries Study
15 © Dr. Zoë Harcombe, Ph.D. www.zoeharcombe.com
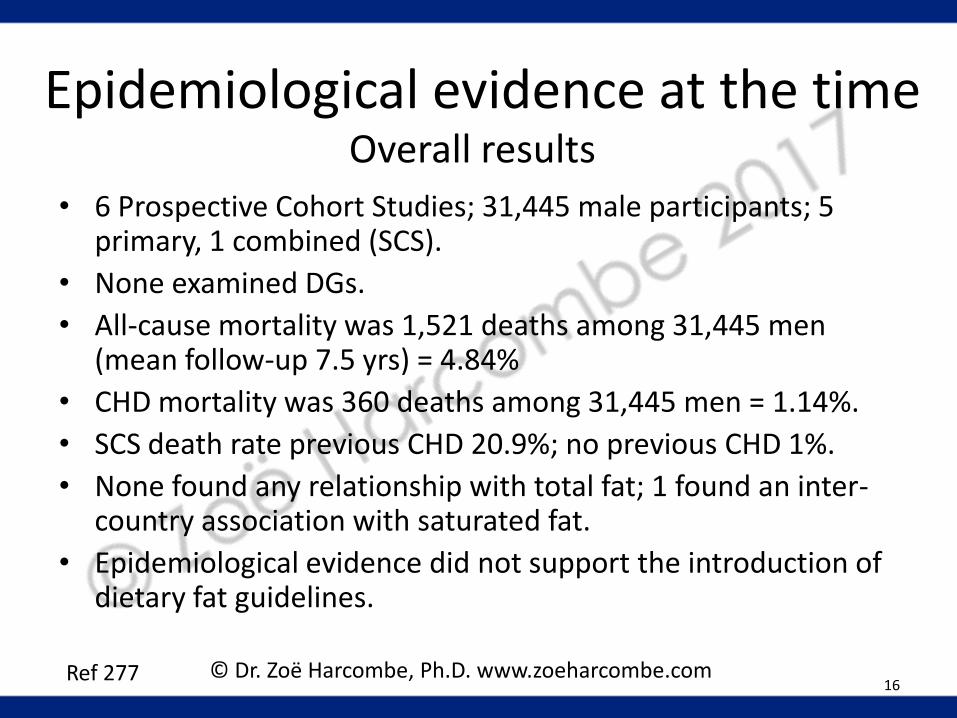
• 6 Prospective Cohort Studies; 31,445 male participants; 5 primary, 1 combined (SCS).
• None examined DGs.
• All-cause mortality was 1,521 deaths among 31,445 men (mean follow-up 7.5 yrs) = 4.84%
• CHD mortality was 360 deaths among 31,445 men = 1.14%.
• SCS death rate previous CHD 20.9%; no previous CHD 1%.
• None found any relationship with total fat; 1 found an inter-country association with saturated fat.
• Epidemiological evidence did not support the introduction of dietary fat guidelines.
16 Ref 277
Epidemiological evidence at the time Overall results
© Dr. Zoë Harcombe, Ph.D. www.zoeharcombe.com
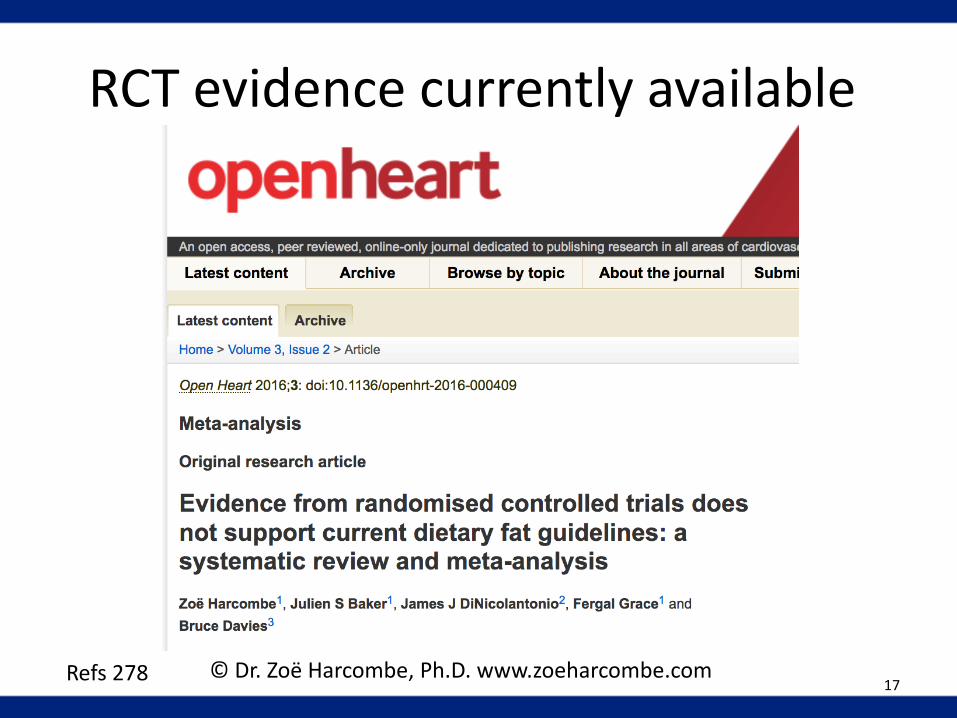
RCT evidence currently available
17 Refs 278 © Dr. Zoë Harcombe, Ph.D. www.zoeharcombe.com

RCT evidence currently available
Study (Table Part 1) Men Years Diet
Rose Corn & Olive Oil (1965)
80 (S) 2 64g corn oil/day 58g olive oil/day
Research Committee low-fat diet (1965)
252 (S) 3 40g fat/day
MRC Soybean oil (1968) 393 (S) 3.4 85g soybean oil/day & many banned foods
LA Veterans (1969) 846 (S/P) 8 40% cals from fat 2/3 from veg oils
Leren Oslo (1970) 412 (S) 11 40% cals from fat 72% from soybean oil
Woodhill Sydney (1978) 458 (S) 5 10% sat fat (SFA)/15% poly vs. 14% sat/9% poly (PUFA)
Refs 26-31 18
A Systematic Review & Meta-Analysis
S/P = Secondary/Primary © Dr. Zoë Harcombe, Ph.D. www.zoeharcombe.com

RCT evidence currently available
Study (Table Part 2) People Years Diet
DART Burr (1989) All men
2,033 (S) 2 Total fat 30% PUFA/SFA ratio = 1
Minnesota Coronary Survey Frantz (1989) - Men - Women
9,057 (P)
2,197/2,196 2,344/2,320
1 Ctrl: 39% cals fat (18% SFA; 5% PUFA; 16% MUFA) Int: 38% cals fat (9% SFA; 15% PUFA; 14% MUFA)
STARS Watts (1992) All men
55 (S) 3.25 27% cals fat (8-10% SFA; 8% PUFA)
WHI Howard (2006) All Women
48,835 (P/S) 8.1 20% cals fat; 7% cals SFA
TOTAL 62,421
Refs 36-38, 49 19
A Systematic Review & Meta-Analysis
S/P = Secondary/Primary PUFA/MUFA/SFA – poly/mono & sat fat
© Dr. Zoë Harcombe, Ph.D. www.zoeharcombe.com

Study name All Deaths / Total Risk ratio and 95% CI
Risk Lower Upper ratio limit limit Intervention Control
Rose Corn Oil (1965) 5.310 0.315 89.441 5 / 28 0 / 13
Rose Olive Oil (1965) 1.500 0.172 13.046 3 / 26 1 / 13
Research Committee Low-Fat (1965) 0.874 0.510 1.499 20 / 123 24 / 129
MRC Soybean Oil (1968) 0.881 0.550 1.411 28 / 199 31 / 194
LA Veterans Dayton (1969) 0.978 0.834 1.148 174 / 424 177 / 422
Leren, Oslo heart study (1970) 0.935 0.773 1.131 101 / 206 108 / 206
Woodhill, Sydney heart study (1978) 1.494 0.953 2.342 39 / 221 28 / 237
DART Fat advice (1989) 0.979 0.765 1.254 111 / 1018 113 / 1015
Frantz Minnesota Men (1989) 1.032 0.833 1.279 158 / 2197 153 / 2196
Frantz Minnesota Women (1989) 1.156 0.885 1.512 111 / 2344 95 / 2320
STARS (1992) 0.346 0.038 3.122 1 / 27 3 / 28
WHI (2006) 0.979 0.904 1.061 950 / 19541 1454 / 29294
0.991 0.935 1.051
0.01 0.1 1 10 100
Fav ours Interv ention Fav ours Control
Dietary Intervention & All Deaths
Meta Analysis random effects method
RCT evidence currently available Forest Plot – All-cause mortality
20 Ref 278 © Dr. Zoë Harcombe, Ph.D. www.zoeharcombe.com

Study name Heart Deaths / Total Risk ratio and 95% CI
Risk Lower Upper ratio limit limit Intervention Control
Rose Corn Oil (1965) 5.310 0.315 89.441 5 / 28 0 / 13
Rose Olive Oil (1965) 1.500 0.172 13.046 3 / 26 1 / 13
Research Committee Low-Fat (1965) 0.891 0.490 1.620 17 / 123 20 / 129
MRC Soybean Oil (1968) 1.053 0.634 1.748 27 / 199 25 / 194
LA Veterans Dayton (1969) 0.816 0.552 1.206 41 / 424 50 / 422
Leren, Oslo heart study (1970) 0.840 0.669 1.056 79 / 206 94 / 206
Woodhill, Sydney heart study (1978) 1.501 0.930 2.425 35 / 221 25 / 237
DART Fat advice (1989) 0.997 0.763 1.303 97 / 1018 97 / 1015
Frantz Minnesota Men (1989) 1.148 0.801 1.645 62 / 2197 54 / 2196
Frantz Minnesota Women (1989) 0.906 0.601 1.364 43 / 2344 47 / 2320
STARS (1992) 0.346 0.038 3.122 1 / 27 3 / 28
WHI (2006) 1.012 0.828 1.238 158 / 19541 234 / 29294
0.976 0.878 1.084
0.01 0.1 1 10 100
Fav ours Interv ention Fav ours Control
Dietary Intervention & CHD Deaths
Meta Analysis random effects method
RCT evidence currently available Forest Plot – CHD deaths
21 Ref 278 © Dr. Zoë Harcombe, Ph.D. www.zoeharcombe.com

• 10 RCTs; 62,421 participants; 8 M/1W/1 mixed; 7 secondary, 1 primary, 2 combined. 1 primary & mixed (Frantz).
• None examined DGs. Frantz & Woodhill tested 10% sat fat; DART tested 30% total fat; STARS tested 27% total/8-10% sat fat.
• All-cause mortality was 6.45% (I) and 6.06% (C). Risk ratio (RR) was 0.991 (95% CI 0.935 to 1.051).
• CHD mortality was 2.16% (I) and 1.80% (C). RR was 0.976 (95% CI 0.878 to 1.084).
• Mean serum cholesterol levels decreased in all but one of both I & C groups (DART control = +1.2%). Reductions were significantly higher in intervention group; this did not result in significant differences in CHD or all-cause mortality.
• RCT evidence does not support current dietary fat guidelines.
22 Ref 278
RCT evidence currently available Overall results
© Dr. Zoë Harcombe, Ph.D. www.zoeharcombe.com

Epidemiological evidence now
23 Refs 276, PhD Chapter 6
Epidemiological evidence now
Refs 213, 219-224 24
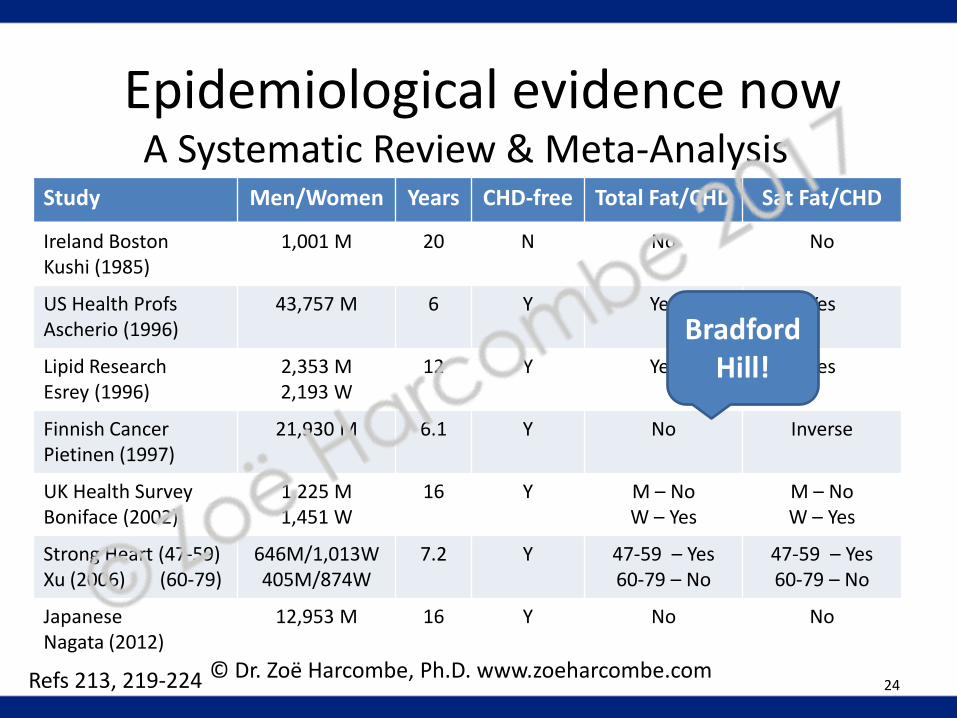
Study Men/Women Years CHD-free Total Fat/CHD Sat Fat/CHD
Ireland Boston Kushi (1985)
1,001 M 20 N No No
US Health Profs Ascherio (1996)
43,757 M 6 Y Yes Yes
Lipid Research Esrey (1996)
2,353 M 2,193 W
12 Y Yes Yes
Finnish Cancer Pietinen (1997)
21,930 M 6.1 Y No Inverse
UK Health Survey Boniface (2002)
1,225 M 1,451 W
16 Y M – No W – Yes
M – No W – Yes
Strong Heart (47-59) Xu (2006) (60-79)
646M/1,013W 405M/874W
7.2 Y 47-59 – Yes 60-79 – No
47-59 – Yes 60-79 – No
Japanese Nagata (2012)
12,953 M 16 Y No No
A Systematic Review & Meta-Analysis
Bradford Hill!
© Dr. Zoë Harcombe, Ph.D. www.zoeharcombe.com

Study name Statistics for each study Risk ratio and 95% CI
Risk Lower Upper ratio limit limit Z-Value p-Value
Ascherio (1996) 1.59 1.01 2.51 2.00 0.05
Esrey (1996) 1.04 1.01 1.07 2.66 0.01
Pietinen (1997) 0.85 0.65 1.12 -1.17 0.24
Boniface men (2002) 1.01 0.93 1.10 0.23 0.82
Boniface women (2002) 1.19 1.03 1.37 2.39 0.02
Xu aged 47-59 (2006) 3.57 1.21 10.51 2.31 0.02
Xu aged 60-79 (2006) 0.77 0.41 1.45 -0.81 0.42
Nagata (2012) 1.12 0.80 1.57 0.66 0.51
1.06 0.97 1.16 1.36 0.17
0.01 0.1 1 10 100Lower risk with total fat Higher risk with total fat
CHD deaths & Total Fat Risk Ratios
Meta Analysis random effects method
Epidemiological evidence now Forest Plot – CHD mortality & Total fat
25 Ref 276 © Dr. Zoë Harcombe, Ph.D. www.zoeharcombe.com

Study name Statistics for each study Risk ratio and 95% CI
Risk Lower Upper ratio limit limit Z-Value p-Value
Ascherio (1996) 2.21 1.38 3.54 3.30 0.00
Esrey (1996) 1.11 1.04 1.18 3.24 0.00
Pietinen (1997) 0.73 0.56 0.95 -2.33 0.02
Boniface men (2002) 1.00 0.85 1.17 0.00 1.00
Boniface women (2002) 1.40 1.09 1.79 2.66 0.01
Xu aged 47-59 (2006) 5.17 1.64 16.33 2.80 0.01
Xu aged 60-79 (2006) 0.80 0.41 1.55 -0.66 0.51
Nagata (2012) 0.96 0.67 1.38 -0.22 0.83
1.13 0.93 1.37 1.26 0.21
0.01 0.1 1 10 100Lower risk with saturated fat Higher risk with saturated fat
CHD deaths & Saturated Fat Risk Ratios
Meta Analysis random effects method
Epidemiological evidence now Forest Plot – CHD mortality & Sat fat
26 Ref 276 © Dr. Zoë Harcombe, Ph.D. www.zoeharcombe.com

• 7 Prospective Cohort Studies; 89,801 participants; 94% male; all but one (Kushi) excluded previous CHD (& this could not used in MA).
• None examined DGs.
• Risk ratio (RR) for total fat & CHD deaths was 1.06 (95% CI 0.97 to 1.16). Not significant.
• Risk ratio (RR) for saturated fat & CHD deaths was 1.13 (95% CI 0.93 to 1.37). Not significant.
• Epidemiological evidence does not support current dietary fat guidelines.
27 Ref 276
Epidemiological evidence now Overall results
© Dr. Zoë Harcombe, Ph.D. www.zoeharcombe.com
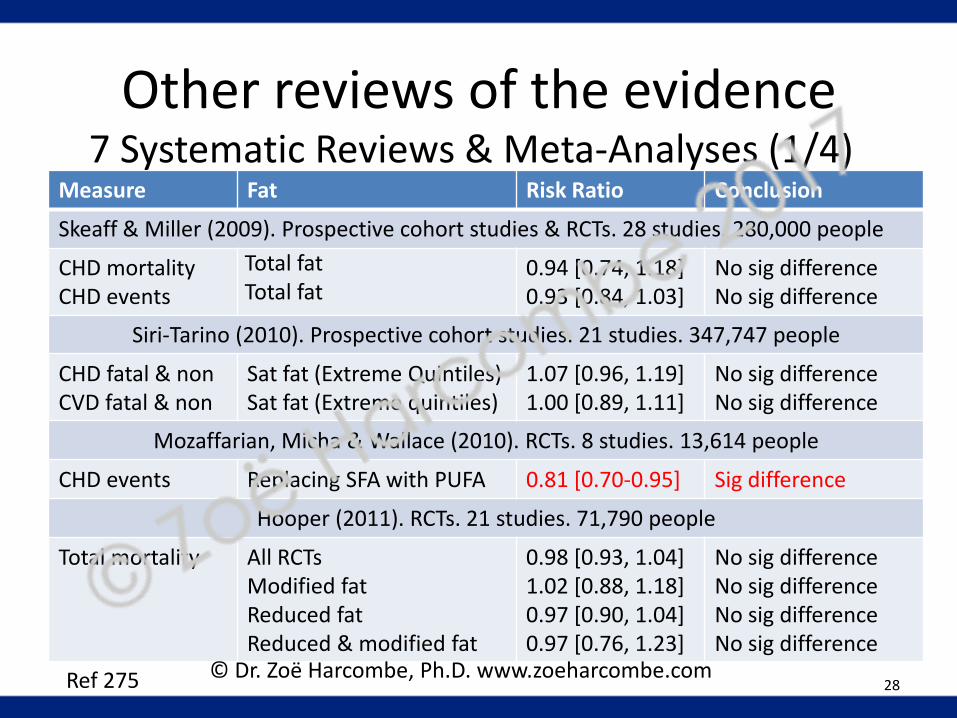
Measure Fat Risk Ratio Conclusion
Skeaff & Miller (2009). Prospective cohort studies & RCTs. 28 studies. 280,000 people
CHD mortality CHD events
Total fat Total fat
0.94 [0.74, 1.18] 0.93 [0.84, 1.03]
No sig difference No sig difference
Siri-Tarino (2010). Prospective cohort studies. 21 studies. 347,747 people
CHD fatal & non CVD fatal & non
Sat fat (Extreme Quintiles) Sat fat (Extreme quintiles)
1.07 [0.96, 1.19] 1.00 [0.89, 1.11]
No sig difference No sig difference
Mozaffarian, Micha & Wallace (2010). RCTs. 8 studies. 13,614 people
CHD events Replacing SFA with PUFA 0.81 [0.70-0.95] Sig difference
Hooper (2011). RCTs. 21 studies. 71,790 people
Total mortality
All RCTs Modified fat Reduced fat Reduced & modified fat
0.98 [0.93, 1.04] 1.02 [0.88, 1.18] 0.97 [0.90, 1.04] 0.97 [0.76, 1.23]
No sig difference No sig difference No sig difference No sig difference
28 Ref 275
Other reviews of the evidence 7 Systematic Reviews & Meta-Analyses (1/4)
© Dr. Zoë Harcombe, Ph.D. www.zoeharcombe.com

Measure Fat Risk Ratio Conclusion
Hooper (2011). RCTs. 21 studies. 71,790 people (Cont’d)
CVD mortality CVD events
All RCTs Modified fat Reduced fat Reduced & modified fat All RCTs Modified fat Reduced fat Reduced & modified fat
0.94 [0.85, 1.04] 0.92 [0.73, 1.15] 0.96 [0.82, 1.13] 0.98 [0.76, 1.27] 0.86 [0.77, 0.96] 0.82 [0.66, 1.02] 0.97 [0.87, 1.08] 0.77 [0.57, 1.03]
No sig difference No sig difference No sig difference No sig difference Sig difference No sig difference No sig difference No sig difference
Chowdhury (2014). Prospective cohort studies & RCTs. 32 studies. 530,525 people
Coronary disease (All top vs. bottom third)
Sat fat Monounsaturated fat Polyunsaturated fat Trans fat
1.02 [0.97, 1.07] 0.99 [0.89, 1.09] 0.93 [0.84, 1.02] 1.16 [1.06, 1.27]
No sig difference No sig difference No sig difference Sig difference
29 Ref 275
Other reviews of the evidence 7 Systematic Reviews & Meta-Analyses (2/4)
© Dr. Zoë Harcombe, Ph.D. www.zoeharcombe.com

Measure Fat Risk Ratio Conclusion
Schwingshackl & Hoffman (2014). RCTs. 12 studies. 7,150 people
All cause mortality CVD mortality CVD events MIs All cause mortality CVD mortality CVD events MIs
Modified fat intake Modified fat intake Modified fat intake Modified fat intake Reduced fat intake Reduced fat intake Reduced fat intake Reduced fat intake
0.92 [0.68, 1.25] 0.96 [0.65, 1.42] 0.85 [0.63, 1.15] 0.76 [0.54, 1.09] 0.79 [0.42, 1.48] 0.93 [0.66, 1.31] 0.93 [0.65, 1.34] 1.18 [0.88, 1.59]
No sig difference No sig difference No sig difference No sig difference No sig difference No sig difference No sig difference No sig difference
Harcombe (2015). RCTs to 1977/1983. 6 studies. 2,467 people
All cause mortality CHD mortality
Reduced or modified fat Reduced or modified fat
0.98 [0.87, 1.10] 0.95 [0.78, 1.15]
No sig difference No sig difference
30 Ref 275
Other reviews of the evidence 7 Systematic Reviews & Meta-Analyses (3/4)
© Dr. Zoë Harcombe, Ph.D. www.zoeharcombe.com

Measure Fat Risk Ratio Conclusion
Hooper (2015). RCTs. 12 studies. 55,858 people
Total mortality CVD mortality CVD events MIs Non-fatal MIs Stroke CHD mortality CHD events
Reduced saturated fat Reduced saturated fat Reduced saturated fat Reduced saturated fat Reduced saturated fat Reduced saturated fat Reduced saturated fat Reduced saturated fat
0.97 [0.90, 1.05] 0.95 [0.80, 1.12] 0.83 [0.72, 0.96] 0.90 [0.80, 1.01] 0.95 [0.80, 1.13] 1.00 [0.89, 1.12] 0.98 [0.84, 1.15] 0.87 [0.74, 1.03]
No sig difference No sig difference Sig difference No sig difference No sig difference No sig difference No sig difference No sig difference
RESULTS 35 out of 39 No sig difference. 4 out of 39...
Mozaffarian Hooper (2011) Chowdhury Hooper (2015)
Replacing SFA with PUFA All RCTs Trans fats Reduced SFA
CHD events CVD events Coronary disease CVD events
UR/ZH (Ref 43) Next page Agree Next page
31 Ref 275
Other reviews of the evidence 7 Systematic Reviews & Meta-Analyses (4/4)
© Dr. Zoë Harcombe, Ph.D. www.zoeharcombe.com
• Same finding, repeated: “The findings are suggestive of a small but potentially important reduction in cardiovascular risk on modification of dietary fat, but not reduction of total fat, in longer trials.” (2011)
• “The findings of this updated review are suggestive of a small but potentially important reduction in cardiovascular risk on reduction of saturated fat intake. Replacing the energy from saturated fat with polyunsaturated fat appears to be a useful strategy, and replacement with carbohydrate appears less useful, but effects of replacement with monounsaturated fat were unclear due to inclusion of only one small trial.” (2015)
32 Refs 40, 41
Other reviews of the evidence Hooper (2011 & 2015)
© Dr. Zoë Harcombe, Ph.D. www.zoeharcombe.com
• 2011: 11/12 non significant results.
• 2015: 7/8 non significant results.
• Nothing sig. for all-cause mortality; Or CVD mortality; Or CHD mortality; Or MIs; Or non-fatal MIs; Or stroke; Or CHD events.
• 11 studies in 2015 PUFA conclusion: only 1 reported SFA reduction & PUFA replacement (Dayton).
• Why different to other reviews? Only study to include 4 studies (n=646) not about CVD/CHD: Diabetes/Houtsmuller; Hypercholesterolemia/Moy (*); Skin cancer/ Black (*); Glucose Intolerance/Ley(*). (*) Unpublished data used.
• Dr Trudi Deakin - Sensitivity test (with only the RCTs that had reduced SFA) failed statistical significance.
• Not one study of healthy people of both genders included in either significant result: Results not generalisable.
33 Refs 29, 39, 40, 41, 240-242
Other reviews of the evidence Hooper (2011 & 2015)
© Dr. Zoë Harcombe, Ph.D. www.zoeharcombe.com

Conclusion
http://www.zoeharcombe.com/phd-thesis/references/ 34
Complete review of the evidence
Paper RCTs Then RCTs Now Epid. Then Epid. Now
Type SR & MA SR & MA SR SR & MA
Focus Dietary fat, Serum cholesterol, Mortality (CHD & all-cause)
Dietary fat (total & SFA), Serum cholesterol, Mortality (CHD)
# of studies 6 (5S/1C) 10 (7S/1P/2C) 6 (5P/1C) 7 (1S/6P)
Tested DFGs 0 0 0 0
Participants 2,467 M 62,421 (86%W) 31,445 M 89,801 (94%M)
Key findings? No sig diff in all-cause mortality No sig diff in CHD mortality
0/6 assoc total fat (TFA)
1/6 assoc SFA
No sig diff in CHD mortality & TFA or SFA
Results Generalisable?
No No No No
S/P/C = Secondary/Primary/Combined

• “There will undoubtedly be many people who will say we have not proven our point.“ (Hegsted)
• “Lack of consensus among nutritional scientists and other health professionals.” (Senators Percy, Schweiker, Zorinsky)
• “Some witnesses have claimed that physical harm could result from the dietary modifications recommended in this report.“
• “...the select committee finds that no physical or mental harm could result from the dietary guidelines recommended for the general public...”
35 Refs 15, 243
Conclusion The consequences
© Dr. Zoë Harcombe, Ph.D. www.zoeharcombe.com

Conclusion Obesity (UK)
Ref 246
Women
Men
25.8%
22.6%
36
1.8% 2.7%
% obese
© Dr. Zoë Harcombe, Ph.D. www.zoeharcombe.com

Conclusion Obesity (US)
Ref 245 37
© Dr. Zoë Harcombe, Ph.D. www.zoeharcombe.com

The end! Thank you for listening
Breckenridge
February 2017
Dr. Zoë Harcombe, Ph.D