short title profile of australian antidepressant users · short title: profile of australian...
TRANSCRIPT

1
Characteristics of antidepressant medication users in a cohort of mid-age and older
Australians
Short title: Profile of Australian antidepressant users
Paige E,1
Korda RJ,1
Kemp A,2 Rodgers B,
3 Banks E.
1,4
1. National Centre for Epidemiology and Population Health, The Australian National
University, Canberra, ACT, Australia
2. School of Population Health, The University of Western Australia, Crawley, WA,
Australia
3. Australian Demographic & Social Research Institute, The Australian National University,
Canberra, ACT, Australia
4. The Sax Institute, Sydney, Australia
Key words
Antidepressant medication, cohort studies, population studies
2
ABSTRACT
Objectives: To investigate antidepressant use, including the class of antidepressant, in mid-
age and older Australians according to sociodemographic, lifestyle and physical and mental
health-related factors.
Methods: Baseline questionnaire data on 111,705 concession-card holders aged ≥45 years
from the 45 and Up Study—a population-based cohort study from New South Wales,
Australia—were linked to administrative pharmaceutical data. Current- and any-
antidepressant users were those dispensed medications with Anatomical Therapeutic
Chemical classification codes beginning N06A, within ≤6 months and ≤19 months before
baseline, respectively; non-users had no antidepressants dispensed ≤19 months before
baseline. Multinomial logistic regression was used to calculate adjusted relative risk ratios
(aRRRs) for predominantly self-reported factors in relation to antidepressant use.
Results: Nineteen percent of the study population (15% of males and 23% of females) were
dispensed at least one antidepressant during the study period. Forty percent of participants
used selective-serotonin reuptake inhibitors (SSRIs) only and 32% used tricyclic
antidepressants (TCAs) only. Current antidepressant use was markedly higher in those
reporting: severe versus no physical impairment (aRRR 3.86(95%CI 3.67-4.06)); fair/poor
versus excellent/very good self-rated health (4.04(3.83-4.25)); high/very high versus low
psychological distress (7.22(6.81-7.66)); ever- versus never-diagnosis of depression by a
doctor (18.85(17.95-19.79)); low dose antipsychotic use versus no antipsychotic use
(12.26(9.85-15.27)); and dispensing of ≥10 versus <5 other medications (5.97(5.62-6.34)).
Sociodemographic and lifestyle factors were also associated with use, although to a lesser
extent. Females, older people, those with lower education and those with poorer health were
more likely to be current antidepressant users than non-users and were also more likely to use
TCAs-only versus SSRIs-only.

3
Conclusions: Use of antidepressants is substantially higher in those with physical ill-health
and in those reporting a range of adverse mental health measures. In addition,
sociodemographic factors, including sex, age and education were also associated with
antidepressant use and the class of antidepressant used.

4
INTRODUCTION
Antidepressant medications are among the most highly prescribed medications in Australia
and use has been increasing over time. In 2011, 89 defined daily doses (DDD) (WHO
Collaborating Centre for Drug Statistics Methodology, 2012) of antidepressants were
dispensed per 1,000 people per day (1000/day) in Australia, up from approximately 45
DDD/1000/day in 2000 (Organisation for Economic Co-operation and Development, 2013).
Compared to other OECD countries, Australia had the second highest use of antidepressants
in 2011, behind Iceland (Organisation for Economic Co-operation and Development, 2013).
Evidence regarding the patterns of use of antidepressants in Australia, and the characteristics
of users, is limited. Such evidence is important for informing a range of areas, including the
quality use of medications, the cost implications of use and in understanding the likely impact
of use on population health.
International studies have shown that health-related factors such as depressive symptoms,
physical functioning impairment and number of medications used are strongly related to
antidepressant use (Karkare et al., 2011; Blazer et al., 2005; Ganguli et al., 1997; Grunebaum
et al., 2008; Pfeiffer et al., 2011). Social determinants—including age, sex, socioeconomic
status, ethnicity and region of residence—that may predispose people to use antidepressants
or affect a person’s ability to access them (Andersen and Newman, 2005), have also been
linked to antidepressant use (Brown et al., 1995; Ganguli et al., 1997; Grunebaum et al.,
2008; Pfeiffer et al., 2011). Differences in health care systems between countries mean the
profile of antidepressant users, particularly in relation to socioeconomic factors, is likely to
differ across populations. Most studies to date have used data from United States (US)
populations and, given the differences between the Australian and US health care systems
(Schoen et al., 2004), it is important examine this issue using Australian data. To date, few
5
Australian studies have been undertaken that examine individual-level factors associated with
antidepressant use in non-institutional populations (Goldney et al., 2007; Page et al., 2009;
Zhang et al., 2010) and most have been limited to using aggregated data. Further, we are not
aware of any previous studies, Australian or international, that have examined whether health
indicators and behaviours such as body mass index, physical activity, alcohol consumption
and cigarette smoking, are associated with antidepressant medication use.
There is limited evidence suggesting that the characteristics of people using antidepressants
may also vary by antidepressant class. A US study published in 1998 reported that men, those
of African-American race and older people were more likely to use tricyclic antidepressants
(TCA) than newer generation selective serotonin reuptake inhibitors (SSRI) (Sclar et al.,
1998). However, little is known about what other factors may be associated with the class of
antidepressant used or whether sociodemographic variations occur in Australia.
This study contributes to existing knowledge by linking detailed survey data to recorded
dispensings of medication use to investigate the relative distributions of antidepressant use in
mid-age and older Australians according to sociodemographic, lifestyle and physical and
mental health-related factors. Secondarily, it examines whether the factors associated with
antidepressant use vary according to the class of antidepressant used.
6
METHODS
Data sources and study population
We undertook analyses using data from the 45 and Up Study baseline questionnaire linked to
dispensing information from Pharmaceutical Benefits Scheme (PBS) records.
The 45 and Up Study is an Australian cohort involving 267,153 men and women aged 45
years or over from New South Wales (NSW), Australia. Participants in the Study were
randomly sampled from the database of Medicare Australia, which provides virtually
complete coverage of the general population. Approximately 10% of the NSW population
aged 45 years or older was included. Participants joined the Study by completing a baseline
questionnaire—distributed from January 2006 to December 2008—and giving signed consent
for follow-up and linkage of their information to a range of health databases including the
PBS database. The Study is described in detail elsewhere (Banks et al., 2008) and
questionnaires can be viewed at http://www.45andup.org.au.
The PBS is an administrative dataset containing information about dispensed prescription
medications. The PBS allows Australian residents access to a large range of medications at
subsidised costs (Department of Health and Ageing, 2013). People contribute a co-payment
toward the cost of their medication and the remaining cost is covered under the PBS. Aged
pensioners and other social security recipients pay a ‘concessional’ co-payment (this ranged
over the study period from AU$3.80 in 2004 to AU$5.30 in 2009), which is lower than the
‘general’ population co-payment (AU$23.70 in 2004, AU$32.90 in 2009). The PBS dataset
did not capture below co-payment dispensings to general beneficiaries before 2012 and thus
this study was restricted to 45 and Up Study participants who were concessional beneficiaries
(those with at least one concessional and no non-concessional claim) during the study period.

7
Selection of PBS records and participants for inclusion in this study
PBS records from 2004-2011 were available for 45 and Up study participants. The study
period was defined for each participant as the 19 months before completion of the baseline
questionnaire. Participants who self-reported holding a Department of Veterans' Affairs card
were excluded, as these people have access to a broader range of subsided medications under
a separate Government program.
The Sax Institute linked the baseline 45 and Up questionnaire data and the PBS data. The
PBS data were supplied by the Department of Human Services.
Measurements
Outcomes
Dispensing of antidepressant medications were identified from the PBS dataset as those with
Anatomical Therapeutic Chemical (ATC) classification codes beginning with N06A (World
Health Organization Collaborating Centre for Drug Statistics Methodology, 2013).
Consecutive dispensings were defined as at least two dispensings, where the time between the
dispensings was less than or equal to the maximum standard supply period (based on the pack
size, e.g. if pack size is 30 tablets, the maximum standard supply period is 30 days) plus a
refill period of eight days.
Participants were classified according to whether or not they had received any dispensing for
an antidepressant during the study period. Study participants who received a dispensing of an
antidepressant were further categorised as: current users; past-only users; and non-persistent
users. As PBS data only provide information about dispensing, not actual use of the

8
medications, we defined current and past-only users as those with two or more consecutive
dispensings of an antidepressant (Eaddy et al., 2005; Andrade et al., 2006). Current users
were defined as those who had at least two consecutive dispensings of an antidepressant
medication within the six month period before completion of the baseline questionnaire
(regardless of past use). Past-only users were defined as participants who had at least two
consecutive dispensings of any antidepressant medication within the 19-month study period
but no consecutive dispensings of two or more antidepressant medications within the six
months before completion of the baseline questionnaire. Non-persistent users were defined
as participants who had at least one dispensing or one or more non-consecutive dispensings
of any antidepressant within the study period. Non-users were defined as those who were not
dispensed any antidepressant medication within the study period.
Current antidepressant users were further classified by the class of antidepressant dispensed
during the study period including: selective-serotonin reuptake inhibitor (SSRI)-only use
(ATC codes N06AB02-N06AB10); tricyclic antidepressant (TCA)-only use (ATC codes
N06AA01 - N06AA23); other antidepressant use(single type) (including monoamine oxidase
inhibitors (MAOI) and serotonin-noradrenaline reuptake inhibitors (SNRI)) (ATC codes
N06AF01- N06AF06, N06AG02- N06AG03 and N06AX01- N06AX26); and combination
use (more than one antidepressant class dispensed).
Exposures
Consistent with the Anderson-Newman model of healthcare utilisation (Andersen and
Newman, 1973), a number of pre-disposing, enabling and need-related factors were examined
as exposures. All exposures—except for region of residence, dispensing of antipsychotics and
number of medications dispensed—were derived from self-reported baseline questionnaire

9
responses. Region of residence was derived from the postcode obtained from Medicare data,
and dispensing of antipsychotics and number of medications dispensed were derived from
PBS data.
Pre-disposing factors were considered to be those that influence a person’s likelihood of
using health care and medications (Andersen and Newman, 2005). These included: age; sex;
marital status (categorised as married/de-facto or not married/de-facto); country of birth
(categorised as Australia/New Zealand, Europe/North America or other); education (based on
highest completed qualification and categorised as no school certificate, school certificate,
apprenticeship/trade/certificate/diploma or university degree or higher); body mass index
(BMI) (calculated as self-report weight in kilograms divided by height in metres squared and
categorised as underweight (15-<18.5kg/m2); normal weight (18.5-<25kg/m
2); overweight
(25-<30kg/m2); and obese (30-50kg/m
2)); physical activity tertile (based on the weighted
number of reported weekly sessions of walking, moderate activity and vigorous activity
(Australian Institute of Health and Welfare, 2003) and categorised as low, medium or high);
smoking status (never, past, current); and alcohol consumption (drinks per week categorised
as none, light (1-10 drinks for men and 1-5 drinks for women), moderate (11-35 drinks for
men and 6-20 drinks for women) and heavy (>35 drinks for men and >20 drinks for women)
(Power et al., 1998)).
Enabling factors are those that allow an individual to access health care and medications if
they need or choose to (Andersen and Newman, 2005) and these included: pre-tax household
income (categorised as <$20,000, $20,000-$39,999, $40,000-$69,999 or ≥$70,000 AUD);
private health insurance (yes/no); and region of residence (based on the
Accessibility/Remoteness Index of Australia Plus (Australian Institute of Health and Welfare,

10
2004) score associated with the postcode of residence and categorised as major cities, inner
regional or more remote).
Need-related factors included general indicators for health as well as factors measuring
depression and other mental illness – these are factors that result in a person needing (or
perceiving the need) to access health care and medications (Andersen and Newman, 2005).
General indicators for health included: physical impairment (derived from the Medical
Outcomes Score-Physical Functioning (MOS-PF), which is equivalent to items from the
physical functioning scale of the SF-36 health survey (Stewart and Ware, 1992) and
categorised as none/minor (score of 100-75), moderate (50-74), or severe (<50)); self-rated
health (categorised as excellent/very good, good or fair/poor); and number of other
medications dispensed (based on total number of unique medications other than
antidepressants dispensed during the study period, categorised as <5, 5-9, or ≥10). Proxy
measures of depression and mental illness included: psychological distress (based on
responses to the Kessler 10 scale (Kessler et al., 2002) and categorised as low (score of <16),
moderate (16-<22), or high/very high (≥22)); ever doctor-diagnosed depression (yes/no); and
current treatment for depression or anxiety (yes/no). The questions asked in the Study
questionnaire have changed over time and up until a certain time the question about whether
participants had ever been diagnosed with depression by a doctor was not included in the
questionnaire; thus responses for this variable were missing for approximately 14% of
participants. Antipsychotics are prescribed for managing psychosis which can occur in a
number of different mental illnesses, most commonly in schizophrenia and bipolar disorder
(Maher and Theodore, 2012), but also major depression (Papakostas et al., 2007). As such,
we included antipsychotic use as a need-related exposure in this study. Antipsychotic use was
ascertained by any dispensing of an item with ATC code beginning with N05A during the

11
study period and was categorised as low, medium, high and combination doses based on the
drug strength dispensed.
Statistical methods
The proportion of participants, by sex and age, dispensed at least one antidepressant during
the study period was calculated. The proportion of participants in each antidepressant user
category was then calculated in relation to the exposures, and differences between groups
were compared using chi squared tests. We then used multinomial logistic regression to
model the relationships between the exposure variables and antidepressant use.
Separate multinomial logistic regression models were used to: i) estimate the strength of the
relationship between each exposure and antidepressant user categories (reference: non-users);
and ii) estimate the strength of the relationship between each exposure and the class of
antidepressant used for current antidepressant users only (reference: SSRI-only use). All
models were adjusted for the non-modifiable factors: sex, age and country of birth.
The primary focus of this study was to compare current users to non-users. While we also
examined factors associated with past-only and non-persistent users, the results for these are
given in a supplementary table, and the results and discussion of this paper focus on current
users.
The strength of association estimates generated from the multinomial logistic regressions are
reported as relative risk ratios (RRR), which express the relative risk of having the outcome
compared to not having the outcome in relation to different levels of the exposure variables
(StataCorp, 2011). For example, a RRR of 1.5 for females currently using antidepressants can

12
be interpreted as: for females compared to males, the relative risk of being a current
antidepressant user compared to a non-user is 1.5. In all analyses, 95% confidence intervals
were generated. All analyses were performed using Stata version 12.0 and were undertaken
using the Secure Unified Research Environment (Sax Institute, 2014). Ethics approval for this
project was obtained from the NSW Population and Health Services Research Ethics
Committee and the Australian National University Human Research Ethics Committee.

13
RESULTS
After excluding participants with no concessional-only PBS records during the study period
(n=152,555) and those with a Departments of Veterans' Affairs card (n=5), a total of 111,705
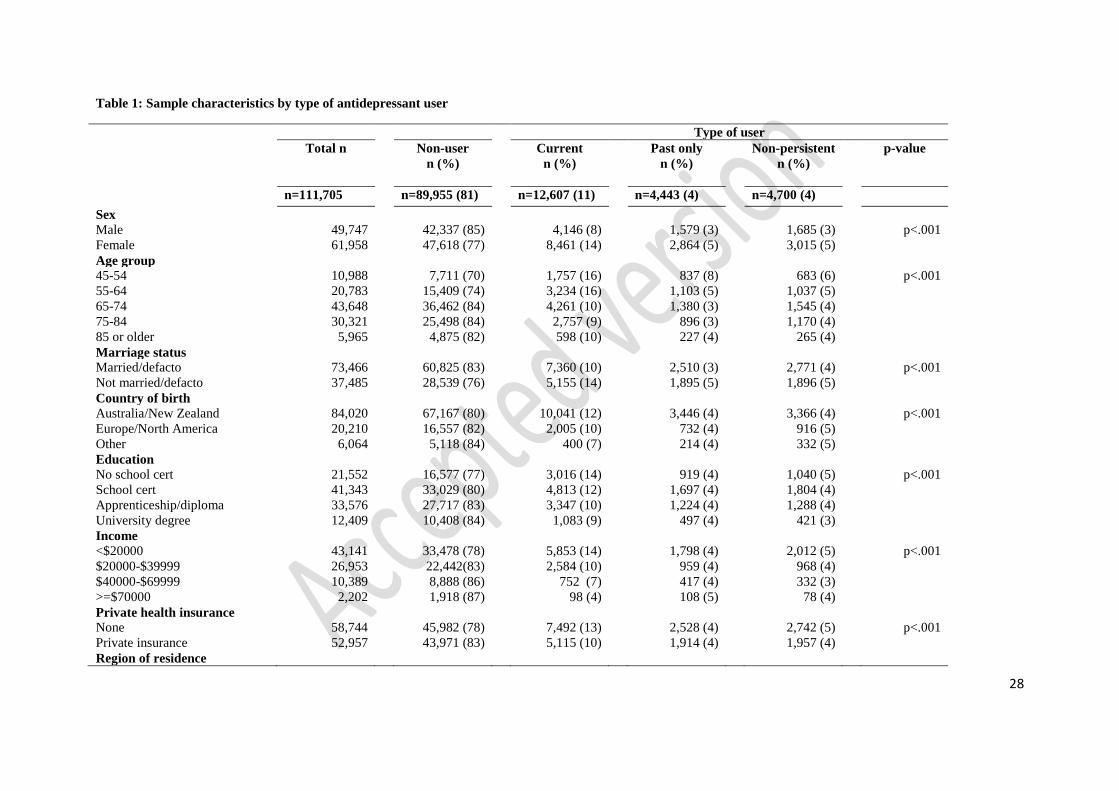
participants remained in the study. Summary characteristics of the study population by
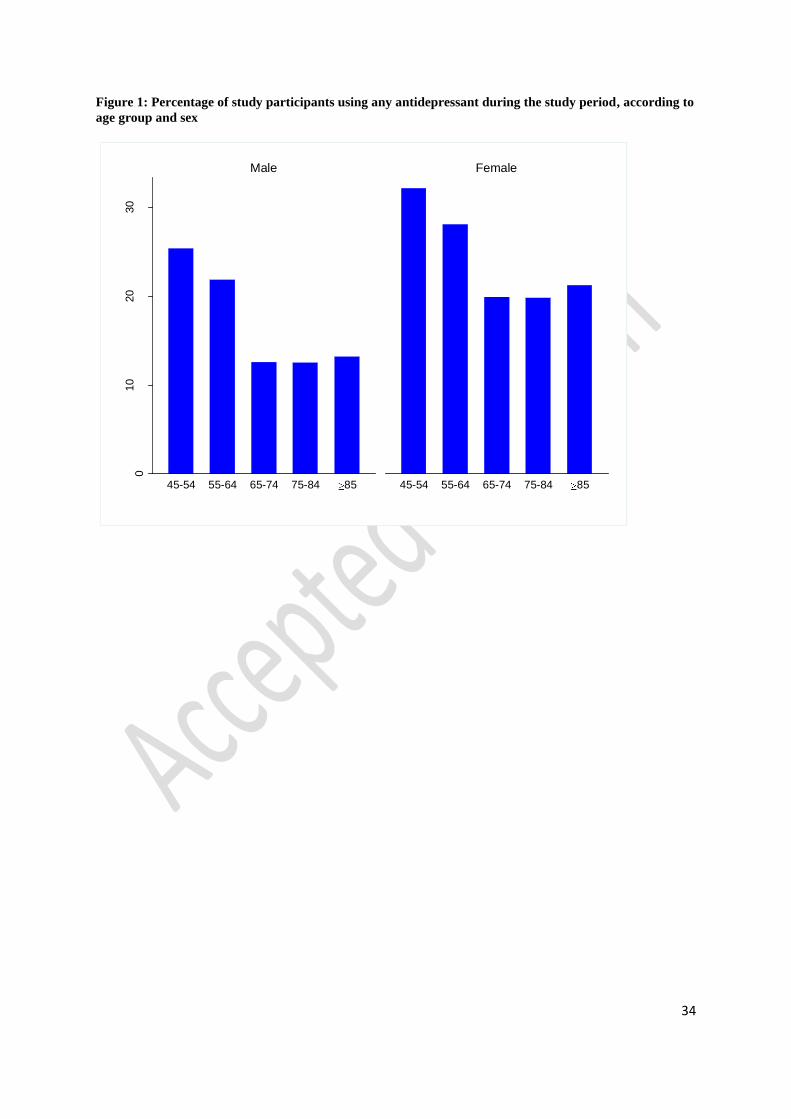
antidepressant user category are presented in Table 1 and Figure 1. Nineteen percent (21,750)
of the participants had been dispensed at least one antidepressant medication (total
dispensings=260,134) during the study period. Approximately 15% of males and 23% of
females were dispensed an antidepressant with the proportion of users decreasing with age
from 30% in those aged 45-54 years to 18% in those aged 85 years or older. The pattern of
antidepressant use by age was similar for both men and women (Figure 1). The proportion of
people using antidepressants decreased with increasing level of education, income and self-
rated health, and increased with increasing level of physical functioning impairment,
psychological distress and the number of other medications dispensed during the study period
(Table 1).
Of the participants who reported at baseline that they were currently being treated for
depression or anxiety, 58% were current antidepressant users, as were 6% of people who
reported not being currently treated for depression or anxiety. Conversely, of those who were
current antidepressant users, 53% reported that they were being currently treated for
depression or anxiety, while 47% of current users reported not being currently treated for
depression or anxiety.
Of those dispensed any antidepressant during the study period, 40% were dispensed an SSRI
only, 32% were dispensed a TCA only, and 17% used another type of antidepressant
(including MAOI and SNRIs). The remaining 11% were dispensed more than one class of

14
antidepressant (combination use) (Table 2). The proportion of people using the different
antidepressant classes was similar across current, past-only and non-persistent users, except
that the proportion of people dispensed a TCA was higher for non-persistent users than
current and past-only users.
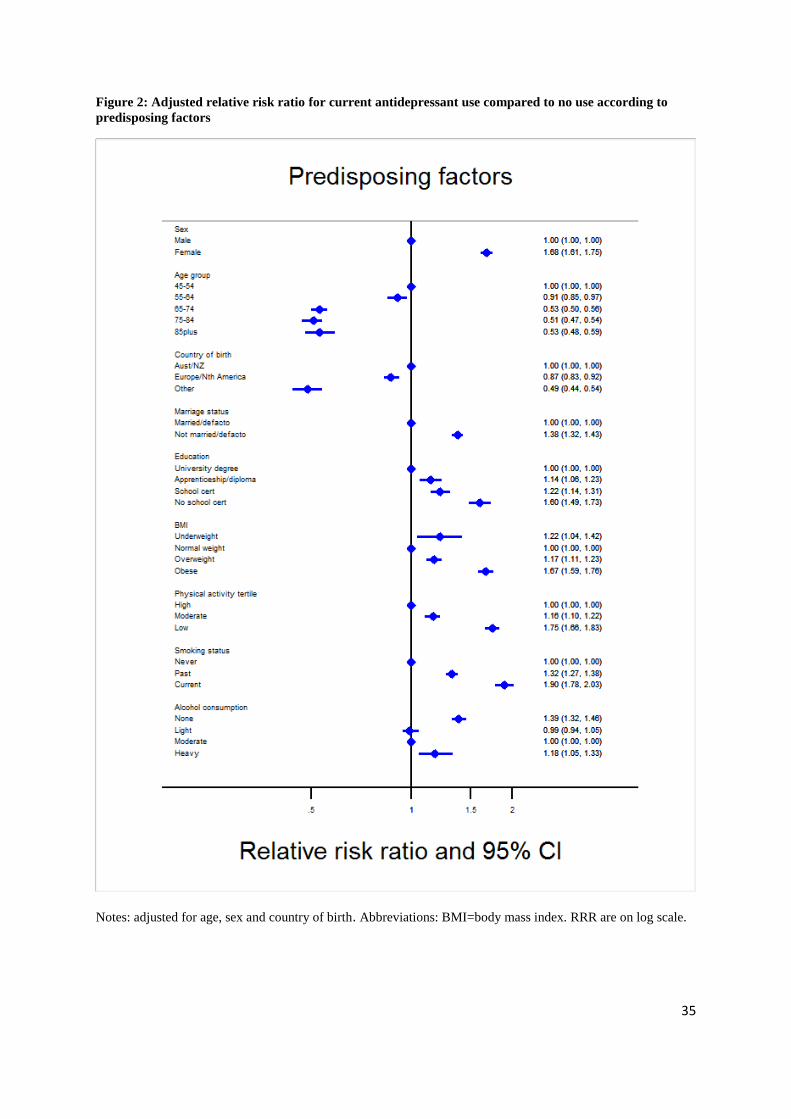
Predisposing factors related to current antidepressant use
After adjusting for sex, age and country of birth, all predisposing factors were statistically
associated with current antidepressant use (Figure 2 and Supplementary Table 1). Females,
younger participants (45-54 years), those born in Australia or New Zealand, those not in a
married or de-facto relationship and those with lower levels of education were more likely to
use antidepressants than their counterparts. Those who were underweight, overweight or
obese were more likely to use antidepressants than those with a normal BMI. People who
were less physically active (compared to those in the highest physical activity tertile) and
those who were past or current smokers (compared to never smokers) were also more likely
to use antidepressants. Compared to those consuming a moderate amount of alcohol, those
who did not drink alcohol and heavy drinkers were more likely to be current antidepressant
users.
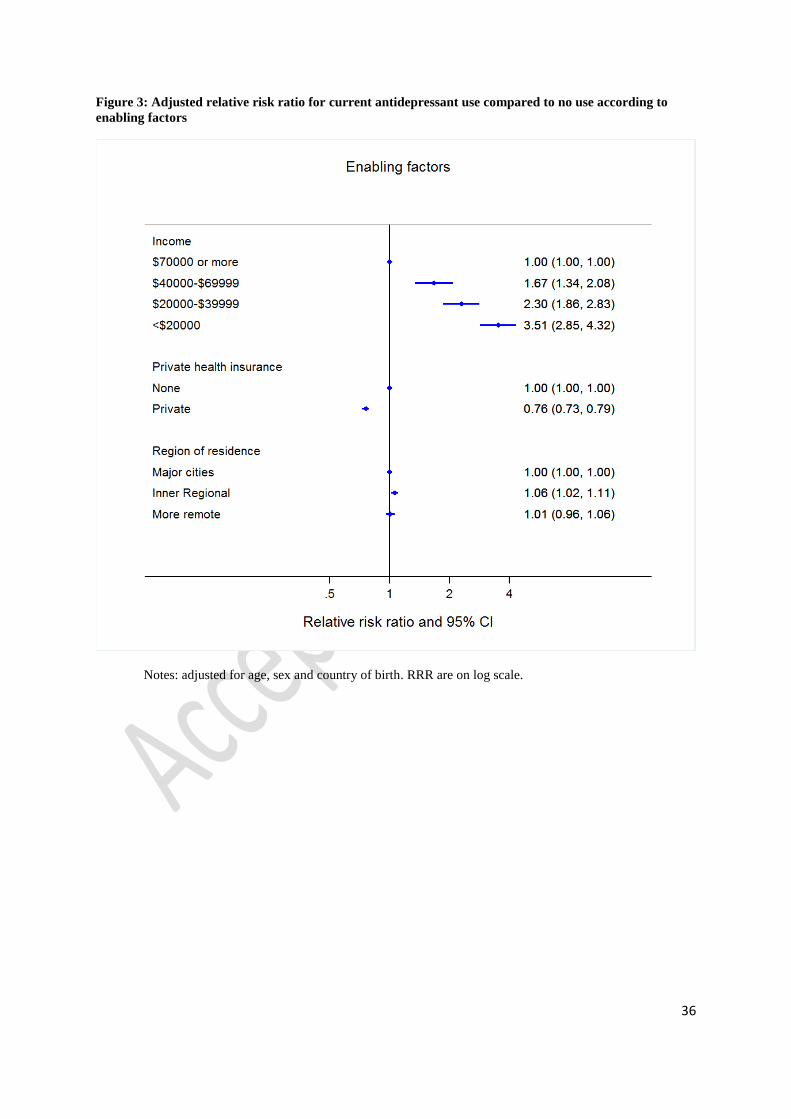
Enabling factors related to current antidepressant use
Of the enabling factors, income and private health insurance were associated with current
antidepressant use, after adjusting for sex, age and country of birth (Figure 3). Compared to
people with an annual household income of $70,000 or more, those with a lower income were
more likely to be current antidepressant users [RRR ranging from 1.67 (95% CI:1.34-2.08)
for those with an income of $40,000-$69,999 to 3.51 (2.85-4.32) for those with an income of
15
<$20,000]. People with private health insurance, compared to no private health insurance,
were less likely to be current antidepressant users [RRR=0.76 (0.73-0.79)].
Need-related factors related to current antidepressant use
All need-related factors were strongly associated with current antidepressant use, after
adjustment for sex, age and country of birth (Figure 4). People with physical impairment
(compared to no/minor impairment), more dispensed medications (compared to <5) and
poorer self-rated health (compared to excellent/very good health) were more likely to be
current antidepressant users. Factors measuring mental health showed the strongest statistical
association with current antidepressant use. Compared to people with low psychological
distress, those with moderate and high/very high psychological distress were 3.16 (3.00-3.34)
and 7.22 (6.81-7.66) times as likely to be current antidepressant users than non-users, while
those who reported ever being diagnosed with depression by a doctor were 18.85 (17.95-
19.79) times as likely to be a current antidepressant users than non-users, compared to those
who hadn’t been diagnosed with depression by a doctor. Similarly, those dispensed any
antipsychotic during the study period (not necessarily at the same time as antidepressant
dispensings) were more likely to be current antidepressant users than those not dispensed any
antipsychotics [RRR ranging from 6.05 (4.50-8.13) for those using high dose antipsychotics
to 12.26 (9.85-15.27) for those using low dose antipsychotics].
After adjustment for sex, age and country of birth, the exposures associated with past-only
use and non-persistent use were the same as those associated with current antidepressant use
(Supplementary table 1).
Factors associated with use of different antidepressant classes
16
Table 3 shows the association between different factors and classes of antidepressant
dispensed, among people who were current antidepressant users. Of the predisposing
factors—after adjustment for sex, age and country of birth—females, older people (compared
to those aged 45-54 years) and those with a lower education (compared to a university degree
or above) were statistically more likely to use a TCA-only than a SSRI-only. Additionally,
compared to using a SSRI-only, people born in a country other than Australia or New
Zealand, those not married or in a de-facto relationship and those with a lower education
(compared to a university degree or above) were more likely to use a combination of
antidepressant classes, while older people (compared to those aged 45-54 years) were less
likely to be use a combination of antidepressant classes.
Of the need-related factors, those with poorer health (good or fair/poor self-rated health; ≥5
medications dispensed; and moderate or severe physical impairment) were generally
statistically more likely to use a TCA-only, other type of antidepressant (single type) or a
combination of antidepressant classes compared to using a SSRI-only. In contrast, people
with poor mental health (moderate or high/very high psychological distress; having ever been
diagnosed with depression by a doctor; and antipsychotic use) were less likely to use a TCA-
only compared to a SSRI-only (although this was not statistically significant for use of
antipsychotics), but were also more likely to use a other type of antidepressant (single type)
or a combination of antidepressant classes compared to a SSRI-only.

17
DISCUSSION
Principal findings
Factors related to an individuals’ general physical and mental well-being, i.e. need-related
health factors and, to a lesser degree, some predisposing and enabling factors, are associated
with current antidepressant use in our sample of Australian adults. Our findings show that
people with poorer physical and mental health (as indicated by moderate-severe physical
impairment; fair-poor self-rated health; moderate-very high psychological distress; ever
diagnosis of depression by a doctor; antipsychotic use; and polypharmacy) were most likely
to be current antidepressant users, as were females, younger people, those born in
Australia/New Zealand, those with low levels of physical activity and those with a lower
income. Sex, age, education and physical and mental health factors were also associated with
the use different classes of antidepressants (TCA-only, single types of other antidepressants
only, or a combination of antidepressants) compared to use of the more common SSRI-only.
Results of the study in relation to other studies
Our results are consistent with those of previous international and Australian studies which
have shown that being female and having poorer physical and mental health is strongly
associated with antidepressant use (Blazer et al., 2005; Ganguli et al., 1997; Grunebaum et
al., 2008; Harris et al., 2011; Karkare et al., 2011; Pfeiffer et al., 2011; Zhang et al., 2010;
Brown et al., 1995). Specifically, these studies have provided evidence that those with: poor
self-rated health, more doctor visits; polypharmacy; high psychological distress; depressive
or anxiety symptoms; cognitive impairment; physical functioning impairment; and one or
more chronic conditions, are more likely to use antidepressants than their counterparts. Our
studies confirm these findings, and further add to the literature by showing antipsychotic
use—which is prescribed for managing psychosis and may be prescribed for those with

18
diagnosed depression—and other health-related indicators and behaviours, including BMI,
physical activity, smoking status and alcohol consumption are also associated with current
use of antidepressants.
In contrast to other studies, while we found that people with lower levels of education and
lower income were more likely to be antidepressant users, previous studies have shown the
opposite or no association between these two factors and antidepressant use. A large study
conducted in Finland (n=65,405) found that, in men, those with a primary or secondary
education compared to a tertiary education were statistically less likely to use antidepressants,
while no statistical association was seen for women (Kivimaki et al., 2007). Other studies
(from the US) reported no statistical association between education and antidepressant use
(Blazer et al., 2000; Grunebaum et al., 2008). Similarly, most previous studies that have
investigated the association between income and antidepressant association have found no
significant relationship (Blazer et al., 2000; Grunebaum et al., 2008; Soudry et al., 2008),
with the results of another study suggesting that people with higher levels of income were
more likely to use antidepressants (Brown et al., 1995). A possible reason for discrepancy
between our results and those from other countries is that, because the concessional PBS
benefits are available to low-income earners, access to medications in this subset of the
Australian population may not be as tied to the ability to pay as in other countries. Instead,
the association between higher antidepressant use and lower income observed in our study
may reflect the increased burden of mental illness within this group of people. This is
supported by a previous study using data from the 45 and Up Study, which showed an
association between low income and low education and increased odds of high psychological
distress (Banks et al., 2010). Furthermore, the observed association between low income and
increased likelihood of antidepressant use in our study may reflect the lower cost of

19
antidepressants and their widespread availability compared to psychotherapy. Indeed, we
found that over half (58%) the people who reported at baseline that they were currently being
treated for depression or anxiety were current antidepressant users. This suggests the other
42% of people may be accessing another form of treatment, such as psychotherapy.
With regard to the relationship between individual-level factors and the type of antidepressant
class used, we found that women and older people were more likely than men and younger
people to use a TCA-only compared to a SSRI-only. This is in contrast to the findings of a
US study which showed that men rather than women were more likely to use a TCA than a
SSRI, although they did similarly find that older people were more likely to use a TCA than
an SSRI (Sclar et al., 1998). It is not clear why our study results were different to the US
study in terms of the relationship between sex and antidepressant class, however, the US
study used data from 1990-1994 so differences in time and setting may reflect a difference in
patterns of prescribing. A further possible explanation is that SSRIs and TCAs may be
prescribed for different indications, so the differences between the studies may reflect
differences in the prevalence of conditions being prescribed for. For example, a previous
Australian study found that SSRIs were used only for mental illness while TCAs were used
for physical conditions (pain, migraine and urinary incontinence) as well as mental illness
(Zhang et al., 2010). It is also possible that TCAs are prescribed secondarily to people who
did not respond to SSRIs, so the results may reflect a difference in the proportion of people
with more severe depression.
Our finding that not all antidepressant users report being currently treated for depression or
anxiety supports the findings from a previous Australian study (Hollingworth et al., 2010).
This study used Australian data from the 2007 National Survey of Mental Health and
20
Wellbeing and PBS data (2002-07), finding that the prevalence of self-reported affective and
anxiety disorders (including depression) were highest in those aged less than 50 years while
antidepressant use was highest in those aged 90 to 94 years old (Hollingworth et al., 2010).
Although these findings could be explained by inaccurate self-reporting of mental illness, a
further Australian study of men and women living in the community or in residential care
examined the reasons for antidepressant use, finding that 70% of use was for psychological
reasons and 10% were reported for physical reasons (Zhang et al., 2010). While we were
unable to explore the reasons for antidepressant use explicitly using our data, taken together,
these results suggest that some people may be using antidepressants for both mental and
physical health reasons. However, our finding may have been due to the six month “window”
that we considered current use, such that individuals may not have been taking the
medication at the time of completing the questionnaire. It may also indicate that a proportion
of people who are using antidepressants may not consider themselves to have a diagnosis of
depression for some other reason.
Strengths and weakness of this study
The main strengths of this study are its: large sample size; population-based nature; linkage
of detailed questionnaire data to detailed independent administrative information on
medication dispensing; and information on a variety of diverse exposures. There are three
main limitations of this study. First, information on most exposures (with the exception of
region of residence, use of antipsychotics and number of medications dispensed) was self-
reported. While this is likely to be accurate for many exposures such as age, sex, education
and country of birth, other factors such as weight, height, physical activity and alcohol
consumption may be less accurately reported. However, this potential bias is likely to be non-
differential as the accuracy of the self-report is unlikely to vary by whether or not a person
21
was using an antidepressant; this would likely bias the results towards the null (no effect).
Second, the PBS data do not provide information on actual use (only individual dispensings
of medication). To deal with this we defined the main outcome of current antidepressant use
as those with two or more consecutive dispensings rather than any dispensing of an
antidepressant. Third, this study was restricted to only those within the 45 and Up Study who
had concessional PBS dispensings during the study period. This sample is likely to be older,
sicker and poorer than the general population and thus is not representative of all those using
antidepressants in the Australian population. We found that 19% of our study population had
been dispensed at least one antidepressant during the 19-month study period. While not
directly comparable, this is higher than the prevalence reported in representative Australian
surveys such as the 2004-05 National Health Survey in which 5% of people reported having
used an antidepressant for mental wellbeing in the two-week period before the survey
(Australian Bureau of Statistics, 2006). While the absolute results, particularly the proportion
of antidepressant users estimated in this study, should be regarded with caution, it has been
previously shown that the relative measures of association calculated in non-representative
cohort studies can be generalized to the broader population (Mealing et al., 2010).
The aim of this study was not to examine causal exposures of antidepressant use, but to
instead examine how the distribution of antidepressant use varies by sociodemographic,
lifestyle and health characteristics. Further, the PBS data do not provide information on the
indication for which the medication is prescribed and thus, antidepressant use as described in
this study should not be used as a proxy of the prevalence of depression.
What does this study mean?
22
Our results indicate that people with poorer physical and mental health are more likely to use
antidepressants than their healthier counterparts. We also found a relationship between
sociodemographic and lifestyle factors and antidepressant use, however, the analyses were
only adjusted for sex, age and country of birth, and thus at least some of this relationship is
likely to reflect underlying differences in health. Indeed, the results observed in this study
appear to broadly reflect underlying distributions of mental illness in Australia. Results from
the 2007 National Survey of Mental Health and Wellbeing showed that more women (22%)
than men (18%) reported having a mental disorder in the 12 months before the survey and the
prevalence of mental illness decreased with age (Australian Bureau of Statistics, 2013).
Further, the prevalence of mental illness increased with decreasing labour force participation
(which is strongly related to morbidity, education and income) and was higher in current
smokers (compared to never smokers) and in those with severe disability (compared to no
disability) (Australian Bureau of Statistics, 2008). This profile of mental disorder in the
Australian population is similar to that observed for antidepressant users in this study.
Our finding that poorer physical health is associated with antidepressant use is also likely to
reflect the complex relationship between psychological distress, chronic health conditions
and disability. A previous study using data from the 45 and Up Study found that people with
limitations to physical functioning such that they needed help for daily tasks were more likely
to have high or very high levels of psychological distress compared to those who did not need
help with daily tasks (Byles et al., 2014). Further, people with chronic health conditions such
as diabetes and heart disease were also more likely to have high or very high levels of
psychological distress (Byles et al., 2014).

23
While we found an association between antidepressant use and dispensings of antipsychotics,
particularly low-dose antipsychotics, it is not possible to ascertain from the available data
why there may be higher rates of antipsychotic dispensings among those who are
antidepressant users.
Further, the patterns of use of different antidepressant classes may reflect the tolerability
profile of different antidepressants. While their efficacy is estimated to be similar, SSRIs are
considered to have a more tolerable side-effect profile than older generation TCAs
(Anderson, 2000). We found a higher proportion of TCA users were non-persistent users,
although we cannot establish whether this was due to tolerability. People with indicators of
mental illness (such as high psychological distress) were also more likely to be dispensed a
combination of antidepressants during the study period then to be using a SSRI only,
although we cannot ascertain from these data whether this was due to switching medication
classes or being concurrently prescribed more than one class. Further, it has been previously
found that the side-effect profiles of specific antidepressants are considered when a
psychiatrist prescribes an antidepressant (Zimmerman et al., 2004); thus associations between
classes of antidepressants and sociodemographic and health factors may reflect the differing
importance of particular side-effects to different groups of people.
CONCLUSIONS
In our sample of mid-age concession card holders, we found clear patterns of antidepressant
use which varied across sociodemographic, lifestyle and health-related factors. Females,
those with lower levels of income or education, and those with poorer health profiles (low
levels of physical activity, being overweight or obese, or being a current smoker or heavy
alcohol drinker) were more likely to use antidepressants than their counterparts. Our findings

24
suggest, in addition to having poorer mental health, users of antidepressant medications are
also sicker and are more likely to have impairments to physical functioning than people who
do not use antidepressants.
ACKNOWLEDGMENTS
We would like to thank Professor Scott Henderson for providing clinical advice and Dr
Timothy Dobbins for providing statistical advice. This research was completed using data
collected through the 45 and Up Study (www.saxinstitute.org.au). The 45 and Up Study is
managed by the Sax Institute in collaboration with major partner Cancer Council NSW; and
partners: the National Heart Foundation of Australia (NSW Division); NSW Ministry of
Health; beyondblue; Ageing, Disability and Home Care, Department of Family and
Community Services and the Australian Red Cross Blood Service. We thank the many
thousands of people participating in the 45 and Up Study.
FUNDING ACKNOWLEDGMENTS
Emily Banks and Bryan Rodgers are supported by the NHMRC (Fellowship No. 1042717
and 471429, respectively). This project was supported by the Study of Economic and
Environmental Factors in health project, funded by the National Health and Medical
Research Council of Australia (NHMRC) (grant reference: 402810) and NHMRC project
grant 1024450.
DECLARATION OF CONFLICTING INTERESTS
The authors declare that there is no conflict of interest.

25
REFERENCES
Andersen R and Newman JF. (1973) Societal and individual determinants of medical care
utilization in the United States. Milbank Mem Fund Q Health Soc 51: 95-124.
Andersen R and Newman JF. (2005) Societal and Individual Determinants of Medical Care
Utilization in the United States. The Milbank Quarterly 83.
Anderson IM. (2000) Selective serotonin reuptake inhibitors versus tricyclic antidepressants:
a meta-analysis of efficacy and tolerability. J Affect Disord 58: 19-36.
Andrade SE, Kahler KH, Frech F, et al. (2006) Methods for evaluation of medication
adherence and persistence using automated databases. Pharmacoepidemiol Drug Saf
15: 565-574; discussion 575-567.
Australian Bureau of Statistics. (2006) 4824.0.55.001 - Mental Health in Australia: A
Snapshot, 2004-05. Available at:
http://www.abs.gov.au/ausstats/[email protected]/mf/4824.0.55.001.
Australian Bureau of Statistics. (2008) 4326.0 - National Survey of Mental Health and
Wellbeing: Summary of Results, 2007 Available at:
http://www.abs.gov.au/AUSSTATS/[email protected]/Latestproducts/4326.0Main%20Feature
s32007?opendocument&tabname=Summary&prodno=4326.0&issue=2007&num=&v
iew=.
Australian Bureau of Statistics. (2013) 4125.0 - Gender Indicators, Australia, Jan 2013:
mental health Available at:
http://www.abs.gov.au/ausstats/[email protected]/Lookup/by%20Subject/4125.0~Jan%20201
3~Main%20Features~Mental%20health~3150.
Australian Institute of Health and Welfare. (2003) The Active Australia Survey: a guide and
manual for implementation analysis and reporting. In: AIHW (ed). Canberra.
Australian Institute of Health and Welfare. (2004) Rural, regional and remote health: a guide
to remoteness classifications. Rural health series No. 4. AIHW cat. no. PHE 53. .
Canberra: AIHW.
Banks E, Byles JE, Gibson RE, et al. (2010) Is psychological distress in people living with
cancer related to the fact of diagnosis, current treatment or level of disability?
Findings from a large Australian study. Med J Aust 193: S62-67.
Banks E, Redman S, Jorm L, et al. (2008) Cohort profile: the 45 and up study. Int J
Epidemiol 37: 941-947.
Blazer DG, Hybels CF, Fillenbaum GG, et al. (2005) Predictors of antidepressant use among
older adults: Have they changed over time? American Journal of Psychiatry 162: 705-
710.
Blazer DG, Hybels CF, Simonsick EM, et al. (2000) Marked differences in antidepressant use
by race in an elderly community sample: 1986-1996. Am J Psychiatry 157: 1089-
1094.
Brown SL, Salive ME, Guralnik JM, et al. (1995) Antidepressant use in the elderly:
association with demographic characteristics, health-related factors, and health care
utilization. J Clin Epidemiol 48: 445-453.
Byles JE, Robinson I, Banks E, et al. (2014) Psychological distress and comorbid physical
conditions: disease or disability? Depress Anxiety 31: 524-532.
Department of Health and Ageing. (2013) About the PBS. Available at:
http://www.pbs.gov.au/info/about-the-pbs.
Eaddy MT, Druss BG, Sarnes MW, et al. (2005) Relationship of total health care charges to
selective serotonin reuptake inhibitor utilization patterns including the length of

26
antidepressant therapy--results from a managed care administrative claims database. J
Manag Care Pharm 11: 145-150.
Ganguli M, Mulsant B, Richards S, et al. (1997) Antidepressant use over time in a rural older
adult population: The MoVIES project. Journal of the American Geriatrics Society
45: 1501-1503.
Goldney RD, Taylor AW and Bain MA. (2007) Depression and remoteness from health
services in South Australia. Australian Journal of Rural Health 15: 201-210.
Grunebaum MF, Oquendo MA and Manly JJ. (2008) Depressive symptoms and
antidepressant use in a random community sample of ethnically diverse, urban elder
persons. Journal of Affective Disorders 105: 273-277.
Harris MG, Burgess PM, Pirkis J, et al. (2011) Correlates of antidepressant and anxiolytic,
hypnotic or sedative medication use in an Australian community sample. Aust N Z J
Psychiatry 45: 249-260.
Hollingworth SA, Burgess PM and Whiteford HA. (2010) Affective and anxiety disorders:
prevalence, treatment and antidepressant medication use. Aust N Z J Psychiatry 44:
513-519.
Karkare SU, Bhattacharjee S, Kamble P, et al. (2011) Prevalence and predictors of
antidepressant prescribing in nursing home residents in the United States. Am J
Geriatr Pharmacother 9: 109-119.
Kessler RC, Andrews G, Colpe LJ, et al. (2002) Short screening scales to monitor population
prevalences and trends in non-specific psychological distress. Psychol Med 32: 959-
976.
Kivimaki M, Gunnell D, Lawlor DA, et al. (2007) Social inequalities in antidepressant
treatment and mortality: a longitudinal register study. Psychological Medicine 37:
373-382.
Maher AR and Theodore G. (2012) Summary of the comparative effectiveness review on off-
label use of atypical antipsychotics. J Manag Care Pharm 18: S1-20.
Mealing NM, Banks E, Jorm LR, et al. (2010) Investigation of relative risk estimates from
studies of the same population with contrasting response rates and designs. BMC Med
Res Methodol 10: 26.
Organisation for Economic Co-operation and Development. (2013) Health at a Glance 2013:
OECD Indicators. OECD Publishing.
Page AN, Swannell S, Martin G, et al. (2009) Sociodemographic correlates of antidepressant
utilisation in Australia. Med J Aust 190: 479-483.
Papakostas GI, Shelton RC, Smith J, et al. (2007) Augmentation of antidepressants with
atypical antipsychotic medications for treatment-resistant major depressive disorder: a
meta-analysis. J Clin Psychiatry 68: 826-831.
Pfeiffer PN, Glass J, Austin K, et al. (2011) Impact of distance and facility of initial diagnosis
on depression treatment. Health Serv Res 46: 768-786.
Power C, Rodgers B and Hope S. (1998) U-shaped relation for alcohol consumption and
health in early adulthood and implications for mortality. Lancet 352: 877.
Sax Institute. (2014) Secure Unified Research Environment. Available at:
https://www.sure.org.au/.
Schoen C, Osborn R, Huynh PT, et al. (2004) Primary care and health system performance:
adults' experiences in five countries. Health Aff (Millwood) Suppl Web Exclusives:
W4-487-503.
Sclar DA, Robison LM, Skaer TL, et al. (1998) Antidepressant prescribing patterns - A
comparison of blacks and whites in a Medicaid population. Clinical Drug
Investigation 16: 135-140.
27
Soudry A, Dufouil C, Ritchie K, et al. (2008) Factors associated with antidepressant use in
depressed and non-depressed community-dwelling elderly: the three-city study.
International Journal of Geriatric Psychiatry 23: 324-330.
StataCorp. (2011) Statabase Reference Manual Release 12. Texas: Stata Press.
Stewart AL and Ware JE. (1992) Measuring functioning and well-being: the medical
outcomes study approach: Duke University Press.
WHO Collaborating Centre for Drug Statistics Methodology. (2012) Guidelines for ATC
classification and DDD assignment 2013. Oslo.
World Health Organization Collaborating Centre for Drug Statistics Methodology. (2013)
ATC stucture and principles. Available at:
http://www.whocc.no/atc/structure_and_principles/.
Zhang Y, Chow V, Vitry AI, et al. (2010) Antidepressant use and depressive
symptomatology among older people from the Australian Longitudinal Study of
Ageing. International Psychogeriatrics 22: 437-444.
Zimmerman M, Posternak M, Friedman M, et al. (2004) Which factors influence
psychiatrists' selection of antidepressants? Am J Psychiatry 161: 1285-1289.
28
Table 1: Sample characteristics by type of antidepressant user
Type of user
Total n
Non-user
n (%)
Current
n (%)
Past only
n (%)
Non-persistent
n (%)
p-value
n=111,705 n=89,955 (81) n=12,607 (11) n=4,443 (4) n=4,700 (4)
Sex
Male 49,747 42,337 (85) 4,146 (8) 1,579 (3) 1,685 (3) p<.001
Female 61,958 47,618 (77) 8,461 (14) 2,864 (5) 3,015 (5)
Age group
45-54 10,988 7,711 (70) 1,757 (16) 837 (8) 683 (6) p<.001
55-64 20,783 15,409 (74) 3,234 (16) 1,103 (5) 1,037 (5)
65-74 43,648 36,462 (84) 4,261 (10) 1,380 (3) 1,545 (4)
75-84 30,321 25,498 (84) 2,757 (9) 896 (3) 1,170 (4)
85 or older 5,965 4,875 (82) 598 (10) 227 (4) 265 (4)
Marriage status
Married/defacto 73,466 60,825 (83) 7,360 (10) 2,510 (3) 2,771 (4) p<.001
Not married/defacto 37,485 28,539 (76) 5,155 (14) 1,895 (5) 1,896 (5)
Country of birth
Australia/New Zealand 84,020 67,167 (80) 10,041 (12) 3,446 (4) 3,366 (4) p<.001
Europe/North America 20,210 16,557 (82) 2,005 (10) 732 (4) 916 (5)
Other 6,064 5,118 (84) 400 (7) 214 (4) 332 (5)
Education
No school cert 21,552 16,577 (77) 3,016 (14) 919 (4) 1,040 (5) p<.001
School cert 41,343 33,029 (80) 4,813 (12) 1,697 (4) 1,804 (4)
Apprenticeship/diploma 33,576 27,717 (83) 3,347 (10) 1,224 (4) 1,288 (4)
University degree 12,409 10,408 (84) 1,083 (9) 497 (4) 421 (3)
Income
<$20000 43,141 33,478 (78) 5,853 (14) 1,798 (4) 2,012 (5) p<.001
$20000-$39999 26,953 22,442(83) 2,584 (10) 959 (4) 968 (4)
$40000-$69999 10,389 8,888 (86) 752 (7) 417 (4) 332 (3)
>=$70000 2,202 1,918 (87) 98 (4) 108 (5) 78 (4)
Private health insurance
None 58,744 45,982 (78) 7,492 (13) 2,528 (4) 2,742 (5) p<.001
Private insurance 52,957 43,971 (83) 5,115 (10) 1,914 (4) 1,957 (4)
Region of residence

29
Type of user
Total n
Non-user
n (%)
Current
n (%)
Past only
n (%)
Non-persistent
n (%)
p-value
Major cities 46,179 37,630 (81) 4,752 (10) 1,769 (4) 2,028 (4) p<.001
Inner Regional 41,435 33,024 (80) 4,972 (12) 1,710 (4) 1,729 (4)
More remote 24,058 19,271 (80) 2,881 (12) 964 (4) 942 (4)
BMI
Underweight 1,691 1,326 (78) 197 (12) 64 (4) 104 (6) p<.001
Normal weight 36,050 29,843 (83) 3,353 (9) 1,329 (4) 1,525 (4)
Overweight 39,506 32,384 (82) 4,041 (10) 1,505 (4) 1,576 (4)
Obese 24,239 18,368 (76) 3,740 (15) 1,128 (5) 1,003 (4)
Physical activity tertile
Low 36,416 27,882 (77) 5,167 (14) 1,682 (5) 1,685 (5) p<.001
Moderate 37,196 30,489 (82) 3,816 (10) 1,351 (4) 1,540 (4)
High 33,340 27,865 (84) 3,006 (9) 1,228 (4) 1,241 (4)
Smoking status
Never 60,018 49,208 (82) 6,092 (10) 2,275 (4) 2,443 (4) p<.001
Past 42,792 34,544 (81) 4,913 (11) 1,626 (4) 1,709 (4)
Current 8,476 5,895 (70) 1,537 (18) 524 (6) 520 (6)
Alcohol consumption
None 46,022 35,676 (78) 6,191 (13) 2,037 (4) 2,118 (5) p<.001
Light 32,536 27,163 (83) 2,971 (9) 1,110 (3) 1,292 (4)
Moderate 26,389 21,839 (83) 2,599 (10) 980 (4) 971 (4)
Heavy 3,019 2,402 (80) 362 (12) 134 (4) 121 (4)
Physical impairment
None/minor 57,901 49,832 (86) 4,340 (8) 1,802 (3) 1,927 (3) p<.001
Moderate 15,773 12,153 (77) 2,145 (14) 714 (5) 761 (5)
Severe 17,149 11,463 (67) 3,647 (21) 1,030 (6) 1,009 (6)
Self-rated health
Excellent/very good 41,396 36,268 (88) 2,760 (7) 1,117 (3) 1,251 (3) p<.001
Good 41,130 33,345 (81) 4,544 (11) 1,601 (4) 1,640 (4)
Fair/poor 23,756 16,146 (68) 4,608 (19) 1,456 (6) 1,546 (7)
Psychological distress
Low 67,310 58,866 (87) 4,652 (7) 1,759 (3) 2,033 (3) p<.001
Moderate 14,491 10,072 (70) 25,88 (18) 950 (7) 881 (6)
High/very high 9,034 4,680 (52) 27,52 (30) 885 (10) 717 (8)

30
Type of user
Total n
Non-user
n (%)
Current
n (%)
Past only
n (%)
Non-persistent
n (%)
p-value
Ever diagnosed with depression by a doctor
No 80,777 71,706 (89) 4,276 (5) 1,946 (2) 2,849 (4) p<.001
Yes 15,519 5,758 (37) 6,670 (43) 1,873 (12) 1,218 (8)
Current treatment for depression or anxiety
No 100,066 87,458 (87) 5,915 (6) 2,988 (3) 3,705 (4) p<.001
Yes 11,639 2,497 (21) 6,692 (58) 1,455 (13) 995 (9)
Use of antipsychotics
Non-user 109,844 89,220 (81) 11,738 (11) 4,272 (4) 4,614 (4) p<.001
Low dose only 414 138 (33) 227 (55) 31 (7) 18 (4)
Medium dose only 818 345 (42) 341 (42) 92 (11) 40 (5)
High dose only 218 107 (49) 87 (40) 15 (7) 9 (4)
Mixed dose 411 145 (35) 214 (52) 33 (8) 19 (5)
Number of other medications dispensed
<5 32,223 28,649 (89) 1,655 (5) 931 (3) 988 (3) p<.001
5 to 9 39,253 32,637 (83) 3,829 (10) 1,342 (3) 1,445 (4)
10 or more 40,229 28,669 (71) 7,123 (18) 2,170 (5) 2,267 (6)
Abbreviations: BMI=body mass index. Notes: Percentages are row percentages. Percentage missing: marriage status=1%; country of birth=1%; education=3%; income=26%;
private health insurance=<1%; region of residence=<1%; BMI=9%; physical activity=4%; smoking status=<1%; alcohol consumption=3%; physical impairment=19%; self-
rated health=5%; psychological distress=19%; and ever diagnosed with depression by a doctor=14%.

31
Table 2: Numbers and percentage of antidepressant users by antidepressant class among those dispensed
any antidepressant
SSRI-only
n (%)
TCA-only
n (%)
Other (single
type)
n (%)
Combination
n (%)
Total n (%)
Current 5,183 (41%) 3,535 (28%) 2,206 (18%) 1,683 (13%) 12,607 (100%)
Past-only 1,883 (42%) 1,333 (30%) 696 (16%) 531 (12%) 4,443 (100%)
Non-persistent 1,702 (36%) 2,097 (45%) 733 (16%) 168 (3%) 4,700 (100%)
Total 8,768 (40%) 6,965 (32%) 3,635 (17%) 2,382 (11%) 21,750 (100%)
Abbreviations: TCA=tricyclic antidepressants; and SSRI=selective serotonin reuptake inhibitors. Notes: other
antidepressants include monoamine oxidase inhibitors and serotonin– noradrenaline reuptake inhibitors.
Combination indicates that more than one class of antidepressants was dispensed to the same individual during
the study period.

32
Table 3: Adjusted relative risk ratio for different types of antidepressants compared to using a SSRI only
in relation to sociodemographic and health exposures, among current users only
TCA-only Other (single type) Combination
RRR (95% CI)^ RRR (95% CI)^ RRR (95% CI)^
Sex
Male 1.00 1.00 1.00
Female 1.34(1.21-1.48) 0.79(0.71-0.89) 1.10(0.97-1.25)
Age group
45-54 1.00 1.00 1.00
55-64 1.30(1.09-1.54) 0.91(0.77-1.07) 0.74(0.62-0.88)
65-74 1.92(1.63-2.26) 0.77(0.65-0.90) 0.69(0.58-0.82)
75-84 2.95(2.48-3.50) 0.90(0.76-1.08) 0.81(0.66-0.98)
85 or older 2.81(2.19-3.62) 0.96(0.71-1.28) 0.91(0.67-1.24)
Country of birth
Australia/New Zealand 1.00 1.00 1.00
Europe/North America 0.89(0.79-1.02) 1.04(0.89-1.20) 1.22(1.04-1.43)
Other 1.15(0.86-1.54) 1.29(0.95-1.75) 1.75(1.29-2.39)
Marriage status
Married/defacto 1.00 1.00 1.00
Not married/defacto 1.05(0.96-1.16) 1.29(1.16-1.45) 1.17(1.04-1.32)
Education
No school cert 1.35(1.12-1.62) 1.00(0.82-1.23) 1.40(1.10-1.78)
School cert 1.41(1.18-1.68) 1.09(0.90-1.32) 1.41(1.13-1.78)
Apprenticeship/diploma 1.38(1.14-1.66) 1.17(0.96-1.43) 1.38(1.09-1.74)
University degree 1.00 1.00 1.00
Income
<$20000 1.13(0.65-1.95) 0.86(0.48-1.53) 1.32(0.63-2.75)
$20000-$39999 1.04(0.60-1.82) 0.79(0.44-1.42) 1.12(0.54-2.36)
$40000-$69999 0.92(0.51-1.64) 0.93(0.51-1.72) 1.29(0.60-2.78)
>=$70000 1.00 1.00 1.00
Private health insurance
None 1.00 1.00 1.00
Private insurance 0.93(0.84-1.02) 1.07(0.96-1.19) 0.98(0.87-1.11)
Region of residence
Major cities 1.00 1.00 1.00
Inner Regional 0.99(0.89-1.10) 1.01(0.89-1.14) 0.94(0.82-1.08)
More remote 0.97(0.85-1.10) 0.92(0.80-1.07) 0.89(0.76-1.04)
BMI
Underweight 0.85(0.57-1.28) 1.21(0.78-1.86) 1.46(0.94-2.25)
Normal weight 1.00 1.00 1.00
Overweight 0.91(0.80-1.02) 0.93(0.81-1.07) 0.93(0.79-1.08)
Obese 0.85(0.75-0.97) 0.97(0.84-1.11) 0.94(0.80-1.10)
Physical activity tertile
Low 1.05(0.93-1.19) 1.07(0.94-1.23) 1.16(1.00-1.35)
Moderate 1.00(0.88-1.13) 0.98(0.85-1.13) 1.04(0.88-1.22)
High 1.00 1.00 1.00
Smoking status
Never 1.00 1.00 1.00
Past 0.97(0.88-1.08) 0.90(0.80-1.01) 1.01(0.88-1.15)
Current 1.13(0.96-1.33) 1.54(1.30-1.82) 1.47(1.22-1.76)
Alcohol consumption
None 1.24(1.10-1.40) 1.22(1.06-1.40) 1.23(1.06-1.44)
Light 1.12(0.97-1.28) 1.07(0.91-1.26) 0.99(0.83-1.19)
Moderate 1.00 1.00 1.00
Heavy 0.70(0.51-0.96) 1.10(0.81-1.50) 0.98(0.69-1.40)
Physical impairment
None/minor 1.00 1.00 1.00
Moderate 1.18(1.02-1.35) 1.03(0.88-1.20) 1.33(1.11-1.58)

33
TCA-only Other (single type) Combination
RRR (95% CI)^ RRR (95% CI)^ RRR (95% CI)^
Severe 1.43(1.27-1.61) 1.16(1.02-1.33) 1.78(1.54-2.07)
Self-rated health
Excellent/very good 1.00 1.00 1.00
Good 1.18(1.05-1.34) 1.18(1.02-1.36) 1.45(1.22-1.72)
Fair/poor 1.40(1.23-1.59) 1.33(1.15-1.53) 2.27(1.92-2.69)
Psychological distress
Low 1.00 1.00 1.00
Moderate 0.68(0.60-0.77) 1.02(0.88-1.18) 1.19(1.01-1.42)
High/very high 0.54(0.47-0.62) 1.42(1.23-1.64) 2.24(1.91-2.63)
Ever diagnosed with
depression by a doctor
No 1.00 1.00 1.00
Yes 0.24(0.22-0.27) 1.42(1.24-1.62) 1.45(1.25-1.68)
Use of antipsychotics
Non-user 1.00 1.00 1.00
Low dose only 0.51(0.32-0.81) 2.86(2.05-3.99) 2.13(1.45-3.14)
Medium dose only 0.78(0.56-1.10) 2.03(1.53-2.70) 2.06(1.52-2.81)
High dose only 0.94(0.47-1.86) 2.14(1.18-3.89) 2.38(1.27-4.48)
Mixed dose 0.64(0.38-1.09) 3.18(2.16-4.66) 4.35(2.98-6.36)
Number of other medications dispensed <5 1.00 1.00 1.00
5 to 9 1.68(1.42-1.98) 1.27(1.08-1.50) 1.81(1.44-2.26)
10 or more 2.13(1.82-2.50) 1.37(1.17-1.61) 3.11(2.52-3.84)
^Adjusted for sex, age, and country of birth. Abbreviations: RRR=relative risk ratio; CI=confidence intervals;
TCA=tricyclic antidepressants; BMI=body mass index. Notes: The relative risk ratio of each class of
antidepressant is calculated in reference to selective serotonin reuptake inhibitors users only.
34
Figure 1: Percentage of study participants using any antidepressant during the study period, according to
age group and sex
010
20
30
45-54 55-64 65-74 75-84 85 45-54 55-64 65-74 75-84 85
Male Female
Perc
ent u
sin
g a
ny a
ntide
pre
ssan
t
35
Figure 2: Adjusted relative risk ratio for current antidepressant use compared to no use according to
predisposing factors
Notes: adjusted for age, sex and country of birth. Abbreviations: BMI=body mass index. RRR are on log scale.
36
Figure 3: Adjusted relative risk ratio for current antidepressant use compared to no use according to
enabling factors
Notes: adjusted for age, sex and country of birth. RRR are on log scale.

37
Figure 4: Adjusted relative risk ratio for current antidepressant use compared to no use according to
need-related factors
Notes: adjusted for age, sex and country of birth. RRR are on log scale.

38
Supplementary table 1: Adjusted relative risk ratio for antidepressant use across different user categories
and according to sociodemographic and health exposures
Current Past only Non-persistent
RRR (95% CI)^ RRR (95% CI)^ RRR (95% CI)^
Sex
Male 1.00 1.00 1.00
Female 1.68(1.61-1.75) 1.46(1.37-1.56) 1.52(1.43-1.62)
Age group
45-54 1.00 1.00 1.00
55-64 0.91(0.85-0.97) 0.66(0.60-0.72) 0.76(0.69-0.84)
65-74 0.53(0.50-0.56) 0.36(0.33-0.39) 0.50(0.46-0.55)
75-84 0.51(0.47-0.54) 0.34(0.31-0.38) 0.55(0.50-0.61)
85 or older 0.53(0.48-0.59) 0.43(0.37-0.50) 0.60(0.52-0.70)
Country of birth
Australia/New Zealand 1.00 1.00 1.00
Europe/North America 0.87(0.83-0.92) 0.94(0.87-1.03) 1.17(1.09-1.27)
Other 0.49(0.44-0.54) 0.71(0.62-0.82) 1.21(1.07-1.36)
Marriage status
Married/defacto 1.00 1.00 1.00
Not married/defacto 1.38(1.32-1.43) 1.47(1.38-1.57) 1.33(1.25-1.41)
Education
No school cert 1.60(1.49-1.73) 1.11(0.99-1.24) 1.52(1.35-1.71)
School cert 1.22(1.14-1.31) 1.00(0.90-1.10) 1.29(1.16-1.44)
Apprenticeship/diploma 1.14(1.06-1.23) 0.92(0.83-1.03) 1.20(1.07-1.34)
University degree 1.00 1.00 1.00
Income
<$20000 3.51(2.85-4.32) 1.04(0.85-1.27) 1.48(1.17-1.87)
$20000-$39999 2.30(1.86-2.83) 0.82(0.67-1.01) 1.09(0.86-1.38)
$40000-$69999 1.67(1.34-2.08) 0.87(0.70-1.08) 0.94(0.73-1.20)
>=$70000 1.00 1.00 1.00
Private health insurance
None 1.00 1.00 1.00
Private insurance 0.76(0.73-0.79) 0.90(0.85-0.96) 0.82(0.77-0.87)
Region of residence
Major cities 1.00 1.00 1.00
Inner Regional 1.06(1.02-1.11) 1.00(0.93-1.08) 0.97(0.91-1.04)
More remote 1.01(0.96-1.06) 0.91(0.84-0.99) 0.89(0.82-0.96)
BMI
15-<18.5 1.22(1.04-1.42) 0.99(0.77-1.29) 1.42(1.15-1.74)
18.5-<25 1.00 1.00 1.00
25-<30 1.17(1.11-1.23) 1.10(1.02-1.19) 1.02(0.95-1.10)
30-50 1.67(1.59-1.76) 1.26(1.16-1.37) 1.04(0.96-1.13)
Physical activity tertile
Low 1.75(1.66-1.83) 1.40(1.30-1.51) 1.35(1.25-1.46)
Moderate 1.16(1.10-1.22) 1.03(0.95-1.12) 1.14(1.05-1.23)
High 1.00 1.00 1.00
Smoking status
Never 1.00 1.00 1.00
Past 1.32(1.27-1.38) 1.12(1.05-1.20) 1.12(1.05-1.19)
Current 1.90(1.78-2.03) 1.49(1.34-1.65) 1.61(1.45-1.78)
Alcohol consumption
None 1.39(1.32-1.46) 1.19(1.10-1.29) 1.22(1.12-1.32)
Light 0.99(0.94-1.05) 0.96(0.88-1.05) 1.11(1.02-1.21)
Moderate 1.00 1.00 1.00
Heavy 1.18(1.05-1.33) 1.10(0.91-1.33) 1.09(0.90-1.32)
Physical impairment
None/minor 1.00 1.00 1.00
Moderate 2.10(1.98-2.22) 1.69(1.54-1.85) 1.63(1.49-1.78)

39
Current Past only Non-persistent
RRR (95% CI)^ RRR (95% CI)^ RRR (95% CI)^
Severe 3.86(3.67-4.06) 2.59(2.39-2.81) 2.28(2.10-2.47)
Self-rated health
Excellent/very good 1.00 1.00 1.00
Good 1.91(1.82-2.01) 1.63(1.51-1.76) 1.46(1.35-1.58)
Fair/poor 4.04(3.83-4.25) 2.98(2.75-3.24) 2.80(2.59-3.02)
Psychological distress
Low 1.00 1.00 1.00
Moderate 3.16(3.00-3.34) 2.88(2.65-3.13) 2.37(2.18-2.58)
High/very high 7.22(6.81-7.66) 5.37(4.90-5.88) 3.93(3.58-4.32)
Ever diagnosed with
depression by a doctor
No 1.00 1.00 1.00
Yes 18.85(17.95-19.79) 10.61(9.89-11.39) 4.94(4.59-5.32)
Use of antipsychotics
Non-user 1.00 1.00 1.00
Low dose only 12.26(9.85-15.27) 4.42(2.98-6.56) 2.37(1.45-3.88)
Medium dose only 6.86(5.87-8.01) 4.39(3.46-5.57) 1.93(1.39-2.69)
High dose only 6.05(4.50-8.13) 2.65(1.54-4.54) 1.51(0.76-3.00)
Mixed dose 10.15(8.14-12.65) 3.83(2.60-5.65) 2.22(1.36-3.61)
Number of other medications
dispensed
<5 1.00 1.00 1.00
5 to 9 2.53(2.38-2.69) 1.63(1.50-1.78) 1.51(1.39-1.64)
10 or more 5.97(5.62-6.34) 3.37(3.10-3.66) 2.86(2.64-3.09)
^Adjusted for sex, age, and country of birth. Abbreviations: RRR=relative risk ratio; CI=confidence intervals;
BMI=body mass index. Notes: The relative risk ratio of each user type is calculated in reference to non-users.