short title: growth kinetics of am fungi - caltechauthors isolation process involved in obtaining...
TRANSCRIPT
Short title: Growth kinetics of AM fungi
Growth dynamics of geographically different arbuscular mycorrhizal fungal isolates
belonging to the ‘Rhizophagus clade’ under monoxenic conditions
Vanesa Analía Silvani1
Laura Fernández Bidondo
María Josefina Bompadre
Roxana Paula Colombo
Mariana Pérgola
Departamento de Biodiversidad y Biología Experimental, Facultad de Ciencias Exactas
y Naturales (FCEyN), Universidad de Buenos Aires (UBA), Ciudad Universitaria, 4to
piso, Pabellón 2, 1428, Buenos Aires, Argentina
Agustín Bompadre
SAP Labs, 1251 Waterfront Place, Pittsburgh, Pennsylvania 15222
Sebastián Fracchia
Centro Regional de Investigaciones Científicas y Transferencia Tecnológica, CRILAR-
CONICET, Entre Ríos y Mendoza, 530 Anillaco, La Rioja, Argentina
Alicia Godeas
Departamento de Biodiversidad y Biología Experimental, Facultad de Ciencias Exactas
y Naturales (FCEyN), Universidad de Buenos Aires (UBA), Ciudad Universitaria, 4to
piso, Pabellón 2, 1428, Buenos Aires, Argentina
Abstract: The growth dynamics of extraradical mycelium and spore formation of 14
“Rhizophagus” isolates from different sites in Argentina were evaluated under
monoxenic conditions. A modified Gompertz model was used to characterize the
development of mycelium and spores for each isolate under the same conditions. The
lag time, maximal growth rate and total quantity of both extraradical hyphae and spores
In Press at Mycologia, preliminary version published on June 2, 2014 as doi:10.3852/13-118
Copyright 2014 by The Mycological Society of America.
were determined. Wide variability among isolates was detected, and all growth
parameters were significantly altered by fungal isolate. Discriminant analysis
differentiated isolates primarily based on the extent of extraradical hyphae produced, yet
such differences did not conclusively correspond to phylogenetic relationships among
closely related isolates based on partial SSU sequences. Given that the “Rhizophagus”
isolates were grown under controlled conditions for many generations, the expression of
phenotypic variability could be attributed to genetic differences that are not completely
resolved by phylogenetic analysis employing the small ribosomal gene.
Key words: Glomeromycota, growth dynamics, in vitro, Rhizophagus
intraradices, Rhizophagus irregularis, variability
INTRODUCTION
Arbuscular mycorrhizal (AM) fungi (phylum Glomeromycota) are obligate biotrophs
that establish mutualistic symbioses with roots of most plant species and play key roles
in ecosystem functioning (Smith and Read 2008). The mycelial network of AM fungi
increases the surface area for nutrient uptake, produces many spores and is a source of
inoculum for colonization of new host plants. The exchange of genetic material also
takes place in the extraradical mycelium (ERM) by hyphal anastomosis (Avio et. al
2006). The ERM, spores and intraradical mycelium are the main fungal structures for
propagation and survival of Glomerales species (Klironomos and Hart 2002, Schalamuk
and Cabello 2010).
Based on molecular surveys and morphological identification, the most
widespread and abundant AM fungal species belong to the genus Rhizophagus (former
Glomus Group Ab, “Rhizophagus intraradices clade”) (Schüßler and Walker 2010).
Within the “Rhizophagus clade” (Schwarzott et al. 2001) R. intraradices and R.
irregularis are the AM species most frequently studied as fungal models (Martin et al.

2008, Fernández et al. 2009, Ehringer et al. 2012). However, little is known concerning
developmental traits that reflect life-history strategies and phenotypic plasticity in this
group.
The study of phenotypic variance among closely related AM fungal isolates has
been problematic, mainly due to their limited distinguishing characteristics and the
experimental protocols used. Hart and Reader (2005) observed that total ERM length
did not differ among six R. intraradices isolates from different locations. In contrast,
Avio et al. (2006) found variation in total hyphal length between two geographically
different isolates of R. intraradices. These studies used a pot-culture system with
inherent risks of measuring artifacts due to growing conditions, contaminants and host
physiological differences. In addition, studies of phenotypic variance performed with
only a few AM fungal strains are not sufficiently representative of AM fungal
population variability. These limitations were partly overcome by using root-organ
cultures (ROCs) of Ri T-DNA-transformed carrot roots colonized by AM fungi
(Declerck et al. 2005). This method allows fungal growth over several generations
under identical conditions, thus removing environmental influences and highlighting the
role of genetics. Koch et al. (2004) showed that individuals from a R. irregularis
population varied in total ERM length, spore number and growth rates with the use of
ROCs. These authors concluded that considerable phenotypic and genetic variation
exists at the population level. However, the range of phenotypic variation among AM
fungal isolates within the “Rhizophagus clade” from different geographic populations
remains unclear. To date no studies have analyzed the in vitro growth dynamics of ERM
development and spore formation among a wide assemblage of AM isolates belonging
to the “Rhizophagus clade”. The isolation process involved in obtaining many fungal
strains, their maintenance under monoxenic cultures for many generations and the time-

consuming process of monitoring their growth under controlled conditions have
impeded studies of this nature.
One possibility to investigate in more detail the growth dynamics of AM fungal
structures is through the application of a mathematical function to fungal growth curves.
This approach can be used to validate biological observations and quantify growth
parameters. The mathematical function of Gompertz reparameterized by Zwiertering et
al. (1990) first was used by Declerck et al. (2001) for modeling sporulation dynamics of
three Glomeraceae species under monoxenic cultures. Declerck et al. (2004) used the
same equation for studying the growth dynamics of extraradical structures of a
Gigasporaceae species. In both studies AM fungal development followed a classical
lag-exponential-plateau phase, and lag time, maximum growth rate and the total
quantity of spores and hyphae could be predicted.
An important parameter of fungal growth is the lag phase, in that it involves the
early colonization of substrate and host roots and subsequently the successful
establishment of the AM symbiosis (Bonfante and Genre 2010). However, whether
variation in the lag phase exists among closely related AM fungal isolates is unknown. In
addition, the rapidity and extent at which the external mycelia develop in soil could be
related to the ability of the AM fungus to survive under different environmental
conditions. In turn, the rate of spore formation and the total number of spores produced
are likely key factors that govern short- and long-term survival of AM fungi. We suggest
that phenotypic variability in such ecologically important life-history traits may contribute
to the propagation and colonization of AM fungal isolates within “Rhizophagus clade” in
heterogeneous environments.
The aim of this study was to investigate the growth dynamics of ERM and spore
production among AM fungal isolates belonging to the “Rhizophagus clade” from
different geographic populations under monoxenic conditions. In addition, the link
between these phenotypic characters and the molecular phylogeny based on the
ribosomal small subunit gene was investigated with discriminate analysis.
Characterizing fungal development under environmentally controlled conditions may
help resolve taxonomic difficulties within this important and cosmopolitan Rhizophagus
group.
MATERIALS AND METHODS
Biological material.—Isolation of AM fungi. We isolated AM fungi from different geographic habitats of
Argentina, using mycorrhizal roots from trap plants as initial inoculum for the establishment of
monoxenic cultures. Bulk soil samples (approx. 200 g) were randomly collected (to a depth of 20 cm)
from different environments (TABLE I). Trap cultures consisted of pots (1000 mL) with field soil as AM
fungal inoculum (100 g per trap plant) mixed with an autoclaved substrate (100 C for 1 h, three
consecutive days) composed of perlite: vermiculite: soil (1:1:1, v/v/v) (pH 7.1; total C 12.08 and N 1.1 (g
kg−1); P 34.2 mg kg−1; K 0.9, Ca 7.5, Mg 1.7 and Na 0.2 [cmol kg−1]). Several pregerminated seeds of
Solanum lycopersicum, Solanum melongena and Pisum sativum were planted in each pot. Plants were
grown in a greenhouse 6 mo with natural light and ambient temperature, watered when necessary and
fertilized every 15 d with 20 mL nutritive solution (Hewitt 1952). After 6 mo, root samples from each
trap plant were cleared in KOH (10% w/v 15 min, 90 C) and stained with trypan blue in lactic acid (0.02
% 10 min, 90 C) to observe AM root colonization.
Establishment of monoxenic culture. Mycorrhizal root samples from trap plants were surface-
sterilized, cut into pieces and each root piece was incubated in drops of Gel-Gro® medium, as described
in Silvani et al. (2008). Each root piece with hyphal regrowth of AM fungi in the absence of other
contaminant microorganisms was placed in the vicinity of a Ri T-DNA-transformed carrot root growing
on minimum medium (MM) (Bécard and Fortin 1988) and incubated in an inverted position at 25 C in the
dark. Monoxenic cultures were monitored weekly under a binocular microscope for the development of
ERM and spore production. New monoxenic cultures were initiated by transferring a single spore to a
transformed carrot root culture to ensure that only one isolate was present. These single-spore cultures
were propagated for at least six generations under identical conditions, as suggested by Koch et al.
(2004), and used for all subsequent work reported here. Each AM isolate in monoxenic culture was
characterized morphologically from spores and by molecular technique. Morphological
characterization of AM fungal isolates. To obtain many healthy spores from monospecific pot cultures, a
piece of monoxenic culture (containing mycorrhizal root fragments, extraradical mycelia and spores) was
inoculated to plantlets of Sorghum halepense and Trifolium repens grown in pots with a sterile substrate
as previously described. After 6 mo AM spores were extracted by wet sieving and decanting.
Approximately 200 spores from pot cultures were mounted in polyvinyl-alcohol glycerol
(PVLG) and a mixture of PVLG and Melzer reagent (1:1, v/v) to observe their morphological characters
and subcellular structure with a Nikon Optiphot-2 microscope. Identification was made under supervision
of Dr Gisela Cuenca, (Instituto Venezolano de Investigación Científica, Caracas, Venezuela) in
accordance with species descriptions and the online guide provided by INVAM
(http://invam.caf.wvu.edu) and Dr Blaszkowski's website (http://agro.ar.szczecin.pl/
wjblaszkowski/index.html). Taxonomic assignments were done according to the Index Fungorum.
Permanent slides were deposited as voucher material at the Banco de Glomeromycota in Vitro (BGIV,
Buenos Aires, Argentina).
Molecular characterization of AM fungal isolates. For fungal DNA extraction, a
bicompartmentalized culture system was used to obtain pure AM fungal propagules (St Arnaud et al.
1996). Spores and external mycelia were recovered from the root-free compartment through dissolution
of the growth medium with sodium citrate buffer and washed with sterile distilled water (Cranenbrouck et
al. 2005).
A cluster of spores and mycelium of each isolate was crushed in 40 μL sterile Tris-EDTA buffer
10 mM (pH 8.0) with a pipette tip and 10 μL Chelex® 100 Resin (BioRad, California) 20% (w/v) was
added to the solution. The mixture was incubated (95 C, 10 min), immersed in ice (2 min) and centrifuged
(11 000 rpm, 5 min); supernatants were transferred to sterile tubes and stored at −18 C until use as
template. The partial SSU nrDNA was amplified using AM1 and NS31 primers (Simon et al. 1992,
Helgason et al. 1998).
Reactions were performed in a final volume of 25 μL containing 5 μL DNA extracts, 0.02 U/μL
high-fidelity DNA iproof BioRad® polymerase (BioRad, California), PCR buffer 1× iproof HF, 200 mM
dNTPs (Invitrogen, Carlsbad, California) and 0.5 μM each primer. Amplification was performed in a
thermo-cycler Gene Bioer Pro® (Bioer, Hangzhou, China). The PCR conditions consisted of an initial
denaturing cycle (98 C, 5 min), 35 amplification cycles (98 C, 5 s; 58 C, 15 s; 72 C, 1 min) and a final
elongation cycle (72 C, 10 min). The amplified products of all AM isolates were cloned into the P-Gem T
easy vector® 2.1 (Promega, Madison, Wisconsin) following the manufacturer's instructions and
transformed into competent Escherichia coli DH5α cells. Per isolate, three colonies of putative positive
transformants were picked and directly subjected to another PCR amplification using the primers and
reaction program as described above. The transformed bacterial colonies showing correct insert size were
grown overnight at 37 C with shaking (200 rpm) in 3 mL Luria-Bertani medium supplemented with 100
mg/mL ampicillin. The plasmids were isolated with the MO BIO UltraClean® Mini Plasmid Prep Kit
(MO BIO, Carlsbad, California), according to the manufacturer's protocol. Sanger sequencing was
performed by the Servicio de Secuenciación y Genotipificado of Facultad de Ciencias Exactas y
Naturales (Universidad de Buenos Aires) on an ABI 3130XL 16-capillary sequencer using big dye 3.1
sequencing chemistry. Sequences were submitted to the EMBL database under accession numbers
GU140042, JX049517- JX049528, JX051853 (TABLE I).
The sequences were compiled with BioEdit Sequence Alignment Editor 7.0 software and
compared with sequences from the GenBank database. DNA similarity was analyzed with the NCBI
BLAST server (http://www.ncbi.nlm.nih.gov) and the MaarjAM database for the phylum Glomeromycota
(http://maarjam.botany.ut.ee). The sequences obtained together with identified species of the genera
Rhizophagus (former Glomus group Ab, “Rhizophagus intraradices clade” including sequences of
references isolates of R. intraradices [FL208] and R. irregularis [DAOM 197198/MUCL43194]), and the
most similar sequences to our clones obtained from BLAST queries were aligned with the program
Clustal W. A neighbor-joining consensus tree was constructed with MEGA 4.0 software assessing
Kimura 2-p distances model and 1000 replicates of non-parametric bootstrapping. Funneliformis mosseae
was used as outgroup. The individual model parameters were estimated with Modeltest 3.7. Phylogenetic
trees were viewed and edited by Tree Explorer and a CorelDraw 11.
Experimental design and measurement of variables.—A total of 14 Rhizophagus isolates were used for
this assay. The Rhizophagus isolates GC1, GC2, GC3 and GC4 (http://www.bgiv.com.ar/strains/)
previously isolated in Silvani et al. (2008) also were included in the analyses. Each experimental unit
consisted of a 9 cm Petri plate with two 5 cm long transformed roots from a 2 wk old root culture growing
in MM and inoculated with a 1 cm3 plug of culture medium from a 6 mo old monoxenic culture. For
assuring the same amount of fungal propagules in each replicate, plug locations were selected in the
monoxenic culture with similar number of extraradical spores (approx. 150–200 spores), mycorrhizal root

fragments and ERM length. Replicate subcultured material prepared in this way (many spores and
hyphae, rather than just one spore) is stable and ensures the reproducibility in experiments (Ehringer et al.
2012). Monoxenic cultures were incubated horizontally in the dark at 25 C in an inverted position for 20
wk. Five replicates were included for each isolate. The ERM development and the number of newly
formed spores were quantified for each replicate at regular intervals from week 3 after initiation of dual
cultures and then every 2 wk until week 20. The length of ERM per Petri plate was measured with the
gridline intersect method of Marsh (1971), and the number of intersects of 1 cm2 squares between hyphae
and lines was included in the formula of Newman (1966). An estimation of spore production per Petri
plate was obtained for each replicate by adding the number of spores counted individually in five 1 cm3
squares located randomly in each Petri plate. All measurements were made with a binocular microscope
(Nikon OPTIPHOT-T2) at 3.2× magnification.
Application of the Gompertz growth model.—Growth curves were fitted by the mathematical model of
Gompertz reparameterized by Zwiertering et al. (1990) to study the kinetics of in vitro development of the
AM fungal isolates for each replicate plate. The formula of the Gompertz model was applied to each
curve as follows: E(Yt) = Aexp(-exp[(μme/A)(λ-t)+1]), where E(Yt) is the expected growth for the
variable Y at time t, and the parameters can be interpreted as: (A) number of spores/ERM when the
fungus reached the stationary phase, (μm) maximum rate of spores/ERM production and (λ) lag time of
the curve. The Gompertz model was fitted to the data by a nonlinear regression algorithm using the
Nelder-Mead optimization to minimize the residual sum of squares, which is the sum of the squared
differences between the measured and the predicted values. The nonlinear curve fitting was carried out by
the SOLVER option in Microsoft Excel software, which allowed the application of an iterative algorithm to
approximate the optimal solution. The values of the three parameters (A, μm and λ) were recorded for
ERM and spore production.
The frequency (%F) and intensity (I%) of mycorrhizal colonization was measured at the end of
the experiment (Declerck et al. 2004). To accomplish this, transformed carrot roots were removed and
cleared and stained as described above. Fifty randomly selected root pieces were mounted on microscope
slides in groups of 10 and examined with a Nikon binocular microscope at 100× magnification.
Statistical analysis.—For each growth curve, the coefficient of determination (R2) was obtained to
evaluate the goodness of fit between the model applied and the data observed. The means and standard
errors of each parameter (A, μm and λ) for both variables (ERM length and spore production) were

calculated over the five replicates for each isolate. For intraspecific comparison, the parameters obtained
for each isolate were analyzed by multivariate ANOVA (MANOVA), using isolate as factor.
Assumptions of homoscedasticity and normality were evaluated with Levene test and Shapiro-Wilkes
test. The data on AM root colonization (I%) were arcsine square root-transformed before analysis. The
least significant difference (LSD) test was performed to compare the means of each parameter among
isolates with a significance of P ≤ 0.05. Discriminant function analysis was performed to visualize
distribution patterns according to the phenotypic variation among isolates (Johnson and Wichern 2001).
The A, μm, λ, %F and I% data were included in this analysis. Finally, to determine whether ERM and
spores developed simultaneously (λERM = λspores), the lag parameters (λ) of ERM and spores were
compared with Student's t-test analysis at a significance of P ≤ 0.05 for each isolate. Statistical procedures
were carried out with the software package SPSS 17.0 and Microsoft Excel for Windows XP.
RESULTS
Monoxenic cultures of AM fungal isolates.—Fourteen AM fungal isolates from different
regions in Argentina were obtained in monoxenic culture from a single spore (TABLE I).
Spore characters of all isolates were consistent with the morphological descriptions of
species within the genus Rhizophagus (phylogenetic group Glomus Group Ab).
Glomoid spores formed in loose clusters in roots and soil, with a three-layered wall
composed of two sloughing, hyaline outer layers and an innermost laminated, yellow
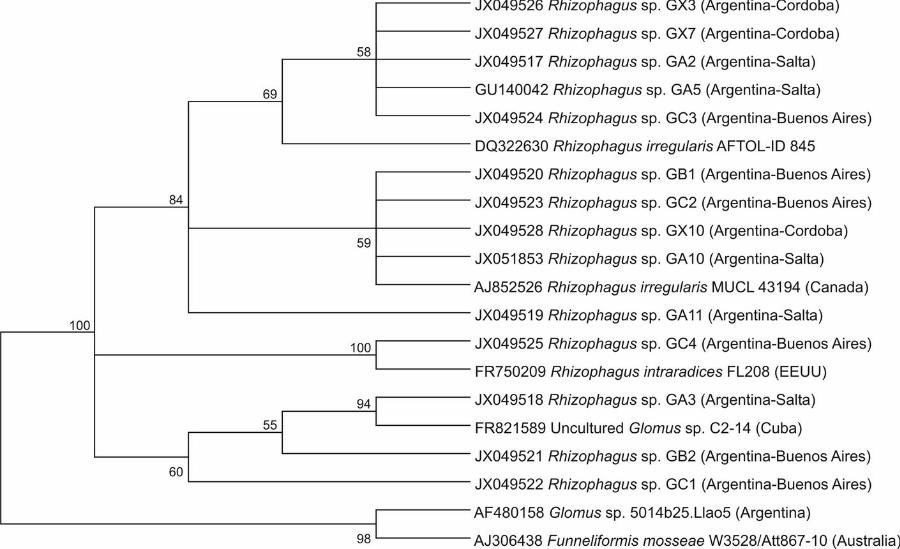
layer (SUPPLEMENTARY FIGS.1, 2). Likewise, phylogenetic analysis of partial SSU
nrDNA of the 14 isolates, including sequences of reference isolates of R. intraradices,
FL208 and R. irregularis, MUCL 43194/DAOM 197198, indicates that all isolates
cluster within the Rhizophagus clade and are separated from F. mosseae and a Glomus
sp. from Argentina with high bootstrap support (100%) (FIG.1).
A cluster was composed of GX3, GX7, GA2, GA5, GC3, GA11, GB1, GC2,
GX10 and GA10 isolates, including R. irregularis AFTOL-ID 845 and. R. irregularis
MUCL 43194/DAOM 197198 (84%). However, based on spore morphology, only the
GA10 isolate clearly belongs to R. irregularis, given the intense reactivity of the
laminate innermost spore wall layer in Melzer's reagent (SUPPLEMENTARY FIG. 1G–H)
and the production of abundant irregular spores with apical cap-like swellings of the
outermost wall layer. All spores of the rest of the isolates were globose to subglobose,
and their wall has neither depressions nor swelling at the spore apex (SUPPLEMENTARY
FIGS. 1, 2). The GC4 isolate was grouped together with R. intraradices −FL208 (100%
bootstrap support). In concordance with the species description (Blaszkowski et al.
2008), the spores of this isolate were globose to subglobose, with the mucilaginous
outermost layer reactive in Melzer's reagent and the third laminate layer composed of
separating sublayers that were not reactive in Melzer's. (SUPPLEMENTARY FIGS. 2K–L).
GC1 and GB2 isolates were positioned within the Rhizophagus clade with an uncertain
position between both Rhizophagus species, while the GA3 isolate was clustered
together with an uncultured Glomus sp. that originated from Cuba, supported by a
bootstrap value of 94%. The spore morphology of these three isolates was not consistent
with R. irregularis but was similar to R. intraradices, given the similar size and shape
of spores and the positive reaction in Melzer's of the outer wall layer (FIGS. 2C–F;
SUPPLEMENTARY FIGS. 1C, D).
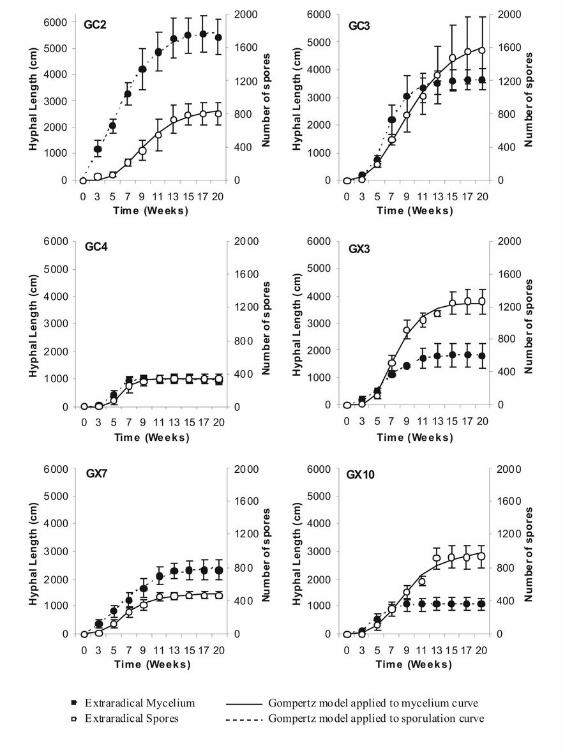
Description of growth curves and application of the Gompertz model.—Growth curves
of ERM development and sporulation for each isolate grown under identical monoxenic
conditions are illustrated (FIG. 2). In general, all isolates followed a typical sigmoid
curve for the development of both ERM and spores, and three main phases could be
distinguished: lag, exponential and stationary.
Microscopic observations revealed that spore germination and hyphal regrowth
from ERM and internal mycelia from mycorrhizal root fragments took place during the
lag phase. Therefore, hyphal extension gave rise to the ERM network, which rapidly
increased during the exponential phase until reaching the maximal slope of the growth
curve. The first spores occurred through hyphal differentiation during the lag phase, and
their number then increased exponentially. Finally, a stationary phase was reached with
no increases in ERM length or spore number. The Gompertz model had a good fit for all
isolates with R2 values of 0.973–1.00. The values of the parameters (λ, μm, A) for each
isolate after applying the Gompertz model in both growth curves are provided (TABLE
II.)
Growth dynamics of AM fungal isolates.—Variation in the development of ERM and
spores among the 14 closely related Rhizophagus isolates from different regions in
Argentina was observed in monoxenic culture (FIG. 2). Significant variation was
detected in all the model parameters fitted to ERM length and sporulation patterns
among isolates (TABLE II).
The lag phase of ERM development (λERM) differed significantly among isolates
(TABLE II). The λERM periods varied approximately 1–5 wk, with most isolates 2–3 wk.
The GA11 and GC2 isolates had the shortest λERM (approx. 1 wk), whereas GA10, GA3,
GX3, GB2 and GC3 had the longest λERM (approx. 5 wk). GA2 started to develop the
ERM exponentially approximately on the second week, GX7, GC1 and GC4 between
the second and third week, whereas the rest of the isolates began this phase between the
third and fourth week (GA5, GX10, GB1).
The lag phase for sporulation (λSPORES) varied significantly also among isolates
(TABLE II). The λSPORES ranged between three and 11 weeks, with most isolates ranging
between the fourth and seventh week. GC1, GB1 and GX7 started to produce spores
exponentially earlier from approximately the third week of monoxenic culture. In
contrast, GA3 and showed a longer λSPORES. Spores of GA11, GX10, GC2 and GC3
began to be produced exponentially on the fourth week, GA2 and GC4 during the fifth,

GA5, GB2, GA10 between the sixth and seventh week and GX3 in the eighth week.
The sporulation continued until reaching maximum production in the stationary phase.
The duration of the exponential phase for both growth curves varied among
isolates, 4–12 wk. After that period, the slope of the curves decreased until the
stationary phase was reached. GC4 produced both AM fungal structures exponentially
for approximately 4 wk, GA11, GB1, GB2 and GC1 approximately 6 wk and GX3,
GX7 and GA10 8 wk. GC2 showed the largest exponential phase (approx. 10 wk). The
exponential formation of ERM network of GC3 lasted 8 wk, while the exponential
production of spores occurred up to 12 wk. The exponential ERM growth phase of GA2
lasted 8 wk, that of GA3 and GX10 6 wk and that of GA5 10 wk. GX10, GA2 and GA5
produced spores for 8 wk in their exponential phase.
The sporulation of some isolates (GA2, GA3, GA5, GA10, GA11, GX7, GX10,
GB2, GC1, GC2, GC4) was delayed with respect to the growth of ERM (λSPORES values
were significantly longer than those of λERM). GC1 and GA10 started to produce spores
exponentially approximately 1 wk later than ERM, GX7, GX10 and GB2 approximately
2 wk, GA5, GA11 and GC2 approximately 3 wk and GA2, GA3, GC4 and GX3
approximately 4 wk. In contrast, GX3 and GC3 synchronously developed both
extraradical structures (the λERM values were not significantly different from the λSPORES
values).
The maximum growth of ERM (μm ERM) varied significantly among isolates and
ranged from a mean of 143.3–784.6 cm/wk (TABLE II). The ERM network of GA10 and
GA3 spread slowly throughout the entire Petri plate, but both AM fungal isolates did
not differ significantly from GA11, GX7, GX10 and GC1. The latter four isolates
together with GA5, GC4, GB2 and GX3 reached μm ERM values of 216–544 cm/wk. The
highest value of μm ERM was recorded for GC3, GA2, GB1 and GC2.

The maximum production rate of spores (μm SPORES) also differed among isolates,
67–436 spores/wk (TABLE II). GB2 and GX7 isolates had the lowest rates of spore
production but did not statistically differ from the GC2, GA10, GA3, GX10 and GC4
isolate. In contrast, GX3 produced more spores than any other isolate. The remaining
isolates had intermediate values of μm SPORES, 147–184 spores/wk.
The AM fungal isolates produced different amounts of ERM and spores when
they reached the stationary phase (FIG. 2). The maximum production of ERM (AERM)
differed among isolates and ranged from an average of 821 cm to 5777 cm (TABLE II).
The isolates that produced the highest values of AERM were GC2, GC3, GA5 and GA2.
The extraradical mycelial network of these isolate was composed mainly of numerous
runner hyphae (RH) and hyphal branches (HB). Some differences in the pattern of
hyphal ramifications were observed among isolates. GC3 produced the highest amount
of branched absorbing structures (BAS) (Bago et al 1998b), while GC2 developed a
large number of short HB, but few of the highly ramifying BAS. GA5 and GA2 formed
more BAS than short HB at 20 wk. GA10 produced the lowest amount of ERM with
few RH and HB, although the AERM value was not statistically different from GA3,
GC4, GC1, GX10 and GA11 isolates. The remaining isolates (GB1, GX3, GB2, GX7)
reached intermediate AERM mean values, but GX3 and GX7 developed more numerous
RH than GB1 and GB2.
There were significant differences in the maximum production of spores
(ASPORES) among isolates at the stationary phase (TABLE II). The ASPORES parameter
varied, 273–1848 spores produced per dish. GA3, GC4 and GB2 produced the least
number of total spores and GC3 and GX3 produced the greatest number of spores. The
remaining isolates had intermediate values of ASPORES.

The frequency (%F) and intensity (%I) of root colonization differed among
isolates in monoxenic culture (TABLE II). Roots colonized by GA10 isolate had the
lowest %F, while GX10 had the highest. Other isolates had intermediate frequencies of
colonization. The %I of intraradical colonization at harvest was lower in GA3 than all
other isolates.
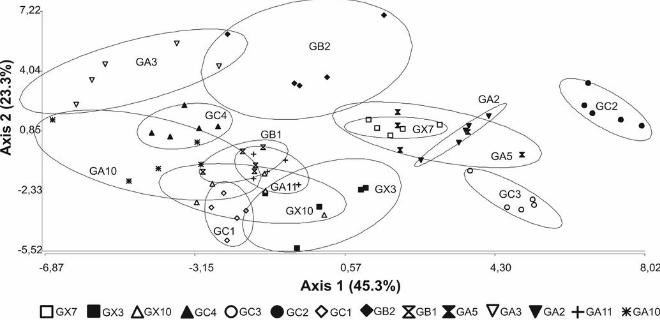
Results from the discriminant analysis showed that some isolates could be
distinguished from others, although many isolates overlapped (FIG.3). In the canonical
axis 1, the AERM contributed the most in separating the isolates, while all growth
parameters of sporulation curves (λSPORES, μm SPORES and ASPORES) had similar weight
contributing to the canonical axis 2 (data not shown). GC2, GC3, GB2 and GA3 isolates
were clearly separated from the other isolates, whereas there was less clear separation
among the remaining isolates. GA2, GA5 and GX7 clustered together, while other
clustering was found for GA10, GA11, GB1, GC1, GX10, GX3 and GC4 (FIG. 6).
However within the last group, GC4 isolate was separated along the second axis.
The differences between some isolates and the clustering among other isolates
within the ordination space did not correspond well to either the geographic locations
where the fungi were isolated or to the phylogenetic relationship of the isolates. For
example, GC2 was closely related to GA10 based on phylogenetic analysis (FIG. 1), but
these two isolates were on opposite extremes of axis 1 based on ERM growth characters
(FIG. 3).
DISCUSSION
In the present study we describe new insights into the growth dynamics of
geographically different AM fungal isolates belonging to the “Rhizophagus clade”. A
similar approach to model sporulation dynamics using the modified Gompertz function
was applied in three Glomeraceae species grown under monoxenic conditions (Declerck
et al. 2001) and a Gigasporaceae species (Declerck et al. 2004). Our work expanded
this analysis to include 14 AM fungal isolates within a single clade, demonstrating its
utility for modeling mycelial and spore growth of Rhizophagus isolates. In agreement
with studies based on monoxenic cultures of R. irregularis (MUCL 41833 and MUCL
43194/DAOM 197198 isolates) (Bago et al. 1998a, Declerck et al. 2001), all
Rhizophagus isolates followed a sigmoid growth curve with the three distinguishable
phases (lag, exponential, stationary).
Little is known about the extent of the lag phase that occurs during the early
stages of the AM fungal life cycle. Our results show that the Rhizophagus isolates
varied in lag phase periods in mycelia growth and sporulation. These data suggest that
variations in the lag phase are related to different propagule germination rates,
presymbiotic mycelial extension and formation of primary infection units in roots of
each Rhizophagus isolate. It has been documented that Diversisporales species initiate
in vitro sporulation after reaching a critical ERM biomass (Diop et al. 1992, Declerck et
al. 2004, Fernández Bidondo et al. 2012). However, this was not observed for all
isolates tested here. For example, GX3 and GC3 did not require long periods or a
maximal biomass of ERM to initiate sporulation but produced spores and developed
ERM simultaneously. This developmental trait suggests an adaptive value for these AM
fungal isolates to grow and rapidly reproduce in a particular set of conditions.
Studies have shown variations in ERM length and spore number between and
within AM fungal species under different experimental protocols (Hart and Reader
2002, 2005; Koch et al. 2004; Munkvold et al. 2004; Avio et al. 2006). We documented
that AM fungal isolates belonging to “Rhizophagus clade” also differed in their
maximal growth rate and amount of extraradical structures reached at the stationary
phase under monoxenic conditions. These phenotypic variations among
phylogenetically closely related isolates could reflect several life-history traits and
might have a significant impact on host root and soil colonization. The ability of certain
Rhizophagus isolates to rapidly produce an extensive hyphal network into the growth
substrate might provide a competitive advantage over other isolates with limited
mycelial growth by increasing the absorptive area for nutrient acquisition, colonizing
new roots and translocating nutrients to host plants. The capacity of certain AM fungal
isolates to produce abundant extraradical propagules likely leads to an increase in
inoculum potential and colonization of new host roots. In Declerck et al. (1996) spore
production of Glomus versiforme in monoxenic culture was strongly correlated with the
internal colonization of transformed carrot roots. In the present study we found that
differences in the rapidity and total production of ERM and spores were not related to
the extent of carrot root colonization by the different Rhizophagus isolates (correlation
coefficients below 0.2, data not shown).
Despite high overall diversity in the growth patterns among the isolates
examined here, it was possible to distinguish certain phenotypic groups. These groups
could be differentiated as either fast or slow colonizers or those with an intermediate
pattern of growth. A high growth rate and ability to produce a large amount of ERM
(e.g. GC2), a large quantity of spores (e.g. GX3) or both (e.g. GC3) could be discerned
from those isolates characterized by a longer lag phase, a slow growth and a limited
production of ERM and spores (e.g. GA3, GB2 or GA10). Other isolates such as GA11,
GC1 and GX10 showed intermediate patterns between these extremes.
Comparing the phenotypes of isolates based on growth patterns to the
phylogenetic analysis produced mixed results. In one case, the phylogenetic clade that
clustered with the R. irregularis AFTOL-ID 845 isolate that included GA2, GA5, GX3,
GX7 and GC3 isolates matched the phenotypic classification based on discriminant
analysis of growth parameters. However, other phylogenetically closely related isolates
(GC2, GA10) displayed the most divergent pattern of ERM development observed here.
Our findings are consistent with Munkvold et al. (2004) showing wide variation in
mycorrhizal effectiveness to deliver phosphorus to a common host plant among AM
fungal isolates within a species. The phenotypic diversity of closely related AM fungi
cannot be adequately represented by examining phylogenetic diversity based on
ribosomal genes. Further work should be aimed at elucidating taxonomic relationships
among such phylogenetically related isolates by adding another DNA regions and
phenotypic traits.
ACKNOWLEDGMENTS
We specially thank Dra Gisela Cuenca and her laboratory staff for helping us with Rhizophagus
morphological characterization and Prof R. Larry Peterson (University of Guelph, Canada) for editing the
English. We appreciate the valuable comments and suggestions of Associate Editor R. Paul Schreiner
and reviewers that have substantially improved our manuscript. We also thank Dr Sergio Ghío for
technical assistance and Lic. Rothen Carolina for her help in creating FIG. 3. We also gratefully
acknowledge financial support from Universidad de Buenos Aires, Agencia Nacional de Promoción
Científica y Tecnológica and Consejo Nacional de Investigaciones Científicas y Técnicas.
LITERATURE CITED
Avio L, Pellegrino E, Bonari E, Giovannetti M. 2006. Functional diversity of arbuscular mycorrhizal fungal
isolates in relation to extraradical mycelial networks. New Phytol 172:347–357.
Bago B, Azcón-Aguilar C, Piché Y. 1998a. Architecture and developmental dynamics of the external
mycelium of the arbuscular mycorrhizal fungus Glomus intraradices grown under monoxenic conditions.
Mycologia 90:52–62.
———, ———, Goulet A, Piché Y. 1998b. Branched absorbing structures (BAS): a feature of the
extraradical mycelium of symbiotic arbuscular mycorrhizal fungi. New Phytol 139:375–388

Bécard G, Fortin A. 1988. Early events of vesicular-arbuscular mycorrhiza formation on Ri T-DNA
transformed roots. New Phytol 108:211–218.
Blaszkowski J, Czerniawska B, Wubet T, Schäfer T, Buscot F, Renker C. 2008. Glomus irregulare, a new
arbuscular mycorrhizal fungus in the Glomeromycota. Mycotaxon 106:247–267.
Bonfante P, Genre A. 2010. Mechanisms underlying beneficial plant-fungus interactions in mycorrhizal
symbiosis. Nat Commun 1:48.
Cranenbrouck S, Voets LL, Bivort C, Renard L, Strullu DG, Declerck S. 2005. Methodologies for in vitro
cultivation of arbuscular mycorrhizal fungi with root organs. In: Declerck S, Strullu DG, Fortin JA, eds. In
vitro culture of mycorrhizas. Heidelberg, Garmany: Springer. p 341–375.
Declerck S, Strulla D, Plenchette C. 1996. In vitro mass production of the arbuscular mycorrhizal fungus,
Glomus versiforme, associated with Ri T-DNA transformed carrot roots. Mycol Res 100:1237–1242.
———, D'Or D, Cranenbrouck S, le Boulengé E. 2001. Modeling the sporulation dynamics of arbuscular
mycorrhizal fungi in monoxenic culture. Mycorrhiza 11:225–230.
———, ———, Bivort C, de Souza FA. 2004. Development of extraradical mycelium of Scutellospora
reticulata under root-organ culture: spore production and function of auxiliary cells. Mycol Res 108:84–
92.
———, Strullu DG, Fortin JA. 2005. In vitro culture of mycorrhizas. Berlin: Springer.
Diop TA, Bécard G, Piché Y. 1992. Long term in vitro culture of an endomycorrhizal fungus, Gigaspora
margarita, on Ri T-DNA transformed root of carrot. Symbiosis 12:249–259.

Ehinger MO, Croll D, Koch AM, Sanders IR. 2012. Significant genetic and phenotypic changes arising
from clonal growth of a single spore of an arbuscular mycorrhizal fungus over multiple generations. New
Phytol 196:853–861.
Fernández L, Silvani V, Bompadre J, Pérgola M, Godeas A. 2009. Transformed soybean (Glycine max)
roots as a tool for the study of the arbuscular mycorrhizal symbiosis. World J Microb Biot 25:1857–1863.
Fernández Bidondo L, Pérgola M, Silvani V, Colombo R, Bompadre J, Godeas A. 2012. Continuous and
long-term monoxenic culture of the arbuscular mycorrhizal fungus Gigaspora decipiens in root organ
culture. J Fun Biol 116:729–735.
Johnson RA, Wichern DW. 2001. Applied multivariate statistical analysis. 6th ed. Upper Saddle River,
New Jersey: Prentice Hall.
Hart M, Reader RJ. 2002. Host plant benefit from association with arbuscular mycorrhizal fungi:
variation due to differences in size of mycelium. Biol Fert Soils 36:357–366.
———,———. 2005. The role of the external mycelium in early colonization for three arbuscular
mycorrhizal fungal species with different colonization strategies. Pedobiologia 49:269–279
Helgason T, Daniell TJ, Husband R, Fitter AH, Young JPW. 1998. Ploughing up the wood-wide-web?
Nature 84:431.
Hewitt EJ. 1952. Sand water culture methods used in the study of plant nutrition. Commonw Agric
Bureau. Tech Comm 22.
Klironomos J, Hart M. 2002. Colonization of roots by arbuscular mycorrhizal fungi using different
sources of inoculum. Mycorrhiza 12:181–184.
Koch AM, Kuhn G, Fontanillas P, Fumagalli L, Goudet J, Sanders I. 2004. High genetic variability and
low local diversity in a population of arbuscular mycorrhizal fungi. P Nat A Sci 101:2369–2374.
Marsh B. 1971. Measurement of length in random arrangement of lines. J Appl Ecol 8:265.
Martin F, Gianinazzi-Pearson V, Hijri M, Lammers P, Requena N, Sanders IR, Sachar-Hill Y, Shapiro H,
Tuskan GA, Young JPW. 2008. The long, hard road to a completed Glomus intraradices genome. New
Phytol 180:747–750.
Munkvold L, Kjǿller R, Vestberg M, Rosendahl S, Jakobsen I. 2004. High functional diversity within
species of arbuscular mycorrhizal fungi. New Phytol 164:357–364.
Newman E. 1966. A method of estimating the total length of roots in a sample. J Appl Ecol 3:139–145.
Schalamuk S, Cabello M. 2010. Arbuscular mycorrhizal fungal propagules from tillage and no-tillage
systems: possible effects on Glomeromycota diversity. Mycologia 102:261–268.
Schüßler A, Walker C. 2010. The Glomeromycota. A species list with new families and new genera.
Arthur Schüßler, Christopher Walker, eds. Published in The Royal Botanic Garden Edinburgh, The Royal
Botanic Garden Kew, Botanische Staatssammlung Munich and Oregon State University.
Schwarzott D, Walker C, Schüßler A. 2001. Glomus, the largest genus of the arbuscular mycorrhizal
fungi (Glomales), is non-monophyletic. Mol Phylogen Evol 21:190–197.
Silvani V, Fracchia S, Fernández L, Pérgola M, Godeas A. 2008. A simple method to obtain endophytic
microorganism from field collected roots. Soil Biol Biochem 40:1259–1263.
Simon L, Lalonde M, Bruns TD. 1992. Specific amplification of 18S fungal ribosomal genes from VA
endomycorrhizal fungi colonizing roots. Appl Environ Microbiol 58:291–295.

Smith SE, Read DJ. 2008. Mycorrhizal symbiosis. Cambridge, UK: Academia Press.
St-Arnaud M, Hamel C, Vimard B, Caron M, Fortín JA. 1996. Enhanced hyphal growth and spore
production of the arbuscular mycorrhizal fungus Glomus intraradices in an in vitro system in the absence of
host roots. Mycol Res 100:328–332.
Zwietering MH, Jongenburger I, Rombouts FM, van t'Riet K. 1990. Modeling of the bacterial growth
curve. Appl Environ Microbiol 56:1875–1881.
LEGENDS
FIG.1. Neighbor-joining tree showing the phylogenetic positions of AM fungal isolates
within Rhizophagus clade (former Glomus group Ab) inferred from nrDNA SSU
sequences with Funneliformis mosseae as outgroup. GenBank accession numbers and
geographic origin (in parentheses) are provided. Values above branches have NJ
bootstrap values (1000 replicates). Bootstrap values below 50% are not shown.
FIG. 2. Production of extraradical mycelium and spores for each isolate associated with
transformed carrot roots grown in minimal medium. Each curve represented the
average values of extraradical hyphal length (cm) (filled circles) and the number of
spores (empty circles) in time (n = 5). Both curves were fitted with the Gompertz model
(solid line for mycelium curve or dotted line for sporulation curve).
FIG. 3. Discriminant analysis biplot showing patterns of distribution of AM fungal
isolates based on growth parameters (λ, μm, A) from the Gompertz model of extraradical
mycelium and spore production in monoxenic culture.
FOOTNOTES
Submitted 14 Apr 2013; accepted for publication 14 Apr 2013.
1Corresponding author. E-mail: [email protected]
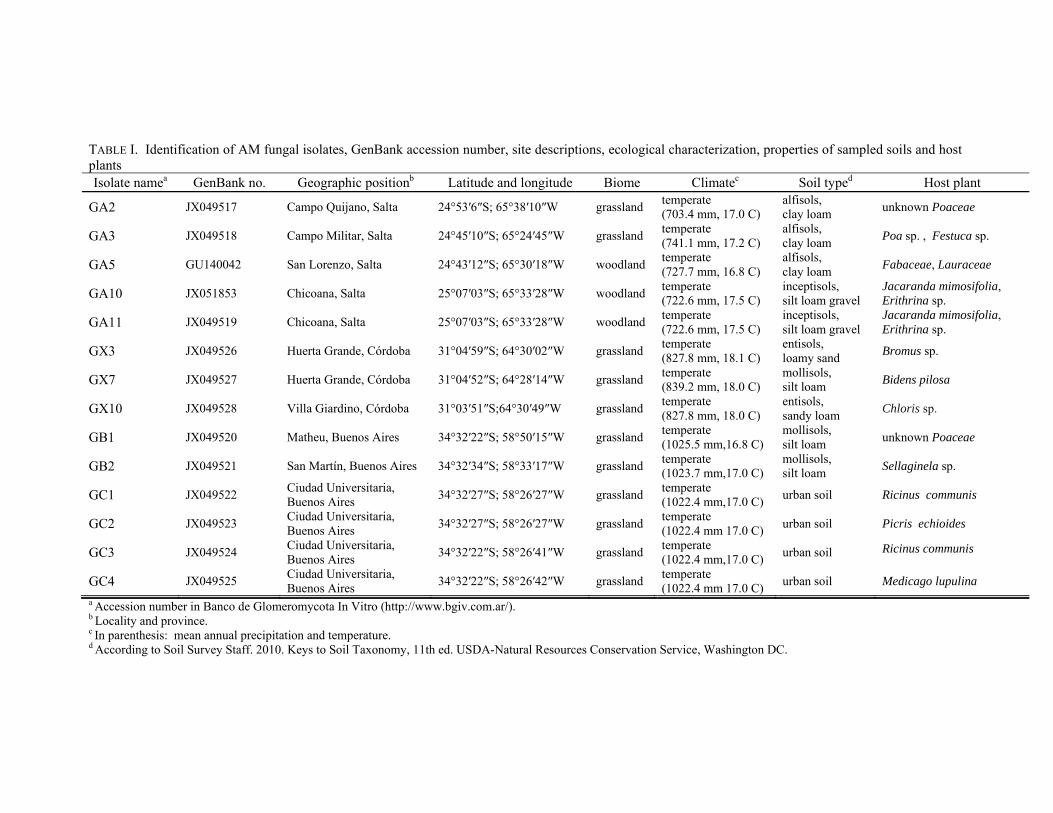
TABLE I. Identification of AM fungal isolates, GenBank accession number, site descriptions, ecological characterization, properties of sampled soils and host plants Isolate namea GenBank no. Geographic positionb Latitude and longitude Biome Climatec Soil typed Host plant
GA2 JX049517 Campo Quijano, Salta 24°53′6″S; 65°38′10″W grassland temperate (703.4 mm, 17.0 C)
alfisols, clay loam unknown Poaceae
GA3 JX049518 Campo Militar, Salta 24°45′10″S; 65°24′45″W grassland temperate (741.1 mm, 17.2 C)
alfisols, clay loam Poa sp. , Festuca sp.
GA5 GU140042 San Lorenzo, Salta 24°43′12″S; 65°30′18″W woodland temperate (727.7 mm, 16.8 C)
alfisols, clay loam Fabaceae, Lauraceae
GA10 JX051853 Chicoana, Salta 25°07′03″S; 65°33′28″W woodland temperate (722.6 mm, 17.5 C)
inceptisols, silt loam gravel
Jacaranda mimosifolia, Erithrina sp.
GA11 JX049519 Chicoana, Salta 25°07′03″S; 65°33′28″W woodland temperate (722.6 mm, 17.5 C)
inceptisols, silt loam gravel
Jacaranda mimosifolia, Erithrina sp.
GX3 JX049526 Huerta Grande, Córdoba 31°04′59″S; 64°30′02″W grassland temperate (827.8 mm, 18.1 C)
entisols, loamy sand Bromus sp.
GX7 JX049527 Huerta Grande, Córdoba 31°04′52″S; 64°28′14″W grassland temperate (839.2 mm, 18.0 C)
mollisols, silt loam Bidens pilosa
GX10 JX049528 Villa Giardino, Córdoba 31°03′51″S;64°30′49″W grassland temperate (827.8 mm, 18.0 C)
entisols, sandy loam Chloris sp.
GB1 JX049520 Matheu, Buenos Aires 34°32′22″S; 58°50′15″W grassland temperate (1025.5 mm,16.8 C)
mollisols, silt loam unknown Poaceae
GB2 JX049521 San Martín, Buenos Aires 34°32′34″S; 58°33′17″W grassland temperate (1023.7 mm,17.0 C)
mollisols, silt loam Sellaginela sp.
GC1 JX049522 Ciudad Universitaria, Buenos Aires 34°32′27″S; 58°26′27″W grassland temperate
(1022.4 mm,17.0 C) urban soil Ricinus communis
GC2 JX049523 Ciudad Universitaria, Buenos Aires 34°32′27″S; 58°26′27″W grassland temperate
(1022.4 mm 17.0 C) urban soil Picris echioides
GC3 JX049524 Ciudad Universitaria, Buenos Aires 34°32′22″S; 58°26′41″W grassland temperate
(1022.4 mm,17.0 C) urban soil Ricinus communis
GC4 JX049525 Ciudad Universitaria, Buenos Aires 34°32′22″S; 58°26′42″W grassland temperate
(1022.4 mm 17.0 C) urban soil Medicago lupulina a Accession number in Banco de Glomeromycota In Vitro (http://www.bgiv.com.ar/). b Locality and province. c In parenthesis: mean annual precipitation and temperature. d According to Soil Survey Staff. 2010. Keys to Soil Taxonomy, 11th ed. USDA-Natural Resources Conservation Service, Washington DC.

TABLE II. Parameters values (means ± SEM) of lag phase (λ), maximum growth rate (μm ) and maximum total growth (A) for extraradical mycelium (ERM) and spore production in 14 ‘Rhizophagus’ isolates derived from the Gompertz model, and frequency (F %) and intensity (I %) of transformed carrot root colonization by each isolate after 20 wk Isolate λ ERM (wk) λ spores (wk) μm ERM (cm week–1) μm spores (spores week–1) A ERM (cm) A spores (Nº spores) F (%) I (%)
GA2 1.7±0.2 b 5.5±0.2 b,c 741.8±2.8 e 147.2±1.4 b 2994.8±3.8 e 880.1±2.4 f,g 39.8±0.6 b,c 52.4±5.9 a
GA3 4.9±0.1 e 10.3±0.1 d 192.4±2.2 a,b 112.6±1.3 a,b 958.9±3.1 a,b 273.3±1.7 a 38.8±0.5 b,c 28.0±1.2 b
GA5 3.3±0.2 c,d 6.4±0.2 b,c,d 409.1±1.1 c,d 165.6±1.4 b 3075.4±5.0 e 836.0±2.9 f,g 45.5±3.6 d,e 45.5±0.6 a
GA10 5.2±0.1 e 6.6±0.2 b,c,d 143.3±1.3 a 103.5±0.9 a,b 820.9±2.9 a 636.9±2.7 d,e,f 27.4±0.5 a 52.5±1.3 a
GA11 0.7±0.1 a 4.2±0.1 a,b 243.0±1.5 a,b,c 183.9±1.9 b 1221.7±1.7 a,b 541.6±2.2 c,d,e 50.0±2.3 e 66.4±2.8 a
GX3 4.6±0.2 e 7.9±0.4 c,d 544.5±2.7 d 436.0±2.8 c 1815.9±4.2 c 1267.6± 2.5 h,i 45.2±1.4 d,e 60.3±2.0 a
GX7 2.1±0.2 b,c 3.7±0.2 a 275.5±1.4 a,b,c 85.1±0.7 a,b 2415.9±3.7 d 477.2±1.4 b,c,d 42.2±1.0 c,d 59.8±4.6 a
GX10 3.0±0.1 c,d 4.6±0.2 a,b 285.2±1.2 a,b,c 118.3±0.7 a,b 1096.5±3.0 a,b 985.2±2.6 g,h 61.8±1.2 f 57.1±1.6 a
GB1 3.6±0.2 d 3.5±0.2 a 618.5±4.1 d,e 166.0±2.0 b 1334.0±3.3 b 386.6±1.8 b,c 45.3.6±0.6 d,e 66.7±1.0 a
GB2 5.0±0.2 e 6.5±0.2 b,c,d 448.9±2.9 c,d 66.6±1.1 a 2026.4±4.9 c,d 315.6±1.9 a,b 40.8±0.5 b,c,d 53.1±6.0 a
GC1 2.1±0.1 b,c 3.3±0.1 a 215.9±1.3 a,b 171.1±1.2 b 1013.4±1.6 a,b 699.4±1.8 e,f,g 36.6±0.4 b 52.4±4.6 a
GC2 1.4±0.2 a,b 4.9±0.2 a,b 639.7±2.8 d,e 106.7±1.5 a,b 5776.6±5.2 g 918.0±3.0 g,h 39.8±0.7 b,c 58.4±2.6 a
GC3 3.9±0.1 d,e 4.1±0.2 a,b 784.6±3.5 e 162.5±1.3 b 3662.1±3.7 f 1848.2±5.0 i 48.2±1.0 e 54.3±4.5 a
GC4 2.5±0.2 b,c 5.2±0.2 b,c 438.2±2.8 c,d 130.0±1.5 a,b 969.6±2.3 a,b 340.8±1.5 a,b 36.4.8±2.1 b 49.3±2.5 a
Values followed by the same letter within the same column are not significantly different (P < 0.05).