short - term natural gas outlook national association of state energy officials state heating oil...
TRANSCRIPT

SHORT - TERMSHORT - TERMNATURAL GAS OUTLOOKNATURAL GAS OUTLOOK
National Association ofState Energy Officials
State Heating Oil and Propane ConferenceAugust 7, 2006
Barbara Mariner-Volpe,Energy Information Administration (EIA)[email protected]
www.eia.doe.gov

FACTORS AFFECTING GAS FACTORS AFFECTING GAS MARKET OUTLOOKMARKET OUTLOOK
• Returns to drilling; Recovery from hurricanes • Weather• Economic Growth• Demand robustness/destruction/switching• International markets
pipeline and lng supplies
world oil market/prices

Wellhead Natural Gas Prices, 1990-2007
0.00
1.00
2.00
3.00
4.00
5.00
6.00
7.00
8.00
Year
Do
llars
per
Th
ou
san
d C
ub
ic F
eet
History
Proj.
Source: EIA Short-Term Energy Outlook, July 2006
Wellhead Natural Gas Prices, 1990-2007

$0
$2
$4
$6
$8
$10
$12
$14
Ja
n-9
9
Au
g-9
9
Ma
r-0
0
No
v-0
0
Ma
y-0
1
De
c-0
1
Ju
l-0
2
Fe
b-0
3
Se
p-0
3
Ma
y-0
4
De
c-0
4
Ju
l-0
5
Ma
r-0
6
Pri
ce (
Do
llar
s p
er M
MB
tu)
0
200
400
600
800
1000
1200
1400
Nu
mb
er o
f R
igs
Number of Rigs Drillingfor Natural Gas
Weekly Henry Hub Spot
Source: Natural Gas Intelligence Weekly Gas Price Index, Baker-Hughes Weekly US Rig Report.
Gas Prices Have Led to Gas Prices Have Led to Record-High Drilling Rates Record-High Drilling Rates
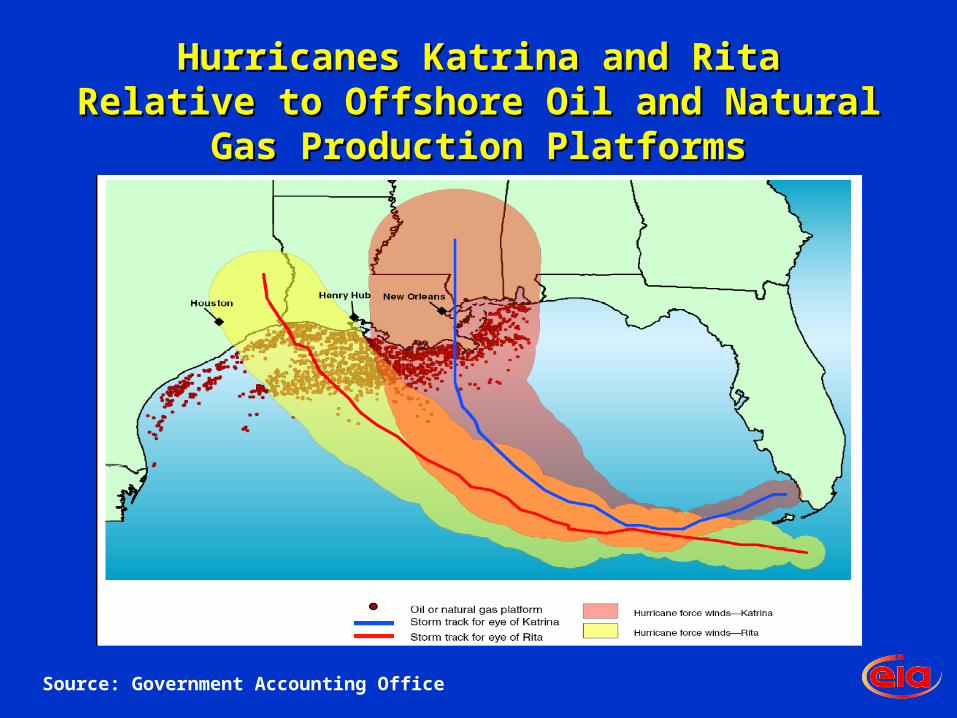
Hurricanes Katrina and RitaHurricanes Katrina and RitaRelative to Offshore Oil and Natural Gas Relative to Offshore Oil and Natural Gas
Production PlatformsProduction Platforms
Source: Government Accounting Office

Production was reduced 800 Bcf as a result Production was reduced 800 Bcf as a result of 2005 Hurricanesof 2005 Hurricanes
Source: MMS; Ocean Warwick
Production was reduced 800 Bcf as
a result of 2005 Hurricanes

Contiguous U.S. LNG Import TerminalsContiguous U.S. LNG Import Terminals
Everett Import Facility - Massachusetts3.5 Billion Cubic Feet Storage Capacity715 Million Cubic Feet per day Vapor.100 Million Cubic Feet per day by Truck
Lake Charles LNG Import Facility - Louisiana9 Billion Cubic Feet Capacity2.1 Billion Cubic Feet per day Vaporization(Expansion complete)
Elba Island LNG Import Facility - Georgia7.3 Billion Cubic Feet Storage Capacity1.2 Billion Cubic Feet per day Vaporization(Expansion completed)
Cove Point LNG Facility - Maryland7.8 Billion Cubic Feet Storage Capacity1 Billion Cubic Feet per day Vaporization(Expansion underway)
Excelerate Energy Bridge No Storage Capacity500 Million Cubic Feet per day
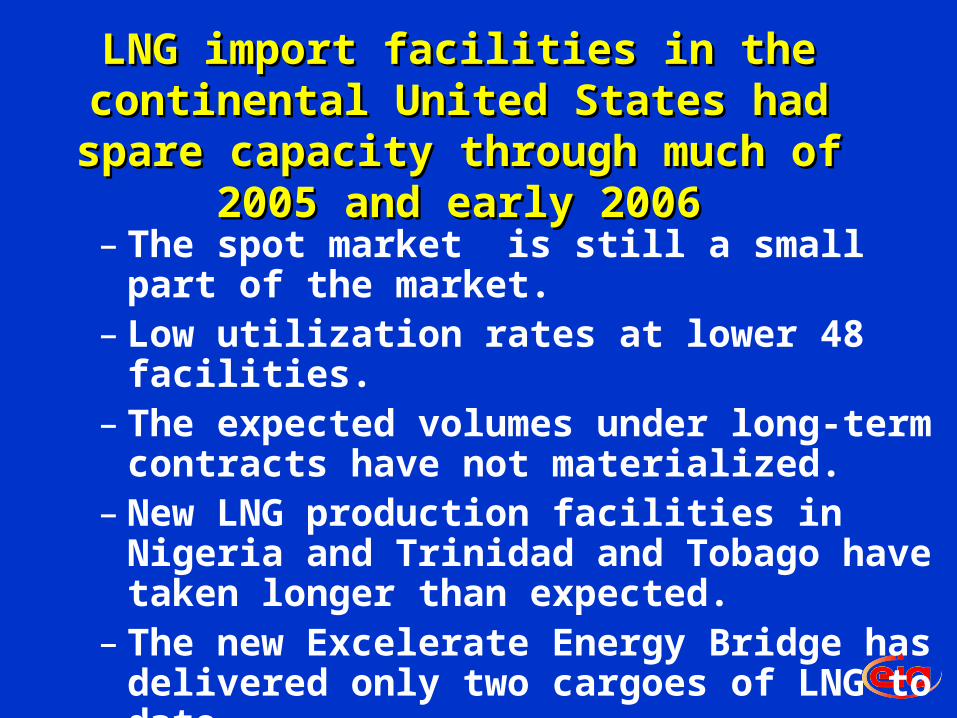
LNG import facilities in the continental LNG import facilities in the continental United States had spare capacity United States had spare capacity
through much of 2005 and early 2006through much of 2005 and early 2006– The spot market is still a small part of the
market. – Low utilization rates at lower 48 facilities. – The expected volumes under long-term
contracts have not materialized.– New LNG production facilities in Nigeria and
Trinidad and Tobago have taken longer than expected.
– The new Excelerate Energy Bridge has delivered only two cargoes of LNG to date.

Production Recovering From Hurricane Production Recovering From Hurricane Loss in 2005Loss in 2005
17.818.1
18.818.6
18.8 18.819.0
18.8
19.2
19.6
18.919.1
18.818.6
18.418.2
15
16
17
18
19
20
1992
1993
1994
1995
1996
1997
1998
1999
2000
2001
2002
2003
2004
2005
2006
2007
TC
F
Sources: EIA, Short-Term Energy Outlook, July 2006
Projections

0
500
1,000
1,500
2,000
2,500
3,000
3,500
4,000
4,500
5,000
1998 1999 2000 2001 2002 2003 2004 2005 2006 2007
Bill
ion
Cu
bic
Fee
t
Pipeline LNG
Projection
Sources: History: EIA; Projections: Short-Term Energy Outlook, July 2006.
Imports are Expected to Increase in 2007Imports are Expected to Increase in 2007
LNG Imports:2005: 630 Bcf2006: 760 Bcf2007: 1000 Bcf
Imports are Expected to Increase in 2007

0
500
1,000
1,500
2,000
2,500
3,000
3,500
4,000
Jan-04Apr-0
4Jul-04
Oct-04
Jan-05Apr-0
5Jul-05
Oct-05
Jan-06Apr-0
6Jul-06
Oct-06
Jan-07Apr-0
7Jul-07
Oct-07
Natural Gas Stocks Are Well Above Natural Gas Stocks Are Well Above Five-Year AverageFive-Year Average
Source: Short-Term Energy Outlook, July 2006
Projection5-Year Range
The blue area represents the minimum and maximum range of historical gas storage levels during the years 2000-2004.
The red line represents actual storage from Jan 2004 to May 2006 and projected storage from May 2006 through December 2007

0
2
4
6
8
10
12
14
16
18
Jan-02 Jan-03 Jan-04 Jan-05 Jan-06 Jan-07 Jan-08
Forecast
Dollars per
thousand cubic feet
Natural Gas Henry Hub Spot PricesNatural Gas Henry Hub Spot Prices(Base Case and 95% Confidence Interval*)(Base Case and 95% Confidence Interval*)
*The confidence intervals show +/- 2 standard errors based on the properties of the model. The ranges do not include the effects of major supply disruptions.Sources: History: Natural Gas Week; Projections: Short-Term Energy Outlook, July 2006.
Natural Gas Henry Hub Spot Prices(Base Case and 95%
Confidence Interval*)

Natural Gas Spot &Natural Gas Spot &West Texas Intermediate Crude Oil PricesWest Texas Intermediate Crude Oil Prices
Sources: EIA Short Term Energy Outlook Jnly2006
History Forecast
WTI Crude Oil
Henry HubNatural Gas

-0.8
-0.6
-0.4
-0.2
0.0
0.2
0.4
0.6
0.8
1.0
2005 2006 2007
Residential Commercial Industrial Electric Power* Total
ProjectionsHistory
Sources: History: EIA; Projections: Short-Term Energy Outlook, July 2006.
* Gas used for electricity generation
AFTER DECREASING IN 2005 and 2006, GAS CONSUMPTION AFTER DECREASING IN 2005 and 2006, GAS CONSUMPTION IS EXPECTED TO INCREASE IN 2007IS EXPECTED TO INCREASE IN 2007
Annual Percent Change in
Total Natural Gas Demand
2005 -2.23%
2006 -1.64%
2007 4.22%Ch
ang
e in
Nat
ura
l G
as C
on
sum
pti
on
(tri
llio
n c
ub
ic f
eet)
AFTER DECREASING IN
2005 and 2006, GAS CONSUMPTION IS
EXPECTED TO INCREASE IN 2007

Residential Sector Expenditures During The Heating Season, 2001-2007 (Billion Dollars)
0.00
5.00
10.00
15.00
20.00
25.00
30.00
35.00
40.00
45.00
50.00
2001-2002 2002-2003 2003-2004 2004-2005 2005-2006 2006-2007
History Forecast

Natural Gas Prices to Electric Generators Natural Gas Prices to Electric Generators Fell in 2006 Relative to Oil PricesFell in 2006 Relative to Oil Prices
$0
$2
$4
$6
$8
$10
$12
$14
Ja
n-0
0
Ma
y-0
0
Se
p-0
0
Ja
n-0
1
Ma
y-0
1
Se
p-0
1
Ja
n-0
2
Ma
y-0
2
Se
p-0
2
Ja
n-0
3
Ma
y-0
3
Se
p-0
3
Ja
n-0
4
Ma
y-0
4
Se
p-0
4
Ja
n-0
5
Ma
y-0
5
Se
p-0
5
Ja
n-0
6
Ma
y-0
6
Se
p-0
6
Ja
n-0
7
Ma
y-0
7
Se
p-0
7
Do
llar
s p
er M
illi
on
Btu
Source: Short-Term Energy Outlook, July 2006.
The decline in natural gas prices reflects some easing of market tightness while petroleum product prices have been high because of global market conditions.
Delivered price to electric generators for residual fuel oil and natural gas
History Projection
Residual Fuel Oil Price
Natural Gas Price

To Sum Up:
EIA expects no significant relief in gas market tightness through 2007.
To Sum Up:

Recent Natural Gas Reports
www.eia.doe.gov
-Natural Gas Processing: The Crucial Link Between Natural Gas Production and Its Transportation To Market
-Overview of the Federal Offshore Royalty Relief Program
- Impact of the 2005 Hurricanes on the Natural Gas Industry in the Gulf of Mexico Region
Watch for upcoming reports on storage and pipeline infrastructure!
Recent Natural Gas Reports