short-term investing for corporations idaho association for financial professionals may 13, 2008...
TRANSCRIPT
Short-term Investing for Corporations
Idaho Association for Financial ProfessionalsMay 13, 2008
Rick Sabones, Director, Global Liquidity & Investments, Citi
2
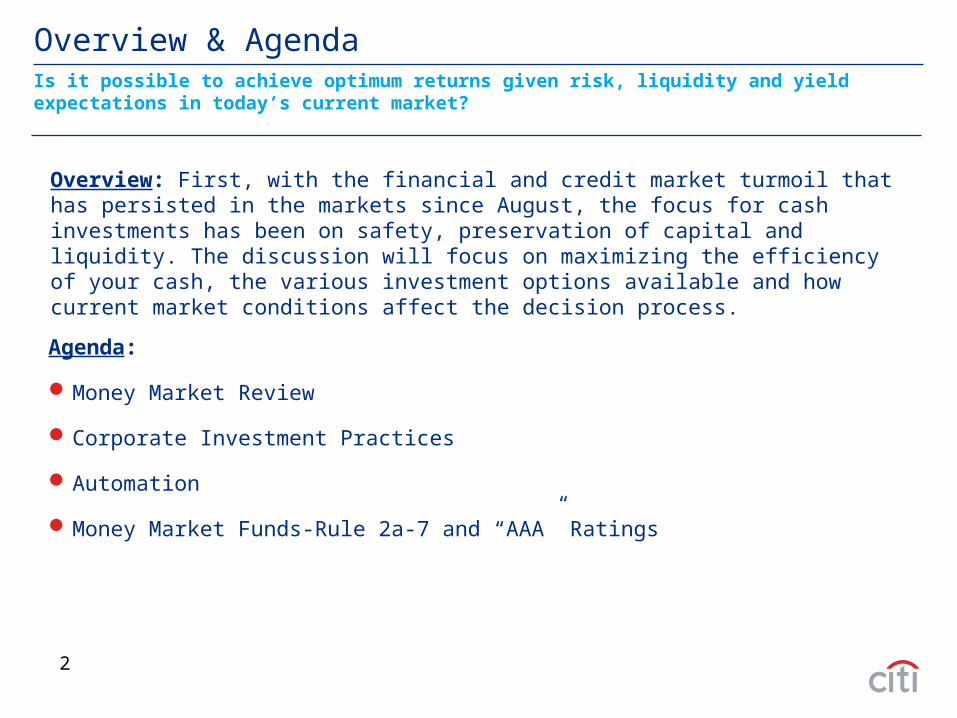
Overview & Agenda
Agenda:
Money Market Review
Corporate Investment Practices
Automation
Money Market Funds-Rule 2a-7 and “AAA” Ratings
Is it possible to achieve optimum returns given risk, liquidity and yield expectations in today’s current market?
Overview: First, with the financial and credit market turmoil that has persisted in the markets since August, the focus for cash investments has been on safety, preservation of capital and liquidity. The discussion will focus on maximizing the efficiency of your cash, the various investment options available and how current market conditions affect the decision process.
3
Money Market Review
4
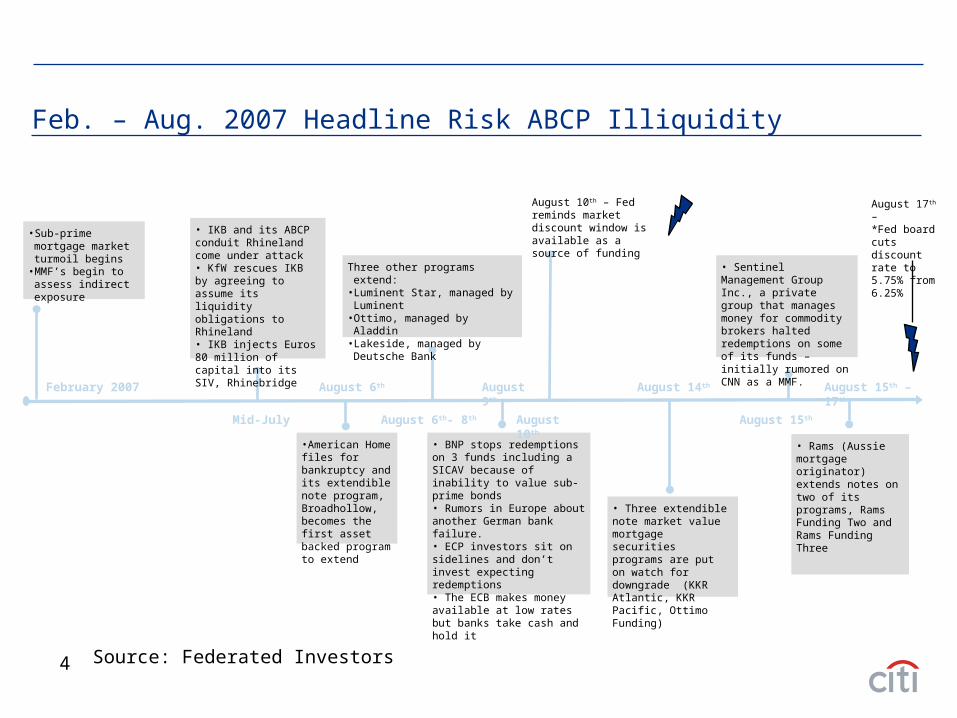
Feb. – Aug. 2007 Headline Risk ABCP Illiquidity
February 2007
Mid-July
August 9th
• Sub-prime mortgage market turmoil begins
• MMF’s begin to assess indirect exposure
• IKB and its ABCP conduit Rhineland come under attack • KfW rescues IKB by agreeing to assume its liquidity obligations to Rhineland• IKB injects Euros 80 million of capital into its SIV, Rhinebridge
August 6th- 8th
•American Home files for bankruptcy and its extendible note program, Broadhollow, becomes the first asset backed program to extend
August 6th
Three other programs extend:• Luminent Star, managed by
Luminent• Ottimo, managed by Aladdin• Lakeside, managed by Deutsche
Bank
• BNP stops redemptions on 3 funds including a SICAV because of inability to value sub-prime bonds• Rumors in Europe about another German bank failure.• ECP investors sit on sidelines and don’t invest expecting redemptions• The ECB makes money available at low rates but banks take cash and hold it
• Three extendible note market value mortgage securities programs are put on watch for downgrade (KKR Atlantic, KKR Pacific, Ottimo Funding)
• Rams (Aussie mortgage originator) extends notes on two of its programs, Rams Funding Two and Rams Funding Three
August 15th
August 14th August 15th – 17th
August 10th – Fed reminds market discount window is available as a source of funding
August 17th – *Fed board cuts discount rate to 5.75% from 6.25%
• Sentinel Management Group Inc., a private group that manages money for commodity brokers halted redemptions on some of its funds – initially rumored on CNN as a MMF.
August 10th
Source: Federated Investors
5
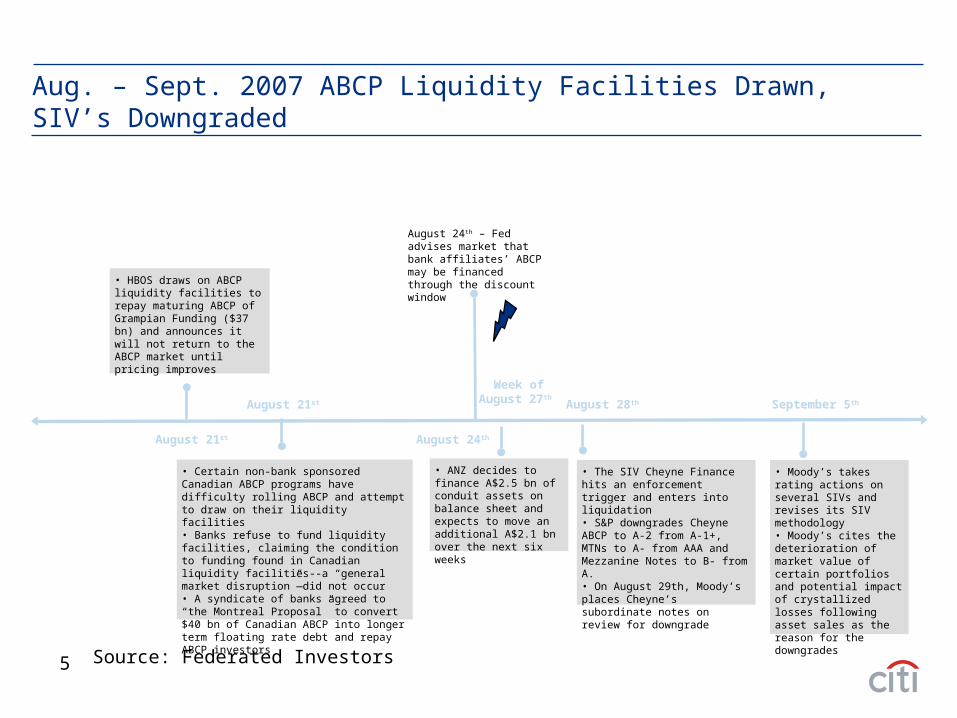
Aug. – Sept. 2007 ABCP Liquidity Facilities Drawn, SIV’s Downgraded
August 21st
Week of August 27th
• HBOS draws on ABCP liquidity facilities to repay maturing ABCP of Grampian Funding ($37 bn) and announces it will not return to the ABCP market until pricing improves
August 24th
• Certain non-bank sponsored Canadian ABCP programs have difficulty rolling ABCP and attempt to draw on their liquidity facilities • Banks refuse to fund liquidity facilities, claiming the condition to funding found in Canadian liquidity facilities--a “general market disruption”—did not occur• A syndicate of banks agreed to “the Montreal Proposal” to convert $40 bn of Canadian ABCP into longer term floating rate debt and repay ABCP investors
August 21st
• The SIV Cheyne Finance hits an enforcement trigger and enters into liquidation• S&P downgrades Cheyne ABCP to A-2 from A-1+, MTNs to A- from AAA and Mezzanine Notes to B- from A. • On August 29th, Moody’s places Cheyne’s subordinate notes on review for downgrade
August 24th – Fed advises market that bank affiliates’ ABCP may be financed through the discount window
September 5th
• Moody’s takes rating actions on several SIVs and revises its SIV methodology• Moody’s cites the deterioration of market value of certain portfolios and potential impact of crystallized losses following asset sales as the reason for the downgrades
• ANZ decides to finance A$2.5 bn of conduit assets on balance sheet and expects to move an additional A$2.1 bn over the next six weeks
August 28th
Source: Federated Investors
6
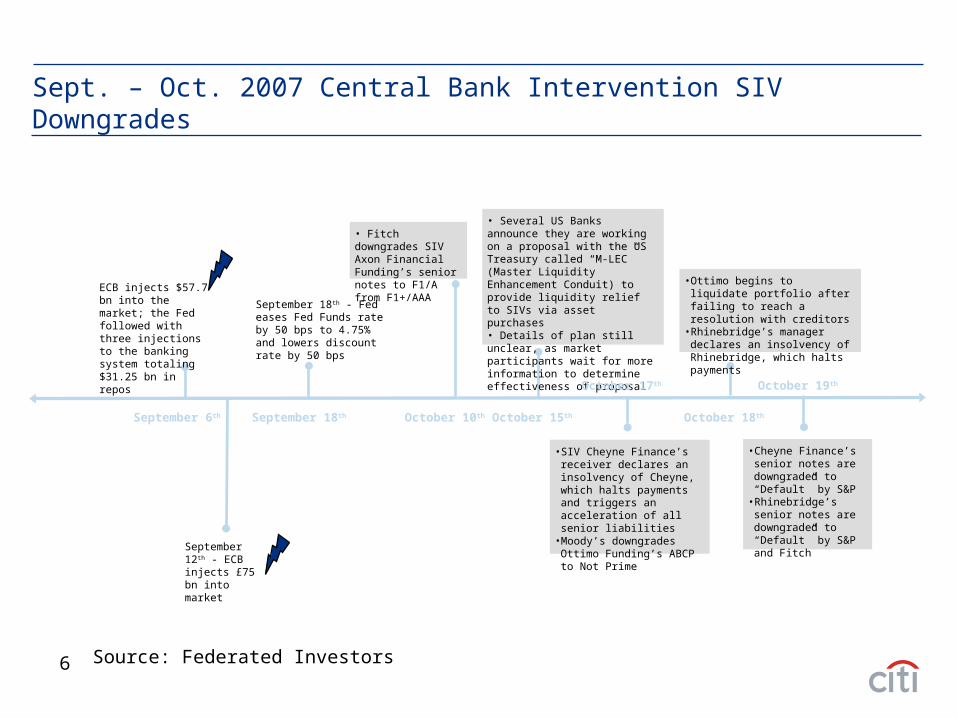
Sept. – Oct. 2007 Central Bank Intervention SIV Downgrades
September 18th September 6th
ECB injects $57.7 bn into the market; the Fed followed with three injections to the banking system totaling $31.25 bn in repos
September 12th - ECB injects £75 bn into market
September 18th - Fed eases Fed Funds rate by 50 bps to 4.75% and lowers discount rate by 50 bps
October 15th
• Several US Banks announce they are working on a proposal with the US Treasury called “M-LEC” (Master Liquidity Enhancement Conduit) to provide liquidity relief to SIVs via asset purchases • Details of plan still unclear, as market participants wait for more information to determine effectiveness of proposal
October 17th
• SIV Cheyne Finance’s receiver declares an insolvency of Cheyne, which halts payments and triggers an acceleration of all senior liabilities
• Moody’s downgrades Ottimo Funding’s ABCP to Not Prime
October 18th
• Ottimo begins to liquidate portfolio after failing to reach a resolution with creditors
• Rhinebridge’s manager declares an insolvency of Rhinebridge, which halts payments
October 19th
• Cheyne Finance’s senior notes are downgraded to “Default” by S&P
• Rhinebridge’s senior notes are downgraded to “Default” by S&P and Fitch
October 10th
• Fitch downgrades SIV Axon Financial Funding’s senior notes to F1/A from F1+/AAA
Source: Federated Investors
7
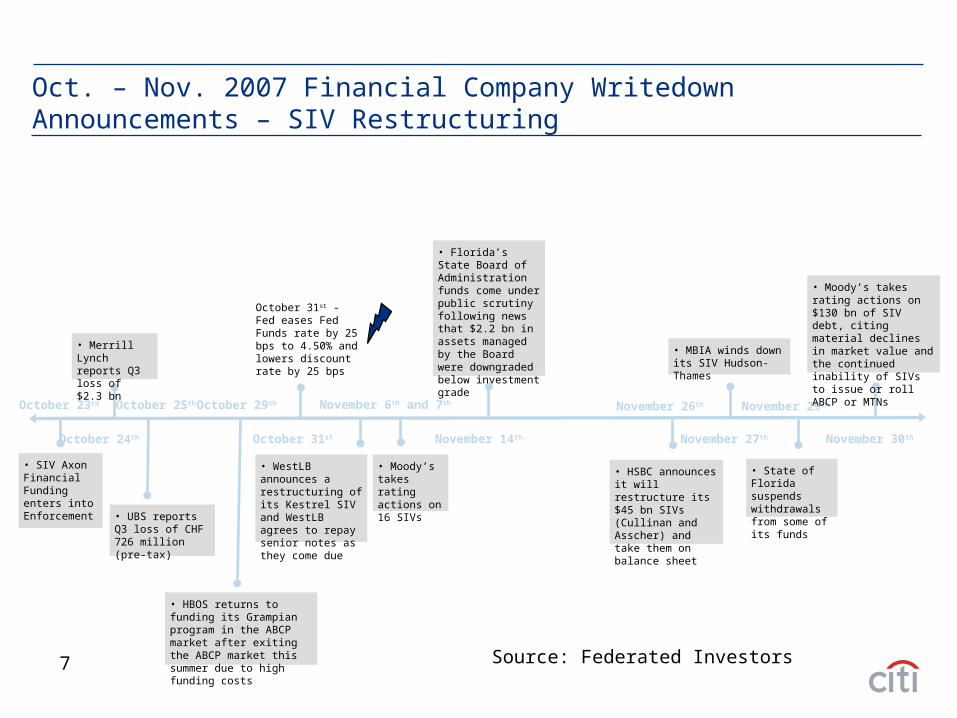
Oct. – Nov. 2007 Financial Company Writedown Announcements – SIV Restructuring
October 29th October 25th
October 31st
October 23rd
• SIV Axon Financial Funding enters into Enforcement
October 31st - Fed eases Fed Funds rate by 25 bps to 4.50% and lowers discount rate by 25 bps
• UBS reports Q3 loss of CHF 726 million (pre-tax)
• HBOS returns to funding its Grampian program in the ABCP market after exiting the ABCP market this summer due to high funding costs
November 6th and 7th
• Moody’s takes rating actions on 16 SIVs
November 14th
• Florida’s State Board of Administration funds come under public scrutiny following news that $2.2 bn in assets managed by the Board were downgraded below investment grade
November 26th
• HSBC announces it will restructure its $45 bn SIVs (Cullinan and Asscher) and take them on balance sheet
November 27th
• MBIA winds down its SIV Hudson-Thames
November 29th
• State of Florida suspends withdrawals from some of its funds
November 30th
• Moody’s takes rating actions on $130 bn of SIV debt, citing material declines in market value and the continued inability of SIVs to issue or roll ABCP or MTNs
• WestLB announces a restructuring of its Kestrel SIV and WestLB agrees to repay senior notes as they come due
October 24th
• Merrill Lynch reports Q3 loss of $2.3 bn
Source: Federated Investors
8
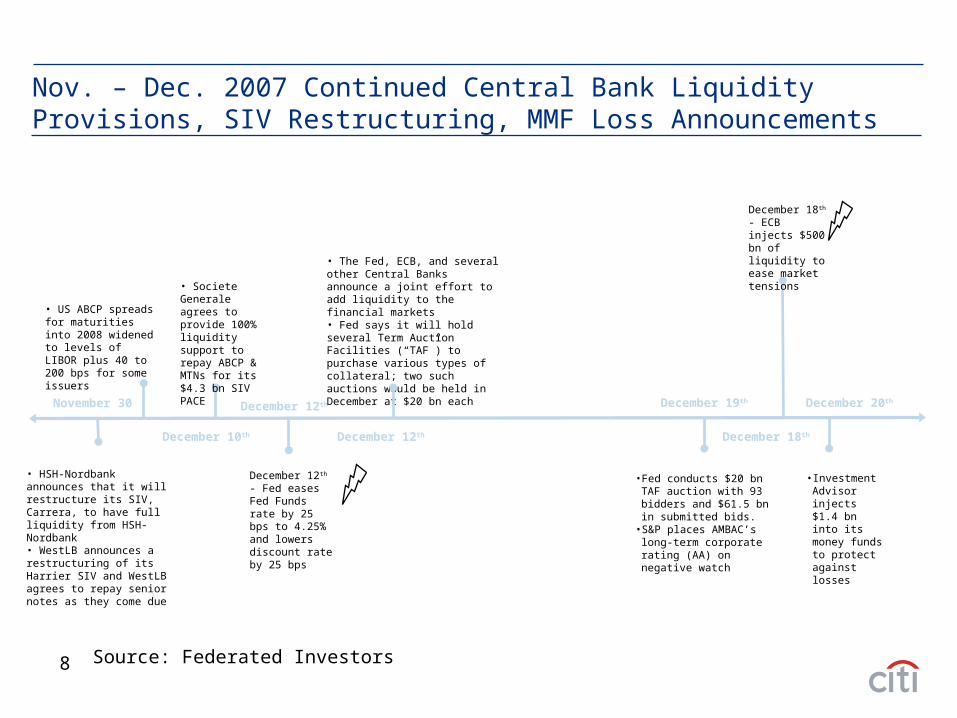
Nov. – Dec. 2007 Continued Central Bank Liquidity Provisions, SIV Restructuring, MMF Loss Announcements
December 10th
November 30
• HSH-Nordbank announces that it will restructure its SIV, Carrera, to have full liquidity from HSH-Nordbank• WestLB announces a restructuring of its Harrier SIV and WestLB agrees to repay senior notes as they come due
December 12th December 19th
• Fed conducts $20 bn TAF auction with 93 bidders and $61.5 bn in submitted bids.
• S&P places AMBAC’s long-term corporate rating (AA) on negative watch
December 12th
• The Fed, ECB, and several other Central Banks announce a joint effort to add liquidity to the financial markets• Fed says it will hold several Term Auction Facilities (“TAF”) to purchase various types of collateral; two such auctions would be held in December at $20 bn each
• Societe Generale agrees to provide 100% liquidity support to repay ABCP & MTNs for its $4.3 bn SIV PACE
December 12th - Fed eases Fed Funds rate by 25 bps to 4.25% and lowers discount rate by 25 bps
December 18th - ECB injects $500 bn of liquidity to ease market tensions
December 20th
• Investment Advisor injects $1.4 bn into its money funds to protect against losses
• US ABCP spreads for maturities into 2008 widened to levels of LIBOR plus 40 to 200 bps for some issuers
December 18th
Source: Federated Investors
9
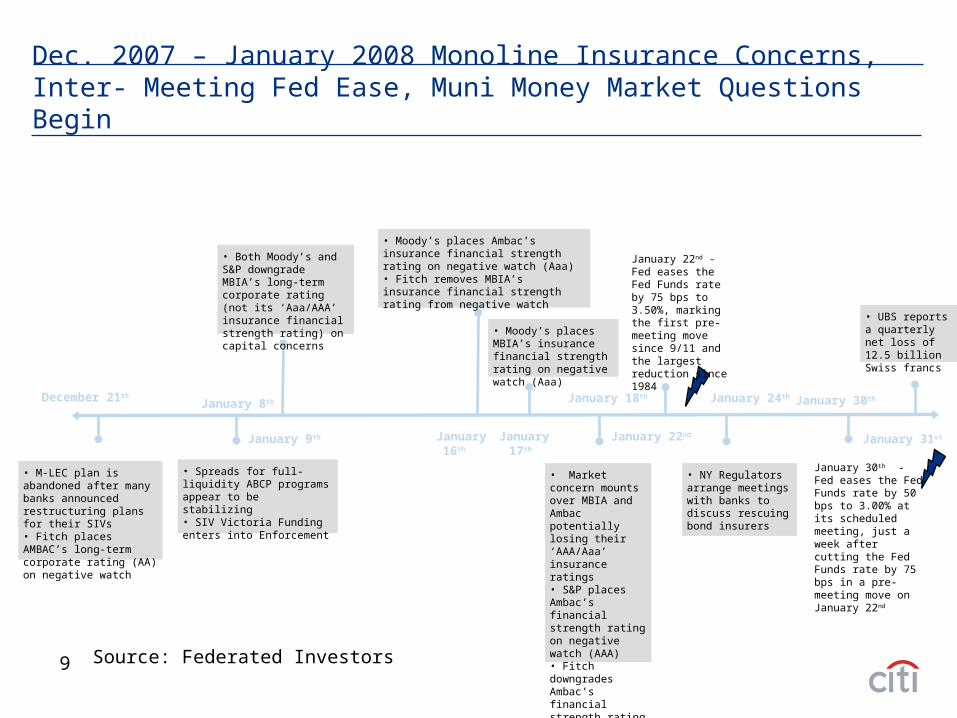
Dec. 2007 – January 2008 Monoline Insurance Concerns, Inter- Meeting Fed Ease, Muni Money Market Questions Begin
December 21st January 8th
• Spreads for full-liquidity ABCP programs appear to be stabilizing • SIV Victoria Funding enters into Enforcement
• M-LEC plan is abandoned after many banks announced restructuring plans for their SIVs• Fitch places AMBAC’s long-term corporate rating (AA) on negative watch
• Both Moody’s and S&P downgrade MBIA’s long-term corporate rating (not its ‘Aaa/AAA’ insurance financial strength rating) on capital concerns
January 9th January 22nd
January 22nd - Fed eases the Fed Funds rate by 75 bps to 3.50%, marking the first pre-meeting move since 9/11 and the largest reduction since 1984
• NY Regulators arrange meetings with banks to discuss rescuing bond insurers
January 24th
• Moody’s places Ambac’s insurance financial strength rating on negative watch (Aaa) • Fitch removes MBIA’s insurance financial strength rating from negative watch
January 16th
• Market concern mounts over MBIA and Ambac potentially losing their ‘AAA/Aaa’ insurance ratings• S&P places Ambac’s financial strength rating on negative watch (AAA)• Fitch downgrades Ambac’s financial strength rating to AA
January 18th
• Moody’s places MBIA’s insurance financial strength rating on negative watch (Aaa)
January 17th
January 30th
January 31st
• UBS reports a quarterly net loss of 12.5 billion Swiss francs
January 30th - Fed eases the Fed Funds rate by 50 bps to 3.00% at its scheduled meeting, just a week after cutting the Fed Funds rate by 75 bps in a pre-meeting move on January 22nd
Source: Federated Investors
10
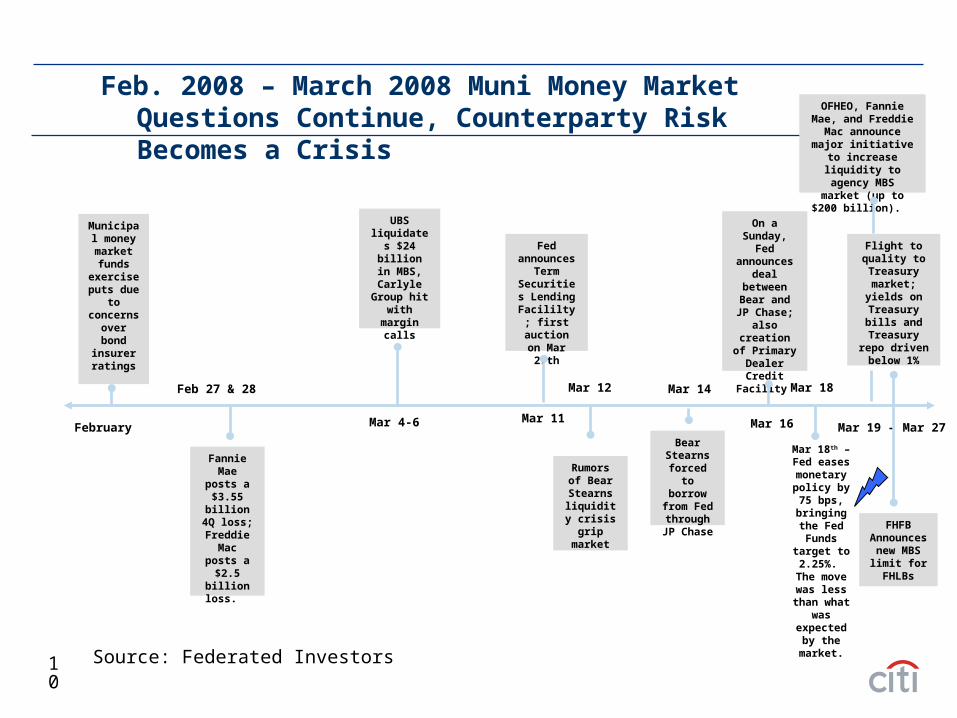
Feb. 2008 – March 2008 Muni Money Market Questions Continue, Counterparty Risk Becomes a Crisis
Municipal money market funds
exercise puts due
to concerns
over bond
insurer ratings
Fannie Mae posts
a $3.55 billion 4Q
loss; Freddie
Mac posts a $2.5 billion loss.
UBS liquidates $24 billion
in MBS, Carlyle
Group hit with margin
calls
Bear Stearns
forced to borrow
from Fed through
JP Chase
On a Sunday, Fed announces
deal between
Bear and JP Chase; also creation of
Primary Dealer Credit
Facility
Fed announces
Term Securities Lending Facililty;
first auction on Mar 27th
Mar 18th – Fed eases monetary
policy by 75 bps,
bringing the Fed Funds target to
2.25%. The move was less than what was
expected by the market.
Mar 4-6 Mar 11
Mar 14
Rumors of Bear
Stearns liquidity
crisis grip market
Mar 12
Mar 16
Mar 18
Mar 19 – Mar 27
Flight to quality to Treasury
market; yields on Treasury
bills and Treasury repo driven below
1%
OFHEO, Fannie Mae, and Freddie Mac announce major
initiative to increase liquidity to agency MBS market (up to
$200 billion).
FHFBAnnounces new MBS limit for FHLBs
February
Feb 27 & 28
Source: Federated Investors
11
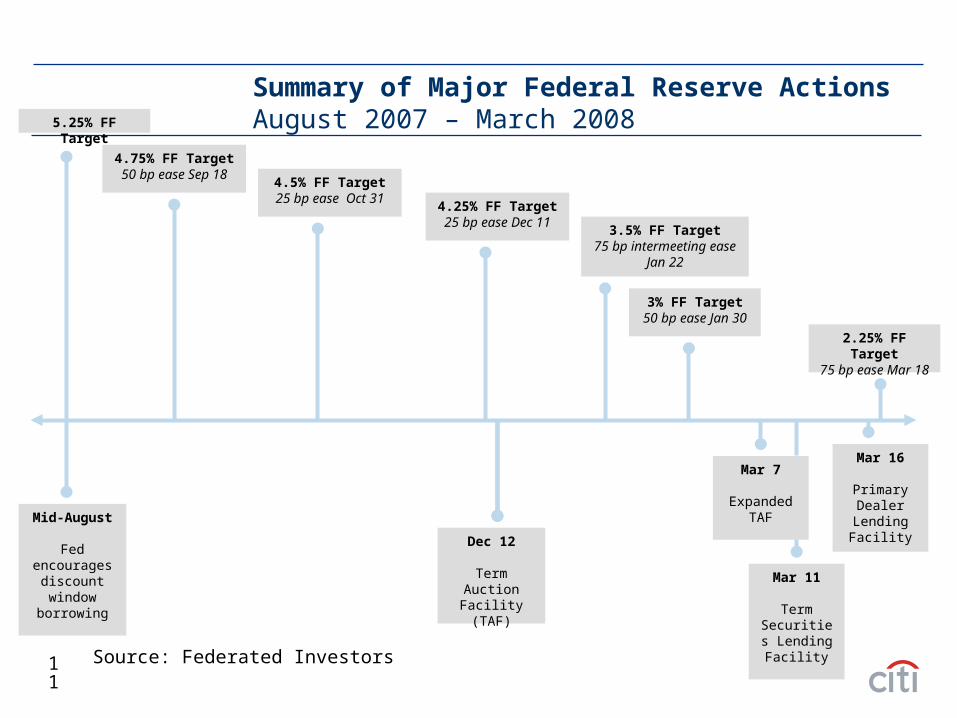
2.25% FF Target75 bp ease Mar 18
4.75% FF Target50 bp ease Sep 18
4.5% FF Target25 bp ease Oct 31
4.25% FF Target25 bp ease Dec 11
3.5% FF Target75 bp intermeeting ease
Jan 22
3% FF Target50 bp ease Jan 30
5.25% FF Target
Mid-August
Fed encourages
discount window
borrowing
Dec 12
Term Auction Facility (TAF)
Mar 7
Expanded TAF
Mar 11
Term Securities Lending Facility
Mar 16
Primary Dealer
Lending Facility
Summary of Major Federal Reserve ActionsAugust 2007 – March 2008
Source: Federated Investors
12
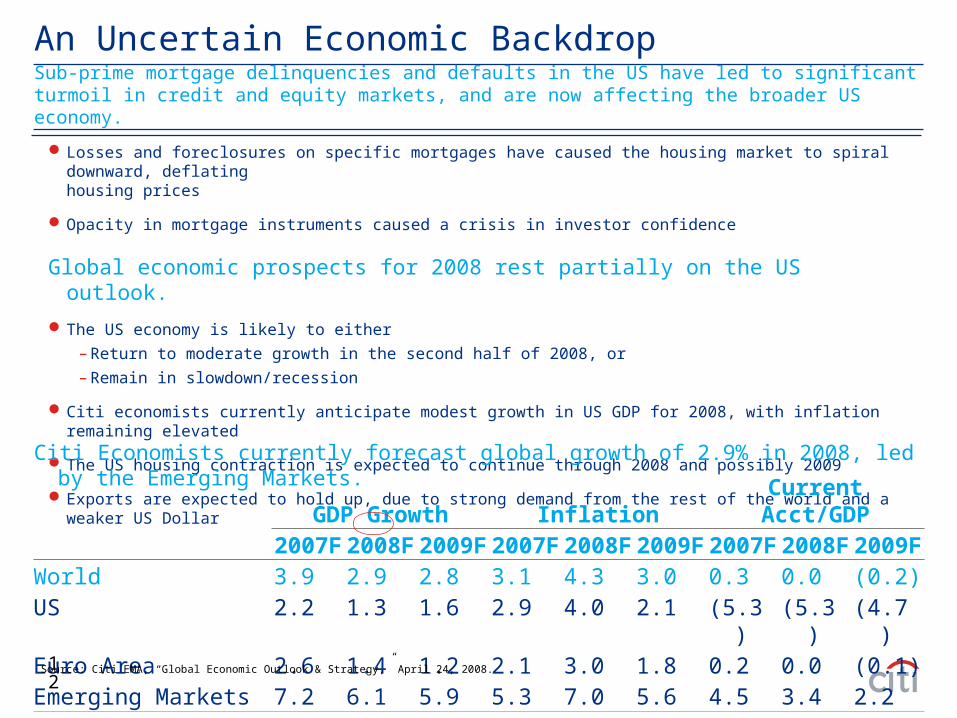
Losses and foreclosures on specific mortgages have caused the housing market to spiral downward, deflating housing prices
Opacity in mortgage instruments caused a crisis in investor confidence
Global economic prospects for 2008 rest partially on the US outlook.
The US economy is likely to either
– Return to moderate growth in the second half of 2008, or
– Remain in slowdown/recession
Citi economists currently anticipate modest growth in US GDP for 2008, with inflation remaining elevated
The US housing contraction is expected to continue through 2008 and possibly 2009
Exports are expected to hold up, due to strong demand from the rest of the world and a weaker US Dollar
An Uncertain Economic Backdrop
Citi Economists currently forecast global growth of 2.9% in 2008, led by the Emerging Markets.
GDP Growth Inflation Current Acct/GDP2007F 2008F 2009F 2007F 2008F 2009F 2007F 2008F 2009F
World 3.9 2.9 2.8 3.1 4.3 3.0 0.3 0.0 (0.2)US 2.2 1.3 1.6 2.9 4.0 2.1 (5.3) (5.3) (4.7)Euro Area 2.6 1.4 1.2 2.1 3.0 1.8 0.2 0.0 (0.1)Emerging Markets 7.2 6.1 5.9 5.3 7.0 5.6 4.5 3.4 2.2
Source: Citi EMA, “Global Economic Outlook & Strategy,” April 24, 2008.
Sub-prime mortgage delinquencies and defaults in the US have led to significant turmoil in credit and equity markets, and are now affecting the broader US economy.
13
$5.00$5.40 $5.25
$4.70
$0.0
$1.0
$2.0
$3.0
$4.0
$5.0
$6.0
2004 2005 2006 2007
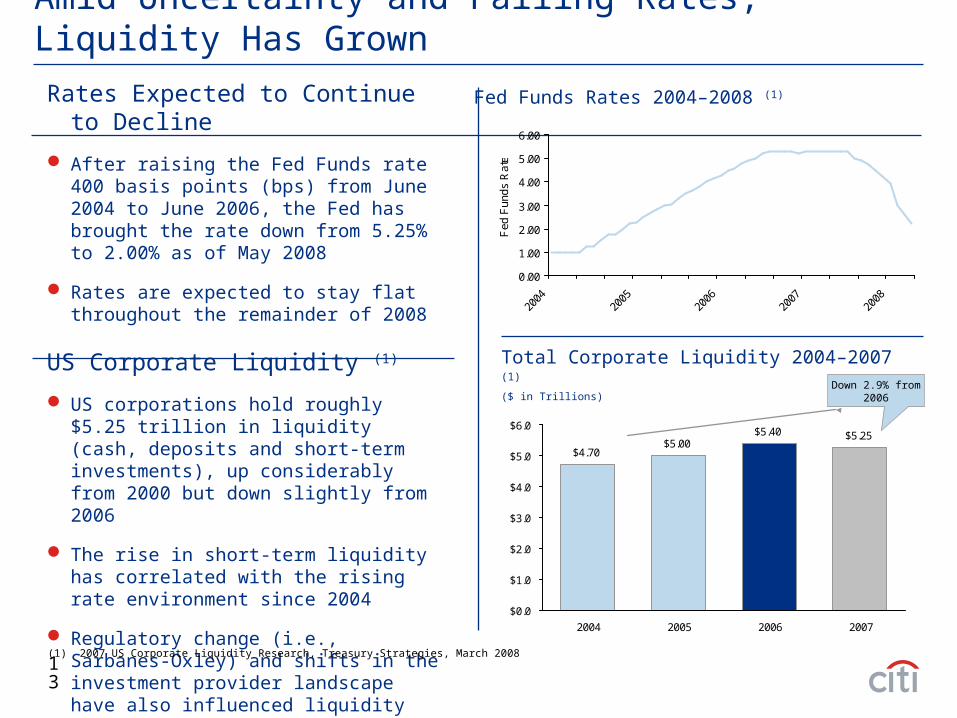
Amid Uncertainty and Falling Rates, Liquidity Has Grown
Rates Expected to Continue to Decline
After raising the Fed Funds rate 400 basis points (bps) from June 2004 to June 2006, the Fed has brought the rate down from 5.25% to 2.00% as of May 2008
Rates are expected to stay flat throughout the remainder of 2008
US Corporate Liquidity (1)
US corporations hold roughly $5.25 trillion in liquidity (cash, deposits and short-term investments), up considerably from 2000 but down slightly from 2006
The rise in short-term liquidity has correlated with the rising rate environment since 2004
Regulatory change (i.e., Sarbanes-Oxley) and shifts in the investment provider landscape have also influenced liquidity management practices
0.00
1.00
2.00
3.00
4.00
5.00
6.00
2004
2005
2006
2007
2008
Fed
Fun
ds R
ate
Fed Funds Rates 2004–2008 (1)
Total Corporate Liquidity 2004–2007 (1)
($ in Trillions) Down 2.9% from
2006
(1) 2007 US Corporate Liquidity Research, Treasury Strategies, March 2008
14
Corporate Investment Practices
15
Types of Cash
.
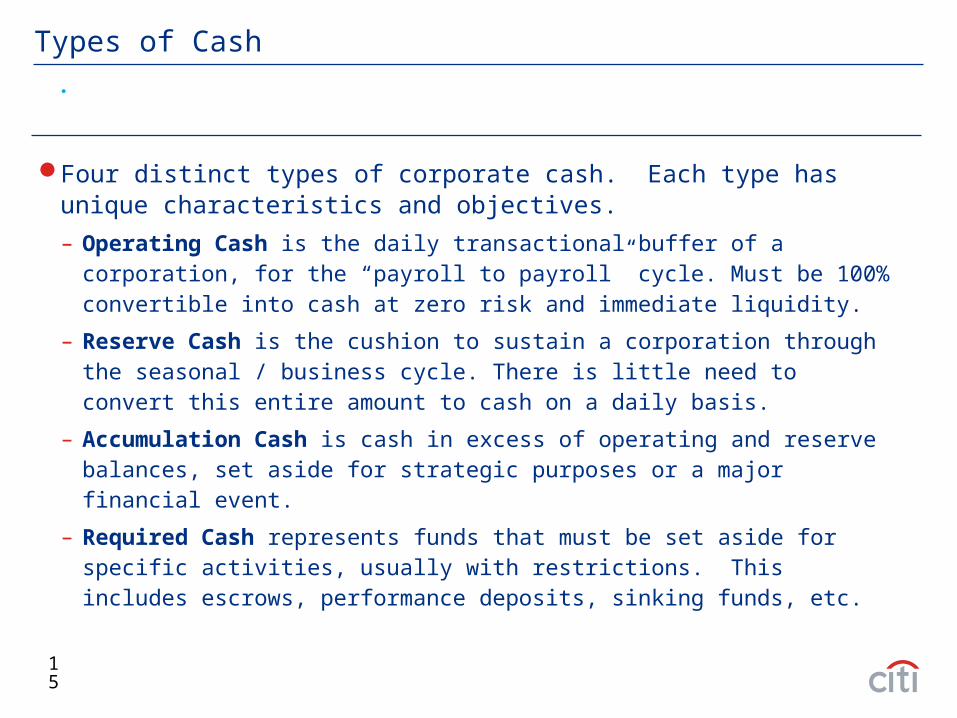
Four distinct types of corporate cash. Each type has unique characteristics and objectives.
– Operating Cash is the daily transactional buffer of a corporation, for the “payroll to payroll” cycle. Must be 100% convertible into cash at zero risk and immediate liquidity.
– Reserve Cash is the cushion to sustain a corporation through the seasonal / business cycle. There is little need to convert this entire amount to cash on a daily basis.
– Accumulation Cash is cash in excess of operating and reserve balances, set aside for strategic purposes or a major financial event.
– Required Cash represents funds that must be set aside for specific activities, usually with restrictions. This includes escrows, performance deposits, sinking funds, etc.
16
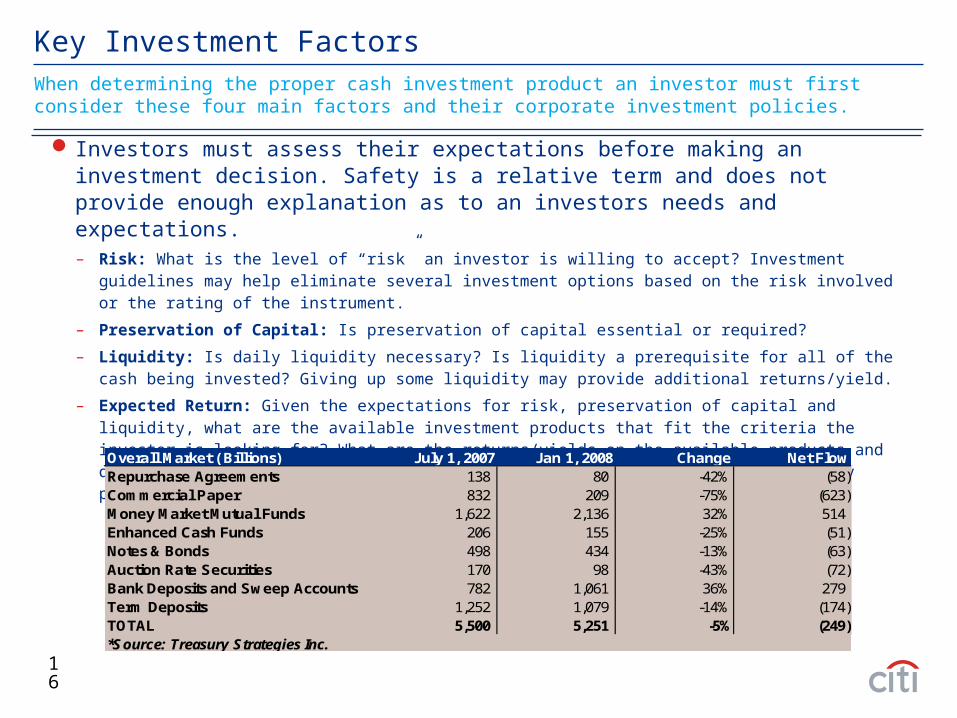
Key Investment Factors
Investors must assess their expectations before making an investment decision. Safety is a relative term and does not provide enough explanation as to an investors needs and expectations.– Risk: What is the level of “risk” an investor is willing to accept? Investment guidelines may help eliminate several
investment options based on the risk involved or the rating of the instrument.
– Preservation of Capital: Is preservation of capital essential or required?
– Liquidity: Is daily liquidity necessary? Is liquidity a prerequisite for all of the cash being invested? Giving up some liquidity may provide additional returns/yield.
– Expected Return: Given the expectations for risk, preservation of capital and liquidity, what are the available investment products that fit the criteria the investor is looking for? What are the returns/yields on the available products and do they provide a return that the investor is expecting? Different products may provide a wide spectrum of returns given the current market turmoil.
When determining the proper cash investment product an investor must first consider these four main factors and their corporate investment policies.
Overall Market ( Billions) July 1, 2007 Jan 1, 2008 Change Net FlowRepurchase Agreements 138 80 -42% (58)Commercial Paper 832 209 -75% (623)Money Market Mutual Funds 1,622 2,136 32% 514Enhanced Cash Funds 206 155 -25% (51)Notes & Bonds 498 434 -13% (63)Auction Rate Securities 170 98 -43% (72)Bank Deposits and Sweep Accounts 782 1,061 36% 279Term Deposits 1,252 1,079 -14% (174)TOTAL 5,500 5,251 -5% (249)*Source: Treasury Strategies Inc.
17
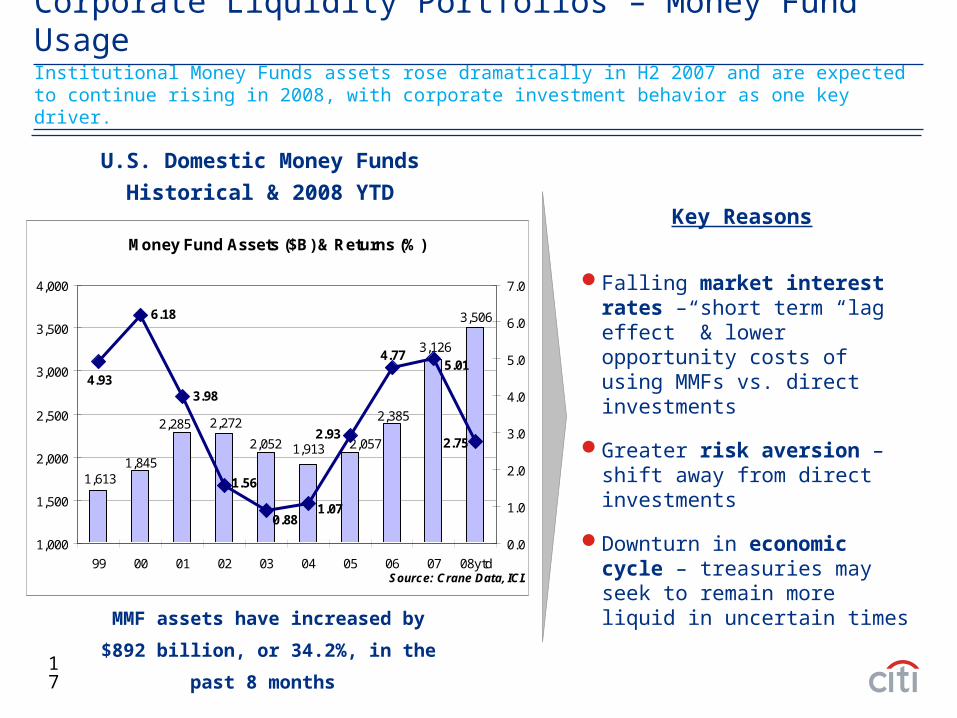
Corporate Liquidity Portfolios – Money Fund Usage
Falling market interest rates – short term “lag effect” & lower opportunity costs of using MMFs vs. direct investments
Greater risk aversion – shift away from direct investments
Downturn in economic cycle – treasuries may seek to remain more liquid in uncertain times
U.S. Domestic Money Funds
Historical & 2008 YTDKey Reasons
MMF assets have increased by $892
billion, or 34.2%, in the past 8 months
Money Fund Assets ($B) & Returns (%)
3,506
3,126
2,057
2,2852,385
1,6131,845
2,272
2,052 1,913 2.75
5.014.77
2.93
1.070.88
1.56
3.984.93
6.18
1,000
1,500
2,000
2,500
3,000
3,500
4,000
99 00 01 02 03 04 05 06 07 08ytd
0.0
1.0
2.0
3.0
4.0
5.0
6.0
7.0
Source: Crane Data, ICI.
Institutional Money Funds assets rose dramatically in H2 2007 and are expected to continue rising in 2008, with corporate investment behavior as one key driver.
18
CP/Repo/CD
27%
Other35%
MM Mut Funds20%
Notes/Bonds18%
CP/Repo/CD
45%
Other32%
Notes/Bonds13%
MM Mut Funds10%
1999Corporate Liquidity
by Instrument
CP/Repo/CD
15%
Other28%
MM Mut Funds36%
Notes/Bonds21%
2004Corporate Liquidity
by Instrument
CP/Repo/CD
24%
Other26%
MM Mut Funds21%
Notes/Bonds29%
CP/Repo/CD
25%
Other25%
MM Mut Funds27%
Notes/Bonds23%
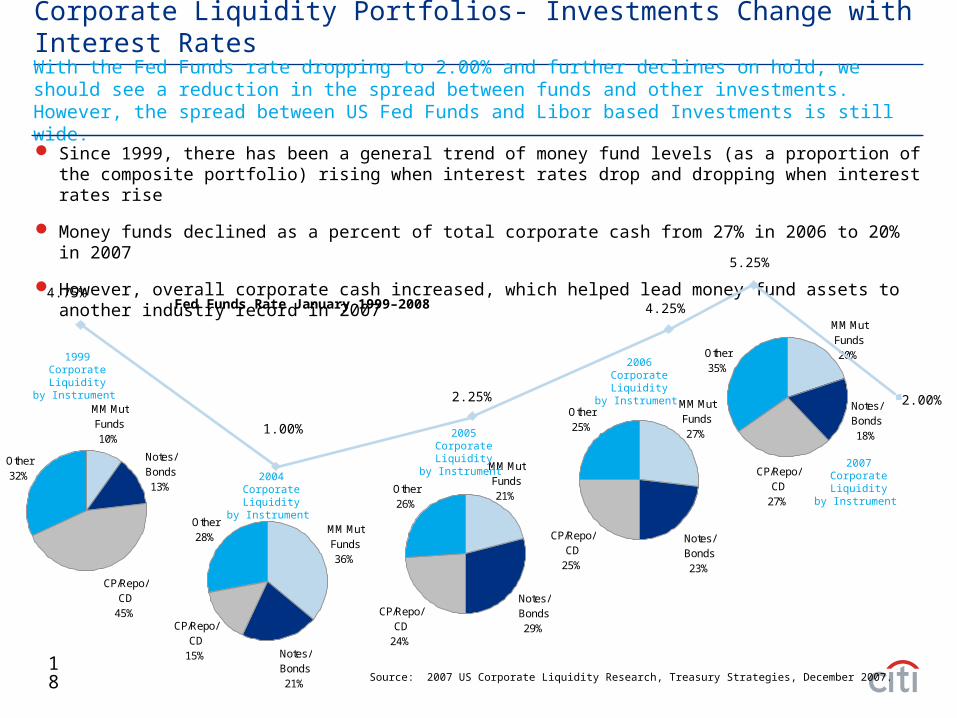
Corporate Liquidity Portfolios- Investments Change with Interest Rates
Since 1999, there has been a general trend of money fund levels (as a proportion of the composite portfolio) rising when interest rates drop and dropping when interest rates rise
Money funds declined as a percent of total corporate cash from 27% in 2006 to 20% in 2007
However, overall corporate cash increased, which helped lead money fund assets to another industry record in 2007
4.75%Fed Funds Rate January 1999–2008 4.25%
1.00%
2.25%
5.25%
Source: 2007 US Corporate Liquidity Research, Treasury Strategies, December 2007.
2005Corporate Liquidity
by Instrument
2006Corporate Liquidity
by Instrument
2007Corporate Liquidity
by Instrument
2.00%
With the Fed Funds rate dropping to 2.00% and further declines on hold, we should see a reduction in the spread between funds and other investments. However, the spread between US Fed Funds and Libor based Investments is still wide.
19
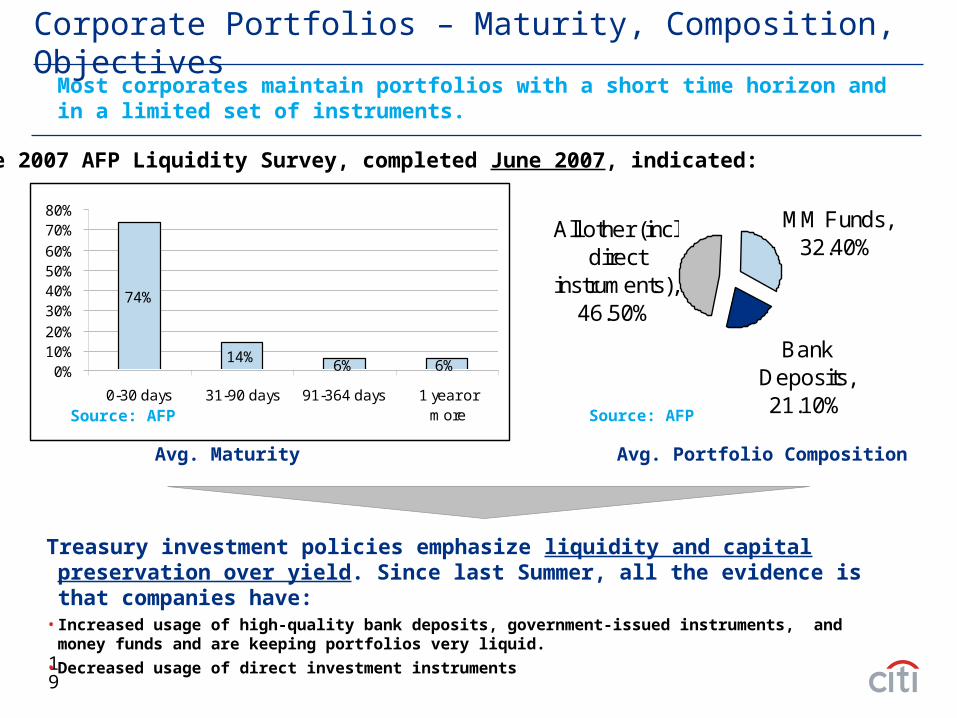
Corporate Portfolios – Maturity, Composition, ObjectivesMost corporates maintain portfolios with a short time horizon and in a limited set of instruments.
74%
14%6% 6%0%
10%20%
30%40%50%60%
70%80%
0-30 days 31-90 days 91-364 days 1 year ormore
Avg. Maturity Avg. Portfolio Composition
Treasury investment policies emphasize liquidity and capital preservation over yield. Since last Summer, all the evidence is that companies have:
• Increased usage of high-quality bank deposits, government-issued instruments, and money funds and are keeping portfolios very liquid.
• Decreased usage of direct investment instruments
The 2007 AFP Liquidity Survey, completed June 2007, indicated:
MM Funds, 32.40%
Bank Deposits, 21.10%
All other (incl direct
instruments), 46.50%
Source: AFP Source: AFP
20
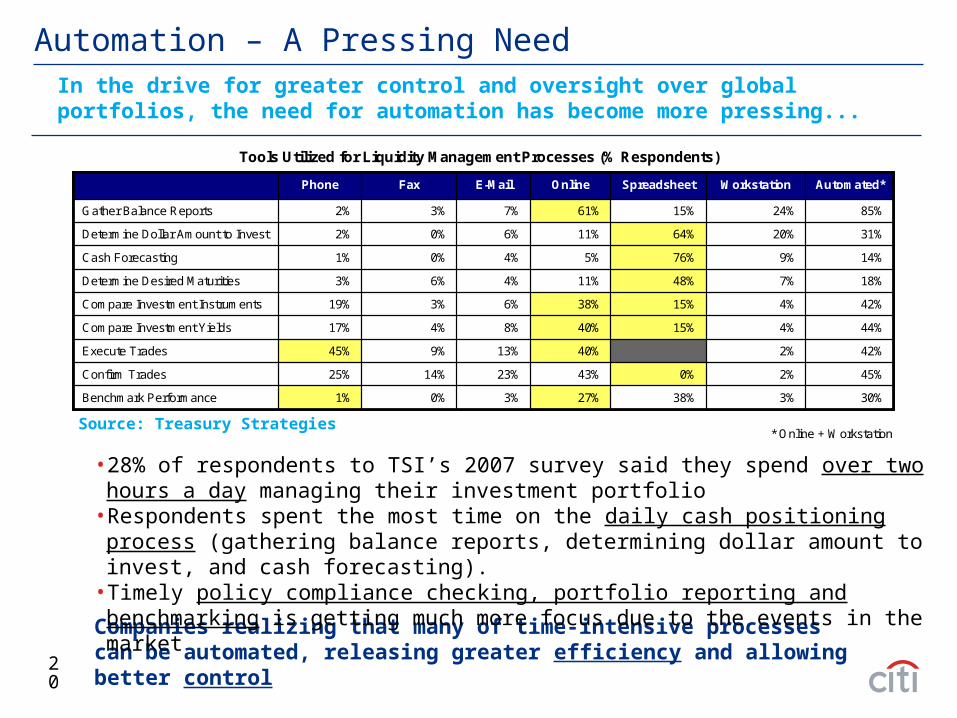
In the drive for greater control and oversight over global portfolios, the need for automation has become more pressing...
Automation – A Pressing Need
Companies realizing that many of time-intensive processes can be automated, releasing greater efficiency and allowing better control
• 28% of respondents to TSI’s 2007 survey said they spend over two hours a day managing their investment portfolio
• Respondents spent the most time on the daily cash positioning process (gathering balance reports, determining dollar amount to invest, and cash forecasting).
• Timely policy compliance checking, portfolio reporting and benchmarking is getting much more focus due to the events in the market
3%
2%
2%
4%
4%
7%
9%
20%
24%
Workstation
30%
45%
42%
44%
42%
18%
14%
31%
85%
Automated*SpreadsheetOnlineE-MailFaxPhone
Benchmark Performance
Confirm Trades
Execute Trades
Compare Investment Yields
Compare Investment Instruments
Determine Desired Maturities
Cash Forecasting
Determine Dollar Amount to Invest
Gather Balance Reports
38%27%3%0%1%
0%43%23%14%25%
40%13%9%45%
15%40%8%4%17%
15%38%6%3%19%
48%11%4%6%3%
76%5%4%0%1%
64%11%6%0%2%
15%61%7%3%2%
Tools Utilized for Liquidity Management Processes (% Respondents)
* Online + WorkstationSource: Treasury Strategies
21
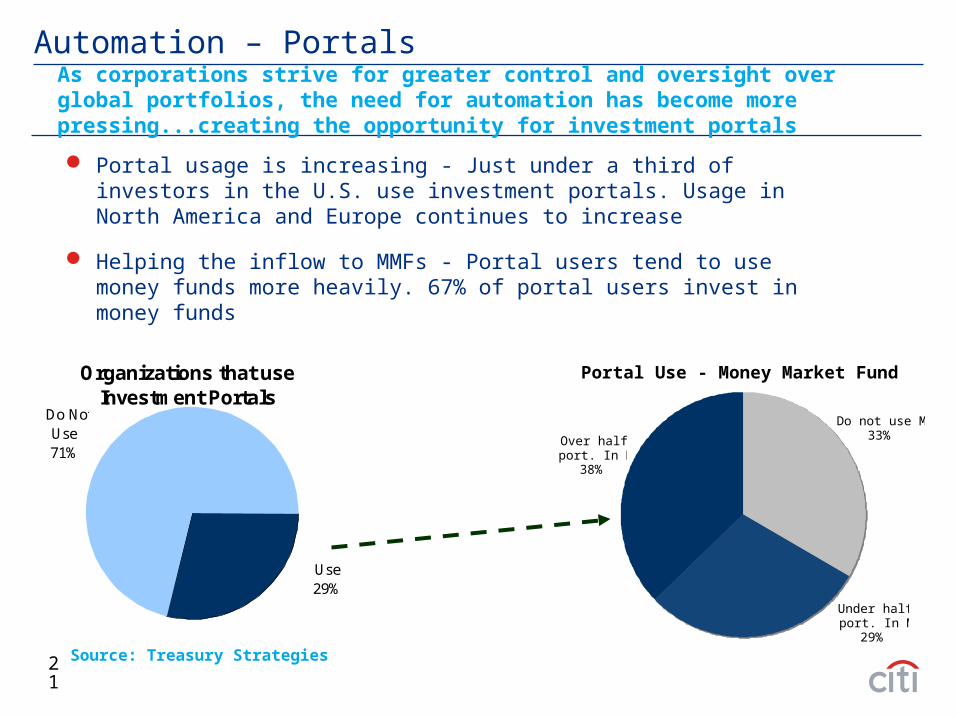
Automation – PortalsAs corporations strive for greater control and oversight over global portfolios, the need for automation has become more pressing...creating the opportunity for investment portals
Organizations that use Investment Portals
Do NotUse71%
Use29%
Portal usage is increasing - Just under a third of investors in the U.S. use investment portals. Usage in North America and Europe continues to increase
Helping the inflow to MMFs - Portal users tend to use money funds more heavily. 67% of portal users invest in money funds
Portal Use - Money Market Fund Usage
Over half of port. In MFs
38%
Do not use MFs33%
Under half of port. In MFs
29%
Source: Treasury Strategies
22
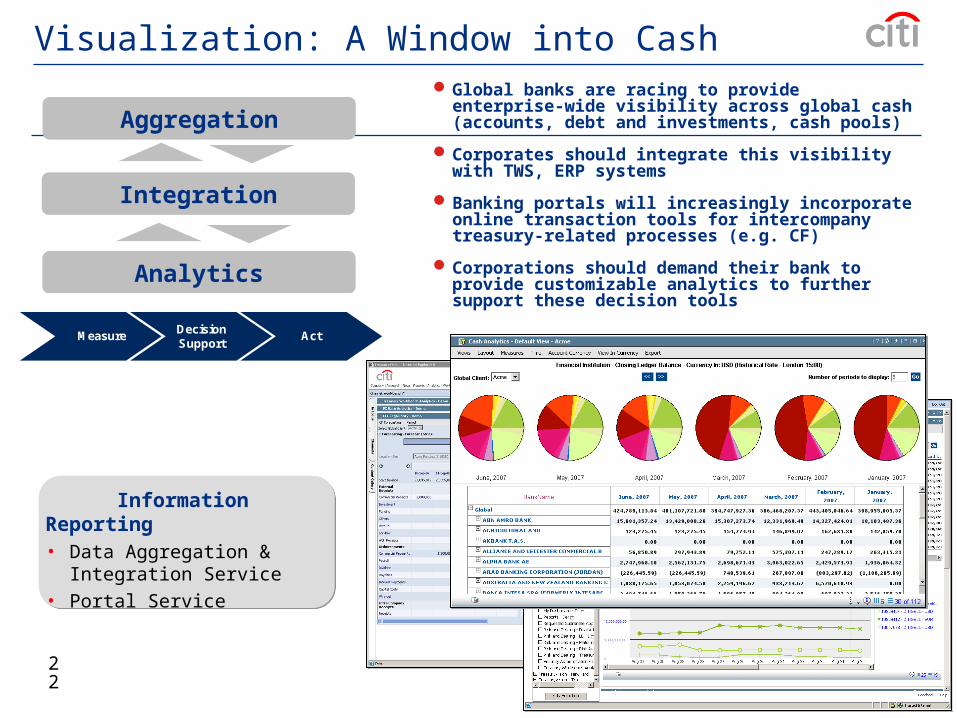
Visualization: A Window into Cash
Aggregation
Integration
Analytics
Global banks are racing to provide enterprise-wide visibility across global cash (accounts, debt and investments, cash pools)
Corporates should integrate this visibility with TWS, ERP systems
Banking portals will increasingly incorporate online transaction tools for intercompany treasury-related processes (e.g. CF)
Corporations should demand their bank to provide customizable analytics to further support these decision tools
Information Reporting• Data Aggregation &
Integration Service• Portal Service
Information Reporting• Data Aggregation &
Integration Service• Portal Service
MeasureForecastDecision
SupportAct
23
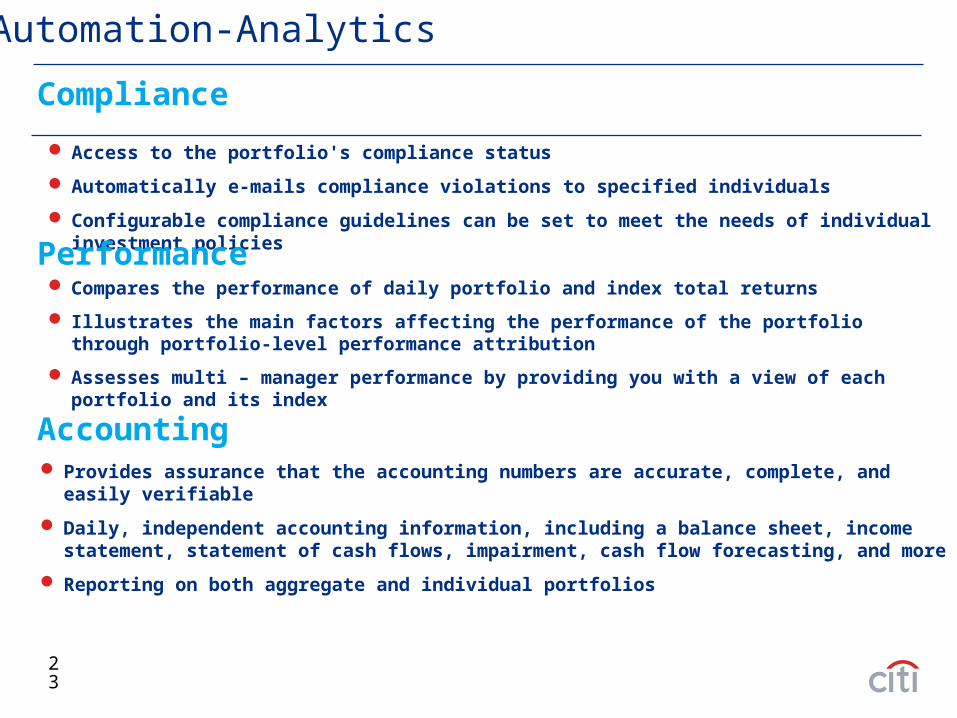
Access to the portfolio's compliance status
Automatically e-mails compliance violations to specified individuals
Configurable compliance guidelines can be set to meet the needs of individual investment policies
Compliance
Automation-Analytics
Compares the performance of daily portfolio and index total returns
Illustrates the main factors affecting the performance of the portfolio through portfolio-level performance attribution
Assesses multi – manager performance by providing you with a view of each portfolio and its index
Accounting
Performance
Provides assurance that the accounting numbers are accurate, complete, and easily verifiable
Daily, independent accounting information, including a balance sheet, income statement, statement of cash flows, impairment, cash flow forecasting, and more
Reporting on both aggregate and individual portfolios
24
Custodians
ERP/TWS Systems
Clearwater
Decision Analytics
Providers
Automation-Analytics
25
Money Market Funds –
Rule 2a-7 and “AAA” Ratings
26
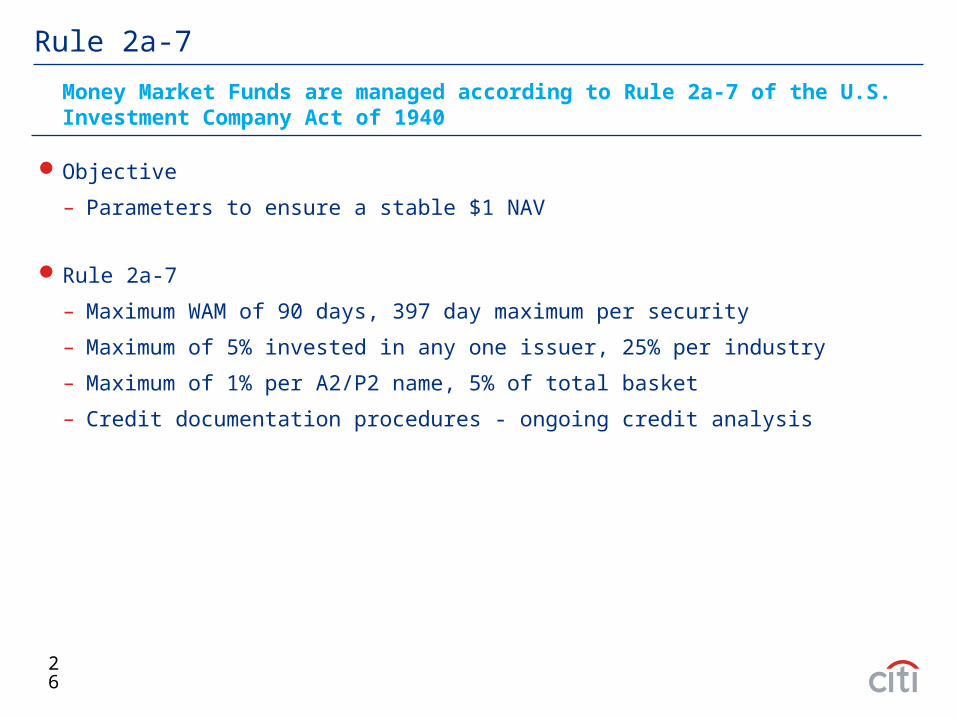
Rule 2a-7
Objective
– Parameters to ensure a stable $1 NAV
Rule 2a-7
– Maximum WAM of 90 days, 397 day maximum per security
– Maximum of 5% invested in any one issuer, 25% per industry
– Maximum of 1% per A2/P2 name, 5% of total basket
– Credit documentation procedures - ongoing credit analysis
Money Market Funds are managed according to Rule 2a-7 of the U.S. Investment Company Act of 1940
27
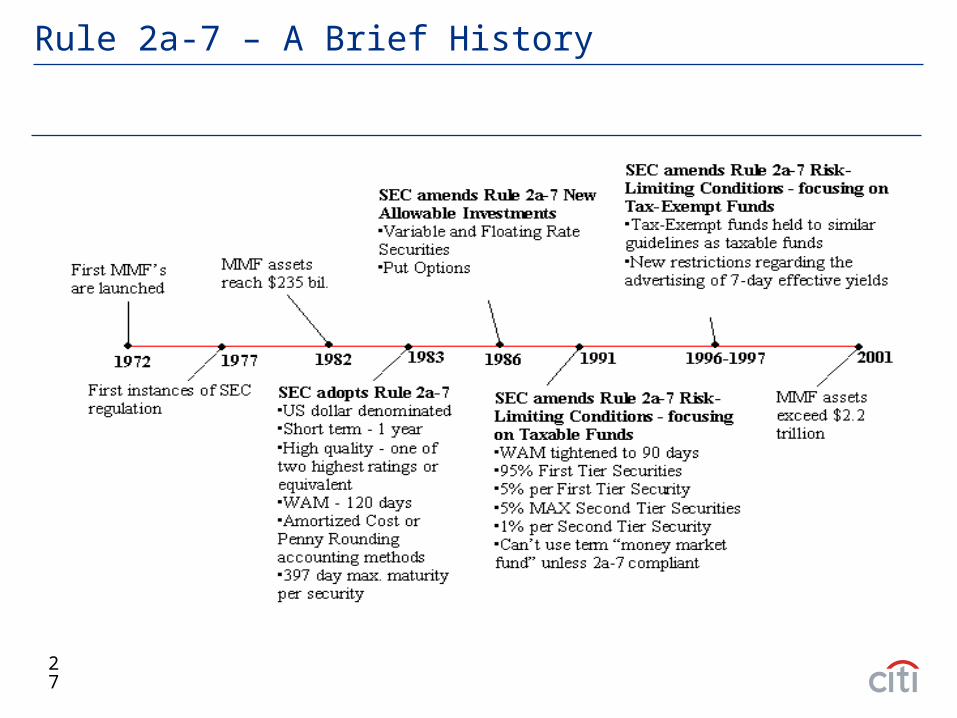
Rule 2a-7 – A Brief History
28
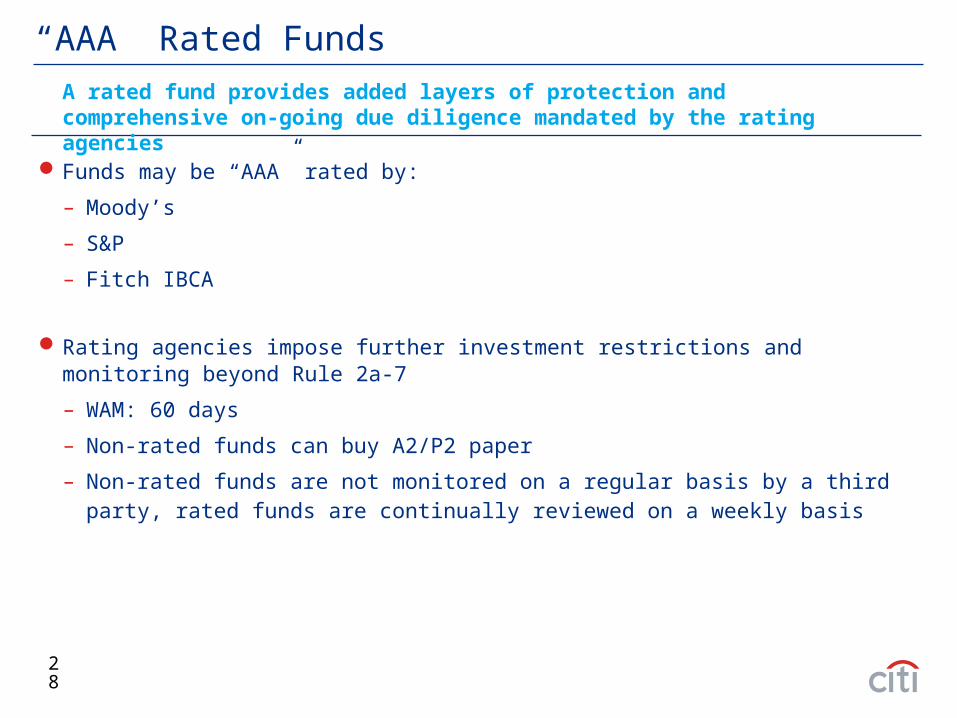
“AAA” Rated Funds
Funds may be “AAA” rated by:
– Moody’s
– S&P
– Fitch IBCA
Rating agencies impose further investment restrictions and monitoring beyond Rule 2a-7
– WAM: 60 days
– Non-rated funds can buy A2/P2 paper
– Non-rated funds are not monitored on a regular basis by a third party, rated funds are continually reviewed on a weekly basis
A rated fund provides added layers of protection and comprehensive on-going due diligence mandated by the rating agencies
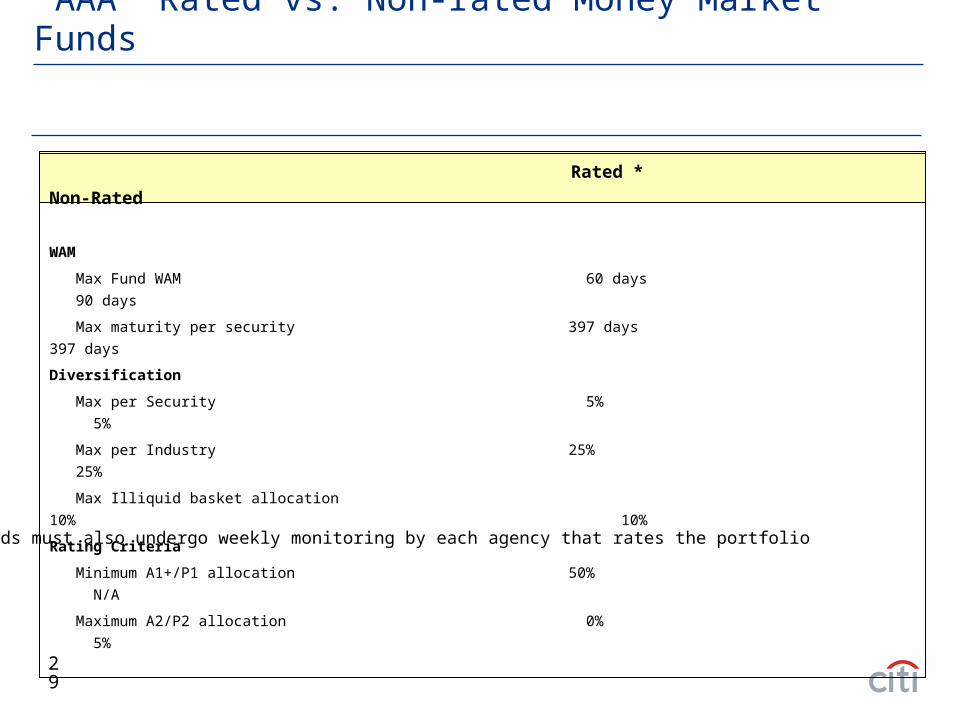
29
Rated * Non-Rated
WAM
Max Fund WAM 60 days 90 days
Max maturity per security 397 days 397 days
Diversification
Max per Security 5% 5%
Max per Industry 25% 25%
Max Illiquid basket allocation 10% 10%
Rating Criteria
Minimum A1+/P1 allocation 50% N/A
Maximum A2/P2 allocation 0% 5%
*Rated funds must also undergo weekly monitoring by each agency that rates the portfolio
“AAA” Rated vs. Non-rated Money Market Funds
30
Summary
Concerns about credit quality and liquidity have forced investors to move cash to “safe”, high quality instruments
Global corporations are increasingly centralizing their global cash and investing processes and oversight
Money market funds have weathered the credit & liquidity storm and remain an attractive cash investment option
Money market funds and high quality bank time deposits are the most common “active” investments, with usage of the former growing especially rapidly
Usage of automation / investment portals is increasingly common, with the fastest growth now occurring internationally

31
Q & A
32
33
Mutual Fund Disclosures
An investment in a money market portfolio is not insured or guaranteed by the Federal Deposit Insurance Corporation or any other government agency. Although a money market portfolio seeks to preserve the value of an investment at $1.00 per share, it is possible to lose money by investing in a money market portfolio.
Investors should consider a fund's objectives, risks, and charges and expenses, and read the prospectus carefully before investing or sending money. The prospectus contains this and other information about the Funds.
34
IRS Circular 230 Disclosure: Citigroup Inc. and its affiliates do not provide tax or legal advice. Any discussion of tax matters in these materials (i) is not intended or written to be used, and cannot beused or relied upon, by you for the purpose of avoiding any tax penalties and (ii) may have been written in connection with the "promotion or marketing" of any transaction contemplated hereby("Transaction"). Accordingly, you should seek advice based on your particular circumstances from an independent tax advisor.
Any terms set forth herein are intended for discussionpurposes only and are subject to the final terms as set forth in separate definitive written agreements. This presentation is not a commitment to lend, syndicate afinancing, underwrite or purchase securities,or commit capital nor does it obligate us to enter into such a commitment, nor are we acting as a fiduciary to you. By accepting this presentation, subject to applicable lawor regulation, you agree to keep confidential the existence of and proposed terms for any Transaction.
Prior to entering into any Transaction, you should determine, without reliance upon us or our affiliates, the economic risks and merits (and independently determine that you are able to assume these risks)as well asthe legal, tax and accounting characterizationsand consequencesof any such Transaction. In this regard, by accepting this presentation, you acknowledge that (a) we are not in the business of providing (and you arenot relying on us for) legal, tax or accounting advice, (b) there may be legal, tax or accounting risks associatedwith any Transaction, (c) you should receive (and rely on) separate and qualified legal, tax and accountingadvice and (d) you should apprise senior management in your organization as to such legal, tax and accounting advice (and any risks associated with any Transaction) and our disclaimer as to these matters. Byacceptanceof these materials, you and we hereby agree that from the commencement of discussions with respect to any Transaction, and notwithstanding any other provision in this presentation, we hereby confirmthat no participant in any Transaction shall be limited from disclosing the U.S. tax treatment or U.S. tax structure of such Transaction.
We are required to obtain, verify and record certain information that identifies each entity that enters into a formal business relationship with us. We will ask for your complete name, street address, and taxpayer IDnumber. We may also request corporate formation documents, or other forms of identification, to verify information provided.
Any prices or levels contained herein are preliminary and indicative only and do not represent bids or offers. These indications are provided solely for your information and consideration, are subject to change at anytime without notice and are not intended as a solicitation with respect to the purchaseor sale of any instrument. The information contained in this presentation may include results of analyses from a quantitative modelwhich represent potential future events that may or may not be realized, and is not a complete analysis of every material fact representing any product. Any estimates included herein constitute our judgment as of thedate hereof and are subject to change without any notice. We and/or our affiliates may make a market in these instruments for our customersand for our own account. Accordingly, we may have a position in any suchinstrument at any time.
Although this material may contain publicly available information about Citi corporate bond research, fixed income strategy or economic and market analysis, Citi policy (i) prohibits employees from offering, directly orindirectly, a favorable or negative researchopinion or offering to change an opinion as consideration or inducement for the receipt of business or for compensation; and (ii) prohibits analysts from being compensated forspecific recommendations or views contained in research reports. So as to reduce the potential for conflicts of interest, as well as to reduce any appearance of conflicts of interest, Citi has enacted policies andprocedures designed to limit communications between its investment banking and research personnel to specifically prescribed circumstances.
[TRADEMARK SIGNOFF: add the appropriate signoff for the relevant legal vehicle]
© 2007 Citigroup Global Markets Inc. Member SIPC. All rights reserved. Citi and Citi and Arc Design are trademarks and service marks of Citigroup Inc. or its affiliates and are used and registered throughout the world.
© 2007 Citigroup Global Markets Limited. Authorized and regulated by the Financial Services Authority. All rights reserved. Citi and Citi and Arc Design are trademarks and service marks of Citigroup Inc. or its affiliates and are used and registered throughout the world.
© 2007 Citibank, N.A. All rights reserved. Citi and Citi and Arc Design are trademarks and service marks of Citigroup Inc. or its affiliates and are used and registered throughout the world.
© 2007 Citigroup Inc. All rights reserved. Citi and Citi and Arc Design are trademarks and service marks of Citigroup Inc. or its affiliates and are used and registered throughout the world.
© 2007 [Name of Legal Vehicle] [Name of regulatory body.] All rights reserved. Citi and Citi and Arc Design are trademarks and service marks of Citigroup Inc. or its affiliates and are used and registered throughout the world.