short sea shipping is our business - algoma … sea shipping is our business 2017 interim report to...
TRANSCRIPT
S h o r t S e a S h i p p i n g i s O U R B U S I N E S S
w w w. a l g o n e t . c o m
2 0 1 7
Interim Report to ShareholdersFor the Three and Nine Months Ended September 30, 2017

Algoma Central Corporation
Table of Contents
General 1Use of Non-GAAP Measures 1Caution Regarding Forward-Looking Statements 2Overall Performance 3Summary of Quarterly Results 5Business Segment Discussion Domestic Dry-Bulk 7 Product Tankers 8 Ocean Self-Unloaders 9 Global Short Sea Shipping 10 Real Estate - Discontinued Operations 12Consolidated 13Disclosure Controls and Procedures and Internal Controls Over Financial Reporting 16Financial Condition, Liquidity and Capital Resources 16Contingencies 17Transactions with Related Parties 17Contractual Obligations 18Notice of Disclosure of No Audit Review 19Interim Condensed Consolidated Statements of Earnings 20Interim Condensed Consolidated Statements of Comprehensive Earnings 21Interim Condensed Consolidated Balance Sheets 22Interim Condensed Consolidated Statements of Changes in Equity 23Interim Condensed Consolidated Statements of Cash Flows 24Notes to the Interim Condensed Consolidated Financial Statements 25

ALGOMA CENTRAL CORPORATION
General
Algoma Central Corporation (“Algoma” or the “Company” or the "Corporation") operates through four segments, Domestic Dry-Bulk, Product Tankers, Ocean Self-Unloaders and Global Short Sea Shipping.
This Management’s Discussion and Analysis (“MD&A”) of the Company has been prepared as at November 3, 2017 and should be read in conjunction with its interim condensed consolidated financial statements for the three and nine months ending September 30, 2017 and 2016, and related notes thereto, and the consolidated financial statements for the years ending December 31, 2016 and 2015.
The MD&A has been prepared by reference to the disclosure requirements established under National Instrument 51-102 “Continuous Disclosure Obligations” of the Canadian Securities Administrators. Additional information on the Company, including its 2016 Annual Information Form, is available on the SEDAR website at www.sedar.com or on the Company's website at www.algonet.com.
The reporting currency used is the Canadian dollar and all amounts are reported in thousands of Canadian dollars, except for per share data, or unless otherwise noted.
Use of Non-GAAP Measures
The following summarizes non-GAAP financial measures utilized in the MD&A. As there is no generally accepted method of calculating these financial measures, they may not be comparable to similar measures reported by other corporations.
EBITDAEBITDA refers to earnings before interest, taxes, depreciation, and amortization. We also include EBITDA of discontinued operations and our share of the EBITDA of our equity interest in joint arrangements in this measure. EBITDA is not a recognized measure for financial statement presentation under generally accepted accounting principles as defined by IFRS. EBITDA is not intended to represent cash flow from operations and it should not be considered as an alternative to net earnings, cash flow from operations, or any other measure of performance prescribed by IFRS. The Company's EBITDA may also not be comparable to EBITDA used by other corporations, which may be calculated differently. The Company considers EBITDA to be a meaningful measure to assess its operating performance in addition to other IFRS measures. It is included because the Company believes it can be useful in measuring its ability to service debt, fund capital expenditures, and expand its business, and it is used by credit providers in the financial covenants of the Company's long-term debt.
Adjusted Measures Management assesses results on a reported and adjusted basis and considers both as useful measures of performance. Adjusted results remove items of note from reported results and are used to calculate our adjusted measure noted below. Items of note include certain items of significance that arise from time to time which management believes are not reflective of underlying business performance. We believe that adjusted measure provides the reader with a better understanding of how management assesses underlying business performance and facilitate a more informed analysis of trends.
Adjusted Basic Earnings per ShareWe adjust our reported Basic Earnings per Share to remove the impact of items of note, net of income taxes, and any other items specified to calculate the Adjusted Basic Earnings per Share (page 5).
1
MANAGEMENT'S DISCUSSION & ANALYSIS
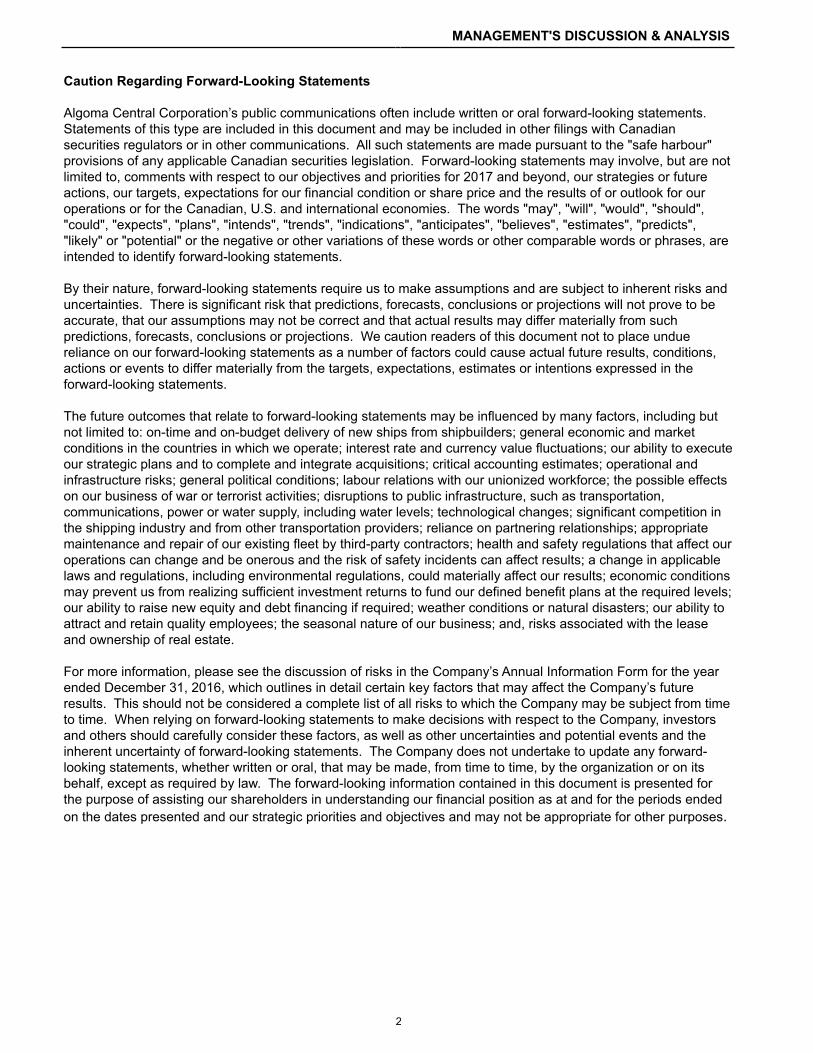
Caution Regarding Forward-Looking Statements
Algoma Central Corporation’s public communications often include written or oral forward-looking statements. Statements of this type are included in this document and may be included in other filings with Canadian securities regulators or in other communications. All such statements are made pursuant to the "safe harbour" provisions of any applicable Canadian securities legislation. Forward-looking statements may involve, but are not limited to, comments with respect to our objectives and priorities for 2017 and beyond, our strategies or future actions, our targets, expectations for our financial condition or share price and the results of or outlook for our operations or for the Canadian, U.S. and international economies. The words "may", "will", "would", "should", "could", "expects", "plans", "intends", "trends", "indications", "anticipates", "believes", "estimates", "predicts", "likely" or "potential" or the negative or other variations of these words or other comparable words or phrases, are intended to identify forward-looking statements.
By their nature, forward-looking statements require us to make assumptions and are subject to inherent risks and uncertainties. There is significant risk that predictions, forecasts, conclusions or projections will not prove to be accurate, that our assumptions may not be correct and that actual results may differ materially from such predictions, forecasts, conclusions or projections. We caution readers of this document not to place undue reliance on our forward-looking statements as a number of factors could cause actual future results, conditions, actions or events to differ materially from the targets, expectations, estimates or intentions expressed in the forward-looking statements.
The future outcomes that relate to forward-looking statements may be influenced by many factors, including but not limited to: on-time and on-budget delivery of new ships from shipbuilders; general economic and market conditions in the countries in which we operate; interest rate and currency value fluctuations; our ability to execute our strategic plans and to complete and integrate acquisitions; critical accounting estimates; operational and infrastructure risks; general political conditions; labour relations with our unionized workforce; the possible effects on our business of war or terrorist activities; disruptions to public infrastructure, such as transportation, communications, power or water supply, including water levels; technological changes; significant competition in the shipping industry and from other transportation providers; reliance on partnering relationships; appropriate maintenance and repair of our existing fleet by third-party contractors; health and safety regulations that affect our operations can change and be onerous and the risk of safety incidents can affect results; a change in applicable laws and regulations, including environmental regulations, could materially affect our results; economic conditions may prevent us from realizing sufficient investment returns to fund our defined benefit plans at the required levels; our ability to raise new equity and debt financing if required; weather conditions or natural disasters; our ability to attract and retain quality employees; the seasonal nature of our business; and, risks associated with the lease and ownership of real estate.
For more information, please see the discussion of risks in the Company’s Annual Information Form for the year ended December 31, 2016, which outlines in detail certain key factors that may affect the Company’s future results. This should not be considered a complete list of all risks to which the Company may be subject from time to time. When relying on forward-looking statements to make decisions with respect to the Company, investors and others should carefully consider these factors, as well as other uncertainties and potential events and the inherent uncertainty of forward-looking statements. The Company does not undertake to update any forward-looking statements, whether written or oral, that may be made, from time to time, by the organization or on its behalf, except as required by law. The forward-looking information contained in this document is presented for the purpose of assisting our shareholders in understanding our financial position as at and for the periods ended on the dates presented and our strategic priorities and objectives and may not be appropriate for other purposes.
2

ALGOMA CENTRAL CORPORATION
Overall Performance
Three Months Nine MonthsEnded September 30 Ended September 302017 2016 2017 2016
Revenues $ 136,556 $ 118,228 $ 312,301 $ 260,828Net Earnings $ 32,768 $ 38,502 $ 42,827 $ 45,068Basic earnings per common share $ 0.84 $ 0.99 $ 1.10 $ 1.16Continuing operations Net earnings $ 22,517 $ 24,425 $ 18,469 $ 29,816 Basic earnings per common share $ 0.58 $ 0.63 $ 0.47 $ 0.77Net earnings from discontinued operations $ 10,251 $ 14,077 $ 24,358 $ 15,252EBITDA $ 43,899 $ 39,373 $ 61,375 $ 45,292
At September 30Common shares outstanding 38,913,733 38,913,733Total assets $ 1,076,358 $ 973,156Total long-term financial liabilities $ 281,386 $ 239,971
The Company is reporting 2017 third quarter revenues of $136,556 compared to $118,228 for the same period in 2016. The increase in revenue occurred mainly in the Domestic Dry-Bulk segment and was due to increased customer demand in salt, and iron and steel commodities and the impact of higher fuel costs that are passed on directly to customers as part of the freight rate. Revenues in the Product Tanker segment increased due to increased customer demand.
Revenues for the nine months ended September 30, 2017 of $312,301 were $51,473 higher than revenues for the same period in the prior year. Domestic Dry-Bulk revenues increased by $31,248, Product Tanker revenues experienced an increase of $16,182 and the Ocean Shipping segment increased $4,128.
The net earnings from continuing operations for the 2016 third quarter of $24,425 includes net gains on shipbuilding contracts of $6,126. Excluding this item from the net earnings from continuing operations, the earnings for the third quarter of 2016 would have been $18,299. When compared to the 2017 third quarter results of $22,517, an improvement of $4,218 in earnings was experienced mainly due to the net earnings increase in the Domestic Dry-Bulk segment.
The net earnings from continuing operations for the 2016 nine-month period of $29,816 includes net gains on shipbuilding contracts in the amount of $22,322. Excluding this item from the net earnings from continuing operations, the earnings for the nine months ended 2016 would have been $7,494 which compares to earnings for the 2017 nine-month period of $18,469. Improvements in earnings in the Domestic Dry-Bulk segment were more than sufficient to offset decreases in the Ocean Self-unloaders and Product Tanker segments.
Net earnings from discontinued operations for the 2017 third quarter were $10,251 compared to $14,077 for the same period last year. During the third quarter, the Company completed the sale of four properties resulting in a net gain of $10,706, while in the third quarter of 2016, four properties were sold for a net gain of $11,938.
3
MANAGEMENT'S DISCUSSION & ANALYSIS
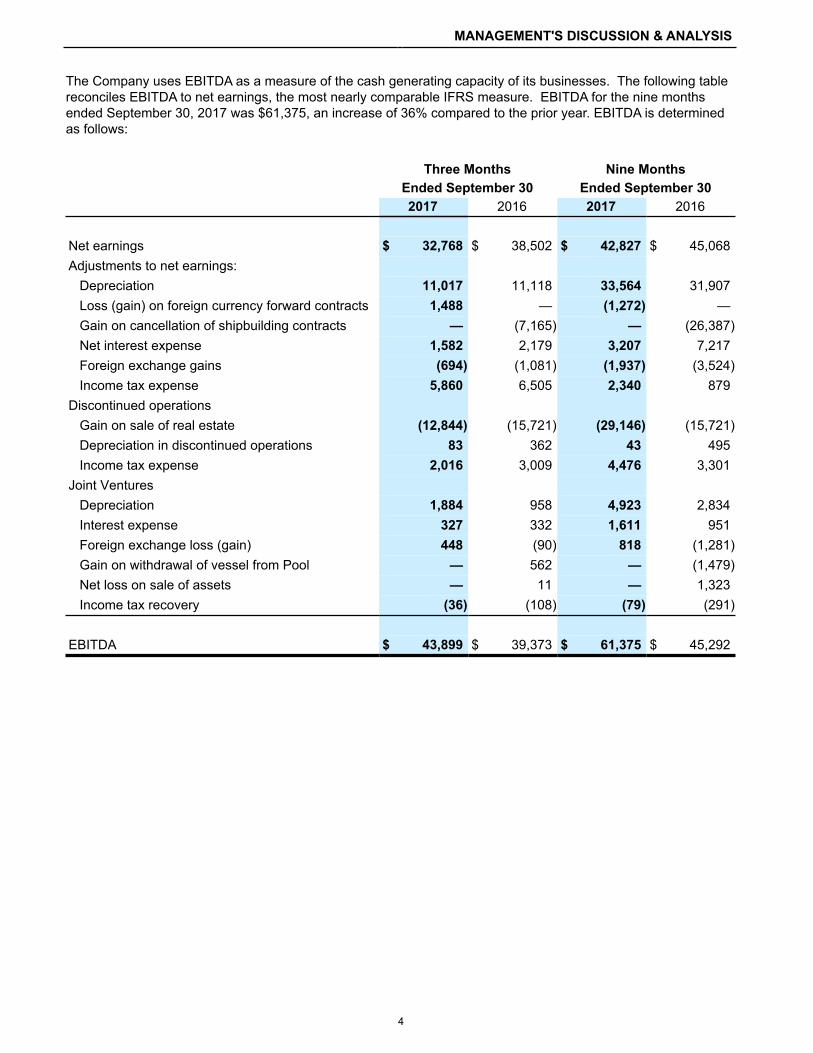
The Company uses EBITDA as a measure of the cash generating capacity of its businesses. The following table reconciles EBITDA to net earnings, the most nearly comparable IFRS measure. EBITDA for the nine months ended September 30, 2017 was $61,375, an increase of 36% compared to the prior year. EBITDA is determined as follows:
Three Months Nine MonthsEnded September 30 Ended September 302017 2016 2017 2016
Net earnings $ 32,768 $ 38,502 $ 42,827 $ 45,068Adjustments to net earnings: Depreciation 11,017 11,118 33,564 31,907 Loss (gain) on foreign currency forward contracts 1,488 — (1,272) — Gain on cancellation of shipbuilding contracts — (7,165) — (26,387) Net interest expense 1,582 2,179 3,207 7,217 Foreign exchange gains (694) (1,081) (1,937) (3,524) Income tax expense 5,860 6,505 2,340 879Discontinued operations Gain on sale of real estate (12,844) (15,721) (29,146) (15,721) Depreciation in discontinued operations 83 362 43 495 Income tax expense 2,016 3,009 4,476 3,301Joint Ventures Depreciation 1,884 958 4,923 2,834 Interest expense 327 332 1,611 951 Foreign exchange loss (gain) 448 (90) 818 (1,281) Gain on withdrawal of vessel from Pool — 562 — (1,479) Net loss on sale of assets — 11 — 1,323 Income tax recovery (36) (108) (79) (291)
EBITDA $ 43,899 $ 39,373 $ 61,375 $ 45,292
4

ALGOMA CENTRAL CORPORATION
Summary of Quarterly Results
The results for the last eight quarters are as follows:
Year Quarter RevenueNet Earnings
(Loss)Basic Earnings
(Loss) perShare
2017 Quarter 3 $ 136,556 $ 32,768 $ 0.84Quarter 2 $ 123,918 $ 29,164 $ 0.75Quarter 1 $ 51,827 $ (19,105) $ (0.49)
2016 Quarter 4 $ 130,578 $ (11,753) $ (0.30)Quarter 3 $ 118,228 $ 38,502 $ 0.99Quarter 2 $ 99,037 $ 13,261 $ 0.34Quarter 1 $ 43,563 $ (6,695) $ (0.17)
2015 Quarter 4 $ 119,171 $ 10,591 $ 0.27
Impact of Seasonality on the Business
The nature of the Company's business is such that the earnings in the first quarter of each year are not indicative of the results for the other three quarters in the year. Due to the closing of the canal system and the winter weather conditions in the Great Lakes – St. Lawrence Waterway, the majority of the Domestic Dry-Bulk fleet does not operate for most of the first quarter. In addition, significant repair and maintenance costs are incurred in the first quarter to prepare the Domestic Dry-Bulk fleet for the upcoming navigation season. As a result, first quarter revenues and earnings are significantly lower than those of the remaining quarters in the year.
The following summarizes the trailing twelve month results in each of the last seven quarters:
Trailing Twelve
Year Quarter Revenue Net EarningsBasic Earnings
per ShareAdjustment to
Basic Earningsper Share *
Adjusted BasicEarnings per
Share
2017 Quarter 3 $ 442,879 $ 31,074 $ 0.80 $ (0.03) $ 0.77Quarter 2 $ 424,551 $ 36,811 $ 0.95 $ (0.22) $ 0.73Quarter 1 $ 399,671 $ 20,908 $ 0.54 $ 0.13 $ 0.67
2016 Quarter 4 $ 391,406 $ 33,315 $ 0.86 $ (0.29) $ 0.57Quarter 3 $ 379,999 $ 55,659 $ 1.43 $ (0.85) $ 0.58Quarter 2 $ 386,848 $ 31,999 $ 0.82 $ (0.39) $ 0.43Quarter 1 $ 413,147 $ 42,068 $ 1.08 $ (0.65) $ 0.43
5

MANAGEMENT'S DISCUSSION & ANALYSIS
* The following table summarizes the adjustment to Basic Earnings per Share, by quarter, for certain items management believes are not reflective of underlying business performance.
2015 2016 2017Q2 Q3 Q4 Q1 Q2 Q3 Q4 Q1 Q2 Q3
Gain on shipbuildingcancellations $ (0.26) $ — $ — $ (0.42) $ — $ (0.16) $ — $ — $ — $ —Impairmentprovisions — — 0.03 — — — 0.81 — — —Gain on sale of realestate properties — — — — — (0.31) (0.22) — (0.35) (0.28)
$ (0.26) $ — $ 0.03 $ (0.42) $ — $ (0.47) $ 0.59 $ — $ (0.35) $ (0.28)Trailing adjustmentto EPS $ (0.65) $ (0.39) $ (0.86) $ (0.29) $ 0.13 $ (0.22) $ (0.03)
6

ALGOMA CENTRAL CORPORATION
Business Segment Discussion
Domestic Dry-Bulk
Domestic Dry-Bulk Financial Review Three Months Nine MonthsEnded September 30 Ended September 302017 2016 2017 2016
Revenue $ 89,539 $ 81,900 $ 188,919 $ 157,671Operating expenses (60,467) (55,347) (148,072) (139,016)General and administrative (2,342) (2,468) (7,767) (8,008)
26,730 24,085 33,080 10,647Depreciation (4,974) (5,673) (14,381) (16,266)(Loss) gain on foreign currency forward contracts (1,488) — 1,272 —Gain on cancellation of shipbuilding contracts — 7,165 — 26,387Income tax expense (5,567) (6,778) (5,123) (5,504)
Net earnings $ 14,701 $ 18,799 $ 14,848 $ 15,264
EBITDA $ 26,730 $ 24,085 $ 33,080 $ 10,647Additions to property, plant, and equipment $ 47,012 $ 11,432 $ 116,712 $ 76,521
September30, 2017
December31, 2016
Total assets $ 561,716 $ 468,401
Revenue increased in the 2017 third quarter by $7,639 and for the nine months ended September 30, 2017 by $31,248 when compared to the previous year periods. The increases for both periods were due primarily to volume increases in the salt and iron and steel sectors and the impact of higher fuel costs that are passed on directly to customers as part of the freight rate. Partially offsetting the volume increases were lower freight rates in certain sectors.
Operating expenses including fuel costs for the 2017 third quarter were higher than the comparable period in 2016 by $5,120 and for the nine months ended September 30, 2017 by $9,056 when compared to 2016. The increases in expenses for both periods were driven by higher operating days, although this was partially offset by lower repair and winter lay-up expenses and continuing efforts by management to reduce costs in targeted areas.
The Company transacts in foreign currency forward contracts in an effort to hedge its shipbuilding construction instalments that are denominated in U.S. dollars and Euro currencies. During the fourth quarter of 2016, hedge accounting for the foreign currency forward contracts ceased to be effective as the hedged forecasted transactions were no longer expected to occur within the original time period, therefore, gains and losses on the foreign currency forward contracts are being recognized in consolidated earnings on a monthly basis.
The gain on shipbuilding contracts of $26,387 in 2016 resulted from the favourable ruling received by the Company involving three cancelled shipbuilding contracts. As a result of the favourable ruling, the Company recognized a net gain consisting of a foreign exchange gain on the deposits made and accrued interest, net of capitalized costs written-off.
Segment earnings were $14,701 for the third quarter of 2017 compared to $18,799 for the prior year as a result of the above items. For the year to date, earnings of $14,848 compared to $15,264, for a decrease of $416. Excluding the after-tax gain on cancellation of shipbuilding contracts in the prior year, the 2017 year to date earnings would reflect a $21,906 improvement in earnings over the prior year for the business segment.
7
MANAGEMENT'S DISCUSSION & ANALYSIS
Product Tankers
Product Tankers Financial Review Three Months Nine MonthsEnded September 30 Ended September 302017 2016 2017 2016
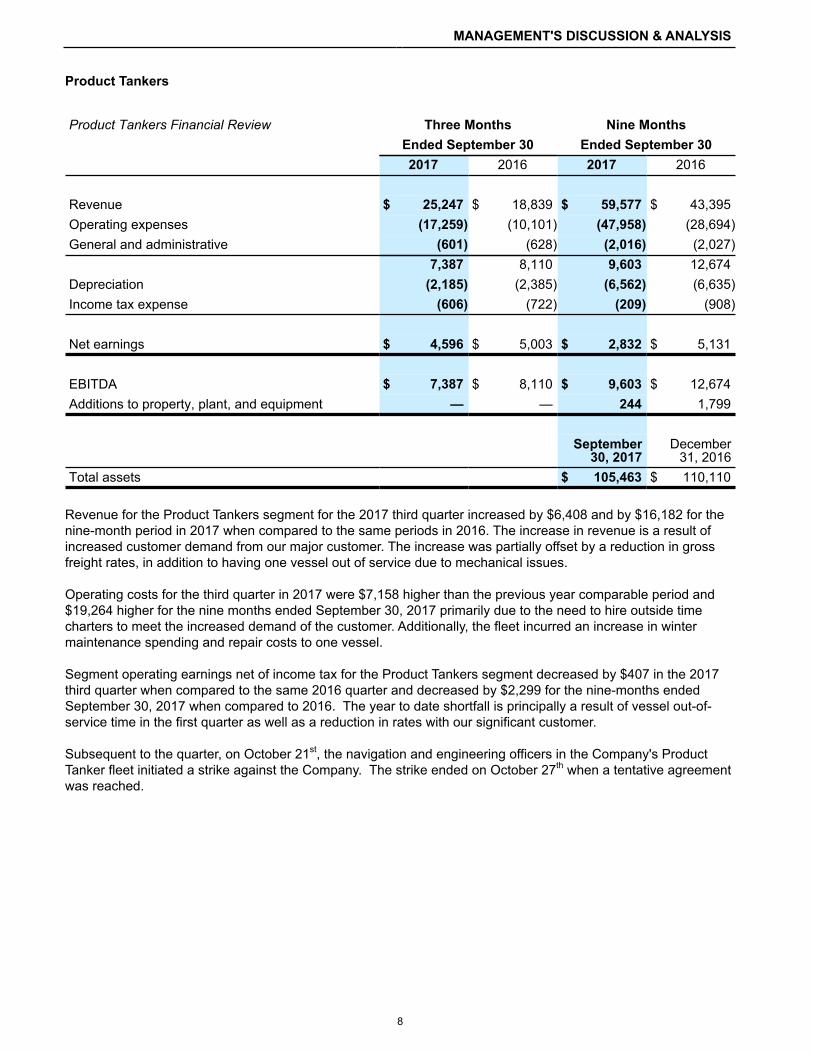
Revenue $ 25,247 $ 18,839 $ 59,577 $ 43,395Operating expenses (17,259) (10,101) (47,958) (28,694)General and administrative (601) (628) (2,016) (2,027)
7,387 8,110 9,603 12,674Depreciation (2,185) (2,385) (6,562) (6,635)Income tax expense (606) (722) (209) (908)
Net earnings $ 4,596 $ 5,003 $ 2,832 $ 5,131
EBITDA $ 7,387 $ 8,110 $ 9,603 $ 12,674Additions to property, plant, and equipment — — 244 1,799
September30, 2017
December31, 2016
Total assets $ 105,463 $ 110,110
Revenue for the Product Tankers segment for the 2017 third quarter increased by $6,408 and by $16,182 for the nine-month period in 2017 when compared to the same periods in 2016. The increase in revenue is a result of increased customer demand from our major customer. The increase was partially offset by a reduction in gross freight rates, in addition to having one vessel out of service due to mechanical issues.
Operating costs for the third quarter in 2017 were $7,158 higher than the previous year comparable period and $19,264 higher for the nine months ended September 30, 2017 primarily due to the need to hire outside time charters to meet the increased demand of the customer. Additionally, the fleet incurred an increase in winter maintenance spending and repair costs to one vessel.
Segment operating earnings net of income tax for the Product Tankers segment decreased by $407 in the 2017 third quarter when compared to the same 2016 quarter and decreased by $2,299 for the nine-months ended September 30, 2017 when compared to 2016. The year to date shortfall is principally a result of vessel out-of-service time in the first quarter as well as a reduction in rates with our significant customer.
Subsequent to the quarter, on October 21st, the navigation and engineering officers in the Company's Product Tanker fleet initiated a strike against the Company. The strike ended on October 27th when a tentative agreement was reached.
8

ALGOMA CENTRAL CORPORATION
Ocean Self-Unloaders
Ocean Self-Unloaders Financial Review Three Months Nine MonthsEnded September 30 Ended September 302017 2016 2017 2016
Revenue $ 18,902 $ 14,594 $ 55,074 $ 50,946Operating expenses (10,538) (9,370) (34,650) (31,734)General and administrative (177) (168) (616) (655)
8,187 5,056 19,808 18,557Depreciation (3,348) (3,060) (10,424) (9,006)Income tax (expense) recovery (10) — (6) 4(Loss) earnings from joint venture (276) 253 (1,278) 3,724
Net earnings $ 4,553 $ 2,249 $ 8,100 $ 13,279
EBITDA $ 7,911 $ 5,309 $ 18,530 $ 22,281Additions to property, plant, and equipment $ 397 $ 2,807 $ 2,904 $ 124,951Additions to property, plant, and equipment by jointventure $ — $ — $ 1,136 $ 15,883
September30, 2017
December31, 2016
Total assets $ 165,187 $ 182,997
The Company’s share of Pool revenues for the third quarter of 2017 increased by $4,308, and by $4,128 for the nine months ended September 30, 2017 when compared to the same periods in 2016. The 2017 third quarter results reflect the return of the Algoma Integrity to the Pool in the second quarter following her deployment in the Domestic Dry-Bulk business.
Operating costs increased in the 2017 third quarter by $1,168 and in the nine-month period ending September 30, 2017 by $2,916 when compared to the previous year's comparable periods. The increases were due mainly to increased dry-docking expenditures and the deployment of the Algoma Integrity back to the Ocean Self-Unloader segment.
Earnings from joint venture reflect Algoma’s 50% interest in the Marbulk joint venture. During the first quarter of 2016, Marbulk's results reflected the ownership of two vessels. Subsequent to the first quarter of 2016, one vessel was sold. Results from 2017 reflect ownership of one vessel that generated less revenue as it was in dry-dock during the first quarter and subsequently entered into a trade route at a lower daily rate. Results for 2017 year to date include foreign exchange losses of $1,109 where results for the same period in 2016 include foreign exchange gains of $1,238.
9

MANAGEMENT'S DISCUSSION & ANALYSIS
Global Short Sea Shipping
Global Short Sea Shipping Financial Review Three Months Nine MonthsEnded September 30 Ended September 302017 2016 2017 2016
Revenue $ 114,839 $ 4,975 $ 198,588 $ 12,081Operating expenses (107,002) (1,959) (180,142) (4,250)General and administrative (1,877) (209) (4,402) (395)
5,960 2,807 14,044 7,436Depreciation (2,770) (963) (6,783) (2,425)Interest expense (298) (308) (2,161) (845)Foreign exchange gain (loss) 236 (68) 582 86Income tax expense (57) — (233) —
Net earnings $ 3,071 $ 1,468 $ 5,449 $ 4,252
Company share of earnings $ 1,536 $ 734 $ 2,725 $ 2,126Amortization of vessel purchase price allocation (63) — (196) —
$ 1,473 $ 734 $ 2,529 $ 2,126
Company share of EBITDA $ 2,980 $ 1,404 $ 7,022 $ 3,718
September30, 2017
December31, 2016
Total assets $ 93,899 $ 68,656
In the second quarter of 2017, the Company expanded its Global Short Sea Shipping segment with the creation of a new joint venture operating as NovaAlgoma Short-Sea Carriers, or NASC, that will focus on short-sea dry-bulk shipping. The total consideration of the investment in the joint venture totalled U.S. $28,721. At closing, the Company acquired an interest in the NASC commercial platform and its book of business, and an interest in a fleet of 15 short-sea mini-bulkers ranging in size from 5,750dwt to 14,700dwt.
We report our interests in NACC and NASC as joint ventures and 50% of the earnings of the business, net of certain purchase accounting adjustments, is included with earnings from joint ventures in our statement of earnings.
Revenue of the joint ventures for the third quarter of 2017 was $114,839, compared to $4,975 generated by NACC alone during the third quarter of 2016. The results for the third quarter of 2017 also reflect the growth of the NACC fleet over the same period in 2016.
Operating expenses amounted to $107,002 for the third quarter of 2017 compared to $1,959 for the third quarter of 2016, mainly as a result of a growing number of vessels in the NACC fleet as well as the addition of the NASC business. Operating expenses include only those costs incurred after the ships enter operation in the case of the ships acquired during the period.
General and administrative expenses also increased quarter-over-quarter as a result of the growth in the NACC fleet and the addition of the NASC business venture. Certain support activities are provided by the two partners.
10
ALGOMA CENTRAL CORPORATION
Generally, it is NACC and NASC's practice to acquire vessels using bank financing to fund a portion of the purchase price resulting in interest charges each quarter.
Our share of earnings from the joint ventures in the third quarter of 2017 was $1,597, from which we deducted amortization of purchase price increments totaling $63, for net earnings of $1,534.
11
MANAGEMENT'S DISCUSSION & ANALYSIS
Real Estate - Discontinued Operations
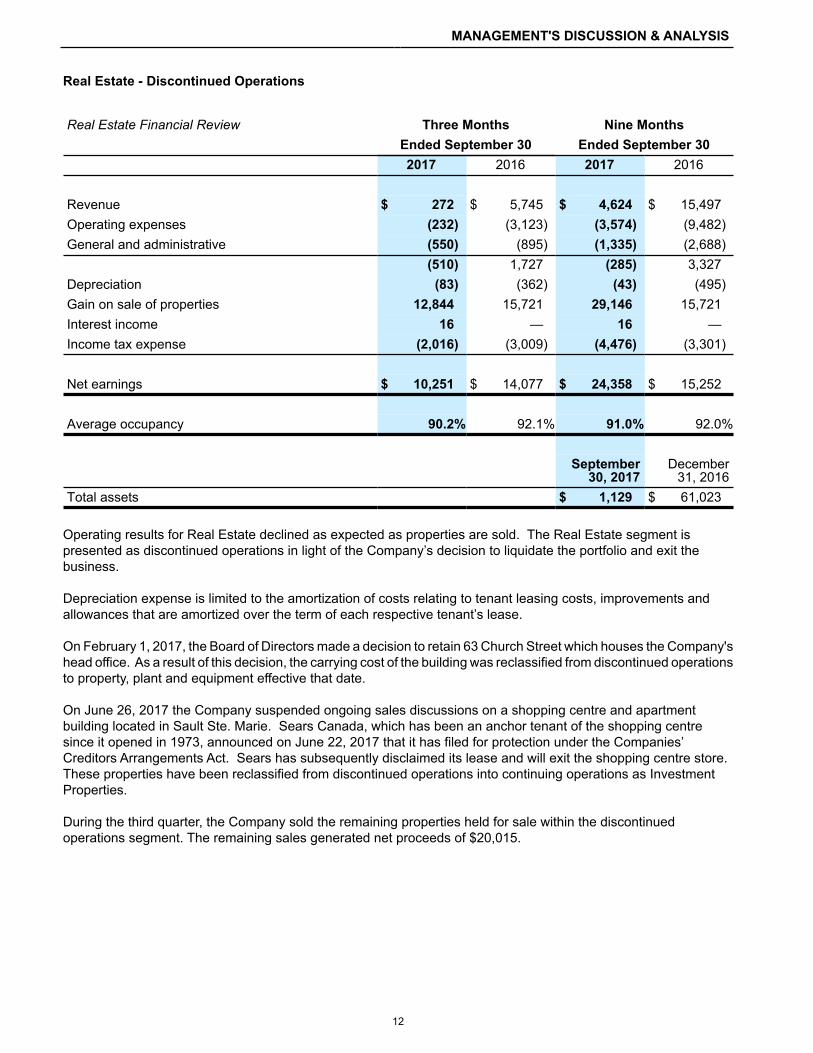
Real Estate Financial Review Three Months Nine MonthsEnded September 30 Ended September 302017 2016 2017 2016
Revenue $ 272 $ 5,745 $ 4,624 $ 15,497Operating expenses (232) (3,123) (3,574) (9,482)General and administrative (550) (895) (1,335) (2,688)
(510) 1,727 (285) 3,327Depreciation (83) (362) (43) (495)Gain on sale of properties 12,844 15,721 29,146 15,721Interest income 16 — 16 —Income tax expense (2,016) (3,009) (4,476) (3,301)
Net earnings $ 10,251 $ 14,077 $ 24,358 $ 15,252
Average occupancy 90.2% 92.1% 91.0% 92.0%
September30, 2017
December31, 2016
Total assets $ 1,129 $ 61,023
Operating results for Real Estate declined as expected as properties are sold. The Real Estate segment is presented as discontinued operations in light of the Company’s decision to liquidate the portfolio and exit the business.
Depreciation expense is limited to the amortization of costs relating to tenant leasing costs, improvements and allowances that are amortized over the term of each respective tenant’s lease.
On February 1, 2017, the Board of Directors made a decision to retain 63 Church Street which houses the Company's head office. As a result of this decision, the carrying cost of the building was reclassified from discontinued operations to property, plant and equipment effective that date.
On June 26, 2017 the Company suspended ongoing sales discussions on a shopping centre and apartment building located in Sault Ste. Marie. Sears Canada, which has been an anchor tenant of the shopping centre since it opened in 1973, announced on June 22, 2017 that it has filed for protection under the Companies’ Creditors Arrangements Act. Sears has subsequently disclaimed its lease and will exit the shopping centre store. These properties have been reclassified from discontinued operations into continuing operations as Investment Properties.
During the third quarter, the Company sold the remaining properties held for sale within the discontinued operations segment. The remaining sales generated net proceeds of $20,015.
12

ALGOMA CENTRAL CORPORATION
Consolidated
Financial Review Three Months Nine MonthsEnded September 30 Ended September 302017 2016 2017 2016
Revenue $ 136,556 $ 118,228 $ 312,301 $ 260,828Operating expenses (90,150) (76,666) (238,432) (205,568)General and administrative (5,832) (6,568) (20,749) (21,202)
40,574 34,994 53,120 34,058Depreciation of property, plant, equipment, andinvestment properties (11,017) (11,118) (33,564) (31,907)Gain on shipbuilding contracts — 7,165 — 26,387Interest expense (1,582) (2,179) (3,207) (7,217)Foreign currency gain (795) 1,081 3,209 3,524Income tax expense (5,860) (6,505) (2,340) (879)Earnings of joint ventures 1,197 987 1,251 5,850
Net earnings from continuing operations $ 22,517 $ 24,425 $ 18,469 $ 29,816
General and Administrative Expenses
General and administrative expenses in the 2017 third quarter were $736 lower than the same period in 2016 and $453 lower year-to-date when compared to the same period in 2016, mainly as a result of on-going cost cutting initiatives. A portion of general and administrative costs that excludes costs associated with the Corporate office is allocated to the Domestic Dry-Bulk and the Product Tanker segments.
Gain on Shipbuilding Contracts
In 2016, the Company recognized gains relating to a dispute involving three shipbuilding contracts. Refunds of all instalments and related interest were received in 2016 which resulted in the recognition of foreign exchange gains, interest income and the write off of capitalized interest on the construction in process.
Investment Properties
On June 26, 2017 the Company suspended sales discussions on a shopping centre and apartment building located in Sault Ste. Marie. As such, these properties and have been reclassified from discontinued operations and included in continuing operations. Under IFRS 5, the historical operating results of these properties have been reclassified to continuing operations on a retroactive basis. In addition to the retroactive reclassification, depreciation in the amount of $2,800 that had not been recorded since classification as an asset held for sale has been recorded in the second quarter of 2017 as though the asset had not been originally classified as held for sale.
Restructuring
During the second quarter, the Company instituted steps to reduce the overall head count at its head office. Restructuring provisions of $2,000 are expected to be incurred in 2017. A 13% reduction in administrative head count is expected as a result of these initiatives.
13

MANAGEMENT'S DISCUSSION & ANALYSIS
Net Interest Expense
Net interest expense consists of the following:
Three Months Nine MonthsEnded September 30 Ended September 302017 2016 2017 2016
Interest expense on borrowings $ 4,891 $ 3,850 $ 12,778 $ 11,798Amortization of financing costs 950 107 1,385 876Interest on employee future benefits, net 59 235 235 300Interest capitalized (3,970) (2,065) (10,292) (4,888)
Interest expense 1,930 2,127 4,106 8,086Interest income (348) 52 (899) (869)Net interest expense $ 1,582 $ 2,179 $ 3,207 $ 7,217
Total interest paid on borrowings remained approximately the same in 2017 when compared to 2016 as the average borrowings remained approximately the same in both years. Net interest expense decreased in 2017 when compared to 2016 due to an increase in the amount of interest capitalized on shipbuilding projects.
The interest capitalized on vessels under construction relates to interest incurred on deposit payments made to various shipyards for the construction of Equinox vessels. The increase for 2017 relates to additional instalments made on these shipbuilding contracts.
Foreign Currency Translation and Unrealized Gain on Foreign Currency Exchange Contracts
Three Months Nine MonthsEnded September 30 Ended September 302017 2016 2017 2016
Loss (gain) on long-term debt $ — $ (15) $ — $ 7,753Gain on return of capital from foreign subsidiary — 2,147 251 1,831Gain (loss) on foreign currency 694 (1,099) 1,686 (1,099)Gain (loss) on shipbuilding contracts receivable — 6 — (3,870)Gain (loss) on loan to joint venture — 42 — (1,091)(Loss) gain on foreign currency exchange contracts (1,489) — 1,272 —
$ (795) $ 1,081 $ 3,209 $ 3,524
The gain on long-term debt relates to a U.S. dollar borrowing in early 2016 that was repaid later in the year. During the period of the borrowing, the Canadian dollar strengthened against the U.S. dollar resulting in a gain on the repayment.
The gain on the return of capital from a foreign subsidiary for the third quarter in 2017 and 2016 reflects the gains on U.S. dollar cash returned from the Company’s non-controlled foreign investee.
The loss on the shipbuilding contract receivable relates to the translation loss on the amount due from the dispute with the shipyard from the date the receivable was designated as a financial asset to the date the amounts were collected.
14

ALGOMA CENTRAL CORPORATION
In January 2016, the Company provided financing to a joint venture for the purpose of purchasing a vessel. The original U.S. dollar loan was converted to Canadian dollars later in the year resulting in a foreign exchange loss caused by strengthening of the Canadian dollar.
Foreign exchange forward contracts are utilized by the Company on purchase commitments to assist in managing its foreign exchange risk associated with payments required under shipbuilding contracts with foreign shipbuilders for vessels that will join our Canadian flag domestic dry-bulk fleet. The gain on the foreign currency exchange contracts relates to the contracts being marked to market as a result of the fluctuation in the period of their fair value. The contracts were deemed to be ineffective for hedge accounting purposes as the maturity dates of the contracts ceased to coincide with the expected date of the payments to the shipyard as production schedules provided by the shipyards changed.
Income Tax Provision
A reconciliation comparing income taxes calculated at the Canadian statutory rate to the amount provided in the interim condensed consolidated financial statements is as follows:
Three Months Nine MonthsEnded September 30 Ended September 302017 2016 2017 2016
Combined federal and provincial statutory incometax rate 26.5% 26.5% 26.5% 26.5%
Earnings before income tax from continuingoperations and net earnings of joint ventures $ 27,180 $ 29,943 $ 19,558 $ 24,845
Expected income tax expense $ (7,203) $ (7,935) $ (5,183) $ (6,584)
Change resulting from:Effect of items that are not taxable 588 1,237 236 3,412Foreign tax rates different from statutory rate 1,241 557 2,274 2,452Adjustments of prior years taxes (537) (84) (537) (84)Other 51 (280) 870 (75)
Actual tax expense $ (5,860) $ (6,505) $ (2,340) $ (879)
Comprehensive Earnings
The comprehensive earnings for the three months ended September 30, 2017 were $31,859 compared to earnings of $41,978 for the comparable 2016 period, and for the nine months ended September 30, 2017 the comprehensive earnings was $23,264 compared to $16,218 for the comparable period in 2016.
The net decrease in comprehensive earnings for the quarter was due to the unrealized loss on the translation of foreign operation financial statements of $11,035. The net comprehensive earnings for the nine months ending in 2017 was $7,046 more than 2016 primarily as a result of net actuarial gains experienced on employee future benefits. The gains in the three month quarter of 2017 were $7,794, which represents the increase in comprehensive earnings for the nine months ended September 30, 2017 when compared to year-to-date 2016.
15

MANAGEMENT'S DISCUSSION & ANALYSIS
Disclosure Controls and Procedures and Internal Controls over Financial Reporting
Disclosure Controls and Procedures
The Company has established and maintained disclosure controls and procedures designed to provide reasonable assurance that: (a) material information required to be disclosed by us is accumulated and communicated to management to allow timely decisions regarding required disclosure; and (b) information required to be disclosed by us is recorded, processed, summarized, and reported within the time periods specified in applicable securities legislation.
Internal Controls over Financial Reporting
The Company's management is responsible for designing, establishing and maintaining an adequate system of internal controls over financial reporting. The internal control system was designed to provide reasonable assurance regarding the reliability of financial reporting and the preparation of financial statements for external purposes, in accordance with IFRS. Because of inherent limitations, internal controls over financial reporting may not prevent or detect all misstatements. Also, projections of any evaluation of effectiveness to future periods are subject to the risk that controls may become inadequate because of changes in conditions, or that the degree of compliance with policies and procedures may deteriorate.
Changes in Internal Controls over Financial Reporting
Under the supervision and with the participation of the Company's management, including the President and Chief Financial Officer, the Company has evaluated changes in internal controls over financial reporting that occurred during the quarter ended September 30, 2017 and found no change that has materially affected, or is reasonably likely to materially affect, internal controls over financial reporting.
Financial Condition, Liquidity and Capital Resources
Statement of Cash Flows
Nine MonthsEnded September 30 Favourable2017 2016 (Unfavourable)
Net cash generated from operating activities $ 32,924 $ 47,382 $ (14,458)Net cash used in investing activities $ (166,916) $ (175,694) $ 8,778Net cash provided from financing activities $ 23,965 $ 1,643 $ 22,322Net cash generated from discontinued operations $ 44,559 $ 37,241 $ 7,318
Operating Activities
Net cash generated from operating activities in 2017 decreased by $14,458 when compared to 2016. Excluding the $22,322 net gain realized on the shipbuilding contracts in 2016, the cash impact of which is treated as an investing activity, the increase in cash generated from operating activities in 2017 resulted primarily from an increase in net earnings from continuing operations.
Investing Activities
Net cash used in investing activities of $166,916 was primarily for instalments due on the Equinox vessels that are under construction, the purchase of the Algoma Stongfield, and the investment NovaAlgoma Short-Sea Carriers.
Net cash used in investing activities of $175,694 in the prior year was primarily for the purchase of two ocean self-unloading bulkers, an investment to acquire a 50% interest in the ocean self-unloading bulker, instalments on new Equinox Class self unloaders, investments in NovaAlgoma Cement Carriers and costs related to capitalized dry-
16
ALGOMA CENTRAL CORPORATION
docking costs on certain vessels, net of refunds of construction instalments previously paid. Financing Activities
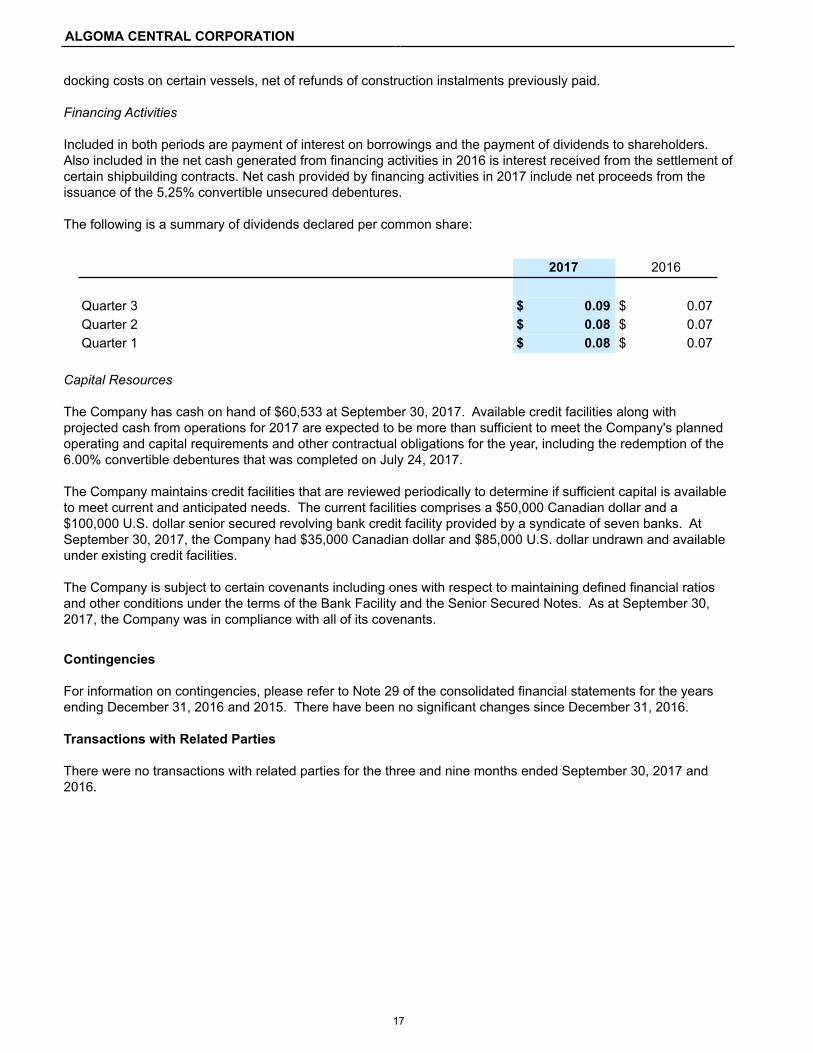
Included in both periods are payment of interest on borrowings and the payment of dividends to shareholders. Also included in the net cash generated from financing activities in 2016 is interest received from the settlement of certain shipbuilding contracts. Net cash provided by financing activities in 2017 include net proceeds from the issuance of the 5.25% convertible unsecured debentures.
The following is a summary of dividends declared per common share:
2017 2016
Quarter 3 $ 0.09 $ 0.07Quarter 2 $ 0.08 $ 0.07Quarter 1 $ 0.08 $ 0.07
Capital Resources
The Company has cash on hand of $60,533 at September 30, 2017. Available credit facilities along with projected cash from operations for 2017 are expected to be more than sufficient to meet the Company's planned operating and capital requirements and other contractual obligations for the year, including the redemption of the 6.00% convertible debentures that was completed on July 24, 2017.
The Company maintains credit facilities that are reviewed periodically to determine if sufficient capital is available to meet current and anticipated needs. The current facilities comprises a $50,000 Canadian dollar and a $100,000 U.S. dollar senior secured revolving bank credit facility provided by a syndicate of seven banks. At September 30, 2017, the Company had $35,000 Canadian dollar and $85,000 U.S. dollar undrawn and available under existing credit facilities.
The Company is subject to certain covenants including ones with respect to maintaining defined financial ratios and other conditions under the terms of the Bank Facility and the Senior Secured Notes. As at September 30, 2017, the Company was in compliance with all of its covenants.
Contingencies
For information on contingencies, please refer to Note 29 of the consolidated financial statements for the years ending December 31, 2016 and 2015. There have been no significant changes since December 31, 2016.
Transactions with Related Parties
There were no transactions with related parties for the three and nine months ended September 30, 2017 and 2016.
17
MANAGEMENT'S DISCUSSION & ANALYSIS
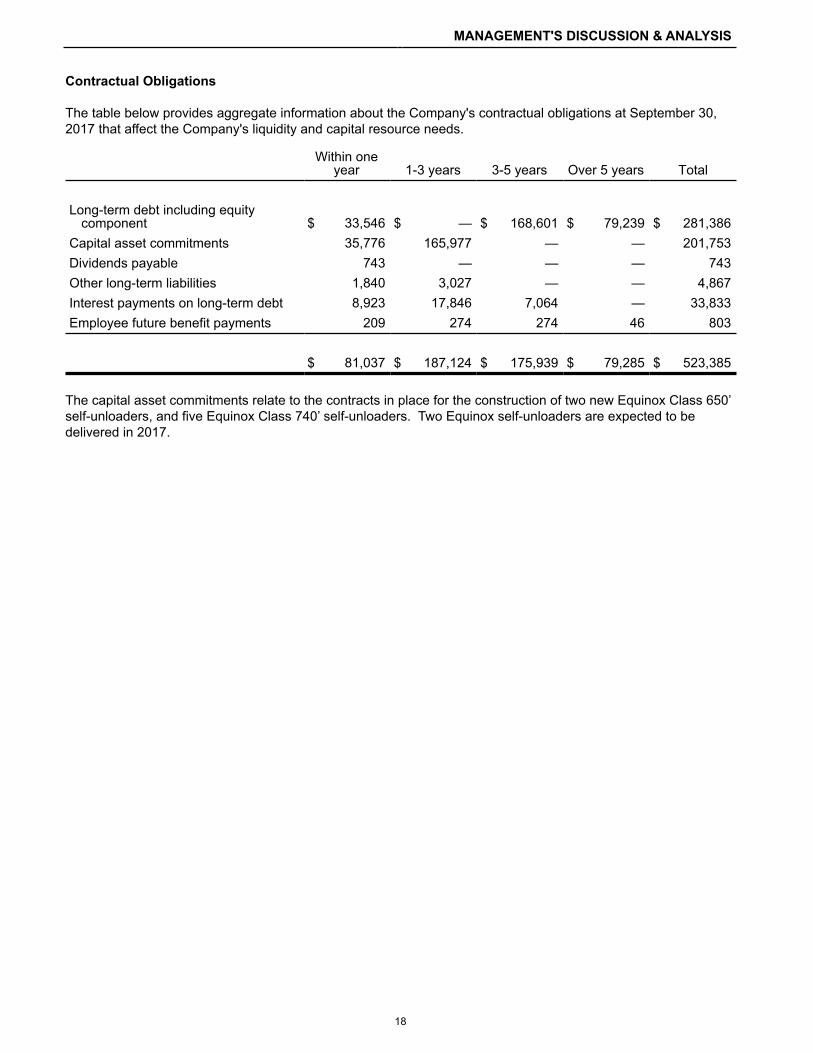
Contractual Obligations
The table below provides aggregate information about the Company's contractual obligations at September 30, 2017 that affect the Company's liquidity and capital resource needs.
Within oneyear 1-3 years 3-5 years Over 5 years Total
Long-term debt including equitycomponent $ 33,546 $ — $ 168,601 $ 79,239 $ 281,386
Capital asset commitments 35,776 165,977 — — 201,753Dividends payable 743 — — — 743Other long-term liabilities 1,840 3,027 — — 4,867Interest payments on long-term debt 8,923 17,846 7,064 — 33,833Employee future benefit payments 209 274 274 46 803
$ 81,037 $ 187,124 $ 175,939 $ 79,285 $ 523,385
The capital asset commitments relate to the contracts in place for the construction of two new Equinox Class 650’ self-unloaders, and five Equinox Class 740’ self-unloaders. Two Equinox self-unloaders are expected to be delivered in 2017.
18

Algoma Central CorporationInterim Condensed Consolidated Financial Statements For the Three and Nine Months Ended September 30, 2017 and 2016
Notice of disclosure of no auditor review of interim condensed consolidated financial statements pursuant to National Instrument 51-02, Part 4, subsection 4.3(3)(a) issued by the Canadian Securities Administrators.
The accompanying interim condensed consolidated financial statements of Algoma Central Corporation for the three and nine months ended September 30, 2017 and 2016 have been prepared in accordance with International Accounting Standard 34, Interim Financial Reporting as issued by the International Accounting Standards Board and are the responsibility of the Company's management. The Company's independent auditors have not performed an audit or a review of these interim condensed consolidated financial statements.
19

INTERIM CONDENSED CONSOLIDATED FINANCIAL STATEMENTS
Interim Condensed Consolidated Statements of EarningsFor the Three and Nine Months ended September 30, 2017 and 2016(Unaudited, in thousands of dollars, except per share data)
Three Months Ended Nine Months EndedSeptember 30 September 30
Notes 2017 2016 2017 2016Note 7 Note 7
Revenue 25 $ 136,556 $ 118,228 $ 312,301 $ 260,828
ExpensesOperations 25 90,150 76,666 238,432 205,568General and administrative 5,832 6,568 20,749 21,202
95,982 83,234 259,181 226,770
40,574 34,994 53,120 34,058Depreciation of property, plant, equipment,and investment properties (11,017) (11,118) (33,564) (31,907)Gain on shipbuilding contracts 8 — 7,165 — 26,387Interest expense 9 (1,582) (2,179) (3,207) (7,217)Foreign currency (loss) gain 10 (795) 1,081 3,209 3,524
27,180 29,943 19,558 24,845Income Tax Expense 11 (5,860) (6,505) (2,340) (879)Net Earnings of Joint Ventures 6 1,197 987 1,251 5,850
Net Earnings from ContinuingOperations 22,517 24,425 18,469 29,816Net Earnings from DiscontinuedOperations 12 10,251 14,077 24,358 15,252
Net Earnings $ 32,768 $ 38,502 $ 42,827 $ 45,068
Basic Earnings per Share Continuing operations 21 $ 0.58 $ 0.63 $ 0.47 $ 0.77 Discontinued operations $ 0.26 $ 0.36 $ 0.63 $ 0.39
$ 0.84 $ 0.99 $ 1.10 $ 1.16
Diluted Earnings per Share Continuing operations 21 $ 0.56 $ 0.59 $ 0.43 $ 0.72 Discontinued operations $ 0.24 $ 0.32 $ 0.56 $ 0.35
$ 0.80 $ 0.91 $ 0.99 $ 1.07
See accompanying notes to the interim condensed consolidated financial statements.
20

ALGOMA CENTRAL CORPORATION
Interim Condensed Consolidated Statements of Comprehensive EarningsFor the Three and Nine Months ended September 30, 2017 and 2016(Unaudited, in thousands of dollars)
Three Months Ended Nine Months EndedSeptember 30 September 30
2017 2016 2017 2016
Net Earnings $ 32,768 $ 38,502 $ 42,827 $ 45,068
Other Comprehensive (Loss) Earnings
Items that may be subsequently reclassifiedto net earnings:
Unrealized (loss) gain on translation offinancial statements of foreign operations (11,035) 2,031 (21,900) (18,930)
Unrealized gain (loss) on hedginginstruments, net of income tax 1,524 1,848 2,496 (69)
Foreign exchange losses (gains) onpurchase commitment hedge reserve, netof income tax, transferred to property,plant, and equipment 808 (1,331) (571) (2,859)
Items that will not be subsequentlyreclassified to net earnings:
Employee future benefits actuarial gain(loss), net of income tax 7,794 927 412 (6,993)
(909) 3,475 (19,563) (28,851)
Comprehensive Earnings $ 31,859 $ 41,977 $ 23,264 $ 16,217
See accompanying notes to the interim condensed consolidated financial statements.
21

INTERIM CONDENSED CONSOLIDATED FINANCIAL STATEMENTS
Interim Condensed Consolidated Balance SheetsSeptember 30, 2017 and 2016(Unaudited, in thousands of dollars)
September DecemberNotes 2017 2016
AssetsCurrent
Cash $ 60,533 $ 130,039Accounts receivable 59,055 52,172Income taxes recoverable 31,259 612Assets of discontinued operations held for sale 12 1,129 61,023Other current assets 13 12,813 13,159
164,789 257,005Employee Future Benefits 15,210 13,517Property, Plant, and Equipment 14 743,164 660,251Investment Properties 7 22,656 —Goodwill and Intangible Asset 15 16,510 11,591Investment in Joint Ventures 6 99,785 79,405Other Assets 16 14,244 14,244
$ 1,076,358 $ 1,036,013
LiabilitiesCurrent
Accounts payable and accrued charges $ 54,796 $ 76,416Current portion of long-term debt 19 33,546 —Income taxes payable 10,340 515Liabilities of discontinued operations held for sale 12 2,104 15,830Other current liabilities 17 6,669 1,297
107,455 94,058
Other Long-Term Liabilities 18 7,148 11,275Deferred Income Taxes 35,751 25,435Employee Future Benefits 24,713 23,140Long-Term Debt 19 242,057 240,555
309,669 300,405
Commitments 23
Shareholders' EquityShare Capital 21 8,344 8,344Contributed Surplus 16,547 11,917Convertible Debentures 20 3,370 4,630Accumulated Other Comprehensive Loss 22 (23,820) (3,845)Retained Earnings 654,793 620,504
659,234 641,550
$ 1,076,358 $ 1,036,013
See accompanying notes to the interim condensed consolidated financial statements.
22

ALGOMA CENTRAL CORPORATION
Interim Condensed Consolidated Statements of Changes in EquitySeptember 30, 2017 and 2016(Unaudited, in thousands of dollars)
ShareCapital
ContributedSurplus
andConvertibleDebentures
AccumulatedOther
ComprehensiveEarnings (Loss) Retained
EarningsTotal
Equity(Note 22)
Balance at December 31, 2015 $ 8,344 $ 16,547 $ 4,685 $ 589,034 $ 618,610
Net earnings — — — 45,068 45,068Dividends — — — (8,171) (8,171)Other comprehensive loss — — (21,858) (6,993) (28,851)
Balance at September 30, 2016 $ 8,344 $ 16,547 $ (17,173) $ 618,938 $ 626,656
Balance at December 31, 2016 $ 8,344 $ 16,547 $ (3,845) $ 620,504 $ 641,550
Net earnings — — — 42,827 42,827Dividends — — — (8,950) (8,950)Debenture issue — 3,370 — — 3,370Other comprehensive loss — — (19,975) 412 (19,563)
Balance at September 30, 2017 $ 8,344 $ 19,917 $ (23,820) $ 654,793 $ 659,234
See accompanying notes to the interim condensed consolidated financial statements.
23
INTERIM CONDENSED CONSOLIDATED FINANCIAL STATEMENTS
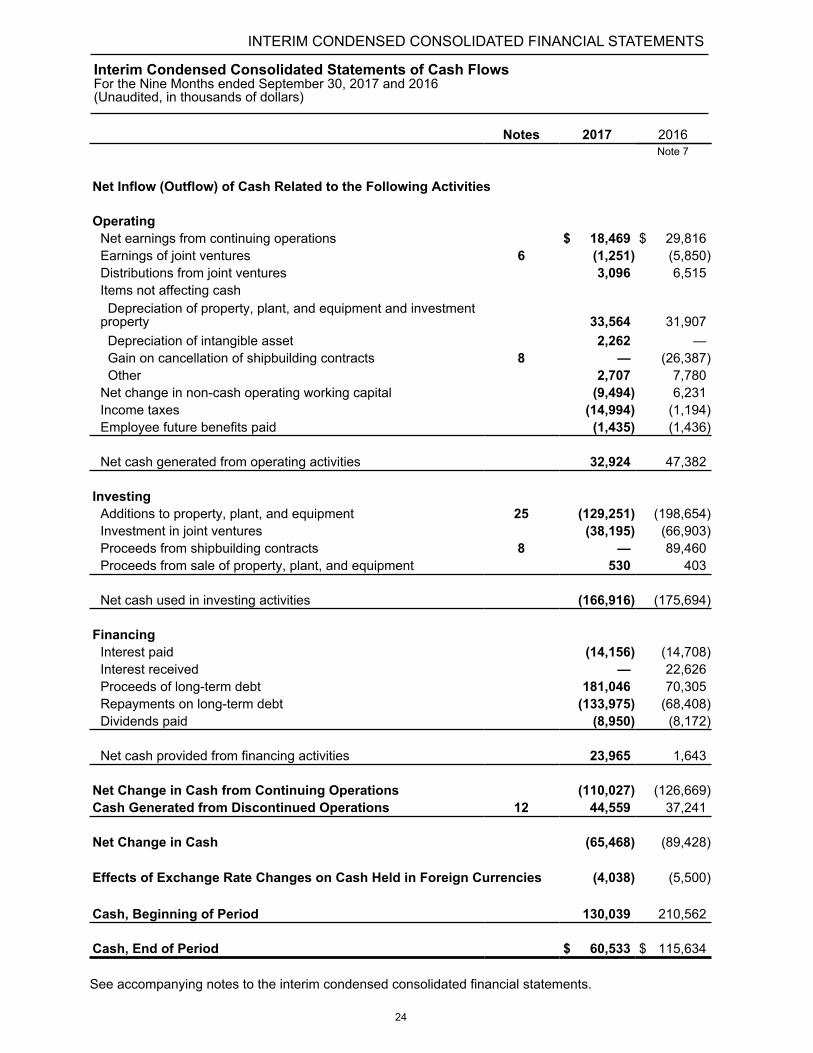
Interim Condensed Consolidated Statements of Cash FlowsFor the Nine Months ended September 30, 2017 and 2016(Unaudited, in thousands of dollars)
Notes 2017 2016Note 7
Net Inflow (Outflow) of Cash Related to the Following Activities
OperatingNet earnings from continuing operations $ 18,469 $ 29,816Earnings of joint ventures 6 (1,251) (5,850)Distributions from joint ventures 3,096 6,515Items not affecting cash Depreciation of property, plant, and equipment and investmentproperty 33,564 31,907 Depreciation of intangible asset 2,262 — Gain on cancellation of shipbuilding contracts 8 — (26,387) Other 2,707 7,780Net change in non-cash operating working capital (9,494) 6,231Income taxes (14,994) (1,194)Employee future benefits paid (1,435) (1,436)
Net cash generated from operating activities 32,924 47,382
InvestingAdditions to property, plant, and equipment 25 (129,251) (198,654)Investment in joint ventures (38,195) (66,903)Proceeds from shipbuilding contracts 8 — 89,460Proceeds from sale of property, plant, and equipment 530 403
Net cash used in investing activities (166,916) (175,694)
FinancingInterest paid (14,156) (14,708)Interest received — 22,626Proceeds of long-term debt 181,046 70,305Repayments on long-term debt (133,975) (68,408)Dividends paid (8,950) (8,172)
Net cash provided from financing activities 23,965 1,643
Net Change in Cash from Continuing Operations (110,027) (126,669)Cash Generated from Discontinued Operations 12 44,559 37,241
Net Change in Cash (65,468) (89,428)
Effects of Exchange Rate Changes on Cash Held in Foreign Currencies (4,038) (5,500)
Cash, Beginning of Period 130,039 210,562
Cash, End of Period $ 60,533 $ 115,634
See accompanying notes to the interim condensed consolidated financial statements.
24

ALGOMA CENTRAL CORPORATIONNotes to the Interim Condensed Consolidated Financial StatementsFor the Three and Nine Months ended September 30, 2017 and 2016(Unaudited, in thousands of dollars, except per share data)
1. ORGANIZATION AND DESCRIPTION OF BUSINESS
Algoma Central Corporation (the “Company”) is incorporated in Canada and is listed on the Toronto Stock Exchange. The address of the Company's registered office is 63 Church St, Suite 600, St. Catharines, Ontario, Canada. The condensed consolidated financial statements of the Company for the three and nine months ended September 30, 2017 and 2016 comprise the Company, its subsidiaries and the Company's interest in associated and jointly controlled entities.
The principal subsidiaries are Algoma Shipping Ltd., Algoma Tankers International Inc., Algoma International Shipholdings Ltd., Algoma Tankers Limited and Algoma Central Properties Inc. The principal jointly controlled entities are Marbulk Canada Inc. (50%), NovaAlgoma Cement Carriers Limited (50%) and NovaAlgoma Short-Sea Holdings Ltd. (50%). In addition, Algoma Shipping Ltd. and Marbulk Canada Inc. are members of an international pool arrangement (the “Pool”), whereby revenues and related voyage expenses are distributed to each Pool member based on the earnings capacity of the vessels.
Algoma Central Corporation owns and operates the largest Canadian flag fleet of dry and liquid bulk carriers operating on the Great Lakes – St. Lawrence Waterway. The Company's Canadian flag fleet consists of self-unloading dry-bulk carriers, gearless dry-bulk carriers and product tankers. The Company also has seven construction contracts for Equinox Class vessels for domestic dry-bulk service.
The Domestic Dry-Bulk marine transportation segment includes ownership and management of the operational and commercial activities of the Company's vessel fleet. The dry-bulk vessels carry cargoes of raw materials such as grain, iron ore, salt and aggregates and operate throughout the Great Lakes – St. Lawrence Waterway, from the Gulf of St. Lawrence through all five Great Lakes. This segment also includes the operational management of vessels owned by other ship owners.
The Product Tankers marine transportation segment includes ownership and management of the operational and commercial activities of Canadian flag tanker vessels operating on the Great Lakes, the St. Lawrence Seaway and the east coast of North America.
The Ocean Self-Unloaders marine transportation segment includes ownership of five ocean-going self-unloading vessels and a 50% interest through a joint venture in a fleet of two self-unloaders. The ocean vessels are engaged in the carriage of dry-bulk commodities in worldwide trades.
The Global Short Sea Shipping segment includes the Company's 50% interests, through joint ventures, in NovaAlgoma Cement Carriers Limited and NovaAlgoma Short-Sea Holdings Ltd.
In addition to the marine businesses, the Company also owns commercial real estate in Sault Ste. Marie and St. Catharines, Ontario.
The nature of the Company's business is such that the earnings in the first quarter of each year are not indicative of the results for the other three quarters in a year. Due to the closing of the canal system and the winter weather conditions in the Great Lakes – St. Lawrence Waterway, the majority of the domestic dry-bulk fleet does not operate for most of the first quarter. In addition, significant repair and maintenance costs are incurred in the first quarter to prepare the domestic dry-bulk fleet for the upcoming navigation season. As a result, first quarter revenues and earnings are significantly lower than those for the remaining three quarters of the year.
2. STATEMENT OF COMPLIANCE
The financial statements have been prepared in accordance with IAS 34, Interim Financial Reporting as issued by the International Accounting Standards Board ("IASB") and using the same accounting policies and methods as were used for the Company's Consolidated Financial Statements and the notes thereto for the years ended December 31, 2016 and 2015. The financial statements should be read in
25

ALGOMA CENTRAL CORPORATIONNotes to the Interim Condensed Consolidated Financial Statements (Unaudited, in thousands of dollars, except per share data)
conjunction with the Company's Consolidated Financial Statements for the years ended December 31, 2016 and 2015.
The reporting currency used is the Canadian dollar and all amounts are reported in thousands of Canadian dollars except for share data unless otherwise noted.
The consolidated financial statements were approved by the Board of Directors and authorized for issue on November 3, 2017.
3. APPLICATION OF NEW AND REVISED INTERNATIONAL FINANCIAL REPORTING STANDARDS (IFRS)
Disclosure Initiative
IAS 7 Statement of Cash Flows has been revised to incorporate amendments issued by the IASB in January 2016. The amendments require entities to provide disclosures that enable users of financial statements to evaluate changes in liabilities arising from financing activities. The amendments were effective for annual periods beginning on or after January 1, 2017.
The Company has applied this new standard in the financial statements for the annual period beginning January 1, 2017. The new standard did not have a material impact on the financial statements.
4. NEW ACCOUNTING STANDARDS NOT YET APPLIED
Revenue Recognition
In May 2014, the IASB issued IFRS 15 Revenue from Contracts with Customers. IFRS 15 replaces the detailed guidance on revenue recognition requirements that currently exists under IFRS. IFRS 15 specifies the accounting treatment for all revenue arising from contracts with customers, unless the contracts are within the scope of other IFRSs. The standard also provides a model for the measurement and recognition of gains and losses on the sale of certain non-financial assets that are not an output of the Company's ordinary activities.
Additional disclosure is required under the standard including disaggregation of total revenue, information about performance obligations, changes in contract asset and liability account balances between periods, and key judgements and estimates. The standard is effective for annual periods beginning on or after January 1, 2018. Early application is permitted either following a full retrospective approach or a modified retrospective approach. The modified retrospective approach allows the standard to be applied to existing contracts beginning in the initial period of adoption and restatements to the comparative periods are not required. The Company is required to disclose the impact by financial line item as a result of the adoption of the new standard.
IFRS 15 will principally affect the timing of revenue recognition for transactions involving multiple-element arrangements (distinct goods or services in a bundled price or deliveries of multiple services that occur at different points in time and/or over different periods of time). Similarly, the measurement of total contract acquisition costs to be recognized in operating expenses over time and contract fulfillment costs recognized over the life of the contract.
Based on the Company's preliminary assessment, as the majority of the Company's revenue is recognized based on a percentage of completion, the Company does not anticipate a significant impact to the method the Company uses to recognize revenue. In some situations there may be freight or other adjustments, on which there may be an impact under the new standards; however the Company does not anticipate these situations to have a material impact on the financial statements.
26
ALGOMA CENTRAL CORPORATIONNotes to the Interim Condensed Consolidated Financial Statements (Unaudited, in thousands of dollars, except per share data)
The Company is currently evaluating the additional disclosure requirements and will provide sufficient information to enable users of financial statements to understand the nature, amount, timing, and uncertainty of revenues and cash flows arising from contracts with customers.
Financial Instruments
In July 2014, the IASB issued the final version of IFRS 9 Financial Instruments, which replaces IAS 39 Financial Instruments: Recognition and Measurement. This final version of IFRS 9 represents the completion of the IASB’s project on financial instruments and it includes the requirements for recognition and measurement, impairment, derecognition and general hedge accounting. This final version of IFRS 9 supercedes all prior versions of IFRS 9 and is mandatorily effective for annual periods beginning on or after January 1, 2018, with early application permitted. The Company is currently evaluating the impact on the financial statements.
Leases
In January 2016, the IASB issued IFRS 16 Leases. This standard introduces a single lessee accounting model, requiring lessees to recognize assets and liabilities for all leases unless the lease term is 12 months or less or the underlying asset has a low value. A lessee is required to recognize a right-of-use asset representing its right to use the underlying asset and a lease liability representing its obligation to make lease payments. Adoption of the new standard will be required effective for annual periods beginning on or after January 1, 2019 and is to be applied retrospectively. The Company is currently evaluating the impact on the financial statements.
Sale or Contribution of Assets between an Investor and its Associate or Joint Venture
IFRS 10 Consolidated Financial Statements and IAS 28 Investments in Associates and Joint Ventures have been revised to incorporate amendments issued by the IASB in September 2014 and December 2015. The amendments include requiring a full gain or loss to be recognized when a transaction between an investor and its associate or joint venture involves assets that constitute a business. The amendments also require that a partial gain or loss be recognized when a transaction between an investor and its associate or joint venture involves assets that do not constitute a business. The effective date of theamendments has been deferred indefinitely. The Company is currently evaluating the impact on the financial statements.
5. BUSINESS ACQUISITION
On April 18, 2017, Algoma and Nova Marine Holdings SA formed a new joint venture that will focus on short-sea dry-bulk shipping. Algoma has acquired a 50% interest in the entity which will operate as NovaAlgoma Short-Sea Carriers (NASC). Under the terms of this agreement, Algoma has invested US$28.7 million to acquire an interest in an owned fleet of 15 mini-bulkers and an ownership interest in a commercial platform managing those ships and approximately 55 ships belonging to other shipowners. In addition, the Company will undertake to guarantee its share of bank loans in place on the owned vessels totalling US$16.1 million.
The agreed purchase price allocation between the parties is US$17.1 million for the vessels and $11.5 million for the interest in the commercial platform. The agreed value of the vessels was validated during due diligence by comparing it to the average of three ship valuations sought for that purpose.
As the 50% investment in NASC does not represent a controlling interest, the Company will account for it as an equity investment. A preliminary purchase price allocation is currently being evaluated.
27

ALGOMA CENTRAL CORPORATIONNotes to the Interim Condensed Consolidated Financial Statements (Unaudited, in thousands of dollars, except per share data)
6. JOINT VENTURES
The Company has a 50% interest in Marbulk Canada Inc., ("Marbulk") which owns and operates ocean-going vessels and participates in an international commercial arrangement, a 50% interest in NovaAlgoma Cement Carriers Limited, ("NACC") which owns and operates pneumatic cement carriers to support infrastructure projects worldwide, and a 50% interest in NovaAlgoma Short-Sea Carriers, ("NASC") which owns and manages short-sea dry-bulk vessels in global markets.
The revenues, expenses and net earnings of the joint ventures by segment for the three and nine months ended September 30, 2017 and 2016 are as follows:
Three Months Ended Nine Months EndedSeptember 30, 2017 September 30, 2017
Ocean Self-Unloaders
GlobalShort SeaShipping
Ocean Self-Unloaders
GlobalShort SeaShipping
Revenue $ 5,164 $ 114,839 $ 12,358 $ 198,588Operating expenses (3,283) (107,002) (8,562) (180,142)General and administrative (76) (1,877) (402) (4,402)Depreciation (997) (2,770) (3,062) (6,783)Interest expense (356) (298) (1,060) (2,161)Foreign exchange (loss) gain (1,132) 236 (2,218) 582
(Loss) earnings before income taxes (680) 3,128 (2,946) 5,682Income tax recovery (expense) 128 (57) 390 (233)
Net (loss) earnings $ (552) $ 3,071 $ (2,556) $ 5,449
Company share of net (loss) earnings $ (276) $ 1,536 $ (1,278) $ 2,725Amortization of vessel purchase price allocation — (63) — (196)
$ (276) $ 1,473 $ (1,278) $ 2,529
28
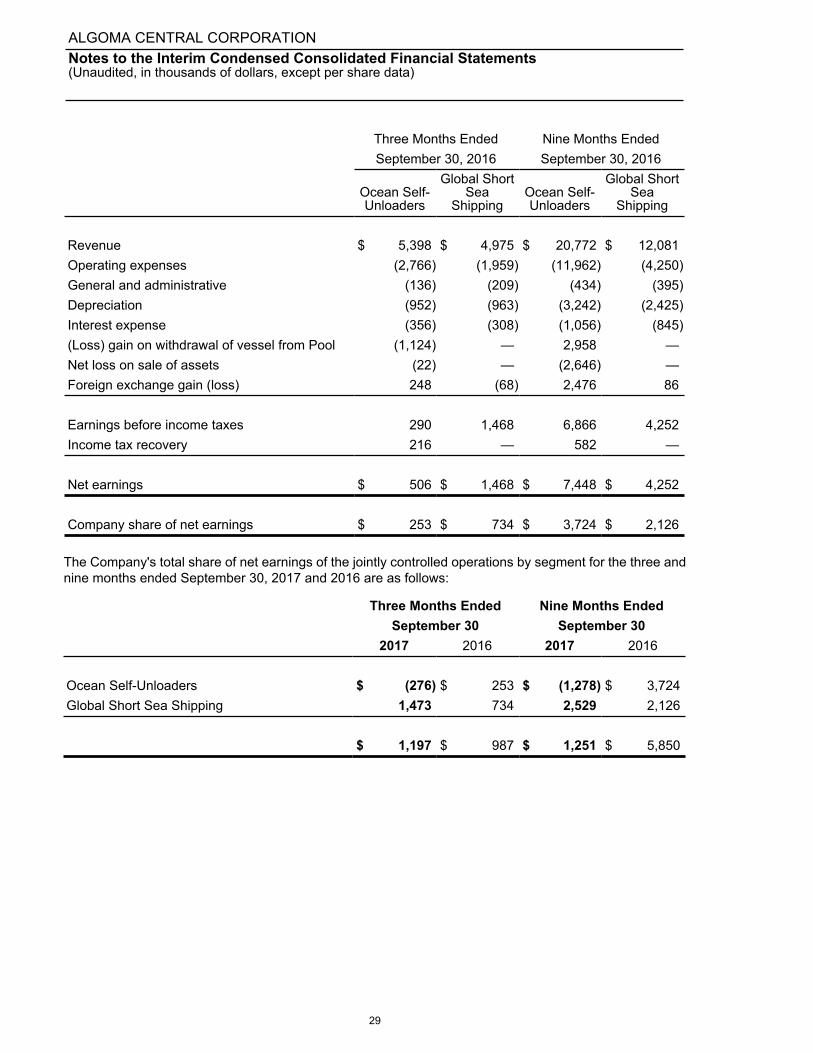
ALGOMA CENTRAL CORPORATIONNotes to the Interim Condensed Consolidated Financial Statements (Unaudited, in thousands of dollars, except per share data)
Three Months Ended Nine Months EndedSeptember 30, 2016 September 30, 2016
Ocean Self-Unloaders
Global ShortSea
ShippingOcean Self-Unloaders
Global ShortSea
Shipping
Revenue $ 5,398 $ 4,975 $ 20,772 $ 12,081Operating expenses (2,766) (1,959) (11,962) (4,250)General and administrative (136) (209) (434) (395)Depreciation (952) (963) (3,242) (2,425)Interest expense (356) (308) (1,056) (845)(Loss) gain on withdrawal of vessel from Pool (1,124) — 2,958 —Net loss on sale of assets (22) — (2,646) —Foreign exchange gain (loss) 248 (68) 2,476 86
Earnings before income taxes 290 1,468 6,866 4,252Income tax recovery 216 — 582 —
Net earnings $ 506 $ 1,468 $ 7,448 $ 4,252
Company share of net earnings $ 253 $ 734 $ 3,724 $ 2,126
The Company's total share of net earnings of the jointly controlled operations by segment for the three and nine months ended September 30, 2017 and 2016 are as follows:
Three Months Ended Nine Months EndedSeptember 30 September 30
2017 2016 2017 2016
Ocean Self-Unloaders $ (276) $ 253 $ (1,278) $ 3,724Global Short Sea Shipping 1,473 734 2,529 2,126
$ 1,197 $ 987 $ 1,251 $ 5,850
29
ALGOMA CENTRAL CORPORATIONNotes to the Interim Condensed Consolidated Financial Statements (Unaudited, in thousands of dollars, except per share data)
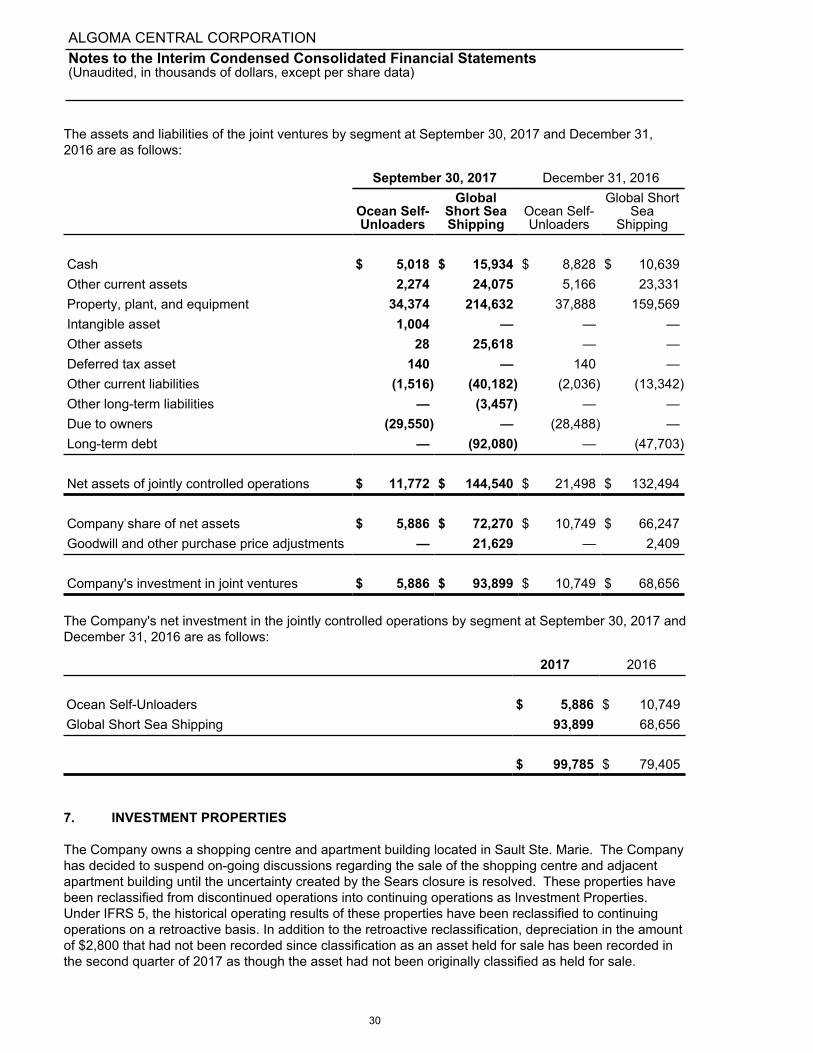
The assets and liabilities of the joint ventures by segment at September 30, 2017 and December 31, 2016 are as follows:
September 30, 2017 December 31, 2016
Ocean Self-Unloaders
GlobalShort SeaShipping
Ocean Self-Unloaders
Global ShortSea
Shipping
Cash $ 5,018 $ 15,934 $ 8,828 $ 10,639Other current assets 2,274 24,075 5,166 23,331Property, plant, and equipment 34,374 214,632 37,888 159,569Intangible asset 1,004 — — —Other assets 28 25,618 — —Deferred tax asset 140 — 140 —Other current liabilities (1,516) (40,182) (2,036) (13,342)Other long-term liabilities — (3,457) — —Due to owners (29,550) — (28,488) —Long-term debt — (92,080) — (47,703)
Net assets of jointly controlled operations $ 11,772 $ 144,540 $ 21,498 $ 132,494
Company share of net assets $ 5,886 $ 72,270 $ 10,749 $ 66,247Goodwill and other purchase price adjustments — 21,629 — 2,409
Company's investment in joint ventures $ 5,886 $ 93,899 $ 10,749 $ 68,656
The Company's net investment in the jointly controlled operations by segment at September 30, 2017 and December 31, 2016 are as follows:
2017 2016
Ocean Self-Unloaders $ 5,886 $ 10,749Global Short Sea Shipping 93,899 68,656
$ 99,785 $ 79,405
7. INVESTMENT PROPERTIES
The Company owns a shopping centre and apartment building located in Sault Ste. Marie. The Company has decided to suspend on-going discussions regarding the sale of the shopping centre and adjacent apartment building until the uncertainty created by the Sears closure is resolved. These properties have been reclassified from discontinued operations into continuing operations as Investment Properties. Under IFRS 5, the historical operating results of these properties have been reclassified to continuing operations on a retroactive basis. In addition to the retroactive reclassification, depreciation in the amount of $2,800 that had not been recorded since classification as an asset held for sale has been recorded in the second quarter of 2017 as though the asset had not been originally classified as held for sale.
30

ALGOMA CENTRAL CORPORATIONNotes to the Interim Condensed Consolidated Financial Statements (Unaudited, in thousands of dollars, except per share data)
Details of the investment properties are as follows:
Accumulated Net BookCost Depreciation Value
Balance, December 31, 2016 $ — $ — $ —
Transfer from Discontinued Operations, June 26, 2017 57,677 30,940 26,737Additions 200 4,281 (4,081)
Balance, September 30, 2017 $ 57,877 $ 35,221 $ 22,656
8. GAIN ON CANCELLATION OF SHIPBUILDING CONTRACTS
During 2016, the Company resolved the dispute with Nantong Mingde Heavy Industries Co. Ltd. (the "Shipyard") involving three shipbuilding contracts. All construction instalments made by the Company were refunded with interest resulting in a net gain of $26,387.
9. NET INTEREST EXPENSE
The components of net interest expense are as follows:
Three Months Ended Nine Months EndedSeptember 30 September 30
2017 2016 2017 2016
Interest expense on borrowings $ 4,891 $ 3,850 $ 12,778 $ 11,798Amortization of financing costs 950 107 1,385 876Interest on employee future benefits, net 59 235 235 300Interest capitalized on vessels underconstruction (3,970) (2,065) (10,292) (4,888)
Total Interest Expense 1,930 2,127 4,106 8,086Interest Income (348) 52 (899) (869)Net Interest Expense $ 1,582 $ 2,179 $ 3,207 $ 7,217
31

ALGOMA CENTRAL CORPORATIONNotes to the Interim Condensed Consolidated Financial Statements (Unaudited, in thousands of dollars, except per share data)
10. FOREIGN CURRENCY (LOSS) GAIN
The components of net (loss) gain on foreign currency translation are as follows:
Three Months Ended Nine Months EndedSeptember 30 September 30
2017 2016 2017 2016
(Loss) gain on U.S. loan $ — $ (15) $ — $ 7,753Unrealized (loss) gain on foreign currencyexchange contracts (1,489) — 1,272 —Gain on return of capital from foreign subsidiary — 1,831 251 1,831Gain (loss) on foreign currency 694 (783) 1,686 (1,099)Gain (loss) on shipbuilding contracts receivable — 6 — (3,870)Gain (loss) on loan to joint venture — 42 — (1,091)
$ (795) $ 1,081 $ 3,209 $ 3,524
11. INCOME TAXES
A reconciliation comparing income taxes calculated at the Canadian statutory rate to the amount provided in the consolidated financial statements is as follows:
Three Months Ended Nine Months EndedSeptember 30 September 30
2017 2016 2017 2016
Combined federal and provincial statutoryincome tax rate 26.5% 26.5% 26.5% 26.5%
Earnings from continuing operations beforeincome tax and net earnings of joint ventures $ 27,180 $ 29,943 $ 19,558 $ 24,845
Expected income tax expense $ (7,203) $ (7,935) $ (5,183) $ (6,584)
Increase (decrease) resulting from:Effect of items that are not taxable 588 1,237 236 3,412Foreign tax rates different from statutory rate 1,241 557 2,274 2,452Adjustments of prior years taxes (537) (84) (537) (84)Other 51 (280) 870 (75)
$ (5,860) $ (6,505) $ (2,340) $ (879)
32
ALGOMA CENTRAL CORPORATIONNotes to the Interim Condensed Consolidated Financial Statements (Unaudited, in thousands of dollars, except per share data)
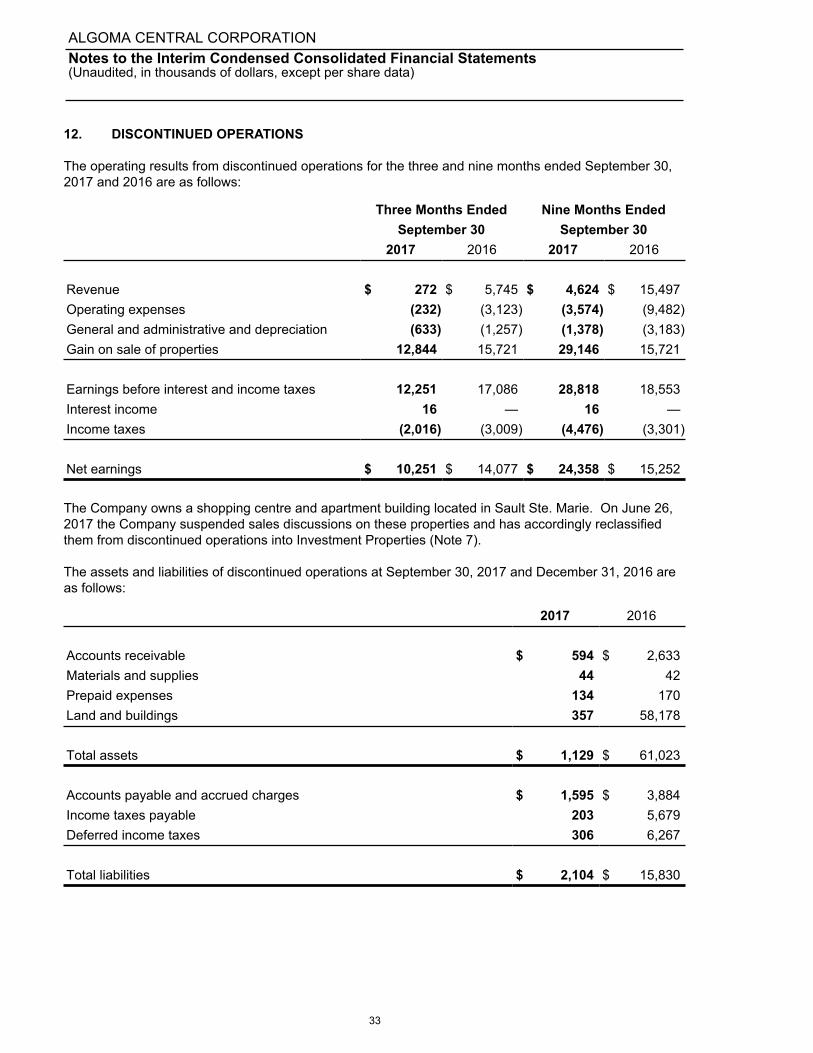
12. DISCONTINUED OPERATIONS
The operating results from discontinued operations for the three and nine months ended September 30, 2017 and 2016 are as follows:
Three Months Ended Nine Months EndedSeptember 30 September 30
2017 2016 2017 2016
Revenue $ 272 $ 5,745 $ 4,624 $ 15,497Operating expenses (232) (3,123) (3,574) (9,482)General and administrative and depreciation (633) (1,257) (1,378) (3,183)Gain on sale of properties 12,844 15,721 29,146 15,721
Earnings before interest and income taxes 12,251 17,086 28,818 18,553Interest income 16 — 16 —Income taxes (2,016) (3,009) (4,476) (3,301)
Net earnings $ 10,251 $ 14,077 $ 24,358 $ 15,252
The Company owns a shopping centre and apartment building located in Sault Ste. Marie. On June 26, 2017 the Company suspended sales discussions on these properties and has accordingly reclassified them from discontinued operations into Investment Properties (Note 7).
The assets and liabilities of discontinued operations at September 30, 2017 and December 31, 2016 are as follows:
2017 2016
Accounts receivable $ 594 $ 2,633Materials and supplies 44 42Prepaid expenses 134 170Land and buildings 357 58,178
Total assets $ 1,129 $ 61,023
Accounts payable and accrued charges $ 1,595 $ 3,884Income taxes payable 203 5,679Deferred income taxes 306 6,267
Total liabilities $ 2,104 $ 15,830
33

ALGOMA CENTRAL CORPORATIONNotes to the Interim Condensed Consolidated Financial Statements (Unaudited, in thousands of dollars, except per share data)
The cash flows from discontinued operations for the nine months ended September 30, 2017 and 2016 are as follows:
Nine Months EndedSeptember 30
2017 2016
Net cash (used in) generated from operating activities $ (8,477) $ 2,754Net cash generated from investing activities 53,036 34,488
Cash generated from discontinued operations $ 44,559 $ 37,242
13. OTHER CURRENT ASSETS
The components of other current assets are as follows:
September 30 December 312017 2016
Materials and supplies $ 8,017 $ 8,588Prepaid expenses 4,265 3,913Loan interest receivable 531 —Derivative asset — 658
$ 12,813 $ 13,159
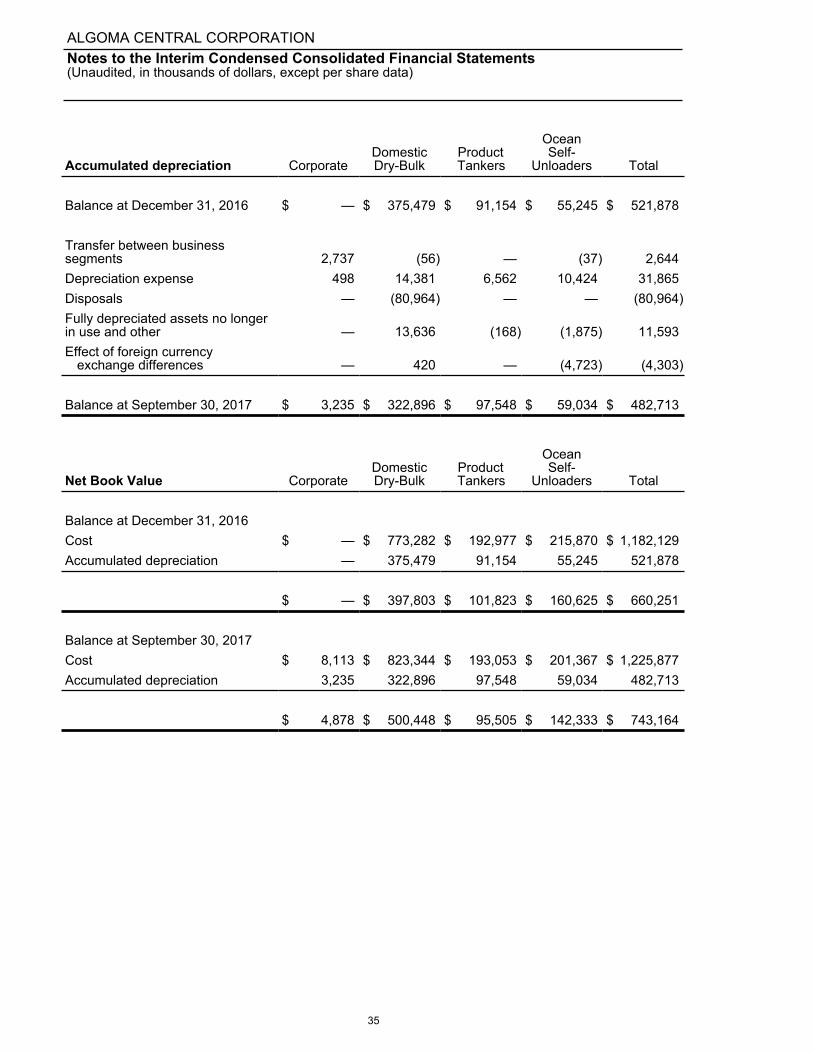
14. PROPERTY, PLANT, AND EQUIPMENT
Details of property, plant, and equipment are as follows:
Cost CorporateDomesticDry-Bulk
ProductTankers
OceanSelf-
Unloaders Total
Balance at December 31, 2016 $ — $ 773,282 $ 192,977 $ 215,870 $ 1,182,129
Transfer between businesssegments 8,024 (2,976) — 2,793 7,841Additions 89 116,712 244 2,904 119,949Disposals — (80,964) — — (80,964)Fully depreciated assets no longerin use and other — 13,636 (168) (1,875) 11,593Effect of foreign currency
exchange differences — 3,654 — (18,325) (14,671)
Balance at September 30, 2017 $ 8,113 $ 823,344 $ 193,053 $ 201,367 $ 1,225,877
34
ALGOMA CENTRAL CORPORATIONNotes to the Interim Condensed Consolidated Financial Statements (Unaudited, in thousands of dollars, except per share data)
Accumulated depreciation CorporateDomesticDry-Bulk
ProductTankers
OceanSelf-
Unloaders Total
Balance at December 31, 2016 $ — $ 375,479 $ 91,154 $ 55,245 $ 521,878
Transfer between businesssegments 2,737 (56) — (37) 2,644Depreciation expense 498 14,381 6,562 10,424 31,865Disposals — (80,964) — — (80,964)Fully depreciated assets no longerin use and other — 13,636 (168) (1,875) 11,593Effect of foreign currency
exchange differences — 420 — (4,723) (4,303)
Balance at September 30, 2017 $ 3,235 $ 322,896 $ 97,548 $ 59,034 $ 482,713
Net Book Value CorporateDomesticDry-Bulk
ProductTankers
OceanSelf-
Unloaders Total
Balance at December 31, 2016Cost $ — $ 773,282 $ 192,977 $ 215,870 $ 1,182,129Accumulated depreciation — 375,479 91,154 55,245 521,878
$ — $ 397,803 $ 101,823 $ 160,625 $ 660,251
Balance at September 30, 2017Cost $ 8,113 $ 823,344 $ 193,053 $ 201,367 $ 1,225,877Accumulated depreciation 3,235 322,896 97,548 59,034 482,713
$ 4,878 $ 500,448 $ 95,505 $ 142,333 $ 743,164
35
ALGOMA CENTRAL CORPORATIONNotes to the Interim Condensed Consolidated Financial Statements (Unaudited, in thousands of dollars, except per share data)
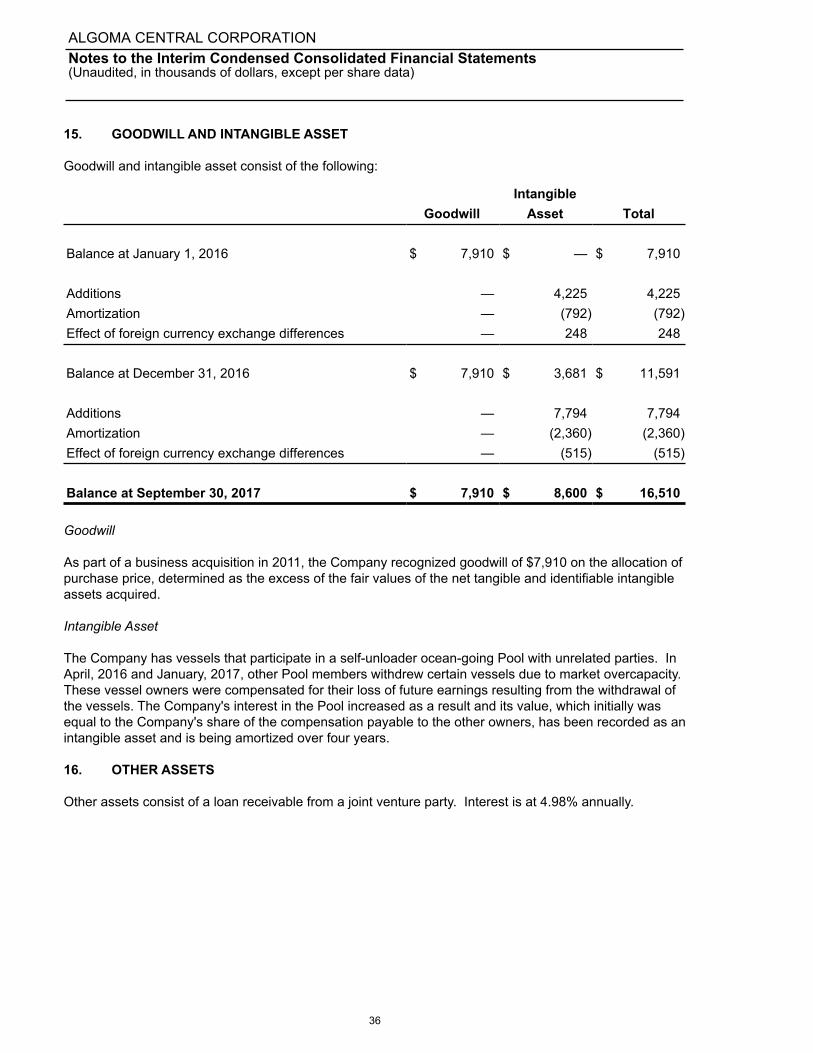
15. GOODWILL AND INTANGIBLE ASSET
Goodwill and intangible asset consist of the following:
IntangibleGoodwill Asset Total
Balance at January 1, 2016 $ 7,910 $ — $ 7,910
Additions — 4,225 4,225Amortization — (792) (792)Effect of foreign currency exchange differences — 248 248
Balance at December 31, 2016 $ 7,910 $ 3,681 $ 11,591
Additions — 7,794 7,794Amortization — (2,360) (2,360)Effect of foreign currency exchange differences — (515) (515)
Balance at September 30, 2017 $ 7,910 $ 8,600 $ 16,510
Goodwill
As part of a business acquisition in 2011, the Company recognized goodwill of $7,910 on the allocation of purchase price, determined as the excess of the fair values of the net tangible and identifiable intangible assets acquired.
Intangible Asset
The Company has vessels that participate in a self-unloader ocean-going Pool with unrelated parties. In April, 2016 and January, 2017, other Pool members withdrew certain vessels due to market overcapacity. These vessel owners were compensated for their loss of future earnings resulting from the withdrawal of the vessels. The Company's interest in the Pool increased as a result and its value, which initially was equal to the Company's share of the compensation payable to the other owners, has been recorded as an intangible asset and is being amortized over four years.
16. OTHER ASSETS
Other assets consist of a loan receivable from a joint venture party. Interest is at 4.98% annually.
36

ALGOMA CENTRAL CORPORATIONNotes to the Interim Condensed Consolidated Financial Statements (Unaudited, in thousands of dollars, except per share data)
17. OTHER CURRENT LIABILITIES
The components of other current liabilities are as follows:
September 30 December 312017 2016
Dividends payable $ 743 $ 527Derivative liabilities 5,926 770
$ 6,669 $ 1,297
18. OTHER LONG-TERM LIABILITIES
Other long-term liabilities consist of the following:
September 30 December 312017 2016
Derivative liabilities $ 2,281 $ 8,194Compensation payable to Pool members 4,867 3,081
$ 7,148 $ 11,275
A portion of the compensation payable to other Pool members for the retirement of two vessels in 2016 and two in 2017 is payable in annual instalments in future years and has been recorded as an Other Long-Term Liability. The Company's share of the liability related to this compensation is payable in four equal annual instalments that commenced April 1, 2017.
37

ALGOMA CENTRAL CORPORATIONNotes to the Interim Condensed Consolidated Financial Statements (Unaudited, in thousands of dollars, except per share data)
19. LONG-TERM DEBT
September 30 December 312017 2016
Convertible unsecured subordinated debentures, due June 30, 2024,interest at 5.25% (Note 20) $ 79,239 $ —
Convertible unsecured subordinated debentures, due March 31, 2018,interest at 6.00% — 67,555
Senior Secured Notes, due July 19, 2021 U.S. $75,000, interest fixed at 5.11% 93,601 100,705 Canadian $75,000, interest fixed at 5.52% 75,000 75,000LIBOR, U.S. $15,000, due October 20, 2017, interest at 3.24% 18,546 —Prime rate loan, interest at 4.2% 15,000 —
281,386 243,260Less: unamortized financing expenses 5,783 2,705
275,603 240,555Less: current portion of long-term debt (33,546) —
$ 242,057 $ 240,555
The Company is subject to certain covenants including ones with respect to maintaining defined financial ratios and other conditions under the terms of the Bank Facility and the Senior Secured Notes.
As at September 30, 2017, the Company was in compliance with all of its covenants.
20. CONVERTIBLE DEBENTURES
In June 2017, the Company issued $82,500 of convertible unsecured subordinated debentures (the “2017 Debentures”). Each 2017 Debenture may be convertible into common shares of the Company at the option of the holder at any time prior to maturity at a price equal to $21.15 per common share. On redemption at the maturity date, the Company may repay the indebtedness represented by the 2017 Debentures by paying an amount equal to the aggregate principal amount of the outstanding debentures. The Company has the option to repay the principal amount with common shares. The proceeds of the 2017 Debenture issue, net of related costs, were $78,383.
The 2017 Debentures are compound financial instruments and as such have been recorded as a liability and as equity. The liability component was valued first and the difference between the proceeds of the 2017 Debenture and the fair value of the liability was assigned to the equity component. The carrying value of the equity component before income tax and financing costs is $3,370.
The present value of the liability, net of expenses, of $75,181 was calculated using a discount rate of 6.0% which approximated the interest rate that would have been applicable to non-convertible debt of the Company at the time the debentures were issued. The liability component will be accreted to the face value of the debentures over the term of the debentures with a resulting charge to interest expense.
38

ALGOMA CENTRAL CORPORATIONNotes to the Interim Condensed Consolidated Financial Statements (Unaudited, in thousands of dollars, except per share data)
On July 21, 2017, the Company redeemed the convertible unsecured subordinated debentures due March 31, 2018 (the "2011 Debentures"). As the 2011 Debentures were redeemed without conversion, the equity component relating to the 2011 Debentures in the amount of $4,630 was transferred to Contributed Surplus.
21. SHARE CAPITAL
Share capital
Authorized share capital consists of an unlimited number of common and preferred shares with no par value. The Company has 38,913,733 common shares outstanding as at September 30, 2017 and December 31, 2016. At September 30, 2017 and December 31, 2016 there were no preferred shares issued and outstanding.
The Company’s Board of Directors on November 3, 2017 authorized payment of a quarterly dividend to shareholders of $0.09 per common share. The dividend is payable on December 1, 2017 to shareholders of record on November 17, 2017.
The basic and diluted net earnings per share are computed as follows:
Three Months Ended Nine Months EndedSeptember 30 September 30
2017 2016 2017 2016
Net earnings from continuing operations for basicearnings per share $ 22,517 $ 24,425 $ 18,469 $ 29,816
Interest expense on debentures, net of tax 1,342 1,078 3,772 3,234
Net earnings from continuing operations fordiluted earnings per share $ 23,859 $ 25,503 $ 22,241 $ 33,050
Basic weighted average common shares 38,913,733 38,913,733 38,913,733 38,913,733Shares due to dilutive effect of debentures 3,900,709 4,478,896 6,212,545 4,478,896
Diluted weighted average common shares 42,814,442 43,392,629 45,126,278 43,392,629
Basic earnings per common share fromcontinuing operations $ 0.58 $ 0.63 $ 0.47 $ 0.77Diluted earnings per common share fromcontinuing operations $ 0.56 $ 0.59 $ 0.43 $ 0.72
39

ALGOMA CENTRAL CORPORATIONNotes to the Interim Condensed Consolidated Financial Statements (Unaudited, in thousands of dollars, except per share data)
22. ACCUMULATED OTHER COMPREHENSIVE LOSS
Hedges
Netinvestment
Purchasecommitment
Foreignexchangetranslation Total
Balance at January 1, 2016 $ (22,409) $ 7,145 $ 19,949 $ 4,685
Gain (loss) on foreign exchange 4,356 (922) (9,529) (6,095)Reclassified to property, plant, and equipment — (2,859) — (2,859)Income tax (expense) recovery (578) 1,002 — 424Net gain (loss) 3,778 (2,779) (9,529) (8,530)
Balance at December 31, 2016 $ (18,631) $ 4,366 $ 10,420 $ (3,845)
Gain (loss) on foreign exchange 7,911 (5,191) (22,602) (19,882)Reclassified to property, plant, and equipment — (571) — (571)Income tax (expense) recovery (1,047) 1,525 — 478Net gain (loss) 6,864 (4,237) (22,602) (19,975)
Balance at September 30, 2017 $ (11,767) $ 129 $ (12,182) $ (23,820)
The net investment hedge reserve represents the cumulative exchange differences on translation of long-term debt held in foreign currency. The Company has elected to hedge a portion of its net investment in foreign subsidiaries with its foreign-denominated debt. Exchange differences accumulated will be reclassified to earnings in the event of a disposal of a foreign operation.
The purchase commitment hedge reserve represents the cumulative exchange differences on translation of cash held in foreign currency which the Company has elected to designate as a hedge of future U.S. dollar commitments for the Equinox Class vessels. Exchange differences accumulated in the purchase commitment reserve will be reclassified to property, plant, and equipment when the payments to the supplier are made or to earnings when a hedge is deemed to be ineffective.
Exchange differences relating to the translation of the results and net assets of the Company's foreign operations from their functional currencies to the Company's presentation currency (Canadian dollars) are recognized directly in other comprehensive earnings and accumulated in the foreign exchange translation reserve. Exchange differences accumulated in the reserve are reclassified to earnings on the disposal of the foreign operation or on a pro-rata basis when cash held in the foreign subsidiary is repatriated to Canada as a return of the net investment.
23. COMMITMENTS
The table below reflects the commitments the Company has at September 30, 2017.
40

ALGOMA CENTRAL CORPORATIONNotes to the Interim Condensed Consolidated Financial Statements (Unaudited, in thousands of dollars, except per share data)
Construction of seven Equinox Class vessels $ 201,753Employee future benefit payments 803
$ 202,556
Annual expected payments are as follows:
Due in 2017 $ 35,986Due in 2018 121,356Due in 2019 44,895Due in 2020 136Due in 2021 and beyond 183
$ 202,556
24. FINANCIAL INSTRUMENTS AND RISK MANAGEMENT
Financial Instruments
The carrying value and fair value of financial assets and financial liabilities are as follows:
September 30 December 312017 2016
Financial assets carrying and fair value
Cash $ 60,533 $ 130,039Accounts receivable $ 59,055 $ 52,172Derivative asset $ — $ 658Other assets $ 14,775 $ 14,244
Financial liabilities carrying and fair value
Accounts payable and accrued charges $ 54,796 $ 76,416Dividends payable $ 743 $ 527Derivative liabilities $ 5,926 $ 770Other long-term liabilities $ 7,148 $ 11,275Carrying value of long-term debt $ 281,386 $ 243,260Fair value of long-term debt $ 297,690 $ 257,454
Risk Management and Financial Instruments
The Company is exposed to various risks arising from financial instruments. The following analysis provides a measurement of those risks.
41
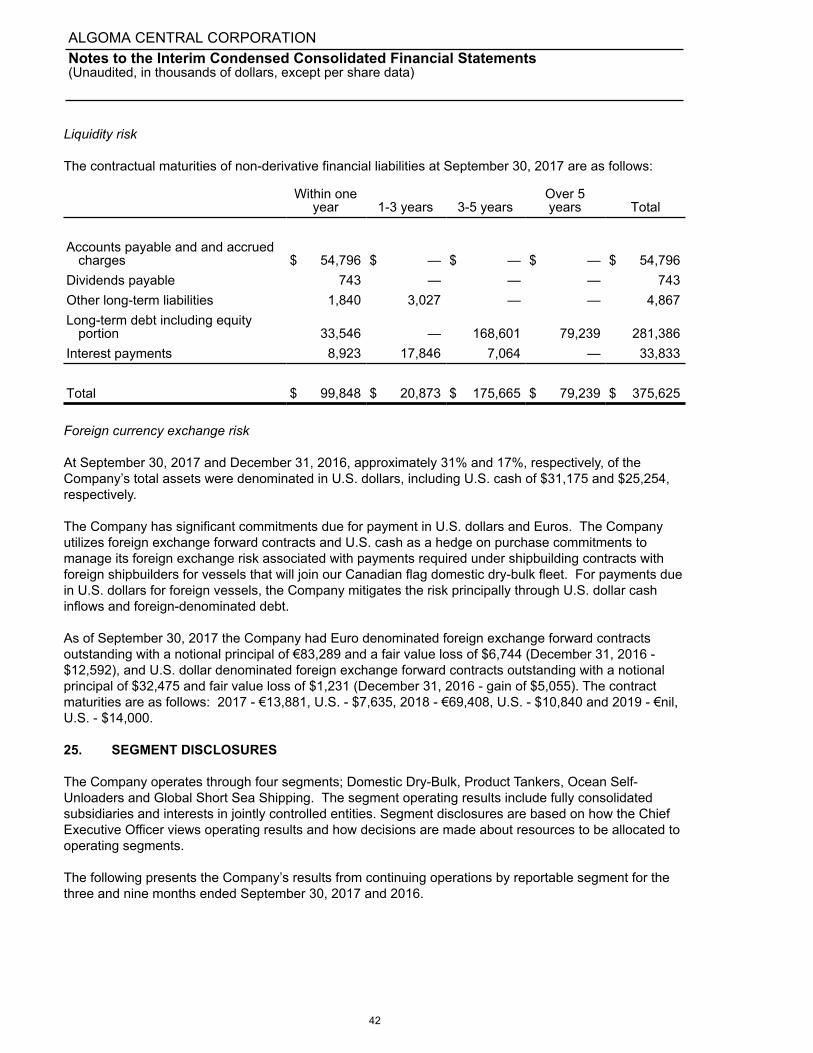
ALGOMA CENTRAL CORPORATIONNotes to the Interim Condensed Consolidated Financial Statements (Unaudited, in thousands of dollars, except per share data)
Liquidity risk
The contractual maturities of non-derivative financial liabilities at September 30, 2017 are as follows:
Within oneyear 1-3 years 3-5 years
Over 5years Total
Accounts payable and and accruedcharges $ 54,796 $ — $ — $ — $ 54,796
Dividends payable 743 — — — 743Other long-term liabilities 1,840 3,027 — — 4,867Long-term debt including equity
portion 33,546 — 168,601 79,239 281,386Interest payments 8,923 17,846 7,064 — 33,833
Total $ 99,848 $ 20,873 $ 175,665 $ 79,239 $ 375,625
Foreign currency exchange risk
At September 30, 2017 and December 31, 2016, approximately 31% and 17%, respectively, of the Company’s total assets were denominated in U.S. dollars, including U.S. cash of $31,175 and $25,254, respectively.
The Company has significant commitments due for payment in U.S. dollars and Euros. The Company utilizes foreign exchange forward contracts and U.S. cash as a hedge on purchase commitments to manage its foreign exchange risk associated with payments required under shipbuilding contracts with foreign shipbuilders for vessels that will join our Canadian flag domestic dry-bulk fleet. For payments due in U.S. dollars for foreign vessels, the Company mitigates the risk principally through U.S. dollar cash inflows and foreign-denominated debt.
As of September 30, 2017 the Company had Euro denominated foreign exchange forward contracts outstanding with a notional principal of €83,289 and a fair value loss of $6,744 (December 31, 2016 - $12,592), and U.S. dollar denominated foreign exchange forward contracts outstanding with a notional principal of $32,475 and fair value loss of $1,231 (December 31, 2016 - gain of $5,055). The contract maturities are as follows: 2017 - €13,881, U.S. - $7,635, 2018 - €69,408, U.S. - $10,840 and 2019 - €nil, U.S. - $14,000.
25. SEGMENT DISCLOSURES
The Company operates through four segments; Domestic Dry-Bulk, Product Tankers, Ocean Self-Unloaders and Global Short Sea Shipping. The segment operating results include fully consolidated subsidiaries and interests in jointly controlled entities. Segment disclosures are based on how the Chief Executive Officer views operating results and how decisions are made about resources to be allocated to operating segments.
The following presents the Company’s results from continuing operations by reportable segment for the three and nine months ended September 30, 2017 and 2016.
42

ALGOMA CENTRAL CORPORATIONNotes to the Interim Condensed Consolidated Financial Statements (Unaudited, in thousands of dollars, except per share data)
Three Months Ended Nine Months EndedSeptember 30 September 30
Revenues 2017 2016 2017 2016
Domestic Dry-Bulk $ 89,539 $ 81,900 $ 188,919 $ 157,671Product Tankers 25,247 18,839 59,577 43,395Ocean Self-Unloaders 18,902 14,594 55,074 50,946
133,688 115,333 303,570 252,012Investment Properties 2,868 2,895 8,731 8,816
$ 136,556 $ 118,228 $ 312,301 $ 260,828
Three Months Ended Nine Months EndedSeptember 30 September 30
Operating Expenses 2017 2016 2017 2016
Domestic Dry-Bulk $ 60,467 $ 55,347 $ 148,072 $ 139,016Product Tankers 17,259 10,101 47,958 28,694Ocean Self-Unloaders 10,538 9,370 34,650 31,734
88,264 74,818 230,680 199,444Investment Properties 2,059 1,848 9,410 6,124
$ 90,323 $ 76,666 $ 240,090 $ 205,568
43

ALGOMA CENTRAL CORPORATIONNotes to the Interim Condensed Consolidated Financial Statements (Unaudited, in thousands of dollars, except per share data)
Three Months Ended Nine Months EndedSeptember 30 September 30
Net Earnings from Continuing Operations 2017 2016 2017 2016
Operating earnings net of income tax
Domestic Dry-Bulk $ 15,992 $ 12,673 $ 13,745 $ (7,058)Gain on cancellation of shipbuilding
contracts — 6,126 — 22,322Unrealized (loss) gain on foreign currency
exchange contracts (1,291) — 1,103 —14,701 18,799 14,848 15,264
Product Tankers 4,596 5,003 2,832 5,131Ocean Self-Unloaders 4,553 2,249 8,100 13,279Global Short Sea Shipping 1,472 734 2,529 2,126Corporate (2,310) (2,429) (8,128) (7,726)
Segment earnings 23,012 24,356 20,181 28,074Not specifically identifiable to segments
Investment properties 810 1,047 (679) 2,692Interest expense (1,930) (1,258) (4,106) (7,217)Interest income 348 (921) 899 —Foreign currency gain 693 1,081 1,937 3,524Income tax (expense) recovery (416) 120 237 2,743
$ 22,517 $ 24,425 $ 18,469 $ 29,816
September 30 December 31Assets 2017 2016
Domestic Dry-Bulk $ 561,716 $ 468,401Product Tankers 105,463 110,110Ocean Self-Unloaders 165,187 182,997Global Short Sea Shipping 93,899 68,656Assets of discontinued operations held for sale 11,279 61,023
Total assets allocated to segments 937,544 891,187Not specifically identifiable to segments 138,814 144,826
$ 1,076,358 $ 1,036,013
44

ALGOMA CENTRAL CORPORATIONNotes to the Interim Condensed Consolidated Financial Statements (Unaudited, in thousands of dollars, except per share data)
Three Months Ended Nine Months EndedSeptember 30 September 30
Additions to Property, Plant, and Equipment 2017 2016 2017 2016
Domestic Dry-Bulk $ 47,012 $ 11,432 $ 116,712 $ 76,521Product Tankers — — 244 1,799Ocean Self-Unloaders 397 2,807 2,904 124,951Corporate — 89 89 110
Total additions (Note 14) $ 47,409 $ 14,328 119,949 203,381
Capitalized interest (10,292) (4,888)Amounts included in working capital 19,594 161Total per cash flow statement $ 129,251 $ 198,654
Three Months Ended Nine Months EndedSeptember 30 September 30
Depreciation of Property, Plant, andEquipment and Investment Property 2017 2016 2017 2016
Domestic Dry-Bulk $ 4,974 $ 5,673 $ 14,381 $ 16,266Product Tankers 2,185 2,385 6,562 6,635Ocean Self-Unloaders 3,348 3,060 10,424 9,006
Corporate 337 — 539 —10,844 11,118 31,906 31,907
Investment Property 173 — 1,658 —
$ 11,017 $ 11,118 $ 33,564 $ 31,907
45

ALGOMA CENTRAL CORPORATIONNotes to the Interim Condensed Consolidated Financial Statements (Unaudited, in thousands of dollars, except per share data)
September 30 December 31Liabilities 2017 2016
Domestic Dry-Bulk $ 41,193 $ 64,993Product Tankers 20,984 22,534Ocean Self-Unloaders 13,483 9,363Liabilities of discontinued operations held for sale 12,254 15,830
Total liabilities allocated to segments 87,914 112,720
Not specifically identifiable to segmentsCurrent liabilities 6,437 527Current portion of long-term debt 33,546 —Other 289,226 281,216
Total Liabilities $ 417,123 $ 394,463
Algoma Central Corporation63 Church Street, Suite 600, St. Catharines, Ontario L2R 3C4
(905) 687-7888www.algonet.com
46

S h o r t S e a S h i p p i n g i s O U R B U S I N E S S
w w w. a l g o n e t . c o m
2 0 1 7
Interim Report to ShareholdersFor the Three and Nine Months Ended September 30, 2017