short report j. braz. chem. soc. - journal of the...
TRANSCRIPT

Short Report J. Braz. Chem. Soc., Vol. 29, No. 4, 873-880, 2018.Printed in Brazil - ©2018 Sociedade Brasileira de Química
http://dx.doi.org/10.21577/0103-5053.20170184
*e-mail: [email protected]
Comparison between Ultrasound Assisted Extraction and Microwave Digestion in the Determination of Arsenic in Edible Grains
Roberto V. Ribeiro, Júlia C. Vieira, Fabiana A. Lobo and Roberta E. S. Froes-Silva*
Departamento de Química, Universidade Federal de Ouro Preto, Campus Universitário, 35400-000 Ouro Preto-MG, Brazil
A comparative evaluation of arsenic extraction from grains using ultrasound assisted extraction (UAE) and microwave digestion (MW) was developed. The arsenic determination was carried out using hydride generation coupled to flame atomic absorption spectroscopy (HG-FAAS). The optimal extraction condition indicated for corn was 20% v v-1 of HCl, temperature of 67 °C and sonication time of 30 min. For bean, the optical condition was HNO3 in a 10% v v-1, temperature of 25 °C and sonication time of 10 min and for soybean it was 30% v v-1 HCl, temperature of 60 °C and time of 10 min. Recovery studies close to 100% in the extraction of spiked samples was achieved. The results obtained were compared with two common extraction methods for arsenic using microwave digestion and the developed methods showed a significant increase in the arsenic recovery from the samples. In the real samples it was found an arsenic concentration of 0.3 µg g-1. The developed methods proved to be efficient at extracting the arsenic present in the studied grains, being appropriate to evaluate the risk to human consumption.
Keywords: arsenic, grains, ultrasound assisted extraction, hydride generation
Introduction
Arsenic (As) is a primary pollutant that is highly toxic, easily released to the atmosphere and readily absorbed in soils. These characteristics make arsenic a hazardous pollutant to humans and the environment in general.1 Human exposure to inorganic arsenic leads to several health problems, varying from morbidity and mortality in infants to cancer, cardiovascular problems and liver intoxication in adults.2
Arsenic is naturally found in the soil. However, anthropogenic activities, like mining, can enrich the concentration within the surrounding areas where mining activity is heaviest.3 Mine tailings that contain sulfide minerals, such as gold tailings, act as the principal source of contamination around those areas. Arsenic present in these minerals that are exposed to the atmosphere, dissolve and are released to the environment.4
Arsenic can also be found in natural water, usually in its inorganic form as either AsIII or AsV. Human activities increase its concentration and water contaminated with arsenic is often used for crop irrigation which results in reduced crop production and health problems associated
with the consumption of contaminated product.5 There is evidence showing that the use of arsenic contaminated water for irrigation leads to an increase of arsenic in the soil surface and consequently increases its presence in irrigated crops.6
One of the most common sources of metal exposure to humans is from foods. Toxic metals are transferred from contaminated soils to the crops and plants, such as soybeans that show a tendency to accumulate toxic metals.7 The development of simple and reliable methods for arsenic determination in plants and food are necessary to have an accurate measure of the contamination.8 Some analytical techniques have been described for arsenic determination in food and plants sample. Mleczek et al.9 evaluated the bioaccumulation of arsenic in mushroom and the influence in the development of the species. The arsenic was determined with high performance liquid chromatography with hydride generation atomic absorption spectroscopy HPLC-HG-AAS after extraction with phosphoric acid and triton in ultrasonic bath.9 Arsenic species concentration in rice and baby rice-based product was determined by ion chromatographic (IC) after microwave acid digestion.10 The results obtained for the samples indicate that this kind of food can introduce significant concentration of inorganic arsenic into babies and young children diets.
Comparison between Ultrasound Assisted Extraction and Microwave Digestion J. Braz. Chem. Soc.874
Speciation of arsenite and arsenate was verified in the rice grain by Huang et al.11 The samples were extracted with nitric acid 0.28 M and analyzed by high performance liquid chromatography hyphenated inductively coupled plasma mass spectroscopy (HPLC-ICP-MS). The speciation of AsIII, AsV, monomethylarsinic acid (MMA) and dimethylarsinic acid (DMA) was performed on an ion exchange column. Appropriate recovery was obtained in the validation of arsenic extraction method made with certified reference materials and it was verified that arsenite was predominant in 115 of 121 samples of rice. Arsenic extraction with microwave system was used for speciation of arsenic in shiitake mushroom.12 For the extraction, a solution with 0.2% (m v-1) HNO3 and 1% (m v-1) H2O2 that oxidizes AsIII into AsV was used without converting organoarsenicals into inorganic arsenic. The determination of arsenic species was carried out by employing HPLC-ICP-MS and the separation involved the use anion and cation exchange column. The proposed method allowed the accurate and reliable determination of arsenic species. The inorganic arsenic was the predominant arsenic species found in the samples evaluated.
A simple and efficient method for arsenic extraction in plants was developed by Mir et al.,8 employing a sequential extraction method with water/methanol 1:1 (v v-1) followed by 0.1 M HCl and diluted HCl. Arsenic was quantified by inductively coupled plasma optical emission spectrometry (ICP OES), HPLC-HG-AAS, HPLC-ICP-MS and X-ray absorption near edge spectroscopy (XANES) to evaluate the stability of AsIII and AsV during the extraction process. In the sequential method, almost twice as much arsenic was extracted when compared to the efficiency of the traditional method and was also useful for the extraction of both inorganic and organic arsenic species.
Hydride generation (HG) techniques coupled with atomic absorption spectroscopy are often employed to determine low concentrations of arsenic in food samples.8,13-17 Hydride generation coupled with flame atomic absorption spectroscopy (HG-FAAS) is a technique capable of providing good limits of detection (LOD) for arsenic18 that are below the threshold of 10 µg L-1 established by the Brazilian regulation for water used for irrigation, human consumption and recreation.19
Ultrasonic assisted extraction (UAE) is often used as a suitable extraction method of arsenic in solids samples.8,17,20 One of the biggest problems with extraction of arsenic is its loss to the environment by volatilization.21 UAE has been shown to be a reliable extraction method that reduces the loss of arsenic and yields good results.22
The use of multivariate optimization methods for optimization is continuously increasing, due to its
advantages in extracting information from a series of data.23,24 This method allows us to study multiple variables simultaneously and it is a faster and cheaper method than proceeding with multiple univariate experiments.25 It is possible to use a multivariate optimization method to obtain the best extraction condition for the UAE method.22
Arsenic extraction methods from plants are well established but methodologies for arsenic extraction in grains like soybeans, beans and corn are poorly explored. Due to the high consumption of these foods around the world, it is important to evaluate the risk in consuming grains cultivated in regions near activities that release arsenic to the local environment. Thus, the development of an efficient method to extract arsenic from edible grains without loss by volatilization and with precise determination needs to be established. The study aim is to develop a simple and efficient method employing ultrasonic bath extraction for arsenic in edible grains cultivated in an area near gold mining activities using HG-FAAS, comparison with microwave (MW) digestion methods and application in real samples.
Experimental
Instrumentation
An analytical balance (Shimadzu ATX 224, Japan) was used to weigh all samples. Ultrasonic bath (Elma E30, Germany) was used to carry out extraction tests. The ultrasonic frequency and power were 37 kHz and 320 W, respectively. Microwave digester (Mars 6, CEM, USA) was used to extract the samples by conventional methods and compare it to ultrasonic extraction. A hydride generator (Buck Scientific 420, USA) coupled with a flame atomic absorption spectrometer (SpectrAA 50B, Varian, Australia) was employed to measure arsenic. The quartz T tube center was held at a distance of approximately 2 cm from the burner in order to reach for maximum sensibility. An air and acetylene flame with oxidizing stoichiometry was set for all analysis. The hollow cathode lamp current was 7 mA, slit width 0.5 nm and wavelength 193.7 nm (GBC XplorAA, Australia). A lyophilizer was employed to freeze dry the samples spiked with arsenic solutions (Virtis benchtop K, India). The soybeans were grounded with mortar and pestle (Unilab, India) and the corns and beans with a slicer (Marconi MA048, Brazil).
Reagents
All of the laboratory glasses and vessels used were previously cleaned with a solution of 5% laboratory detergent Extran (Merck, Brazil) and afterwards a 10% solution of

Ribeiro et al. 875Vol. 29, No. 4, 2018
nitric acid (HNO3) (Synth, Brazil). A standard 1000 mg L-1 arsenic solution (SpecSol, Brazil) was used to prepare the calibration curve and reference solutions for spiking. All the solutions were prepared with ultrapure water (BFilters, Brazil) 15 µS cm-1. For the acid solutions used in the hydride generator and for the extraction assays hydrochloric acid (HCl), sulfuric acid (H2SO4), HNO3 (Synth, Brazil) were used. To generate hydrides, a solution of 1.5% sodium borohydride (NaBH4) (Fluka, USA) and 0.5% sodium hydroxide (NaOH) (Synth, Brazil) was used. The NaBH4 solution used to react with the arsenic present in the sample and form the hydride was at 2.0% with 0.5% NaOH. The acid solution was at 10 and 3% of HCl and H2SO4, respectively. Potassium iodide (KI) (Synth, Brazil) and HCl (Synth, Brazil) were used to prepare samples to be analyzed in the HG-FAAS.
Sampling and sample preparation
Three types of grains, bean, soybean and corn, were collected on four different points inside two distinct irrigated farms located in a region with ongoing gold mining activities in Paracatu, Minas Gerais, Brazil.
In order to obtain a more homogenous sample, all grains were ground before any consequent treatment. The soybean grains were ground with mortar and pestle, while corn and bean grains were ground with a slicer.
For the spike, 20 g of each powdered grain was weighted and then spiked with 10 mL of an arsenic solution 10 mg L-1, to achieve a concentration of 5 µg g-1. The wet grains were then homogenized and freeze-dried to avoid any loss of arsenic by volatilization. The dried samples were then stored frozen in a fridge until further procedures.
All samples and standards were treated with 5% HCl and with 1% of a solution 5% m v-1 KI to guarantee that all the arsenic present in the sample is in the form of As3+ and thus react to form arsine, which is the arsenic species measured. The LOD of 0.2 µg g-1 was obtained and it was calculated as 3 times the standard deviation of 10 readings of the blank divided by the slope of the calibration curve.26
Multivariate optimization and ultrasonic assisted extraction
Multivariate optimization was used to obtain the best extraction conditions of arsenic in grains. A central composite design 23 (CCD) was used varying the temperature, sonication time and acid concentration for HCl and HNO3. For each grain, the CCD design employing HCl and HNO3 was used individually. To execute this design, 0.1500 ± 0.0005 g of the spiked samples were weighed and transferred to vessels. Afterward each acid in different concentrations was added, ranging from 10 to 30% v v-1
by the experimental design, and the volume adjusted to 50 mL with acid solution. The vessels were subsequently sealed with laboratory film and submitted to ultrasonic bath at a frequency of 60 Hz and a power of 240 W with different temperatures, 25 to 60 °C, and sonication times, 10 to 25 min. The experimental design data are shown in Tables 1 and 2.
Upon extraction, the samples were filtered to remove the remaining grains. Afterwards, the solution was cooled, sealed and stored under refrigeration for a maximum of 48 h before the analysis.
Microwave digestion
Triplicate digestions of each grain were performed by the One Touch Method Feed Grain,27 where 0.5 g triplicates of the spiked sample was transferred to an Xpress vessel (CEM) for microwave digestion and then added 10 and 2 mL of HNO3 and HCl, respectively. The samples were allowed to pre-digest open for 15 min before the vessels were sealed. The digestion occurred in one stage with power ranging from 1030-1800 W, ramp time of 20 to 25 min, hold time of 15 min and temperature of 200 °C. Then, the digested samples had their volume completed to 50 mL, stored in sealed vessels under refrigeration until the analysis.
Another method, plant material,27 was tested to compare the extraction methods. Triplicate digestions of each grain were done. The conditions were similar to the previously used method, but without a pre-digestion. The method hold time was 10 min and the volume of HNO3 was 10 mL. The digested sample volume was then completed to 50 mL, stored in sealed vessels under refrigeration until further analysis.
Both of the tested digestion methods are very similar to the recommended method for arsenic extraction by the United States Food and Drug Administration (US-FDA).28
Results and Discussion
Multivariate optimization
In search for better conditions, a 23 CCD was designed. The variables were temperature, sonication time and each acid concentration (Tables 1 and 2). All the assays were performed with a spiked sample of 5 µg g-1 of arsenic. This concentration was chosen in order to work in the linear range of the equipment and to work with a mass that is homogenous and light enough to allow efficient filtration and homogeneity in the acid solution. An attempt to use simultaneously both acids was made but did not present reliable results.

Comparison between Ultrasound Assisted Extraction and Microwave Digestion J. Braz. Chem. Soc.876
The extraction results for nitric and hydrochloric acids are shown in Tables 1 and 2, respectively.
For bean and soybean, the experiment with nitric acid as the extractant showed the best results of extraction. For corn
Table 1. Experimental design and percentage of arsenic extracted in each assay with nitric acid
AssayAcid concentration /
(%, v v-1)Temperature / °C Sonication time / min Bean extraction / % Corn extraction / % Soybean extraction / %
1 10.0 25.0 10.0 98 47 100
2 10.0 25.0 30.0 78 87 107
3 10.0 60.0 10.0 87 73 113
4 10.0 60.0 30.0 87 67 100
5 30.0 25.0 10.0 70 40 60
6 30.0 25.0 30.0 65 40 33
7 30.0 60.0 10.0 61 33 40
8 30.0 60.0 30.0 61 33 40
9 3.2 42.5 20.0 70 66 113
10 36.8 42.5 20.0 56 33 107
11 20.0 13 20.0 56 60 47
12 20.0 72 20.0 61 47 53
13 20.0 42.5 3.2 70 60 60
14 20.0 42.5 36.8 74 66 60
15 (C)a 20.0 42.5 20.0 74 60 67
16 (C)a 20.0 42.5 20.0 74 53 80
17 (C)a 20.0 42.5 20.0 78 53 74
aC: central points generated for the experimental design.
Table 2. Experimental design and percentage of arsenic extracted in each assay with hydrochloric acid
AssayAcid concentration /
(%, v v-1)Temperature / °C Sonication time / min Bean extraction / % Corn extraction / % Soybean extraction / %
1 10.0 25.0 10.0 67 68 76
2 10.0 25.0 30.0 60 77 90
3 10.0 60.0 10.0 67 77 90
4 10.0 60.0 30.0 87 77 90
5 30.0 25.0 10.0 80 91 90
6 30.0 25.0 30.0 80 95 95
7 30.0 60.0 10.0 93 95 98
8 30.0 60.0 30.0 87 98 98
9 3.2 42.5 20.0 80 77 66
10 36.8 42.5 20.0 80 91 98
11 20.0 13 20.0 73 86 90
12 20.0 72 20.0 93 95 95
13 20.0 42.5 3.2 80 86 85
14 20.0 42.5 36.8 74 86 98
15 (C)a 20.0 42.5 20.0 73 95 85
16 (C)a 20.0 42.5 20.0 80 91 90
17 (C)a 20.0 42.5 20.0 80 91 90
aC: central points generated for the experimental design.

Ribeiro et al. 877Vol. 29, No. 4, 2018
the best extraction results were obtained with hydrochloric acid as extractant.
Although a good response surface with a defined maximum was not achieved by the design, it was possible to achieve good extraction percentage of arsenic evaluating the percentage obtained with all experiments and then adopting it as the optimum condition.24 Assay number 1 in Table 1 (nitric acid) was chosen as the best extraction point, achieving good arsenic extraction percentage, with low acid concentration, room temperature and low extraction time.
The critical values obtained from fitting the data were not considered interesting for tests. The fitted response surface did not have a maximum point, it was a saddle point and thus, the critical values do not serve as an optimum.24 Evaluating the critical values obtained, the conditions were similar to assay number 7, which has a low recovery percentage, with about the same concentration of nitric acid and time, but a negative time. The Pareto chart for the bean design indicated that time is the only significant variable, p > 0.05, with a negative contribution. The effect of time was further investigated with the conditions from assay one.
To further investigate the influence of time in arsenic extraction, triplicates experiments were used with a time of 5 min, the conditions for the other two variables were adopted as the same obtained with assay 1, nitric acid concentration of 10% v v-1 and temperature of 25 °C. The results of those experiments lead to a poor extraction performance, with just 49% arsenic extracted, and a high relative standard deviation of 36.7%. Therefore, this data supported the decision of using assay 1 as the optimum extraction condition.
For corn extraction, a maximum point was achieved by the data analysis, indicating that the model is well adjusted for the method. The fitted response surface demonstrated in Figure 1 generated by quadratic equation (equation 1) indicated that the critical values obtained from this design are an acid concentration of 20%, temperature of 67 °C and sonication time of 30 min. The maximum value predicted is 98.5%. These critical values were used as the optimum extraction condition of arsenic in corn.
z = 34.39 + 2.084x – 0.0328x2 + 1.4035y – 0.0257y2 + 4.25 × 10⁻¹⁴x + 1 × 10-18xy + 0.2428y + 16.54 (1)
Both response surfaces did not fit well for soybean and saddle points were obtained. Therefore, the optimum conditions were obtained by analyzing the results from the experiments. The nitric acid procedure, although presenting good recovery, was not used due to interferences observed in the analysis with this acid as extractant. Since the hydrochloric acid extractions also presented good
recoveries and did not present such interferences, the hydrochloric acid design was used to obtain the optimum conditions.
Four different experimental points with hydrochloric acid showed a high recovery rate, assays number 7, 8, 10 and 13. The variable values of the points were then compared to decide which point was going to be used in the remaining tests. Assay number 7 was chosen due to its low sonication time. A summary of the optimum conditions used is shown in Table 3.
Spike and methodology validation
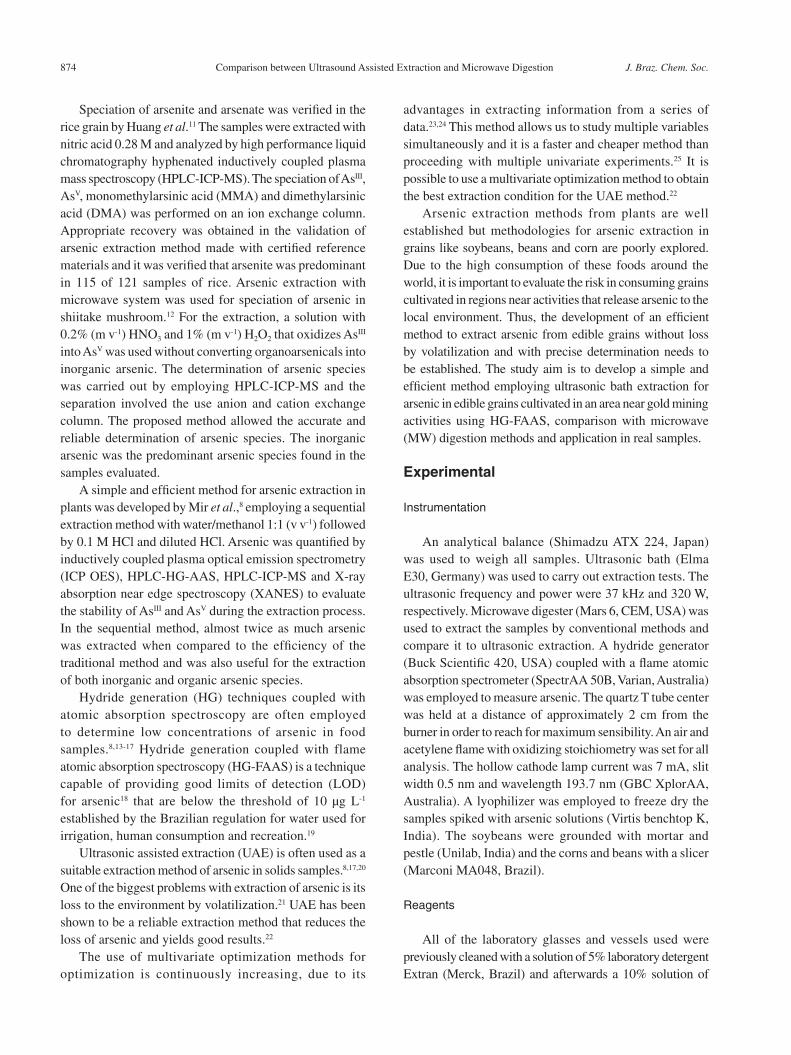
In order to validate the extraction methodology developed and to guarantee the homogeneity of the spiked samples, triplicate extractions using the optimum conditions were performed for each grain. The samples were prepared with three different spike concentrations, 5, 10 and 20 µg g-1. The means for the recoveries and relative standard deviation (RSD) obtained from this experiment are shown in Table 4.
Table 3. Optimum condition values obtained for arsenic extraction using ultrasonic bath
GrainAcid
concentration / (%, v v-1)
Temperature / °C Sonication time / min
Bean 10 25 10
Corn 20 67 30
Soybean 30 60 10
Figure 1. Fitted response surface for corn extraction obtained with the multivariate design.
Comparison between Ultrasound Assisted Extraction and Microwave Digestion J. Braz. Chem. Soc.878
The results for the recovery of the added arsenic corresponds to 93-106, 100-113, and 96-113% for bean, corn, and soybean, respectively. All RSD stayed below 10%. These results demonstrate the efficiency of the developed method.
Applying the methods to real samples
The developed method was applied to real samples of each grain. Those grains are cultivated with irrigation pivots in an area near gold mining activities suspected to be contaminated with arsenic.29 Soybeans come from two different farms and were cultivated in the summer crop. Corn and bean also originate from the same farms, and were grown in the winter crop.
The grains were dried at room temperature and subsequently milled. The optimum conditions obtained in this study were then applied to the respective grain.
The extraction and the analysis were both carried out in triplicate. The sample mass analyzed was 0.5000 ± 0.0005 g.
The arsenic concentration found in beans was 0.3 µg g-1 of sample. This concentration is the legal limit for cereals and cereal products established by the National Health Surveillance Agency (ANVISA),30 and thus raise a concern about the cultivation in the area. The arsenic concentration on the other studied grains, corn and soybean, were under the LOD of method of 0.2 µg g-1 for samples analyzed. Although some plants showed indications of contamination, such as small leaves and low yield31 the arsenic concentration was under the limit of detection of method for the majority of samples.
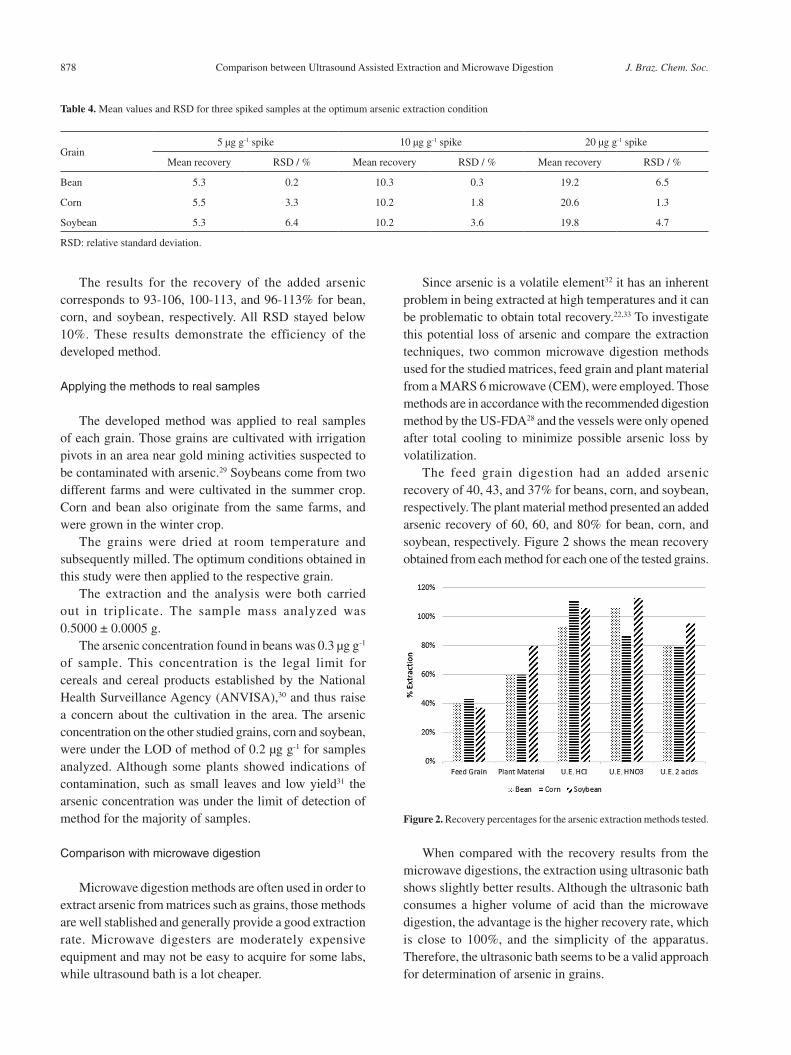
Comparison with microwave digestion
Microwave digestion methods are often used in order to extract arsenic from matrices such as grains, those methods are well stablished and generally provide a good extraction rate. Microwave digesters are moderately expensive equipment and may not be easy to acquire for some labs, while ultrasound bath is a lot cheaper.
Since arsenic is a volatile element32 it has an inherent problem in being extracted at high temperatures and it can be problematic to obtain total recovery.22,33 To investigate this potential loss of arsenic and compare the extraction techniques, two common microwave digestion methods used for the studied matrices, feed grain and plant material from a MARS 6 microwave (CEM), were employed. Those methods are in accordance with the recommended digestion method by the US-FDA28 and the vessels were only opened after total cooling to minimize possible arsenic loss by volatilization.
The feed grain digestion had an added arsenic recovery of 40, 43, and 37% for beans, corn, and soybean, respectively. The plant material method presented an added arsenic recovery of 60, 60, and 80% for bean, corn, and soybean, respectively. Figure 2 shows the mean recovery obtained from each method for each one of the tested grains.
When compared with the recovery results from the microwave digestions, the extraction using ultrasonic bath shows slightly better results. Although the ultrasonic bath consumes a higher volume of acid than the microwave digestion, the advantage is the higher recovery rate, which is close to 100%, and the simplicity of the apparatus. Therefore, the ultrasonic bath seems to be a valid approach for determination of arsenic in grains.
Table 4. Mean values and RSD for three spiked samples at the optimum arsenic extraction condition
Grain5 µg g-1 spike 10 µg g-1 spike 20 µg g-1 spike
Mean recovery RSD / % Mean recovery RSD / % Mean recovery RSD / %
Bean 5.3 0.2 10.3 0.3 19.2 6.5
Corn 5.5 3.3 10.2 1.8 20.6 1.3
Soybean 5.3 6.4 10.2 3.6 19.8 4.7
RSD: relative standard deviation.
Figure 2. Recovery percentages for the arsenic extraction methods tested.

Ribeiro et al. 879Vol. 29, No. 4, 2018
Conclusions
An ultrasonic assisted extraction method for arsenic in bean, corn and soybean grains was successfully obtained with the use of multivariate design. The multivariate optimization allowed finding an optimum extraction condition for all grains with a low number of experiments. For corn, the quadratic equation of response surface allowed us to find the critical values corresponding the optimal condition for arsenic extraction and for bean and soybean, the optimum condition was obtained evaluating the recovery results of assays from experimental design.
All three optimum extraction conditions were successfully verified with the recovery of three different spiked samples. The mean values of the three replicates were all close to 100% with an RSD under 10%, which indicate that the developed method is reproducible in the studied concentration range.
In order to apply the method in a real sample and investigate the presence of arsenic in grains cultivated on an area with indications of arsenic contamination in the environment, tests with beans, corn and soybeans from farms on the contaminated areas were analyzed. The analysis showed that there is no contamination of arsenic in concentration greater than 0.3 µg g-1 in the samples.
A comparison between the developed arsenic extraction method and pre-existing microwave digestion methods for grains showed that ultrasonic bath is a valid technique to extract arsenic from grains. A recovery rate close to 100% was obtained with the new method, this recovery rate is interesting for food matrices, since it is very important that the total amount of arsenic present be quantified to guarantee the safety of the grain for human consumption.
Acknowledgments
The authors acknowledge the CNPq, FAPEMIG, CAPES, PROPP-UFOP, PPGQUIM-UFOP by financial support and scholarships and Dr Jason G. Taylor (UFOP) for insightful discussion.
References
1. Mojsilovic, O.; McLaren, R. G.; Condron, L. M.; Environ.
Pollut. 2011, 159, 2996.
2. Schlebusch, C. M.; Gattepaille, L. M.; Engström, K.; Vahter, M.;
Jakobsson, M.; Broberg, K.; Mol. Biol. Evol. 2015, 32, 1544.
3. Otones, V.; Álvarez-Ayuso, E.; García-Sánchez, A.; Santa
Regina, I.; Murciego, A.; Environ. Pollut. 2011, 159, 2637.
4. Toujaguez, R.; Ono, F. B.; Martins, V.; Cabrera, P. P.; Blanco,
A. V.; Bundschuh, J.; Guilherme, L. R. G.; J. Hazard. Mater.
2013, 262, 1004.
5. Caporale, A. G.; Pigna, M.; Sommella, A.; Dynes, J. J.;
Cozzolino, V.; Violante, A.; J Environ. Manage. 2013, 128, 837.
6. Bundschuh, J.; Nath, B.; Bhattacharya, P.; Liu, C. W.; Armienta,
M. A.; Moreno-López, M. V.; Lopez, D. L.; Jean, J. S.; Cornejo,
L.; Macedo L. F. L.; Filho, A. T.; Sci. Total Environ. 2012, 429, 92.
7. Salazar, M. J.; Rodriguez, J. H.; Nieto, G. L.; Pignata, M. L.;
J. Hazard. Mater. 2012, 233, 244.
8. Mir, K. A.; Rutter, A.; Koch, I.; Smith, P.; Reimer, K.; Poland,
J.; Talanta 2007, 72, 1507.
9. Mleczek, M.; Niedzielski, P.; Siwulski, M.; Rzymski, P.;
Gąsecka, M.; Goliński, P.; Kozak, L.; Kozubik, T.; Eur. Food
Res. Technol. 2015, 242, 355.
10. Signes-Pastor, A. J.; Carey, M.; Meharg, A. A.; Food Chem.
2016, 191, 128.
11. Huang, J. H.; Fecher, P.; Ilgen, G.; Hu, K. N.; Yang, J.; Food
Chem. 2012, 130, 453.
12. Llorente-Mirandes, T.; Arbero, M.; Rubio, R.; López-Sánchez,
J. F.; Food Chem. 2014, 158, 207.
13. Cerveira, C.; Pozebon, D.; de Moraes, D. P.; Fraga, J. C. S.;
Anal. Methods 2015, 7, 4528.
14. Moretto, A. L.; Cadore, S.; Microchim. Acta 2004, 146, 239.
15. Rasmussen, R. R.; Hedegaard, R. V.; Larsen, E. H.; Sloth, J. J.;
Anal. Bioanal. Chem. 2012, 403, 2825.
16. Reyes, M. N.; Cervera, M. L.; Campos, R. C.; de la Guardia,
M.; Talanta 2008, 75, 811.
17. dos Santos, W. N. L.; Cavalcante, D. D.; Macedo, S. M.;
Nogueira, J. S.; da Silva, E. G. P.; Food Anal. Methods 2013,
6, 1128.
18. Macedo, S. M.; dos Santos, D. C.; de Jesus, R. M.; da Rocha,
G. O.; Ferreira, S. L. C.; de Andrade, J. B.; Microchem. J. 2010,
96, 46.
19. Conselho Nacional do Meio Ambiente (CONAMA); Resolução
No. 396, de 3 de abril de 2008; Diário Oficial da União: Brasília,
2008, seção 66, p. 64.
20. Pumure, I.; Renton, J. J.; Smart, R. B.; Chemosphere 2010, 78,
1295.
21. Afonso, D. D.; Arslan, Z.; Bednar, A. D.; Microchim. Acta 2009,
167, 53.
22. Paula, J. F. R.; Froes-Silva, R. E. S.; Ciminelli, V. S. T.;
Microchem. J. 2012, 104, 12.
23. Lavine, B. K.; Workman, J.; Anal. Chem. 2013, 85, 705.
24. Bezerra, M. A.; Santelli, R. E.; Oliveira, E. P.; Villar, L. S.;
Escaleira, L. A.; Talanta 2008, 76, 965.
25. Khajeh, M.; J. Food Sci. Technol. 2014, 51, 2576.
26. Eurachem Guide; The Fitness for Purpose of Analytical
Methods: A Laboratory Guide to Method Validation and Related
Topics, 2nd ed.; LGC (Teddington) Ltd.: Teddington, UK, 2014.
Available at https://www.eurachem.org/index.php/publications/
guides/mv, accessed in June, 2017.
Comparison between Ultrasound Assisted Extraction and Microwave Digestion J. Braz. Chem. Soc.880
27. MARS 6 Manual: Microwave Digestion and Extraction System;
CEM: Matthews, North Carolina, 2014, p. 10.
28. United States Food and Drugs Administration (US-FDA);
Analysis of Foods for As, Cd, Cr, Hg and Pb by Inductively
Coupled Plasma-Mass Spectrometry (ICP-MS); US-FDA:
Silver Spring, Maryland, 2011.
29. Rezende, P. S.; Costa, L. M.; Windmoller, C. C.; Arch. Environ.
Contam. Toxicol. 2015, 68, 588.
30. Agência Nacional de Vigilância Sanitária (ANVISA);
Resolução RDC No. 42 de 29 de agosto de 2013, Dispõe sobre
o Regulamento Técnico MERCOSUL sobre Limites Máximos
de Contaminantes Inorgânicos em Alimentos; Diário Oficial da
União: Brasília, 2013, seção 1, p. 33.
31. Gálusová, T.; Rybanský, Ľ.; Mészáros, P.; Spieß, N.; Piršelová,
B.; Kuna, R.; Libantová, J.; Moravčíková, J.; Hauptvogel, P.;
Matuíková, I.; Plant Growth Regul. 2014, 76, 147.
32. Planer-Friedrich, B.; Lehr, C.; Matschullat, J.; Merkel, B. J.;
Nordstrom, D. K.; Sandstrom, M. W.; Geochim. Cosmochim.
Acta 2006, 70, 2480.
33. Lariols, R.; Fernández-Martínez, R.; Lehecho, I.; Rucandio, I.;
Sci. Total Environ. 2012, 414, 600.
Submitted: August 10, 2017
Published online: October 13, 2017