short and medium-term oil market outlook - shfe.com.cn · short and medium-term oil market outlook...
TRANSCRIPT

© OECD/IEA 2016
Short and Medium-Term Oil Market Outlook
13th Shanghai Derivatives Market Forum - 25 May 2016

© OECD/IEA 2016
Oil world changed on Nov. 27th 2014
OPEC doesn’t cut production to support prices. “The market will find the price.”
Brent falls from $80/bbl to $70/bbl.
At Dec. 4th 2015 meeting OPEC removes production quotas & price falls from $43/bbl to $27/bbl.
20
40
60
80
100
120
May 14 Sep 14 Jan 15 May 15 Sep 15 Jan 16 May 16
$/bbl Brent crude oil
Copyright © 2016 Argus Media
© OECD/IEA 2016
Where are we now?
Demand growth is solid
China’s growth rate slows
India’s growth rate picks up
Global supply growth falling away
OPEC & non-OPEC growth down
Non-OPEC falls sharply led by US
Iran is stand-out country
Market getting close to balance
Prices reach 4-month high
Looking further ahead
© OECD/IEA 2016
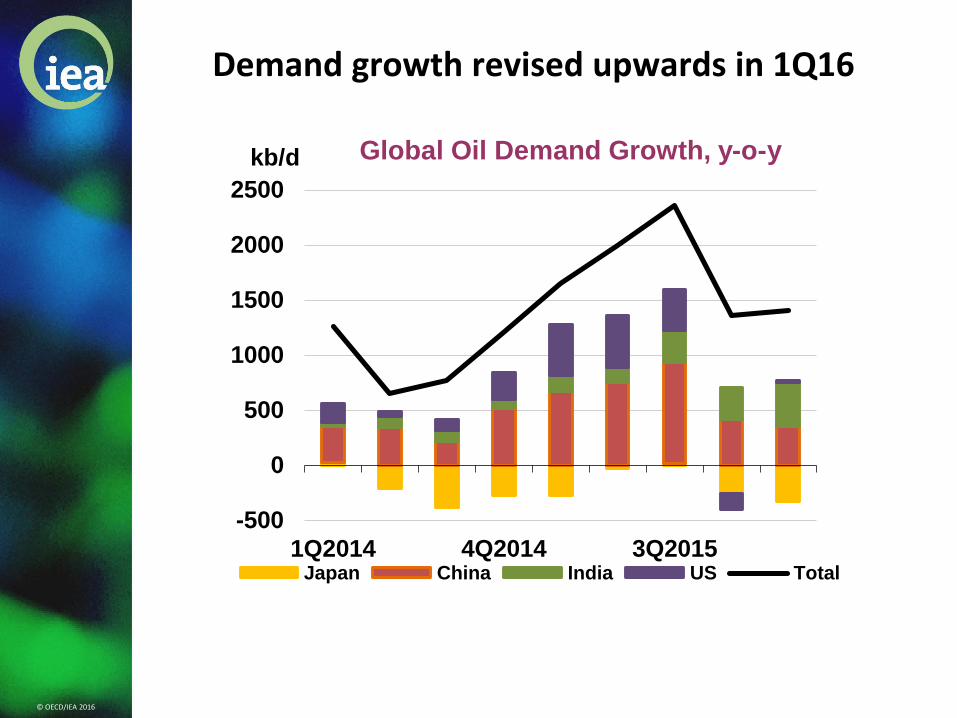
Demand growth revised upwards in 1Q16
-500
0
500
1000
1500
2000
2500
1Q2014 4Q2014 3Q2015
kb/d Global Oil Demand Growth, y-o-y
Japan China India US Total

© OECD/IEA 2016
Indian demand races ahead
0
100
200
300
400
1Q2015 3Q2015 1Q2016
kb/d Indian Demand Growth, y-o-y
LPG/naphtha FO/other
Gasoil/Jet/Kerosene Gasoline
Total

© OECD/IEA 2016
India takes the lead in oil demand growth

© OECD/IEA 2016
China – slowing growth but still strong
0%
3%
6%
9%
0
4
8
12
1Q2014 3Q2014 1Q2015 3Q2015 1Q2016
mb/d Chinese Oil Demand
LPG/naphtha Gasoline
Gasoil Others
Growth (RHS) %
© OECD/IEA 2016
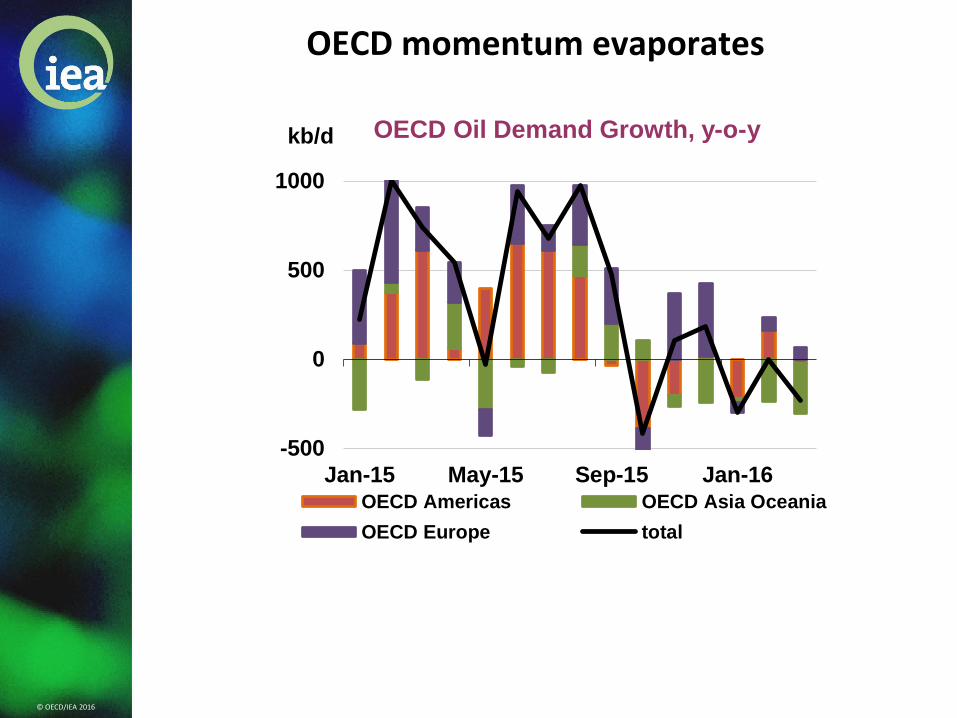
OECD momentum evaporates
-500
0
500
1000
Jan-15 May-15 Sep-15 Jan-16
kb/d OECD Oil Demand Growth, y-o-y
OECD Americas OECD Asia Oceania
OECD Europe total

© OECD/IEA 2016
Outages & low prices take toll on supply
-1.5-1.0-0.50.00.51.01.52.02.53.03.54.04.5
Jan 14 Jun 14 Nov 14 Apr 15 Sep 15 Feb 16
mb/d
Thousands
OPEC and Non-OPEC Oil Supply Year-on-Year Change
OPEC Crude Non-OPEC
OPEC NGLs Total Supply

© OECD/IEA 2016
Non-OPEC supply falling fast
-1.5
-1.0
-0.5
0.0
0.5
1.0
1.5
2.0
2.5
3.0
1Q12 1Q13 1Q14 1Q15 1Q16
mb/d
Other North America Total
Total Non-OPEC Supply, y-o-y Change

© OECD/IEA 2016
US supply growth vanishes
-1.0
-0.5
0.0
0.5
1.0
1.5
2.0
Jan-11 Jan-12 Jan-13 Jan-14 Jan-15 Jan-16
mb/d US Crude Supply - Yearly Change

© OECD/IEA 2016
OPEC pumps at robust rate
-1.5
-1.0
-0.5
0.0
0.5
1.0
1.5
2.0
Jan 14 Jul 14 Jan 15 Jul 15 Jan 16
mb/d OPEC Growth y-o-y
Other OPEC Iraq Saudi Arabia
Iran OPEC

© OECD/IEA 2016
Iran only major growth in OPEC
2.50
2.75
3.00
3.25
3.50
3.75
4.00
4.25
mb/d Iran Crude Supply

© OECD/IEA 2016
OECD stocks draw in February
2,500
2,600
2,700
2,800
2,900
3,000
3,100
Jan Mar May Jul Sep Nov Jan
mb OECD Total Oil Stocks
Range 2011-2015 Avg 2011-2015
2015 2016

© OECD/IEA 2016
Market heading towards balance
-2.5
-1.5
-0.5
0.5
1.5
2.5
3.5
84
86
88
90
92
94
96
98
1Q09 3Q10 1Q12 3Q13 1Q15 3Q16
mb/dmb/d Demand/Supply Balance until 4Q16*
Impl. stock ch.&misc (RHS) Demand Supply*
*OPEC crude production assumed to ramp up to average 33.0 mb/d in 2Q16, 33.2 mb/d in 3Q16 and 33.1 mb/d in 4Q16

© OECD/IEA 2016
Oil rallies to 4-month high near $45/bbl
20
40
60
80
100
120
May 14 Sep 14 Jan 15 May 15 Sep 15 Jan 16 May 16
$/bbl Benchmark Crude Prices
WTI Cushing N. Sea Dated Dubai
Copyright © 2016 Argus Media

© OECD/IEA 2016
Looking ahead to 2021
Demand growth solid at 1.2 mb/d through 2021
Production growth slashed as investment cuts bite
Crude trade shifts more and more eastwards
Huge uncertainties
OPEC production policy
Non-OPEC
World economy
Efficiency gains
© OECD/IEA 2016
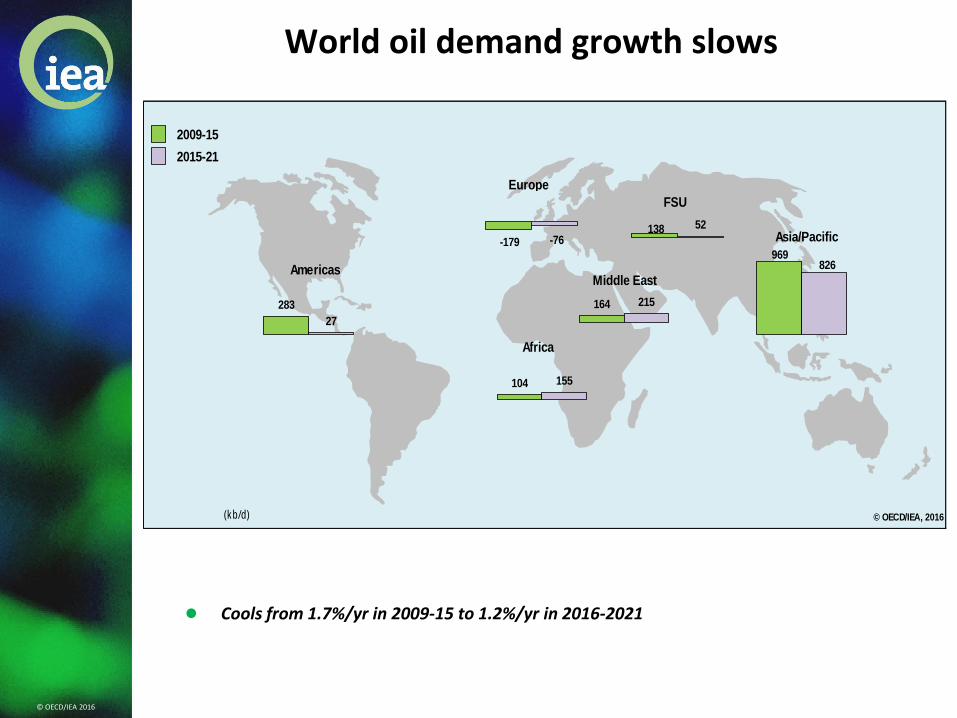
World oil demand growth slows
Cools from 1.7%/yr in 2009-15 to 1.2%/yr in 2016-2021
2009-15
2015-21
© OECD/IEA, 2016(kb/d)
-179 -76138 52
283
27
164 215
104 155
Americas
Africa
Middle East
Europe
FSU
969826
Asia/Pacific

© OECD/IEA 2016
Non-OECD drives global demand
Despite concerns about slowing Chinese demand, overall non-OECD momentum remains strong
0
10
20
30
40
50
60
2001 2003 2005 2007 2009 2011 2013 2015 2017 2019 2021
mb/d
OECD vs NonOECD Total products
OECD NonOECD
0
2
4
6
8
10
12
14
16
2001 2003 2005 2007 2009 2011 2013 2015 2017 2019 2021
mb/d
OECD vs NonOECD Motor Gasoline

© OECD/IEA 2016
Chinese demand growth slips a gear
Economy slows and shifts from industry to services
0%
2%
4%
6%
8%
10%
12%
14%
16%
18%
20%
0
2
4
6
8
10
12
14
2001 2003 2005 2007 2009 2011 2013 2015 2017 2019 2021
mb/d
LPG
Naphtha
Motor Gasoline
Jet & Kerosene
Gasoil/Diesel
Residual Fuel
Other Products
y-o-y Growth (RHS)

© OECD/IEA 2016
Indian oil use races ahead
Motorists take to the roads
0.0
1.0
2.0
3.0
4.0
5.0
6.0
2009 2010 2011 2012 2013 2014 2015 2016 2017 2018 2019 2020 2021
kb/d
LPG
Naphtha
Motor Gasoline
Jet & Kerosene
Gasoil/Diesel
Other Products
© OECD/IEA 2016
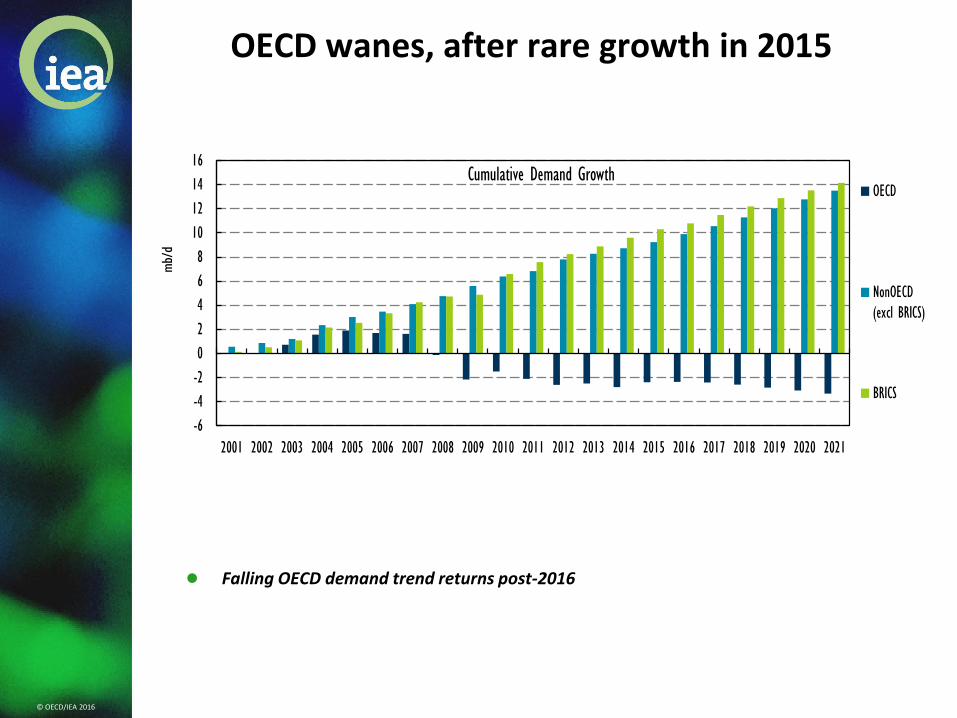
OECD wanes, after rare growth in 2015
Falling OECD demand trend returns post-2016
-6
-4
-2
0
2
4
6
8
10
12
14
16
2001 2002 2003 2004 2005 2006 2007 2008 2009 2010 2011 2012 2013 2014 2015 2016 2017 2018 2019 2020 2021
mb/dCumulative Demand Growth
OECD
NonOECD
(excl BRICS)
BRICS
© OECD/IEA 2016
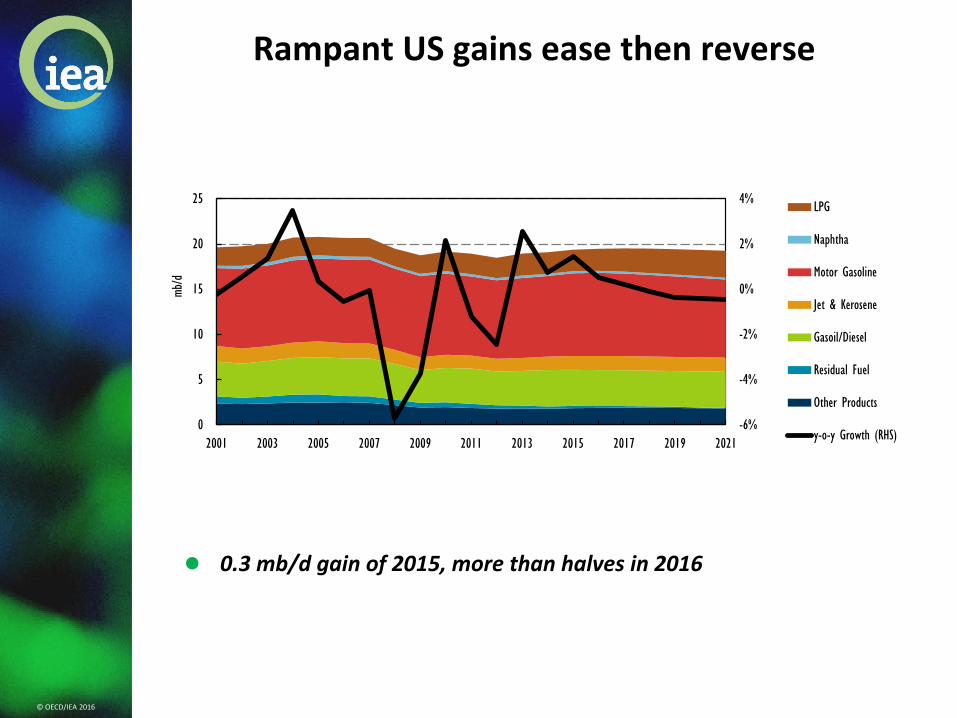
Rampant US gains ease then reverse
0.3 mb/d gain of 2015, more than halves in 2016
-6%
-4%
-2%
0%
2%
4%
0
5
10
15
20
25
2001 2003 2005 2007 2009 2011 2013 2015 2017 2019 2021
mb/d
LPG
Naphtha
Motor Gasoline
Jet & Kerosene
Gasoil/Diesel
Residual Fuel
Other Products
y-o-y Growth (RHS)

© OECD/IEA 2016
Upstream oil capex cut for 2nd year
Drop of 17% in 2016 follows 24% reduction in 2015
0
100
200
300
400
500
600
2002 2004 2006 2008 2010 2012 2014 2016
USD
billion
0
100
200
300
400
500
600
2002 2004 2006 2008 2010 2012 2014 2016
USD
billion
America N America S Europe Australia
Middle East Russia Asia Africa

© OECD/IEA 2016
World supply growth plunges
2015-21 growth slows to 4.1 mb/d vs 11 mb/d in 2009-15
-1.0
-0.5
0.0
0.5
1.0
1.5
2.0
2.5
3.0
2014 2015 2016 2017 2018 2019 2020 2021
mb/d
OPEC Non-OPEC
*2014 -15 shows actual output growth. 2016 assumes Iran ramp-up. OPEC capacity increases thereafter.
-1.0
-0.5
0.0
0.5
1.0
1.5
2.0
2.5
3.0
2014 2015 2016 2017 2018 2019 2020 2021
mb/d
OPEC Non-OPEC World
*2014 -15 shows actual output growth. 2016 assumes Iran ramp-up. OPEC capacity increases thereafter.

© OECD/IEA 2016
Non-OPEC supply growth collapses
-1500
-1000
-500
0
500
1000
1500
2000
2500
2004 2005 2006 2007 2008 2009 2010 2011 2012 2013 2014 2015 2016 2017 2018 2019 2020 2021
kb/d
Other non-OPEC
China
Latin America
FSU
Other Asia
Europe
OECD Americas
Total

© OECD/IEA 2016
US LTO takes biggest hit for now
0.0
1.0
2.0
3.0
4.0
5.0
6.0
2010 2012 2014 2016 2018 2020
mb/d
Bakken Eagle Ford W. Texas Niobrara Other LTO
Output to drop by 800 kb/d over 2016-17
© OECD/IEA 2016
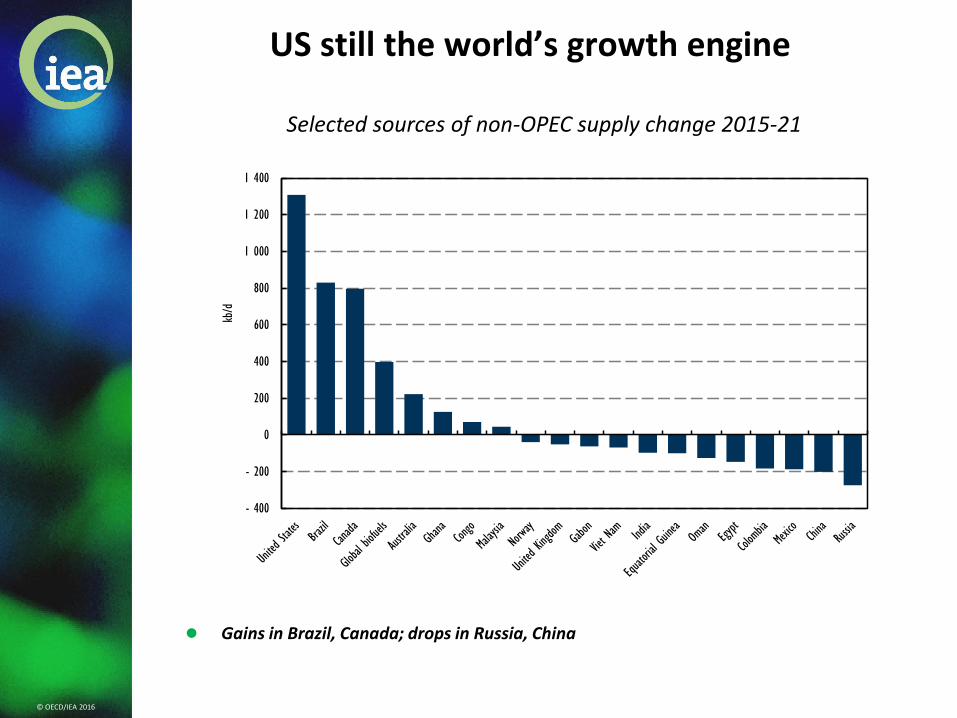
US still the world’s growth engine
Gains in Brazil, Canada; drops in Russia, China
Selected sources of non-OPEC supply change 2015-21
- 400
- 200
0
200
400
600
800
1 000
1 200
1 400
kb/d
© OECD/IEA 2016
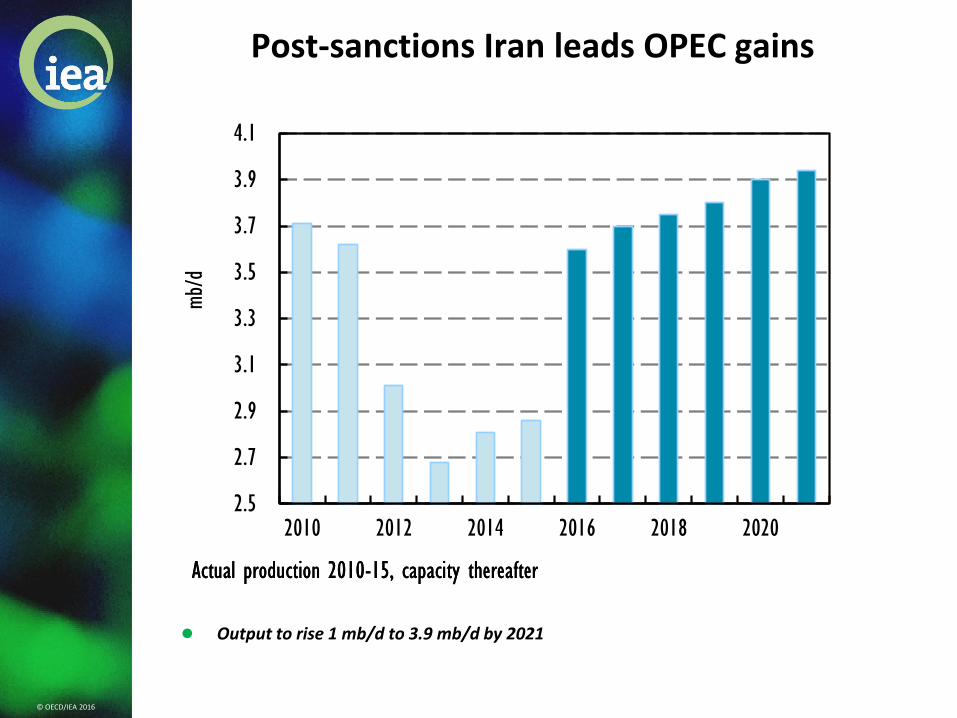
Post-sanctions Iran leads OPEC gains
Output to rise 1 mb/d to 3.9 mb/d by 2021
2.5
2.7
2.9
3.1
3.3
3.5
3.7
3.9
4.1
2010 2012 2014 2016 2018 2020
mb/d
Actual production 2010-15, capacity thereafterActual production 2010-15, capacity thereafter
© OECD/IEA 2016
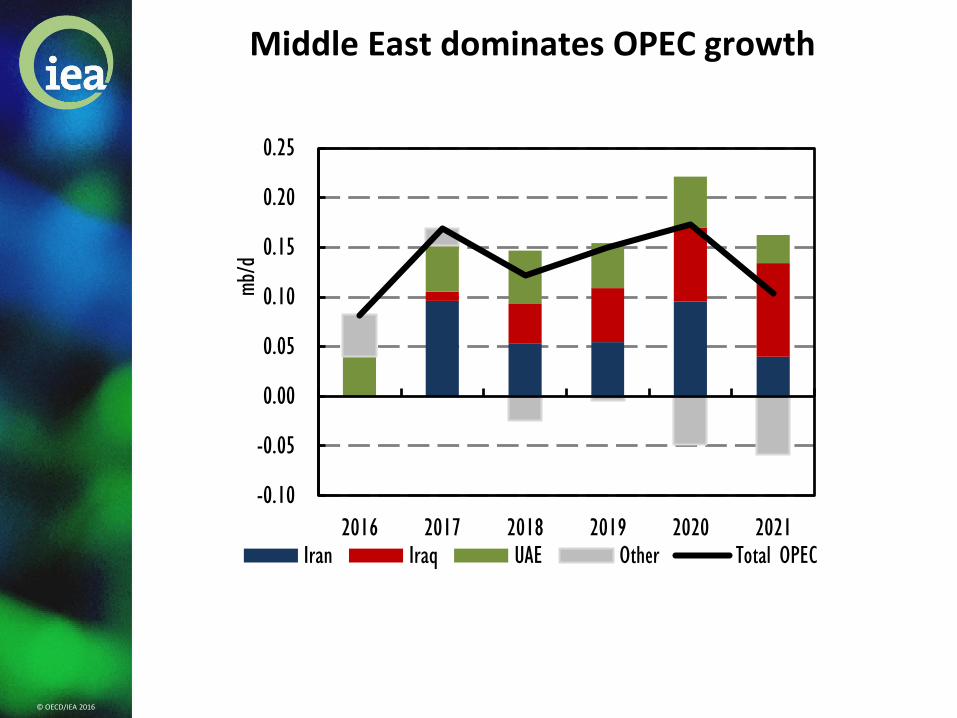
Middle East dominates OPEC growth
-0.10
-0.05
0.00
0.05
0.10
0.15
0.20
0.25
2016 2017 2018 2019 2020 2021
mb/d
Iran Iraq UAE Other Total OPEC

© OECD/IEA 2016
Surplus erodes in 2017
Tightening market drives price recovery - $80/bbl in 2020?
-2.5
-2.0
-1.5
-1.0
-0.5
0.0
0.5
1.0
1.5
2.0
2.5
82
84
86
88
90
92
94
96
98
100
102
2004 2006 2008 2010 2012 2014 2016 2018 2020
mb/dmb/d Global balance
Implied Stock Change World Demand World Supply

© OECD/IEA 2016
Conclusions
Global oil supply growth is plunging, as low prices take their toll
Iran leads OPEC gains over the forecast period
Despite a near-term dip, U.S. production rises to an all-time high
While global oil demand growth is slowing, oil use crosses the symbolic 100 mb/d mark towards the end of the decade
The availability of resources that can be easily and quickly tapped set to limit the scope of price rallies – at least in the near-term
The historic investment cuts now being seen raise the odds of oil-security surprises in the not-too-distant-future

© OECD/IEA 2016
IEA Oil Market Analysis
The leading oil market report since 1983, with the latest data and outlook.
Market analysis underpins the IEA’s emergency response mandate
Five-year outlook for supply & demand trends.
Complements short-term OMR and long-term World Energy Outlook analysis.
www.oilmarketreport.org