shopping behaviors of college students · pdf fileresults suggest that income does have an...
TRANSCRIPT

UNIVERSITY OF NEW HAMPSHIRE
Shopping Behaviors of College Students
SOC 601
Valerie R. Barthell and Jessica Ann Waitt
May 10, 2010
This research examines the shopping behaviors of college student, encompassing their use of credit cards, where they shop, and how their income affects shopping. Respondents completed a self administered 36 question survey, in which they chose the most appropriate answer. Results show statistical evidence that income and age affect college students’ shopping behaviors, use of credit cards, and amount of credit card debt. It was found that most respondents use credit cards but report little to no debt; however it was shown that the older the respondent the more debt they perceived they have. It was also found that students with lower monthly incomes shop for sale items and/or shop in discount stores to save money. These results suggest that income does have an effect on the shopping behaviors of college students.
Introduction and Conceptual Framework
Shopping is a cultural norm around the world. Historically, shopping can be seen in all
cultures in different forms based on the economic system. In many countries shopping is a trade
system in which goods can be exchanged for other goods or services of value; and in others, it is
a capitalist system such as ours. In modern times in industrialized countries, goods are set at a
monetary value and socioeconomic status can determine which goods can be readily purchased.
This study will set out to investigate the shopping habits of college students. We will
investigate whether the amount of income, credit, and employment status of a college student
affects their shopping habits in store and online. We seek to answer three research questions:
RQI: What affect does age have on credit card debt?
RQII: What are the effects of income or credit on shopping habits of college students in
store and online?
RQIII: What are students’ perceptions of credit card debt and spending?
Consumerism is prevalent in our society. We shop for many reasons, for things we need
or want and items we buy for our “image.” Goffman’s theory of the presentation of self states
that everyone uses impression management to shape other’s view of them. In our society, we buy
certain products to give others a particular perception of ourselves that we want them to have.
Due to this impression management, people may buy things that are out of their income range,
incurring debt. We will determine if income, credit, employment status, and perceptions of debt
affect a student’s shopping behavior positively or negatively.
Background Literature
Shopping has become commonplace(,); it is now an activity to pass time, with everyone
from young children to adults wanting to go shopping. Across America, there are small retailers,

small businesses, large retailers, and even malls. Consumerism has grown to an all time high
with the availability to shop anytime anywhere, and being able to pay with credit. This has
changed the behavior of modern generations, who now have more options than previous
generations.
I. Income and Sales
There are many societal factors influencing what products a person wants; everyone
wants what is the current “in” trend. These societal pressures, as stated by Satterthwaite, cause
people to have “a taste for more and better things” (2001:147). With coupons, sale shopping,
discount stores(;) many people seek the best price for items in order to continuously shop and
keep up with all the current trends. There are many incentives given to shoppers by retail giants,
such as coupons and competitive markdowns on retail items. A 2003 study of 1,147 sale prone
consumers in the Midwestern and Southeastern part of the United States suggests through
surveys that sale prone consumers are generally concerned about the economic benefits of the
sale (Garretson and Burton 2003:169). This study lends to whether the income of a college
student influences their shopping habits.
With the high disparity of income in the United States, the access and ability to buy
goods and services varies. Walters (2000) theorizes that throughout history there has been a fear
of being unemployed and not having income to provide the necessities of life or economic
stability. In today’s economy, with the unemployment rate being 9.7%, according to the Bureau
of Labor Statistics, it creates a fear to spend (2010). “Economic development creates jobs, and
jobs provide the disposable income that further fuels the economy” (Giloth 1998: xi). This
suggests that employment status and income will influence shopping behaviors, as the more
income one has the more they may shop.
Further, society’s shopping habits are influenced by the economic situation. The current
economic situation is one of regression. People have lost money in the market and in other ways
as well. This may led to saving strategies as well as cut backs in shopping and spending. An
early 2009 (Rodriguez) survey of 4,329 online consumers from pricegrabber.com concluded that
“consumers implemented a number of savings strategies to cut back on grocery shopping (13%),
energy consumption (13%), gasoline (27%), and retail shopping (46%)” (6).
2. E- Commerce
Today, there are many avenues for purchasing the goods that one wants or needs. With
the evolution of the Internet, there are now even more ways to shop and get more for your
money. “E- commerce is the selling of goods and services via an electronic media, using
technology to facilitate rapid exchange of detailed information between buyers and sellers”
(Lightner 2003:153). Online shopping is available for consumers “twenty-four hours a day,
seven days a week, three hundred sixty-five days a year” (Bellmann, Lohse, and Johnson
1999:32). Online stores function just as a retail store would; they display their items, have sales,
and continually have the goods that are in demand. The convenience and availability of Internet
shopping is a characteristic that is appealing to everyone. A 2008 Rotem- Mindali and Solomon
study of 510 participants suggests that online purchases are not affected greatly by the
demographics or socioeconomic status of the consumer (14).
While e-commerce is a seemingly large industry, research has shown that use of e-
commerce is not what it was projected to be. A study conducted in 2003 by Girard, Korgaonkar
and Silverblatt of 585 participants of various demographics has publicized that sales through e-
commerce have not grown as expected (102). It is suggested, “uncertainty and perceived risk
associated with revealing personal information as a part of online purchasing has contributed to

cautions against untried e-tailers” (Wolin, Korgaonkar, and Lund 2002 as cited in Girard et al
2003: 102).
Other researchers have seen a statistically small growth in online retail sales. Research by
Dixon and Marston (2002) found that in both the U.K. and the United States e- commerce
represented 1- 1.5% of all retail based on data from the Census Bureau (as cited in Rotem-
Mindali and Salomon 2008: 14). While e- commerce represents only a small portion of all retail
sales, it is still a growing industry with vast possibilities that will guide the future of shopping.
Many people have purchased various items online, ranging from food to electronics to
larger items, such as home furnishings, and these purchases are not limited to a particular
demographic or socioeconomic status. Online stores have a few different functions for
consumers; as described by researchers “e-retail encompasses three main activities: specifically,
a product search activity, an online purchase function, and the product delivery capability”
(Keeney 1999; Kolesar and Galbraith 2000; Torkzadeh and Dhillon 2002 as cited in Rotem-
Mindali and Salomon 2008: 246). These functions allow consumers to use online retail stores as
a database of information for research on products, product pricing, and purchasing. According
to a 2009 study of 4,329 participants “54% of online consumers searched for coupons and
discounts online even if they planned to purchase offline” (Rodriguez 6). The research function
of online stores has given consumers the ability to make sure they are getting the best possible
deal for their money; which is important to many consumers who have limited income.
According to a recent survey of 4,239 online consumers, 91% of these consumers said that
researching products online made them feel more confident about their purchases (Rodriguez
2009: 1).
3. Credit Cards and Debt
Credit cards are an easy and helpful way to pay for products and services. Many people
use credit cards because they are able to buy materials or objects at that moment, without
necessarily having the money to do so. When credit cards users use their credit card unwisely,
they tend to only pay the minimum each month, carry high balances and create a large amount of
debt (Joireman, Kees and Sprott 2010:155). College students are a target for credit card
companies, because college students enjoy the idea that they are able to purchase an object
without necessarily obtaining the money for it at that time. “It was estimated in a 2000 study that
91% of college seniors have a credit card and 56% hold four or more credit cards” (Mae 2005;
Consumer Federation of America 1999 as cited in Joireman 155). Also, in this study it was found
that “the average college student will leave college with more than $2,800 in credit card debt and
up to one fifth of college students debt will be of $10,000 or more” (Mae 2005; Consumer
Federation of America 1999 as cited in Joireman et al. 155). This article looked at the reasoning
behind the unwise credit card usage that leads college students into such a large amount of debt.
In a 2006 study, 448 students from five colleges in three states in the Midwestern,
Northeastern and Southern United States were given a questionnaire consisting of 173 items in
which students were asked to complete outside of class and return during the next session
(Norvilitis, Merwin, Osberg, Roehling, Young, and Kamas 2006: 1400-1402). The study found
that “financial knowledge is critical. It is one of the strongest predictors of debt and is also one of
the most amenable to change” (Norvilitis et al. 1407). Lack of financial knowledge among young
credit cards users creates a situation where they are unaware of the major consequences of their
behavior.
Compulsive buying tendencies and the perceptions of future consequences may affect
how college students use their credit cards. Compulsive buying tendencies were defined as” the

short term positive rewards one receives after chronic, repetitive purchases”(Joireman et al. 156).
College students’ attitudes toward debt may reflect their risky credit card habits. Another feature
that college students are not considering is the future consequences of their shopping habits. It
was stated that in regards to credit card use, “there is a reduced tendency to consider the impact
of current behaviors on future outcomes” (Joireman et al.157). Since college students are young,
there is still much to learn about money management.
Methods
The purpose of this study is to investigate the relationships between college students’
income or credit and perceptions of debt on their shopping habits.
1. Hypotheses
In past literature it has not been shown whether the amount of income or credit of a
college student affects where the shop and if they specifically shop for sales, thus this study asks
what affect income or credit will have on shopping behaviors.
HIa: Credit card debt will increase with age.
HIb: Age will have no affect on the amount of credit card debt.
HIIa: The lower the income and credit of the student, the more they will shop for sales and/or
shop in discount stores to save money.
HIIb: The income or credit of the student will not affect their shopping behavior.
There has been past research into perceptions of debt and financial knowledge impacting
this, however, there has not been research on how college students’ perceptions of debt will
affect their shopping habits, thus this study will ask this.
HIIIa: If a student perceives credit card debt as negative they will use a credit card less and are
more likely to pay more than the minimum every month.
HIIIb: The student’s perception of credit card debt will not affect their use of credit.
2. Sampling and Protocol
A probability sampling procedure was used to draw a sample of classes on the Durham
campus of the University of New Hampshire. A list of all general education classes was acquired
and listed in an Excel spreadsheet. Using a systematic sampling method 20 classes were
sampled, doing this systematically every 46th class on the list was chosen. This method is most
appropriate for our study because it gave us an unbiased sample that is representative of the
University of New Hampshire at Durham students. After choosing 20 classes, e- mails were sent
to the professors requesting permission to survey their students; after a pre- determined time
period, follow up e- mails were sent to the professors who had yet to reply.
Using this sampling procedure brought upon issues of replacement due to the fact that
when sampling study abroad, labs, practicums, internships, and recitations were not left out. In
our initial sample, two classes needed to be replaced due to this problem and as the sampling
progressed, others were replaced. As professors said “no,” the classes were replaced with similar
classes in order to acquire a representative sample.
The participants consisted of 233 males and females ages 18 to 24 years old. The sample
was taken at the University of New Hampshire Durham campus, and consisted of undergraduate
students in general education classes. The students were from all colleges encompassed in the
university in a variety of majors.
Quantitative data was gathered through a self-administered paper and pencil survey
instrument distributed in classrooms on the University of New Hampshire campus in Durham,

New Hampshire. Following informed consent, the survey instrument consisted of 36 questions of
different types in four categories to be completed and returned when distributed.
3. Variables
There were many variables examined in this study. Those of interest are income, credit
card use, credit card debt, and discount shopping. Income was defined as the amount of money
the respondent receives monthly from various sources such as employment, loans, legal
guardians, and other sources specified by the respondent. We ascertained this information from
asking 11 questions on a self-administered survey. Questions included how much income they
received monthly (a categorical question with $500 ranges), if they were employed and what
type of employment, and if income was received from a legal guardian, student loans,
employment, or another source (questions 21- 31 on survey in appendices).
Credit cards were defined as a system of payment, including store charge cards that the
respondent owns. We gathered various information about the respondent’s use of credit cards by
asking several questions (questions 13 and 14 on survey in appendices), such as how many credit
cards the respondent has and how often they use the credit cards. Following asking information
about respondents’ credit card use, a series of questions (questions 15- 17 on survey in
appendices) were asked related to their amount of credit card debt and how they felt about it.
Credit card debt was defined as the balance on credit card that has not been paid in full and is
collecting interest due.
Discount shopping for the purpose of this study was defined as seeking out only sale
items in department and/ or brand stores and/ or shopping more in discount stores to save money.
Questions were asked about the types of stores that the respondents typically shop in, and
whether they seek out sales specifically. They were also asked if knowledge of their income

affects whether they seek out sales only and/ or shop in discount stores only. Further questions
were asked relating to e- commerce and whether respondents use these retailers to save money or
compare prices in order to save money in store (questions 3- 12 on survey in appendices). These
variables will be statistically examined and discussed further.
Results
This study was to investigate the relationship of income or credit on college students’
shopping behaviors. A total of 233 surveys were collected, and descriptive statistics were run
using SPSS.
There were a total of 233 respondents, encompassing 147 females and 86 males. There is
an overrepresentation of females, as the population break down on the University of New
Hampshire Durham campus is about 56% females and 44% males as of fall 2008 (University of
New Hampshire). Respondents in this study were 63.1% female and 36.9% male.
All respondents were ages 18 to 24 years old, with the majority, 38.6%, being age 19.
Further our study represents a younger population as 93.6% were ages 18 to 21 years old, and
only 6.4% being over the age of 21. The ages of our respondents may affect their perceptions of
credit card debt, as well as their income.
As Table 3 (below) shows, there is a difference in the amount of debt in relation to the
respondent’s age. The relationship between age and credit card debt is statistically significant
with a p value of .004. It was found that 213 participants responded that they did not have debt or
had little debt ($0- $500) at the time. Through this data it is shown those participants ages 18 to

24 have little debt, with only 15 respondents claiming $501 to $2500 in credit card debt(;), and
51 respondents claiming $0 to $500 in credit card debt.
Table 3 Credit Card Debt * Age Crosstabulation
Age
Total 18 19 20 21 22 24
Credit Card
Debt
0- 500 Count 1 7 15 16 10 1 1 51
% within
Age
20.0% 16.7% 17.2% 31.4% 35.7% 9.1% 25.0% 22.4%
501- 1000 Count 0 2 0 3 2 3 0 10
% within
Age
.0% 4.8% .0% 5.9% 7.1% 27.3% .0% 4.4%
1001- 1500 Count 0 0 0 1 1 0 0 2
% within
Age
.0% .0% .0% 2.0% 3.6% .0% .0% .9%
1501- 2000 Count 0 0 0 0 1 1 0 2
% within
Age
.0% .0% .0% .0% 3.6% 9.1% .0% .9%
2001- 2500 Count 1 0 0 0 0 0 0 1
% within
Age
20.0% .0% .0% .0% .0% .0% .0% .4%
I don't have
debt
Count 3 33 72 31 14 6 3 162
% within
Age
60.0% 78.6% 82.8% 60.8% 50.0% 54.5% 75.0% 71.1%
Total Count 5 42 87 51 28 11 4 228
% within
Age
100.0% 100.0% 100.0% 100.0% 100.0% 100.0% 100.0% 100.0%
Students of different ages have varying perceptions of credit card debt. These views
may impact how many credit cards (a student has) students have, as well as how much debt they
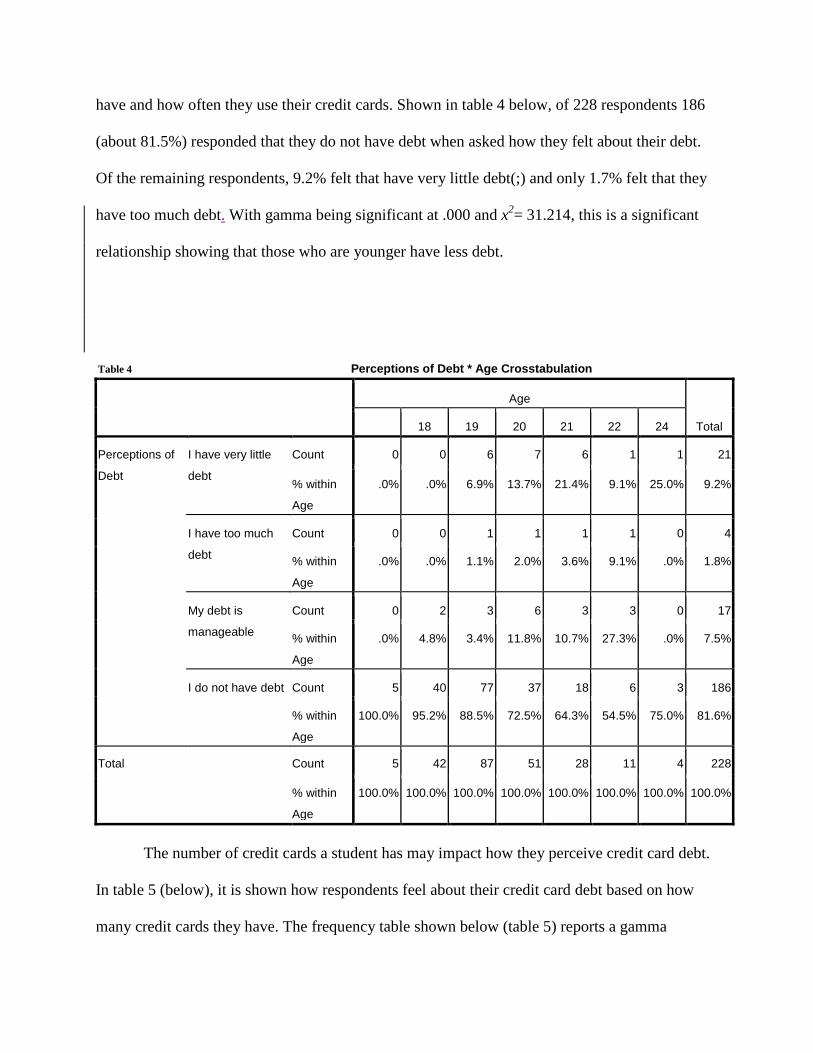
have and how often they use their credit cards. Shown in table 4 below, of 228 respondents 186
(about 81.5%) responded that they do not have debt when asked how they felt about their debt.
Of the remaining respondents, 9.2% felt that have very little debt(;) and only 1.7% felt that they
have too much debt. With gamma being significant at .000 and x2= 31.214, this is a significant
relationship showing that those who are younger have less debt.
Table 4 Perceptions of Debt * Age Crosstabulation
Age
Total 18 19 20 21 22 24
Perceptions of
Debt
I have very little
debt
Count 0 0 6 7 6 1 1 21
% within
Age
.0% .0% 6.9% 13.7% 21.4% 9.1% 25.0% 9.2%
I have too much
debt
Count 0 0 1 1 1 1 0 4
% within
Age
.0% .0% 1.1% 2.0% 3.6% 9.1% .0% 1.8%
My debt is
manageable
Count 0 2 3 6 3 3 0 17
% within
Age
.0% 4.8% 3.4% 11.8% 10.7% 27.3% .0% 7.5%
I do not have debt Count 5 40 77 37 18 6 3 186
% within
Age
100.0% 95.2% 88.5% 72.5% 64.3% 54.5% 75.0% 81.6%
Total Count 5 42 87 51 28 11 4 228
% within
Age
100.0% 100.0% 100.0% 100.0% 100.0% 100.0% 100.0% 100.0%
The number of credit cards a student has may impact how they perceive credit card debt.
In table 5 (below), it is shown how respondents feel about their credit card debt based on how
many credit cards they have. The frequency table shown below (table 5) reports a gamma

significant at level of .000, a highly significant level. As shown in the table, 107 (46.9%)
respondents do not have a credit card and reported that they do not have debt, showing that this
group feels they have the lowest amount of debt. However, 62 respondents with 1 credit card
also report no existing debt. There are 8 respondents reporting having four or more credit cards
with various perceptions of their debt; showing that the more credit cards a student owns the less
likely they are to report being debt free.
Table 5
Perceptions of Debt * Number of Cards Crosstabulation
Number of Cards
Total - 0 1 2 3 4 5 8
Perceptions
of Debt
I have very
little debt
Count 1 0 0 13 7 0 0 0 0 21
% within
Number
of Cards
100.0% .0% .0% 15.3% 31.8% .0% .0% .0% .0% 9.2%
I have too
much debt
Count 0 0 0 2 0 0 1 0 1 4
% within
Number
of Cards
.0% .0% .0% 2.4% .0% .0% 20.0% .0% 50.0% 1.8%
My debt is
manageable
Count 0 0 0 8 4 1 2 1 1 17
% within
Number
of Cards
.0% .0% .0% 9.4% 18.2% 25.0% 40.0% 100.0% 50.0% 7.5%
I do not have
debt
Count 0 1 107 62 11 3 2 0 0 186
% within
Number
of Cards
.0% 100.0% 100.0% 72.9% 50.0% 75.0% 40.0% .0% .0% 81.6%
Total Count 1 1 107 85 22 4 5 1 2 228
% within
Number
of Cards
100.0% 100.0% 100.0% 100.0% 100.0% 100.0% 100.0% 100.0% 100.0% 100.0%
Chi-Square Tests
Value df Asymp. Sig. (2-sided)
Pearson Chi-Square 123.563a 24 .000
Likelihood Ratio 93.021 24 .000
N of Valid Cases 228
a. 29 cells (80.6%) have expected count less than 5. The minimum expected count is .02.
Symmetric Measures
Value Asymp. Std. Errora Approx. Tb Approx. Sig.
Ordinal by Ordinal Gamma -.744 .065 -7.047 .000
N of Valid Cases 228
a. Not assuming the null hypothesis.
b. Using the asymptotic standard error assuming the null hypothesis.
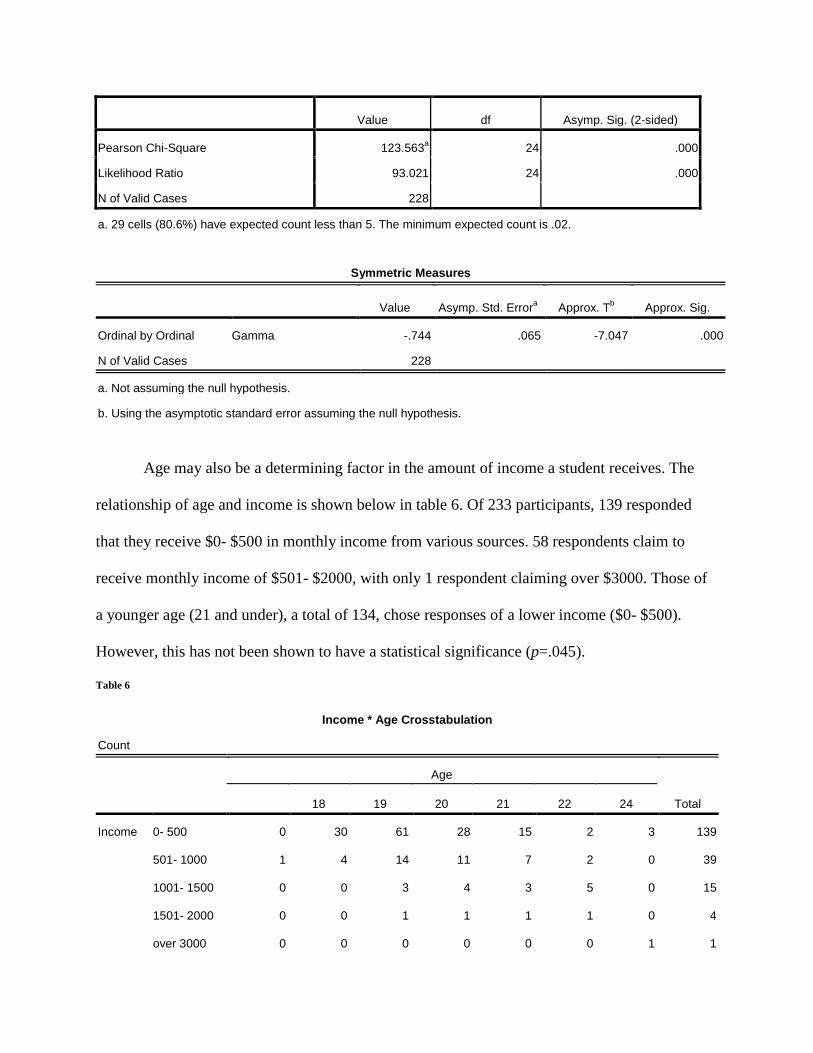
Age may also be a determining factor in the amount of income a student receives. The
relationship of age and income is shown below in table 6. Of 233 participants, 139 responded
that they receive $0- $500 in monthly income from various sources. 58 respondents claim to
receive monthly income of $501- $2000, with only 1 respondent claiming over $3000. Those of
a younger age (21 and under), a total of 134, chose responses of a lower income ($0- $500).
However, this has not been shown to have a statistical significance (p=.045).
Table 6
Income * Age Crosstabulation
Count
Age
Total 18 19 20 21 22 24
Income 0- 500 0 30 61 28 15 2 3 139
501- 1000 1 4 14 11 7 2 0 39
1001- 1500 0 0 3 4 3 5 0 15
1501- 2000 0 0 1 1 1 1 0 4
over 3000 0 0 0 0 0 0 1 1

Don't Know 1 8 10 6 2 1 0 28
Total 2 42 89 50 28 11 4 226
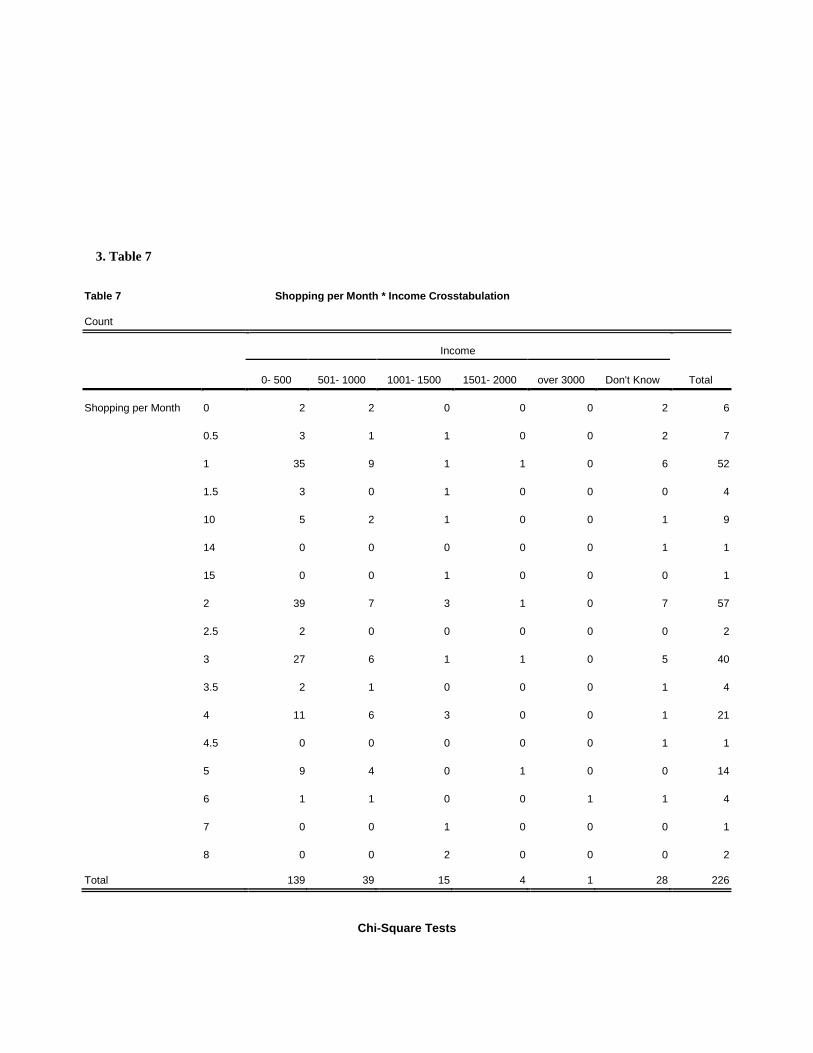
Table 7 (appendix) demonstrates a relationship between income and the number of times
a respondent goes shopping a month. This data shows that those respondents who shop 0 to 1
time per month (65 respondents) reported having a lower monthly income, with 40 reporting that
they receive between $0 and $500 a month of income; with the other 25 respondents, who report
shopping only 0 to 1 time a month, claiming no more than $2000 a month of income. Those who
report shopping the most (10 to 15 times a month) claim various amounts of monthly income,
with the lowest report being 5 participants claiming $0 to $500 monthly income and the highest
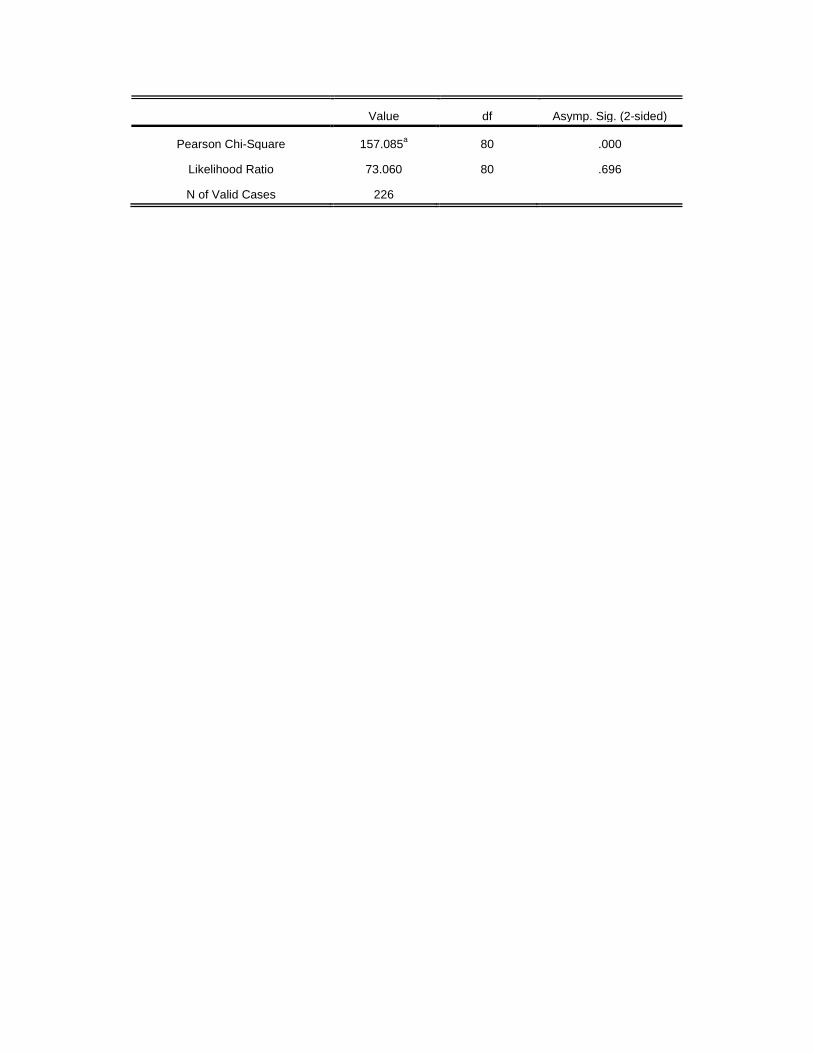
of $1001 to $1500 monthly income (2 respondents). A chi- square test was performed, finding a
statistical significance) and found this data to be statistically significant x2=157.085 (p=.000,
df=80), supporting the study’s hypothesis that income affects students’ shopping habits.
Table 8 (below) is a crosstabulation of credit card payments (DV) and perceptions of debt
(IV). With a total of 228 respondents, 5.7% report their debt as being manageable, yet they only
report paying the minimum or more than the minimum. Of the respondents, 38.5% report that
they pay the minimum payment, yet they do not have debt. A chi- square test was run, finding a
statistical significance x2= 120.105 (p= .000, and df=15). This statistical information leads to
rejecting the study’s hypothesis, but failing to reject the null hypothesis that students’
perceptions of credit card debt will not influence how they use credit cards.

Table 8 Credit Card Payment * Perceptions of Debt Crosstabulation
Perceptions of Debt
Total
I have
very little
debt
I have too
much debt
My debt is
manageable
I do not
have debt
Credit Card
Payment
Count 0 0 0 2 2
% within
Perceptions of
Debt
.0% .0% .0% 1.1% .9%
- Count 0 1 0 2 3
% within
Perceptions of
Debt
.0% 25.0% .0% 1.1% 1.3%
I pay the minimum Count 3 1 4 5 13
% within
Perceptions of
Debt
14.3% 25.0% 23.5% 2.7% 5.7%
I pay more than the
minimum, but not
the full amount
Count 9 2 9 7 27
% within
Perceptions of
Debt
42.9% 50.0% 52.9% 3.8% 11.8%
I pay the full amount Count 9 0 4 58 71
% within
Perceptions of
Debt
42.9% .0% 23.5% 31.2% 31.1%
I do not have a
credit card, or do not
use a credit card
Count 0 0 0 112 112
% within
Perceptions of
Debt
.0% .0% .0% 60.2% 49.1%
Total Count 21 4 17 186 228
% within 100.0% 100.0% 100.0% 100.0% 100.0%

Table 8 Credit Card Payment * Perceptions of Debt Crosstabulation
Perceptions of Debt
Total
I have
very little
debt
I have too
much debt
My debt is
manageable
I do not
have debt
Credit Card
Payment
Count 0 0 0 2 2
% within
Perceptions of
Debt
.0% .0% .0% 1.1% .9%
- Count 0 1 0 2 3
% within
Perceptions of
Debt
.0% 25.0% .0% 1.1% 1.3%
I pay the minimum Count 3 1 4 5 13
% within
Perceptions of
Debt
14.3% 25.0% 23.5% 2.7% 5.7%
I pay more than the
minimum, but not
the full amount
Count 9 2 9 7 27
% within
Perceptions of
Debt
42.9% 50.0% 52.9% 3.8% 11.8%
I pay the full amount Count 9 0 4 58 71
% within
Perceptions of
Debt
42.9% .0% 23.5% 31.2% 31.1%
I do not have a
credit card, or do not
use a credit card
Count 0 0 0 112 112
% within
Perceptions of
Debt
.0% .0% .0% 60.2% 49.1%
Total Count 21 4 17 186 228
Perceptions of
Debt

Table 9 (below) shows a descriptive statistics crosstabulation of income and participants
who shop for discounts (whether that be sale items or shopping in discount stores). It was found
to be significant at a gamma of .063 and an x2= 34.830. With 221 observations, 101 (45.7%)
responded that they shop for sale items and their income does affect where they shop to save
money. Of these 101 responses, 78 (77.2%) reported an income of less than $1000 a month,
suggesting that those with a lower income do seek out sales and/ or shop in discount store to save
money. This data supports the study’s hypothesis.
Table 9
discount * Income Crosstabulation
Income
Total 0- 500 501- 1000 1001- 1500 1501- 2000 over 3000 Don't Know
discount .00 Count 7 2 1 2 0 0 12
% within Income 5.2% 5.3% 6.7% 50.0% .0% .0% 5.4%
1.00 Count 32 5 8 0 0 9 54
% within Income 23.7% 13.2% 53.3% .0% .0% 32.1% 24.4%
2.00 Count 56 22 6 2 1 14 101
% within Income 41.5% 57.9% 40.0% 50.0% 100.0% 50.0% 45.7%
3.00 Count 40 9 0 0 0 5 54
% within Income 29.6% 23.7% .0% .0% .0% 17.9% 24.4%
Total Count 135 38 15 4 1 28 221
% within Income 100.0% 100.0% 100.0% 100.0% 100.0% 100.0% 100.0%
Table 10 (below) shows the association between income and shopping for discounted
items online. A total of 226 responses demonstrate that 72.6% do shop online for discounted
items; of this group, 57.9% report an income of $500 or less per month and 19.5% report an
income of $501- $1000 a month. Further, 60 of the 226 (26.5%) responses report that they do not
shop for sale items online or even use online retailers. These descriptive statistics do not show a

statistical significance (p=.124, x2= 12.955) in this association, neither refuting nor supporting
the study’s hypothesis that those students with lower income will shop online to save money.
Table 10
Discounted Items Online * Income Crosstabulation
Income
Total 0- 500
501-
1000
1001-
1500
1501-
2000
over
3000
Don't
Know
Discounted Items
Online
Count 1 0 0 0 0 0 1
% within
Income
.7% .0% .0% .0% .0% .0% .4%
- Count 0 1 0 0 0 0 1
% within
Income
.0% 2.6% .0% .0% .0% .0% .4%
Yes Count 95 32 12 3 1 21 164
% within
Income
68.3% 82.1% 80.0% 75.0% 100.0% 75.0% 72.6%
No Count 15 3 2 0 0 1 21
% within
Income
10.8% 7.7% 13.3% .0% .0% 3.6% 9.3%
I don't use online
retailers
Count 28 3 1 1 0 6 39
% within
Income
20.1% 7.7% 6.7% 25.0% .0% 21.4% 17.3%
Total Count 139 39 15 4 1 28 226
% within
Income
100.0% 100.0% 100.0% 100.0% 100.0% 100.0% 100.0%
Discussion
The purpose of this study was to examine the shopping behaviors of college students,
encompassing their income, credit card use and credit card debt, and their actions to save money.
First, we tested the affects of age on credit card use and perceptions of debt, to determine if there
was a statistical difference in the use of credit cards and perception of credit card debt based on
age. It was found through a descriptive statistics crosstabulation that there is a statistical
relationship between these variables with a gamma approximate significance p=.004; with most
respondents claiming little to no debt (table 3). While there was minimal difference in the debt
among those ages 18 to 24, there is basis to support the hypothesis that age does have an effect
on the amount of debt the student has.
Second, we tested the affects of age on perceptions of credit card debt. It was found that
9.2% of respondents ages 18 to 24 feel that have very little debt; and 1.7% of respondents ages
18 to 24 feel that they have too much debt (p=.000). Further, the majority (65.8%) of
respondents 21 and under responding that they do not have debt. This shows a statistical
relationship between the variables, showing that as age increases, the respondents perceive that
they have less debt; this refutes the study’s hypothesis that as age increases, so will debt.
Finally, we tested the affects of income on whether the student shops for sale items and/
or shops in discount stores. It was found that 45.7% of respondents said that they shop for sale
items and their income does affect where they shop to save money. Of these respondents, 77.2%
reported an income of less than $1000 a month, suggesting that those with a lower income do
seek out sales and/ or shop in discount store to save money, which supports the study’s
hypothesis.
1. Future Research
This study has found significant relationships between income, age, and shopping behaviors of
college students. Several aspects should be kept in mind about this study; we had a limited age
range (18 to 24) with most respondents being under 21; also, there was an underrepresentation of
men in the study. Despite these aspects, it was found that as students age their shopping habits
change in many ways, such as their use of credit cards and how they shop to save money. This
study was limited in its access to a diverse population, and if broadened could have larger
implications. Also more qualitative research should be conducted to ascertain the level of
knowledge that college students have on terms of credit card agreements and use. Further, other
aspects of shopping should be examined, such as previous financial knowledge, whether the
student has had education on financial matters, and if they are aware of the terms and
consequences of credit card use and debt. With future research we may be able to give students
education in credit cards to better the economy.

References
Bellman, Steven, Gerald L. Lohse, and Eric J. Johnson. 1999.”Predictors of Online Buying
Behaviors.”Communications of the ACM 42(12): 32-38. Retrieved 20 February 2010.
(http://elearning.dmst.aueb.gr/mis/Cases/Plaisio/Case/Training_Files/Online_buyi
ng_%20behaviour.pdf).
Garretson, Judith A. and Scot Burton.2003.”Highly Coupon and Sale Prone Consumers:
Benefits Beyond Price Savings.”Journal of Advertising Research 43(2):162-172.
Retrieved 23 February 2010.
(http://search.ebscohost.com/login.aspx?direct=true&db=ufh&AN=10740439&sit
e=ehost-live).
Giloth, Robert P. 1998. Jobs & Economic Development: Strategies and Practice. Thousand
Oaks, CA: Sage Publications.
Girard, Tulay, Pradeep Korgaonkar and Ronnie Silverblatt. 2003. “Relationship of Type of
Product, Shopping Orientations, and Demographics with Preference for Shopping on
the Internet.” Journal of Buisness and Psychology 18(1):101-120.
Joireman, Jeff, Jeremy Kees and David Sprott.2010. “Concern with Immediate Consequences Magnifies the Impact of Compulsive Buying Tendencies on College Students’ Credit Card Debt.” The Journal of Consumer Affairs 44(1): 155-178.

Lightner, Nancy J.2003.”What users want in E-Commerce Design: Effects of Age,
Education and Income.”Ergonomics 46(3):153-168.
Norvilitis, Jill M., Timothy M. Osberg, Paul Young, Michelle M. Merwin, Patricia V.
Roehling, and Michele M. Kamas. 2006. “Personality Factors, Money, Attitudes,
Financial Knowledge, and Credit Card Debit in College Students.” Journal of
Applied Social Psychology 36(6):1395- 1413.
Rotem-Mindali, Orit and Ilan Salomon.2008.”Modeling Consumers’ Purchase and
Delivery Choices in the Face of the Information Age.”Environment and Planning B:
Planning and Design 36: 245-261.
Rodriguez, Sara. 2009. Economic Climate Shifts Consumers Online. Report on Consumer
Behavior, pp 1-10. Retrieved 20 February 2010
(https://mr.pricegrabber.com/Economic_Climate_Shifts_Consumers_Online_Mar
ch_2009_CBR.pdf).
Satterthwaite, Ann.2001. Going Shopping: Consumer Choices and Community Consequences.
New haven, CT: Yale University Press.
University of New Hampshire. 2010. 2008 UNH Fast Facts. Retrieved 6 May 2010.
(http://www.unh.edu/unhedutop/aboutunh.html)
U.S. the Bureau of Labor Statistics. United States Department of Labor. 2010. Employment
Situatuation, 2010. Retrieved 6 May 2010. (http://www.bls.gov/cps/)
Walters, William. 2000. Unemployment and Government: Genealogies of the Social. New York,
NY: Cambridge University Press.

Appendices
1. Informed Consent
A research project on Shopping Behavior is being conducted by Valerie Barthell and Jessica Ann Waitt, students in the Department of Sociology at the University of New Hampshire. Your class was randomly selected from all general education undergraduate classes at UNH; your participation is important. Your participation will take approximately ten minutes. You are not required to participate in this research and you may discontinue your participation at any time without penalty. You may also omit leave blank any items on the questionnaire you prefer not to answer. If you should experience any of feelings of discomfort, please be aware that you may contact the Health Services Center at the University of New Hampshire for assistance at http://www.unh.edu/health-services/ Please do not write your name on this survey. All responses will be treated confidentially, and information about individual responses will not be released. If you agree to participate in this research project as described, please complete the attached questionnaire. If you do not want to participate, please return a blank survey to the box at the front of the room. Once you are done please drop your questionnaire in the box located at the front of the room. Thank you. If you have any questions about this study, please feel free to contact us at: Valerie Barthell at [email protected] or Jessica Ann Waitt at [email protected] . You may also contact our professor, Dr. Catherine Moran, at [email protected].

2. Survey Please CIRCLE the letter of the answer that corresponds best to you unless otherwise instructed. Shopping 1. What do you typically shop for? (Please rank the items 1-8 with 1 being the item(s) you most often shop for) _____ a. Clothes _____ b. Shoes _____ c. Electronics (Computers, Computer accessories, Video Game Consoles etc.) _____ d. Accessories (Jewelry, Purses, Scarves, Hair Accessories, etc.) _____ e. Books _____ f. Music _____ g. Entertainment (DVDs, Video Games, etc.) _____ h. Other (please specify) _______________ 2. On average how many times per month do you go shopping, not including grocery shopping? (please enter the number) I go shopping _____ times a month. 3. When you go shopping what type of store do you usually shop in? (Circle all that apply) a. Department Stores (Macy’s, JCPenney, Sears, etc.) b. Discount Stores (Tjmaxx, Marshalls, Ross Dress for Less, etc.) c. Brand Stores (Hollister, Abercrombie and Fitch, Charlotte Russe, etc.) d. Online Retailers e. Other (please specify) _______________ 4. When shopping do you seek out sale items to save money? a. Yes b. No 5. When shopping in Department Stores (Macy’s, JCPenney, etc.) and Brand Stores (Hollister, Charlotte Russe, etc.) do you seek out sale items only? a. Yes b. No c. I don’t shop in these types of stores 6. Does your income affect whether you decide to shop at department / brand store retail prices or at bargain stores/ sale prices? a. Yes b. No 7. On average how many times per month do you shop online? (Please enter the digits) I shop ______ time a month online. 8. Do you use online retailers to compare prices both online and in store? a. Yes
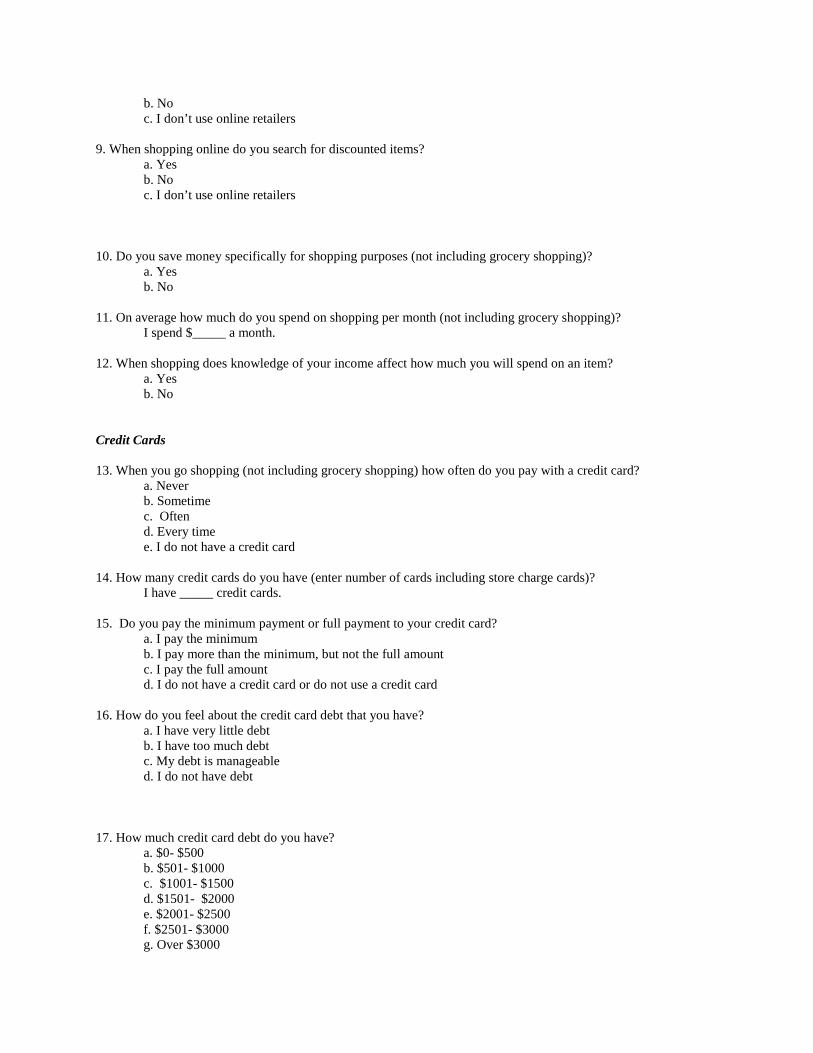
b. No c. I don’t use online retailers 9. When shopping online do you search for discounted items? a. Yes b. No c. I don’t use online retailers 10. Do you save money specifically for shopping purposes (not including grocery shopping)? a. Yes b. No 11. On average how much do you spend on shopping per month (not including grocery shopping)? I spend $_____ a month. 12. When shopping does knowledge of your income affect how much you will spend on an item? a. Yes b. No Credit Cards 13. When you go shopping (not including grocery shopping) how often do you pay with a credit card? a. Never b. Sometime c. Often d. Every time e. I do not have a credit card 14. How many credit cards do you have (enter number of cards including store charge cards)? I have _____ credit cards. 15. Do you pay the minimum payment or full payment to your credit card? a. I pay the minimum b. I pay more than the minimum, but not the full amount c. I pay the full amount d. I do not have a credit card or do not use a credit card 16. How do you feel about the credit card debt that you have? a. I have very little debt b. I have too much debt c. My debt is manageable d. I do not have debt 17. How much credit card debt do you have? a. $0- $500 b. $501- $1000 c. $1001- $1500 d. $1501- $2000 e. $2001- $2500 f. $2501- $3000 g. Over $3000

h. I do not have debt 18. Do you spend more or less now than you did before the current economic depression (not including grocery shopping)? a. I spend more b. I spend less c. I spend about the same 19. Do you shop more or less than you did before the current economic depression (not including grocery shopping)? a. I shop more b. I shop less c. I shop about the same amount 20. Do you shop more at discount stores (such as Tjmaxx and Marshalls) than you did before the current economic depression? a. Yes b. No Income 21. Are you currently employed? a. Yes b. No 22. What type of employment do you have? a. Full- time b. Part- time c. I am not employed 23. On average how many hours per week do you work for wage? (Please enter number of hours, enter 0 if you are not employed) I work _____ hours per week. 24. Do you receive income from a source other than yourself or your savings, such as cash advances, loans, or money from another person (such as parent or legal guardian)? a. Yes b. No 25. Do you receive monthly income from student loans? a. Yes b. No 26. Do you receive monthly income from a full- time job? a. Yes b. No 27. Do you receive monthly income from a part- time job? a. Yes b. No 28. Do you receive money monthly from a parent or legal guardian? a. Yes

b. No 29. Do you ever receive cash advances from credit cards? a. Yes b. No 30. Do you receive money monthly from a source other than student loans, a full- time job, a part- time job, a parent or legal guardian, or cash advances (from credit cards)? a. Yes (please specify) _______________ b. No 31. What is your average monthly income? a. $0- $500 b. $501- $1000 c. $1001- $1500 d. $1501- $2000 e. $2001- $2500 f. $2501- $3000 g. Over $3000 f. Don’t know. Demographic Information 32. What is your sex? a. Male b. Female c. Other 33. What is your age? (Please enter the digits) I am _____ years old. 34. What is your year in school? a. Freshman b. Sophomore c. Junior d. Senior e. Other (please specify) _____________ 35. What is your student status? a. Full- time b Part- time c. Other (please specify) _______________ 36. What college are you enrolled in at UNH? a. College of Engineering and Physical Sciences (CEPS) b. College of Health and Human Services (CHHS) c. College of Liberal Arts (COLA) d. College of Life Sciences and Agriculture (COLSA) e. Thompson School of Applied Science f. Whittemore School of Business and Economics
3. Table 7
Table 7 Shopping per Month * Income Crosstabulation
Count
Income
Total 0- 500 501- 1000 1001- 1500 1501- 2000 over 3000 Don't Know
Shopping per Month 0 2 2 0 0 0 2 6
0.5 3 1 1 0 0 2 7
1 35 9 1 1 0 6 52
1.5 3 0 1 0 0 0 4
10 5 2 1 0 0 1 9
14 0 0 0 0 0 1 1
15 0 0 1 0 0 0 1
2 39 7 3 1 0 7 57
2.5 2 0 0 0 0 0 2
3 27 6 1 1 0 5 40
3.5 2 1 0 0 0 1 4
4 11 6 3 0 0 1 21
4.5 0 0 0 0 0 1 1
5 9 4 0 1 0 0 14
6 1 1 0 0 1 1 4
7 0 0 1 0 0 0 1
8 0 0 2 0 0 0 2
Total 139 39 15 4 1 28 226
Chi-Square Tests
Value df Asymp. Sig. (2-sided)
Pearson Chi-Square 157.085a 80 .000
Likelihood Ratio 73.060 80 .696
N of Valid Cases 226