shop the world
TRANSCRIPT

Shop the World!Consumer attitudes towards global distance selling

Shop the World 1
Japan . . . . . . . . . . . . . . . . . . . . . . . . . . . . . . 176 Mexico . . . . . . . . . . . . . . . . . . . . . . . . . . . . . 192 Netherlands . . . . . . . . . . . . . . . . . . . . . . . . . 208 Poland . . . . . . . . . . . . . . . . . . . . . . . . . . . . . . 224 Russia . . . . . . . . . . . . . . . . . . . . . . . . . . . . . . 240
South Korea . . . . . . . . . . . . . . . . . . . . . . . . . 256 Spain . . . . . . . . . . . . . . . . . . . . . . . . . . . . . . . 272 Switzerland . . . . . . . . . . . . . . . . . . . . . . . . . 288 Turkey . . . . . . . . . . . . . . . . . . . . . . . . . . . . . . 304 USA . . . . . . . . . . . . . . . . . . . . . . . . . . . . . . . . 320
Appendix . . . . . . . . . . . . . . . . . . . . . . . . . . . 336
Methodology: Study design and sample size . . . . 336 Questionnaire . . . . . . . . . . . . . . . . . . . . . . . . . . . . . . 337
Legal notice . . . . . . . . . . . . . . . . . . . . . . . . . 338
Editorial . . . . . . . . . . . . . . . . . . . . . . . . . . . . . . 2
Shop the World! - in five minutes . . . . . . . . . 3
Shop the World! - in half an hour . . . . . . . . . 4
Media use . . . . . . . . . . . . . . . . . . . . . . . . . . . . . . . . 4 Distance selling - Market overview . . . . . . . . . . 5 Distance selling - Use . . . . . . . . . . . . . . . . . . . . . . 6 Search for product information . . . . . . . . . . . . . 8 Supplier selection . . . . . . . . . . . . . . . . . . . . . . . . . 9 Placing orders . . . . . . . . . . . . . . . . . . . . . . . . . . . 10 Payment methods . . . . . . . . . . . . . . . . . . . . . . . 11 Delivery . . . . . . . . . . . . . . . . . . . . . . . . . . . . . . . . 12 Returns . . . . . . . . . . . . . . . . . . . . . . . . . . . . . . . . 13 Cross-boarder shopping . . . . . . . . . . . . . . . . . . . 14
Australia . . . . . . . . . . . . . . . . . . . . . . . . . . . . . 16
Austria . . . . . . . . . . . . . . . . . . . . . . . . . . . . . . 32 Brazil . . . . . . . . . . . . . . . . . . . . . . . . . . . . . . . . 48 Canada . . . . . . . . . . . . . . . . . . . . . . . . . . . . . . 64 China . . . . . . . . . . . . . . . . . . . . . . . . . . . . . . . . 80 France . . . . . . . . . . . . . . . . . . . . . . . . . . . . . . . 96 Germany . . . . . . . . . . . . . . . . . . . . . . . . . . . . 112 Great Britain . . . . . . . . . . . . . . . . . . . . . . . . . 128 India . . . . . . . . . . . . . . . . . . . . . . . . . . . . . . . 144 Italy . . . . . . . . . . . . . . . . . . . . . . . . . . . . . . . . 160
Table of Contents
Table of Contents

Shop the World 2
lobal distance selling account-ed for sales of €616 billion in
2013 and is expected to see annual growth of 10 .7% in the next five years . This trend now influences almost all sectors of the economy . An increasing focus is being placed on the eCommerce customers who decide whether, when and under what conditions they order goods online .
Businesses thus have to understand the var-ious steps in the customer’s journey through the online purchasing process . And they must also be aware of the economic and cultural dif-ferences that drive cross-border eCommerce .
In this Shop the World! consumer study, more than 11,000 people in 20 countries were asked about their attitudes, behavior and pref-erences in respect of different media, product selection criteria, payment methods, and de-
livery and return options . They were also asked about their rea-sons for ordering goods from abroad, and the obstacles they face in doing so .
The same data was collected for each country to allow the first ever comparative study of dis-
tance selling practices in 20 different countries around the world . The survey is supplemented by a set of country profiles containing current distance selling sales figures and forecasts, as well as demographic, economic and media-related data .
I trust you will find the study valuable in your work, and wish you an interesting and infor-mative read .
Dear Reader,
G
Yours
Thomas KippCEO DHL eCommerce
Editorial

Shop the World 3
• When it comes to internet use, the Nether-lands lead the field (93%) . China (42%), Mexico (38%) and India (13%) bring up the rear . South Korea is the market leader in terms of smartphone share (73%) .
• The global advertising industry is set to see revenue of €413 billion in 2014 . After the US and China, the biggest growth in glob-al advertising expenditure will be seen in emerging economies like Indonesia, Ar-gentina and Brazil . While TV remains the dominant medium in the global media mix, future growth will primarily occur through spends on mobile advertising .
• According to Euromonitor International, global distance selling sales amounted to €616 billion in 2013 .
• The three biggest distance selling markets are the US, China and Japan .
• The global distance selling market is ex-pected to see annual growth of 10 .7% between now and 2018 .
• The largest growth is expected in China (24 .5%), Mexico (16 .5%) and Australia (16 .4%) .
• The top products offered via distance sell-ing are fashion, consumer electronics, me-dia products and food . There are, however, marked country-specific differences .
• Some 84% of the online population are distance selling customers . Emerging economies see lower user numbers, but enjoy considerably higher growth fore-casts .
• Annual per capita orders average
13 in global comparison, with country-specific order numbers ranging from 6 in Mexico to 29 in Great Britain .
• As the only one of the emerging economies
covered by the study, China has extremely high user rates, order numbers and signifi-cant growth potential .
• Customers mainly search for products on-line (93%), largely via search engines and suppliers’ websites .
• Their main reasons for choosing a supplier are affordable prices and free delivery .
• Orders are primarily placed online using a PC, followed by those placed with mobile devices . China, South Korea, and Austra-lia have the highest shares in mCommerce (some 15% of orders overall) .
• Credit cards are the most frequent pay-ment method used . Preferences differ from region to region, however . These include for example the use of Alipay in China, and cash on delivery in India .
• The key ordering criteria are speedy, free delivery . Acceptable delivery times range from between 3 .8 days in Turkey to 12 .4 days in Russia .
• The highest return rates are seen in Ger-
many, Austria, Switzerland and the Nether-lands (between 9% and 13%) .
• Some 45% of internet users have ordered goods from abroad . Figures in emerging economies are significantly lower than those for industrialised countries .
• The main exporting countries are the US, Great Britain, Germany and China .
• The main reasons for ordering goods from abroad are that they are not available do-mestically and are lower-priced . In emerg-ing economies, better quality and protec-tion against counterfeit goods and product piracy are key drivers in the purchasing decision .
Shop the World! - in five minutes
Shop the World! - in five minutes
Media use Distance selling – market overview Customer Journey Cross-border shopping

Shop the World 4
Global advertising expenditure · in Eur bn. *
2011 2012 2013 2014 2015
436.
8
413.
1
391.
7
377.
3
363.
9
2016
462.
9
Mobile internet
TV
Desktop internet
Out of home
Radio
Movies
General magazines
Newspapers
24.6
24.2
19.4
4.1
2.1
0.6
-1.2
-2.7
Contributors to global growth in adspend by medium 2013-2016 · in Eur bn. *
Internet use
As more and more people use the internet huge country-specific differences emerge . The Nether-lands lead the field with 93%, followed by Great Britain (87%) and Canada (86 .8%) . India, Chi-na and Mexico bring up the rear . While Mexico and China have online populations of 38% and 42% respectively, only 12 .6% of India's consumers use the inter-net .
With growing use of smart- phones, mobile access to online content is on the rise . Com- pared with 2012, state subsidisa-tion and billion-strong invest-ment in Brazil, Poland and Tur-key have led to a two-fold rise in use of internet-compatible smart-phones . In Russia and Mexico, smartphone use has risen from 20% to 37% . But South Korea, where 73% of the population own a smartphone, is the un-contested leader .
Advertising
The global advertising indus-try is set to see revenue of €413 billion in 2014 . Growth of 5 .8% and 6 .1% is forecast for 2015 and 2016 respectively . While TV re-mains the dominant medium in the global media mix, future growth will largely be seen in ex-penditure on mobile advertise-ment . The three biggest advertis-ing markets are the US (€130 .5 billion), Japan (€41 .4 billion) and China (€31 .9 billion), although Japan is expected to relinquish its No . 2 spot to China in 2016 . Apart from the US and China, the biggest growth in global ad-vertising expenditure will be seen in the emerging economies such as Indonesia, Argentina and Brazil .
* Source: Zenith Optimedia 2013
Internet desktopMobile internetNewspapers Magazines
40+7+1+7+18+3+17+7Global media mix · 2013 in % *
TV Radio Movies Outdoor advertising
18.0
17.0
8.0
7.01.07.0
40.0
3.0
India
USA
China
Indonesia
Argentina
Brazil
UK
Japan
South Korea
Russia
18.8
5.2
12.8
5.1
2.7
2.5
3.0
2.5
2.2
1.9
Top ten contributors to ad spend growth 2013 - 2016 · in Eur bn. *
Shop the World! - in half an hour
Shop the World! - in half an hourMedia use
Media Use · Distance selling-market overview · Distance selling use ·
Searching for product information · Supplier selection · Placing orders ·
Payment methods · Delivery · Returns · Cross-border shopping
Shop the World 5
Industrialised countries (Europe)
Industrialised countries (Americas & APAC)
Emerging economies
GL
US
CN
JP
UK
DE
KR
FR
RU
BR
IT
ES
CA
AU
NL
CH
MX
PL
AT
TR
IN
Distance selling sales by country in 2013 · in EUR bn. *
616.4
227.1
78.4
57.4
45.3
34.9
26.1
25.7
14.4
8.6
6.4
6.3
6.1
5.2
4.5
4.2
4.1
4.1
3.2
2.9
2.4
CN
MX
AU
BR
ES
IT
TR
PL
RU
IN
FR
CA
GL
DE
US
NL
KR
JP
AT
CH
UK
Distance selling market growth by country CAGR 2013 - 2018 · in % *
24.4
16.5
16.4
13.6
13.0
12.7
12.4
12.2
11.9
11.6
11.3
10.8
10.7
8.7
7.3
5.7
5.3
4.8
4.8
4.2
4.0
* Source: Euromonitor International
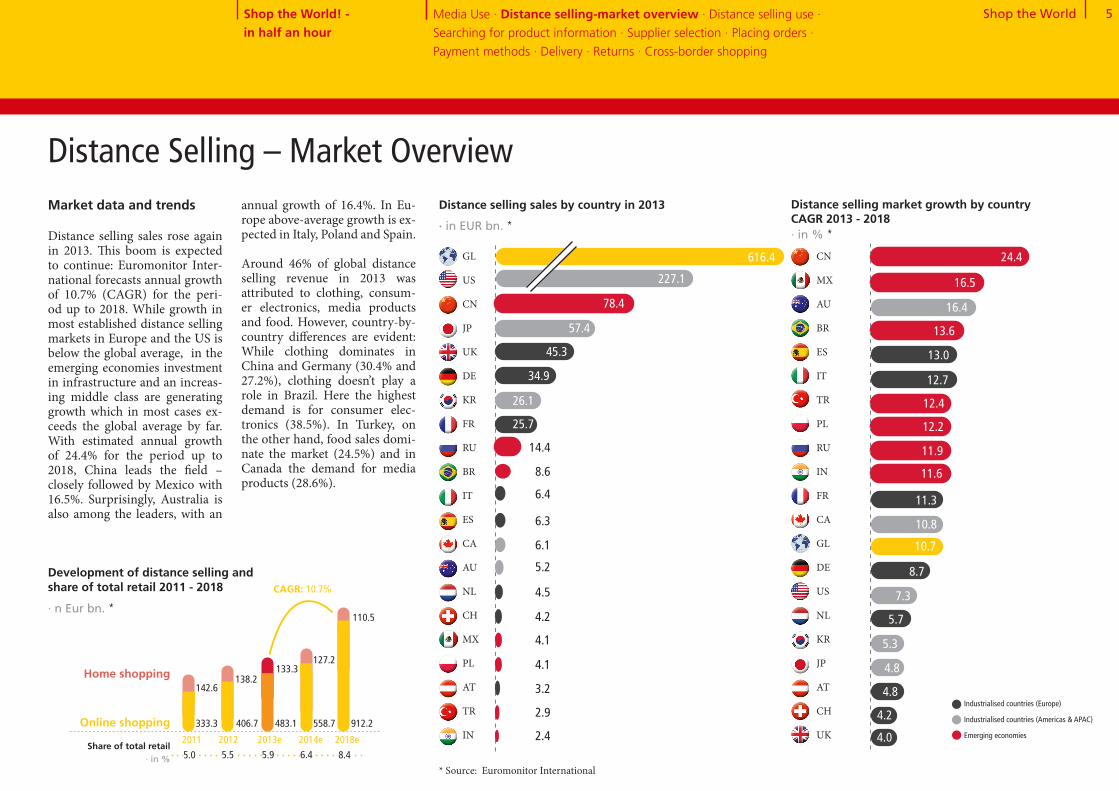
Market data and trends
Distance selling sales rose again in 2013 . This boom is expected to continue: Euromonitor Inter-national forecasts annual growth of 10 .7% (CAGR) for the peri-od up to 2018 . While growth in most established distance selling markets in Europe and the US is below the global average, in the emerging economies investment in infrastructure and an increas- ing middle class are generating growth which in most cases ex-ceeds the global average by far .With estimated annual growth of 24 .4% for the period up to 2018, China leads the field – closely followed by Mexico with 16 .5% . Surprisingly, Australia is also among the leaders, with an
Shop the World! - in half an hour
Distance Selling – Market Overviewannual growth of 16 .4% . In Eu-rope above-average growth is ex-pected in Italy, Poland and Spain .
Around 46% of global distance selling revenue in 2013 was attributed to clothing, consum-er electronics, media products and food . However, country-by-country differences are evident: While clothing dominates in China and Germany (30 .4% and 27 .2%), clothing doesn’t play a role in Brazil . Here the highest demand is for consumer elec-tronics (38 .5%) . In Turkey, on the other hand, food sales domi-nate the market (24 .5%) and in Canada the demand for media products (28 .6%) .
Development of distance selling and share of total retail 2011 - 2018 · n Eur bn. *
CAGR: 10.7%
Home shopping
Online shopping 333.3 406.7 483.1
142.6138.2
133.3
558.7 912.2
127.2
110.5
2011 2012 2013e 2014e 2018eShare of total retail
· in % 5.0 5.5 5.9 6.4 8.4
Media Use · Distance selling-market overview · Distance selling use ·
Searching for product information · Supplier selection · Placing orders ·
Payment methods · Delivery · Returns · Cross-border shopping
Shop the World 6
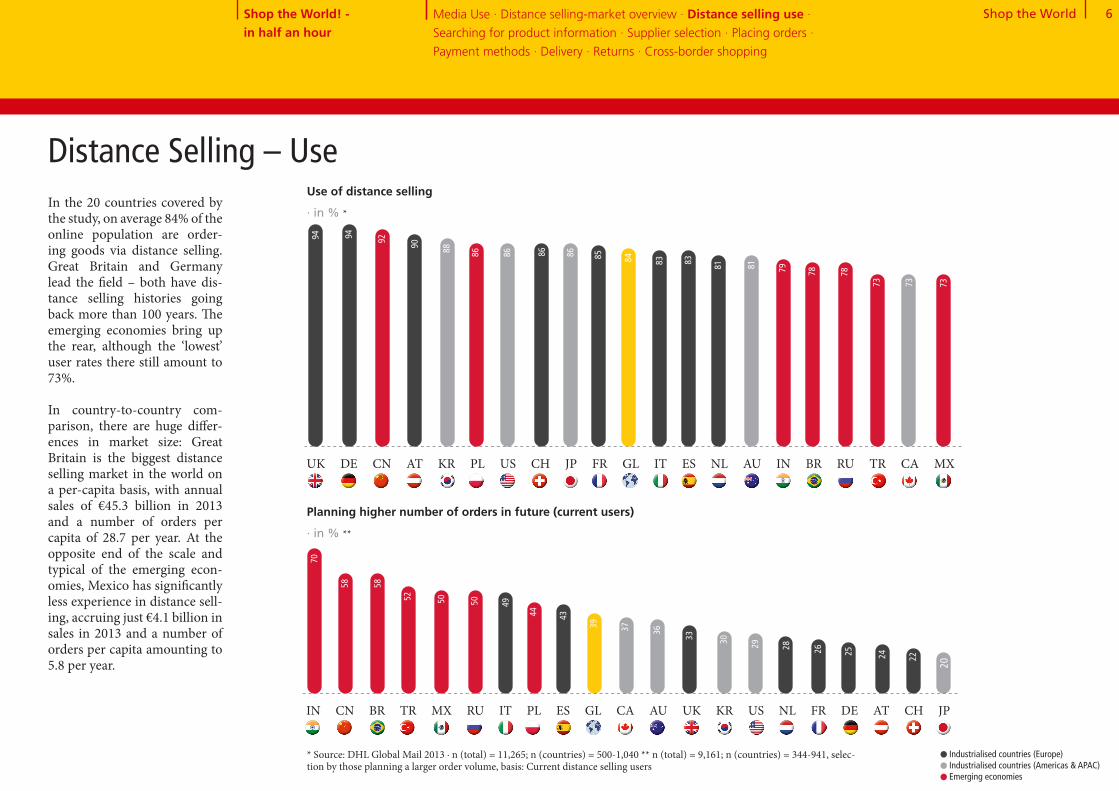
In the 20 countries covered by the study, on average 84% of the online population are order- ing goods via distance selling . Great Britain and Germany lead the field – both have dis-tance selling histories going back more than 100 years . The emerging economies bring up the rear, although the ‘lowest’ user rates there still amount to 73% .
In country-to-country com-parison, there are huge differ- ences in market size: Great Britain is the biggest distance selling market in the world on a per-capita basis, with annual sales of €45 .3 billion in 2013 and a number of orders per capita of 28 .7 per year . At the opposite end of the scale and typical of the emerging econ-omies, Mexico has significantly less experience in distance sell-ing, accruing just €4 .1 billion in sales in 2013 and a number of orders per capita amounting to 5 .8 per year .
Use of distance selling · in % *
Shop the World! - in half an hour
UK DE CN AT KR PL US CH JP FR GL IT ES NL AU IN BR RU TR CA MX
94 94 92 90 88 86 86 86 86 85 84 83 83 81 81 79 78 78
73 73 73
70
58 58
52 50 50 49
44 43
39 37 36
33 30 29 28 26 25 24 22
20
IN CN BR TR MX RU IT PL ES GL CA AU UK KR US NL FR DE AT CH JP
Planning higher number of orders in future (current users)
· in % **
Distance Selling – Use
Industrialised countries (Europe)Industrialised countries (Americas & APAC)Emerging economies
* Source: DHL Global Mail 2013 ∙ n (total) = 11,265; n (countries) = 500-1,040 ** n (total) = 9,161; n (countries) = 344-941, selec-tion by those planning a larger order volume, basis: Current distance selling users
Media Use · Distance selling-market overview · Distance selling use ·
Searching for product information · Supplier selection · Placing orders ·
Payment methods · Delivery · Returns · Cross-border shopping
Shop the World 7Shop the World! - in half an hour
UK 28.7
DE 18.2
CN 23.1
AT 15.6
KR 16.5
PL 12.7
US 13.6
CH 12.6
JP 13.1
FR 12.0
IT 10.1
ES 10.1
NL 7.9
AU 14.3
IN 8.5
BR 7.0
RU 6.8
TR 8.1
MX 5.8
CA 9.7
GL 12.7
< 8 orders
< 10 orders
< 15 orders
15 orders or more
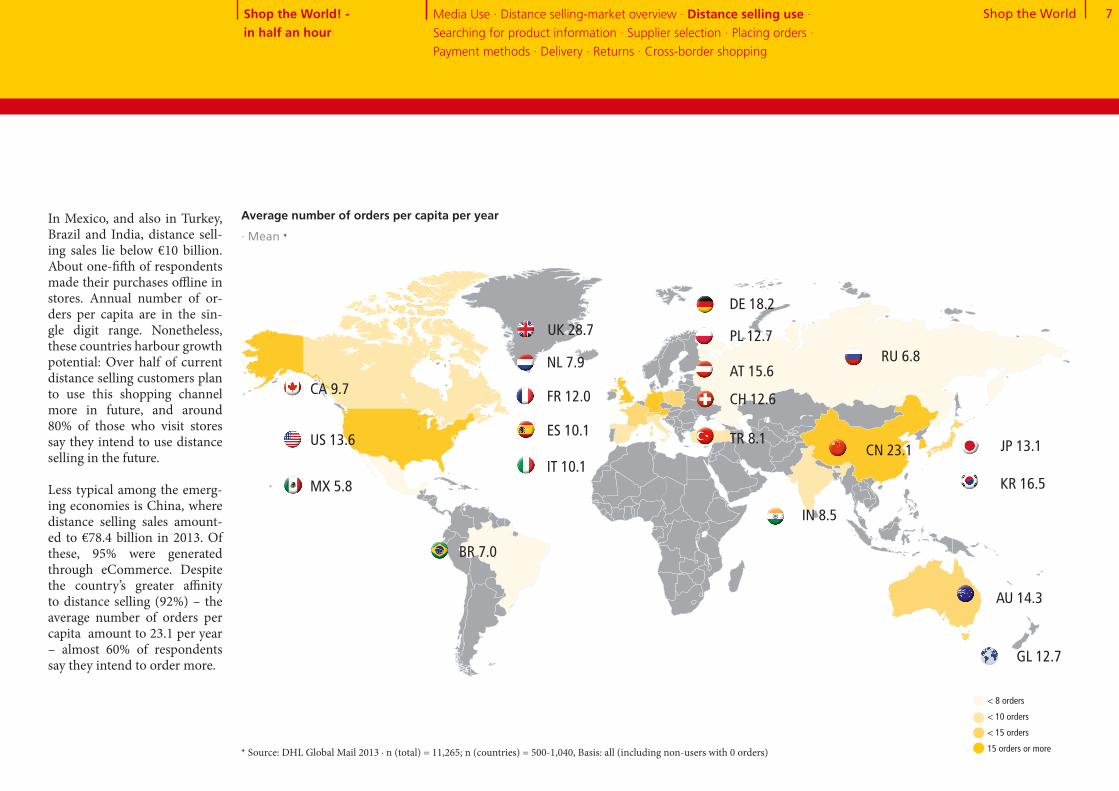
Average number of orders per capita per year · Mean *
In Mexico, and also in Turkey, Brazil and India, distance sell-ing sales lie below €10 billion . About one-fifth of respondents made their purchases offline in stores . Annual number of or-ders per capita are in the sin-gle digit range . Nonetheless, these countries harbour growth potential: Over half of current distance selling customers plan to use this shopping channel more in future, and around 80% of those who visit stores say they intend to use distance selling in the future .
Less typical among the emerg-ing economies is China, where distance selling sales amount-ed to €78 .4 billion in 2013 . Of these, 95% were generated through eCommerce . Despite the country’s greater affinity to distance selling (92%) – the average number of orders per capita amount to 23 .1 per year – almost 60% of respondents say they intend to order more .
* Source: DHL Global Mail 2013 ∙ n (total) = 11,265; n (countries) = 500-1,040, Basis: all (including non-users with 0 orders)
Media Use · Distance selling-market overview · Distance selling use ·
Searching for product information · Supplier selection · Placing orders ·
Payment methods · Delivery · Returns · Cross-border shopping

Shop the World 8
Searching for product information
Across all countries covered by the study, some 93% of respon-dents go online to search for product information . Search en-gines are the No . 1 choice (53%), followed by retailers’ websites (46%), price comparison sites (44%) and online marketplaces (43%) . Some 70% of distance selling customers also use offline sources, mostly in their immedi-ate environment . 38% rely on ex-perience gained by and tips from friends, acquaintances and col- leagues, while about a quarter use catalogs and product visibil-ity in retail stores .
Country-specific differences are evident in the way users search for information . People in Brazil tend to rely on personal recom-mendations (48%), social media platforms (26%) and customer reviews (53%) . In Japan, the trend goes more towards per-sonal dialog (18%), while social media plays only a subordinate role .
Online (net)
Search engines
Retailer or manufacturer website
Price comparison sites
Online marketplace
Customer ratings on the supplier’s website
Customer ratings in blogs and forums
Social media platforms, such as Facebook, Twitter
Apps (on smartphone, iPad or tablet)
Offline (net)
Recommendations from friends, acquaintances, and colleagues
Catalog
Product check in a retail store
Product test ratings / expert test reports
Mail advertising
93
53
46
44
43
41
36
15
10
70
38
25
24
23
15
Search for product information · in % *
Flags show national variations from the global average of at least +10% points.
Shop the World! - in half an hour
* Source: DHL Global Mail 2013 ∙ n = 9,386; Basis: Distance selling users
Media Use · Distance selling-market overview · Distance selling use ·
Searching for product information · Supplier selection · Placing orders ·
Payment methods · Delivery · Returns · Cross-border shopping

Shop the World 9
Price is the key criterion in choosing a supplier . This is es-pecially the case in Japan (64%) and South Korea (66%) . By way of contrast, people in India place significantly less importance on affordable prices (35%) . The second most important criteri-on is free delivery . This is a key purchasing factor for 45% of people worldwide, and is the most important supplier selec-tion driver in Japan and the US .
Of less importance when choos-ing a supplier are the criteria in-volved in the subsequent phases of the purchasing process . In global comparison, one in four people expect speedy delivery (26%) . This includes delivery time, which is of great impor-tance to customers in Brazil (38%) . Supplier preference can also be driven by customers’ pay-ment option preferences (23%) and free returns (21%), the latter being of particular importance to shoppers in Germany (35%) and Austria (35%), where distance selling and especially free returns have long been the norm .
Favorable prices, promotions, & special offers
Free delivery
Positive customer ratings on the internet
Fast delivery
Choice of preferred payment methods
Free returns
Large selection of products
Good customer service
Attractive product line
Recommendations and experiences of friends, acquaintances, and colleagues
Straightforward return process
Official test seals, reviews, and test reports of independent institutions
52
45
27
26
23
21
21
19
14
15
13
9
Criteria for choosing a vendor · in % *
Flags show national variations from the global average of at least +10% points.
Shop the World! - in half an hour
Supplier selection
* Source: DHL Global Mail 2013 ∙ n = 10,617, Basis: Current and future distance selling users
Media Use · Distance selling-market overview · Distance selling use ·
Searching for product information · Supplier selection · Placing orders ·
Payment methods · Delivery · Returns · Cross-border shopping
Shop the World 10
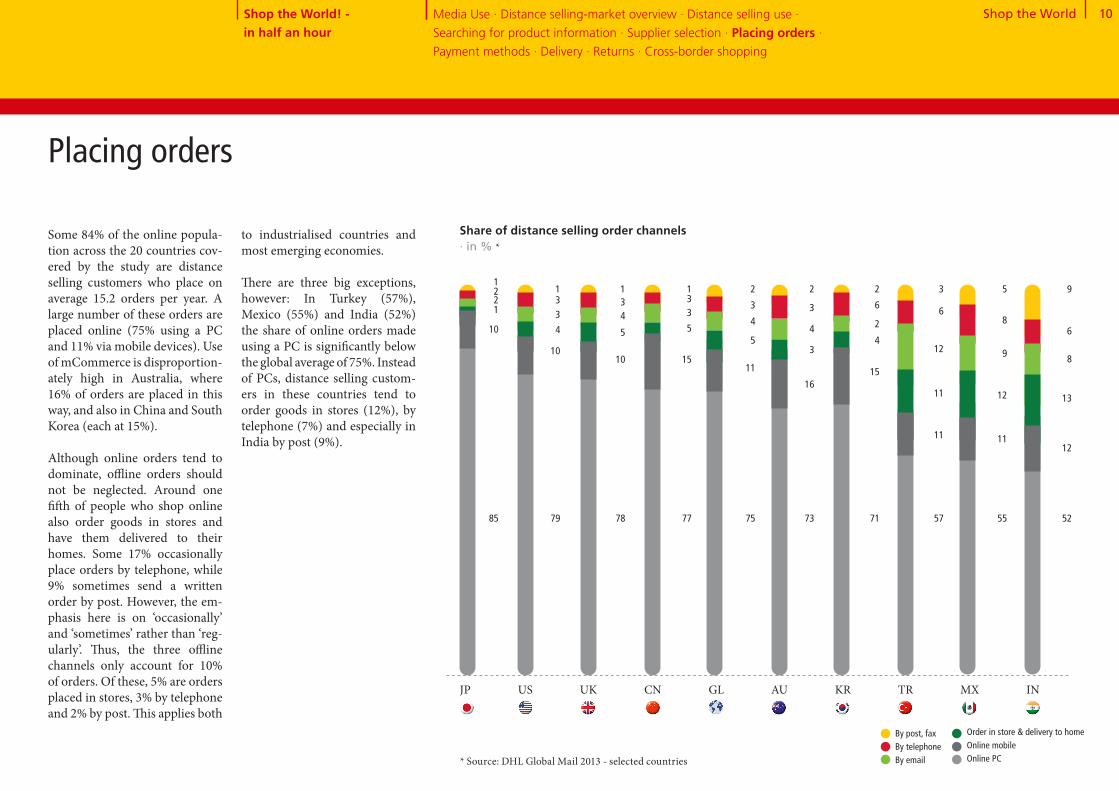
Some 84% of the online popula-tion across the 20 countries cov-ered by the study are distance selling customers who place on average 15 .2 orders per year . A large number of these orders are placed online (75% using a PC and 11% via mobile devices) . Use of mCommerce is disproportion- ately high in Australia, where 16% of orders are placed in this way, and also in China and South Korea (each at 15%) .
Although online orders tend to dominate, offline orders should not be neglected . Around one fifth of people who shop online also order goods in stores and have them delivered to their homes . Some 17% occasionally place orders by telephone, while 9% sometimes send a written order by post . However, the em-phasis here is on ‘occasionally’ and ‘sometimes’ rather than ‘reg-ularly’ . Thus, the three offline channels only account for 10% of orders . Of these, 5% are orders placed in stores, 3% by telephone and 2% by post . This applies both
to industrialised countries and most emerging economies .
There are three big exceptions, however: In Turkey (57%), Mexico (55%) and India (52%) the share of online orders made using a PC is significantly below the global average of 75% . Instead of PCs, distance selling custom-ers in these countries tend to order goods in stores (12%), by telephone (7%) and especially in India by post (9%) .
Shop the World! - in half an hour
Placing orders
Media Use · Distance selling-market overview · Distance selling use ·
Searching for product information · Supplier selection · Placing orders ·
Payment methods · Delivery · Returns · Cross-border shopping
Share of distance selling order channels · in % *
* Source: DHL Global Mail 2013 - selected countries
JP US UK CN GL AU KR TR MX IN
1221
10
85
133
4
10
79
134
5
10
78
133
5
15
77
2
3
4
5
11
75
2
3
4
3
16
73
2
6
2
4
15
71
3
6
12
11
11
57
5
8
9
12
11
55
9
6
8
13
12
52
By post, faxBy telephoneBy email
Order in store & delivery to homeOnline mobileOnline PC

Shop the World 11
Credit cards are the most fre-quently used method of payment around the world . In global com-parison, some 61% of respon-dents said they used this method (very) frequently or occasionally . In Turkey, Japan, the US, South Korea, Brazil and Canada this figure rises to over 80% . The Netherlands, Poland and Russia tend to view credit card payment with scepticism – regular credit card use in these countries drops to just below 25% .
Online payment systems like PayPal and Alipay are the second most-frequent payment method used . More than half of distance selling customers around the world say they use them (very) frequently or occasionally . As with credit card payments, use of online payment systems varies from country to count-ry . In China, Aliplay – a wallet solution which supports all national debit cards and inter- national credit cards – is the do-minant choice . Almost all Chi-nese distance selling customers (91%) use it to pay for their or-ders . In Japan, by contrast, online payment systems are of little re- levance: Nine out of ten custom-
ers (88%) say they never use them or only use them on occa-sion .
Debit cards, prepayment, in-voice payment, direct debit and cash on delivery see similar use rates of between 28% and 34% . But there are some countries in which these payment methods are the preferred choice . Peo-ple in Great Britain (78%) prefer debit cards, while the Swiss (76%) and Germans (69%) like to receive an invoice before they pay . Cash on delivery, by con-trast, enjoys wide acceptance in India (75%) . Payment by install-ments is by far the least preferred method (12%), and is mostly used in South Korea (49%) .
Never Seldom Frequently / very frequentlyOccasionally
29 10 19 42Credit card
Online payment systems
Debit card
Prepayment
Invoice
Direct debit
Cash on delivery
Installment purchase / financing
33 13 20 34
55 11 16 18
53 16 16 15
54 16 16 13
56 16 16 12
78 9 8 4
56 1616 12
Frequently / very frequently
Payment in distance selling · in % *
Flags show national variations from the global average of at least +10% points.
Shop the World! - in half an hour
Payment methods
* Source: DHL Global Mail 2013 ∙ n = 9,218-9,324, Basis: Current distance selling users
Media Use · Distance selling-market overview · Distance selling use ·
Searching for product information · Supplier selection · Placing orders ·
Payment methods · Delivery · Returns · Cross-border shopping
Shop the World 12
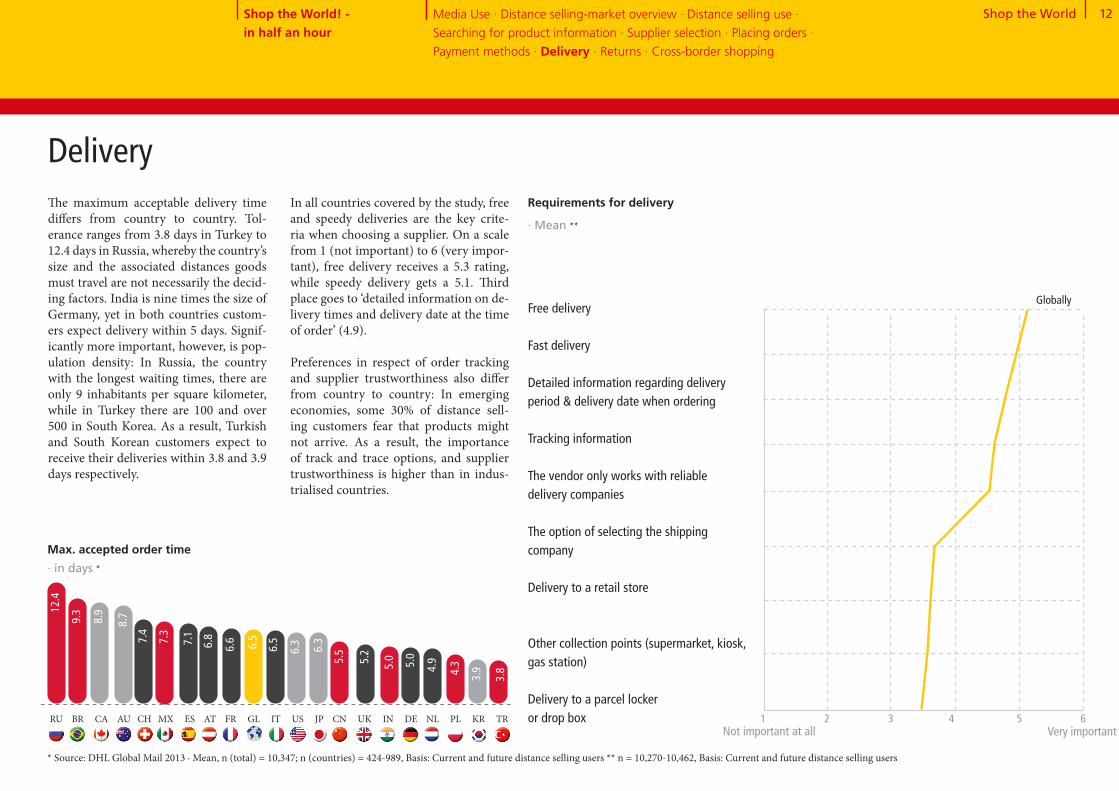
The maximum acceptable delivery time differs from country to country . Tol-erance ranges from 3 .8 days in Turkey to 12 .4 days in Russia, whereby the country’s size and the associated distances goods must travel are not necessarily the decid-ing factors . India is nine times the size of Germany, yet in both countries custom-ers expect delivery within 5 days . Signif-icantly more important, however, is pop-ulation density: In Russia, the country with the longest waiting times, there are only 9 inhabitants per square kilometer, while in Turkey there are 100 and over 500 in South Korea . As a result, Turkish and South Korean customers expect to receive their deliveries within 3 .8 and 3 .9 days respectively .
In all countries covered by the study, free and speedy deliveries are the key crite-ria when choosing a supplier . On a scale from 1 (not important) to 6 (very impor-tant), free delivery receives a 5 .3 rating, while speedy delivery gets a 5 .1 . Third place goes to ‘detailed information on de-livery times and delivery date at the time of order’ (4 .9) .
Preferences in respect of order tracking and supplier trustworthiness also differ from country to country: In emerging economies, some 30% of distance sell-ing customers fear that products might not arrive . As a result, the importance of track and trace options, and supplier trustworthiness is higher than in indus-trialised countries .
RU BR CA AU CH MX ES AT FR GL IT US JP CN UK IN DE NL PL KR TR
Max . accepted order time · in days *
Free delivery
Fast delivery
Detailed information regarding delivery period & delivery date when ordering
Tracking information
The vendor only works with reliable delivery companies
The option of selecting the shipping company
Delivery to a retail store
Other collection points (supermarket, kiosk, gas station)
Delivery to a parcel locker or drop box 1 2 3 4 5 6
Not important at all Very important
Globally
Requirements for delivery · Mean **
12.4
9.3
8.9
8.7
7.4
7.3
7.1
6.8
6.6 6.5
6.5
6.3 6.3
5.5
5.2
5.0 5.0
4.9
4.3
3.9
3.8
Shop the World! - in half an hour
Delivery
* Source: DHL Global Mail 2013 ∙ Mean, n (total) = 10,347; n (countries) = 424-989, Basis: Current and future distance selling users ** n = 10,270-10,462, Basis: Current and future distance selling users
Media Use · Distance selling-market overview · Distance selling use ·
Searching for product information · Supplier selection · Placing orders ·
Payment methods · Delivery · Returns · Cross-border shopping
Shop the World 13
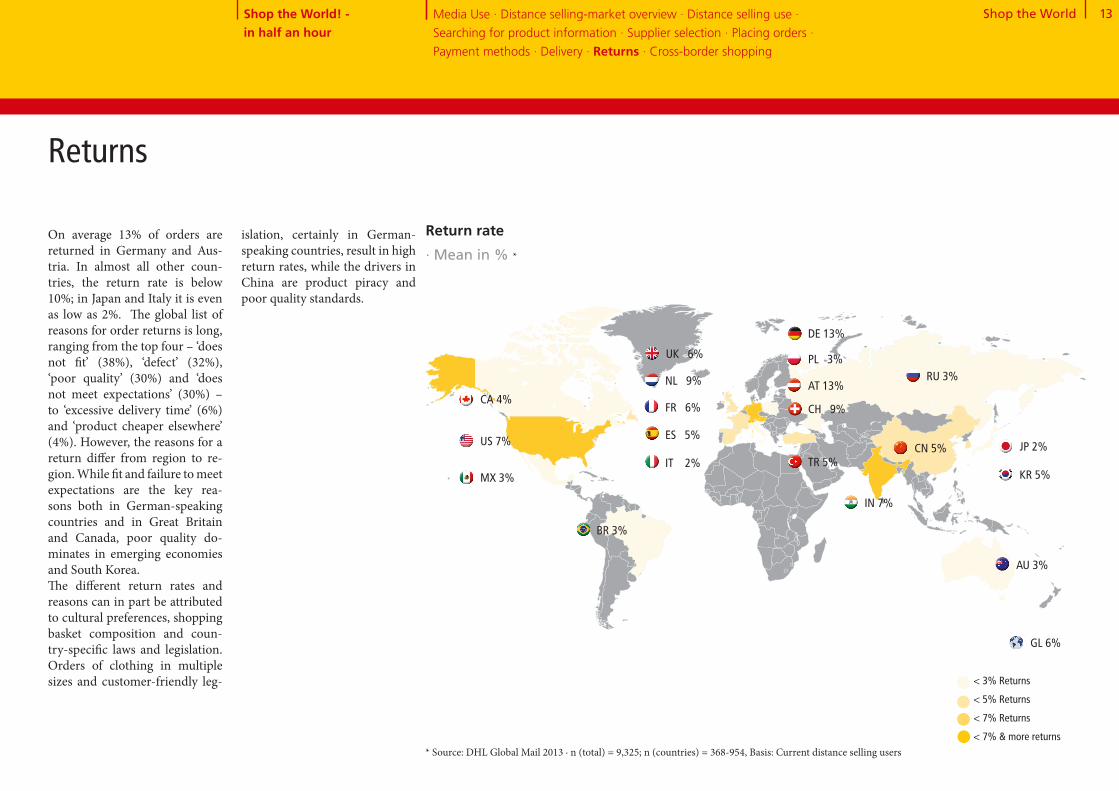
On average 13% of orders are returned in Germany and Aus- tria . In almost all other coun-tries, the return rate is below 10%; in Japan and Italy it is even as low as 2% . The global list of reasons for order returns is long, ranging from the top four – ‘does not fit’ (38%), ‘defect’ (32%), ‘poor quality’ (30%) and ‘does not meet expectations’ (30%) – to ‘excessive delivery time’ (6%) and ‘product cheaper elsewhere’ (4%) . However, the reasons for a return differ from region to re- gion . While fit and failure to meet expectations are the key rea- sons both in German-speaking countries and in Great Britain and Canada, poor quality do-minates in emerging economies and South Korea .The different return rates and reasons can in part be attributed to cultural preferences, shopping basket composition and coun-try-specific laws and legislation . Orders of clothing in multiple sizes and customer-friendly leg-
islation, certainly in German-speaking countries, result in high return rates, while the drivers in China are product piracy and poor quality standards .
Shop the World! - in half an hour
UK 6%
DE 13%
CN 5%
AT 13%
KR 5%
PL 3%
US 7%
CH 9%
JP 2%
FR 6%
IT 2%
ES 5%
NL 9%
AU 3%
IN 7%
BR 3%
RU 3%
TR 5%MX 3%
CA 4%
GL 6%
< 3% Returns
< 5% Returns
< 7% Returns
< 7% & more returns
Return rate · Mean in % *
Returns
* Source: DHL Global Mail 2013 ∙ n (total) = 9,325; n (countries) = 368-954, Basis: Current distance selling users
Media Use · Distance selling-market overview · Distance selling use ·
Searching for product information · Supplier selection · Placing orders ·
Payment methods · Delivery · Returns · Cross-border shopping
Shop the World 14
Cross-border shopping – Overview
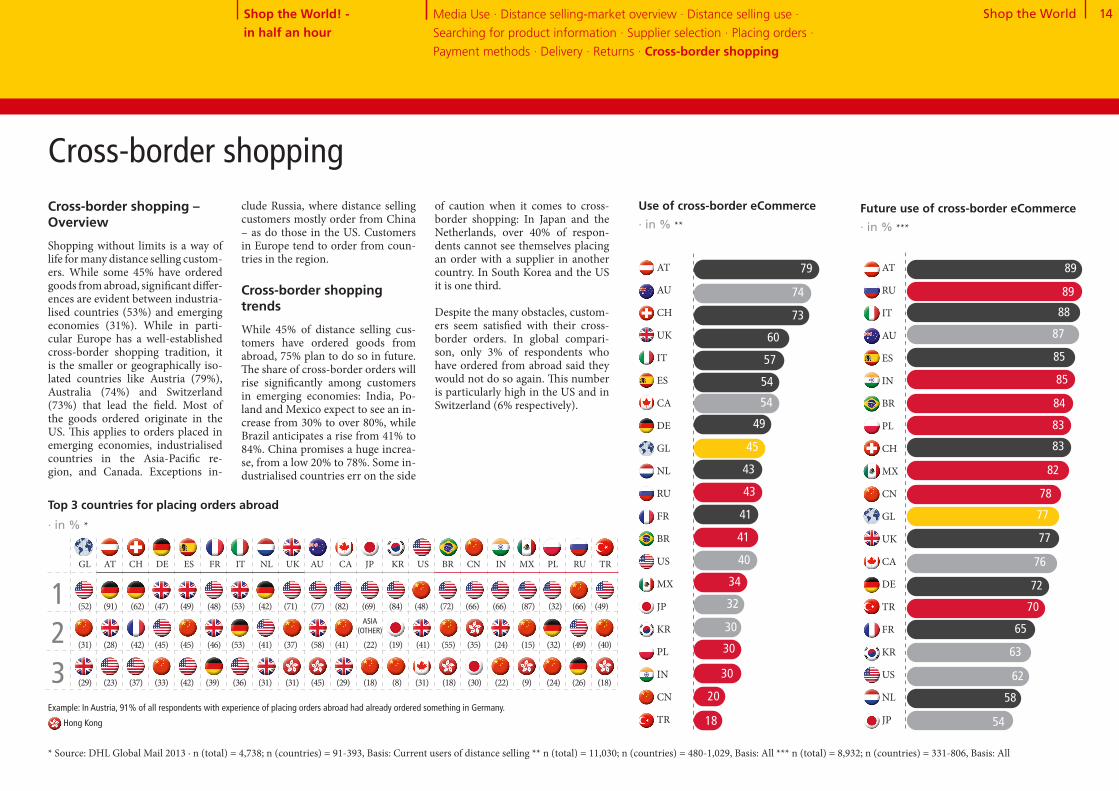
Shopping without limits is a way of life for many distance selling custom- ers . While some 45% have ordered goods from abroad, significant differ- ences are evident between industria-lised countries (53%) and emerging economies (31%) . While in parti-cular Europe has a well-established cross-border shopping tradition, it is the smaller or geographically iso-lated countries like Austria (79%), Australia (74%) and Switzerland (73%) that lead the field . Most of the goods ordered originate in the US . This applies to orders placed in emerging economies, industrialised countries in the Asia-Pacific re- gion, and Canada . Exceptions in-
clude Russia, where distance selling customers mostly order from China – as do those in the US . Customers in Europe tend to order from coun-tries in the region .
Cross-border shopping trends
While 45% of distance selling cus-tomers have ordered goods from abroad, 75% plan to do so in future . The share of cross-border orders will rise significantly among customers in emerging economies: India, Po-land and Mexico expect to see an in-crease from 30% to over 80%, while Brazil anticipates a rise from 41% to 84% . China promises a huge increa-se, from a low 20% to 78% . Some in-dustrialised countries err on the side
79
74
73
60
57
54
54
49
45
43
43
41
41
40
34
32
30
30
30
20
18
Use of cross-border eCommerce · in % **
123
GL AT CH DE ES FR IT NL UK AU CA JP KR US BR CN IN MX PL RU TR
(52) (91) (62) (47) (49) (48) (53) (42) (71) (77) (82) (69) (84) (48) (72) (66) (66) (87) (32) (66) (49)ASIA
(OTHER)
(31) (28) (42) (45) (45) (46) (53) (41) (37) (58) (41) (22) (19) (41) (55) (35) (24) (15) (32) (49) (40)
(29) (23) (37) (33) (42) (39) (36) (31) (31) (45) (29) (18) (8) (31) (18) (30) (22) (9) (24) (26) (18)
Top 3 countries for placing orders abroad · in % *
Example: In Austria, 91% of all respondents with experience of placing orders abroad had already ordered something in Germany.
Hong Kong
Shop the World! - in half an hour
Cross-border shoppingof caution when it comes to cross-border shopping: In Japan and the Netherlands, over 40% of respon-dents cannot see themselves placing an order with a supplier in another country . In South Korea and the US it is one third .
Despite the many obstacles, custom-ers seem satisfied with their cross-border orders . In global compari-son, only 3% of respondents who have ordered from abroad said they would not do so again . This number is particularly high in the US and in Switzerland (6% respectively) .
* Source: DHL Global Mail 2013 ∙ n (total) = 4,738; n (countries) = 91-393, Basis: Current users of distance selling ** n (total) = 11,030; n (countries) = 480-1,029, Basis: All *** n (total) = 8,932; n (countries) = 331-806, Basis: All
AT
AU
CH
UK
IT
ES
CA
DE
GL
NL
RU
FR
BR
US
MX
JP
KR
PL
IN
CN
TR
89
89
88
87
85
85
84
83
83
82
78
77
77
76
72
70
65
63
62
58
54
Future use of cross-border eCommerce · in % ***
AT
RU
IT
AU
ES
IN
BR
PL
CH
MX
CN
GL
UK
CA
DE
TR
FR
KR
US
NL
JP
Media Use · Distance selling-market overview · Distance selling use ·
Searching for product information · Supplier selection · Placing orders ·
Payment methods · Delivery · Returns · Cross-border shopping

Shop the World 15
Drivers in cross-border shopping
The main reasons for shopping abroad are that products are not available domestically (73%) and that prices are lower elsewhere (63%) . In emerging economies, better quality and protection against counterfeit goods and product piracy are key factors . These were cited particularly fre-quently by customers in China, India and Russia . Obstacles to cross-border shopping
In global comparison, 20% of all internet users say they would not order from abroad in future . Among them are also experi-enced distance selling customers who think the obstacles and pro-blems of ordering abroad are just too big . The biggest obstacles are seen in the delivery process: Long delivery times (56%), high delivery charges (54%) and com-plex return management (51%) . These were cited to equal extent by respondents in all countries
covered by the study . Cultural differences between the coun-tries occur in the context of other barriers: Concern about counter-feit products is one of the main obstacles in Japan (56%), while in Switzerland only 31% share this concern . Language barriers tend to stop people in Turkey (49%), China (44%) and France (42%) from ordering goods from abroad .
Products not obtain-able domestically
Lower prices
Greater selection
Higher quality of the products
Assurance against product counterfeiting
74
74
72
57
69
62
49
35
41
49
8
15
24
4
6
Emerging economies
Industrialized countries (Europe)
Industrialized countries (Americas & APAC)
Drivers for ordering abroad · in % *
Shop the World! - in half an hour
* Source: DHL Global Mail 2013 ∙ n = 7,289, Basis: Current or future use of cross-border distance selling ** n = 10,689
Long delivery times
High delivery costs
Complicated return process
Fear of fraud
Customs clearance
Non-transparent costs
Uncertain delivery
Uncertainty regarding warranty terms, payment process, legal situation, etc.
Unknown product quality
Uncertainty with problems
Concern about misuse of payment data
Language problems
Concerns about data protection
No demand because all products are obtainable locally
56
54
51
42
41
41
39
39
33
36
32
32
Flags show national variations from the global average of at least +10% points.
24
13
Barriers to ordering abroad · in % **
Media Use · Distance selling-market overview · Distance selling use ·
Searching for product information · Supplier selection · Placing orders ·
Payment methods · Delivery · Returns · Cross-border shopping
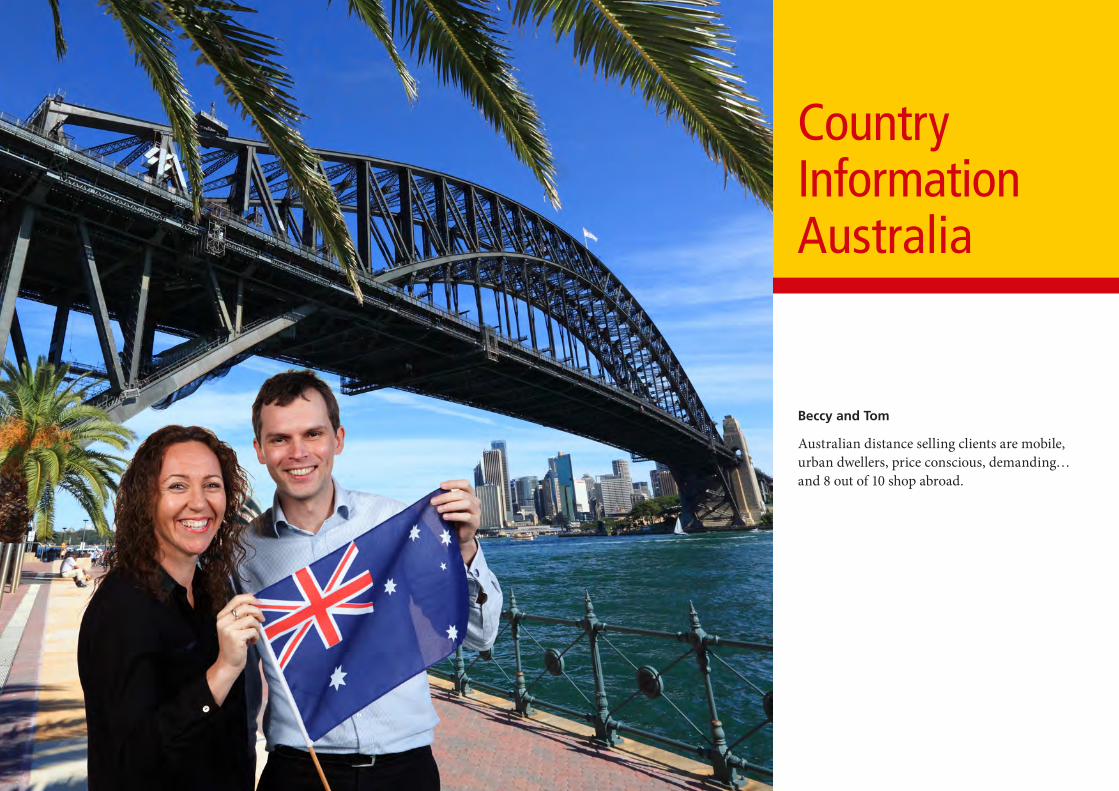
Country InformationAustralia
Beccy and Tom Australian distance selling clients are mobile, urban dwellers, price conscious, demanding… and 8 out of 10 shop abroad.
Shop the World 17
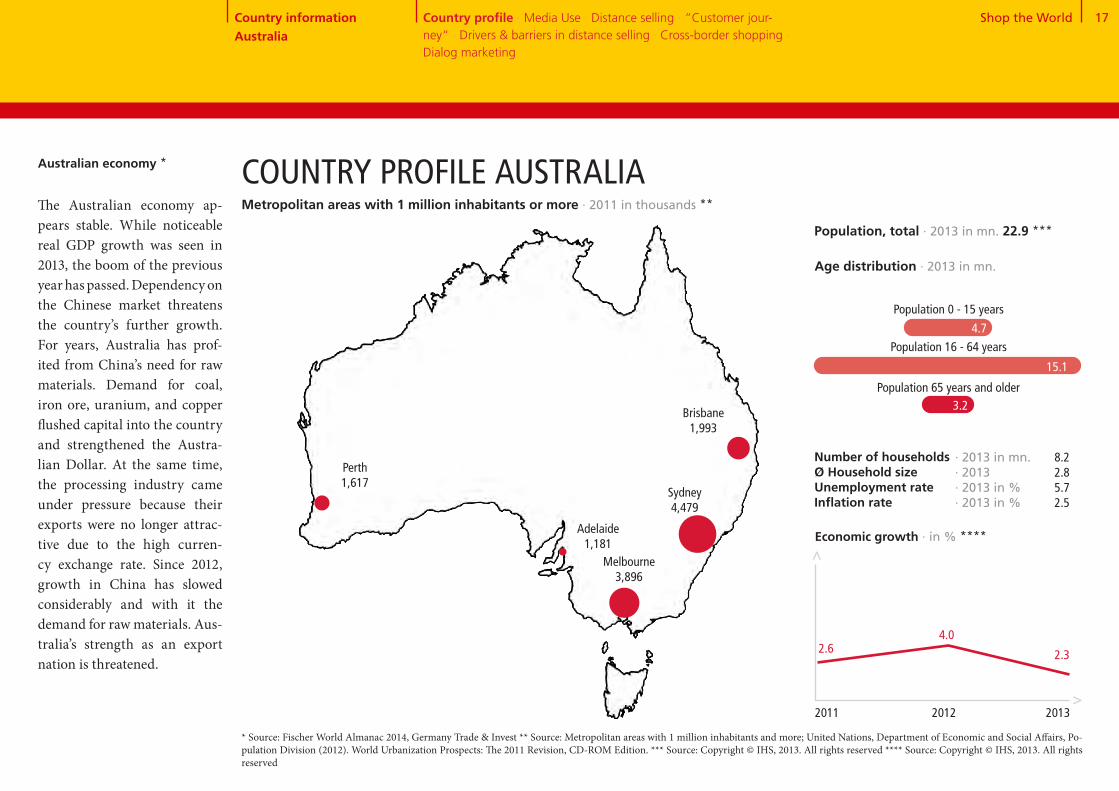
4.7
Population 0 - 15 years
Australian economy * COUNTRY PROFILE AUSTRALIA
Melbourne 3,896
* Source: Fischer World Almanac 2014, Germany Trade & Invest ** Source: Metropolitan areas with 1 million inhabitants and more; United Nations, Department of Economic and Social Affairs, Po-pulation Division (2012). World Urbanization Prospects: The 2011 Revision, CD-ROM Edition. *** Source: Copyright © IHS, 2013. All rights reserved **** Source: Copyright © IHS, 2013. All rights reserved
Number of households Ø Household sizeUnemployment rateInflation rate
4.0
Economic growth · in % ****
>
>
2.32.6
2011 2012 2013
Country information Australia
Country profile · Media Use · Distance selling · “Customer jour-ney“ · Drivers & barriers in distance selling · Cross-border shopping · Dialog marketing
· 2013 in mn.· 2013· 2013 in %· 2013 in %
8.22.85.72.5
The Australian economy ap- pears stable. While noticeable real GDP growth was seen in 2013, the boom of the previous year has passed. Dependency on the Chinese market threatens the country’s further growth. For years, Australia has prof-ited from China’s need for raw materials. Demand for coal, iron ore, uranium, and copper flushed capital into the country and strengthened the Austra- lian Dollar. At the same time, the processing industry came under pressure because their exports were no longer attrac-tive due to the high curren-cy exchange rate. Since 2012, growth in China has slowed considerably and with it the demand for raw materials. Aus-tralia’s strength as an export nation is threatened.
15.1
3.2Brisbane 1,993
Perth 1,617
Adelaide 1,181
Sydney 4,479
Age distribution · 2013 in mn.
Population 65 years and older
Population, total · 2013 in mn. 22.9 ***
Population 16 - 64 years
Metropolitan areas with 1 million inhabitants or more · 2011 in thousands **
Shop the World 18
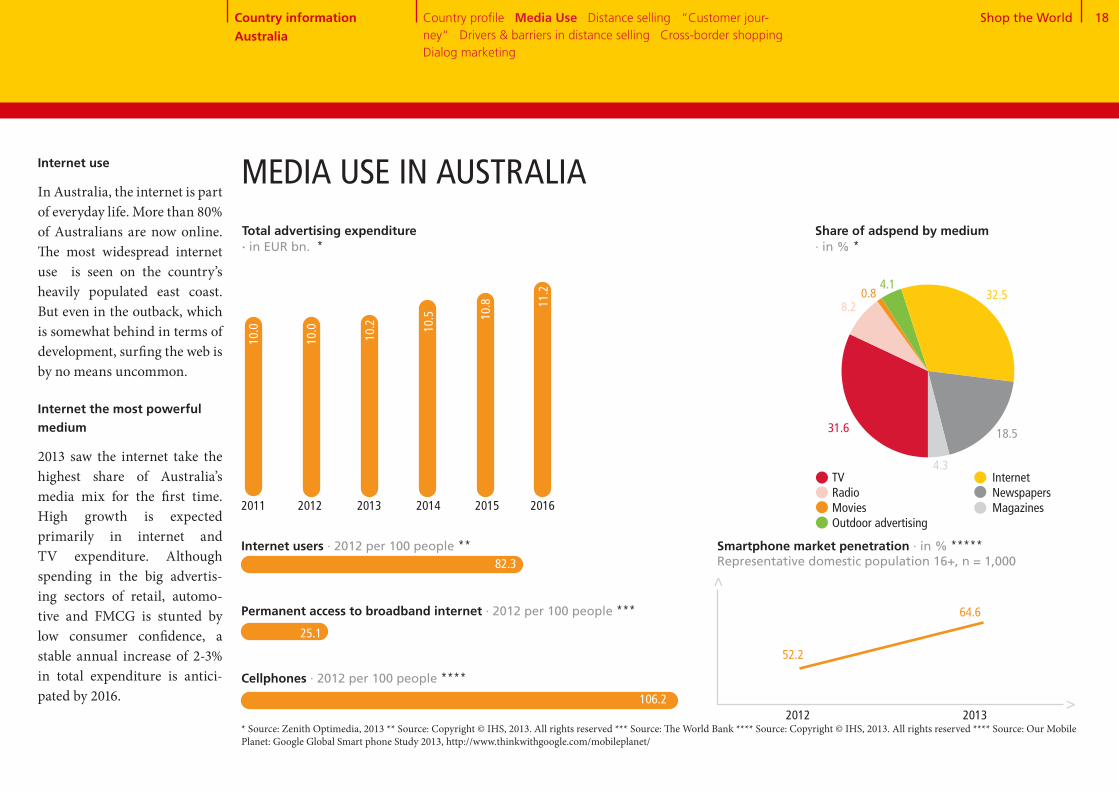
32+8+1+4+32+19+4MEDIA USE IN AUSTRALIA
25.1
106.2
Smartphone market penetration · in % *****Representative domestic population 16+, n = 1,000
52.2
Internet users · 2012 per 100 people **
Permanent access to broadband internet · 2012 per 100 people ***
Cellphones · 2012 per 100 people ****
2012 2013
64.6
Share of adspend by medium · in % *
TV Radio Movies Outdoor advertising
Total advertising expenditure · in EUR bn. *
Internet Newspapers Magazines
>>
2011 2012 2013 2014 2015
10.8
82.3
10.5
10.2
10.0
10.0
2016
11.2
Country information Australia
Country profile · Media Use · Distance selling · “Customer jour-ney“ · Drivers & barriers in distance selling · Cross-border shopping · Dialog marketing
32.5
18.5
4.3
4.10.8
8.2
31.6
* Source: Zenith Optimedia, 2013 ** Source: Copyright © IHS, 2013. All rights reserved *** Source: The World Bank **** Source: Copyright © IHS, 2013. All rights reserved **** Source: Our Mobile Planet: Google Global Smart phone Study 2013, http://www.thinkwithgoogle.com/mobileplanet/
Internet use
In Australia, the internet is part of everyday life. More than 80% of Australians are now online. The most widespread internet use is seen on the country’s heavily populated east coast. But even in the outback, which is somewhat behind in terms of development, surfing the web is by no means uncommon. Internet the most powerful medium
2013 saw the internet take the highest share of Australia’s media mix for the first time. High growth is expected primarily in internet and TV expenditure. Although spending in the big advertis- ing sectors of retail, automo-tive and FMCG is stunted by low consumer confidence, a stable annual increase of 2-3% in total expenditure is antici- pated by 2016.
Shop the World 19
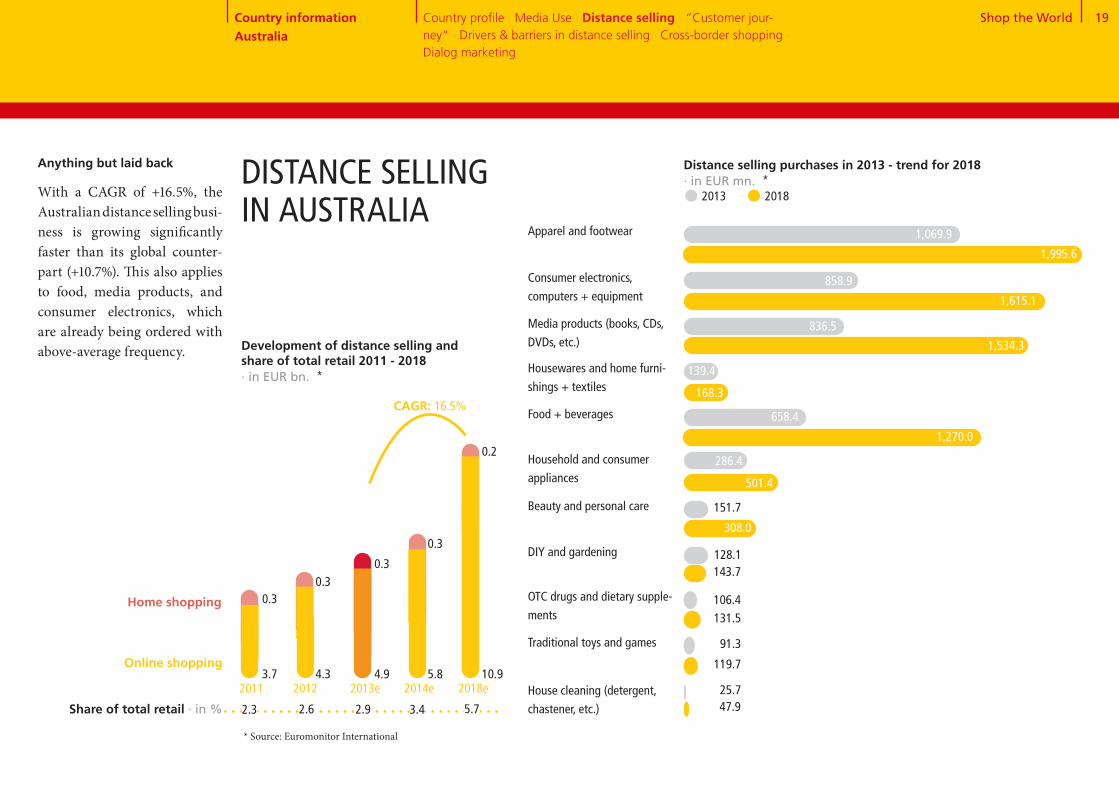
Anything but laid back
With a CAGR of +16.5%, the Australian distance selling busi- ness is growing significantly faster than its global counter-part (+10.7%). This also applies to food, media products, and consumer electronics, which are already being ordered with above-average frequency.
DISTANCE SELLING IN AUSTRALIA
1,995.6
Distance selling purchases in 2013 - trend for 2018 · in EUR mn. * 2013 2018
Apparel and footwear
168.3
139.4
1,270.0
286.4
501.4
308.0
143.7128.1
106.4
119.7
91.3
47.9
Consumer electronics,
computers + equipment
Media products (books, CDs,
DVDs, etc.)
Housewares and home furni-
shings + textiles
Food + beverages
Household and consumer
appliances
Beauty and personal care
DIY and gardening
OTC drugs and dietary supple-
ments
Traditional toys and games
House cleaning (detergent,
chastener, etc.)
Development of distance selling and share of total retail 2011 - 2018 · in EUR bn. *
CAGR: 16.5%
Home shopping
Online shopping3.7 4.3 4.9
0.30.3
0.3
5.8 10.9
0.3
0.2
2011 2012 2013e 2014e 2018e
Share of total retail · in % 2.3 2.6 2.9 3.4
* Source: Euromonitor International
25.7
Country information Australia
Country profile · Media Use · Distance selling · “Customer jour-ney“ · Drivers & barriers in distance selling · Cross-border shopping · Dialog marketing
658.4
151.7
131.5
1,534.3
836.5
1,069.9
1,615.1
858.9
5.7
Shop the World 20
81+1984
+16
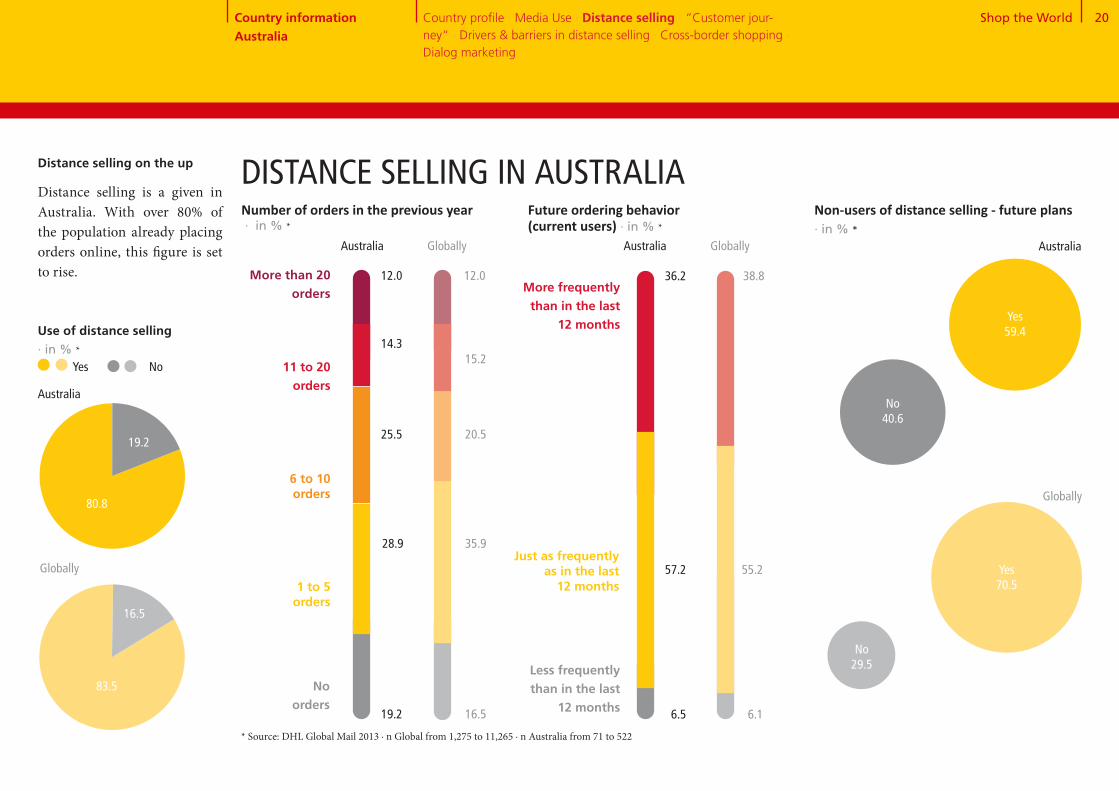
Distance selling on the up
Distance selling is a given in Australia. With over 80% of the population already placing orders online, this figure is set to rise.
Use of distance selling · in % *
80.8
19.2
Australia
Globally
83.5
16.5
Number of orders in the previous year · in % *
1 to 5 orders
6 to 10 orders
11 to 20 orders
More than 20 orders
No orders
25.5
28.9
14.3
19.2
12.0
20.5
35.9
15.2
16.5
12.0
Future ordering behavior (current users) · in % *
More frequently than in the last
12 months
Just as frequently as in the last
12 months
Less frequently than in the last
12 months
57.2
36.2
55.2
38.8
6.5 6.1
Non-users of distance selling - future plans · in % *
Yes59.4
Australia
Globally
Yes70.5
No40.6
No29.5
Yes No
Australia Globally Australia Globally
DISTANCE SELLING IN AUSTRALIA
* Source: DHL Global Mail 2013 ∙ n Global from 1,275 to 11,265 ∙ n Australia from 71 to 522
Country information Australia
Country profile · Media Use · Distance selling · “Customer jour-ney“ · Drivers & barriers in distance selling · Cross-border shopping · Dialog marketing
Shop the World 21
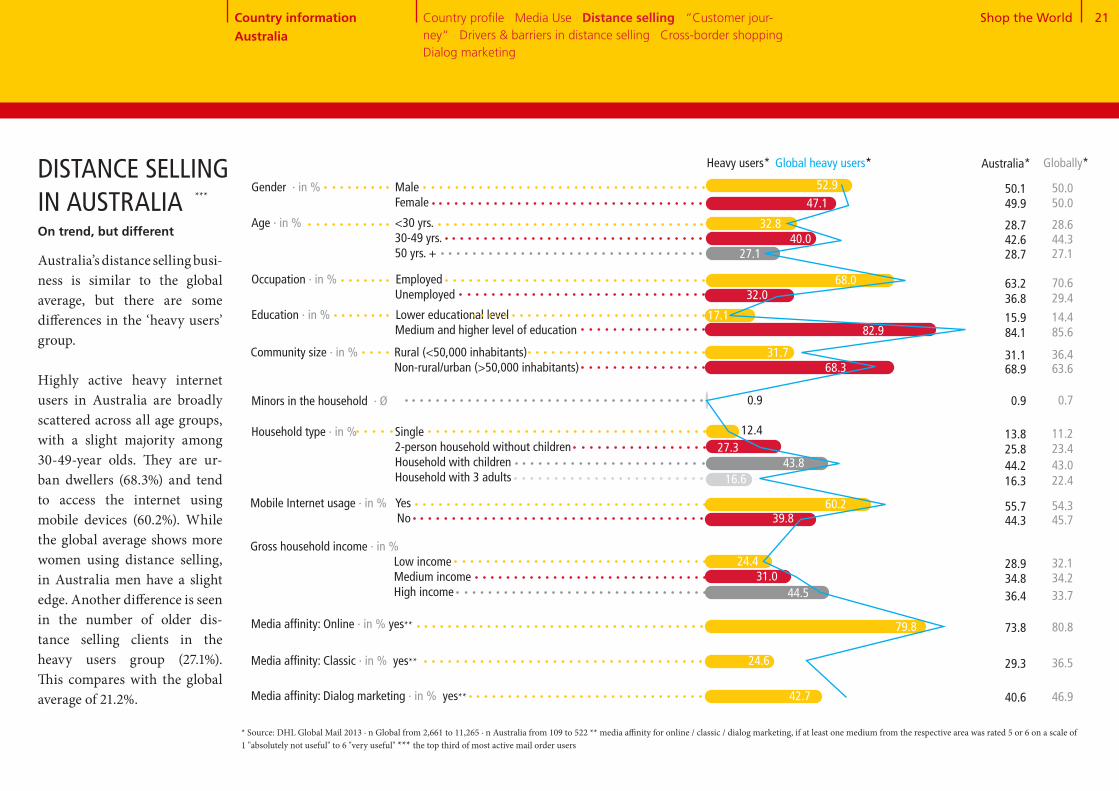
On trend, but different
Australia’s distance selling busi- ness is similar to the global average, but there are some differences in the ‘heavy users’ group. Highly active heavy internet users in Australia are broadly scattered across all age groups, with a slight majority among 30-49-year olds. They are ur-ban dwellers (68.3%) and tend to access the internet using mobile devices (60.2%). While the global average shows more women using distance selling, in Australia men have a slight edge. Another difference is seen in the number of older dis- tance selling clients in the heavy users group (27.1%). This compares with the global average of 21.2%.
DISTANCE SELLING IN AUSTRALIA
* Source: DHL Global Mail 2013 ∙ n Global from 2,661 to 11,265 ∙ n Australia from 109 to 522 ** media affinity for online / classic / dialog marketing, if at least one medium from the respective area was rated 5 or 6 on a scale of 1 "absolutely not useful" to 6 "very useful" *** the top third of most active mail order users
Country information Australia
Country profile · Media Use · Distance selling · “Customer jour-ney“ · Drivers & barriers in distance selling · Cross-border shopping · Dialog marketing
***
Globally*
40.0
Gender · in % Male Female
Age · in % <30 yrs. 30-49 yrs. 50 yrs. +
Occupation · in % Employed Unemployed
Education · in % Lower educational level Medium and higher level of education
17.1
Media affinity: Online · in % yes**
Community size · in % Rural (<50,000 inhabitants) Non-rural/urban (>50,000 inhabitants)
Minors in the household · Ø
Household type · in % Single 2-person household without children Household with children Household with 3 adults
Mobile Internet usage · in % Yes No
Gross household income · in % Low income Medium income High income
Media affinity: Classic · in % yes**
Media affinity: Dialog marketing · in % yes** 42.7
24.6
79.8
44.531.0
24.4
39.860.2
16.643.8
47.1
32.8
52.9
32.0
82.9
68.3
0.9
27.312.4
68.0
44.327.1
14.4
36.4
46.9
36.5
80.8
33.734.232.1
45.754.3
22.443.0
50.0
28.6
50.0
29.4
85.6
63.6
0.7
23.411.2
70.6
Australia*
42.628.7
15.9
31.1
40.6
29.3
73.8
36.434.828.9
44.355.7
16.344.2
49.9
28.7
50.1
36.8
84.1
68.9
0.9
25.813.8
63.2
27.1
31.7
Heavy users* Global heavy users*
Shop the World 22
“CUSTOMER JOURNEY“ – SEARCHING FOR PRODUCT INFORMATIONSearch for product information · Australia in % * Globally
34.1 35.5
53.2
24.0 23.4
35.6 44.2
22.9 23.9
45.8
49.0 42.5
24.6 25.1
11.8 15.1
16.6 15.1
8.2 9.7
39.1 37.8
Criteria for choosing a vendor · Australia in % *
Globally
Search engines
Customer ratings in blogs or forums
Product test ratings / expert test reports
Product check in a retail store
Retailer or manufacturer website
Online marketplace
Catalog
Mail advertising
Social media platforms such as Facebook and Twitter
Apps (on smartphone, iPad, or tablet)
Recommendations from friends, acquaintances, and colleagues
35.1 40.6Customer ratings on the supplier’s website
Price comparison sites
Large selection of products
Recommendation and experiences of friends, acquaintances, and colleagues
Official test seals, reviews, and test reports of independent institutions
Attractive product line
Favorable prices, promotions, & special offers
Straightforward return process
Free returns
Choice of preferred payment methods
Fast delivery
Free delivery
Good customer service
Positive customer ratings on the internet
15.1 13.7
20.7
10.1 8.8
30.0 26.6
12.0 14.9
56.9 51.7
9.6 12.9
14.4 20.8
30.6 22.6
27.5 25.7
44.0 45.2
15.4 18.5
19.9
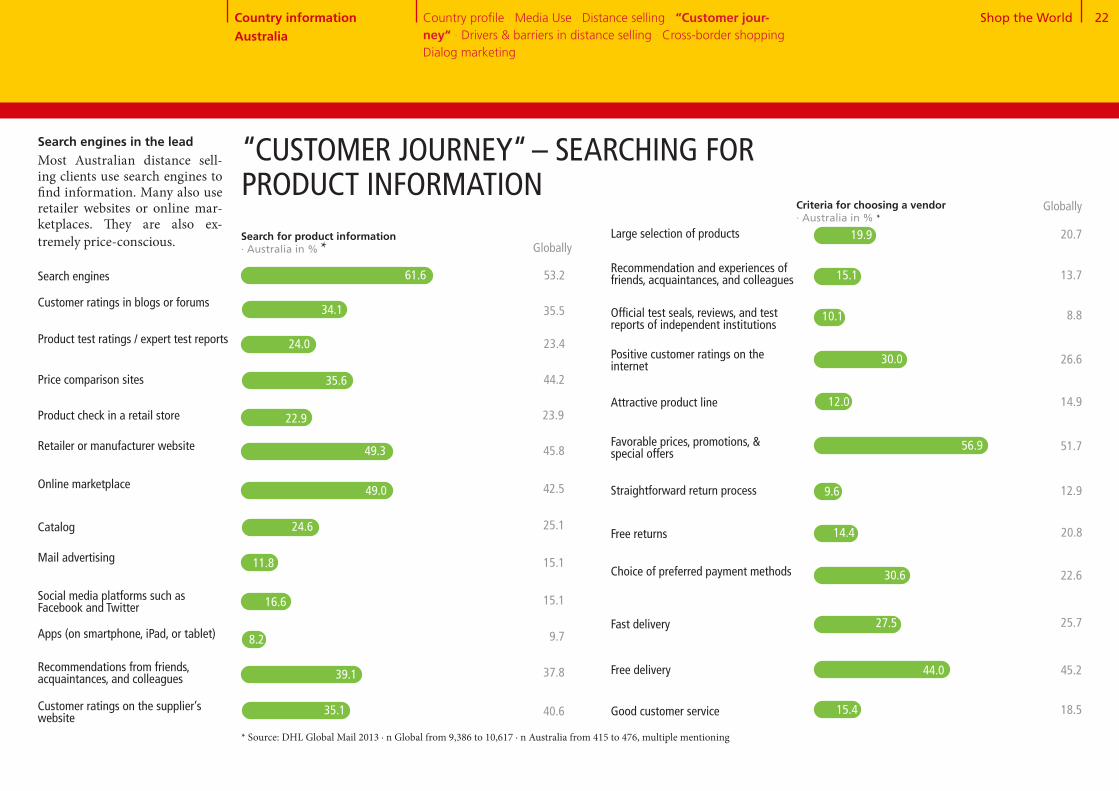
Search engines in the leadMost Australian distance sell-ing clients use search engines to find information. Many also use retailer websites or online mar-ketplaces. They are also ex- tremely price-conscious.
* Source: DHL Global Mail 2013 ∙ n Global from 9,386 to 10,617 ∙ n Australia from 415 to 476, multiple mentioning
Country information Australia
Country profile · Media Use · Distance selling · “Customer jour-ney“ · Drivers & barriers in distance selling · Cross-border shopping · Dialog marketing
61.6
49.3

Shop the World 23
* Source: DHL Global Mail 2013 ∙ n Global from 10,218 to 10,384 ∙ n Australia from 462 to 468 ** scale from 1 "absolutely not useful“ to 6 "very useful“
Demanding target group
Persuasive advertising is a particular challenge in Aus- tralia. Online shoppers tend to perceive advertising media as unhelpful. Internet search en-gines lead the way, with 62.7% of users perceiving them as ‘very useful’.
ACCEPTANCE OF ADVERTISING MEDIA
Country information Australia
Country profile · Media Use · Distance selling · “Customer jour-ney“ · Drivers & barriers in distance selling · Cross-border shopping · Dialog marketing
Usefulness of advertising media · in % *, **
5 and 63 and 41 and 2
Ø
47.228.1 24.726.1 43.8 30.1
Online advertisingAustralia Globally
Television advertising
5 and 63 and 41 and 2
3.43.6
Ø
40.741.3 18.030.6 41.8 27.6
3.03.4
41.142.2 16.738.7 40.4 20.9Social media
Australia Globally
Advertising letters
2.93.1
32.546.2 21.333.9 37.6 28.5
2.93.4
Product suggestions in online shops
45.326.8 28.018.9 45.1 36.0
3.53.9
29.87.6 62.76.5 28.7 64.8
4.74.8
38.512.7 48.79.1 31.7 59.1
4.24.6
45.329.4 25.229.9 43.9 26.2
AustraliaGlobally
Household advertising
3.43.4
44.535.7 19.729.0 46.7 24.3
AustraliaGlobally
Advertisements in mag- azines and periodicals
3.23.4
47.338.6 14.134.8 43.1 22.1
AustraliaGlobally
Advertisements in newspapers
3.03.2
37.553.2 9.241.8 40.7 17.6
Australia Globally
Billboard advertise-ments
2.53.0
40.244.0 15.744.3 38.8 16.9
AustraliaGlobally
Radio
2.92.9
45.620.6 33.819.3 44.2 36.6
AustraliaGlobally
Catalogs from vendors
3.83.9
Australia Globally
Australia Globally
AustraliaGlobally
Internet search engines
Australia Globally
Price comparison sites
AustraliaGlobally
Shop the World 24
Australia Globally Use of different suppliers · in % *
Never Seldom Frequently / very frequently
Occasionally
* Source: DHL Global Mail 2013 ∙ n Global from 9,270 to 9,446 ∙ n Australia from 413 to 422
Online PC
Online mobile (tablet, smartphone)
By telephone
In writing (by post, fax)
By email
Order in store & delivery to home
73.2
2.7
1.7
4.2
75.0
3.2
2.1
4.4
“CUSTOMER JOURNEY“– PLACING ORDERS
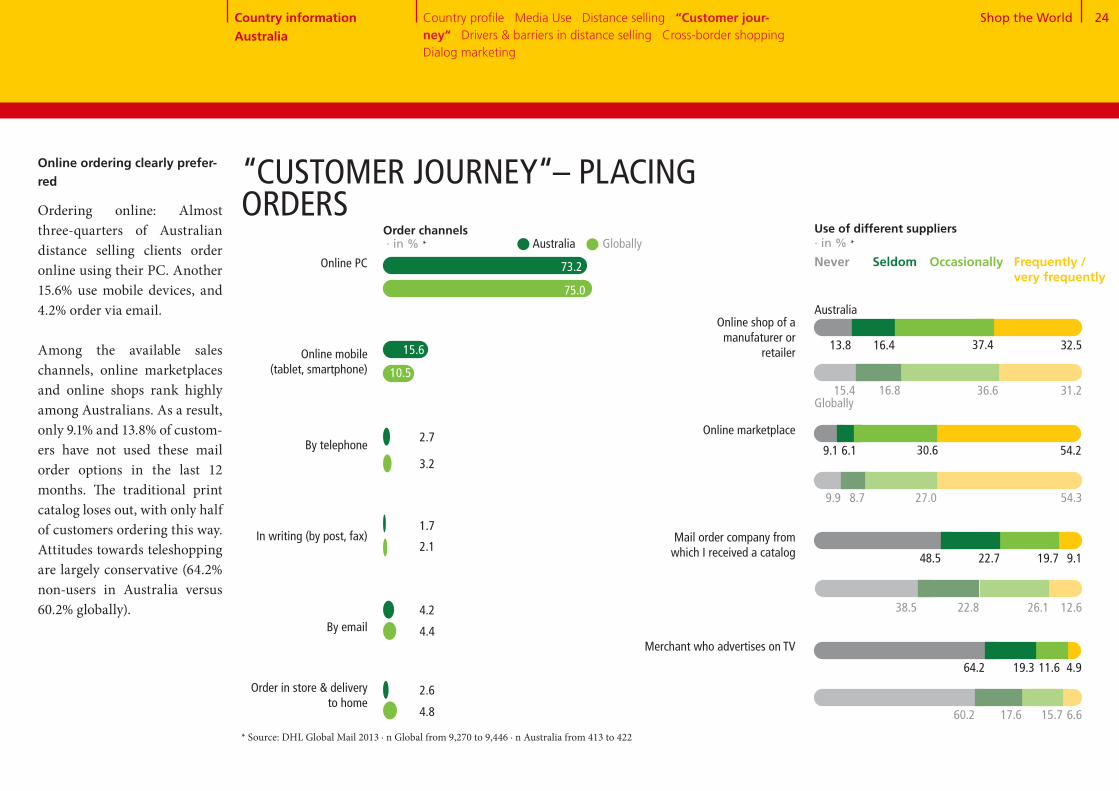
Online ordering clearly prefer-red
Ordering online: Almost three-quarters of Australian distance selling clients order online using their PC. Another 15.6% use mobile devices, and 4.2% order via email.
Among the available sales channels, online marketplaces and online shops rank highly among Australians. As a result, only 9.1% and 13.8% of custom-ers have not used these mail order options in the last 12 months. The traditional print catalog loses out, with only half of customers ordering this way. Attitudes towards teleshopping are largely conservative (64.2% non-users in Australia versus 60.2% globally).
13.8 32.516.4 37.4
Australia
9.1 54.26.1 30.6
48.5 9.122.7 19.7
64.2 4.919.3 11.6
15.6
10.5
2.6
4.8
Order channels · in % *
Country information Australia
Country profile · Media Use · Distance selling · “Customer jour-ney“ · Drivers & barriers in distance selling · Cross-border shopping · Dialog marketing
Online marketplace
Mail order company from which I received a catalog
Merchant who advertises on TV
Online shop of a manufaturer or
retailer
Globally
9.9 54.38.7 27.0
38.5 12.622.8 26.1
60.2 6.617.6 15.7
15.4 31.216.8 36.6
Shop the World 25
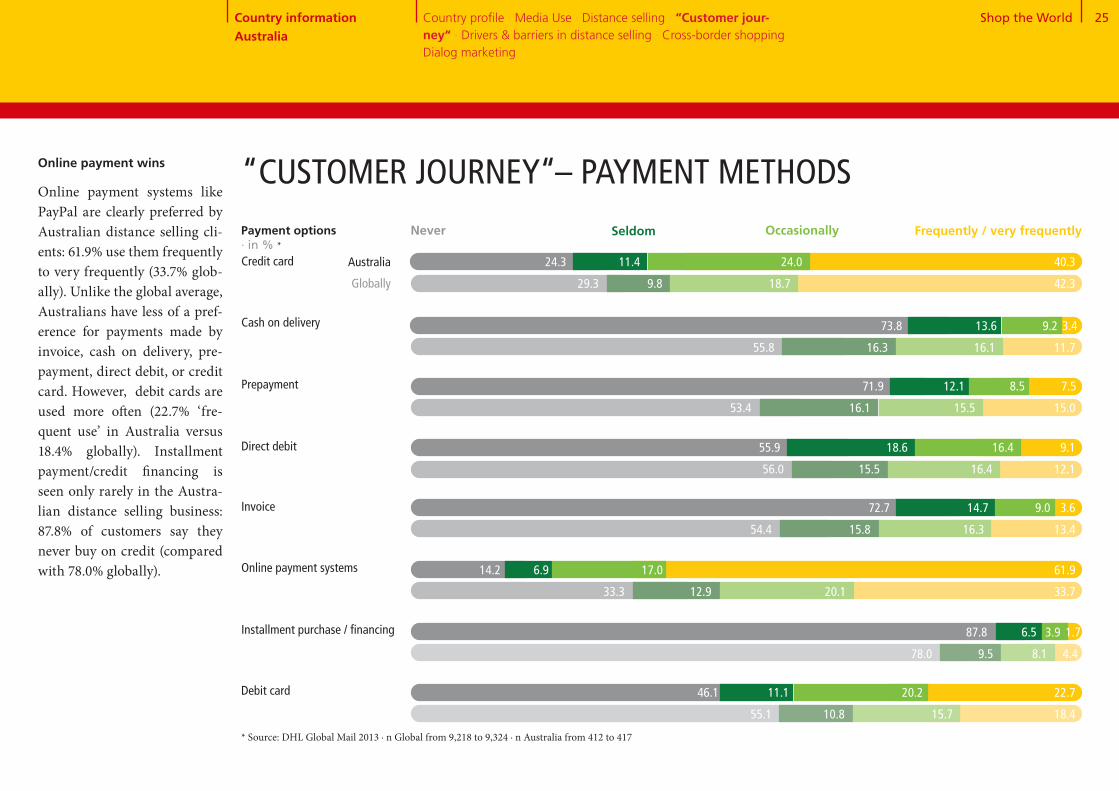
Online payment wins
Online payment systems like PayPal are clearly preferred by Australian distance selling cli-ents: 61.9% use them frequently to very frequently (33.7% glob- ally). Unlike the global average, Australians have less of a pref- erence for payments made by invoice, cash on delivery, pre-payment, direct debit, or credit card. However, debit cards are used more often (22.7% ‘fre-quent use’ in Australia versus 18.4% globally). Installment payment/credit financing is seen only rarely in the Austra-lian distance selling business: 87.8% of customers say they never buy on credit (compared with 78.0% globally).
Cash on delivery
Prepayment
Direct debit
Credit card
* Source: DHL Global Mail 2013 ∙ n Global from 9,218 to 9,324 ∙ n Australia from 412 to 417
“CUSTOMER JOURNEY“– PAYMENT METHODS
Online payment systems
Installment purchase / financing
Debit card
Invoice
Payment options · in % *
Never Seldom Frequently / very frequentlyOccasionally
Australia
Globally
24.3 11.4 24.0 40.3
29.3 9.8 18.7 42.3
73.8 13.6 9.2 3.4
55.8 16.3 16.1 11.7
71.9 12.1 8.5 7.5
53.4 16.1 15.5 15.0
55.9 18.6 16.4 9.1
56.0 15.5 16.4 12.1
72.7 14.7 9.0 3.6
54.4 15.8 16.3 13.4
14.2 6.9 17.0 61.9
33.3 12.9 20.1 33.7
87.8 6.5 3.9 1.7
78.0 9.5 8.1 4.4
46.1 11.1 20.2 22.7
55.1 10.8 15.7 18.4
Country information Australia
Country profile · Media Use · Distance selling · “Customer jour-ney“ · Drivers & barriers in distance selling · Cross-border shopping · Dialog marketing

Shop the World 26
Australia Globally
The option of selecting the shipping company The vendor only works with reliable delivery companies
Detailed information regarding de-livery period & delivery date when ordering
Fast delivery
Free delivery
Tracking information
Delivery to a retail store
Delivery to a parcel locker or drop box
Other collection points (supermar-ket, kiosk, gas station) 3.4
3.3
2.9
5.1
4.6
5.0
3.2
4.8
4.4
Max. accepted order time · Ø in days *
3.6
3.5
3.7
5.3
4.8
5.1
3.8
4.9
4.7
* Source: DHL Global Mail 2013 ∙ n Global from 10,270 to 10,462 ∙ n Australia from 454 to 471 ** scale from 1 "absolutely not important“ to 6 "very important“
Speed is relative
Given Australia’s geography, speed is relative – as can be measured against customers’ delivery expectations. In some areas, it may take up to two days longer for a parcel to ar-rive. Expectations regarding transport are generally slightly lower compared with the global standard.
“CUSTOMER JOURNEY“ – DELIVERY
1 2 3 4 5 6
Requirements for delivery · Ø *,**
Country information Australia
Country profile · Media Use · Distance selling · “Customer jour-ney“ · Drivers & barriers in distance selling · Cross-border shopping · Dialog marketing
8.7
6.5
Australia Globally

Shop the World 27
15+85Number of returns per capita per year · Ø * Australia Globally
0.8
0.4
Return rate · in % * Australia Globally
3.0
Reasons for returns * · Australia in %
Defective product 41.9
Percentage of users who returned goods · in % *
15.6
84.4
Australia Globally
Yes No
“CUSTOMER JOURNEY“– RETURNSReturns are not an issue
Only 15.6% of distance sellingclients in Australia return or-dered goods. This is more than 10 percentage points below the global average of 27.5%. Both the per capita returns (0.4 ver-sus 0.8 globally) and the return rate of 3% are significantly be-low the global average. The reasons for a return can differ greatly: Australian consumers do not hold back if a product is found to be defect (41.9% versus 32.3% globally). Far less often, an item is returned because it does not fit (24.5% versus 37.7%) or because several sizes were ordered to allow a better choice (6.1% versus 15.5%).
* Source: DHL Global Mail 2013 ∙ n Global from 2,648 to 9,325 ∙ n Australia from 65 to 417
Differing product description
Delivery of the wrong product
Wrong product was ordered
Product did not fit
Ordered multiple variants to choose from
Delivery period too long
Found less expensive product
Deficient product quality
Product was not liked
17.3
15.6
24.5
16.9
6.1
6.5
5.9
Globally
32.3
30.0
17.8
13.3
8.5
37.7
29.9
15.5
5.8
3.9
21.7
4.5
Country information Australia
Country profile · Media Use · Distance selling · “Customer jour-ney“ · Drivers & barriers in distance selling · Cross-border shopping · Dialog marketing
5.9
72+28 27.5
72.5
Shop the World 28
High delivery costs
Uncertain delivery
Concern about misuse of payment data
No demand because all products are obtainable locally
Long delivery periods
Unknown product quality
No try-on possible before purchase
Complicated return of the products
No personal advice
No personal contact person for problems
Doubts regarding data protection or the dissemination of data to third parties
Concern about counterfeited products, product piracy
DRIVERS & BARRIERS IN DISTANCE SELLING
Product can only be obtained via distance selling
Easy price comparison
Shopping 24/7
Location-independent ordering
Higher product quality
Lower prices
Greater selection
Option to deliver to a preferred location
Barriers · Australia in % *
50.8
54.6
72.6
63.5
7.8
59.1
46.0
67.3
72.3
46.4
67.4
Globally
36.6
24.2
34.4
3.9
25.8
48.5
64.9
44.1
21.5
22.0
29.8
34.1
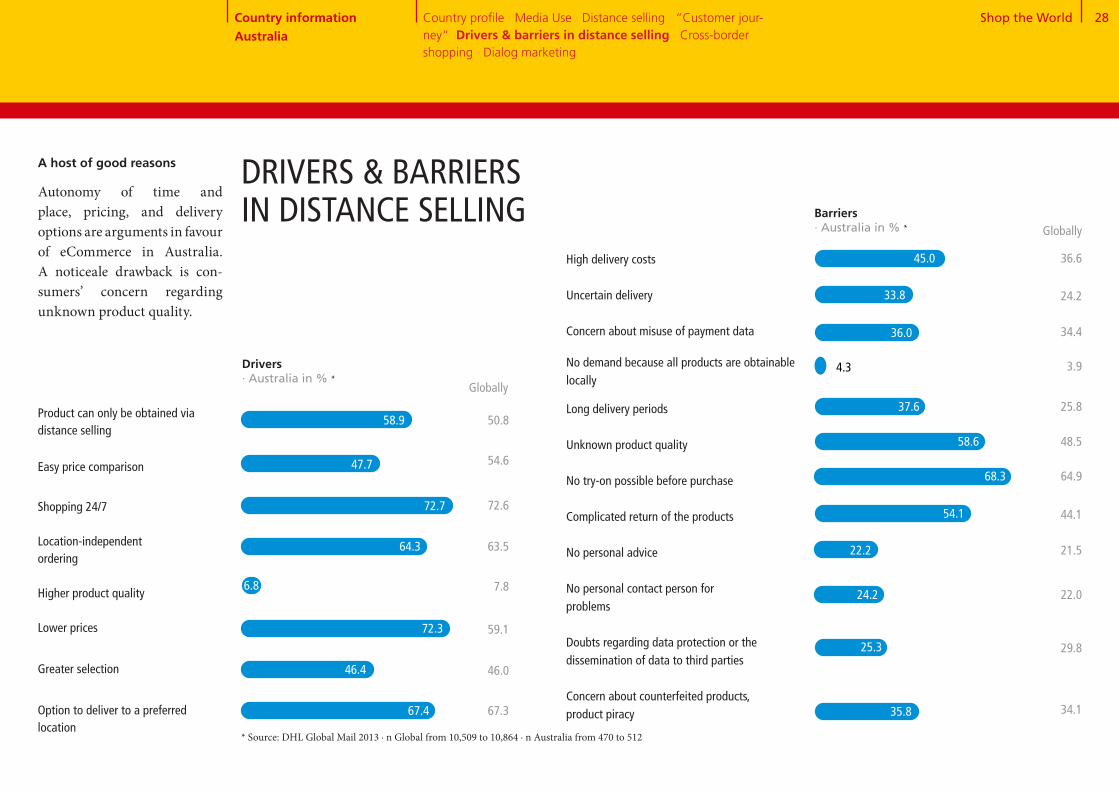
A host of good reasons
Autonomy of time and place, pricing, and delivery options are arguments in favour of eCommerce in Australia. A noticeale drawback is con- sumers’ concern regarding unknown product quality.
Drivers · Australia in % *
Globally
* Source: DHL Global Mail 2013 ∙ n Global from 10,509 to 10,864 ∙ n Australia from 470 to 512
58.9
47.7
72.7
64.3
6.8
45.0
33.8
36.0
4.3
37.6
58.6
68.3
54.1
22.2
24.2
25.3
35.8
Country information Australia
Country profile · Media Use · Distance selling · “Customer jour-ney“· Drivers & barriers in distance selling · Cross-border shopping · Dialog marketing
Shop the World 29
80+9+11
CROSS-BORDER SHOPPING – OVERVIEW
Previous orders abroad
Previous and future orders abroad by country · in % *
China[43.9]
Other Asian countries[17.4]
1
2
3
4
5
USA[77.4]
Great Britain[58.0]
Hong Kong[45.0]
Future orders abroad
Australia
* Source: DHL Global Mail 2013 ∙ n Global from 4,738 to 8,807 ∙ n Australia from 359 to 438 ** split into "further orders planned“ 78% Australia and "no further orders planned“ 2.1% Australia
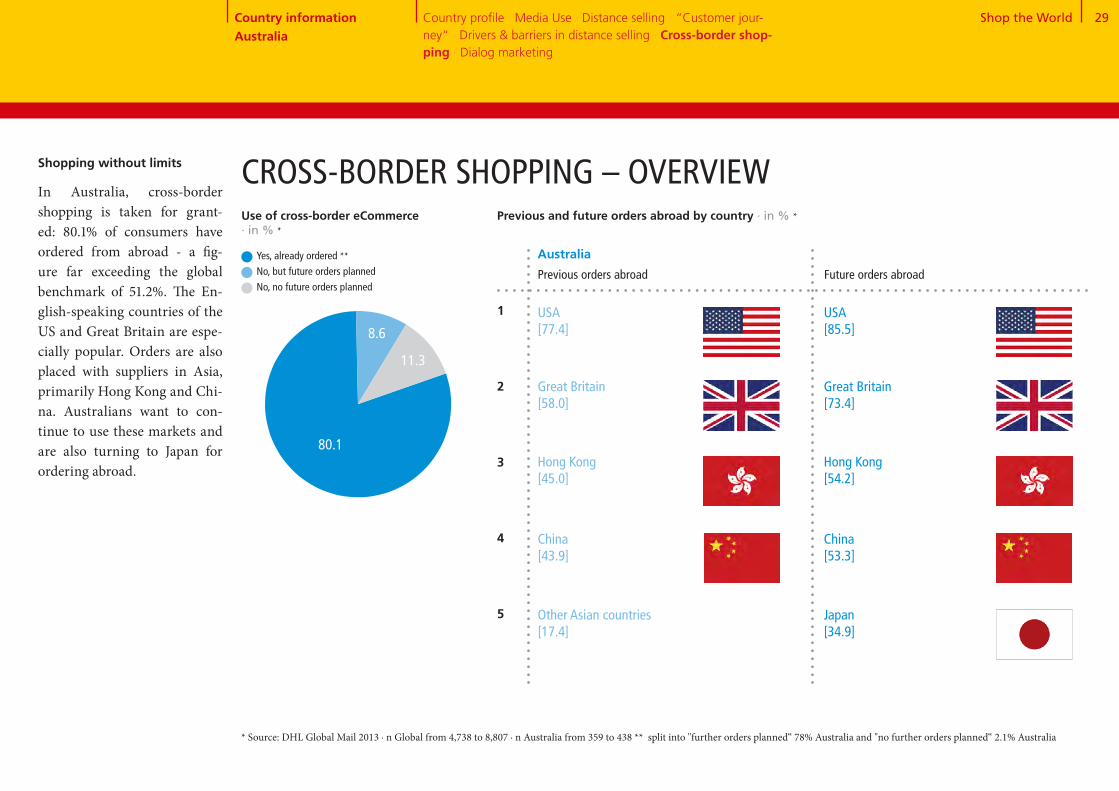
Shopping without limits
In Australia, cross-border shopping is taken for grant-ed: 80.1% of consumers have ordered from abroad - a fig-ure far exceeding the global benchmark of 51.2%. The En- glish-speaking countries of the US and Great Britain are espe-cially popular. Orders are also placed with suppliers in Asia, primarily Hong Kong and Chi-na. Australians want to con-tinue to use these markets and are also turning to Japan for ordering abroad.
China[53.3]
Japan[34.9]
USA[85.5]
Great Britain[73.4]
Hong Kong[54.2]
Country information Australia
Country profile · Media Use · Distance selling · “Customer jour-ney“ · Drivers & barriers in distance selling · Cross-border shop-ping · Dialog marketing
Use of cross-border eCommerce · in % *
Yes, already ordered **No, but future orders planned No, no future orders planned
8.6
80.1
11.3

Shop the World 30
Products not obtainable domestically
Higher quality of the products
Lower prices
Greater selection
Assurance against product counter-
feiting
Drivers for ordering abroad · Australia in % *
Barriers to ordering abroad · Australia in % *
High delivery costs Language problems
Customs clearance
Non-transparent costs
Uncertainty with problems
No demand because all products are obtainable locally
Long delivery times
Unknown product quality
Complicated return process
Concerns regarding data protection Fear of fraud Uncertain delivery
Concern about misuse of payment data
Uncertainty regarding warranty terms, payment process, legal situation, etc.
Globally
73.3
24.2
62.9
41.2
11.7
Globally
53.7
31.6
41.3
41.3
33.3
12.5
56.1
35.7
50.8
24.5
41.6
39.5
31.6
39.3
Price-driven purchase
When compared with the glob-al trend, the main driver for or-dering abroad is a lower price. In contrast, product quality (13.4% versus 24.2% globally) plays only a subordinate role. Lack of product availability on the domestic market and grea-ter selection are also key fac-tors.
CROSS-BORDER SHOPPING – DRIVERS & BARRIERS
* Source: DHL Global Mail 2013 ∙ n Global from 7,289 to 10,689 ∙ n Australia from 410 to 495
51.8
21.6
22.3
27.7
32.8
8.6
65.1
50.5
48.5
24.4
45.8
43.3
36.1
42.0
76.7
13.4
80.9
55.6
3.5
Country information Australia
Country profile · Media Use · Distance selling · “Customer jour-ney“ · Drivers & barriers in distance selling · Cross-border shop-ping · Dialog marketing

Shop the World 31
Receipt of mailings and catalogs · Australia in % *
5 and 63 and 41 and 2
DIALOG MARKETING
Reading mailings and catalogs
· in % *,**
Australia
Globally
22.4 30.4 47.3
22.1 35.2 42.7
5 and 63 and 41 and 2
Response to mailings and catalogs
· in % *,**
Australia
Globally
28.1 49.1 22.8
29.0 45.8 25.3
Response channel for mailings and catalogs · Australia in % * Globally
Website visits
Visits to stores or
branch offices
Other online
response (e.g. chat,
Twitter, Facebook,
newsletter
registration, etc.)
Phone call
Business reply card
67.7 73.4
48.6
30.0
24.5
18.4
12.6
*Source: DHL Global Mail 2013 ∙ n Global from 8,788 to 11,265 ∙ n Australia from 393 to 522 ** scale from 1 "never“ to 6 "almost always“
Dialog marketing popular
Dialog marketing is widely used in Australia. At 42.6%, the number of people who receive one or more mailings and cat-alogs per week, is considerably higher than the global average of 26.9%. The approximately 11.2% of the online population that do not receive mailings is within the global average. Also, mailing recipients look forward to receiving these mails: At 47.3%, frequency in reading di-alog marketing mails is almost 5 percentage points higher than the global average. In contrast, recipients are less enthusiastic when it comes to responding via the established channels (e.g. via suppliers’ websites). They do, however, tend to go directly to an advertiser’s out-let or store (68.9% versus 48.6% globally).
Globally
One or more times per week
One or more times per month
Less than once per month
Never
26.9
33.7
27.7
11.6 68.9
19.3
16.0
17.5
6.4
42.6
24.7
21.5
11.2
Country information Australia
Country profile · Media Use · Distance selling · “Customer jour-ney“ · Drivers & barriers in distance selling · Cross-border shop-ping · Dialog marketing
Country InformationAustria
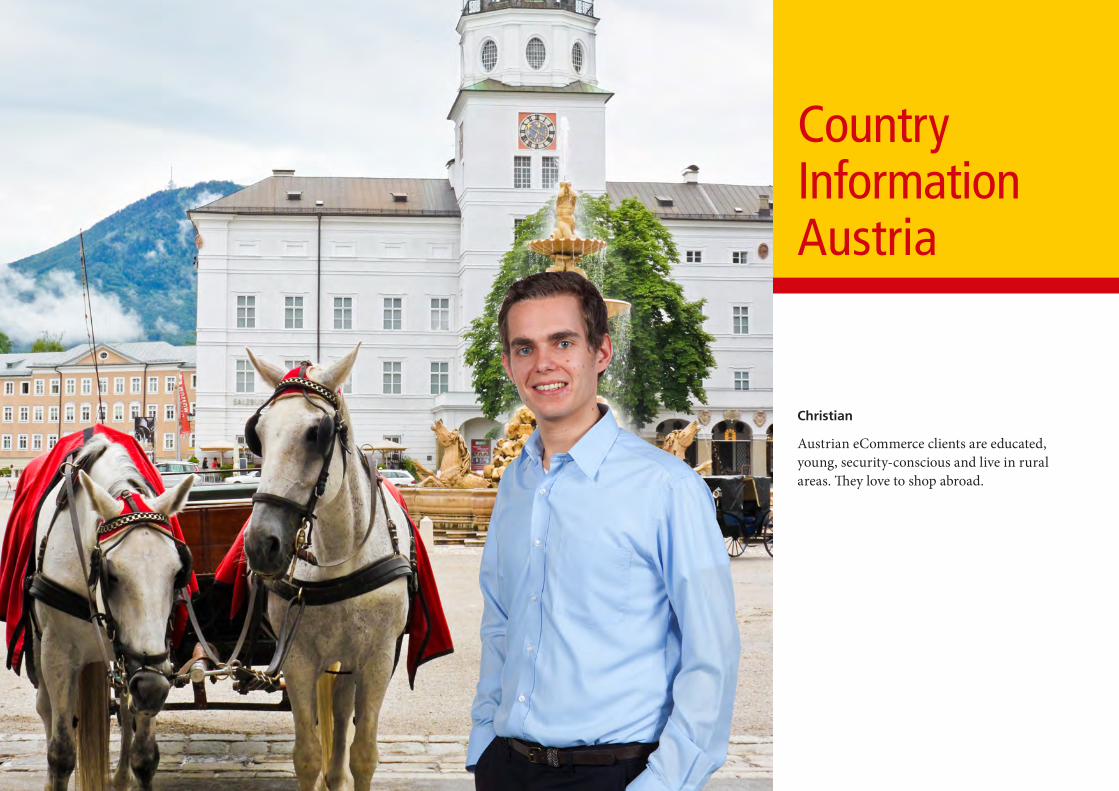
Christian
Austrian eCommerce clients are educated, young, security-conscious and live in rural areas. They love to shop abroad.
Shop the World 33
The Austrian economy *
* Source: Fischer World Almanac 2014, Germany Trade & Invest ** Source: Metropolitan areas with 1 million inhabitants and more; United Nations, Department of Economic and Social Affairs, Po-pulation Division (2012). World Urbanization Prospects: The 2011 Revision, CD-ROM Edition. *** Source: Copyright © IHS, 2013. All rights reserved **** Source: Copyright © IHS, 2013. All rights reserved
Country information Austria Country profile · Media Use · Distance selling · “Customer jour-ney“ · Drivers & barriers in distance selling · Cross-border selling · Dialog marketing
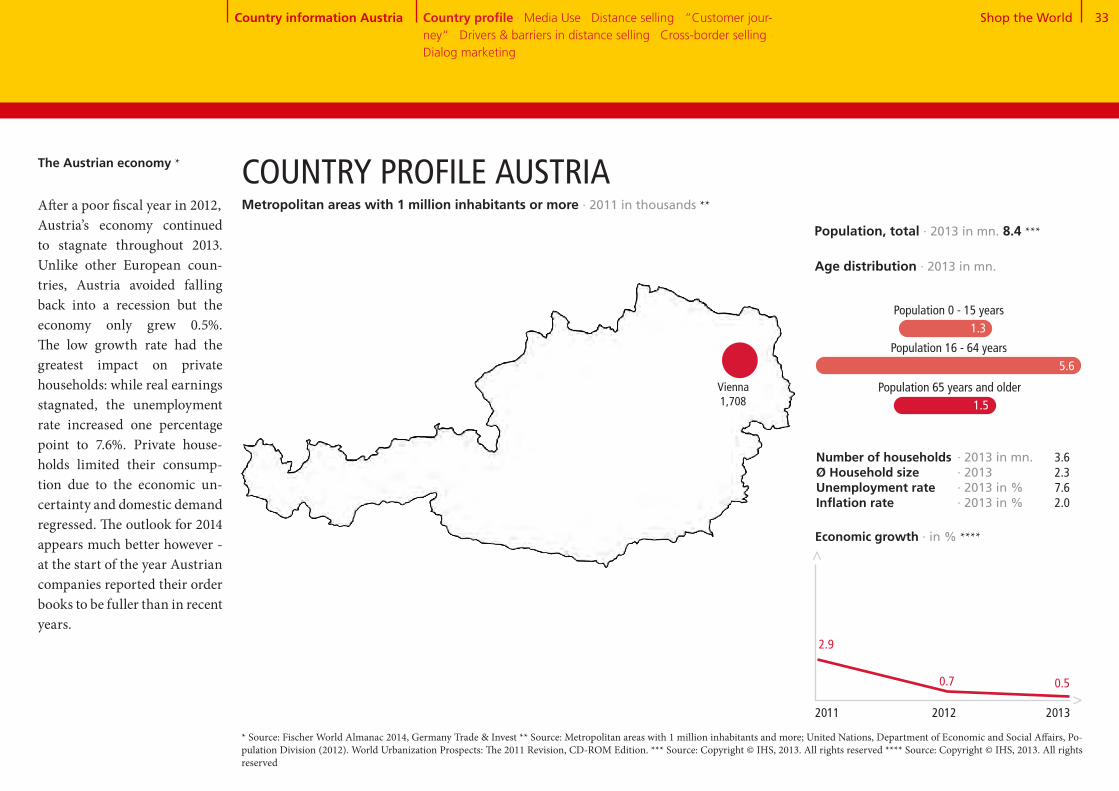
After a poor fiscal year in 2012,Austria’s economy continued to stagnate throughout 2013. Unlike other European coun-tries, Austria avoided falling back into a recession but the economy only grew 0.5%. The low growth rate had the greatest impact on private households: while real earnings stagnated, the unemployment rate increased one percentage point to 7.6%. Private house-holds limited their consump-tion due to the economic un-certainty and domestic demand regressed. The outlook for 2014 appears much better however - at the start of the year Austrian companies reported their order books to be fuller than in recent years.
1.3Population 0 - 15 years
COUNTRY PROFILE AUSTRIA
Number of households Ø Household sizeUnemployment rateInflation rate
0.7
Economic growth · in % ****
>
>
0.5
2.9
2011 2012 2013
Age distribution · 2013 in mn.
Population 65 years and older
Population, total · 2013 in mn. 8.4 ***
Population 16 - 64 years
· 2013 in mn.· 2013· 2013 in %· 2013 in %
3.6 2.37.62.0
5.6
1.5
Metropolitan areas with 1 million inhabitants or more · 2011 in thousands **
Vienna1,708

Shop the World 34
23+6+1+7+14+37+12MEDIA USE IN AUSTRIA
25.2
161.2
Smartphone market penetration · in % ***** Representative domestic population 16+, n = 1,000
35.9
Internet users · 2012 per 100 people **
Permanent access to broadband internet · 2012 per100 people ***
Cellphones · 2012 per 100 people ****
2012 2013
48.0
Share of adspend by medium · in % *
TV Radio Movies Outdoor advertising
Total advertising expenditure · in EUR bn. *
Internet Newspapers Magazines
>>
* Source: Zenith Optimedia, 2013 ** Source: Copyright © IHS, 2013. All rights reserved *** Source: The World Bank **** Source: Copyright © IHS, 2013. All rights reserved **** Source: Our Mobile Planet: Google Global Smart phone Study 2013, http://www.thinkwithgoogle.com/mobileplanet/
2011 2012 2013 2014 2015
3.4
81.0
3.3
3.3
3.3
3.3
2016
3.5
Country information Austria Country profile · Media Use · Distance selling · “Customer jour-ney“ · Drivers & barriers in distance selling · Cross-border selling · Dialog marketing
14.4
36.9
12.2
6.5
0.4
5.6
24.0
Internet use
The extent to which the popu-lation uses the internet is an indicator of how important it is. 81% of all Austrians had in-ternet access in 2012, while 25% had a permanent broadband connection. The future of in-ternet growth is going mobile. According to experts, "on de-mand" TV, videos and films are the greatest drivers.
In the land of newspapers and magazines
Printed advertising has an high share in Austria‘s media mix, while internet expen ditures are below the European average. Currently, the total advertising market is growing slightly at a rate of 1.2%.

Shop the World 35
Apparel and footwear
Consumer electronics,
computers + equipment
Media products (books, CDs,
DVDs, etc.)
Housewares and home furni-
shings + textiles
Food + beverages
Household and consumer
appliances
Beauty and personal care
DIY and gardening
OTC drugs and dietary supple-
ments
Traditional toys and games
House cleaning (detergent,
chastener, etc.)
Fashion and media products
Clothing and media products are bestsellers in Austria, fol-lowed by consumer electron- ics. Compared to the global average, toys are ordered more frequently, while cosmetics are less popular.
DISTANCE SELLING IN AUSTRIA
785.1
Distance selling purchases in 2013 - trend for 2018 · in EUR mn. * 2013 2018
375.4
1112.7
617.2
173.0
149.3
189.3
105.9
141.4
71.0
67.3
48.7
44.3
86.5
43.8
10.3
Development of distance selling and share of total retail 2011 - 2018 · in EUR bn. *
CAGR: 4.8%
Home shopping
Online shopping1.8 2.2 2.6
0.6
0.6
0.6
2.9 3.5
0.6
0.5
2011 2012 2013e 2014e 2018e
Share of total retail · in % 4.7 5.1 5.8 6.3 7.2
* Source: Euromonitor International
722.7
8.3
Country information Austria Country profile · Media Use · Distance selling · “Customer jour-ney“ · Drivers & barriers in distance selling · Cross-border selling · Dialog marketing
151.0
61.3
49.5
366.0

Shop the World 36
84+16
90+10
Top usage rates
In Austria, distance selling purchases are very common. Almost 90% are users and al-most three quarters of the non-users want to become involvedin the future.
Use of distance selling · in % *
89.8
10.2
Austria
Globally
83.5
16.5
Number of orders in the previous year · in % *
1 to 5 orders
6 to 10 orders
11 to 20 orders
No orders
21.4
39.0
17.5
10.2
11.9
20.5
35.9
15.2
16.5
12.0
Future ordering behavior (current users) · in % *
More frequently than in the last
12 months
Just as frequently as in the last
12 months
Less frequently than in the last
12 months
68.0
24.4
55.2
38.8
7.6 6.1
Non-users of distance selling - future plans · in % *
Yes73.5
Austria
Globally
Yes70.5
No26.5
No29.5
Yes No
Globally Austria Globally
DISTANCE SELLING IN AUSTRIA
* Source: DHL Global Mail 2013 ∙ n Global from 1,275 to 11,265 ∙ n Austria from 34 to 510
Country information Austria Country profile · Media Use · Distance selling · “Customer jour-ney“ · Drivers & barriers in distance selling · Cross-border selling · Dialog marketing
Austria
More than 20 orders
Shop the World 37
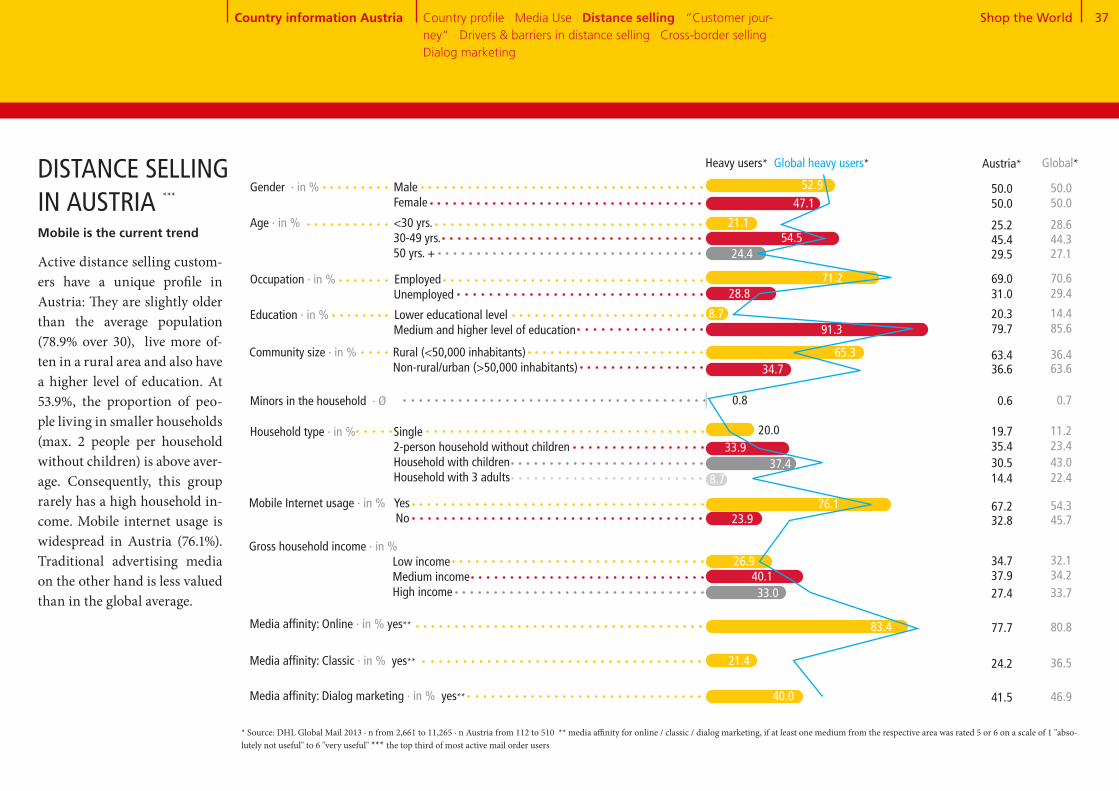
Mobile is the current trend
Active distance selling custom-ers have a unique profile in Austria: They are slightly older than the average population (78.9% over 30), live more of-ten in a rural area and also have a higher level of education. At 53.9%, the proportion of peo-ple living in smaller households (max. 2 people per household without children) is above aver-age. Consequently, this group rarely has a high household in-come. Mobile internet usage is widespread in Austria (76.1%). Traditional advertising media on the other hand is less valued than in the global average.
DISTANCE SELLING IN AUSTRIA
* Source: DHL Global Mail 2013 ∙ n from 2,661 to 11,265 ∙ n Austria from 112 to 510 ** media affinity for online / classic / dialog marketing, if at least one medium from the respective area was rated 5 or 6 on a scale of 1 "abso-lutely not useful" to 6 "very useful" *** the top third of most active mail order users
Country information Austria Country profile · Media Use · Distance selling · “Customer jour-ney“ · Drivers & barriers in distance selling · Cross-border selling · Dialog marketing
***
Global*
54.5
Gender · in % Male Female
Age · in % <30 yrs. 30-49 yrs. 50 yrs. +
Occupation · in % Employed Unemployed
Education · in % Lower educational level Medium and higher level of education
8.7
Media affinity: Online · in % yes**
Community size · in % Rural (<50,000 inhabitants) Non-rural/urban (>50,000 inhabitants)
Minors in the household · Ø
Household type · in % Single 2-person household without children Household with children Household with 3 adults
Mobile Internet usage · in % Yes No
Gross household income · in % Low income Medium income High income
Media affinity: Classic · in % yes**
Media affinity: Dialog marketing · in % yes** 40.0
21.4
83.4
33.040.1
26.9
23.976.1
8.737.4
47.1
21.1
52.9
28.8
91.3
34.7
0.8
33.920.0
71.2
44.327.1
14.4
36.4
46.9
36.5
80.8
33.734.232.1
45.754.3
22.443.0
50.0
28.6
50.0
29.4
85.6
63.6
0.7
23.411.2
70.6
Austria*
45.429.5
20.3
63.4
41.5
24.2
77.7
27.437.934.7
32.867.2
14.430.5
50.0
25.2
50.0
31.0
79.7
36.6
0.6
35.419.7
69.0
24.4
65.3
Heavy users* Global heavy users*

Shop the World 38
Search engines
Customer ratings in blogs or forums
Product test ratings / expert test reports
Product check in a retail store
Retailer or manufacturer website
Online marketplace
Catalog
Mail advertising
Social media platforms such as Facebook and Twitter
Apps (on smartphone, iPad, or tablet)
Recommendations from friends, acquaintances, and colleagues
Customer ratings on the supplier’s website
Price comparison sites
Large selection of products
Recommendation and experiences of friends, acquaintances, and colleagues
Official test seals, reviews, and test reports of independent institutions
Attractive product line
Favorable prices, promotions, & special offers
Straightforward return process
Free returns
Choice of preferred payment methods
Fast delivery
Free delivery
Good customer service
Positive customer ratings on the internet
Criteria for choosing a vendor · Austria in % *
“CUSTOMER JOURNEY“ – SEARCHING FOR PRODUCT INFORMATIONSearch for product information · Austria in % * Globally
33.4 35.5
53.2
27.3 23.4
44.9 44.2
22.7 23.9
48.5 45.8
50.3 42.5
23.8 25.1
17.7 15.1
9.6 15.1
5.8 9.7
35.4 37.8
Globally
54.4
48.9 40.6
7.0 13.7
20.7
9.6 8.8
22.8 26.6
15.0 14.9
46.0 51.7
19.2 12.9
36.2 20.8
31.5 22.6
23.1 25.7
42.5 45.2
14.7 18.5
23.1
Customer reviews are important
In Austria, customer reviews posted on retailer websites are extremely important when searching for information. Free returns are particularly rele-vant when selecting a product.
* Source: DHL Global Mail 2013 ∙ n Global from 9,386 to 10,617 ∙ n Austria from 453 to 489, multiple mentioning
Country information Austria Country profile · Media Use · Distance selling · “Customer jour-ney“ · Drivers & barriers in distance selling · Cross-border selling · Dialog marketing

Shop the World 39
* Source: DHL Global Mail 2013 ∙ n Global from 10,218 to 10,384 ∙ n Austria from 468 to 484 ** scale from 1 "absolutely not useful" to 6 "very useful“
Price checks are convincing
Distance selling clients in Aus-tria generally make purchasing decisions based on informationavailable online, mainly price comparison portals (59.4%) and search engines (57.6%). “Tradi-tional” catalogs from retailers continue to generate a great deal of interest, however.
ACCEPTANCE OF ADVERTISING MEDIA
Country information Austria Country profile · Media Use · Distance selling · “Customer jour-ney“ · Drivers & barriers in distance selling · Cross-border selling · Dialog marketing
Usefulness of advertising media · in % *, **
5 and 63 and 41 and 2
Ø43.640.8 15.6
26.1 43.8 30.1
Online advertisingAustriaGlobally
Television advertising
5 and 63 and 41 and 2
3.03.6
Ø
40.144.9 15.030.6 41.8 27.6
2.93.4
41.844.3 13.938.7 40.4 20.9Social media
Austria Globally
Advertising letters
2.93.1
33.155.4 11.633.9 37.6 28.5
2.53.4
Product suggestions in online shops
50.326.9 22.818.9 45.1 36.0
3.43.9
33.29.2 57.66.5 28.7 64.8
4.64.8
30.99.7 59.49.1 31.7 59.1
4.64.6
50.130.3 19.629.9 43.9 26.2
AustriaGlobally
Household advertising
3.33.4
46.037.3 16.729.0 46.7 24.3
AustriaGlobally
Advertisements in mag- azines and periodicals
3.13.4
43.041.9 15.134.8 43.1 22.1
AustriaGlobally
Advertisements in newspapers
3.03.2
36.654.9 8.541.8 40.7 17.6
AustriaGlobally
Billboard advertise-ments
2.53.0
36.055.7 8.444.3 38.8 16.9
AustriaGlobally
Radio
2.52.9
42.920.9 36.219.3 44.2 36.6
AustriaGlobally
Catalogs from vendors
3.93.9
AustriaGlobally
Globally
Globally
Internet search engines
Globally
Price comparison sites
Globally
Austria
Austria
Austria
Austria

Shop the World 40
Online PC
Online mobile (tablet, smartphone)
By telephone
In writing (by post, fax)
By email
Order in store & delivery to home
Online marketplace
Mail order company from which I received a catalog
Merchant who advertises on TV
Online shop of a manufaturer or
retailer
Use of different suppliers · in % *Never Seldom Frequently /
very frequentlyOccasionally
* Source: DHL Global Mail 2013 ∙ n Global from 9,270 to 9,446 ∙ n Austria from 451 to 457
Austria Global
79.9
2.7
2.6
6.2
75.0
3.2
2.1
4.4
“CUSTOMER JOURNEY“– PLACING ORDERS
Online wins
Austrian distance selling cli-ents like to place orders online via PC (79.9% vs. 75% globally), whe reas other ordering meth-ods are barely used.Online market places are the most popular way of order- ing products. They are used frequently to very frequent-ly by 56,4% of Austrian dis- tance selling cli ents. However, dispatchers who advertise their products on te levision struggle in Austria. 82,1% claim never to have used a TV shopping chan-nel.
15.2 28.321.3
15.4 31.216.8
35.2
36.6
Austria
Globally
10.7 56.46.6
9.9 54.38.7
26.4
27.0
30.2 17.223.8
38.5 12.622.8
28.7
26.1
82.1 1.811.7
60.2 6.617.6
4.4
15.7
7.0
10.5
1.6
4.8
Order channels · in % *
Country information Austria Country profile · Media Use · Distance selling · “Customer jour-ney“ · Drivers & barriers in distance selling · Cross-border selling · Dialog marketing

Shop the World 41
Playing it safe
Austrian distance selling cli-ents prefer to pay for goods only after receiving them: 36.1% use this payment method often (vs. 13.4% globally). In the interna-tional comparison, the high af-finity for paying by direct debit is significant. Credit cards andonline payment systems on the other hand are used less fre-quently in the global compari-son. Cash on delivery, install-ment purchases/financing and debit cards play a minor role.
Cash on delivery
Prepayment
Direct debit
Credit card
* Source: DHL Global Mail 2013 ∙ n Global from 9,218 to 9,324 ∙ n Austria from 451 to 455
“CUSTOMER JOURNEY“– PAYMENT METHODS
Online payment systems
Installment purchase / financing
Debit card
Invoice
Payment options · in % * Never Seldom Frequently / very frequentlyOccasionally
Austria
Globally
36.2 11.9 19.1 32.8
29.3 9.8 18.7 42.3
69.7 17.3 7.9 5.1
55.8 16.3 16.1 11.7
54.1 23.4 15.1 7.5
53.4 16.1 15.5 15.0
45.6 17.6 16.3 20.5
56.0 15.5 16.4 12.1
23.5 18.0 22.4 36.1
54.4 15.8 16.3 13.4
46.0 14.1 18.7 21.3
33.3 12.9 20.1 33.7
87.4 5.5 4.6 2.4
78.0 9.5 8.1 4.4
94.9 2.5 1.51.1
55.1 10.8 15.7 18.4
Country information Austria Country profile · Media Use · Distance selling · “Customer jour-ney“ · Drivers & barriers in distance selling · Cross-border selling · Dialog marketing

Shop the World 42
The option of selecting the shipping company The vendor only works with reliable delivery companies
Detailed information regarding de-livery period & delivery date when ordering
Fast delivery
Free delivery
Tracking information
Delivery to a retail store
Delivery to a parcel locker or drop box
Other collection points (supermar-ket, kiosk, gas station)
Austria Globally
2.7
2.4
2.9
5.1
4.3
4.7
3.2
4.7
4.6
Max. accepted order time · Ø in days *
3.6
3.5
3.7
5.3
4.8
5.1
3.8
4.9
4.7
* Source: DHL Global Mail 2013 ∙ n Global from 10,270 to 10,462 ∙ n Austria from 473 to 488 ** scale from 1 "absolutely not important“ to 6 "very important“
Rather undemanding
While the expectations for delivery times are close to the global average (almost 7 days), Austrians are relatively un- demanding regarding other delivery requirements.
“CUSTOMER JOURNEY“ – DELIVERY
1 2 3 4 5 6
Requirements for delivery · Ø *,**
Country information Austria Country profile · Media Use · Distance selling · “Customer jour-ney“ · Drivers & barriers in distance selling · Cross-border selling · Dialog marketing
6.8
6.5
Austria Globally

Shop the World 43
47+5327+73+Number of returns per capita per year · Ø * Austria Globally
0.8
1.8
Return rate · in % * Austria Globally
5.9
13.4
Reasons for returns · Austria in % *
Defective product 30.1
Percentage of users who returned goods · in % *
46.853.2
Austria Globally
“CUSTOMER JOURNEY“ – RETURNSFrequent returns
People living in German- speaking countries often have the possibility of returning goods free of charge, and this option is used extensively in Austria. Almost one out of every two clients has returned a product over the last 12 months. Austrian mail order clients tend to return goods if the product did not meet their requirements or they were generally dissatisfied with it. Austrians also like to order a selection of product variants to choose from (32.5% vs. 15.5% globally).
27.5
72.5
* Source: DHL Global Mail 2013 ∙ n Global from 2,648 to 9,325 ∙ n Austria from 206 to 441
Differing product description
Delivery of the wrong product
Wrong product was ordered
Product did not fit
Ordered multiple variants to choose from
Delivery period too long
Found less expensive product
Deficient product quality
Product was not liked
13.1
12.1
62.2
43.4
32.5
5.8
2.9
Globally
32.3
30.0
17.8
13.3
8.5
37.7
29.9
15.5
5.8
3.9
33.1
6.8
Country information Austria Country profile · Media Use · Distance selling · “Customer jour-ney“ · Drivers & barriers in distance selling · Cross-border selling · Dialog marketing
Yes No

Shop the World 44
High delivery costs
Uncertain delivery
Concern about misuse of payment data
No demand because all products are obtainable locally
Long delivery times
Unknown product quality
No try-on possible before purchase
Complicated return process
No personal advice
No personal contact person for problems
Doubts regarding data protection or the dissemination of data to third parties
Concern about counterfeited products, product piracy
Product can only be obtained via distance selling
Easy price comparison
Shopping 24/7
Location-independent ordering
Higher product quality
Lower prices
Greater selection
Option to deliver to a preferred location
DRIVERS & BARRIERS IN DISTANCE SELLING
50.8
54.6
72.6
63.5
7.8
59.1
46.0
67.3
48.3
51.9
69.5
24/7 shopping world
In Austria, the around-the-clock nature of the distance sell- ing business is a decisive factor(79.8% vs. 72.6% globally). High delivery costs are a main purchasing barrier.
Drivers · Austria in % *
Globally
* Source: DHL Global Mail 2013 ∙ n Global from 10,509 to 10,864 ∙ n Austria from 460 to 488
52.1
63.9
79.8
63.6
2.5
45.7
11.3
38.0
3.7
14.9
41.2
61.6
30.7
34.0
18.3
31.8
22.8
Country information Austria Country profile · Media Use · Distance selling · “Customer jour-ney“ · Drivers & barriers in distance selling · Cross-border selling · Dialog marketing
Barriers · Austria in % * Globally
36.6
24.2
34.4
3.9
25.8
48.5
64.9
44.1
21.5
22.0
29.8
34.1
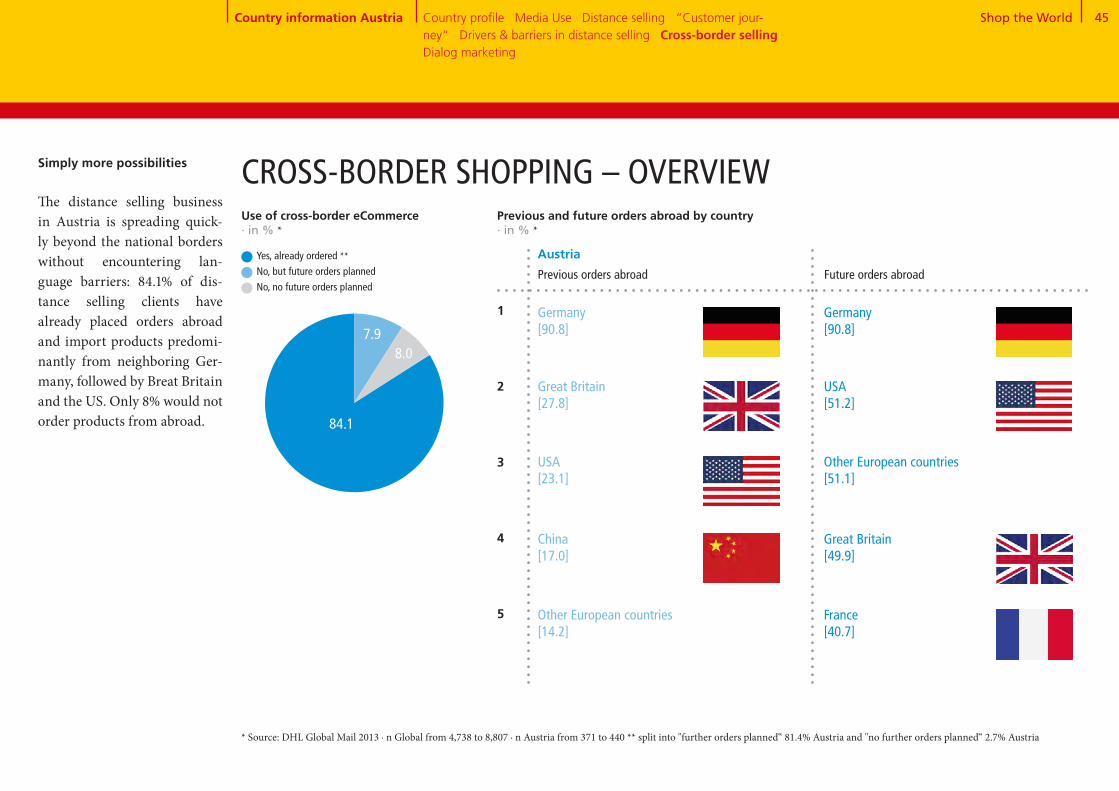
Shop the World 45
84+9+7
CROSS-BORDER SHOPPING – OVERVIEW
Previous orders abroad
Previous and future orders abroad by country · in % *
China[17.0]
Other European countries[14.2]
1
2
3
4
5
Germany[90.8]
Great Britain[27.8]
USA[23.1]
Future orders abroad
Austria
* Source: DHL Global Mail 2013 ∙ n Global from 4,738 to 8,807 ∙ n Austria from 371 to 440 ** split into "further orders planned“ 81.4% Austria and "no further orders planned“ 2.7% Austria
Simply more possibilities
The distance selling business in Austria is spreading quick-ly beyond the national borders without encountering lan- guage barriers: 84.1% of dis- tance selling clients have already placed orders abroad and import products predomi-nantly from neighboring Ger-many, followed by Breat Britain and the US. Only 8% would not order products from abroad.
Great Britain[49.9]
France[40.7]
Germany[90.8]
USA[51.2]
Other European countries[51.1]
Country information Austria Country profile · Media Use · Distance selling · “Customer jour-ney“ · Drivers & barriers in distance selling · Cross-border selling · Dialog marketing
Use of cross-border eCommerce · in % *
Yes, already ordered **No, but future orders planned No, no future orders planned
7.9
84.1
8.0

Shop the World 46
Products not obtainable domestically
Higher quality of the products
Lower prices
Greater selection
Assurance against product counter-
feiting
High delivery costs Language problems
Customs clearance
Non-transparent costs
Uncertainty with problems
No demand because all products are obtainable locally
Long delivery times
Unknown product quality
Complicated return process
Concerns regarding data protection Fear of fraud Uncertain delivery
Concern about misuse of payment data
Uncertainty regarding warranty terms, payment process, legal situation, etc.
Drivers for ordering abroad· Austria in % *
Barriers to ordering abroad · Austria in % *
Globally
73.3
24.2
62.9
41.2
11.7
Globally
53.7
31.6
41.3
41.3
33.3
12.5
56.1
35.7
50.8
24.5
41.6
39.5
31.6
39.3
Lack of choice at home
Austrians are placing more andmore orders abroad because of the greater product variety. High delivery costs and com-plicated return processes are seen as main obstacles.
CROSS-BORDER SHOPPING – DRIVERS & BARRIERS
* Source: DHL Global Mail 2013 ∙ n Global from 7,289 to 10,689 ∙ n Austria from 408 to 479
61.0
23.0
49.0
41.4
31.9
8.3
40.5
26.9
58.2
24.0
43.9
34.1
36.8
38.7
80.9
7.1
66.3
37.3
2.0
Country information Austria Country profile · Media Use · Distance selling · “Customer jour-ney“ · Drivers & barriers in distance selling · Cross-border selling · Dialog marketing
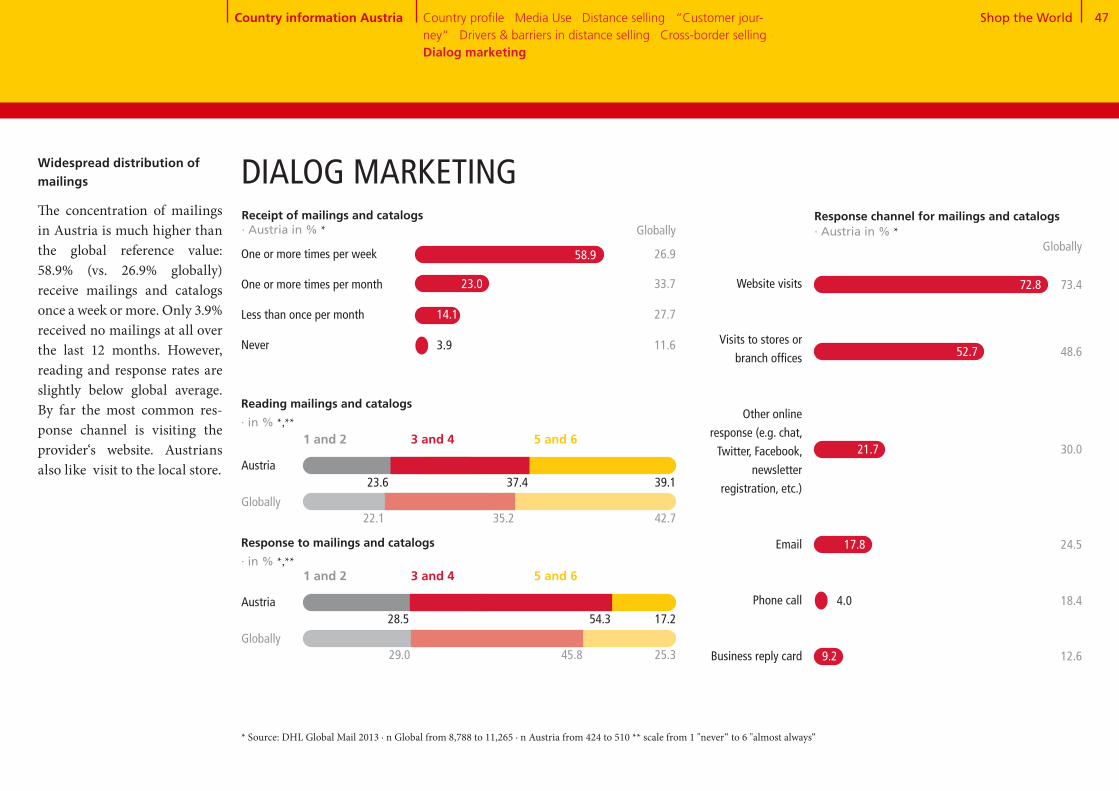
Shop the World 47
Receipt of mailings and catalogs · Austria in % *
5 and 63 and 41 and 2
DIALOG MARKETING
Reading mailings and catalogs · in % *,**
Austria
Globally
23.6 37.4 39.1
22.1 35.2 42.7
5 and 63 and 41 and 2
Response to mailings and catalogs · in % *,**
Austria
Globally
28.5 54.3 17.2
29.0 45.8 25.3
Response channel for mailings and catalogs · Austria in % * Globally
Website visits
Visits to stores or
branch offices
Other online
response (e.g. chat,
Twitter, Facebook,
newsletter
registration, etc.)
Phone call
Business reply card
72.8 73.4
48.6
30.0
24.5
18.4
12.6
* Source: DHL Global Mail 2013 ∙ n Global from 8,788 to 11,265 ∙ n Austria from 424 to 510 ** scale from 1 "never“ to 6 "almost always“
Widespread distribution ofmailings
The concentration of mailings in Austria is much higher than the global reference value: 58.9% (vs. 26.9% globally) receive mailings and catalogs once a week or more. Only 3.9%received no mailings at all over the last 12 months. However, reading and response rates are slightly below global average. By far the most common res-ponse channel is visiting the provider‘s website. Austrians also like visit to the local store.
Globally
One or more times per week
One or more times per month
Less than once per month
Never
26.9
33.7
27.7
11.6 52.7
21.7
17.8
4.0
9.2
58.9
23.0
14.1
3.9
Country information Austria Country profile · Media Use · Distance selling · “Customer jour-ney“ · Drivers & barriers in distance selling · Cross-border selling · Dialog marketing

Country InformationBrazil
Juliana, Camila, and Maiza
Brazil’s heavy users are young, urban, have high-incomes, are media savvy, price-conscious… and wild about consumer electronics.
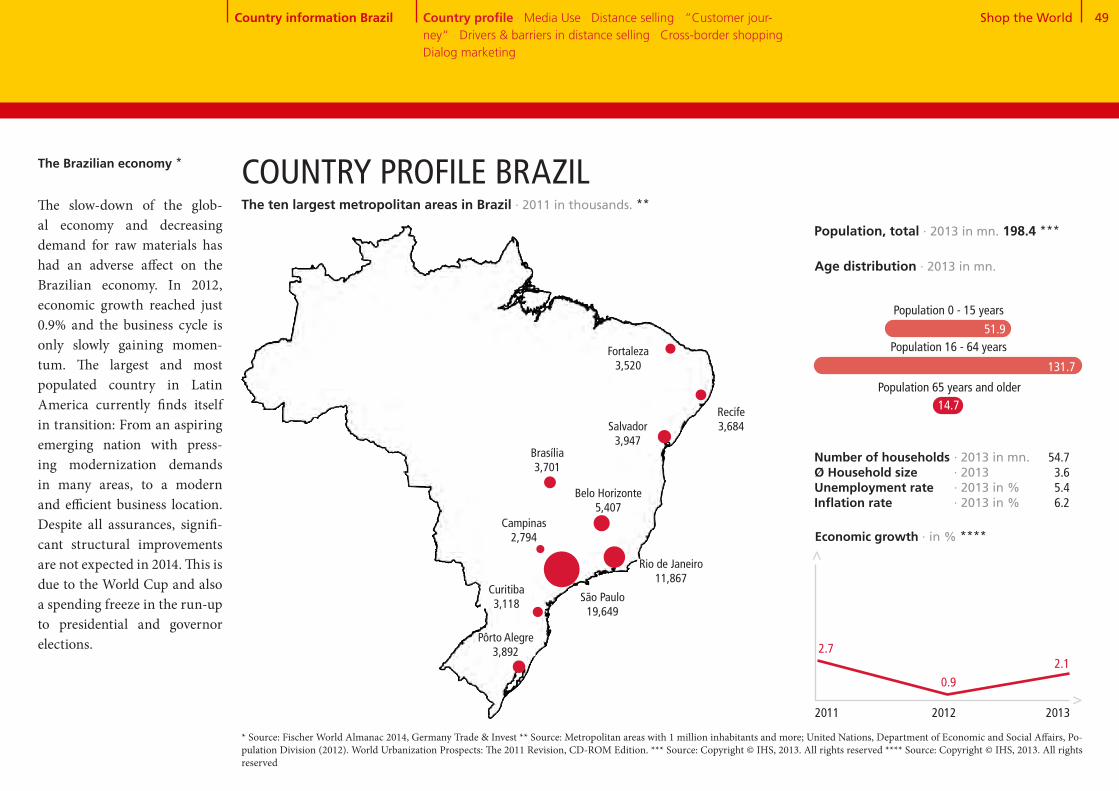
Shop the World 49
51.9
Population 0 - 15 years
The Brazilian economy * COUNTRY PROFILE BRAZIL
São Paulo 19,649
Rio de Janeiro11,867
* Source: Fischer World Almanac 2014, Germany Trade & Invest ** Source: Metropolitan areas with 1 million inhabitants and more; United Nations, Department of Economic and Social Affairs, Po-pulation Division (2012). World Urbanization Prospects: The 2011 Revision, CD-ROM Edition. *** Source: Copyright © IHS, 2013. All rights reserved **** Source: Copyright © IHS, 2013. All rights reserved
Number of households Ø Household sizeUnemployment rateInflation rate
0.9
Economic growth · in % ****
>
>
2.12.7
2011 2012 2013
Age distribution · 2013 in mn.
Population 65 years and older
Population, total · 2013 in mn. 198.4 ***
Country information Brazil Country profile · Media Use · Distance selling · “Customer jour-ney“ · Drivers & barriers in distance selling · Cross-border shopping · Dialog marketing
Population 16 - 64 years
· 2013 in mn.· 2013· 2013 in %· 2013 in %
54.7 3.65.46.2
The slow-down of the glob-al economy and decreasing demand for raw materials has had an adverse affect on the Brazilian economy. In 2012, economic growth reached just 0.9% and the business cycle is only slowly gaining momen-tum. The largest and most populated country in Latin America currently finds itself in transition: From an aspiring emerging nation with press-ing modernization demands in many areas, to a modern and efficient business location. Despite all assurances, signifi-cant structural improvements are not expected in 2014. This is due to the World Cup and also a spending freeze in the run-up to presidential and governor elections.
131.7
14.7
Belo Horizonte5,407
Salvador3,947
Pôrto Alegre3,892
Brasília 3,701
Fortaleza3,520
Recife3,684
Curitiba 3,118
Campinas 2,794
The ten largest metropolitan areas in Brazil · 2011 in thousands. **

Shop the World 50
71+4+1+4+5+10+5MEDIA USE IN BRAZIL
9.2
125.2
Smartphone market penetration · in % *****Representative domestic population 16+, n = 1,000
13.8
Internet users · 2012 per 100 people **
Permanent access to broadband internet · 2012 per 100 people ***
Cellphones · 2012 per 100 people ****
2012 2013
26.3
Share of adspend by medium · in % *
TV Radio Movies Outdoor advertising
Total advertising expenditure · in EUR bn. *
Internet Newspapers Magazines
>>
* Source: Zenith Optimedia, 2013 ** Source: Copyright © IHS, 2013. All rights reserved *** Source: The World Bank **** Source: Copyright © IHS, 2013. All rights reserved **** Source: Our Mobile Planet: Google Global Smart phone Study 2013, http://www.thinkwithgoogle.com/mobileplanet/
2011 2012 2013 2014 2015
14.7
49.8
14.0
12.8
11.9
11.2
2016
15.8
Country information Brazil Country profile · Media Use · Distance selling · “Customer jour-ney“ · Drivers & barriers in distance selling · Cross-border shopping · Dialog marketing
4.5
10.2
5.6
3.50.34.1
71.9
Internet use
Of the approximately 198 mil- lion population, only about half had access to the internet in 2012. Yet due to the public fund- ing of PCs, laptops, tablets, and smartphones, more and more Brazilians are rushing to the web, particularly those in the low-income bracket.
Soccer and social media
TV is still the dominant medi-um in South America's largest advertising market. Due to the World Cup, expenditures for TV will increase by another 12% in 2014 - the total market shows a strong 9% growth. In-ternet expenditures are record- ing the strongest growth, driven by social media. After the US, Brazil is the second largest market worldwide for Facebook, Twitter, and You- Tube.
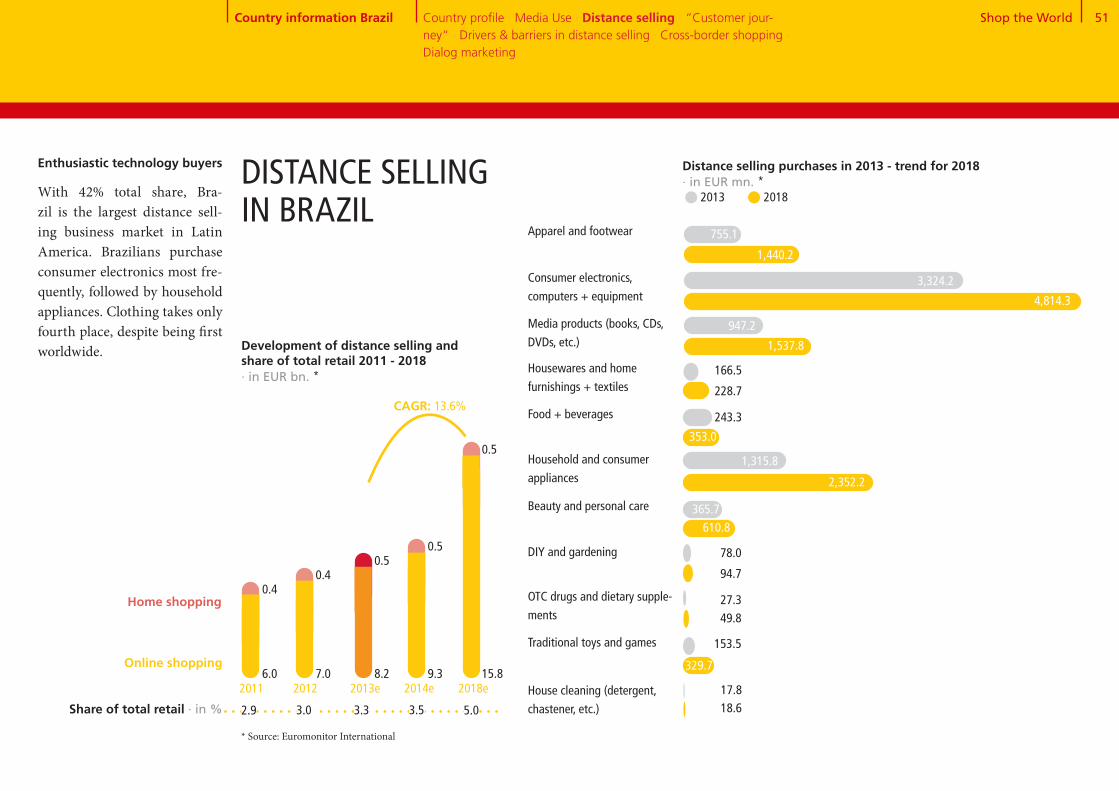
Shop the World 51
Enthusiastic technology buyers
With 42% total share, Bra-zil is the largest distance sell-ing business market in Latin America. Brazilians purchase consumer electronics most fre-quently, followed by household appliances. Clothing takes only fourth place, despite being first worldwide.
DISTANCE SELLING IN BRAZIL
1,440.2
Distance selling purchases in 2013 - trend for 2018 · in EUR mn. * 2013 2018
Apparel and footwear
4,814.3
3,324.2
1,537.8
947.2
228.7
166.5
353.0
1,315.8
2,352.2
610.8
94.7
78.0
27.3
329.7
153.5
18.6
Consumer electronics,
computers + equipment
Media products (books, CDs,
DVDs, etc.)
Housewares and home
furnishings + textiles
Food + beverages
Household and consumer
appliances
Beauty and personal care
DIY and gardening
OTC drugs and dietary supple-
ments
Traditional toys and games
House cleaning (detergent,
chastener, etc.)
Development of distance selling and share of total retail 2011 - 2018 · in EUR bn. *
CAGR: 13.6%
Home shopping
Online shopping6.0 7.0 8.2
0.40.4
0.5
9.3 15.8
0.5
0.5
2011 2012 2013e 2014e 2018e
Share of total retail · in % 2.9 3.0 3.3 3.5 5.0
* Source: Euromonitor International
755.1
17.8
Country information Brazil Country profile · Media Use · Distance selling · “Customer jour-ney“ · Drivers & barriers in distance selling · Cross-border shopping · Dialog marketing
243.3
365.7
49.8

Shop the World 52
84+16
78+22
Distance selling business set to grow
Brazil’s consumer activity in the distance selling business is still below the global average. But a shopping boom is expect- ed in the future: 57.7% have ex-pressed the desire to buy more.
Use of distance selling · in % *
78.5
21.5
Brazil
Globally
83.5
16.5
Number of orders in the previous year · in % *
1 to 5 orders
6 to 10 orders
11 to 20 orders
No orders
21.2
37.1
15.0
21.5
5.1
20.5
35.9
15.2
16.5
12.0
Future ordering behavior (current users) · in % *
More frequently than in the last
12 months
Just as frequently as in the last
12 months
Less frequently than in the last
12 months
38.9
57.7
55.2
38.8
3.3 6.1
Non-users of distance selling - future plans · in % *
Yes71.0
Brazil
Globally
Yes70.5
No29.0
No29.5
Yes No
Brazil Globally Brazil Globally
DISTANCE SELLING IN BRAZIL
* Source: DHL Global Mail 2013 ∙ n Global from 1,275 to 11,265 ∙ n Brazil from 86 to 512
Country information Brazil Country profile · Media Use · Distance selling · “Customer jour-ney“ · Drivers & barriers in distance selling · Cross-border shopping · Dialog marketing
More than 20 orders
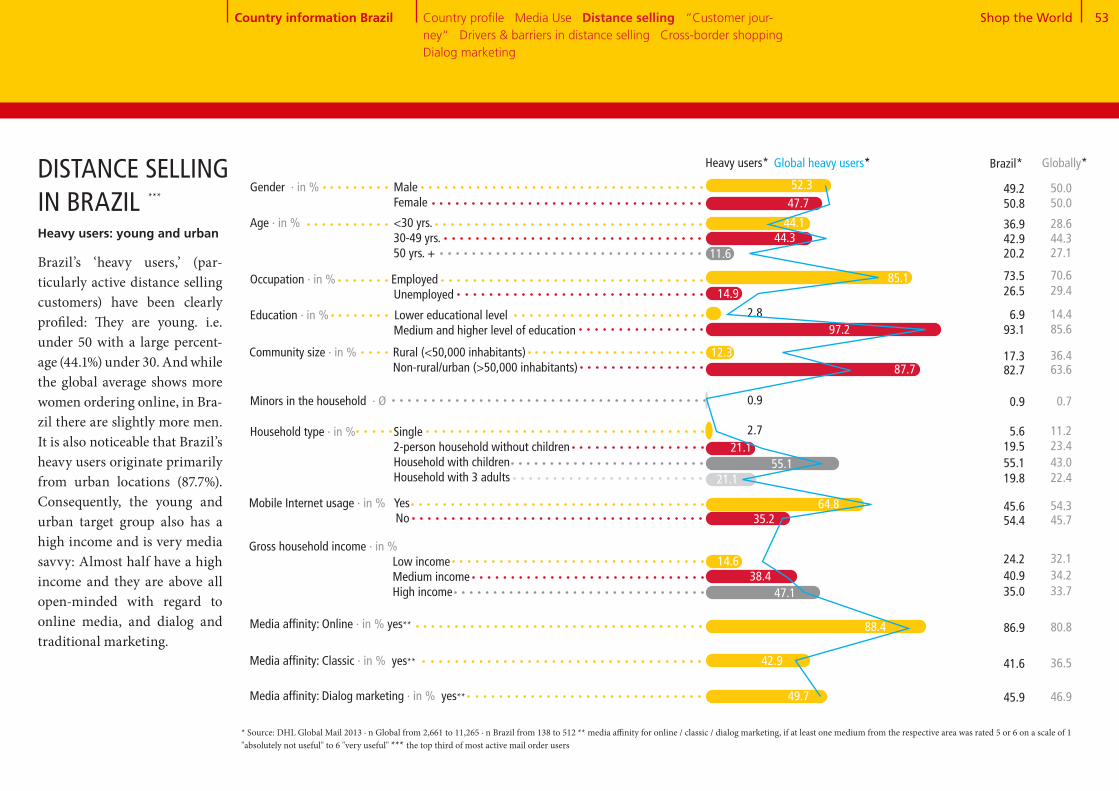
Shop the World 53
Globally*
44.3
Gender · in % Male Female
Age · in % <30 yrs. 30-49 yrs. 50 yrs. +
Occupation · in % Employed Unemployed
Education · in % Lower educational level Medium and higher level of education
2.8
Media affinity: Online · in % yes**
Community size · in % Rural (<50,000 inhabitants) Non-rural/urban (>50,000 inhabitants)
Minors in the household · Ø
Household type · in % Single 2-person household without children Household with children Household with 3 adults
Mobile Internet usage · in % Yes No
Gross household income · in % Low income Medium income High income
Media affinity: Classic · in % yes**
Media affinity: Dialog marketing · in % yes** 49.7
42.9
88.4
47.138.4
14.6
35.264.8
21.155.1
47.7
44.1
52.3
14.9
97.2
87.7
0.9
21.12.7
85.1
Heavy users: young and urban Brazil’s ‘heavy users,’ (par- ticularly active distance selling customers) have been clearly profiled: They are young. i.e. under 50 with a large percent-age (44.1%) under 30. And while the global average shows more women ordering online, in Bra-zil there are slightly more men. It is also noticeable that Brazil’s heavy users originate primarily from urban locations (87.7%). Consequently, the young and urban target group also has a high income and is very media savvy: Almost half have a high income and they are above all open-minded with regard to online media, and dialog and traditional marketing.
DISTANCE SELLING IN BRAZIL
* Source: DHL Global Mail 2013 ∙ n Global from 2,661 to 11,265 ∙ n Brazil from 138 to 512 ** media affinity for online / classic / dialog marketing, if at least one medium from the respective area was rated 5 or 6 on a scale of 1 "absolutely not useful" to 6 "very useful" *** the top third of most active mail order users
44.327.1
14.4
36.4
46.9
36.5
80.8
33.734.232.1
45.754.3
22.443.0
50.0
28.6
50.0
29.4
85.6
63.6
0.7
23.411.2
70.6
Country information Brazil Country profile · Media Use · Distance selling · “Customer jour-ney“ · Drivers & barriers in distance selling · Cross-border shopping · Dialog marketing
***
Brazil*
42.920.2
6.9
17.3
45.9
41.6
86.9
35.040.924.2
54.445.6
19.855.1
50.8
36.9
49.2
26.5
93.1
82.7
0.9
19.55.6
73.5
11.6
12.3
Heavy users* Global heavy users*

Shop the World 54
“CUSTOMER JOURNEY“ SEARCHING FOR PRODUCT INFORMATION
Search for product information · Brazil in % * Globally
40.3 35.5
53.2
27.5 23.4
55.3 44.2
13.7 23.9
50.2 45.8
33.6 42.5
18.2 25.1
17.2 15.1
25.9 15.1
8.0 9.7
48.2 37.8
Criteria for choosing a vendor· Brazil in % *
Globally
Search engines 54.9
Customer ratings in blogs or forums
Product test ratings / expert test reports
Product check in a retail store
Retailer or manufacturer website
Online marketplace
Catalog
Mail advertising
Social media platforms such as Facebook and Twitter
Apps (on smartphone, iPad, or tablet)
Recommendations from friends, acquaintances, and colleagues
52.6 40.6Customer ratings on the supplier’s website
Price comparison sites
Large selection of products
Recommendation and experiences of friends, acquaintances, and colleagues
Official test seals, reviews, and test reports of independent institutions
Attractive product line
Favorable prices, promotions, & special offers
Straightforward return process
Free returns
Choice of preferred payment methods
Fast delivery
Free delivery
Good customer service
Positive customer ratings on the internet
20.7 13.7
20.7
2.6 8.8
29.4 26.6
10.3 14.9
44.2 51.7
9.6 12.9
15.2 20.8
24.6 22.6
37.9 25.7
44.8 45.2
19.8 18.5
18.9
Price-conscious consumers
Both during the information search and retailer selection, Brazilians keep an eye on their pocketbooks. Price comparison sites as well as low prices and free delivery are of greatest impor- tance.
* Source: DHL Global Mail 2013 ∙ n Global from 9,386 to 10,617 ∙ n Brazil from 401 to 468, multiple mentioning
Country information Brazil Country profile · Media Use · Distance selling · “Customer jour-ney“ · Drivers & barriers in distance selling · Cross-border shop-ping · Dialog marketing
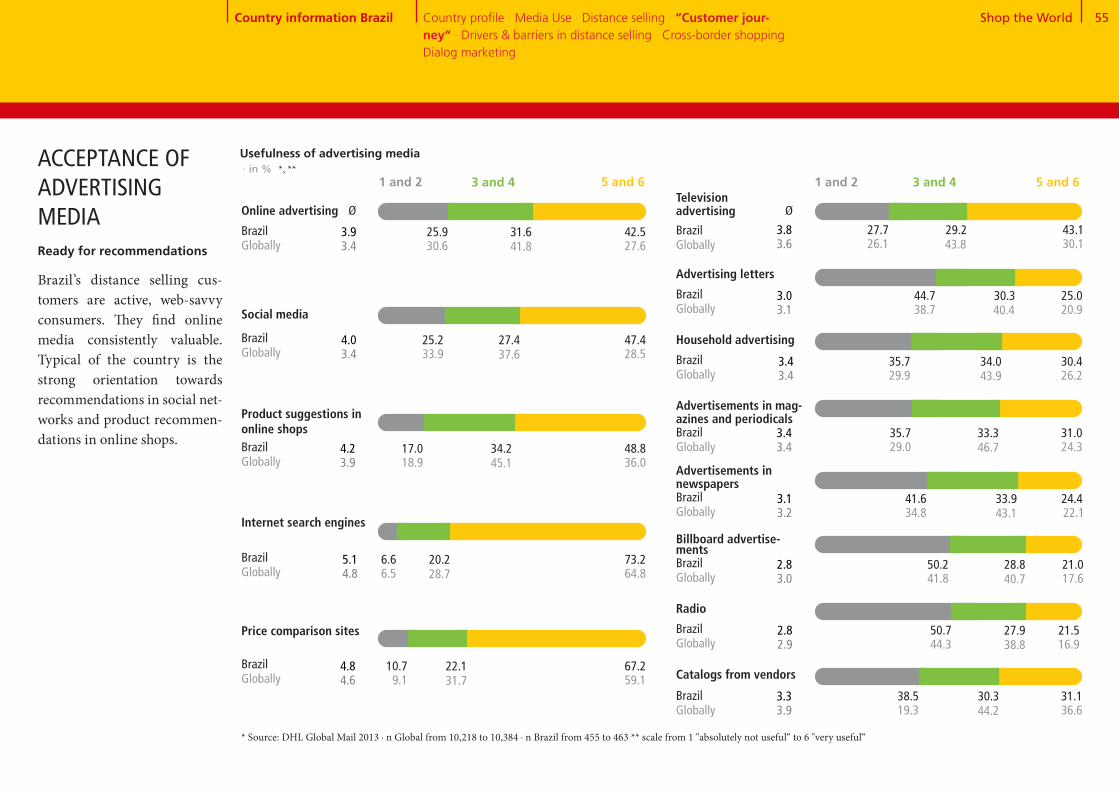
Shop the World 55
Usefulness of advertising media · in % *, **
5 and 63 and 41 and 2
Ø
29.227.7 43.126.1 43.8 30.1
Online advertising
* Source: DHL Global Mail 2013 ∙ n Global from 10,218 to 10,384 ∙ n Brazil from 455 to 463 ** scale from 1 "absolutely not useful“ to 6 "very useful“
Ready for recommendations
Brazil’s distance selling cus- tomers are active, web-savvy consumers. They find online media consistently valuable. Typical of the country is the strong orientation towards recommendations in social net-works and product recommen-dations in online shops.
ACCEPTANCE OF ADVERTISING MEDIA
Brazil Globally
Country information Brazil Country profile · Media Use · Distance selling · “Customer jour-ney“ · Drivers & barriers in distance selling · Cross-border shopping · Dialog marketing
Television advertising
5 and 63 and 41 and 2
3.83.6
Ø
31.625.9 42.530.6 41.8 27.6
3.93.4
30.344.7 25.038.7 40.4 20.9Social media
Brazil Globally
Advertising letters
3.03.1
27.425.2 47.433.9 37.6 28.5
4.03.4
Product suggestions in online shops
34.217.0 48.818.9 45.1 36.0
4.23.9
20.26.6 73.26.5 28.7 64.8
5.14.8
22.110.7 67.29.1 31.7 59.1
4.84.6
34.035.7 30.429.9 43.9 26.2
Brazil Globally
Household advertising
3.43.4
33.335.7 31.029.0 46.7 24.3
Brazil Globally
Advertisements in mag- azines and periodicals
3.43.4
33.941.6 24.434.8 43.1 22.1
Brazil Globally
Advertisements in newspapers
3.13.2
28.850.2 21.041.8 40.7 17.6
Brazil Globally
Billboard advertise-ments
2.83.0
27.950.7 21.544.3 38.8 16.9
Brazil Globally
Radio
2.82.9
30.338.5 31.119.3 44.2 36.6
Brazil Globally
Catalogs from vendors
3.33.9
Brazil Globally
Brazil Globally
Brazil Globally
Internet search engines
Brazil Globally
Price comparison sites
Brazil Globally

Shop the World 56
Online PC
Online mobile (tablet, smartphone)
By telephone
In writing (by post, fax)
By email
Order in store & delivery to home
Online marketplace
Mail order company from which I received a catalog
Merchant who advertises on TV
Online shop of a manufaturer or
retailer
Use of different suppliers · in % *
Never Frequently / very frequently
Occasionally
* Source: DHL Global Mail 2013 ∙ n Global from 9,270 to 9,446 ∙ n Brazil from 393 to 402
Brazil Globally
71.1
3.4
1.1
6.9
75.0
3.2
2.1
4.4
“CUSTOMER JOURNEY“– PLACING ORDERSOrders primarily online
When it comes to ordering methods, Brazilian distance selling customers match the global trend: Nine out of ten order online with a PC, a smart phone, or by email. Only a small number order locally in a store and have it delivered to their home, or order by tele-phone. But Brazil goes its own way when selecting a distance selling business. Most custom-ers choose a manufacturer or retailer’s online shop (56.8% “frequent use” versus 31.2% globally). Online marketplaces take second place (39.2%), com-pared to first place in the global average (54.3%). Openness to teleshopping is also noticeable: 60.4% of Brazilians buy via tele- shopping, whereas the global average is only 39.9%.
7.8 56.89.3
15.4 31.216.8
26.1
36.6
Brazil
Globally
16.8 39.213.5
9.9 54.38.7
30.5
27.0
42.4 15.421.5
38.5 12.622.8
20.7
26.1
39.6 16.924.2
60.2 6.617.6
19.3
15.7
9.6
10.5
7.8
4.8
Order channels· in % *
Country information Brazil Country profile · Media Use · Distance selling · “Customer jour-ney“ · Drivers & barriers in distance selling · Cross-border shopping · Dialog marketing
Seldom
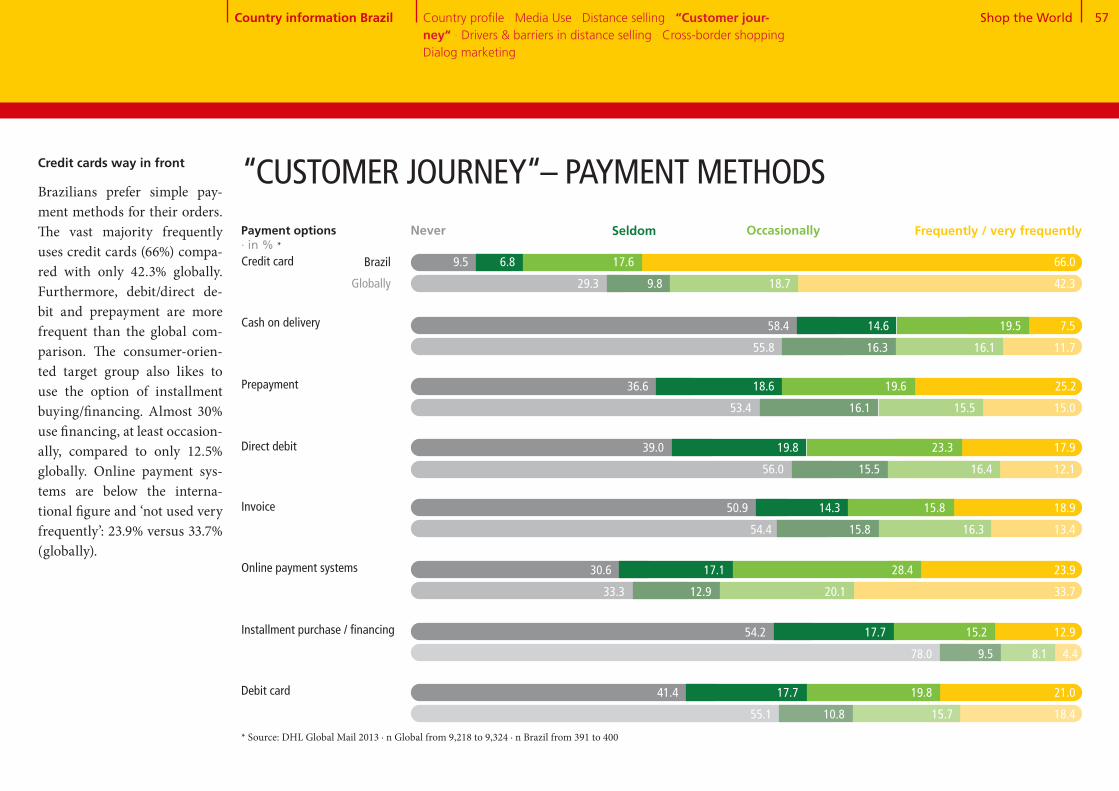
Shop the World 57
Credit cards way in front
Brazilians prefer simple pay-ment methods for their orders. The vast majority frequently uses credit cards (66%) compa-red with only 42.3% globally. Furthermore, debit/direct de-bit and prepayment are more frequent than the global com-parison. The consumer-orien-ted target group also likes to use the option of installment buying/financing. Almost 30% use financing, at least occasion- ally, compared to only 12.5% globally. Online payment sys-tems are below the interna- tional figure and ‘not used very frequently’: 23.9% versus 33.7% (globally).
Cash on delivery
Prepayment
Direct debit
Credit card
* Source: DHL Global Mail 2013 ∙ n Global from 9,218 to 9,324 ∙ n Brazil from 391 to 400
“CUSTOMER JOURNEY“– PAYMENT METHODS
Online payment systems
Installment purchase / financing
Debit card
Invoice
Payment options · in % *
Never Frequently / very frequentlyOccasionally
Brazil
Globally
9.5 6.8 17.6 66.0
29.3 9.8 18.7 42.3
58.4 14.6 19.5 7.5
55.8 16.3 16.1 11.7
36.6 18.6 19.6 25.2
53.4 16.1 15.5 15.0
39.0 19.8 23.3 17.9
56.0 15.5 16.4 12.1
50.9 14.3 15.8 18.9
54.4 15.8 16.3 13.4
30.6 17.1 28.4 23.9
33.3 12.9 20.1 33.7
54.2 17.7 15.2 12.9
78.0 9.5 8.1 4.4
41.4 17.7 19.8 21.0
55.1 10.8 15.7 18.4
Country information Brazil Country profile · Media Use · Distance selling · “Customer jour-ney“ · Drivers & barriers in distance selling · Cross-border shopping · Dialog marketing
Seldom
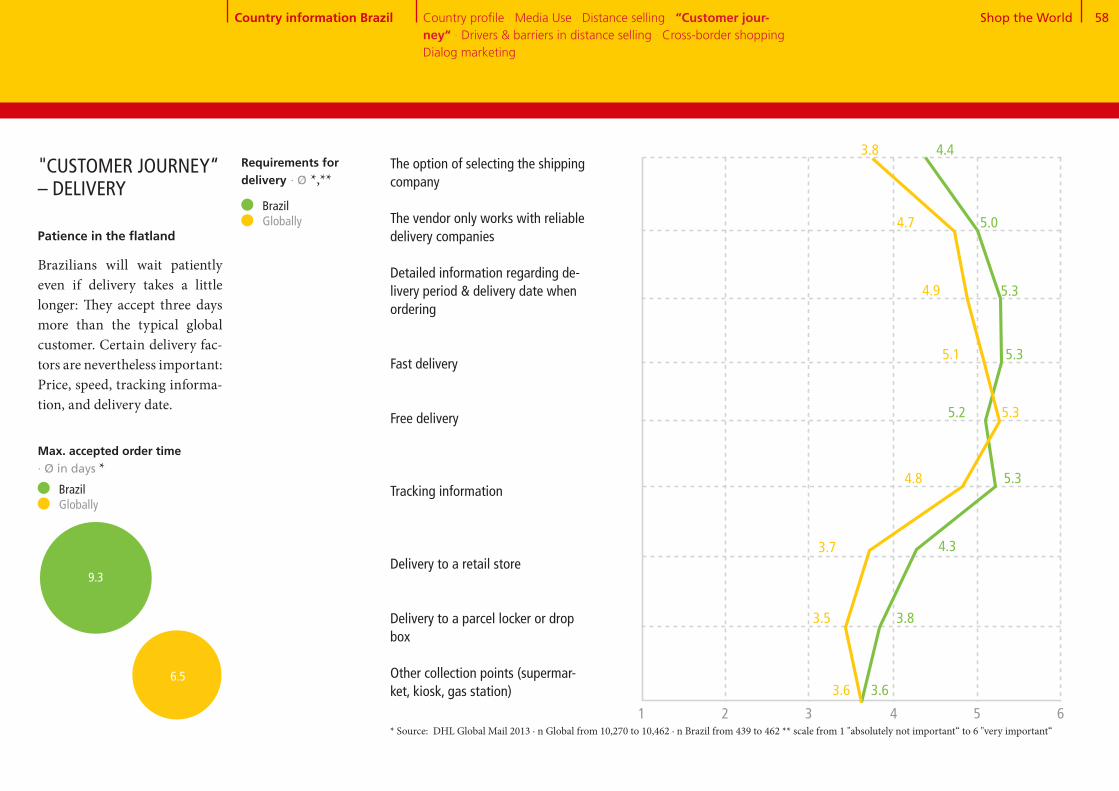
Shop the World 58
The option of selecting the shipping company The vendor only works with reliable delivery companies
Detailed information regarding de-livery period & delivery date when ordering
Fast delivery
Free delivery
Tracking information
Delivery to a retail store
Delivery to a parcel locker or drop box
Other collection points (supermar-ket, kiosk, gas station)
Brazil Globally
3.6
3.8
4.3
5.2
5.3
5.3
4.4
5.3
5.0
Max. accepted order time · Ø in days *
3.6
3.5
3.7
5.3
4.8
5.1
3.8
4.9
4.7
* Source: DHL Global Mail 2013 ∙ n Global from 10,270 to 10,462 ∙ n Brazil from 439 to 462 ** scale from 1 "absolutely not important“ to 6 "very important“
Patience in the flatland
Brazilians will wait patiently even if delivery takes a little longer: They accept three days more than the typical global customer. Certain delivery fac-tors are nevertheless important: Price, speed, tracking informa-tion, and delivery date.
"CUSTOMER JOURNEY“ – DELIVERY
1 2 3 4 5 6
Requirements for delivery · Ø *,**
Country information Brazil Country profile · Media Use · Distance selling · “Customer jour-ney“ · Drivers & barriers in distance selling · Cross-border shopping · Dialog marketing
9.3
6.5
Brazil Globally

Shop the World 59
15+85
72+28
Number of returns per capita per year · Ø * Brazil Globally
0.8
0.3
Return rate · in % * Brazil Globally
5.9
Reasons for returns · Brazil in % *
Defective product 35.5
Percentage of users who returned goods · in % *
15.6
84.4
Brazil Globally
Yes No
“CUSTOMER JOURNEY“ – RETURNSMinimal return rate
Only 15.6% of distance selling customers in Brazil returned ordered goods, 10% below the global average of 27.5%. Even the per capita number of returns is minimal at 0.3 (com-pared to 0.8 globally), as is the return rate (3.3%) which is be-low the global average of 5.9%. Most common reasons for returns are: Defective products, product deviates from descrip-tion, and dissatisfaction. The most frequently cited global reason (product does not fit - 37.7%) occurs far less frequent-ly in Brazil (21.0%).
27.5
72.5
* Source: DHL Global Mail 2013 ∙ n Global from 2,648 to 9,325 ∙ n Brazil from 62 to 397
Differing product description
Delivery of the wrong product
Wrong product was ordered
Product did not fit
Ordered multiple variants to choose from
Delivery period too long
Found less expensive product
Deficient product quality
Product was not liked
27.5
22.6
21.0
27.2
3.2
6.4
9.5
Globally
32.3
30.0
17.8
13.3
8.5
37.7
29.9
15.5
5.8
3.9
14.6
4.8
Country information Brazil Country profile · Media Use · Distance selling · “Customer jour-ney“ · Drivers & barriers in distance selling · Cross-border shopping · Dialog marketing
3.3
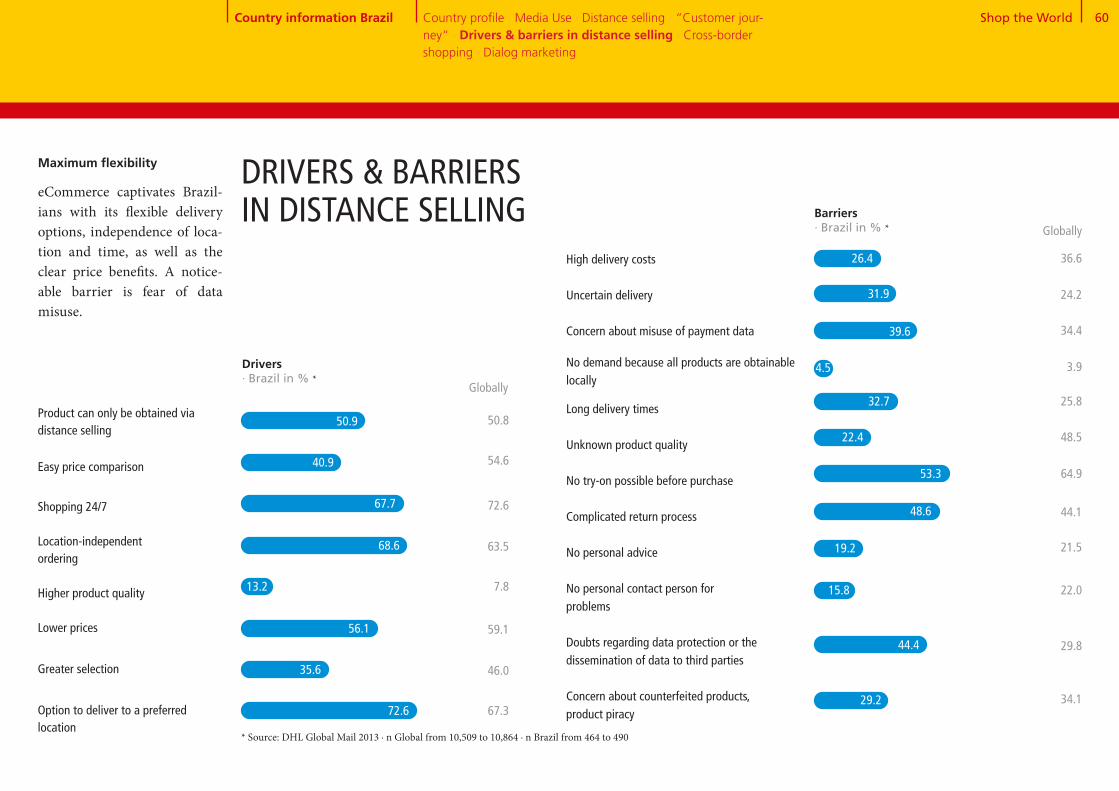
Shop the World 60
High delivery costs
Uncertain delivery
Concern about misuse of payment data
No demand because all products are obtainable locally
Long delivery times
Unknown product quality
No try-on possible before purchase
Complicated return process
No personal advice
No personal contact person for problems
Doubts regarding data protection or the dissemination of data to third parties
Concern about counterfeited products, product piracy
Product can only be obtained via distance selling
Easy price comparison
Shopping 24/7
Location-independent ordering
Higher product quality
Lower prices
Greater selection
Option to deliver to a preferred location
DRIVERS & BARRIERS IN DISTANCE SELLING Barriers
· Brazil in % *
50.8
54.6
72.6
63.5
7.8
59.1
46.0
67.3
56.1
35.6
72.6
Globally
36.6
24.2
34.4
3.9
25.8
48.5
64.9
44.1
21.5
22.0
29.8
34.1
Maximum flexibility
eCommerce captivates Brazil- ians with its flexible delivery options, independence of loca-tion and time, as well as the clear price benefits. A notice- able barrier is fear of data misuse.
Drivers · Brazil in % *
Globally
* Source: DHL Global Mail 2013 ∙ n Global from 10,509 to 10,864 ∙ n Brazil from 464 to 490
50.9
40.9
67.7
68.6
13.2
26.4
31.9
39.6
4.5
32.7
22.4
53.3
48.6
19.2
15.8
44.4
29.2
Country information Brazil Country profile · Media Use · Distance selling · “Customer jour-ney“ · Drivers & barriers in distance selling · Cross-border shopping · Dialog marketing
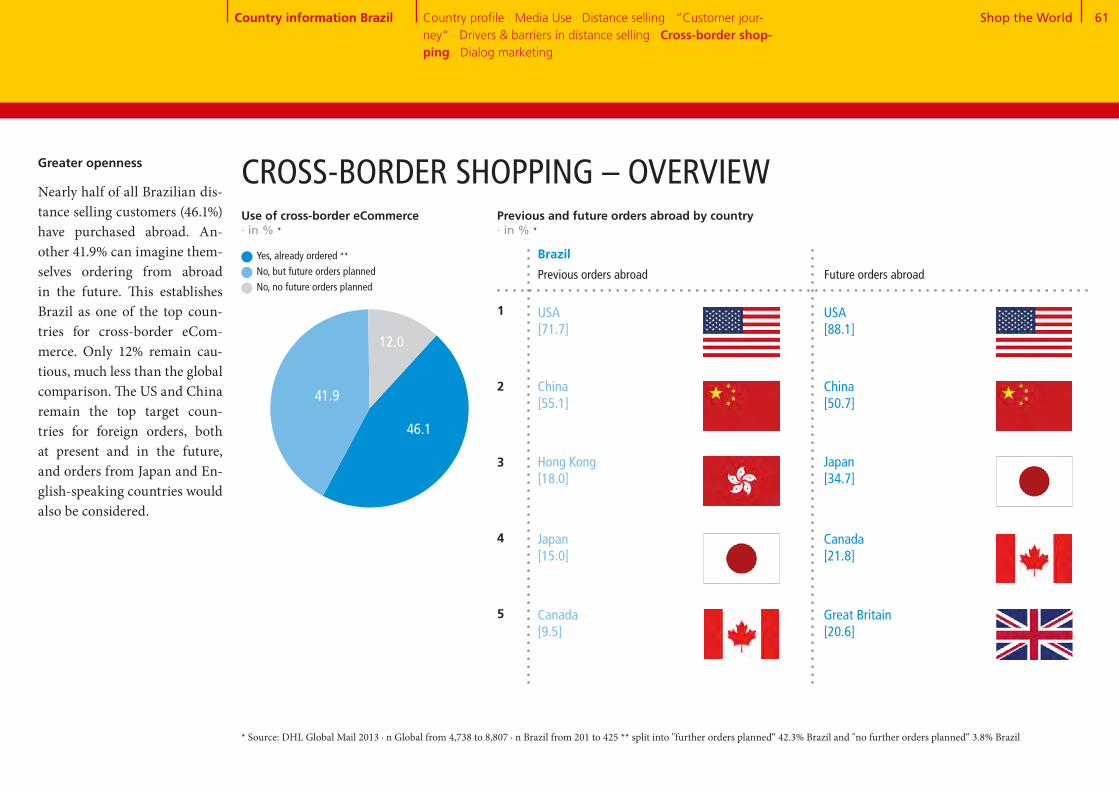
Shop the World 61
46+42+12CROSS-BORDER SHOPPING – OVERVIEW
Previous orders abroad
Previous and future orders abroad by country · in % *
Japan[15.0]
Canada[9.5]
1
2
3
4
5
USA[71.7]
China[55.1]
Hong Kong[18.0]
Future orders abroad
Brazil
* Source: DHL Global Mail 2013 ∙ n Global from 4,738 to 8,807 ∙ n Brazil from 201 to 425 ** split into "further orders planned“ 42.3% Brazil and "no further orders planned“ 3.8% Brazil
Greater openness
Nearly half of all Brazilian dis-tance selling customers (46.1%) have purchased abroad. An-other 41.9% can imagine them-selves ordering from abroad in the future. This establishes Brazil as one of the top coun-tries for cross-border eCom-merce. Only 12% remain cau-tious, much less than the global comparison. The US and China remain the top target coun-tries for foreign orders, both at present and in the future, and orders from Japan and En- glish-speaking countries would also be considered.
Canada[21.8]
Great Britain[20.6]
USA[88.1]
China[50.7]
Japan[34.7]
Country information Brazil Country profile · Media Use · Distance selling · “Customer jour-ney“ · Drivers & barriers in distance selling · Cross-border shop-ping · Dialog marketing
Use of cross-border eCommerce · in % *
Yes, already ordered **No, but future orders planned No, no future orders planned
41.9
46.1
12.0
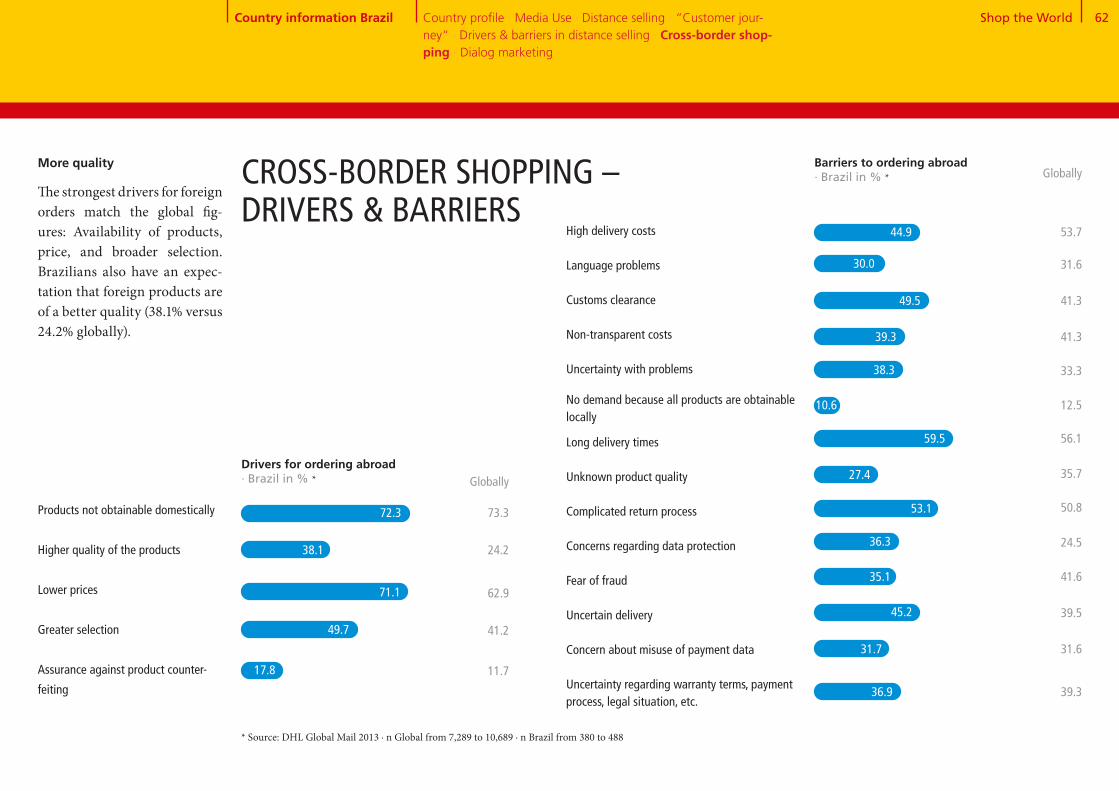
Shop the World 62
High delivery costs Language problems
Customs clearance
Non-transparent costs
Uncertainty with problems
No demand because all products are obtainable locally
Long delivery times
Unknown product quality
Complicated return process
Concerns regarding data protection Fear of fraud Uncertain delivery
Concern about misuse of payment data
Uncertainty regarding warranty terms, payment process, legal situation, etc.
Products not obtainable domestically
Higher quality of the products
Lower prices
Greater selection
Assurance against product counter-
feiting
Drivers for ordering abroad· Brazil in % *
Barriers to ordering abroad · Brazil in % *
Globally
73.3
24.2
62.9
41.2
11.7
Globally
53.7
31.6
41.3
41.3
33.3
12.5
56.1
35.7
50.8
24.5
41.6
39.5
31.6
39.3
More quality
The strongest drivers for foreign orders match the global fig- ures: Availability of products, price, and broader selection. Brazilians also have an expec-tation that foreign products are of a better quality (38.1% versus 24.2% globally).
CROSS-BORDER SHOPPING – DRIVERS & BARRIERS
* Source: DHL Global Mail 2013 ∙ n Global from 7,289 to 10,689 ∙ n Brazil from 380 to 488
44.9
30.0
49.5
39.3
38.3
10.6
59.5
27.4
53.1
36.3
35.1
45.2
31.7
36.9
72.3
38.1
71.1
49.7
17.8
Country information Brazil Country profile · Media Use · Distance selling · “Customer jour-ney“ · Drivers & barriers in distance selling · Cross-border shop-ping · Dialog marketing
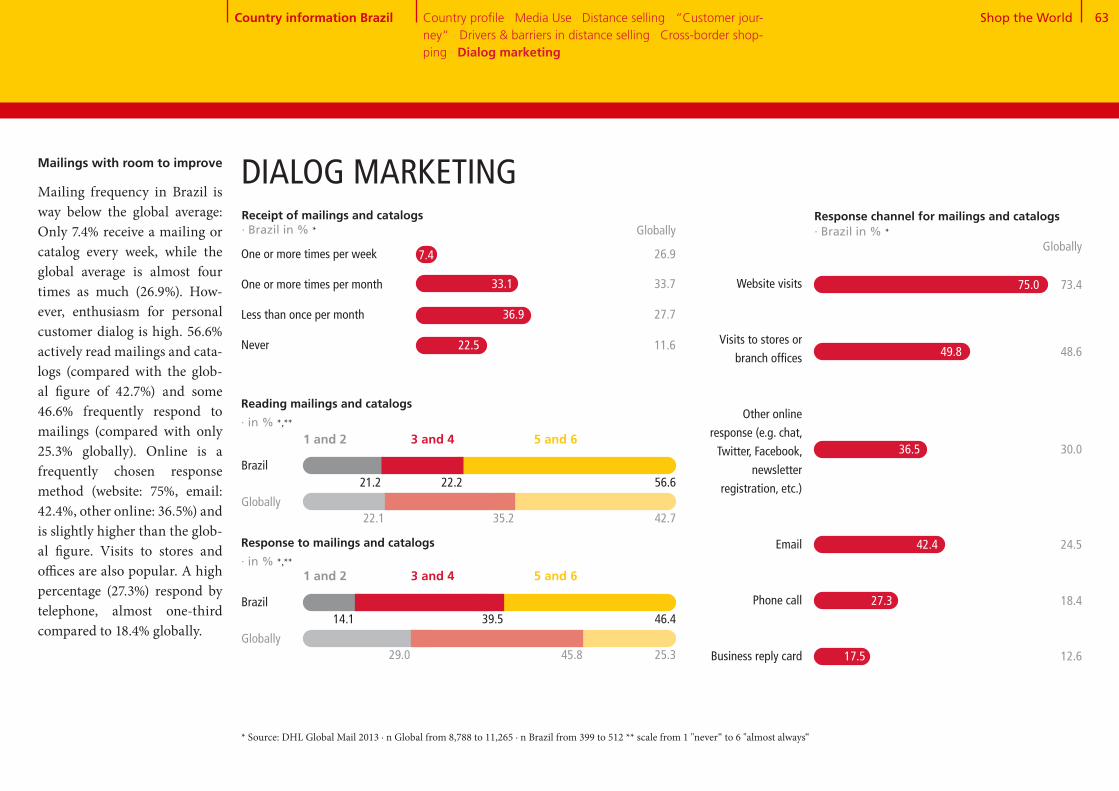
Shop the World 63
Receipt of mailings and catalogs · Brazil in % *
5 and 63 and 41 and 2
DIALOG MARKETING
Reading mailings and catalogs · in % *,**
Brazil
Globally
21.2 22.2 56.6
22.1 35.2 42.7
5 and 63 and 41 and 2
Response to mailings and catalogs · in % *,**
Brazil
Globally
14.1 39.5 46.4
29.0 45.8 25.3
Response channel for mailings and catalogs · Brazil in % * Globally
Website visits
Visits to stores or
branch offices
Other online
response (e.g. chat,
Twitter, Facebook,
newsletter
registration, etc.)
Phone call
Business reply card
75.0 73.4
48.6
30.0
24.5
18.4
12.6
* Source: DHL Global Mail 2013 ∙ n Global from 8,788 to 11,265 ∙ n Brazil from 399 to 512 ** scale from 1 "never“ to 6 "almost always“
Mailings with room to improve
Mailing frequency in Brazil is way below the global average: Only 7.4% receive a mailing or catalog every week, while the global average is almost four times as much (26.9%). How-ever, enthusiasm for personal customer dialog is high. 56.6% actively read mailings and cata-logs (compared with the glob-al figure of 42.7%) and some 46.6% frequently respond to mailings (compared with only 25.3% globally). Online is a frequently chosen response method (website: 75%, email: 42.4%, other online: 36.5%) and is slightly higher than the glob-al figure. Visits to stores and offices are also popular. A high percentage (27.3%) respond by telephone, almost one-third compared to 18.4% globally.
Globally
One or more times per week
One or more times per month
Less than once per month
Never
26.9
33.7
27.7
11.6 49.8
36.5
42.4
27.3
17.5
7.4
33.1
36.9
22.5
Country information Brazil Country profile · Media Use · Distance selling · “Customer jour-ney“ · Drivers & barriers in distance selling · Cross-border shop-ping · Dialog marketing

Country InformationCanada
Claudia
Canadian eCommerce customers like to buy media products. They are experienced cross-border shop-pers and prefer to order in English-speaking coun-tries.
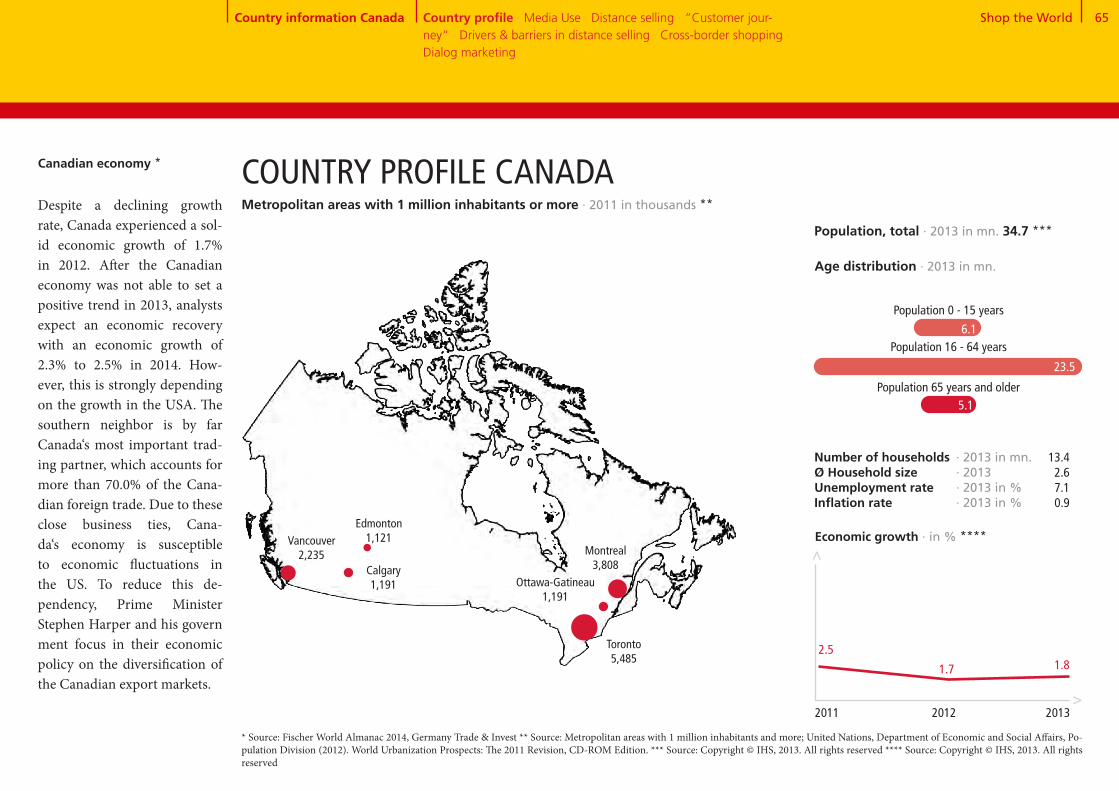
Shop the World 65
6.1
Population 0 - 15 years
Canadian economy * COUNTRY PROFILE CANADA
Toronto 5,485
Montreal 3,808
* Source: Fischer World Almanac 2014, Germany Trade & Invest ** Source: Metropolitan areas with 1 million inhabitants and more; United Nations, Department of Economic and Social Affairs, Po-pulation Division (2012). World Urbanization Prospects: The 2011 Revision, CD-ROM Edition. *** Source: Copyright © IHS, 2013. All rights reserved **** Source: Copyright © IHS, 2013. All rights reserved
Number of households Ø Household sizeUnemployment rateInflation rate
1.7
Economic growth · in % ****
>
>
1.82.5
2011 2012 2013
Age distribution · 2013 in mn.
Population 65 years and older
Population, total · 2013 in mn. 34.7 ***
Country information Canada Country profile · Media Use · Distance selling · “Customer jour-ney“ · Drivers & barriers in distance selling · Cross-border shopping · Dialog marketing
Population 16 - 64 years
· 2013 in mn.· 2013· 2013 in %· 2013 in %
13.4 2.67.1 0.9
Despite a declining growth rate, Canada experienced a sol- id economic growth of 1.7% in 2012. After the Canadian economy was not able to set a positive trend in 2013, analysts expect an economic recovery with an economic growth of 2.3% to 2.5% in 2014. How-ever, this is strongly depending on the growth in the USA. The southern neighbor is by far Canada‘s most important trad-ing partner, which accounts for more than 70.0% of the Cana-dian foreign trade. Due to these close business ties, Cana-da‘s economy is susceptible to economic fluctuations in the US. To reduce this de-pendency, Prime Minister Stephen Harper and his govern ment focus in their economic policy on the diversification of the Canadian export markets.
23.5
5.1
Vancouver 2,235
Ottawa-Gatineau 1,191
Calgary 1,191
Edmonton 1,121
Metropolitan areas with 1 million inhabitants or more · 2011 in thousands **
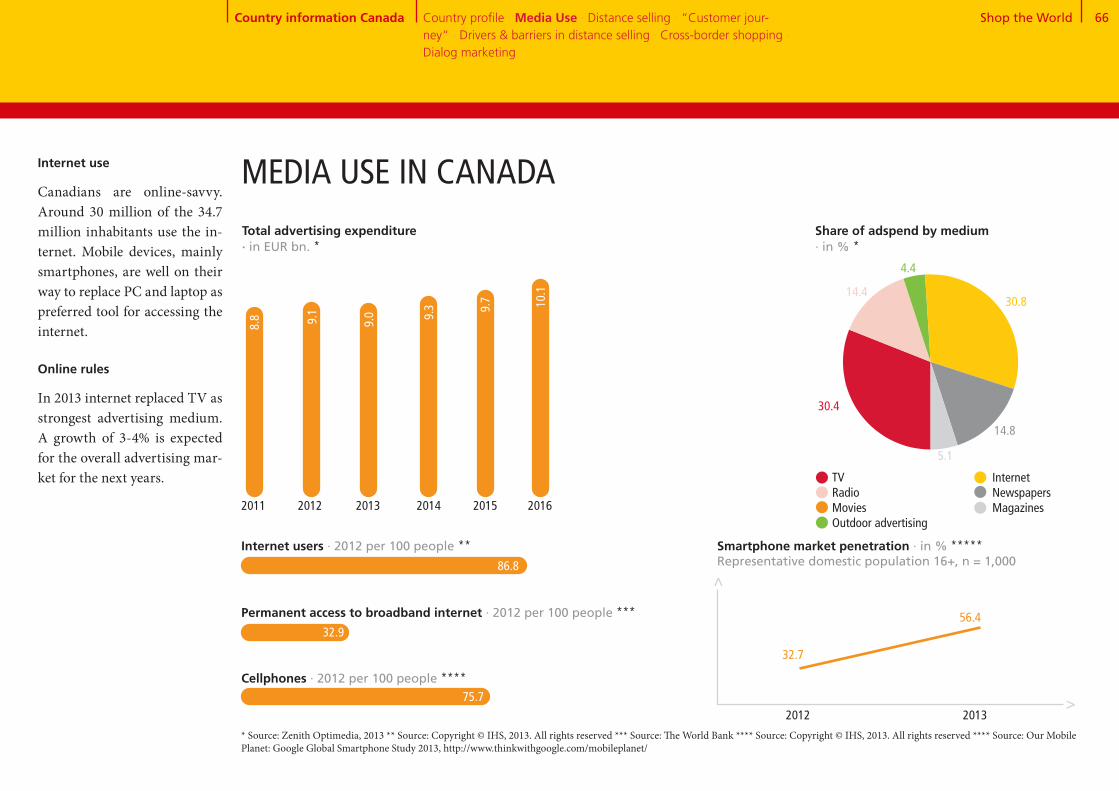
Shop the World 66
31+14+4+31+15+5MEDIA USE IN CANADA
32.9
Smartphone market penetration · in % *****Representative domestic population 16+, n = 1,000
32.7
Internet users · 2012 per 100 people **
Permanent access to broadband internet · 2012 per 100 people ***
Cellphones · 2012 per 100 people ****
2012 2013
56.4
Share of adspend by medium · in % *
TV Radio Movies Outdoor advertising
Total advertising expenditure · in EUR bn. *
Internet Newspapers Magazines
>>
* Source: Zenith Optimedia, 2013 ** Source: Copyright © IHS, 2013. All rights reserved *** Source: The World Bank **** Source: Copyright © IHS, 2013. All rights reserved **** Source: Our Mobile Planet: Google Global Smartphone Study 2013, http://www.thinkwithgoogle.com/mobileplanet/
2011 2012 2013 2014 2015
9.7
86.8
9.3
9.09.1
8.8
2016
10.1
Country information Canada Country profile · Media Use · Distance selling · “Customer jour-ney“ · Drivers & barriers in distance selling · Cross-border shopping · Dialog marketing
30.8
14.8
5.1
4.4
14.4
30.4
75.7
Internet use
Canadians are online-savvy. Around 30 million of the 34.7 million inhabitants use the in-ternet. Mobile devices, mainly smartphones, are well on their way to replace PC and laptop as preferred tool for accessing the internet.
Online rules
In 2013 internet replaced TV asstrongest advertising medium. A growth of 3-4% is expected for the overall advertising mar-ket for the next years.
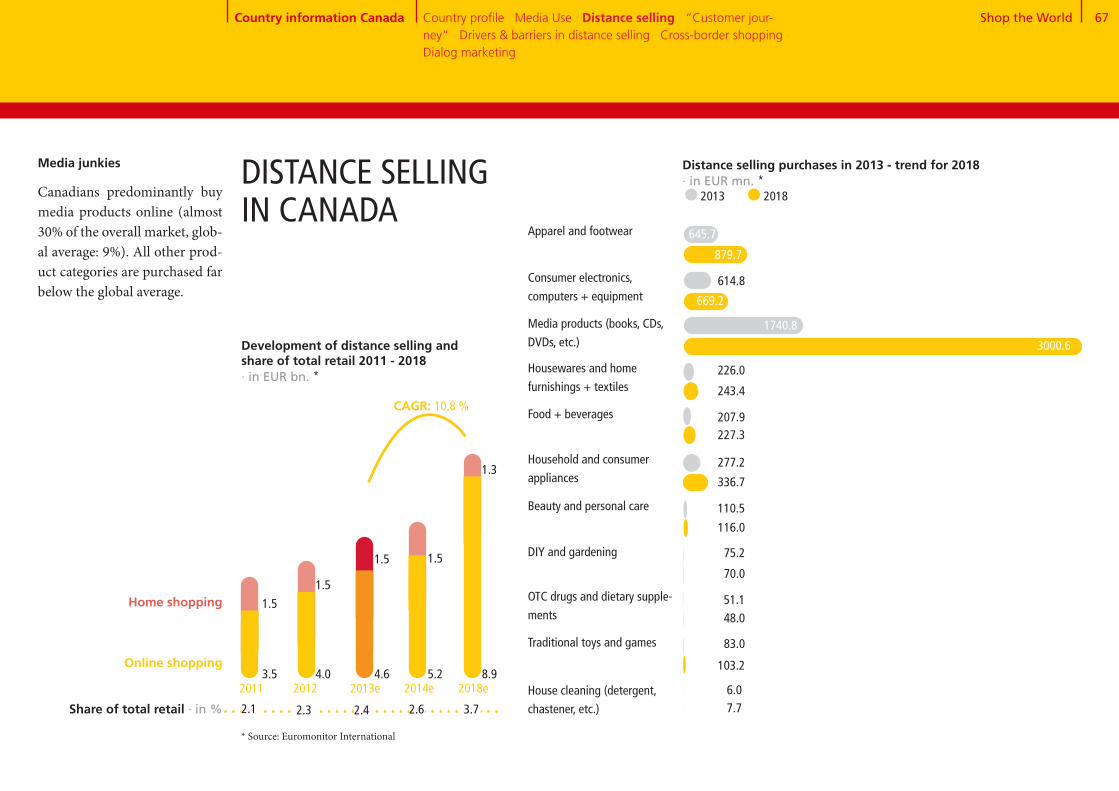
Shop the World 67
Media junkies
Canadians predominantly buy media products online (almost 30% of the overall market, glob- al average: 9%). All other prod-uct categories are purchased far below the global average.
DISTANCE SELLING IN CANADA
879.7
Distance selling purchases in 2013 - trend for 2018 · in EUR mn. * 2013 2018
Apparel and footwear
669.2
614.8
3000.6
1740.8
243.4
226.0
227.3
277.2
336.7
116.0
70.0
75.2
51.1
103.2
83.0
7.7
Consumer electronics,
computers + equipment
Media products (books, CDs,
DVDs, etc.)
Housewares and home
furnishings + textiles
Food + beverages
Household and consumer
appliances
Beauty and personal care
DIY and gardening
OTC drugs and dietary supple-
ments
Traditional toys and games
House cleaning (detergent,
chastener, etc.)
Development of distance selling and share of total retail 2011 - 2018 · in EUR bn. *
CAGR: 10.8 %
Home shopping
Online shopping3.5 4.0 4.6
1.5
1.5
1.5
5.2 8.9
1.5
1.3
2011 2012 2013e 2014e 2018e
Share of total retail · in % 2.1 2.3 2.4 2.6 3.7
* Source: Euromonitor International
645.7
6.0
Country information Canada Country profile · Media Use · Distance selling · “Customer jour-ney“ · Drivers & barriers in distance selling · Cross-border shopping · Dialog marketing
207.9
110.5
48.0
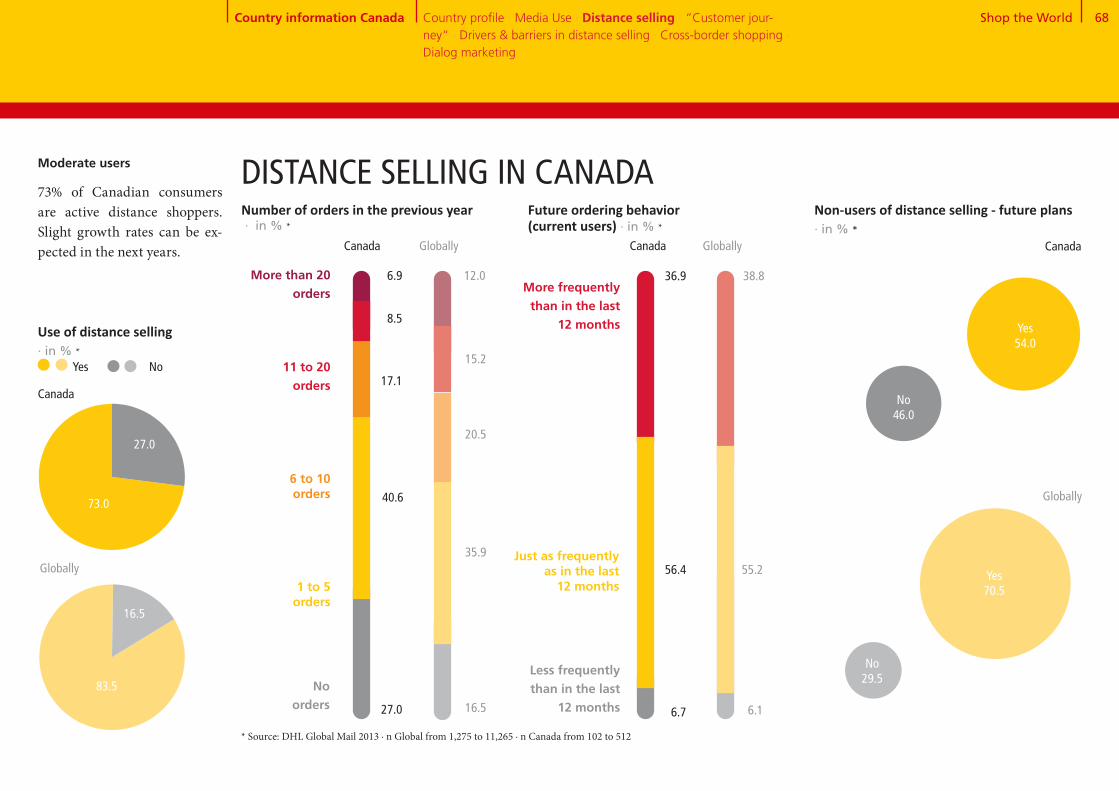
Shop the World 68
73+2784
+16
Moderate users
73% of Canadian consumers are active distance shoppers. Slight growth rates can be ex-pected in the next years.
Use of distance selling · in % *
73.0
27.0
Canada
Globally
83.5
16.5
Number of orders in the previous year · in % *
1 to 5 orders
6 to 10 orders
11 to 20 orders
More than 20 orders
No orders
17.1
40.6
8.5
27.0
6.9
20.5
35.9
15.2
16.5
12.0
Future ordering behavior (current users) · in % *
More frequently than in the last
12 months
Just as frequently as in the last
12 months
Less frequently than in the last
12 months
56.4
36.9
55.2
38.8
6.7 6.1
Non-users of distance selling - future plans · in % *
Yes54.0
Canada
Globally
Yes70.5
No46.0
No29.5
Yes No
Canada Globally Canada Globally
DISTANCE SELLING IN CANADA
* Source: DHL Global Mail 2013 ∙ n Global from 1,275 to 11,265 ∙ n Canada from 102 to 512
Country information Canada Country profile · Media Use · Distance selling · “Customer jour-ney“ · Drivers & barriers in distance selling · Cross-border shopping · Dialog marketing
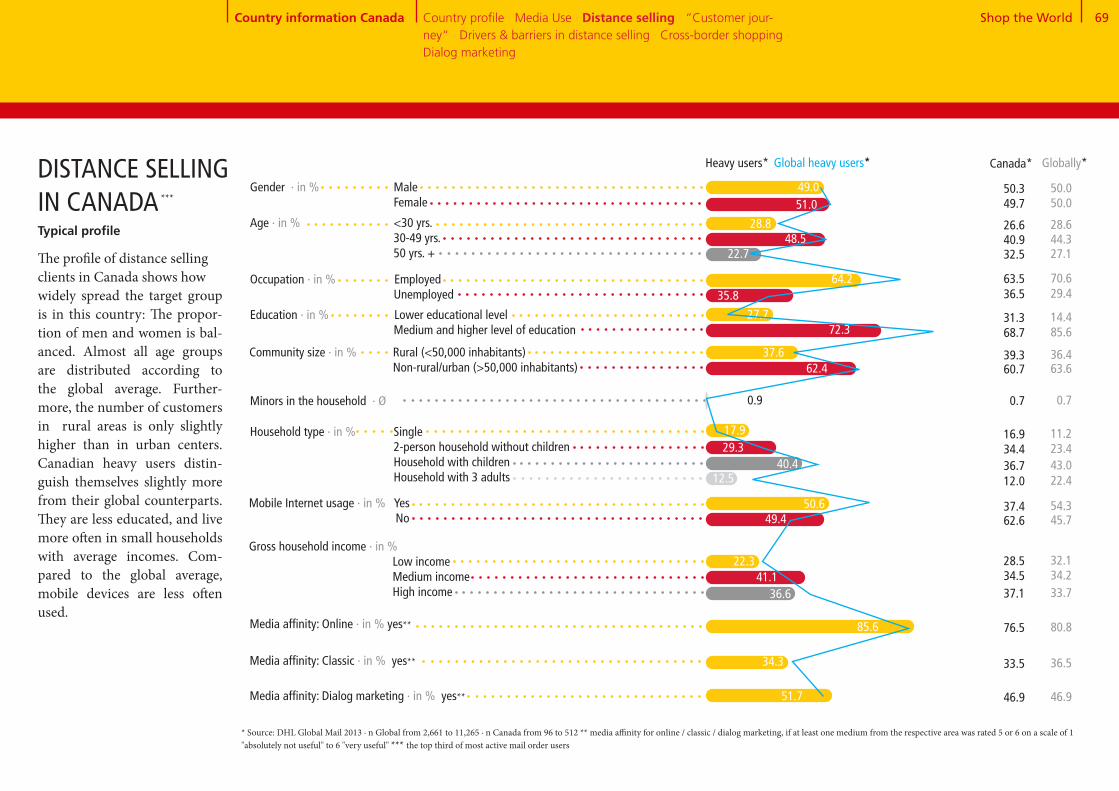
Shop the World 69
Globally*
48.5
Gender · in % Male Female
Age · in % <30 yrs. 30-49 yrs. 50 yrs. +
Occupation · in % Employed Unemployed
Education · in % Lower educational level Medium and higher level of education
27.7
Media affinity: Online · in % yes**
Community size · in % Rural (<50,000 inhabitants) Non-rural/urban (>50,000 inhabitants)
Minors in the household · Ø
Household type · in % Single 2-person household without children Household with children Household with 3 adults
Mobile Internet usage · in % Yes No
Gross household income · in % Low income Medium income High income
Media affinity: Classic · in % yes**
Media affinity: Dialog marketing · in % yes** 51.7
34.3
85.6
36.641.1
22.3
49.450.6
12.540.4
51.0
28.8
49.0
35.8
72.3
62.4
0.9
29.317.9
64.2
Typical profile
The profile of distance sellingclients in Canada shows howwidely spread the target group is in this country: The propor-tion of men and women is bal- anced. Almost all age groups are distributed according to the global average. Further- more, the number of customers in rural areas is only slightly higher than in urban centers. Canadian heavy users distin-guish themselves slightly more from their global counterparts. They are less educated, and live more often in small households with average incomes. Com- pared to the global average, mobile devices are less often used.
DISTANCE SELLING IN CANADA
* Source: DHL Global Mail 2013 ∙ n Global from 2,661 to 11,265 ∙ n Canada from 96 to 512 ** media affinity for online / classic / dialog marketing, if at least one medium from the respective area was rated 5 or 6 on a scale of 1 "absolutely not useful" to 6 "very useful" *** the top third of most active mail order users
44.327.1
14.4
36.4
46.9
36.5
80.8
33.734.232.1
45.754.3
22.443.0
50.0
28.6
50.0
29.4
85.6
63.6
0.7
23.411.2
70.6
Country information Canada Country profile · Media Use · Distance selling · “Customer jour-ney“ · Drivers & barriers in distance selling · Cross-border shopping · Dialog marketing
***
Canada*
40.932.5
31.3
39.3
46.9
33.5
76.5
37.134.528.5
62.637.4
12.036.7
49.7
26.6
50.3
36.5
68.7
60.7
0.7
34.416.9
63.5
22.7
37.6
Heavy users* Global heavy users*

Shop the World 70
“CUSTOMER JOURNEY“ SEARCHING FOR PRODUCT INFORMATIONSearch for product information · Canada in % * Globally
29.9 35.5
53.2
22.4 23.4
27.4 44.2
20.4 23.9
49.4 45.8
39.0 42.5
17.0 25.1
11.3 15.1
15.1
9.7
37.8
Criteria for choosing a vendor· Canada in % *
Globally
Search engines 52.9
Customer ratings in blogs or forums
Product test ratings / expert test reports
Product check in a retail store
Retailer or manufacturer website
Online marketplace
Catalog
Mail advertising
Social media platforms such as Facebook and Twitter
Apps (on smartphone, iPad, or tablet)
Recommendations from friends, acquaintances, and colleagues
40.6Customer ratings on the supplier’s website
Price comparison sites
Large selection of products
Recommendation and experiences of friends, acquaintances, and colleagues
Official test seals, reviews, and test reports of independent institutions
Attractive product line
Favorable prices, promotions, & special offers
Straightforward return process
Free returns
Choice of preferred payment methods
Fast delivery
Free delivery
Good customer service
Positive customer ratings on the internet
11.1 13.7
20.7
9.1 8.8
18.0 26.6
15.8 14.9
55.9 51.7
10.6 12.9
18.6 20.8
24.0 22.6
23.1 25.7
51.7 45.2
18.7 18.5
20.9
The own opinion countsCanadians care less about other people‘s opinions: Customer ratings, recommendations and price comparison sites are used below global average.
* Source: DHL Global Mail 2013 ∙ n Global from 9,386 to 10,617 ∙ n Canada from 369 to 451, multiple mentioning
Country information Canada Country profile · Media Use · Distance selling · “Customer jour-ney“ · Drivers & barriers in distance selling · Cross-border shopping · Dialog marketing
12.0
7.1
32.8
36.4

Shop the World 71
Usefulness of advertising media · in % *, **
5 and 63 and 41 and 2
Ø
43.731.1 25.226.1 43.8 30.1
Online advertising
* Source: DHL Global Mail 2013 ∙ n Global from 10,218 to 10,384 ∙ n Canada from 423 to 437 ** scale from 1 "absolutely not useful“ to 6 very useful“
Critical target group
Canadian consumers are slight-ly more critical when it comes to advertising media. Only search engines are considered to be usefull by two thirds of respondents.
ACCEPTANCE OF ADVERTISING MEDIA
Canada Globally
Country information Canada Country profile · Media Use · Distance selling · “Customer jour-ney“ · Drivers & barriers in distance selling · Cross-border shopping · Dialog marketing
Television advertising
5 and 63 and 41 and 2
3.33.6
Ø
38.938.1 23.030.6 41.8 27.6
3.13.4
41.540.6 17.938.7 40.4 20.9Social media
Canada Globally
Advertising letters
3.03.1
38.337.8 23.933.9 37.6 28.5
3.13.4
Product suggestions in online shops
47.222.1 30.818.9 45.1 36.0
3.63.9
30.46.4 63.26.5 28.7 64.8
4.74.8
41.516.7 41.89.1 31.7 59.1
4.04.6
44.727.8 27.529.9 43.9 26.2
Canada Globally
Household advertising
3.53.4
38.339.4 22.329.0 46.7 24.3
Canada Globally
Advertisements in mag- azines and periodicals
3.13.4
41.237.7 21.134.8 43.1 22.1
Canada Globally
Advertisements in newspapers
3.13.2
31.252.5 16.441.8 40.7 17.6
Canada Globally
Billboard advertise-ments
2.73.0
36.248.5 15.344.3 38.8 16.9
Canada Globally
Radio
2.82.9
41.822.1 36.119.3 44.2 36.6
Canada Globally
Catalogs from vendors
3.73.9
Canada Globally
Canada Globally
Canada Globally
Internet search engines
Canada Globally
Price comparison sites
Canada Globally

Shop the World 72
15.4 31.216.8 36.6
Use of different suppliers · in % *
Online marketplace
Mail order company from which I received a catalog
Merchant who advertises on TV
Never Seldom Frequently / very frequently
Occasionally
Online shop of a manufaturer or
retailer
* Source: DHL Global Mail 2013 ∙ n Global from 9,270 to 9,446 ∙ n Canada from 362 to 371
Canada Global
Online PC
Online mobile (tablet, smartphone)
By telephone
In writing (by post, fax)
By email
Order in store & delivery to home
73.6
4.3
1.5
6.1
75.0
3.2
2.1
4.4
“CUSTOMER JOURNEY“ – PLACING ORDERSOnline orders preferred
For 73.6% of Canadian dis- tance selling clients, the PC is the most common medium for placing orders. Only 7.4% order via mobile devices, which is sig-nificantly lower than the global average. Online marketplaces play an important role, and are used frequently to very fre-quently by 50% of Canadian dis- tance selling clients. However, dispatchers who advertise their products on television struggle in the Canadian target group. 72% claim never to have used a TV shopping channel. Tradi- tional catalogs are also not common in Canada, 50% never use this method of ordering.
13.6 24.519.2 42.6
Canada
Globally
15.4 46.99.3
9.9 54.38.7
28.4
27.0
50.6 6.921.4
38.5 12.622.8
21.1
26.1
71.9 4.413.5
60.2 6.617.6
10.2
15.7
10.5
4.8
Order channels· in % *
Country information Canada Country profile · Media Use · Distance selling · “Customer jour-ney“ · Drivers & barriers in distance selling · Cross-border shopping · Dialog marketing
7.4
7.1
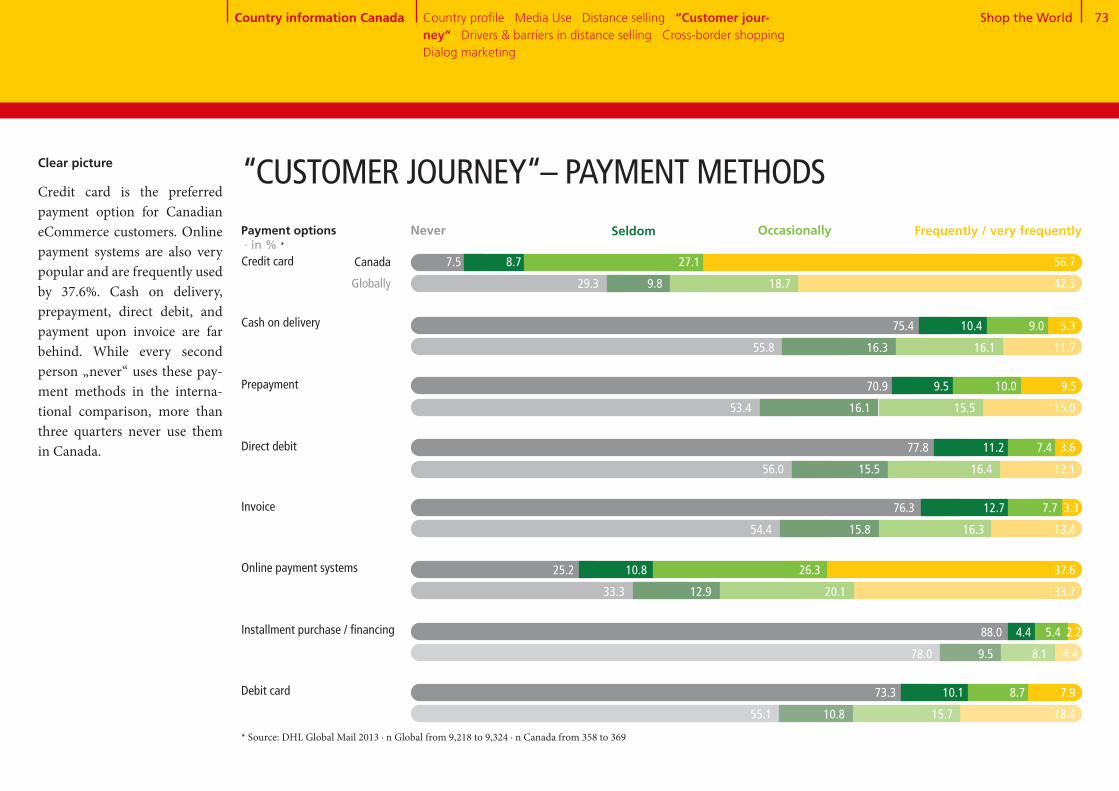
Shop the World 73
Clear picture
Credit card is the preferred payment option for Canadian eCommerce customers. Online payment systems are also very popular and are frequently used by 37.6%. Cash on delivery, prepayment, direct debit, and payment upon invoice are far behind. While every second person „never“ uses these pay-ment methods in the interna-tional comparison, more than three quarters never use them in Canada.
Cash on delivery
Prepayment
Direct debit
Credit card
* Source: DHL Global Mail 2013 ∙ n Global from 9,218 to 9,324 ∙ n Canada from 358 to 369
“CUSTOMER JOURNEY“– PAYMENT METHODS
Online payment systems
Installment purchase / financing
Debit card
Invoice
Payment options · in % *
Never Seldom Frequently / very frequentlyOccasionally
Canada
Globally
7.5 8.7 27.1 56.7
29.3 9.8 18.7 42.3
75.4 10.4 9.0 5.3
55.8 16.3 16.1 11.7
70.9 9.5 10.0 9.5
53.4 16.1 15.5 15.0
77.8 11.2 7.4 3.6
56.0 15.5 16.4 12.1
76.3 12.7 7.7 3.3
54.4 15.8 16.3 13.4
25.2 10.8 26.3 37.6
33.3 12.9 20.1 33.7
88.0 4.4 5.4 2.2
78.0 9.5 8.1 4.4
73.3 10.1 8.7 7.9
55.1 10.8 15.7 18.4
Country information Canada Country profile · Media Use · Distance selling · “Customer jour-ney“ · Drivers & barriers in distance selling · Cross-border shopping · Dialog marketing
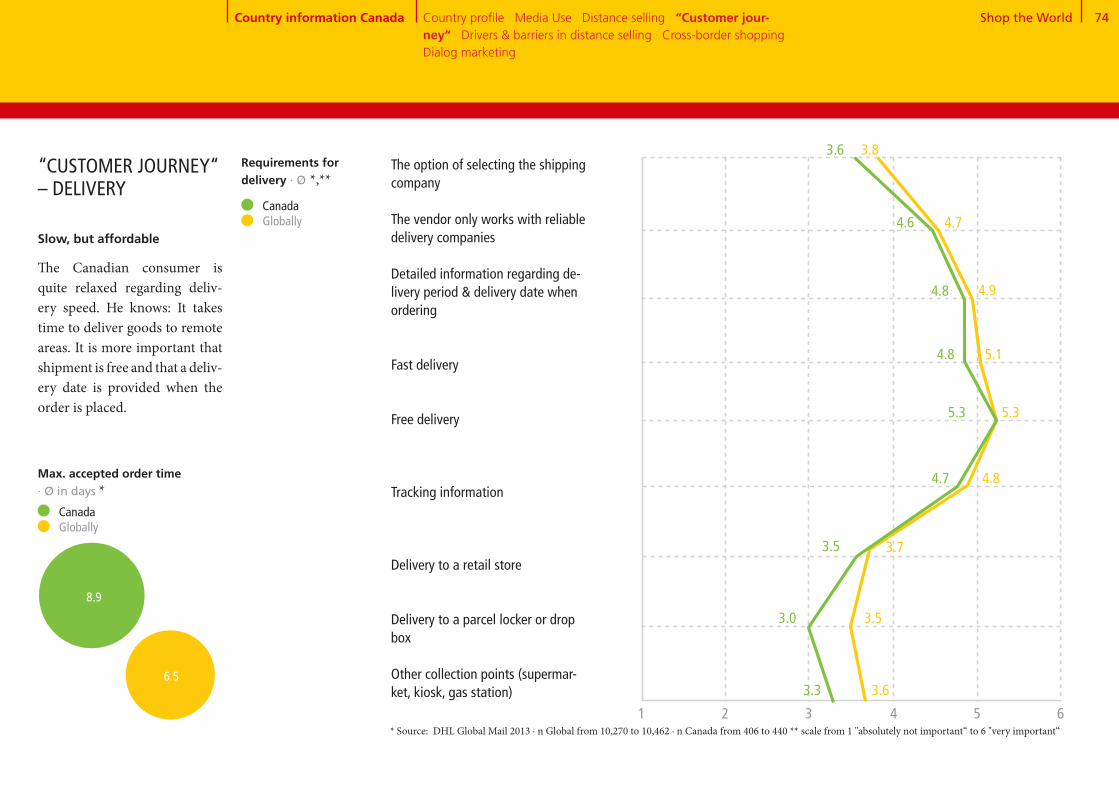
Shop the World 74
Canada Globally
The option of selecting the shipping company The vendor only works with reliable delivery companies
Detailed information regarding de-livery period & delivery date when ordering
Fast delivery
Free delivery
Tracking information
Delivery to a retail store
Delivery to a parcel locker or drop box
Other collection points (supermar-ket, kiosk, gas station) 3.3
3.0
3.5
5.3
4.7
4.8
3.6
4.8
4.6
Max. accepted order time · Ø in days *
3.6
3.5
3.7
5.3
4.8
5.1
3.8
4.9
4.7
* Source: DHL Global Mail 2013 ∙ n Global from 10,270 to 10,462 ∙ n Canada from 406 to 440 ** scale from 1 "absolutely not important“ to 6 "very important“
Slow, but affordable
The Canadian consumer is quite relaxed regarding deliv- ery speed. He knows: It takes time to deliver goods to remote areas. It is more important that shipment is free and that a deliv- ery date is provided when the order is placed.
“CUSTOMER JOURNEY“ – DELIVERY
1 2 3 4 5 6
Requirements for delivery · Ø *,**
Country information Canada Country profile · Media Use · Distance selling · “Customer jour-ney“ · Drivers & barriers in distance selling · Cross-border shopping · Dialog marketing
8.9
6.5
Canada Globally
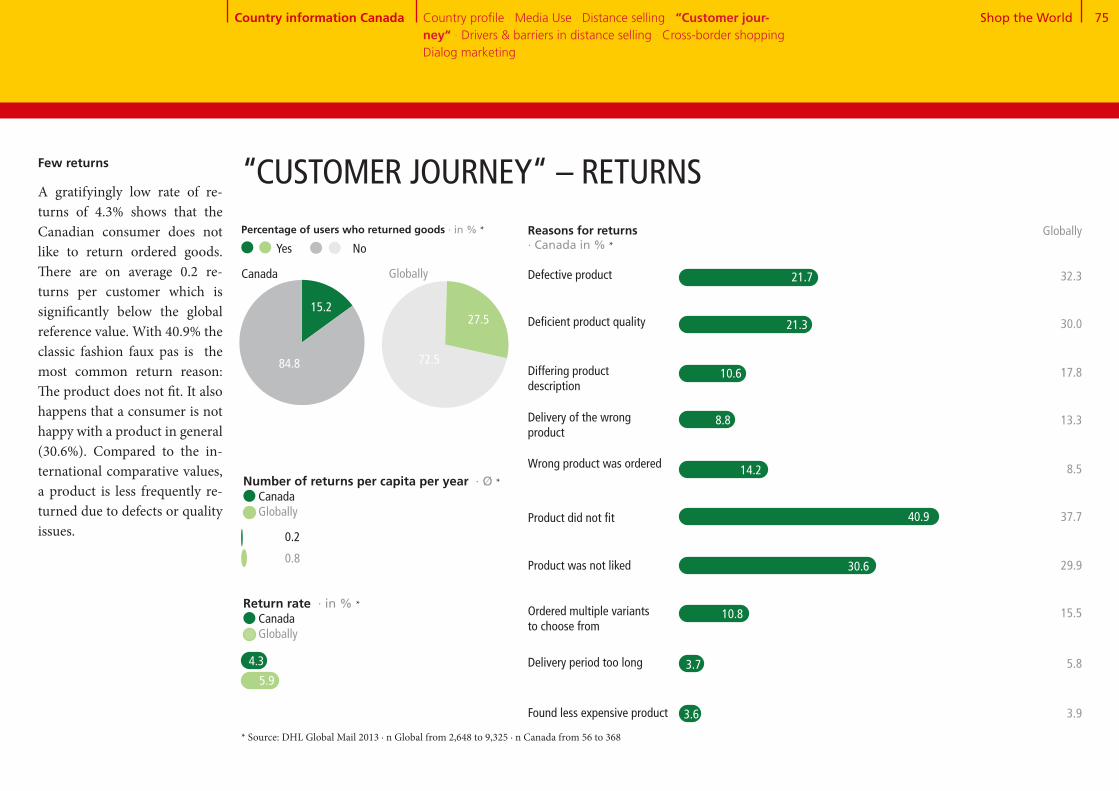
Shop the World 75
15+85
72+28
Number of returns per capita per year · Ø * Canada Globally
0.8
0.2
Return rate · in % * Canada Globally
5.9
Reasons for returns · Canada in % *
Defective product 21.7
Percentage of users who returned goods · in % *
15.2
84.8
Canada Globally
Yes No
“CUSTOMER JOURNEY“ – RETURNSFew returns
A gratifyingly low rate of re-turns of 4.3% shows that the Canadian consumer does not like to return ordered goods. There are on average 0.2 re-turns per customer which is significantly below the global reference value. With 40.9% the classic fashion faux pas is the most common return reason: The product does not fit. It also happens that a consumer is not happy with a product in general (30.6%). Compared to the in-ternational comparative values, a product is less frequently re-turned due to defects or quality issues.
27.5
72.5
* Source: DHL Global Mail 2013 ∙ n Global from 2,648 to 9,325 ∙ n Canada from 56 to 368
Differing product description
Delivery of the wrong product
Wrong product was ordered
Product did not fit
Ordered multiple variants to choose from
Delivery period too long
Found less expensive product
Deficient product quality
Product was not liked
10.6
8.8
40.9
30.6
10.8
3.7
3.6
Globally
32.3
30.0
17.8
13.3
8.5
37.7
29.9
15.5
5.8
3.9
21.3
14.2
Country information Canada Country profile · Media Use · Distance selling · “Customer jour-ney“ · Drivers & barriers in distance selling · Cross-border shopping · Dialog marketing
4.3
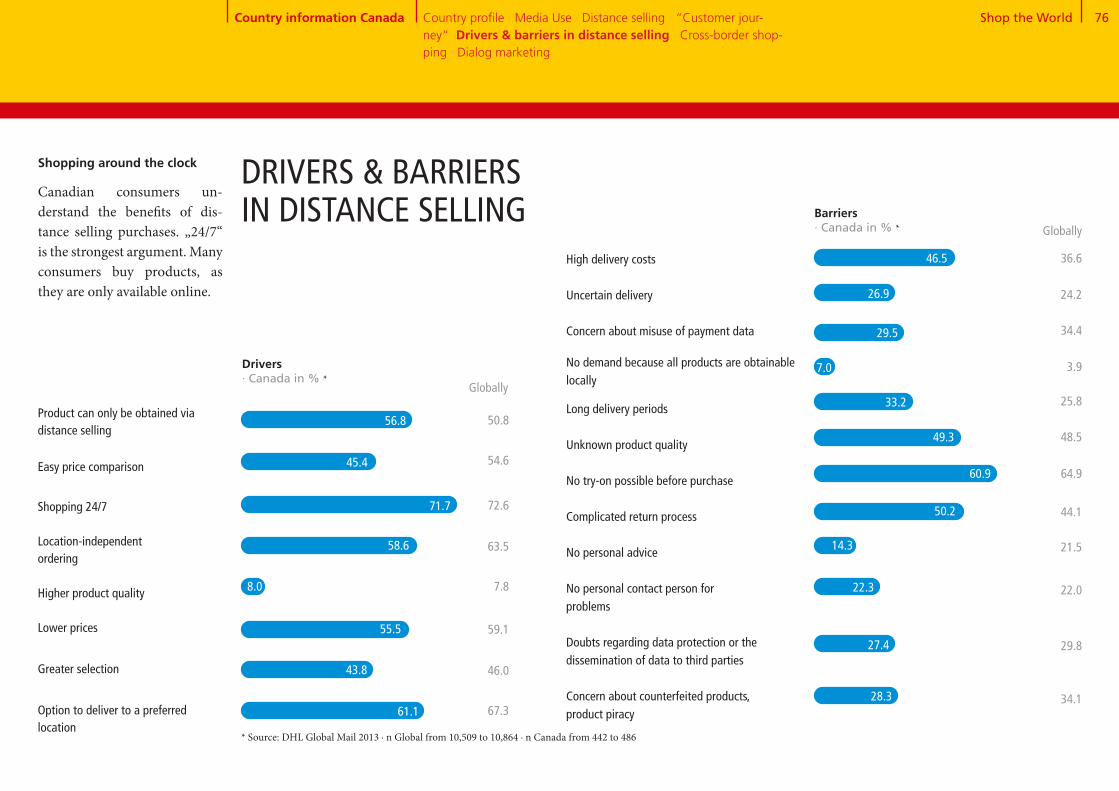
Shop the World 76
High delivery costs
Uncertain delivery
Concern about misuse of payment data
No demand because all products are obtainable locally
Long delivery periods
Unknown product quality
No try-on possible before purchase
Complicated return process
No personal advice
No personal contact person for problems
Doubts regarding data protection or thedissemination of data to third parties
Concern about counterfeited products, product piracy
Product can only be obtained via distance selling
Easy price comparison
Shopping 24/7
Location-independent ordering
Higher product quality
Lower prices
Greater selection
Option to deliver to a preferred location
DRIVERS & BARRIERS IN DISTANCE SELLING Barriers
· Canada in % *
50.8
54.6
72.6
63.5
7.8
59.1
46.0
67.3
55.5
43.8
61.1
Globally
36.6
24.2
34.4
3.9
25.8
48.5
64.9
44.1
21.5
22.0
29.8
34.1
Shopping around the clock
Canadian consumers un-derstand the benefits of dis- tance selling purchases. „24/7“ is the strongest argument. Many consumers buy products, as they are only available online.
Drivers · Canada in % *
Globally
* Source: DHL Global Mail 2013 ∙ n Global from 10,509 to 10,864 ∙ n Canada from 442 to 486
56.8
45.4
71.7
58.6
8.0
46.5
26.9
29.5
7.0
33.2
49.3
60.9
50.2
14.3
22.3
27.4
28.3
Country information Canada Country profile · Media Use · Distance selling · “Customer jour-ney“· Drivers & barriers in distance selling · Cross-border shop-ping · Dialog marketing

Shop the World 77
61+16+23CROSS-BORDER SHOPPING – OVERVIEW
Previous orders abroad
Previous and future orders abroad by country · in % *
Hong Kong[28.9]
Japan[14.9]
1
2
3
4
5
USA[82.1]
China[41.2]
Great Britain[29.0]
Future orders abroad
Canada
* Source: DHL Global Mail 2013 ∙ n Global from 4,738 to 8,807 ∙ n Canada from 265 to 410 ** split into "further orders planned“ 60 % Canada and "no further orders planned" 1.2 % Canada
Experienced customers
Cross-border shopping is com-monly used in Canada. 61.2 % of consumers have ordered from abroad, exeeding the glob- al benchmark of 51.2%. En- glish-speaking countries like the US and Great Britain are especially popular. Orders are also placed with suppliers in Asia, primarily China and Hong Kong.
Hong Kong[39.0]
France[35.2]
USA[89.7]
Great Britain[47.7]
China[45.0]
Country information Canada Country profile · Media Use · Distance selling · “Customer jour-ney“· Drivers & barriers in distance selling · Cross-border shop-ping · Dialog marketing
Use of cross-border eCommerce · in % *
Yes, already ordered **No, but future orders planned No, no future orders planned
16.0
61.2 22.7

Shop the World 78
Products not obtainable domestically
Higher quality of the products
Lower prices
Greater selection
Assurance against product counter-
feiting
High delivery costs Language problems
Customs clearance
Non-transparent costs
Uncertainty with problems
No demand because all products are obtainable locally
Long delivery times
Unknown product quality
Complicated return process
Concerns regarding data protection Fear of fraud Uncertain delivery
Concern about misuse of payment data
Uncertainty regarding warranty terms, payment process, legal situation, etc.
Drivers for ordering abroad· Canada in % *
Barriers to ordering abroad · Canada in % *
Globally
73.3
24.2
62.9
41.2
11.7
Globally
53.7
31.6
41.3
41.3
33.3
12.5
56.1
35.7
50.8
24.5
41.6
39.5
31.6
39.3
Top prices and best selection
Canadians order from abroad, mainly because products are not available domestically or because they expect lower prices. High delivery costs and long delivery times speak against ordering from abroad. Another barrier is the more dif-ficult process involved in prod-uct returns.
CROSS-BORDER SHOPPING – DRIVERS & BARRIERS
* Source: DHL Global Mail 2013 ∙ n Global from 7,289 to 10,689 ∙ n Canada from 328 to 476
52.9
28.4
42.3
39.8
31.4
14.0
55.4
46.1
49.5
23.4
44.2
38.0
29.2
34.3
63.7
12.6
69.1
45.9
5.8
Country information Canada Country profile · Media Use · Distance selling · “Customer jour-ney“· Drivers & barriers in distance selling · Cross-border shop-ping · Dialog marketing

Shop the World 79
Receipt of mailings and catalogs · Canada in % *
5 and 63 and 41 and 2
DIALOG MARKETING
Reading mailings and catalogs · in % *,**
Canada
Globally
25.6 39.3 35.1
22.1 35.2 42.7
5 and 63 and 41 and 2
Response to mailings and catalogs · in % *,**
Canada
Globally
37.3 44.5 18.2
29.0 45.8 25.3
Response channel for mailings and catalogs · Canada in % * Globally
Website visits
Visits to stores or
branch offices
Other online
response (e.g. chat,
Twitter, Facebook,
newsletter
registration, etc.)
Phone call
Business reply card
64.4 73.4
48.6
30.0
24.5
18.4
12.6
* Source: DHL Global Mail 2013 ∙ n Global from 8,788 to 11,265 ∙ n Canada from 366 to 512 ** scale from 1 "never“ to 6 "almost always“
Cautious response behavior
In Canada, mailings or catalogsare less common: 16% never receive advertisements in their letterbox. Canadians read and respond to direct marketing initiatives less often than the global average. By far the most common response channel is visiting the provider‘s website. Clients also pay a visit to the local store.
Globally
One or more times per week
One or more times per month
Less than once per month
Never
26.9
33.7
27.7
11.6 53.5
24.2
16.7
15.9
12.3
25.6
28.3
30.7
15.5
Country information Canada Country profile · Media Use · Distance selling · “Customer jour- ney“ · Drivers & barriers in distance selling · Cross-border shop- ping · Dialog marketing

Country Information China
Mandy
Chinese consumers love eCommerce. They are young, urban, and mobile. Quality and autentic- ity of products are important.

Shop the World 81Country profile · Media Use · Distance selling · “Customer jour-ney“ · Drivers & barriers in distance selling · Cross-border shopping · Dialog marketing
273.5Population 0 - 15 years
The Chinese economy * COUNTRY PROFILE CHINA
Shanghai 19,554
Beijing 14,999
* Source: Fischer World Almanac 2014, Germany Trade & Invest ** Source: Metropolitan areas with 1 million inhabitants and more; United Nations, Department of Economic and Social Affairs, Po-pulation Division (2012). World Urbanization Prospects: The 2011 Revision, CD-ROM Edition. *** Source: Copyright © IHS, 2013. All rights reserved **** Source: Copyright © IHS, 2013. All rights reserved
Number of households Ø Household sizeUnemployment rateInflation rate
7.7
Economic growth · in % ****
>
>
7.7
9.3
2011 2012 2013
Age distribution · 2013 in mn.
Population 65 years and older
Population, total · 2013 in mn. 1,353.6 ***
Country information China
Population 16 - 64 years
· 2013 in mn.· 2013· 2013 in %· 2013 in %
344.0 3.94.12.6
In 2012, economic growth in China fell well short of the growth rates from previ-ous years. Last year the Chi- nese economy remained stable and registered a 7.7% growth. The third session of the 18th Communist Party Conference laid the foundations for great- er economic activity. The de- clared aim was to change from an investment and export- driven economy to an economy based predominantly on domes- tic consumption. To achieve this, key requirements are the development of pension and health insurance schemes and consolidation of purchasing power in the less developed ru-ral regions.
963.9
116.2
Shenzhen 10,222
Tianjin 8,535
Guangdong 7,160
Chengdu 6,397
Guangdong 10,486
Wuhan 8,904
Chongqing 9,732
The ten largest conurbations in China · 2011 in thousand. **
Foshan6,208

Shop the World 82
40+4+1+14+23+16+2MEDIA USE IN CHINA
13.0
81.3
Smartphone market penetration · in % *****Representative domestic population 16+, n = 1,000
33.1
Internet users · 2012 per 100 people **
Permanent access to broadband internet · 2012 per 100 people ***
Cellphones · 2012 per 100 people ****
2012 2013
46.9
Share of adspend by medium · in % *
TV Radio Movies Outdoor advertising
Total advertising expenditure · in EUR bn. *
Internet Newspapers Magazines
>>
* Source: Zenith Optimedia, 2013 ** Source: Copyright © IHS, 2013. All rights reserved *** Source: The World Bank **** Source: Copyright © IHS, 2013. All rights reserved **** Source: Our Mobile Planet: Google Global Smart phone Study 2013, http://www.thinkwithgoogle.com/mobileplanet/
2011 2012 2013 2014 2015
39.9
42.3
35.7
31.9
29.0
26.2
2016
44.8
Country information China
23.3
15.62.2
14.50.24.3
39.9
Internet use
In China, the internet is a recently acquired freedom for independent communication. Chinese consumers are spend-ing more and more time on the internet and social media sites, and are very enthusiastic about mobile communication. None- theless, the majority of internet users are located in the coastal regions and larger cities.
Strong market in the fast lane
The third largest global advertis- ing market continues to grow at an impressive rate of 12% per year and will move into secondplace behind the USA by 2016. The internet will replace TV as the dominant medium within the next three years. The main drivers behind this growth are online videos and mobile ad-vertisement.
Country profile · Media Use · Distance selling · “Customer jour-ney“ · Drivers & barriers in distance selling · Cross-border shopping · Dialog marketing
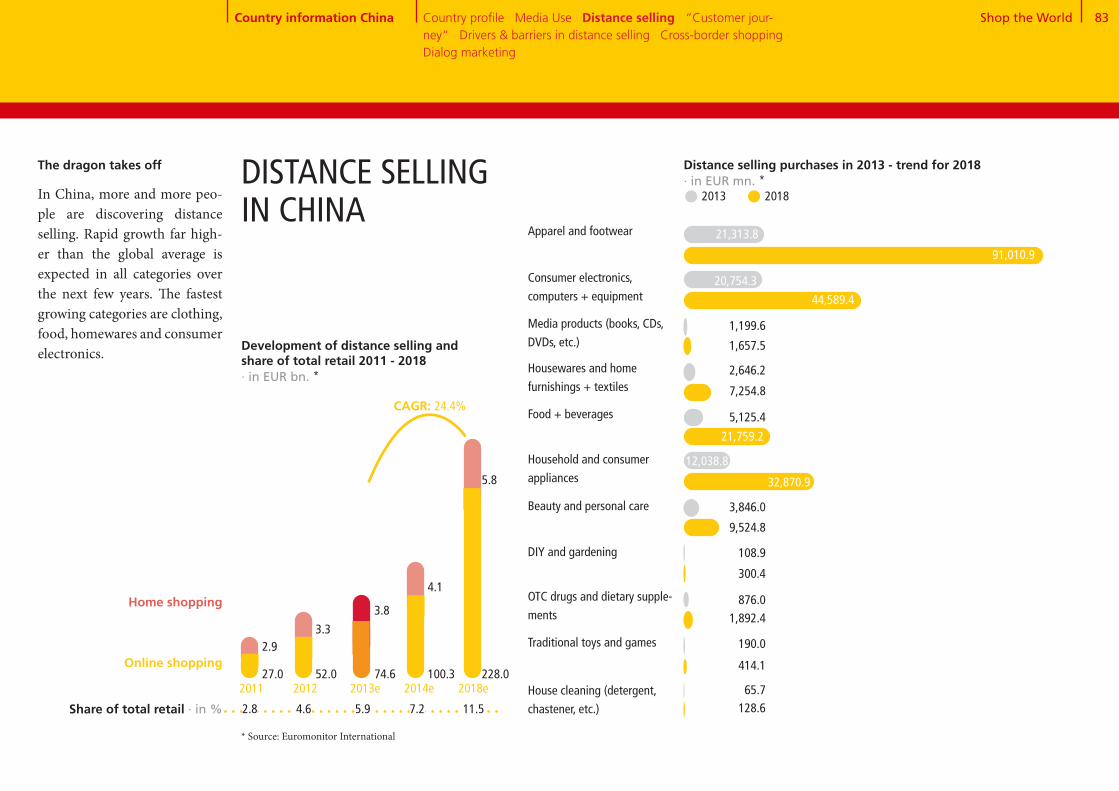
Shop the World 83Country profile · Media Use · Distance selling · “Customer jour-ney“ · Drivers & barriers in distance selling · Cross-border shopping · Dialog marketing
Distance selling purchases in 2013 - trend for 2018 · in EUR mn. * 2013 2018
Apparel and footwear
Consumer electronics,
computers + equipment
Media products (books, CDs,
DVDs, etc.)
Housewares and home
furnishings + textiles
Food + beverages
Household and consumer
appliances
Beauty and personal care
DIY and gardening
OTC drugs and dietary supple-
ments
Traditional toys and games
House cleaning (detergent,
chastener, etc.)
The dragon takes off
In China, more and more peo-ple are discovering distance selling. Rapid growth far high-er than the global average is expected in all categories over the next few years. The fastest growing categories are clothing, food, homewares and consumer electronics.
91,010.9
44,589.4
20,754.3
1,657.5
1,199.6
7,254.8
2,646.2
21,759.2
12,038.8
32,870.9
9,524.8
300.4
108.9
876.0
414.1
190.0
128.6
Development of distance selling and share of total retail 2011 - 2018 · in EUR bn. *
CAGR: 24.4%
Home shopping
Online shopping27.0 52.0 74.6
2.93.3
3.8
100.3 228.0
4.1
5.8
2011 2012 2013e 2014e 2018e
Share of total retail · in % 2.8 4.6 5.9 7.2 11.5
* Source: Euromonitor International
21,313.8
65.7
Country information China
5,125.4
3,846.0
1,892.4
DISTANCE SELLING IN CHINA
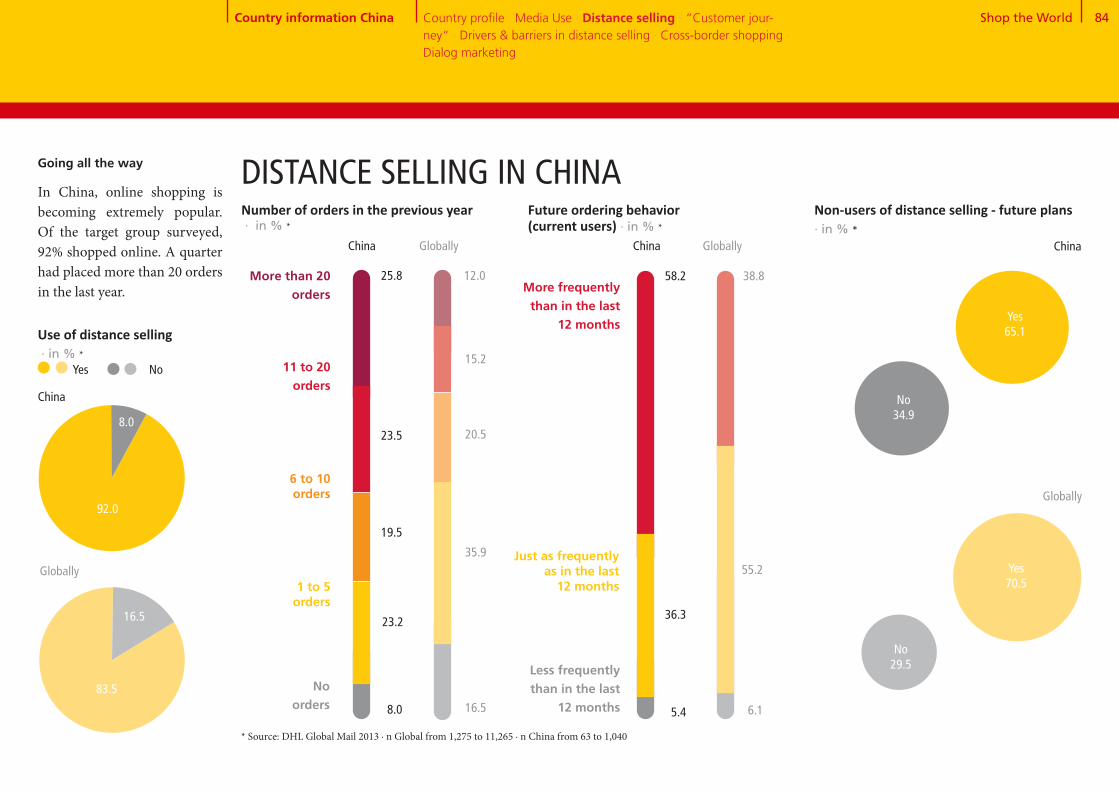
Shop the World 84
Non-users of distance selling - future plans · in % *
92+884+16
Going all the way
In China, online shopping is becoming extremely popular. Of the target group surveyed, 92% shopped online. A quarter had placed more than 20 orders in the last year.
Use of distance selling · in % *
92.0
8.0
China
Globally
83.5
16.5
Number of orders in the previous year · in % *
1 to 5 orders
6 to 10 orders
11 to 20 orders
No orders
19.5
23.2
23.5
8.0
25.8
20.5
35.9
15.2
16.5
12.0
Future ordering behavior (current users) · in % *
More frequently than in the last
12 months
Just as frequently as in the last
12 months
Less frequently than in the last
12 months
36.3
58.2
55.2
38.8
5.4 6.1
Yes65.1
China
Globally
Yes70.5
No34.9
No29.5
Yes No
China Globally China Globally
DISTANCE SELLING IN CHINA
* Source: DHL Global Mail 2013 ∙ n Global from 1,275 to 11,265 ∙ n China from 63 to 1,040
Country information China Country profile · Media Use · Distance selling · “Customer jour-ney“ · Drivers & barriers in distance selling · Cross-border shopping · Dialog marketing
More than 20 orders

Shop the World 85
Globally*
50.3
Gender · in % Male Female
Age · in % <30 yrs. 30-49 yrs. 50 yrs. +
Occupation · in % Employed Unemployed
Education · in % Lower educational level Medium and higher level of education
Media affinity: Online · in % yes**
Community size · in % Rural (<50,000 inhabitants) Non-rural/urban (>50,000 inhabitants)
Minors in the household · Ø
Household type · in % Single 2-person household without children Household with children Household with 3 adults
Mobile Internet usage · in % Yes No
Gross household income · in % Low income Medium income High income
Media affinity: Classic · in % yes**
Media affinity: Dialog marketing · in % yes** 40.3
45.1
88.4
35.542.4
22.1
39.260.8
30.856.8
57.0
33.3
43.0
10.7
99.6
86.3
0.6
9.43.0
89.3
Particularly heavy users
Online shopping in China is very different from the average behaviour worldwide. This can be seen in the number of heavy users. They are predominantly women (57%), younger, with a higher level of education. Members of this target group live almost exclusively in urban centers due to the enormous conurbations in China.The household structure is fam- ily-oriented. Two further trends are worth noting: The increased use of mobile internet (60.8%) and the strong affinity to classic media (45.1%).
DISTANCE SELLING IN CHINA
* Source: DHL Global Mail 2013 ∙ n Global from 2,661 to 11,265 ∙ n China from 248 to 1,040 ** media affinity for online / classic / dialog marketing, if at least one medium from the respective area was rated 5 or 6 on a scale of 1 "absolutely not useful" to 6 "very useful" *** the top third of most active mail order users
44.327.1
14.4
36.4
46.9
36.5
80.8
33.734.232.1
45.754.3
22.443.0
50.0
28.6
50.0
29.4
85.6
63.6
0.7
23.411.2
70.6
Country information China
***
China*
46.722.1
0.8
18.7
43.0
47.1
84.3
29.138.332.6
49.950.1
33.553.3
48.2
31.1
51.8
16.3
99.2
81.3
0.6
10.82.4
83.7
16.3
13.7
Heavy users* Global heavy users*
0.4
Country profile · Media Use · Distance selling · “Customer jour-ney“ · Drivers & barriers in distance selling · Cross-border shopping · Dialog marketing

Shop the World 86
Search engines
Customer ratings in blogs or forums
Product test ratings / expert test reports
Product check in a retail store
Retailer or manufacturer website
Online marketplace
Catalog
Mail advertising
Social media platforms such as Facebook and Twitter
Apps (on smartphone, iPad, or tablet)
Recommendations from friends, acquaintances, and colleagues
Price comparison sites
Large selection of products
Recommendation and experiences of friends, acquaintances, and colleagues
Official test seals, reviews, and test reports of independent institutions
Attractive product line
Favorable prices, promotions, & special offers
Straightforward return process
Free returns
Choice of preferred payment methods
Fast delivery
Free delivery
Good customer service
Positive customer ratings on the internet
Country profile · Media Use · Distance selling · “Customer jour-ney“ · Drivers & barriers in distance selling · Cross-border shopping · Dialog marketing
“CUSTOMER JOURNEY“ – SEARCHING FOR PRODUCT INFORMATION
Search for product information · China in % * Globally
30.0 35.5
53.2
21.4 23.4
51.0 44.2
32.1 23.9
34.0 45.8
59.8 42.5
18.2 25.1
15.1 15.1
20.5 15.1
20.2 9.7
50.9 37.8
Criteria for choosing a vendor · China in % *
Globally
45.3
50.1 40.6Customer ratings on the supplier‘s website
22.6 13.7
20.7
10.5 8.8
47.3 26.6
24.5 14.9
52.4 51.7
12.9 12.9
21.3 20.8
9.4 22.6
15.9 25.7
32.9 45.2
18.6 18.5
19.5
Word of mouth
Chinese consumers usually search for product informa- tion on online marketplaces and price comparison websites. They also attach great impor- tance to personal recommenda-tions.
* Source: DHL Global Mail 2013 ∙ n Global from 9,386 to 10,617 ∙ n China from 953 to 1,004, multiple mentioning
Country information China

Shop the World 87Country profile · Media Use · Distance selling · “Customer jour-ney“ · Drivers & barriers in distance selling · Cross-border shopping · Dialog marketing
Usefulness of advertising media · in % *, **
5 and 63 and 41 and 2
Ø
46.118.7 35.226.1 43.8 30.1
Online advertising
* Source: DHL Global Mail 2013 ∙ n Global from 10,218 to 10,384 ∙ n China from 979 to 994 ** scale from 1 "absolutely not useful" to 6 "very useful"
Broad acceptance
Compared to the global average, a larger proportion of Chinese consumers found advertising media useful. Users considered online media such as online ad-vertising, social media or even recommendations in online shops most helpful when search- ing for information.
China Globally
Country information China
Television advertising
5 and 63 and 41 and 2
3.83.6
Ø
51.317.3 31.430.6 41.8 27.6
3.83.4
47.825.5 26.738.7 40.4 20.9Social media
China Globally
Advertising letters
3.53.1
47.813.9 38.333.9 37.6 28.5
4.03.4
Product suggestions in online shops
42.57.5 50.018.9 45.1 36.0
4.43.9
32.05.4 62.66.5 28.7 64.8
4.74.8
30.95.3 63.89.1 31.7 59.1
4.74.6
48.826.7 24.529.9 43.9 26.2
China Globally
Household advertising
3.43.4
51.118.7 30.229.0 46.7 24.3
China Globally
Advertisements in mag- azines and periodicals
3.73.4
48.823.8 27.434.8 43.1 22.1
China Globally
Advertisements in newspapers
3.63.2
53.119.9 27.041.8 40.7 17.6
China Globally
Billboard advertise-ments
3.63.0
48.026.4 25.744.3 38.8 16.9
China Globally
Radio
3.52.9
50.317.3 32.419.3 44.2 36.6
China Globally
Catalogs from vendors
3.83.9
China Globally
China Globally
China Globally
Internet search engines
China Globally
Price comparison sites
China Globally
ACCEPTANCE OF ADVERTISING MEDIA

Shop the World 88Country profile · Media Use · Distance selling · “Customer jour-ney“ · Drivers & barriers in distance selling · Cross-border shopping · Dialog marketing
Online PC
Online mobile (tablet, smartphone)
By telephone
In writing (by post, fax)
By email
Order in store & delivery to home
“CUSTOMER JOURNEY“ – PLACING ORDERS
Online marketplace
Merchant who advertises on TV
Use of different suppliers · in % *
Mail order company from which I received a catalog
Never Frequently / very frequently
Occasionally
Online shop of a manufaturer or retailer
* Source: DHL Global Mail 2013 ∙ n Global from 9,270 to 9,446 ∙ n China from 943 to 955
China Global
76.8
2.2
1.2
2.0
75.0
3.2
2.1
4.4
Welcome to Alibaba
Online shoppers primarly place orders online, whether via PC (76.8%) or mobile devices (14.6%). The ubiquitous eCom-merce giant Alibaba dominates the market with its tmall shop- ping website. The large majorityof providers has a shop there or on one of the smaller online marketplaces – however, in- dependent online shops are less common in China.Compared to the average world-wide, offline channels are seldom used to place or-ders, and catalogs are also used far less than the global average. Merchants who advertise their products on TV are slightly more popular in China: only 53% of those surveyed had not recently placed an order via this channel.
16.3 28.817.4
15.4 31.216.8
37.5
36.6
China
Globally
1.7 87.02.2
9.9 54.38.7
9.1
27.0
46.0 7.523.0
38.5 12.622.8
23.5
26.1
53.0 8.618.8
60.2 6.617.6
19.6
15.7
14.6
10.5
3.1
4.8
Order channels · in % *
Country information China
Seldom
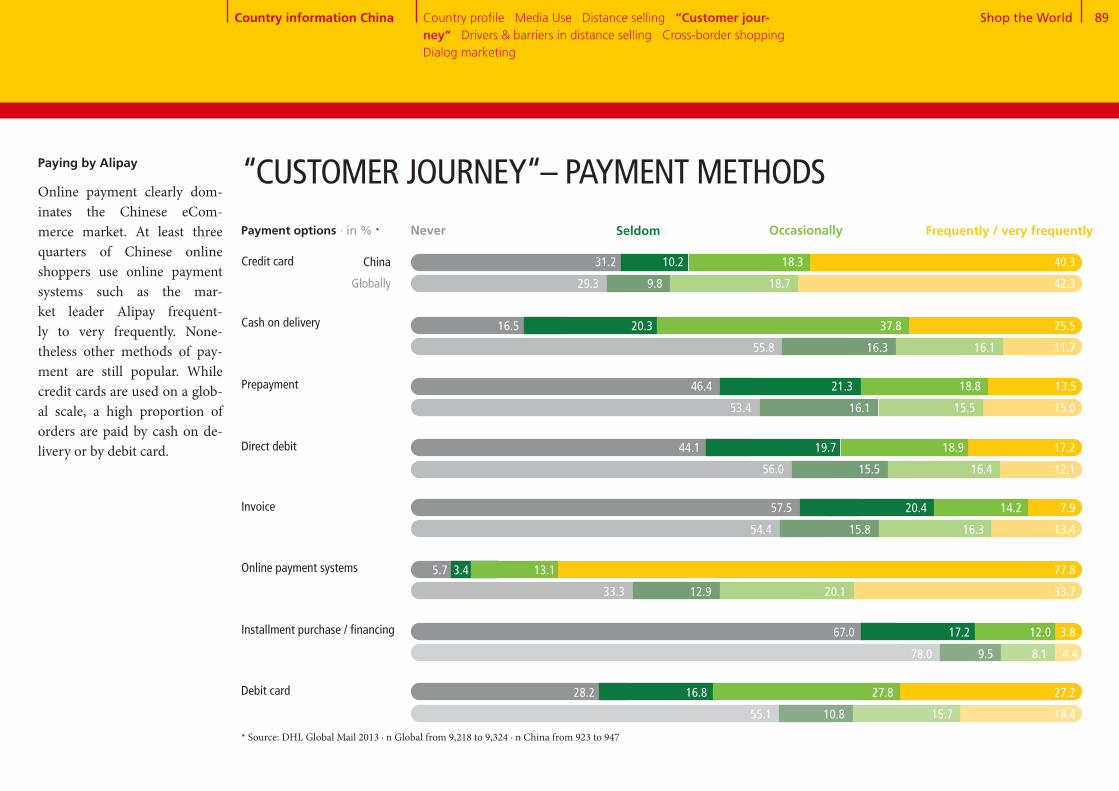
Shop the World 89Country profile · Media Use · Distance selling · “Customer jour-ney“ · Drivers & barriers in distance selling · Cross-border shopping · Dialog marketing
Paying by Alipay
Online payment clearly dom- inates the Chinese eCom-merce market. At least three quarters of Chinese online shoppers use online payment systems such as the mar-ket leader Alipay frequent-ly to very frequently. None- theless other methods of pay-ment are still popular. While credit cards are used on a glob- al scale, a high proportion of orders are paid by cash on de-livery or by debit card.
Cash on delivery
Prepayment
Direct debit
Credit card
* Source: DHL Global Mail 2013 ∙ n Global from 9,218 to 9,324 ∙ n China from 923 to 947
“CUSTOMER JOURNEY“– PAYMENT METHODS
Online payment systems
Installment purchase / financing
Debit card
Invoice
Payment options · in % * Never Frequently / very frequentlyOccasionally
China
Globally
31.2 10.2 18.3 40.3
29.3 9.8 18.7 42.3
16.5 20.3 37.8 25.5
55.8 16.3 16.1 11.7
46.4 21.3 18.8 13.5
53.4 16.1 15.5 15.0
44.1 19.7 18.9 17.2
56.0 15.5 16.4 12.1
57.5 20.4 14.2 7.9
54.4 15.8 16.3 13.4
5.7 3.4 13.1 77.8
33.3 12.9 20.1 33.7
67.0 17.2 12.0 3.8
78.0 9.5 8.1 4.4
28.2 16.8 27.8 27.2
55.1 10.8 15.7 18.4
Country information China
Seldom

Shop the World 90
The option of selecting the shipping company The vendor only works with reliable delivery companies
Detailed information regarding de-livery period & delivery date when ordering
Fast delivery
Free delivery
Tracking information
Delivery to a retail store
Delivery to a parcel locker or drop box
Other collection points (supermar-ket, kiosk, gas station)
Country profile · Media Use · Distance selling · “Customer jour-ney“ · Drivers & barriers in distance selling · Cross-border shopping · Dialog marketing
China Globally
4.0
3.9
3.8
5.2
4.9
5.0
4.4
4.7
4.9
Max. accepted order time · Ø in days *
3.6
3.5
3.7
5.3
4.8
5.1
3.8
4.9
4.7
* Source: DHL Global Mail 2013 ∙ n Global from 10,270 to 10,462 ∙ n China from 988 to 995 ** scale from 1 "absolutely not important" to 6 "very important“
Long distance, little time
The predominantly urban cli-ents accept delivery times be-low the global average. They are also used to being able to choose from different delivery companies. Alternative collec-tion points and drop boxes are also very important.
"CUSTOMER JOURNEY“ – DELIVERY
1 2 3 4 5 6
Requirements for delivery · Ø *,**
Country information China
5.5
6.5
China Globally

Shop the World 91
37+63
72+28
Number of returns per capita per year · Ø * China Globally
0.8
1.0
Return rate · in % * China Globally
5.9
Reasons for returns · China in % *
Defective product 39.2
Percentage of users who returned goods · in % *
37.063.0
China Globally
Yes No
“CUSTOMER JOURNEY“ – RETURNSReturns are rather rare
Even though 37% of those sur-veyed had already returned goods bought online, the re-turn-rate is well below the in-ternational average (4.9%). The Chinese target group usually returns goods when a product is faulty or of insufficient qual-ity. Misleading product de-scriptions also play a relatively important role. On the other hand, people rarely order multi-ple variants of the same product to choose from.
27.5
72.5
* Source: DHL Global Mail 2013 ∙ n Global from 2,648 to 9,325 ∙ n China from 352 to 954
Differing product description
Delivery of the wrong product
Wrong product was ordered
Product did not fit
Ordered multiple variants to choose from
Delivery period too long
Found less expensive product
Deficient product quality
Product was not liked
28.4
12.5
33.5
23.0
2.8
7.9
Globally
32.3
30.0
17.8
13.3
8.5
37.7
29.9
15.5
5.8
3.9
40.9
10.0
Country information China
4.9
2.8
Country profile · Media Use · Distance selling · “Customer jour-ney“ · Drivers & barriers in distance selling · Cross-border shopping · Dialog marketing

Shop the World 92Country profile · Media Use · Distance selling · “Customer jour-ney“· Drivers & barriers in distance selling · Cross-border shopping · Dialog marketing
High delivery costs
Uncertain delivery
Concern about misuse of payment data
No demand because all products are obtainable locally
Long delivery times
Unknown product quality
No try-on possible before purchase
Complicated return of the products
No personal advice
No personal contact person for problems
Doubts regarding data protection or the dissemination of data to third parties
Concern about counterfeited products, product piracy
Product can only be obtained via distance selling
Easy price comparison
Shopping 24/7
Location-independent ordering
Higher product quality
Lower prices
Greater selection
Option to deliver to a preferred location
DRIVERS & BARRIERS IN DISTANCE SELLING Barriers
· China in % *
50.8
54.6
72.6
63.5
7.8
59.1
46.0
67.3
64.4
61.3
80.0
Globally
36.6
24.2
34.4
3.9
25.8
48.5
64.9
44.1
21.5
22.0
29.8
34.1
The quality must be right
Aspects of eCommerce that most impress the Chinese include a high degree of price transparency and extensive de-livery options. Major barriers: questionable product quality and concerns about product piracy.
Drivers · China in % *
Globally
* Source: DHL Global Mail 2013 ∙ n Global from 10,509 to 10,864 ∙ n China from 996 to 1.032
47.8
61.7
64.1
64.4
13.4
18.4
14.2
39.9
2.9
21.2
67.8
61.1
53.6
29.8
19.5
34.6
68.5
Country information China

Shop the World 93
CROSS-BORDER SHOPPING – OVERVIEW
Country profile · Media Use · Distance selling · “Customer jour-ney“ · Drivers & barriers in distance selling · Cross-border shop-ping · Dialog marketing
25+53+22
Previous orders abroad
Previous and future orders abroad by country · in % *
Great Britain[17.9]
Germany[13.6]
1
2
3
4
5
USA[65.8]
Hong Kong[34.8]
Japan[30.4]
Future orders abroad
China
* Source: DHL Global Mail 2013 ∙ n Global from 4,738 to 8,807 ∙ n China from 207 to 799 ** split into "further orders planned“ 24.8% China and "no further orders planned" 0.5% China
Potential for imports
Since China has an enormous domestic market and export- ing to China is still not an easy undertaking, Chinese clients rarely take the opportunity of ordering from abroad. How-ever, significant growth can be expected since more than half of those surveyed indicated that they would like to order prod-ucts from abroad in the future. The US currently benefits from orders received from China and will continue to do so in the fu-ture. Closer to home, people or-der goods from Hong Kong and Japan. In the future, the Chi- nese target group will also show a greater interest in products from Great Britain and France.
Great Britain[39.5]
France[34.8]
USA[83.8]
Hong Kong[61.8]
Japan[46.8]
Country information China
Use of cross-border eCommerce· in % *
Yes, already ordered **No, but future orders planned No, no future orders planned
52.925.3
21.8
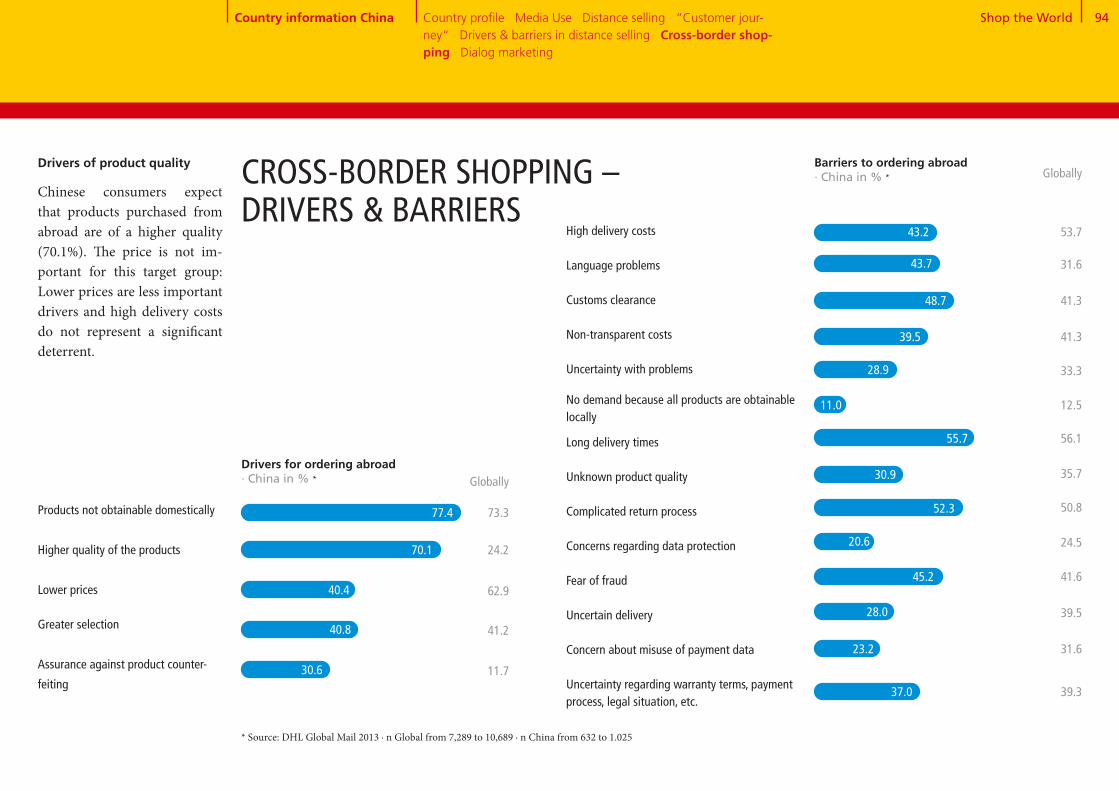
Shop the World 94
Products not obtainable domestically
Higher quality of the products
Lower prices
Greater selection
Assurance against product counter-
feiting
High delivery costs Language problems
Customs clearance
Non-transparent costs
Uncertainty with problems
No demand because all products are obtainable locally
Long delivery times
Unknown product quality
Complicated return process
Concerns regarding data protection Fear of fraud Uncertain delivery
Concern about misuse of payment data
Uncertainty regarding warranty terms, payment process, legal situation, etc.
CROSS-BORDER SHOPPING – DRIVERS & BARRIERS
Country profile · Media Use · Distance selling · “Customer jour-ney“ · Drivers & barriers in distance selling · Cross-border shop-ping · Dialog marketing
Drivers for ordering abroad· China in % *
Barriers to ordering abroad · China in % *
Globally
73.3
24.2
62.9
41.2
11.7
Globally
53.7
31.6
41.3
41.3
33.3
12.5
56.1
35.7
50.8
24.5
41.6
39.5
31.6
39.3
Drivers of product quality
Chinese consumers expect that products purchased from abroad are of a higher quality (70.1%). The price is not im-portant for this target group: Lower prices are less important drivers and high delivery costs do not represent a significant deterrent.
* Source: DHL Global Mail 2013 ∙ n Global from 7,289 to 10,689 ∙ n China from 632 to 1.025
43.2
43.7
48.7
39.5
28.9
11.0
55.7
30.9
52.3
20.6
45.2
28.0
23.2
37.0
77.4
70.1
40.4
40.8
30.6
Country information China

Shop the World 95Country profile · Media Use · Distance selling · “Customer jour-ney“ · Drivers & barriers in distance selling · Cross-border shop-ping · Dialog marketing
Receipt of mailings and catalogs · China in % *
5 and 63 and 41 and 2
DIALOG MARKETING
Reading mailings and catalogs · in % *,**
China
Globally
20.0 39.2 40.9
22.1 35.2 42.7
5 and 63 and 41 and 2
Response to mailings and catalogs · in % *,**
China
Globally
28.2 46.6 25.2
29.0 45.8 25.3
Response channel for mailings and catalogs · China in % * Globally
Website visits
Visits to stores or
branch offices
Other online
response (e.g. chat,
Twitter, Facebook,
newsletter
registration, etc.)
Phone call
Business reply card
77.9 73.4
48.6
30.0
24.5
18.4
12.6
* Source: DHL Global Mail 2013 ∙ n Global from 8,788 to 11,265 ∙ n China from 861 to 1,040 ** scale from 1 "never“ to 6 "almost always“
Fewer mailings
Chinese consumers receive relatively few mailings and catalogs. Only 7.5% receive offers once a week or more. Al-most a fifth never receive such traditional direct marketing. The number of those surveyed who read mailings and cata-logs was similar to global fig- ures: More than 40% frequently or almost always read mailings and catalogs. The frequency with which they respond to offers paints a similar picture. Differences in the form of re- sponse were identifiable. Online channels such as chat rooms, microblogging and newsletters are used to an increasing extent. However, the most common response channel in China is visiting the provider‘s website (77.9%).
Globally
One or more times per week
One or more times per month
Less than once per month
Never
26.9
33.7
27.7
11.6 49.7
47.5
24.5
25.1
11.8
7.5
37.4
38.9
16.1
Country information China

Country InformationFrance
Yann French online buyers are employed, middle-class, rural, traditional, comfortable... and prefer to orderfashion items and food products.
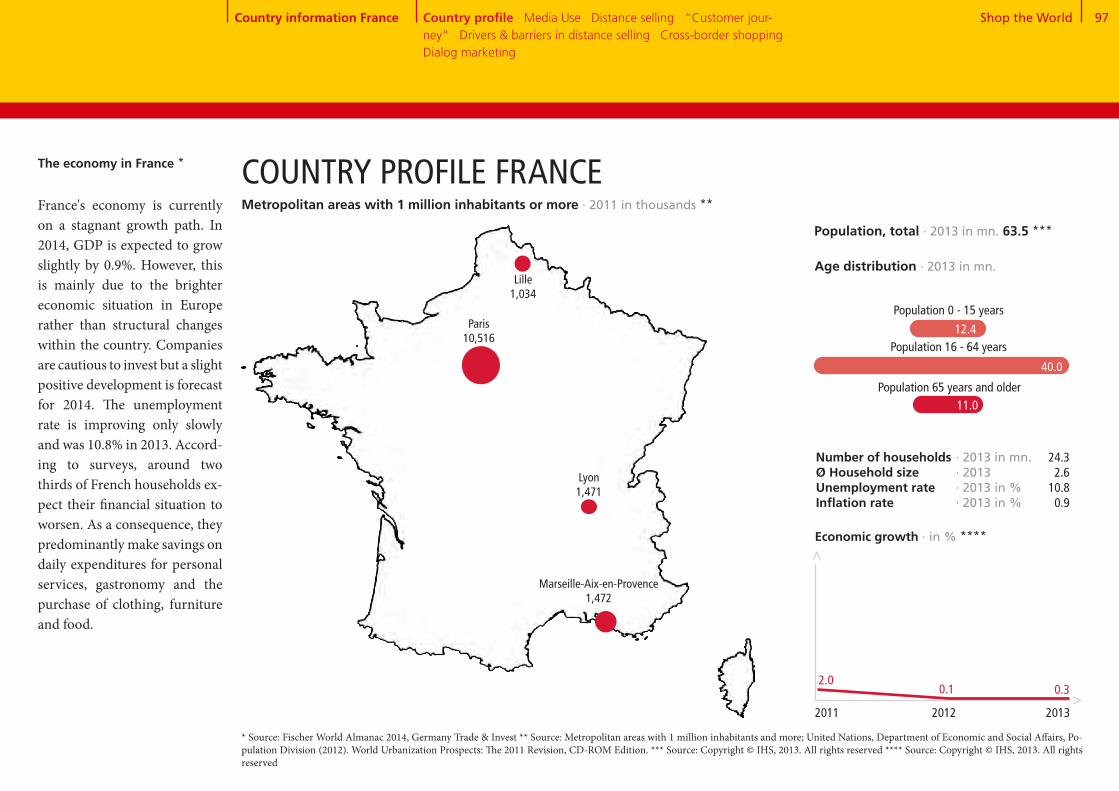
Shop the World 97Country information France Country profile · Media Use · Distance selling · “Customer jour-ney“ · Drivers & barriers in distance selling · Cross-border shopping · Dialog marketing
12.4
Population 0 - 15 years
The economy in France * COUNTRY PROFILE FRANCE
Paris 10,516
Marseille-Aix-en-Provence 1,472
* Source: Fischer World Almanac 2014, Germany Trade & Invest ** Source: Metropolitan areas with 1 million inhabitants and more; United Nations, Department of Economic and Social Affairs, Po-pulation Division (2012). World Urbanization Prospects: The 2011 Revision, CD-ROM Edition. *** Source: Copyright © IHS, 2013. All rights reserved **** Source: Copyright © IHS, 2013. All rights reserved
Number of households Ø Household sizeUnemployment rateInflation rate
0.1
Economic growth · in % ****
>
>
0.32.0
2011 2012 2013
Age distribution · 2013 in mn.
Population 65 years and older
Population, total · 2013 in mn. 63.5 ***
Population 16 - 64 years
· 2013 in mn.· 2013· 2013 in %· 2013 in %
24.3 2.6
10.80.9
France's economy is currently on a stagnant growth path. In 2014, GDP is expected to grow slightly by 0.9%. However, this is mainly due to the brighter economic situation in Europe rather than structural changes within the country. Companies are cautious to invest but a slight positive development is forecast for 2014. The unemployment rate is improving only slowly and was 10.8% in 2013. Accord- ing to surveys, around two thirds of French households ex-pect their financial situation to worsen. As a consequence, they predominantly make savings on daily expenditures for personal services, gastronomy and the purchase of clothing, furniture and food.
40.0
11.0
Lille 1,034
Lyon 1,471
Metropolitan areas with 1 million inhabitants or more · 2011 in thousands **
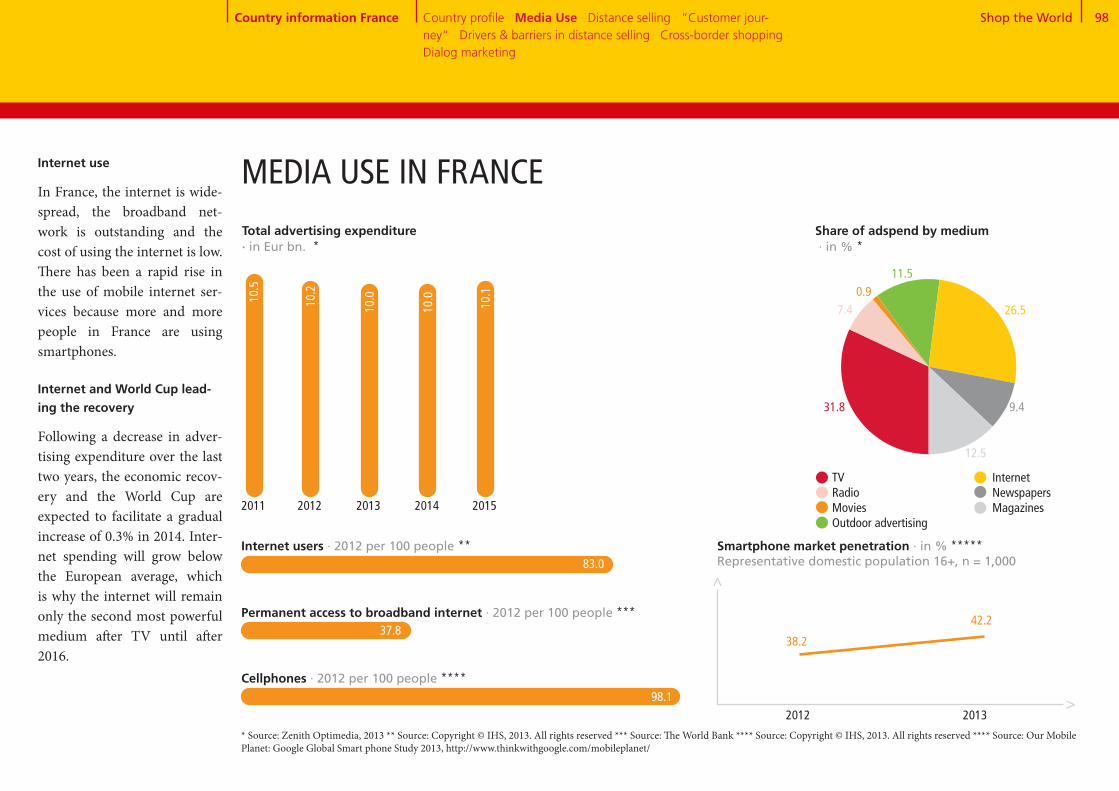
Shop the World 98
32+7+1+12+26+9+13
Country information France Country profile · Media Use · Distance selling · “Customer jour-ney“ · Drivers & barriers in distance selling · Cross-border shopping · Dialog marketing
MEDIA USE IN FRANCE
37.8
98.1
Smartphone market penetration · in % *****Representative domestic population 16+, n = 1,000
38.2
Internet users · 2012 per 100 people **
Permanent access to broadband internet · 2012 per 100 people ***
Cellphones · 2012 per 100 people ****
2012 2013
42.2
Share of adspend by medium · in % *
TV Radio Movies Outdoor advertising
Total advertising expenditure · in Eur bn. *
Internet Newspapers Magazines
>>
* Source: Zenith Optimedia, 2013 ** Source: Copyright © IHS, 2013. All rights reserved *** Source: The World Bank **** Source: Copyright © IHS, 2013. All rights reserved **** Source: Our Mobile Planet: Google Global Smart phone Study 2013, http://www.thinkwithgoogle.com/mobileplanet/
2011 2012 2013 2014 2015
10.1
83.0
10.0
10.010.2
10.5
26.5
9.4
12.5
11.50.9
7.4
31.8
Internet use
In France, the internet is wide- spread, the broadband net-work is outstanding and the cost of using the internet is low. There has been a rapid rise in the use of mobile internet ser-vices because more and more people in France are using smartphones.
Internet and World Cup lead-ing the recovery
Following a decrease in adver-tising expenditure over the last two years, the economic recov- ery and the World Cup are expected to facilitate a gradual increase of 0.3% in 2014. Inter-net spending will grow below the European average, which is why the internet will remain only the second most powerful medium after TV until after 2016.
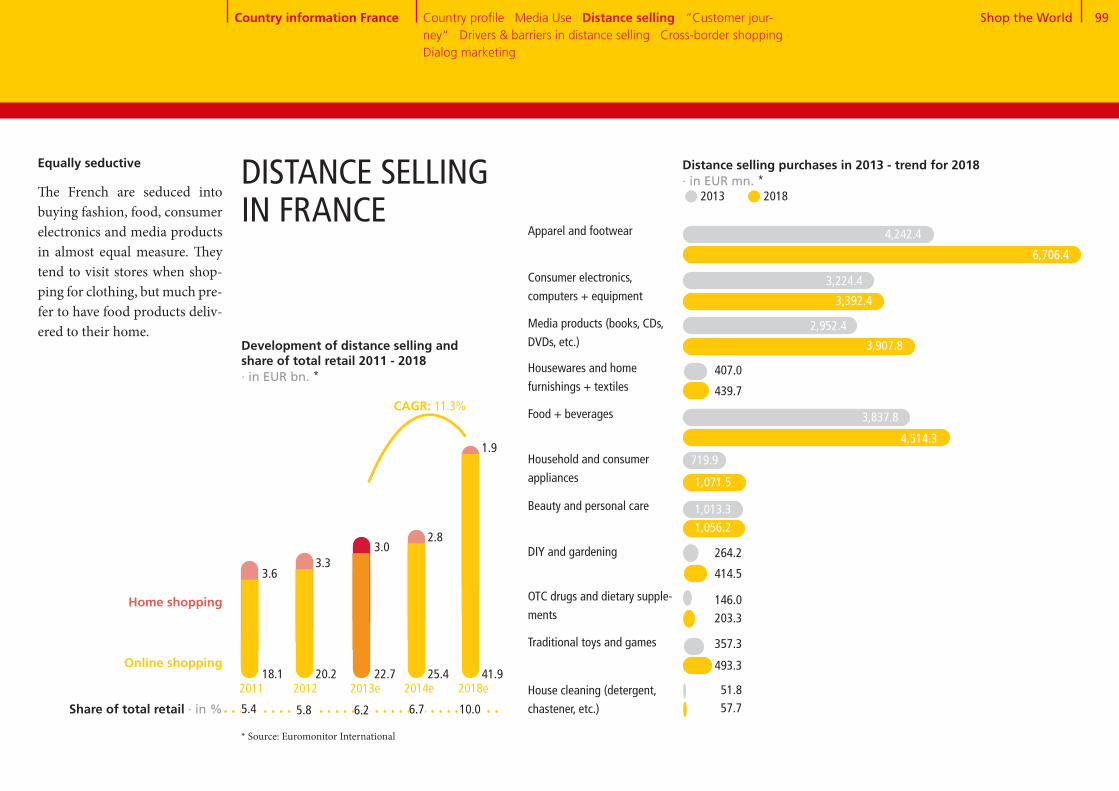
Shop the World 99
Apparel and footwear
Consumer electronics,
computers + equipment
Media products (books, CDs,
DVDs, etc.)
Housewares and home
furnishings + textiles
Food + beverages
Household and consumer
appliances
Beauty and personal care
DIY and gardening
OTC drugs and dietary supple-
ments
Traditional toys and games
House cleaning (detergent,
chastener, etc.)
Equally seductive
The French are seduced into buying fashion, food, consumer electronics and media products in almost equal measure. They tend to visit stores when shop- ping for clothing, but much pre-fer to have food products deliv- ered to their home.
DISTANCE SELLING IN FRANCE
6,706.4
3,392.4
3,224.4
3,907.8
2,952.4
439.7
407.0
4,514.3
719.9
1,071.5
1,056.2
414.5
264.2
146.0
493.3
357.3
57.7
Development of distance selling and share of total retail 2011 - 2018 · in EUR bn. *
CAGR: 11.3%
Home shopping
Online shopping18.1 20.2 22.7
3.63.3
3.0
25.4 41.9
2.8
1.9
2011 2012 2013e 2014e 2018e
Share of total retail · in % 5.4 5.8 6.2 6.7 10.0
* Source: Euromonitor International
4,242.4
51.8
Country information France Country profile · Media Use · Distance selling · “Customer jour-ney“ · Drivers & barriers in distance selling · Cross-border shopping · Dialog marketing
3,837.8
1,013.3
203.3
Distance selling purchases in 2013 - trend for 2018 · in EUR mn. * 2013 2018
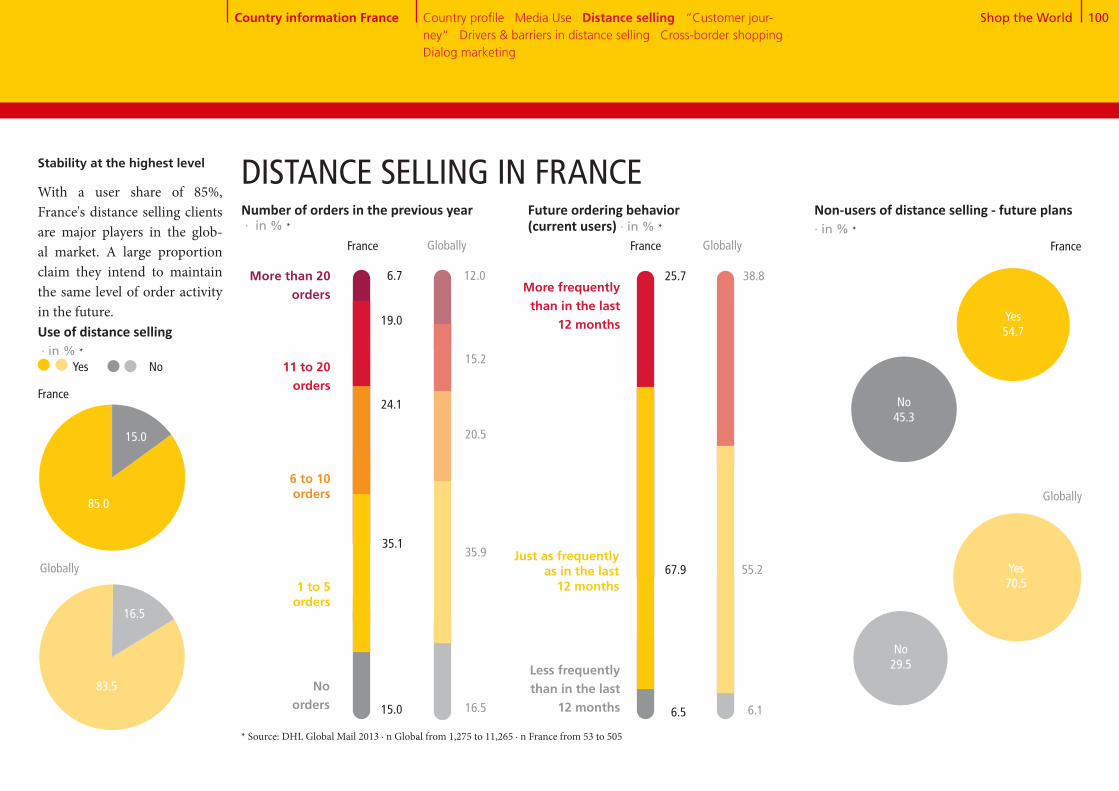
Shop the World 100
85+1584
+16
Stability at the highest level
With a user share of 85%, France's distance selling clients are major players in the glob-al market. A large proportion claim they intend to maintain the same level of order activity in the future.Use of distance selling · in % *
85.0
15.0
France
Globally
83.5
16.5
Number of orders in the previous year · in % *
1 to 5 orders
6 to 10 orders
11 to 20 orders
No orders
24.1
35.1
19.0
15.0
6.7
20.5
35.9
15.2
16.5
12.0
Future ordering behavior (current users) · in % *
More frequently than in the last
12 months
Just as frequently as in the last
12 months
Less frequently than in the last
12 months
67.9
25.7
55.2
38.8
6.5 6.1
Non-users of distance selling - future plans · in % *
Yes54.7
France
Globally
Yes70.5
No45.3
No29.5
Yes No
France Globally France Globally
DISTANCE SELLING IN FRANCE
* Source: DHL Global Mail 2013 ∙ n Global from 1,275 to 11,265 ∙ n France from 53 to 505
Country information France Country profile · Media Use · Distance selling · “Customer jour-ney“ · Drivers & barriers in distance selling · Cross-border shopping · Dialog marketing
More than 20 orders

Shop the World 101
Globally*
49.5
Gender · in % Male Female
Age · in % <30 yrs. 30-49 yrs. 50 yrs. +
Occupation · in % Employed Unemployed
Education · in % Lower educational level Medium and higher level of education
14.9
Media affinity: Online · in % yes**
Community size · in % Rural (<50,000 inhabitants) Non-rural/urban (>50,000 inhabitants)
Minors in the household · Ø
Household type · in % Single 2-person household without children Household with children Household with 3 adults
Mobile Internet usage · in % Yes No
Gross household income · in % Low income Medium income High income
Media affinity: Classic · in % yes**
Media affinity: Dialog marketing · in % yes** 51.3
33.7
87.5
39.737.2
23.1
49.550.5
10.856.8
44.5
30.9
55.5
20.8
85.1
31.7
1.0
20.112.4
79.2
Beyond the metropolis Distance selling in France is booming in rural regions. Around 70% of distance sell-ing clients and heavy users live outside of Paris or the few other conurbations. The profiles of heavy users, who are particu-larly important for the indus- try, are more masculine than the global trend. The target group tends to represent house-holds with children and has a higher level of education as well as a household income in the medium range. While gen-eral media affinity is similar to the international comparison, mobile devices are used much more seldomly to access the in-ternet in France.
DISTANCE SELLING IN FRANCE
* Source: DHL Global Mail 2013 ∙ n Global from 2,661 to 11,265 ∙ n France from 113 to 505 ** media affinity for online / classic / dialog marketing, if at least one medium from the respective area was rated 5 or 6 on a scale of 1 "absolutely not useful" to 6 "very useful" *** the top third of most active mail order users
44.327.1
14.4
36.4
46.9
36.5
80.8
33.734.232.1
45.754.3
22.443.0
50.0
28.6
50.0
29.4
85.6
63.6
0.7
23.411.2
70.6
Country information France Country profile · Media Use · Distance selling · “Customer jour-ney“ · Drivers & barriers in distance selling · Cross-border shopping · Dialog marketing
***
France*
45.528.9
23.2
70.4
54.1
35.8
79.5
29.040.430.6
59.240.8
10.143.9
50.5
25.6
49.5
25.1
76.8
29.6
0.9
28.517.4
74.9
19.6
68.3
Heavy users* Global heavy users*

Shop the World 102
Search engines
Customer ratings in blogs or forums
Product test ratings / expert test reports
Product check in a retail store
Retailer or manufacturer website
Online marketplace
Catalog
Mail advertising
Social media platforms such as Facebook and Twitter
Apps (on smartphone, iPad, or tablet)
Recommendations from friends, acquaintances, and colleagues
Customer ratings on the supplier’s website
Price comparison sites
Large selection of products
Recommendation and experiences of friends, acquaintances, and colleagues
Official test seals, reviews, and test reports of independent institutions
Attractive product line
Favorable prices, promotions, & special offers
Straightforward return process
Free returns
Choice of preferred payment methods
Fast delivery
Free delivery
Good customer service
Positive customer ratings on the internet
„CUSTOMER JOURNEY“ – SEARCHING FOR PRODUCT INFORMATIONSearch for product information · France in % * Globally
32.0 35.5
53.2
18.2 23.4
41.8 44.2
28.7 23.9
40.0 45.8
33.1 42.5
31.9 25.1
14.6 15.1
7.7 15.1
4.7 9.7
35.8 37.8
Criteria for choosing a vendor · France in % *
Globally
52.0
32.6 40.6
13.4 13.7
20.7
6.4 8.8
18.0 26.6
18.3 14.9
53.8 51.7
10.9 12.9
23.2 20.8
20.6 22.6
26.2 25.7
50.5 45.2
18.2 18.5
24.1
Tradition has a future
In order to search information, digital media is used most fre-quently, while the retail busi-ness and catalogs are also popu-lar sources of information.
* Source: DHL Global Mail 2013 ∙ n Global from 9,386 to 10,617 ∙ n France from 425 to 470, multiple mentioning
Country information France Country profile · Media Use · Distance selling · “Customer jour-ney“ · Drivers & barriers in distance selling · Cross-border shopping · Dialog marketing

Shop the World 103
Usefulness of advertising media · in % *, **
5 and 63 and 41 and 2
Ø
44.832.4 22.926.1 43.8 30.1
Online advertising
* Source: DHL Global Mail 2013 ∙ n Global from 10,218 to 10,384 ∙ n France from 454 to 464 ** scale from 1 "absolutely not useful" to 6 "very useful“
No online hype
While online media is becom- ing increasingly relevant elsewhere, the opinion of dis-tance selling clients in France is rather more reserved. The French are slightly wary of on-line advertising and social me-dia.
ACCEPTANCE OF ADVERTISING MEDIA
FranceGlobally
Country information France Country profile · Media Use · Distance selling · “Customer jour-ney“ · Drivers & barriers in distance selling · Cross-border shopping · Dialog marketing
Television advertising
5 and 63 and 41 and 2
3.33.6
Ø
39.938.3 21.730.6 41.8 27.6
3.13.4
34.540.9 24.538.7 40.4 20.9Social media
FranceGlobally
Advertising letters
3.13.1
32.350.4 17.333.9 37.6 28.5
2.83.4
Product suggestions in online shops
45.724.0 30.318.9 45.1 36.0
3.63.9
28.85.4 65.76.5 28.7 64.8
4.84.8
35.411.9 52.79.1 31.7 59.1
4.44.6
38.731.0 30.329.9 43.9 26.2
FranceGlobally
Household advertising
3.43.4
46.532.2 21.329.0 46.7 24.3
FranceGlobally
Advertisements in mag- azines and periodicals
3.23.4
42.937.5 19.634.8 43.1 22.1
FranceGlobally
Advertisements in newspapers
3.13.2
43.139.2 17.741.8 40.7 17.6
FranceGlobally
Billboard advertise-ments
3.03.0
39.544.3 16.244.3 38.8 16.9
FranceGlobally
Radio
2.92.9
39.815.9 44.319.3 44.2 36.6
FranceGlobally
Catalogs from vendors
4.13.9
FranceGlobally
FranceGlobally
FranceGlobally
Internet search engines
FranceGlobally
Price comparison sites
FranceGlobally
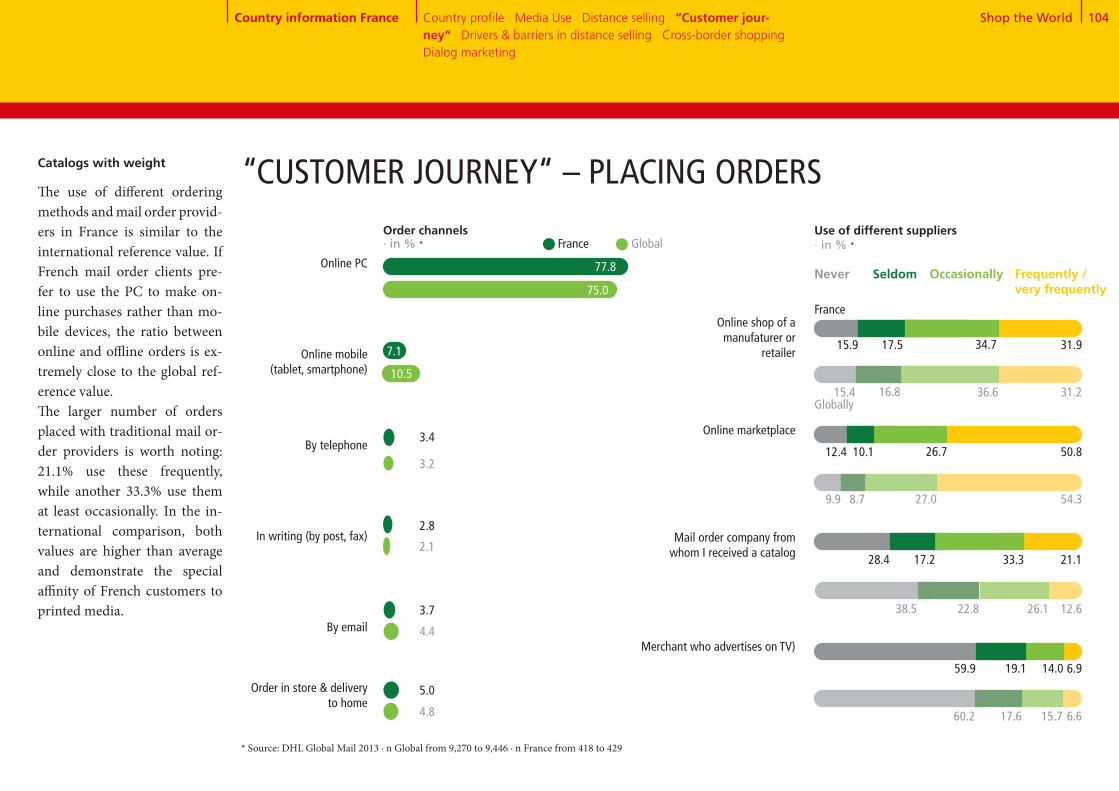
Shop the World 104
Online PC
Online mobile (tablet, smartphone)
By telephone
In writing (by post, fax)
By email
Order in store & delivery to home
Online marketplace
Mail order company from whom I received a catalog
Merchant who advertises on TV)
Online shop of a manufaturer or
retailer
Use of different suppliers · in % *
Never Frequently / very frequently
Occasionally
* Source: DHL Global Mail 2013 ∙ n Global from 9,270 to 9,446 ∙ n France from 418 to 429
France Global
77.8
3.4
2.8
3.7
75.0
3.2
2.1
4.4
“CUSTOMER JOURNEY“ – PLACING ORDERSCatalogs with weight
The use of different ordering methods and mail order provid- ers in France is similar to the international reference value. If French mail order clients pre-fer to use the PC to make on-line purchases rather than mo- bile devices, the ratio between online and offline orders is ex- tremely close to the global ref- erence value.The larger number of orders placed with traditional mail or-der providers is worth noting: 21.1% use these frequently, while another 33.3% use them at least occasionally. In the in-ternational comparison, both values are higher than average and demonstrate the special affinity of French customers to printed media.
15.9 31.917.5
15.4 31.216.8
34.7
36.6
France
Globally
12.4 50.810.1
9.9 54.38.7
26.7
27.0
28.4 21.117.2
38.5 12.622.8
33.3
26.1
59.9 6.919.1
60.2 6.617.6
14.0
15.7
7.1
10.5
5.0
4.8
Order channels · in % *
Country information France Country profile · Media Use · Distance selling · “Customer jour-ney“ · Drivers & barriers in distance selling · Cross-border shopping · Dialog marketing
Seldom
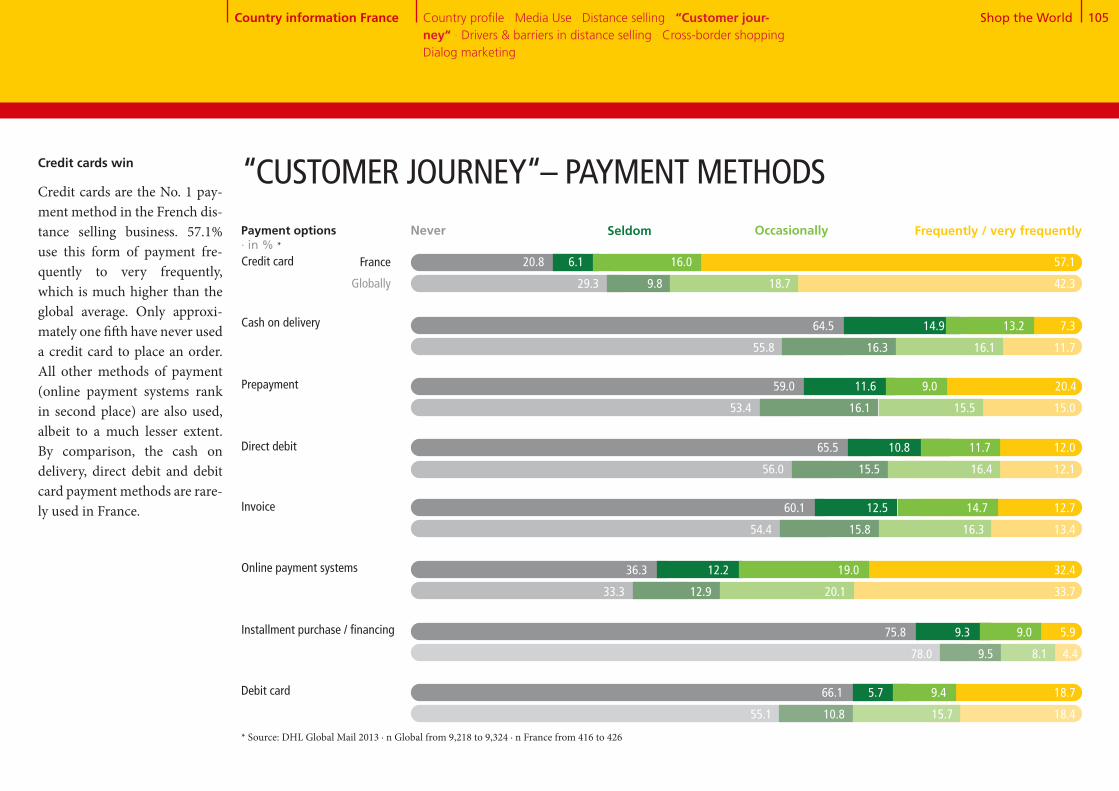
Shop the World 105
Credit cards win
Credit cards are the No. 1 pay-ment method in the French dis- tance selling business. 57.1% use this form of payment fre-quently to very frequently, which is much higher than the global average. Only approxi-mately one fifth have never used a credit card to place an order. All other methods of payment (online payment systems rank in second place) are also used, albeit to a much lesser extent. By comparison, the cash on delivery, direct debit and debit card payment methods are rare- ly used in France.
Cash on delivery
Prepayment
Direct debit
Credit card
* Source: DHL Global Mail 2013 ∙ n Global from 9,218 to 9,324 ∙ n France from 416 to 426
“CUSTOMER JOURNEY“– PAYMENT METHODS
Online payment systems
Installment purchase / financing
Debit card
Invoice
Payment options · in % *
Never Frequently / very frequentlyOccasionally
France
Globally
20.8 6.1 16.0 57.1
29.3 9.8 18.7 42.3
64.5 14.9 13.2 7.3
55.8 16.3 16.1 11.7
59.0 11.6 9.0 20.4
53.4 16.1 15.5 15.0
65.5 10.8 11.7 12.0
56.0 15.5 16.4 12.1
60.1 12.5 14.7 12.7
54.4 15.8 16.3 13.4
36.3 12.2 19.0 32.4
33.3 12.9 20.1 33.7
75.8 9.3 9.0 5.9
78.0 9.5 8.1 4.4
66.1 5.7 9.4 18.7
55.1 10.8 15.7 18.4
Country information France Country profile · Media Use · Distance selling · “Customer jour-ney“ · Drivers & barriers in distance selling · Cross-border shopping · Dialog marketing
Seldom
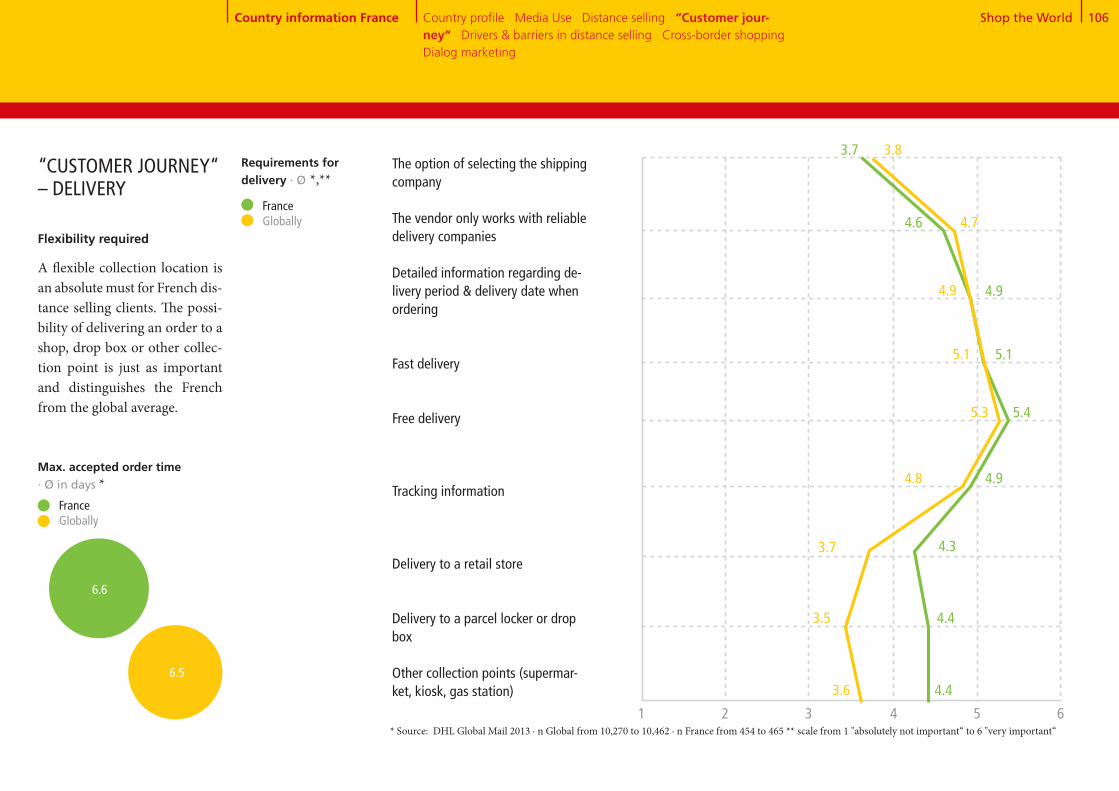
Shop the World 106
The option of selecting the shipping company The vendor only works with reliable delivery companies
Detailed information regarding de-livery period & delivery date when ordering
Fast delivery
Free delivery
Tracking information
Delivery to a retail store
Delivery to a parcel locker or drop box
Other collection points (supermar-ket, kiosk, gas station)
France Globally
4.4
4.4
4.3
5.4
4.9
5.1
3.7
4.9
4.6
Max. accepted order time · Ø in days *
3.6
3.5
3.7
5.3
4.8
5.1
3.8
4.9
4.7
* Source: DHL Global Mail 2013 ∙ n Global from 10,270 to 10,462 ∙ n France from 454 to 465 ** scale from 1 "absolutely not important“ to 6 "very important“
Flexibility required
A flexible collection location is an absolute must for French dis- tance selling clients. The possi-bility of delivering an order to a shop, drop box or other collec-tion point is just as important and distinguishes the French from the global average.
“CUSTOMER JOURNEY“ – DELIVERY
1 2 3 4 5 6
Requirements for delivery · Ø *,**
Country information France Country profile · Media Use · Distance selling · “Customer jour-ney“ · Drivers & barriers in distance selling · Cross-border shopping · Dialog marketing
6.6
6.5
France Globally

Shop the World 107
74+26
72+28
Number of returns per capita per year · Ø * France Globally
0.8
0.7
Return rate · in % * France Globally
5.9
Reasons for returns · France in % *
Defective product 30.8
Percentage of users who returned goods · in % *
26.4
73.6
France Globally
Yes No
“CUSTOMER JOURNEY“ – RETURNSUnremarkable return rate
The option to use different or-dering methods and suppliers is used by one in four clients in France. This is comparable to the global average. A similar picture emerges for the number of returns and the return rate. The main reason for returning goods in France is that the or-dered product did not fit: 47.5% give this as a reason, a figure that is way ahead of the field in the international compari-son. In contrast, poor quality and abnormal or incomplete deliveries were specified more often as reasons for returning products.
27.5
72.5
* Source: DHL Global Mail 2013 ∙ n Global from 2,648 to 9,325 ∙ n France from 111 to 423
Differing product description
Delivery of the wrong product
Wrong product was ordered
Product did not fit
Ordered multiple variants to choose from
Delivery period too long
Found less expensive product
Deficient product quality
Product was not liked
10.8
8.2
47.5
22.4
8.9
7.2
0.9
Globally
32.3
30.0
17.8
13.3
8.5
37.7
29.9
15.5
5.8
3.9
25.1
7.2
Country information France Country profile · Media Use · Distance selling · “Customer jour-ney“ · Drivers & barriers in distance selling · Cross-border shopping · Dialog marketing
6.2
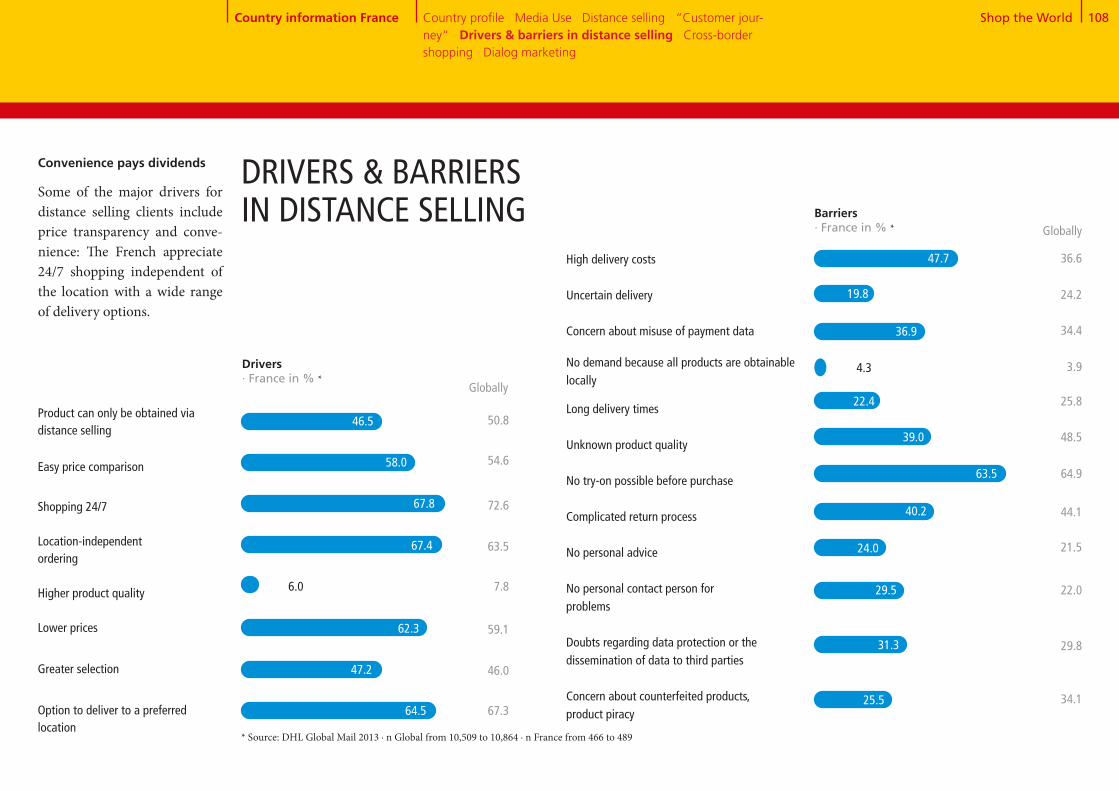
Shop the World 108
High delivery costs
Uncertain delivery
Concern about misuse of payment data
No demand because all products are obtainable locally
Long delivery times
Unknown product quality
No try-on possible before purchase
Complicated return process
No personal advice
No personal contact person for problems
Doubts regarding data protection or the dissemination of data to third parties
Concern about counterfeited products, product piracy
Product can only be obtained via distance selling
Easy price comparison
Shopping 24/7
Location-independent ordering
Higher product quality
Lower prices
Greater selection
Option to deliver to a preferred location
DRIVERS & BARRIERS IN DISTANCE SELLING Barriers
· France in % *
50.8
54.6
72.6
63.5
7.8
59.1
46.0
67.3
62.3
47.2
64.5
Globally
36.6
24.2
34.4
3.9
25.8
48.5
64.9
44.1
21.5
22.0
29.8
34.1
Convenience pays dividends
Some of the major drivers for distance selling clients include price transparency and conve-nience: The French appreciate 24/7 shopping independent of the location with a wide range of delivery options.
Drivers · France in % *
Globally
* Source: DHL Global Mail 2013 ∙ n Global from 10,509 to 10,864 ∙ n France from 466 to 489
46.5
58.0
67.8
67.4
6.0
47.7
19.8
36.9
4.3
22.4
39.0
63.5
40.2
24.0
29.5
31.3
25.5
Country information France Country profile · Media Use · Distance selling · “Customer jour-ney“ · Drivers & barriers in distance selling · Cross-border shopping · Dialog marketing

Shop the World 109
47+21+32CROSS-BORDER SHOPPING – OVERVIEW
Previous orders abroad
Previous and future orders abroad by country · in % *
China[25.6]
Hong Kong[15.8]
1
2
3
4
5
USA[48.0]
Great Britain[46.2]
Germany[38.7]
Future orders abroad
France
* Source: DHL Global Mail 2013 ∙ n Global from 4,738 to 8,807 ∙ n France from 195 to 385 ** split into "further orders planned“ 43.5% France and "no further orders planned“ 3.3% France
Shopping with the neighbors
The Grande Nation is reluctant to order from abroad. France is slightly below the global aver-age when it comes to interna-tional eCommerce: 46.8% have already placed an order abroad. There is a certain skepticism among current non-users about their future plans to import from other countries: Almost a third would not consider order- ing from abroad in the future.Although Germany is cur- rently in third place behind the US and Great Britain, the French intend to purchase a greater number of products from Germany in the future. Other European countries
[52.5]
Canada[47.3]
Germany[71.6]
USA[70.2]
Great Britain[68.6]
Country information France Country profile · Media Use · Distance selling · “Customer jour-ney“ · Drivers & barriers in distance selling · Cross-border shop-ping · Dialog marketing
Use of cross-border eCommerce · in % *
Yes, already ordered **No, but future orders planned No, no future orders planned
20.8
46.832.4
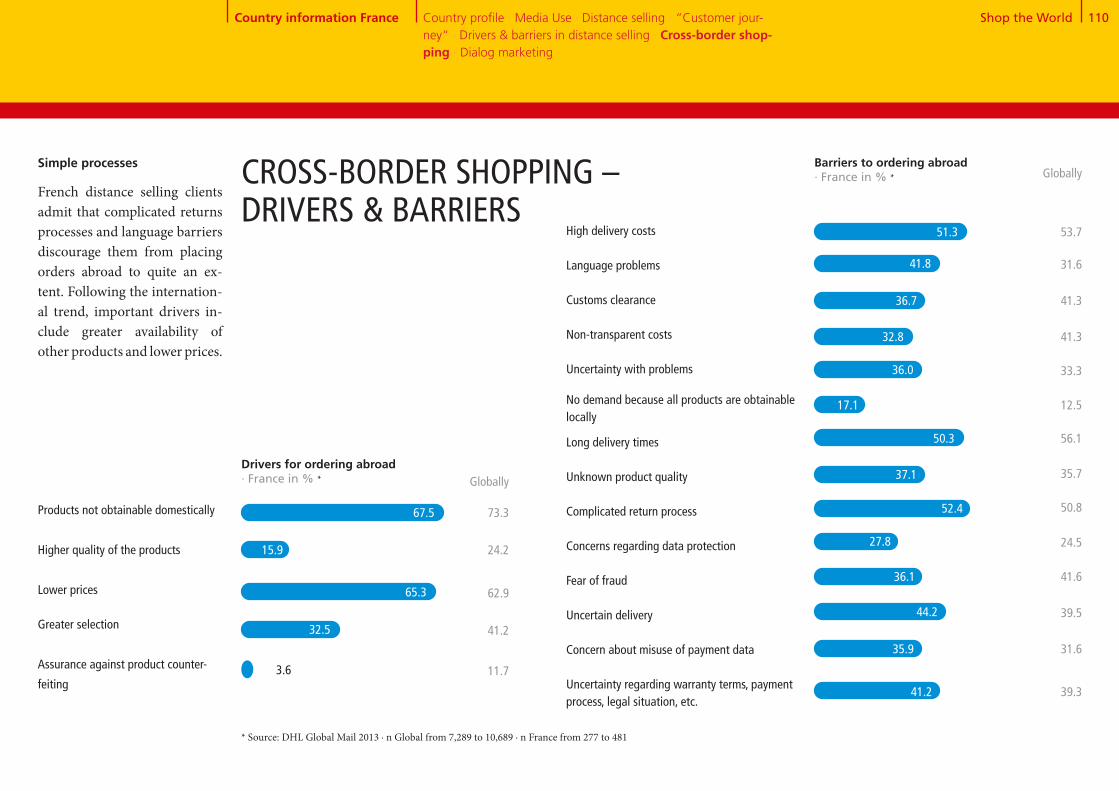
Shop the World 110
Products not obtainable domestically
Higher quality of the products
Lower prices
Greater selection
Assurance against product counter-
feiting
High delivery costs Language problems
Customs clearance
Non-transparent costs
Uncertainty with problems
No demand because all products are obtainable locally
Long delivery times
Unknown product quality
Complicated return process
Concerns regarding data protection Fear of fraud Uncertain delivery
Concern about misuse of payment data
Uncertainty regarding warranty terms, payment process, legal situation, etc.
Drivers for ordering abroad· France in % *
Barriers to ordering abroad · France in % *
Globally
73.3
24.2
62.9
41.2
11.7
Globally
53.7
31.6
41.3
41.3
33.3
12.5
56.1
35.7
50.8
24.5
41.6
39.5
31.6
39.3
Simple processes
French distance selling clients admit that complicated returns processes and language barriers discourage them from placing orders abroad to quite an ex-tent. Following the internation- al trend, important drivers in- clude greater availability of other products and lower prices.
CROSS-BORDER SHOPPING – DRIVERS & BARRIERS
* Source: DHL Global Mail 2013 ∙ n Global from 7,289 to 10,689 ∙ n France from 277 to 481
51.3
41.8
36.7
32.8
36.0
17.1
50.3
37.1
52.4
27.8
36.1
44.2
35.9
41.2
67.5
15.9
65.3
32.5
3.6
Country information France Country profile · Media Use · Distance selling · “Customer jour-ney“ · Drivers & barriers in distance selling · Cross-border shop-ping · Dialog marketing

Shop the World 111
Receipt of mailings and catalogs · France in % *
5 and 63 and 41 and 2
DIALOG MARKETING
Reading mailings and catalogs
· in % *,**
France
Globally
22.0 29.5 48.5
22.1 35.2 42.7
5 and 63 and 41 and 2
Response to mailings and catalogs · in % *,**
France
Globally
25.8 46.7 27.6
29.0 45.8 25.3
Response channel for mailings and catalogs · France in % * Globally
Website visits
Visits to stores or
branch offices
Other online
response (e.g. chat,
Twitter, Facebook,
newsletter
registration, etc.)
Phone call
Business reply card
63.1 73.4
48.6
30.0
24.5
18.4
12.6
* Source: DHL Global Mail 2013 ∙ n Global from 8,788 to 11,265 ∙ n France from 396 to 505 ** scale from 1 "never“ to 6 "almost always“
High mailing density
In line with the high affinity for dialog marketing media, consumers in France regularly receive mailings and catalogs: 44.2% receive corresponding input for their purchasing deci-sion at least once a week. The-se media are also read more often compared to the global average and provoke a posi-tive response more frequent-ly. For the French, visiting the website is the most obvious way of contacting the sender of the advertising literature, followed by visiting a local re-tail outlet, which the French do more frequently than the international average. Other online responses (e.g. via Face- book, Twitter) and emails are used with a proportionally lower frequency.
Globally
One or more times per week
One or more times per month
Less than once per month
Never
26.9
33.7
27.7
11.6 53.6
15.3
13.1
11.1
12.2
44.2
28.6
19.6
7.5
Country information France Country profile · Media Use · Distance selling · "Customer jour-ney“ · Drivers & barriers in distance selling · Cross-border shop-ping · Dialog marketing

Country InformationGermany
Katja, Christian, and Judith
Germany’s eCommerce clients are active, fashion- conscious, service-oriented. They like to shop abroad.
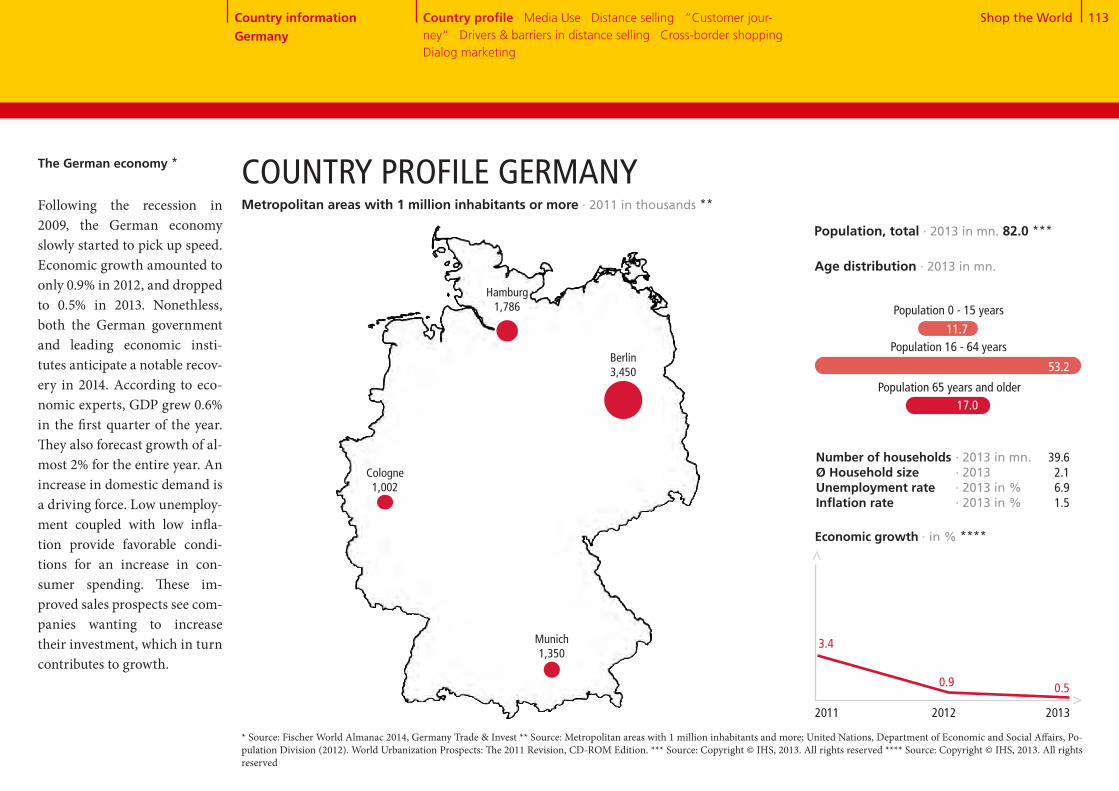
Shop the World 113
11.7
Population 0 - 15 years
The German economy * COUNTRY PROFILE GERMANY
Berlin3,450
Hamburg1,786
* Source: Fischer World Almanac 2014, Germany Trade & Invest ** Source: Metropolitan areas with 1 million inhabitants and more; United Nations, Department of Economic and Social Affairs, Po-pulation Division (2012). World Urbanization Prospects: The 2011 Revision, CD-ROM Edition. *** Source: Copyright © IHS, 2013. All rights reserved **** Source: Copyright © IHS, 2013. All rights reserved
Number of households Ø Household sizeUnemployment rateInflation rate
0.9
Economic growth · in % ****
>
>
0.5
3.4
2011 2012 2013
Age distribution · 2013 in mn.
Population 65 years and older
Population, total · 2013 in mn. 82.0 ***
Country information Germany
Country profile · Media Use · Distance selling · “Customer jour-ney“ · Drivers & barriers in distance selling · Cross-border shopping · Dialog marketing
Population 16 - 64 years
· 2013 in mn.· 2013· 2013 in %· 2013 in %
39.6 2.16.91.5
Following the recession in 2009, the German economy slowly started to pick up speed. Economic growth amounted to only 0.9% in 2012, and dropped to 0.5% in 2013. Nonethless, both the German government and leading economic insti- tutes anticipate a notable recov- ery in 2014. According to eco-nomic experts, GDP grew 0.6% in the first quarter of the year. They also forecast growth of al-most 2% for the entire year. An increase in domestic demand is a driving force. Low unemploy- ment coupled with low infla- tion provide favorable condi-tions for an increase in con- sumer spending. These im- proved sales prospects see com-panies wanting to increase their investment, which in turn contributes to growth.
53.2
17.0
Munich1,350
Cologne1,002
Metropolitan areas with 1 million inhabitants or more · 2011 in thousands **

Shop the World 114
23+4+1+5+22+28+17MEDIA USE IN GERMANY
34.0
131.3
Smartphone market penetration · in % *****Representative domestic population 16+, n = 1,000
28.8
Internet users · 2012 per 100 people **
Permanent access to broadband internet · 2012 per 100 people ***
Cellphones · 2012 per 100 people ****
2012 2013
39.8
Share of adspend by medium · in % *
TV Radio Movies Outdoor advertising
Total advertising expenditure · in EUR bn. *
Internet Newspapers Magazines
>>
* Source: Zenith Optimedia, 2013 ** Source: Copyright © IHS, 2013. All rights reserved *** Source: The World Bank **** Source: Copyright © IHS, 2013. All rights reserved **** Source: Our Mobile Planet: Google Global Smart phone Study 2013, http://www.thinkwithgoogle.com/mobileplanet/
2011 2012 2013 2014 2015
18.6
84.0
18.4
18.1
18.3
18.5
2016
18.8
Country information Germany
Country profile · Media Use · Distance selling · “Customer jour-ney“ · Drivers & barriers in distance selling · Cross-border shopping · Dialog marketing
22.0
28.0
17.3
4.9
0.5
4.0
23.2
Internet use
The number of internet users in Germany sees only moder- ate growth. Internet user fig-ures have reached a level at which only marginal growth can be achieved. It is assumed that people in the 50+ age brack- et will be key in this regard. Mobile devices are instrumen-tal in helping internet new- comers gain a foothold in the online world. Weak growth in spite of a stable economy
In 2013, overall advertising ex-penditure dropped despite the stable economy. An increase of 1.5% is expected for 2014. Only online advertising will in- crease significantly in 2015 (7.4%). Although extremely underrepresented in Germany, mobile spends grew 70.0% in 2013, and started to attract ad-vertisers’ attention.
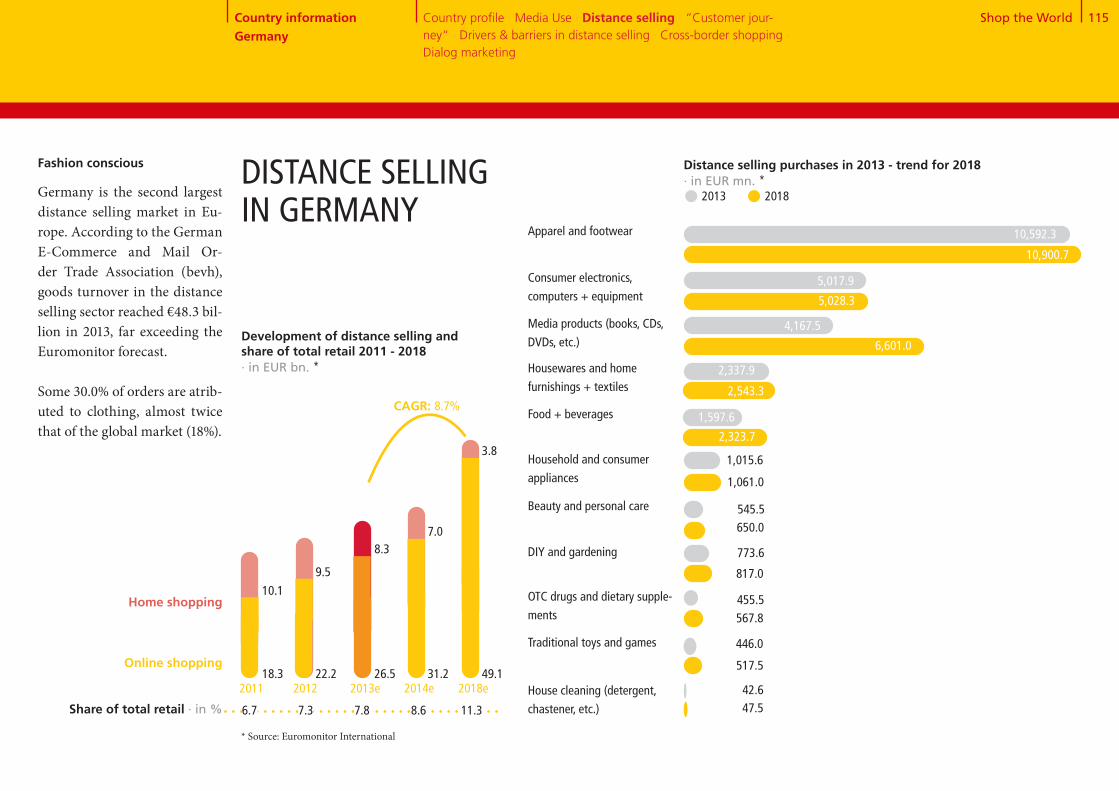
Shop the World 115
Distance selling purchases in 2013 - trend for 2018 · in EUR mn. * 2013 2018
Apparel and footwear
Consumer electronics,
computers + equipment
Media products (books, CDs,
DVDs, etc.)
Housewares and home
furnishings + textiles
Food + beverages
Household and consumer
appliances
Beauty and personal care
DIY and gardening
OTC drugs and dietary supple-
ments
Traditional toys and games
House cleaning (detergent,
chastener, etc.)
Fashion conscious
Germany is the second largest distance selling market in Eu-rope. According to the GermanE-Commerce and Mail Or-der Trade Association (bevh), goods turnover in the distance selling sector reached €48.3 bil-lion in 2013, far exceeding the Euromonitor forecast.
Some 30.0% of orders are atrib- uted to clothing, almost twice that of the global market (18%).
DISTANCE SELLING IN GERMANY
10,900.7
5,028.3
5,017.9
6,601.0
4,167.5
2,543.3
2,337.9
2,323.7
1,015.6
1,061.0
650.0
817.0
773.6
455.5
517.5
446.0
47.5
Development of distance selling and share of total retail 2011 - 2018 · in EUR bn. *
CAGR: 8.7%
Home shopping
Online shopping18.3 22.2 26.5
10.1
9.5
8.3
31.2 49.1
7.0
3.8
2011 2012 2013e 2014e 2018e
Share of total retail · in % 6.7 7.3 7.8 8.6 11.3
* Source: Euromonitor International
10,592.3
42.6
Country information Germany
Country profile · Media Use · Distance selling · “Customer jour-ney“ · Drivers & barriers in distance selling · Cross-border shopping · Dialog marketing
1,597.6
545.5
567.8
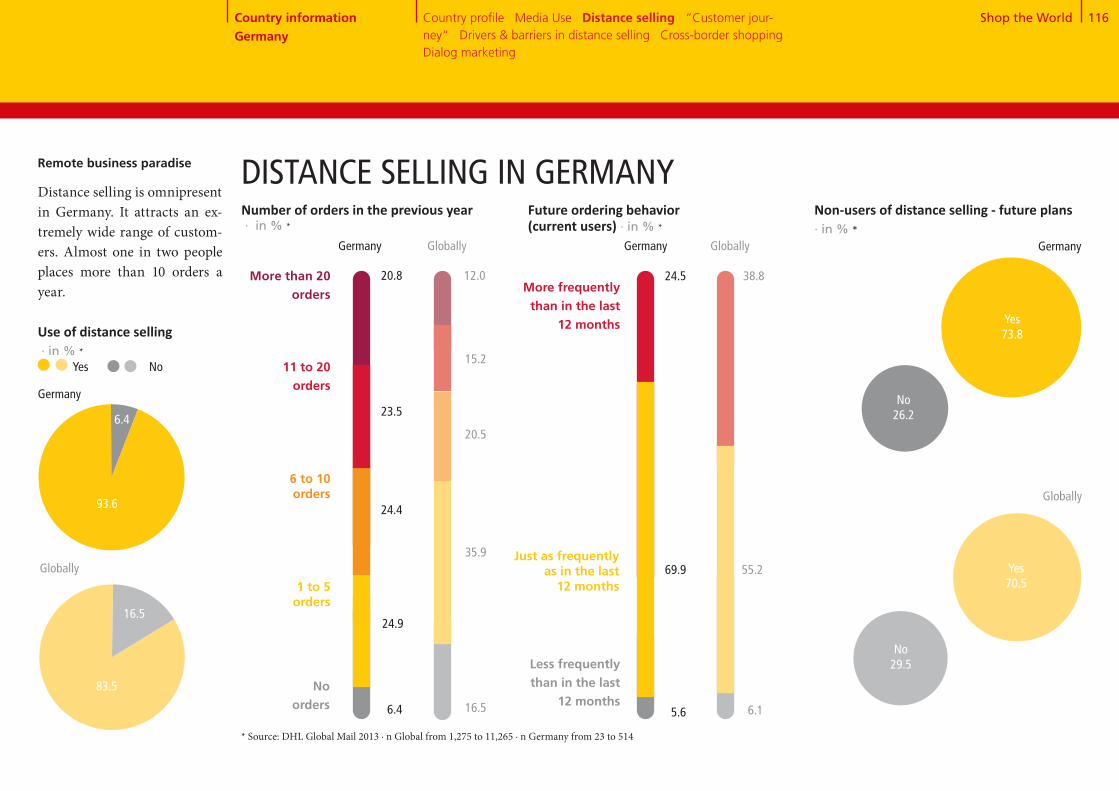
Shop the World 116
Non-users of distance selling - future plans · in % *
94+684+16
Remote business paradise
Distance selling is omnipresentin Germany. It attracts an ex- tremely wide range of custom-ers. Almost one in two people places more than 10 orders a year.
Use of distance selling · in % *
93.6
6.4
Germany
Globally
83.5
16.5
Number of orders in the previous year · in % *
1 to 5 orders
6 to 10 orders
11 to 20 orders
No orders
24.4
24.9
23.5
6.4
20.8
20.5
35.9
15.2
16.5
12.0
Future ordering behavior (current users) · in % *
More frequently than in the last
12 months
Just as frequently as in the last
12 months
Less frequently than in the last
12 months
69.9
24.5
55.2
38.8
5.6 6.1
Yes73.8
Germany
Globally
Yes70.5
No26.2
No29.5
Yes No
Germany Globally Germany Globally
DISTANCE SELLING IN GERMANY
* Source: DHL Global Mail 2013 ∙ n Global from 1,275 to 11,265 ∙ n Germany from 23 to 514
Country information Germany
Country profile · Media Use · Distance selling · “Customer jour-ney“ · Drivers & barriers in distance selling · Cross-border shopping · Dialog marketing
More than 20 orders

Shop the World 117
Globally*
45.1
Gender · in % Male Female
Age · in % <30 yrs. 30-49 yrs. 50 yrs. +
Occupation · in % Employed Unemployed
Education · in % Lower educational level Medium and higher level of education
28.2
Media affinity: Online · in % yes**
Community size · in % Rural (<50,000 inhabitants) Non-rural/urban (>50,000 inhabitants)
Minors in the household · Ø
Household type · in % Single 2-person household without children Household with children Household with 3 adults
Mobile Internet usage · in % Yes No
Gross household income · in % Low income Medium income High income
Media affinity: Classic · in % yes**
Media affinity: Dialog marketing · in % yes** 44.9
25.1
83.4
56.028.6
15.4
32.367.7
12.138.4
48.4
24.1
51.6
29.6
71.8
38.9
0.6
39.110.4
70.4
Heavy users: target group with purchasing power
Distinguished by a large num-ber of traits, the heavy user group in Germany is of partic- ular relevance in the distance selling business. Heavy users have a high household income, and tend to live in rural regions. Most are aged between 30 and 49 (45.1%), followed by the over fifties (30.8%). Compared to global benchmarks, Germany’s heavy users are much more likely to belong to an older age group (50+) and have received a higher level of education. The affinity of German heavy users to traditional media is much lower than the global compar- ison.
DISTANCE SELLING IN GERMANY
* Source: DHL Global Mail 2013 ∙ n Global from 2,661 to 11,265 ∙ n Germany from 123 to 514 ** media affinity for online / classic / dialog marketing, if at least one medium from the respective area was rated 5 or 6 on a scale of 1 "absolutely not useful" to 6 "very useful" *** the top third of most active mail order users
44.327.1
14.4
36.4
46.9
36.5
80.8
33.734.232.1
45.754.3
22.443.0
50.0
28.6
50.0
29.4
85.6
63.6
0.7
23.411.2
70.6
Country information Germany
Country profile · Media Use · Distance selling · “Customer jour-ney“ · Drivers & barriers in distance selling · Cross-border shopping · Dialog marketing
***
Germany*
43.133.4
29.6
55.1
47.9
27.1
79.4
40.230.629.2
44.155.9
12.035.8
49.6
23.5
50.4
35.8
70.4
44.9
0.7
31.520.7
64.2
30.8
61.1
Heavy users* Global heavy users*
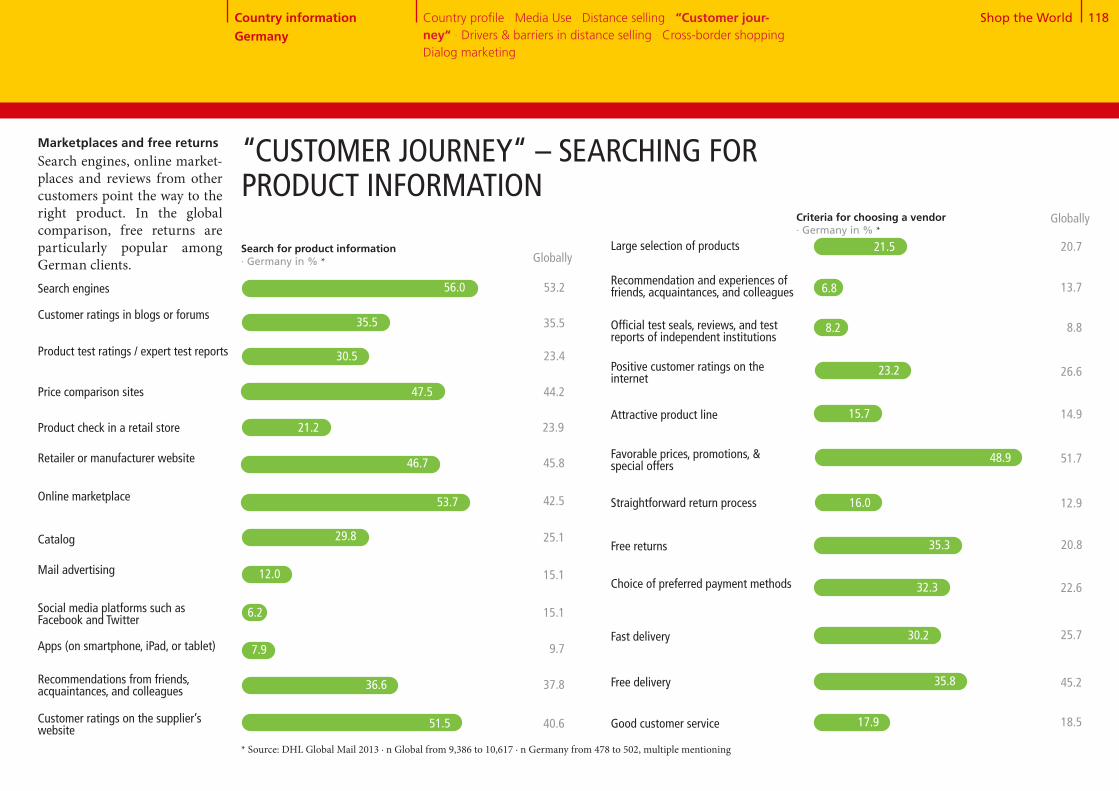
Shop the World 118
Search engines
Customer ratings in blogs or forums
Product test ratings / expert test reports
Product check in a retail store
Retailer or manufacturer website
Online marketplace
Catalog
Mail advertising
Social media platforms such as Facebook and Twitter
Apps (on smartphone, iPad, or tablet)
Recommendations from friends, acquaintances, and colleagues
Customer ratings on the supplier’s website
Price comparison sites
Large selection of products
Recommendation and experiences of friends, acquaintances, and colleagues
Official test seals, reviews, and test reports of independent institutions
Attractive product line
Favorable prices, promotions, & special offers
Straightforward return process
Free returns
Choice of preferred payment methods
Fast delivery
Free delivery
Good customer service
Positive customer ratings on the internet
“CUSTOMER JOURNEY“ – SEARCHING FOR PRODUCT INFORMATION
Search for product information · Germany in % * Globally
35.5 35.5
53.2
30.5 23.4
47.5 44.2
21.2 23.9
46.7 45.8
53.7 42.5
29.8 25.1
12.0 15.1
6.2 15.1
7.9 9.7
36.6 37.8
Criteria for choosing a vendor · Germany in % *
Globally
56.0
51.5 40.6
6.8 13.7
20.7
8.2 8.8
23.2 26.6
15.7 14.9
48.9 51.7
16.0 12.9
35.3 20.8
32.3 22.6
30.2 25.7
35.8 45.2
17.9 18.5
21.5
Marketplaces and free returnsSearch engines, online market-places and reviews from other customers point the way to the right product. In the global comparison, free returns are particularly popular among German clients.
* Source: DHL Global Mail 2013 ∙ n Global from 9,386 to 10,617 ∙ n Germany from 478 to 502, multiple mentioning
Country information Germany
Country profile · Media Use · Distance selling · “Customer jour-ney“ · Drivers & barriers in distance selling · Cross-border shopping · Dialog marketing

Shop the World 119
Usefulness of advertising media · in % *, **
5 and 63 and 41 and 2
Ø
44.536.5 19.026.1 43.8 30.1
Online advertising
* Source: DHL Global Mail 2013 ∙ n Global from 10,218 to 10,384 ∙ n Germany from 474 to 494 ** scale from 1 "absolutely not useful" to 6 "very useful“
Bargain hunting
Search engines (64.1%) and price comparison websites (62%) know how to convince rational consumers and provide them with useful product in-formation. Nevertheless, more than a third of clients use cata-logs as a useful source of infor-mation.
ACCEPTANCE OF ADVERTISING MEDIA
Germany Globally
Country information Germany
Country profile · Media Use · Distance selling · “Customer jour-ney“ · Drivers & barriers in distance selling · Cross-border shopping · Dialog marketing
Television advertising
5 and 63 and 41 and 2
3.13.6
Ø
37.943.7 18.430.6 41.8 27.6
2.93.4
36.649.4 14.038.7 40.4 20.9Social media
Germany Globally
Advertising letters
2.73.1
34.852.5 12.833.9 37.6 28.5
2.63.4
Product suggestions in online shops
44.125.1 30.918.9 45.1 36.0
3.63.9
28.96.9 64.16.5 28.7 64.8
4.84.8
30.18.0 62.09.1 31.7 59.1
4.64.6
41.630.4 28.129.9 43.9 26.2
Germany Globally
Household advertising
3.43.4
47.534.3 18.129.0 46.7 24.3
Germany Globally
Advertisements in mag- azines and periodicals
3.23.4
46.138.6 15.434.8 43.1 22.1
Germany Globally
Advertisements in newspapers
3.03.2
35.356.2 8.641.8 40.7 17.6
Germany Globally
Billboard advertise-ment
2.53.0
35.155.0 9.944.3 38.8 16.9
Germany Globally
Radio
2.52.9
44.217.9 37.919.3 44.2 36.6
Germany Globally
Catalogs from vendors
3.93.9
GermanyGlobally
Germany Globally
Germany Globally
Internet search engines
Germany Globally
Price comparison sites
Germany Globally
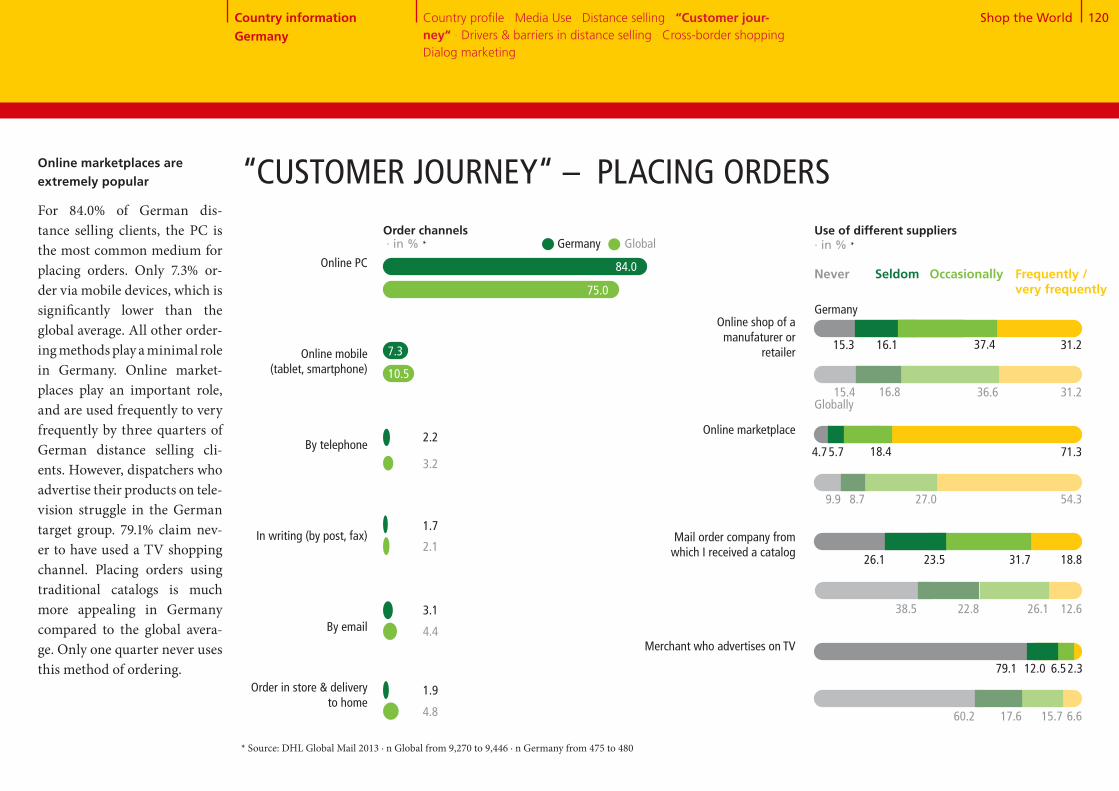
Shop the World 120
Online PC
Online mobile (tablet, smartphone)
By telephone
In writing (by post, fax)
By email
Order in store & delivery to home
Online marketplace
Mail order company from which I received a catalog
Merchant who advertises on TV
Online shop of a manufaturer or
retailer
Use of different suppliers · in % *
Never Frequently / very frequently
Occasionally
* Source: DHL Global Mail 2013 ∙ n Global from 9,270 to 9,446 ∙ n Germany from 475 to 480
Germany Global
84.0
2.2
1.7
3.1
75.0
3.2
2.1
4.4
“CUSTOMER JOURNEY“ – PLACING ORDERSOnline marketplaces are extremely popular
For 84.0% of German dis- tance selling clients, the PC is the most common medium for placing orders. Only 7.3% or-der via mobile devices, which is significantly lower than the global average. All other order- ing methods play a minimal role in Germany. Online market- places play an important role, and are used frequently to very frequently by three quarters of German distance selling cli-ents. However, dispatchers who advertise their products on tele- vision struggle in the German target group. 79.1% claim nev-er to have used a TV shopping channel. Placing orders using traditional catalogs is much more appealing in Germany compared to the global avera-ge. Only one quarter never uses this method of ordering.
15.3 31.216.1
15.4 31.216.8
37.4
36.6
Germany
Globally
4.7 71.35.7
9.9 54.38.7
18.4
27.0
26.1 18.823.5
38.5 12.622.8
31.7
26.1
79.1 2.312.0
60.2 6.617.6
6.5
15.7
7.3
10.5
1.9
4.8
Order channels · in % *
Country information Germany
Country profile · Media Use · Distance selling · “Customer jour-ney“ · Drivers & barriers in distance selling · Cross-border shopping · Dialog marketing
Seldom

Shop the World 121
Control is better
Germans like to play it safe: They mostly use online pay-ment systems, pay by invoice or direct debit and are reluctant to trust providers. Advance payments or payments using a credit card are therefore rarely preferred. In Germany, the latter method is used much less frequently compared to the glob- al average and more than half of clients refuse to use a credit card at all. Cash on delivery, installment and debit card pay-ments are virtually unheard of in German.
Cash on delivery
Prepayment
Direct debit
Credit card
* Source: DHL Global Mail 2013 ∙ n Global from 9,218 to 9,324 ∙ n Germany from 472 to 476
“CUSTOMER JOURNEY“– PAYMENT METHODS
Online payment systems
Installment purchase / financing
Debit card
Invoice
Payment options · in % *
Never Frequently / very frequentlyOccasionally
Germany
Globally
53.5 13.8 18.8 13.9
29.3 9.8 18.7 42.3
81.3 12.3 4.0 2.5
55.8 16.3 16.1 11.7
45.6 29.0 17.3 8.2
53.4 16.1 15.5 15.0
23.3 20.7 28.3 27.7
56.0 15.5 16.4 12.1
13.0 18.5 34.0 34.5
54.4 15.8 16.3 13.4
23.9 9.4 17.7 49.0
33.3 12.9 20.1 33.7
84.0 9.6 4.1 2.3
78.0 9.5 8.1 4.4
95.1 2.41.51.1
55.1 10.8 15.7 18.4
Country information Germany
Country profile · Media Use · Distance selling · “Customer jour-ney“ · Drivers & barriers in distance selling · Cross-border shopping · Dialog marketing
Seldom

Shop the World 122
The option of selecting the shipping company The vendor only works with reliable delivery companies
Detailed information regarding delivery period & delivery date when ordering
Fast delivery
Free delivery
Tracking information
Delivery to a retail store
Delivery to a parcel locker or drop box
Other collection points (supermar-ket, kiosk, gas station)
Germany Globally
3.2
2.6
2.8
5.0
4.5
4.9
3.4
4.8
4.7
Max. accepted order time · Ø in days *
3.6
3.5
3.7
5.3
4.8
5.1
3.8
4.9
4.7
* Source: DHL Global Mail 2013 ∙ n Global from 10,270 to 10,462 ∙ n Germany from 489 to 499 ** scale from 1 "absolutely not important“ to 6 "very important“
Highest expectations
People are used to getting what they want quickly in Germany. The maximum accepted time from click to delivery is 5 days, although shorter delivery times are more commonplace. Recip- ients attach great importance to detailed delivery informa- tion. Packstation collection booths are particularly impor- tant for heavy users.
“CUSTOMER JOURNEY“ – DELIVERY
1 2 3 4 5 6
Requirements for delivery · Ø *,**
Country information Germany
Country profile · Media Use · Distance selling · “Customer jour-ney“ · Drivers & barriers in distance selling · Cross-border shopping · Dialog marketing
5.0
6.5
Germany Globally
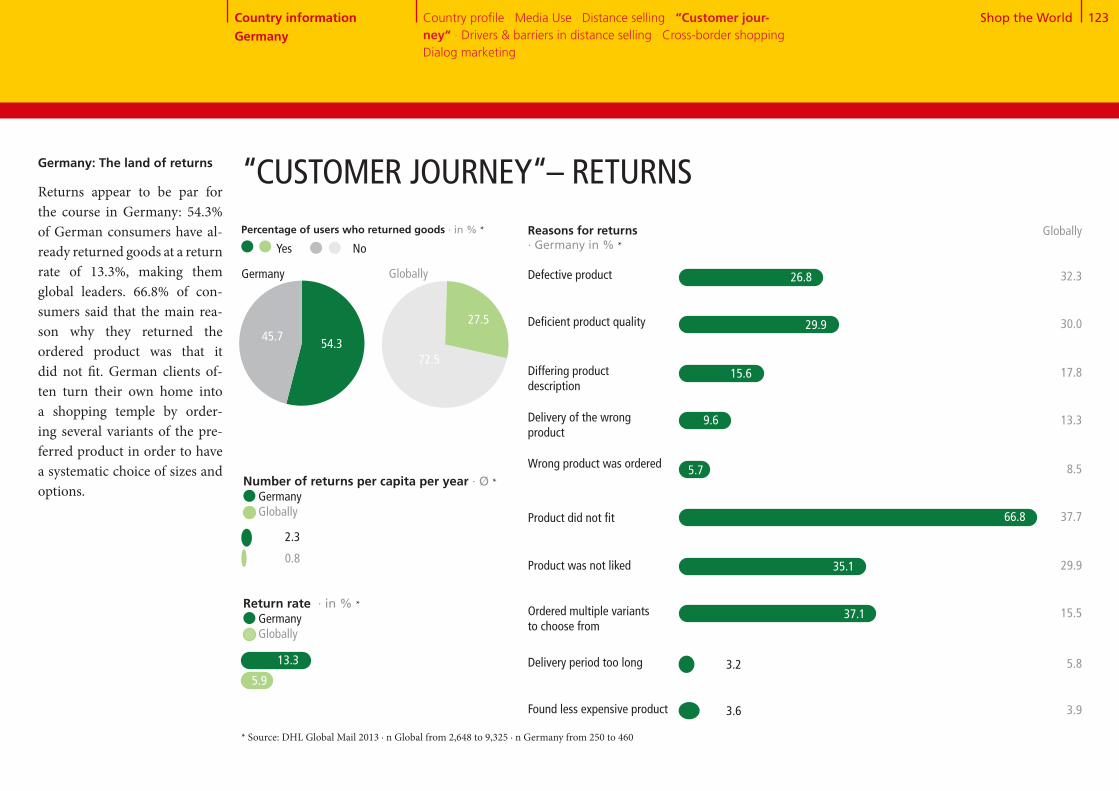
Shop the World 123
54+46
72+28
Number of returns per capita per year · Ø * Germany Globally
0.8
2.3
Return rate · in % * Germany Globally
5.9
Reasons for returns · Germany in % *
Defective product 26.8
Percentage of users who returned goods · in % *
54.345.7
Germany Globally
Yes No
“CUSTOMER JOURNEY“– RETURNSGermany: The land of returns
Returns appear to be par for the course in Germany: 54.3% of German consumers have al- ready returned goods at a return rate of 13.3%, making them global leaders. 66.8% of con- sumers said that the main rea-son why they returned the ordered product was that it did not fit. German clients of-ten turn their own home into a shopping temple by order- ing several variants of the pre- ferred product in order to have a systematic choice of sizes and options.
27.5
72.5
* Source: DHL Global Mail 2013 ∙ n Global from 2,648 to 9,325 ∙ n Germany from 250 to 460
Differing product description
Delivery of the wrong product
Wrong product was ordered
Product did not fit
Ordered multiple variants to choose from
Delivery period too long
Found less expensive product
Deficient product quality
Product was not liked
15.6
9.6
66.8
35.1
37.1
3.2
3.6
Globally
32.3
30.0
17.8
13.3
8.5
37.7
29.9
15.5
5.8
3.9
29.9
5.7
Country information Germany
Country profile · Media Use · Distance selling · “Customer jour-ney“ · Drivers & barriers in distance selling · Cross-border shopping · Dialog marketing
13.3

Shop the World 124
High delivery costs
Uncertain delivery
Concern about misuse of payment data
No demand because all products are obtainable locally
Long delivery times
Unknown product quality
No try-on possible before purchase
Complicated return process
No personal advice
No personal contact person for problems
Doubts regarding data protection or the dissemination of data to third parties
Concern about counterfeited products, product piracy
Product can only be obtained via distance selling
Easy price comparison
Shopping 24/7
Location-independent ordering
Higher product quality
Lower prices
Greater selection
Option to deliver to a preferred location
DRIVERS & BARRIERS IN DISTANCE SELLING Barriers
· Germany in % *
50.8
54.6
72.6
63.5
7.8
59.1
46.0
67.3
62.1
65.4
78.4
Globally
36.6
24.2
34.4
3.9
25.8
48.5
64.9
44.1
21.5
22.0
29.8
34.1
24/7 – Around the clock
The most important drivers in the German distance selling business can be attributed to convenience: Shopping around the clock, convenient deliveries and simple price comparisons are top of the list.
Drivers · Germany in % *
Globally
* Source: DHL Global Mail 2013 ∙ n Global from 10,509 to 10,864 ∙ n Germany from 455 to 500
54.4
72.0
85.1
59.5
4.4
41.2
13.5
37.9
2.0
15.4
44.2
64.1
26.6
31.0
16.8
32.2
24.5
Country information Germany
Country profile · Media Use · Distance selling · “Customer jour-ney“ · Drivers & barriers in distance selling · Cross-border shopping · Dialog marketing
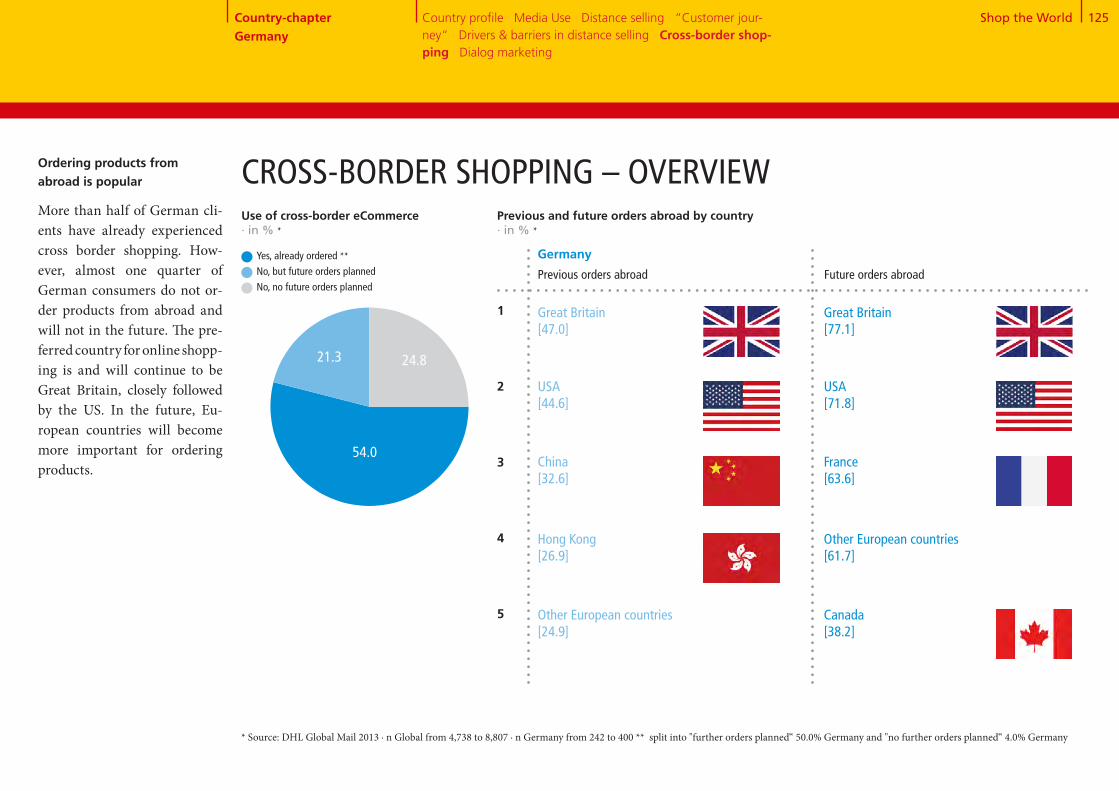
Shop the World 125
54+21+25
CROSS-BORDER SHOPPING – OVERVIEW
Previous orders abroad
Previous and future orders abroad by country · in % *
Hong Kong[26.9]
Other European countries[24.9]
1
2
3
4
5
Great Britain[47.0]
USA[44.6]
China[32.6]
Future orders abroad
Germany
* Source: DHL Global Mail 2013 ∙ n Global from 4,738 to 8,807 ∙ n Germany from 242 to 400 ** split into "further orders planned“ 50.0% Germany and "no further orders planned“ 4.0% Germany
Ordering products from abroad is popular
More than half of German cli-ents have already experienced cross border shopping. How-ever, almost one quarter of German consumers do not or-der products from abroad and will not in the future. The pre- ferred country for online shopp- ing is and will continue to be Great Britain, closely followed by the US. In the future, Eu-ropean countries will become more important for ordering products.
Other European countries[61.7]
Canada[38.2]
Great Britain[77.1]
USA[71.8]
France[63.6]
Country-chapter Germany
Use of cross-border eCommerce · in % *
Yes, already ordered **No, but future orders planned No, no future orders planned
54.0
24.821.3
Country profile · Media Use · Distance selling · “Customer jour-ney“ · Drivers & barriers in distance selling · Cross-border shop-ping · Dialog marketing

Shop the World 126
Products not obtainable domestically
Higher quality of the products
Lower prices
Greater selection
Assurance against product counter-
feiting
High delivery costs Language problems
Customs clearance
Non-transparent costs
Uncertainty with problems
No demand because all products are obtainable locally
Long delivery times
Unknown product quality
Complicated return process
Concerns regarding data protection Fear of fraud Uncertain delivery
Concern about misuse of payment data
Uncertainty regarding warranty terms, payment process, legal situation, etc.
Drivers for ordering abroad· Germany in % *
Barriers to ordering abroad · Germany in % *
Globally
73.3
24.2
62.9
41.2
11.7
Globally
53.7
31.6
41.3
41.3
33.3
12.5
56.1
35.7
50.8
24.5
41.6
39.5
31.6
39.3
Variety abroad
The strongest drivers for for-eign orders are the availability of products and lower prices. However, some of the major barriers for purchasing abroad include a complicated product returns process and customs formalities.
CROSS-BORDER SHOPPING – DRIVERS & BARRIERS
* Source: DHL Global Mail 2013 ∙ n Global from 7,289 to 10,689 ∙ n Germany from 328 to 489
60.3
27.7
62.5
52.9
38.0
14.9
57.2
36.7
65.6
33.4
48.9
45.2
42.7
51.3
80.3
5.5
65.0
26.1
3.7
Country information Germany
Country profile · Media Use · Distance selling · “Customer jour-ney“ · Drivers & barriers in distance selling · Cross-border shop-ping · Dialog marketing

Shop the World 127
Receipt of mailings and catalogs · Germany in % *
5 and 63 and 41 and 2
DIALOG MARKETING
Reading mailings and catalogs · in % *,**
Germany
Globally
20.8 34.5 44.7
22.1 35.2 42.7
5 and 63 and 41 and 2
Response to mailings and catalogs · in % *,**
Germany
Globally
30.8 51.9 17.3
29.0 45.8 25.3
Response channel for mailings and catalogs · Germany in % * Globally
Website visits
Visits to stores or
branch offices
Other online
response (e.g. chat,
Twitter, Facebook,
newsletter
registration, etc.)
Phone call
Business reply card
77.1 73.4
48.6
30.0
24.5
18.4
12.6
* Source: DHL Global Mail 2013 ∙ n Global from 8,788 to 11,265 ∙ n Germany from 405 to 514 ** scale from 1 "never“ to 6 "almost always“
Nationwide mailings
The receipt of mailings and cata- logs is so widespread in Ger-many that only 3.1% of Ger-mans claim that companies never contact them using this method. One third of Germ-ans receive purchase informa-tion one or more times a week. While Germans read these of-fers more frequently than the global average, they are more reluctant to respond to mailings and catalogs in any other way. When they do respond, how- ever, 77.1% visit the website while 43.6% follow up with a visit to a local retail outlet. Other response channels play a minor role, even in the global comparison.
Globally
One or more times per week
One or more times per month
Less than once per month
Never
26.9
33.7
27.7
11.6 43.6
19.3
17.5
11.8
9.9
37.1
38.6
21.2
3.1
Country information Germany
Country profile · Media Use · Distance selling · “Customer jour-ney“ · Drivers & barriers in distance selling · Cross-border shop-ping · Dialog marketing
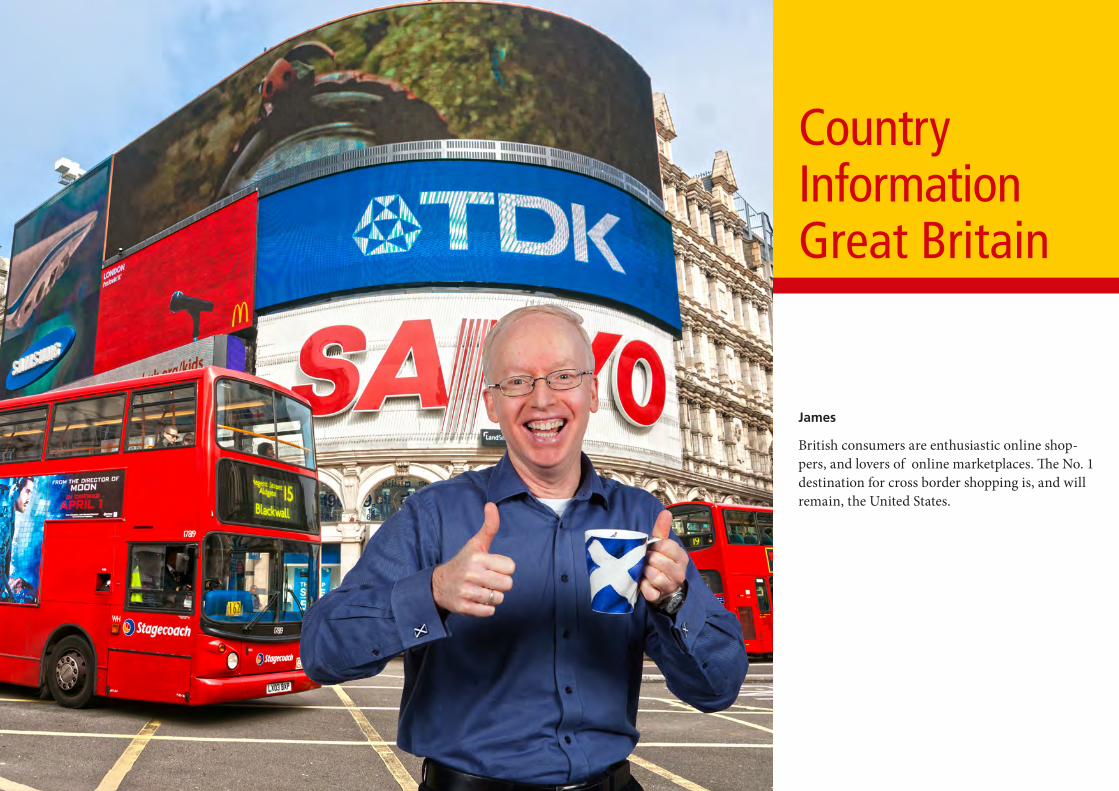
Country InformationGreat Britain
James
British consumers are enthusiastic online shop-pers, and lovers of online marketplaces. The No. 1 destination for cross border shopping is, and will remain, the United States.

Shop the World 129Country information Great Britain
11.6
Population 0 - 15 years
The economy in Great Britain * COUNTRY PROFILE GREAT BRITAIN
Birmingham 2,273
London 8,923
* Source: Fischer World Almanac 2014, Germany Trade & Invest ** Source: Metropolitan areas with 1 million inhabitants and more; United Nations, Department of Economic and Social Affairs, Po-pulation Division (2012). World Urbanization Prospects: The 2011 Revision, CD-ROM Edition. *** Source: Copyright © IHS, 2013. All rights reserved **** Source: Copyright © IHS, 2013. All rights reserved
Number of households Ø Household sizeUnemployment rateInflation rate
0.3
Economic growth · in % ****
>
>
1.91.1
2011 2012 2013
Age distribution · 2013 in mn.
Population 65 years and older
Population, total · 2013 in mn. 62.8 ***
Population 16 - 64 years
· 2013 in mn.· 2013· 2013 in %· 2013 in %
26.3 2.47.62.6
The economic upturn is picking up pace. Forecasts for 2014 estimate another increase in real GDP growth of 2.2% (fol-lowing 0.3% in 2012 and 1.9% in 2013). After several weak years, 2014 should see growth in the level of investment. Ex-ports contributing to almost one third of GDP should also increase in 2014. Nominal wages are growing strongly in the face of sinking infla- tion, which is favouring private consumers. Consumer credit volumes will also increase.
40.4
10.7
Manchester 2,216
Metropolitan areas with 1 million inhabitants or more · 2011 in thousands **
West Yorkshire 1,605
Glasgow 1,140
Country profile · Media Use · Distance selling · "Customer jour-ney“ · Drivers & barriers in distance selling · Cross-border shopping · Dialog marketing

Shop the World 130
27+4+1+6+41+16+5
Country information Great Britain
MEDIA USE IN GREAT BRITAIN
34.0
130.8
Smartphone market penetration · in % *****Representative domestic population 16+, n = 1,000
50.9
Internet users · 2012 per 100 people **
Permanent access to broadband internet · 2012 per 100 people ***
Cellphones · 2012 per 100 people ****
2012 2013
62.2
Share of adspend by medium · in % *
TV Radio Movies Outdoor advertising
Total advertising expenditure · in EUR bn. *
Internet Newspapers Magazines
>>
* Source: Zenith Optimedia, 2013 ** Source: Copyright © IHS, 2013. All rights reserved *** Source: The World Bank **** Source: Copyright © IHS, 2013. All rights reserved **** Source: Our Mobile Planet: Google Global Smart phone Study 2013, http://www.thinkwithgoogle.com/mobileplanet/
2011 2012 2013 2014 2015
17.8
87.0
16.9
15.9
15.1
14.8
41.2
16.0
5.2
6.4
1.23.5
26.5
2016
18.6
Internet use
The internet has tradition in the UK and is used intensively by the population of 63 mil- lion. 87% had internet access in 2012, while 34% surfed via a permanent broadband connec-tion. The British have a new best friend – the smartphone. It is used by almost two thirds of the population.
World Cup and election cam-paigns
In the land of creative advertis- ing, the internet has been the dominant medium since 2009. TV is the second most popular medium and will, like the inter-net, profit from the World Cup and the forthcoming elections.
Country profile · Media Use · Distance selling · “Customer jour-ney“ · Drivers & barriers in distance selling · Cross-border shopping · Dialog marketing

Shop the World 131
Apparel and footwear
Consumer electronics,
computers + equipment
Media products (books, CDs,
DVDs, etc.)
Housewares and home
furnishings + textiles
Food + beverages
Household and consumer
appliances
Beauty and personal care
DIY and gardening
OTC drugs and dietary supple-
ments
Traditional toys and games
House cleaning (detergent,
chastener, etc.)
European champion
The largest distance selling market in Europe displays a rel- atively low average growth rate of 4% p.a. In spite of this, media products, Household appliances and DIY / gardening still hold potential. Fashion and food are always popular among the British – they look like retaining their position as best-sellers up until 2018.
11,020.0
3,696.3
3,283.9
6,253.4
4,094.8
2,947.9
1,985.7
7,034.8
1,128.8
1,714.0
977.2
1,144.3
731.9
329.4
1,009.2
626.3
230.5
Development of distance selling and share of total retail 2011 - 2018 · in EUR bn. *
CAGR: 4.0%
Home shopping
Online shopping31.8 36.0 40.1
6.0
5.55.1
43.1 51.5
4.7
3.5
2011 2012 2013e 2014e 2018e
Share of total retail · in % 10.2 11.0 11.7 12.3 13.9
* Source: Euromonitor International
10,092.8
173.0
Country information Great Britain
5,690.2
867.5
409.6
DISTANCE SELLING IN GREAT BRITAIN
Country profile · Media Use · Distance selling · "Customer jour-ney“ · Drivers & barriers in distance selling · Cross-border shopping · Dialog marketing
Distance selling purchases in 2013 - trend for 2018 · in EUR mn. * 2013 2018
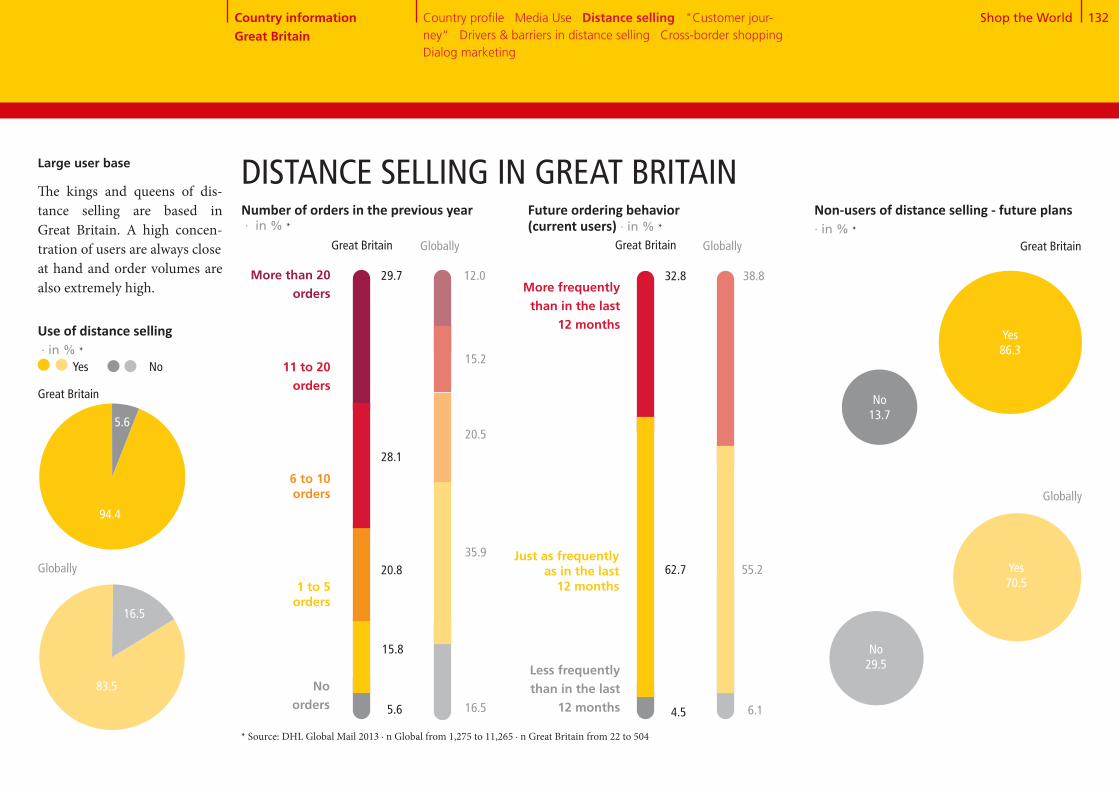
Shop the World 132
94+6
Great Britain
84+16
Large user base
The kings and queens of dis- tance selling are based in Great Britain. A high concen- tration of users are always closeat hand and order volumes are also extremely high.
Use of distance selling · in % *
94.4
5.6
Great Britain
Globally
83.5
16.5
Number of orders in the previous year · in % *
1 to 5 orders
6 to 10 orders
11 to 20 orders
More than 20 orders
No orders
20.8
15.8
28.1
5.6
29.7
20.5
35.9
15.2
16.5
12.0
Future ordering behavior (current users) · in % *
More frequently than in the last
12 months
Just as frequently as in the last
12 months
Less frequently than in the last
12 months
62.7
32.8
55.2
38.8
4.5 6.1
Non-users of distance selling - future plans · in % *
Yes86.3
Great Britain
Globally
Yes70.5
No13.7
No29.5
Yes No
Great Britain Globally Globally
DISTANCE SELLING IN GREAT BRITAIN
* Source: DHL Global Mail 2013 ∙ n Global from 1,275 to 11,265 ∙ n Great Britain from 22 to 504
Country information Great Britain
Country profile · Media Use · Distance selling · "Customer jour-ney“ · Drivers & barriers in distance selling · Cross-border shopping · Dialog marketing

Shop the World 133
Globally*
48.4
Gender · in % Male Female
Age · in % <30 yrs. 30-49 yrs. 50 yrs. +
Occupation · in % Employed Unemployed
Education · in % Lower educational level Medium and higher level of education
Media affinity: Online · in % yes**
Community size · in % Rural (<50,000 inhabitants) Non-rural/urban (>50,000 inhabitants)
Minors in the household · Ø
Household type · in % Single 2-person household without children Household with children Household with 3 adults
Mobile Internet usage · in % Yes No
Gross household income · in % Low income Medium income High income
Media affinity: Classic · in % yes**
Media affinity: Dialog marketing · in % yes** 32.7
20.7
79.2
36.633.9
29.5
27.972.1
20.838.0
47.825.8
52.2
25.9
90.4
52.5
0.7
31.99.3
74.1
Mobile savvy
Heavy users in distance sellingcan be characterized as having a high level of mobile internet usage. Almost three quarters ofthis important customer group have mobile access to the inter-net. From a global viewpoint, heavy users are found most frequently in rural areas, have a higher average age (50+) and appreciate the benefits of home delivery. Their affinity to online media is high, but still slightly below the global online average. The reluctance towards classic media and dialog marketing is clearly more pronounced. Only one in five heavy users feels a strong affiliation to traditional media.
DISTANCE SELLING IN GREAT BRITAIN
* Source: DHL Global Mail 2013 ∙ n Global from 2,661 to 11,265 ∙ n Great Britain from 120 to 504 ** media affinity for online / classic / dialog marketing, if at least one medium from the respective area was rated 5 or 6 on a scale of 1 "absolutely not useful" to 6 "very useful" *** the top third of most active mail order users
44.327.1
14.4
36.4
46.9
36.5
80.8
33.734.232.1
45.754.3
22.443.0
50.0
28.6
50.0
29.4
85.6
63.6
0.7
23.411.2
70.6
Country information Great Britain
***
Great Britain*
42.329.3
12.3
46.4
27.5
20.7
77.0
28.534.936.6
33.067.0
23.132.9
50.0
28.4
50.0
28.5
87.7
53.6
0.6
30.813.2
71.5
25.9
47.5
Heavy users* Global heavy users*
9.6
Country profile · Media Use · Distance selling · "Customer jour-ney“ · Drivers & barriers in distance selling · Cross-border shopping · Dialog marketing

Shop the World 134
“CUSTOMER JOURNEY“ – SEARCHING FOR PRODUCT INFORMATION
Search for product information · Great Britain in % * Globally
40.3 35.5
53.2
29.7 23.4
33.6 44.2
30.6 23.9
52.4 45.8
58.2 42.5
19.7 25.1
11.6 15.1
6.4 15.1
10.4 9.7
42.9 37.8
Criteria for choosing a vendor · Great Britain in % *
Globally
Search engines 60.0
Customer ratings in blogs or forums
Product test ratings / expert test reports
Product check in a retail store
Retailer or manufacturer website
Online marketplace
Catalog
Mail advertising
Social media platforms such as Face-book and Twitter
Apps (on smartphone, iPad, or tablet)
Recommendations from friends, acquaintances, and colleagues
52.2 40.6Customer ratings on the supplier‘s website
Price comparison sites
Large selection of products
Recommendation and experiences of friends, acquaintances, and colleagues
Official test seals, reviews, and test reports of independent institutions
Attractive product line
Favorable prices, promotions, & special offers
Straightforward return process
Free returns
Choice of preferred payment methods
Fast delivery
Free delivery
Good customer service
Positive customer ratings on the internet
12.3 13.7
20.7
9.4 8.8
30.7 26.6
12.3 14.9
55.4 51.7
14.2 12.9
22.4 20.8
17.8 22.6
24.8 25.7
52.0 45.2
18.3 18.5
19.3
Search engines preferredIn the UK, search engines and online marketplaces are the preferred methods of searching for information. Furthermore, customer reviews have a strong influence on product selection.
* Source: DHL Global Mail 2013 ∙ n Global from 9,386 to 10,617 ∙ n Great Britain from 471 to 498, multiple mentioning
Country information Great Britain
Country profile · Media Use · Distance selling · “Customer jour-ney“ · Drivers & barriers in distance selling · Cross-border shopping · Dialog marketing

Shop the World 135
Acceptance of advertising media · in % *, **
5 and 63 and 41 and 2
Ø
45.435.0 19.726.1 43.8 30.1
Online advertising
* Source: DHL Global Mail 2013 ∙ n Global from 10,218 to 10,384 ∙ n Great Britain from 478 to 492 ** scale from 1 "absolutely not useful" to 6 "very useful“
Demanding target group
The British are rather wary when it comes to advertising media. In general they do not consider advertising media to be particularly useful. All types of media are scrutinized with suspicion. Only search engines are considered to be usefull by two thirds of respondents.
USEFULNESS OF ADVERTISING MEDIA
Great BritainGlobally
Country information Great Britain
Television advertising
5 and 63 and 41 and 2
3.13.6
Ø
37.850.4 11.830.6 41.8 27.6
2.73.4
33.954.8 11.338.7 40.4 20.9Social media
Great BritainGlobally
Advertising letters
2.53.1
31.657.2 11.233.9 37.6 28.5
2.53.4
Product suggestions in online shops
46.129.5 24.318.9 45.1 36.0
3.43.9
28.45.5 66.26.5 28.7 64.8
4.84.8
39.414.6 46.19.1 31.7 59.1
4.24.6
37.052.1 10.929.9 43.9 26.2
Great BritainGlobally
Household advertising
2.63.4
44.141.5 14.429.0 46.7 24.3
Great BritainGlobally
Advertisements in mag- azines and periodicals
2.93.4
34.353.1 12.634.8 43.1 22.1
Great BritainGlobally
Advertisements in newspapers
2.63.2
27.165.7 7.241.8 40.7 17.6
Great BritainGlobally
Billboard advertise-ments
2.23.0
29.064.7 6.344.3 38.8 16.9
Great BritainGlobally
Radio
2.22.9
44.731.9 23.419.3 44.2 36.6
Great BritainGlobally
Catalogs from vendors
3.33.9
Great BritainGlobally
Great BritainGlobally
Great BritainGlobally
Internet search engines
Great BritainGlobally
Price comparison sites
Great BritainGlobally
Country profile · Media Use · Distance selling · "Customer jour-ney“ · Drivers & barriers in distance selling · Cross-border shopping · Dialog marketing

Shop the World 136
Online PC
Online mobile (tablet, smartphone)
By telephone
In writing (by post, fax)
By email
Order in store & delivery to home
Country profile · Media Use · Distance selling · "Customer jour-ney“ · Drivers & barriers in distance selling · Cross-border shopping · Dialog marketing
Use of different suppliers · in % *
Merchant who advertises on TV
Never Seldom Frequently / very frequently
Occasionally
* Source: DHL Global Mail 2013 ∙ n Global from 9,270 to 9,446 ∙ n Great Britain from 472 to 476
Great Britain Global
77.6
2.5
1.3
3.6
75.0
3.2
2.1
4.4
“CUSTOMER JOURNEY“ – PLACING ORDERSOnline triumphs
The British preference for cer-tain ordering channels is only slightly different from the glob- al trend. Placing orders online using a PC is the clear favorite at almost 78%. Around one in ten people prefers mobile access using a tablet or smartphone. The vast majority of people in Britain (79%) visit online mar-ketplaces to choose and order products. Independent online shops are relatively popular, but the products on offer do not compare to the comprehensive range found in online market-places. The traditional catalog or teleshopping ordering chan-nels rarely appeal.
10.3 31.518.9
15.4 31.216.8
39.3
36.6
Great Britain
Globally
1.9 79.02.1
9.9 54.38.7
17.0
27.0
48.1 10.018.3
38.5 12.622.8
23.5
26.1
75.5 5.112.0
60.2 6.617.6
7.4
15.7
10.3
10.5
4.6
4.8
Order channels · in % *
Country information Great Britain
Online marketplace
Mail order company from which I received a catalog
Online shop of a manufaturer or
retailer

Shop the World 137Country profile · Media Use · Distance selling · "Customer jour-ney“ · Drivers & barriers in distance selling · Cross-border shopping · Dialog marketing
Debit cards lead the way
Debit cards, online payment systems, and credit cards are evidently the only types of payment option required in Great Britain. Debit cards are the most common form of pay-ment with more than half of all clients using debit cards fre-quently to very frequently. Af-ter debit cards, online payment systems and credit cards are used at approximately the same frequency but almost a third of consumers have not used a cred- it card yet.
Cash on delivery
Prepayment
Direct debit
Credit card
* Source: DHL Global Mail 2013 ∙ n Global from 9,218 to 9,324 ∙ n Great Britain from 465 to 474
“CUSTOMER JOURNEY“– PAYMENT METHODS
Online payment systems
Installment purchase / financing
Debit card
Invoice
Payment options · in % *
Never Seldom Frequently / very frequentlyOccasionally
Great Britain
Globally
31.4 7.0 17.3 44.3
29.3 9.8 18.7 42.3
85.1 10.2 3.6 1.1
55.8 16.3 16.1 11.7
81.3 7.7 5.2 5.8
53.4 16.1 15.5 15.0
72.3 11.4 9.3 6.9
56.0 15.5 16.4 12.1
77.2 12.6 7.6 2.5
54.4 15.8 16.3 13.4
18.0 10.6 25.9 45.4
33.3 12.9 20.1 33.7
90.5 5.7 2.31.5
78.0 9.5 8.1 4.4
10.5 11.8 27.1 50.6
55.1 10.8 15.7 18.4
Country information Great Britain
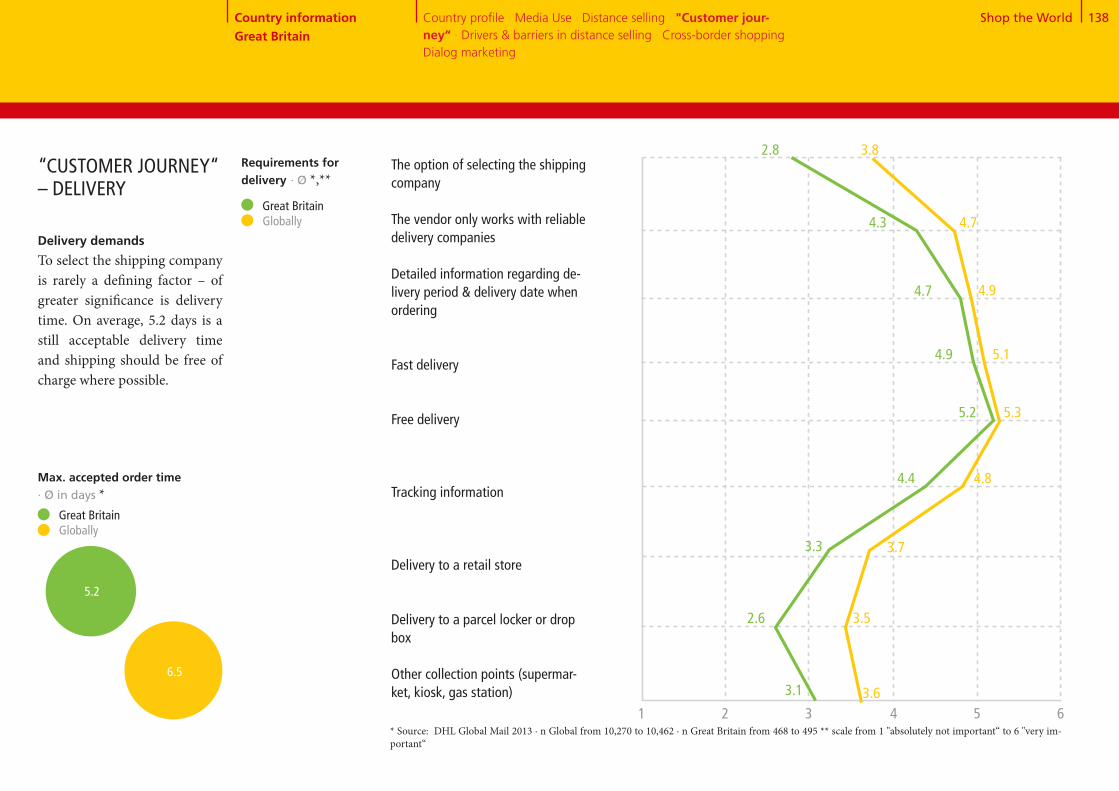
Shop the World 138
The option of selecting the shipping company The vendor only works with reliable delivery companies
Detailed information regarding de-livery period & delivery date when ordering
Fast delivery
Free delivery
Tracking information
Delivery to a retail store
Delivery to a parcel locker or drop box
Other collection points (supermar-ket, kiosk, gas station)
Country profile · Media Use · Distance selling · "Customer jour-ney“ · Drivers & barriers in distance selling · Cross-border shopping · Dialog marketing
Great Britain Globally
3.1
2.6
3.3
5.2
4.4
4.9
2.8
4.7
4.3
Max. accepted order time · Ø in days *
3.6
3.5
3.7
5.3
4.8
5.1
3.8
4.9
4.7
* Source: DHL Global Mail 2013 ∙ n Global from 10,270 to 10,462 ∙ n Great Britain from 468 to 495 ** scale from 1 "absolutely not important“ to 6 "very im-portant“
Delivery demands
To select the shipping company is rarely a defining factor – of greater significance is delivery time. On average, 5.2 days is a still acceptable delivery time and shipping should be free of charge where possible.
“CUSTOMER JOURNEY“ – DELIVERY
1 2 3 4 5 6
Requirements for delivery · Ø *,**
Country information Great Britain
5.2
6.5
Great Britain Globally
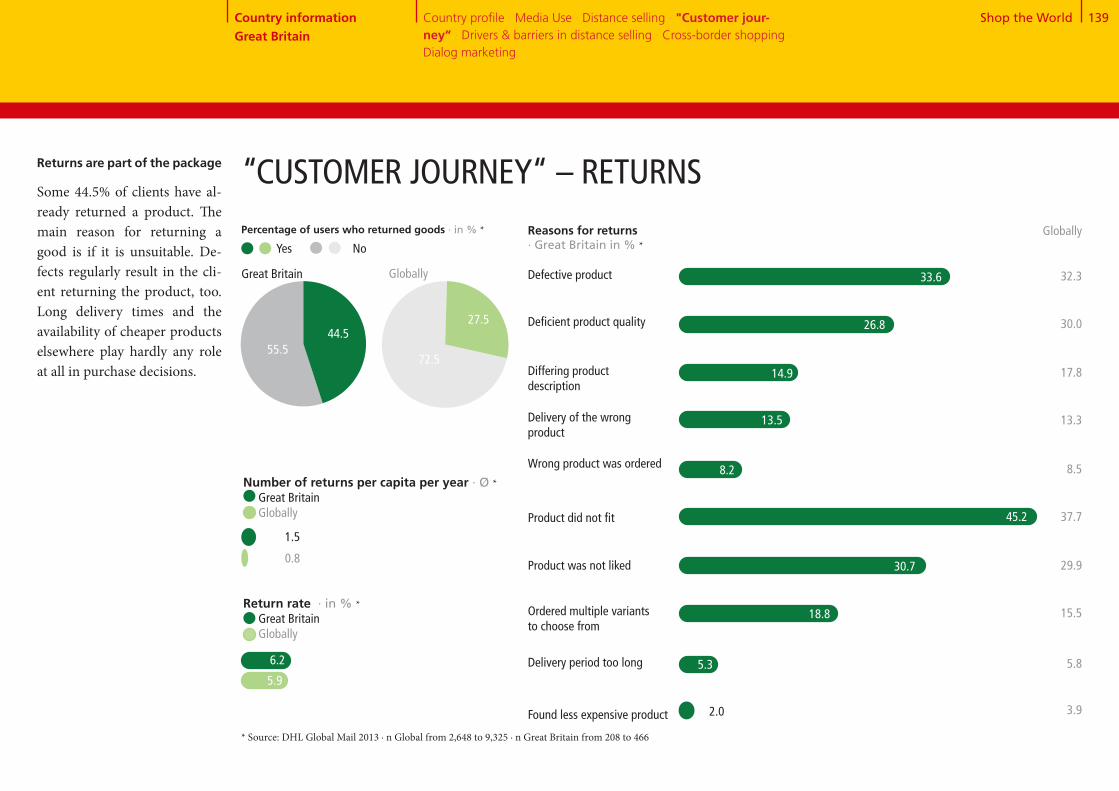
Shop the World 139Country profile · Media Use · Distance selling · "Customer jour-ney“ · Drivers & barriers in distance selling · Cross-border shopping · Dialog marketing
55+45 72+28
Number of returns per capita per year · Ø * Great Britain Globally
0.8
1.5
Return rate · in % * Great Britain Globally
5.9
Reasons for returns · Great Britain in % *
Defective product 33.6
Percentage of users who returned goods · in % *
44.555.5
Great Britain Globally
Yes No
“CUSTOMER JOURNEY“ – RETURNSReturns are part of the package
Some 44.5% of clients have al-ready returned a product. The main reason for returning a good is if it is unsuitable. De-fects regularly result in the cli-ent returning the product, too. Long delivery times and the availability of cheaper products elsewhere play hardly any role at all in purchase decisions.
27.5
72.5
* Source: DHL Global Mail 2013 ∙ n Global from 2,648 to 9,325 ∙ n Great Britain from 208 to 466
Differing product description
Delivery of the wrong product
Wrong product was ordered
Product did not fit
Ordered multiple variants to choose from
Delivery period too long
Found less expensive product
Deficient product quality
Product was not liked
14.9
13.5
45.2
30.7
18.8
5.3
2.0
Globally
32.3
30.0
17.8
13.3
8.5
37.7
29.9
15.5
5.8
3.9
26.8
8.2
Country information Great Britain
6.2

Shop the World 140
High delivery costs
Uncertain delivery
Concern about misuse of payment data
No demand because all products are obtainable locally
Long delivery times
Unknown product quality
No try-on possible before purchase
Complicated return process
No personal advice
No personal contact person for problems
Doubts regarding data protection or thedissemination of data to third parties
Concern about counterfeited products, product piracy
DRIVERS & BARRIERS IN DISTANCE SELLING
Product can only be obtained via distance selling
Easy price comparison
Shopping 24/7
Location-independent ordering
Higher product quality
Lower prices
Greater selection
Option to deliver to a preferred location
Barriers · Great Britain in % *
50.8
54.6
72.6
63.5
7.8
59.1
46.0
67.3
68.3
56.1
72.3
Globally
36.6
24.2
34.4
3.9
25.8
48.5
64.9
44.1
21.5
22.0
29.8
34.1
Shopping around the clock
Shopping around the clock is the main reason why the Britishare attracted to distance selling. Low prices and home deliveries also play a role.
Drivers · Great Britain in % *
Globally
* Source: DHL Global Mail 2013 ∙ n Global from 10,509 to 10,864 ∙ n Great Britain from 488 to 496
58.3
52.0
82.5
70.0
3.7
41.7
22.5
33.1
1.2
24.4
52.9
73.8
47.1
18.8
22.7
25.5
30.3
Country information Great Britain
Country profile · Media Use · Distance selling · "Customer jour-ney“· Drivers & barriers in distance selling · Cross-border shopping · Dialog marketing
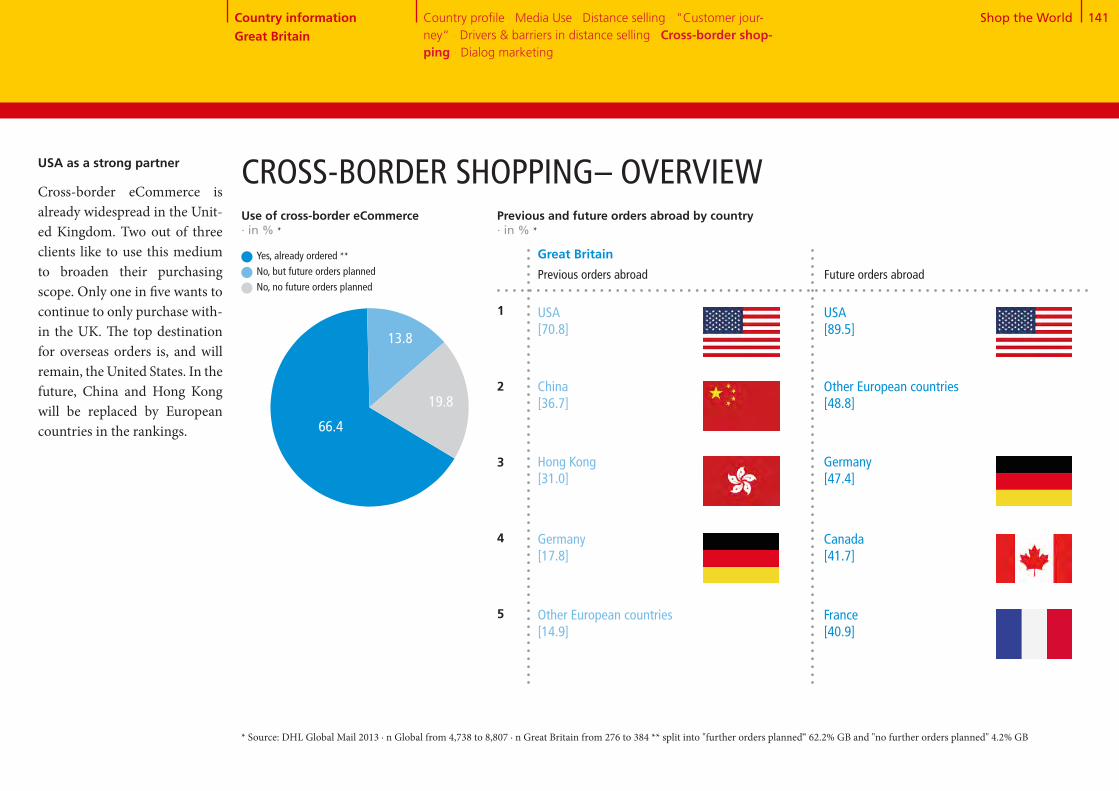
Shop the World 141
66+14+20
CROSS-BORDER SHOPPING– OVERVIEW
Previous orders abroad
Previous and future orders abroad by country · in % *
Germany[17.8]
Other European countries[14.9]
1
2
3
4
5
USA[70.8]
China[36.7]
Hong Kong[31.0]
Future orders abroad
Great Britain
* Source: DHL Global Mail 2013 ∙ n Global from 4,738 to 8,807 ∙ n Great Britain from 276 to 384 ** split into "further orders planned“ 62.2% GB and "no further orders planned" 4.2% GB
USA as a strong partner
Cross-border eCommerce is already widespread in the Unit-ed Kingdom. Two out of three clients like to use this medium to broaden their purchasing scope. Only one in five wants to continue to only purchase with- in the UK. The top destination for overseas orders is, and will remain, the United States. In thefuture, China and Hong Kong will be replaced by European countries in the rankings.
Canada[41.7]
France[40.9]
USA[89.5]
Other European countries[48.8]
Germany[47.4]
Country information Great Britain
Use of cross-border eCommerce · in % *
Yes, already ordered **No, but future orders planned No, no future orders planned
13.8
66.4
19.8
Country profile · Media Use · Distance selling · "Customer jour-ney“ · Drivers & barriers in distance selling · Cross-border shop-ping · Dialog marketing

Shop the World 142
Products not obtainable domestically
Higher quality of the products
Lower prices
Greater selection
Assurance against product counter-
feiting
High delivery costs Language problems
Customs clearance
Non-transparent costs
Uncertainty with problems
No demand because all products are obtainable locally
Long delivery times
Unknown product quality
Complicated return process
Concerns regarding data protection Fear of fraud Uncertain delivery
Concern about misuse of payment data
Uncertainty regarding warranty terms, payment process, legal situation, etc.
Country profile · Media Use · Distance selling · "Customer jour-ney“ · Drivers & barriers in distance selling · Cross-border shop-ping · Dialog marketing
Drivers for ordering abroad· Great Britain in % *
Barriers to ordering abroad · Great Britain in % *
Globally
73.3
24.2
62.9
41.2
11.7
Globally
53.7
31.6
41.3
41.3
33.3
12.5
56.1
35.7
50.8
24.5
41.6
39.5
31.6
39.3
Selection and price areimportant
The British do not believe that products from abroad are better quality. However, the variety is considered and lower prices are enticing. Long delivery times and higher delivery costs are the main reasons preventing British consumers from buyingimports.
CROSS-BORDER SHOPPING – DRIVERS & BARRIERS
* Source: DHL Global Mail 2013 ∙ n Global from 7,289 to 10,689 ∙ n Great Britain from 330 to 478
54.8
26.5
32.1
40.8
39.0
13.8
63.4
45.0
49.6
24.0
49.5
44.3
38.2
39.6
69.7
5.8
61.5
31.3
1.8
Country information Great Britain

Shop the World 143Country profile · Media Use · Distance selling · "Customer jour-ney“ · Drivers & barriers in distance selling · Cross-border shop-ping · Dialog marketing
Great Britain
Receipt of mailings and catalogs · Great Britain in % *
5 and 63 and 41 and 2
DIALOG MARKETING
Reading mailings and catalogs
· in % *,**
Great Britain
Globally
40.0 38.0 22.0
22.1 35.2 42.7
5 and 63 and 41 and 2
Response to mailings and catalogs · in % *,**
Globally
51.6 35.8 12.6
29.0 45.8 25.3
Response channel for mailings and catalogs · Great Britain in % * Globally
Website visits
Visits to stores or
branch offices
Other online
response (e.g. chat,
Twitter, Facebook,
newsletter
registration, etc.)
Phone call
Business reply card
76.4 73.4
48.6
30.0
24.5
18.4
12.6
* Source: DHL Global Mail 2013 ∙ n Global from 8,788 to 11,265 ∙ n Great Britain from 337 to 504 ** scale from 1 "never“ to 6 "almost always“
Ubiquitous offers
A large number of mailings andcatalogs are regularly sent to clients in Great Britain. Almost one in three has the opportuni-ty to browse through various offers once a week or more - the recipients, however, seldom take any notice of them. Only 22.1% regularly read adverti-sing material pushed through their letterbox. Other responses are even rarer. By far the most common response channel is visiting the provider‘s website. Occasionally, clients pay a visit to the local store.
Globally
One or more times per week
One or more times per month
Less than once per month
Never
26.9
33.7
27.7
11.6 48.7
19.3
15.7
10.3
5.1
30.8
38.5
25.5
5.2
Country information Great Britain
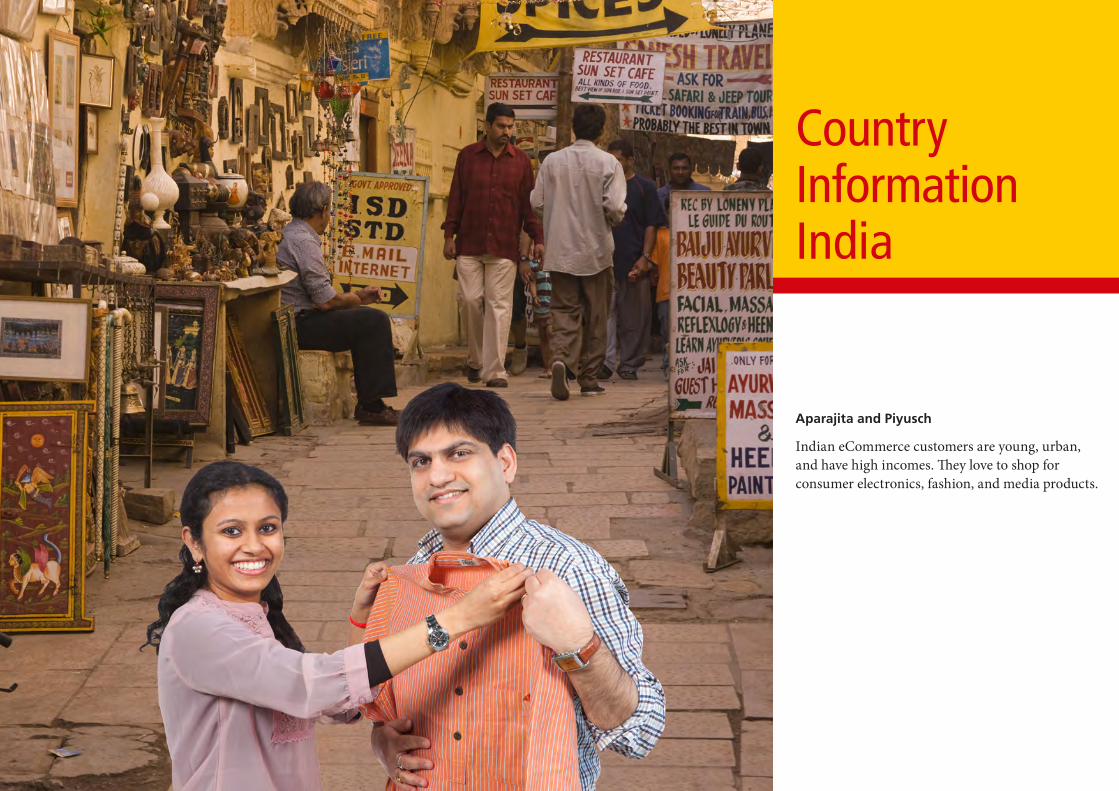
Country InformationIndia
Aparajita and Piyusch
Indian eCommerce customers are young, urban, and have high incomes. They love to shop for consumer electronics, fashion, and media products.

Shop the World 145Country information India Country profile · Media Use · Distance selling · “Customer jour-ney“ · Drivers & barriers in distance selling · Cross-border shopping · Dialog marketing
400.4Population 0 - 15 years
The economy in India * COUNTRY PROFILE INDIA
Mumbai (Bombay)
19,422
Delhi 21,935
* Source: Fischer World Almanac 2014, Germany Trade & Invest ** Source: Metropolitan areas with 1 million inhabitants and more; United Nations, Department of Economic and Social Affairs, Po-pulation Division (2012). World Urbanization Prospects: The 2011 Revision, CD-ROM Edition. *** Source: Copyright © IHS, 2013. All rights reserved **** Source: Copyright © IHS, 2013. All rights reserved
Number of households Ø Household sizeUnemployment rateInflation rate
4.7
Economic growth · in % ****
>
>
4.6
6.6
2011 2012 2013
Age distribution · 2013 in mn.
Population 65 years and older
Population, total · 2013 in mn. 1,258.4 ***
Population 16 - 64 years
· 2013 in mn.· 2013· 2013 in %· 2013 in %
222.0 5.79.2
10.1
Economic growth in India has slowed considerably. With GDP growth of 4.6% in 2013, it was significantly below the real growth seen in 2011 (6.6%). IMF analysts predict a rise to 5.16% in 2014. The high bud-get deficit, stagnating indus- try production, and declining import numbers give cause for concern. At the same time, infrastructure projects are on hold due to delays in tendering, permit processing, and property acquisition. Consumer spend- ing is subdued in the face of high inflation and crises-driven insecurity.
794.0
63.9
Hyderabad 7,578
Pune (Poona) 4,951
Kolkata (Calcutta)
14,283
Ahmadabad 6,210
Jaipur 3,017
Surat 4,438
Chennai (Madras)
8,523
Bangalore 8,275
The ten largest conurbations in India · 2011 in thousand. **
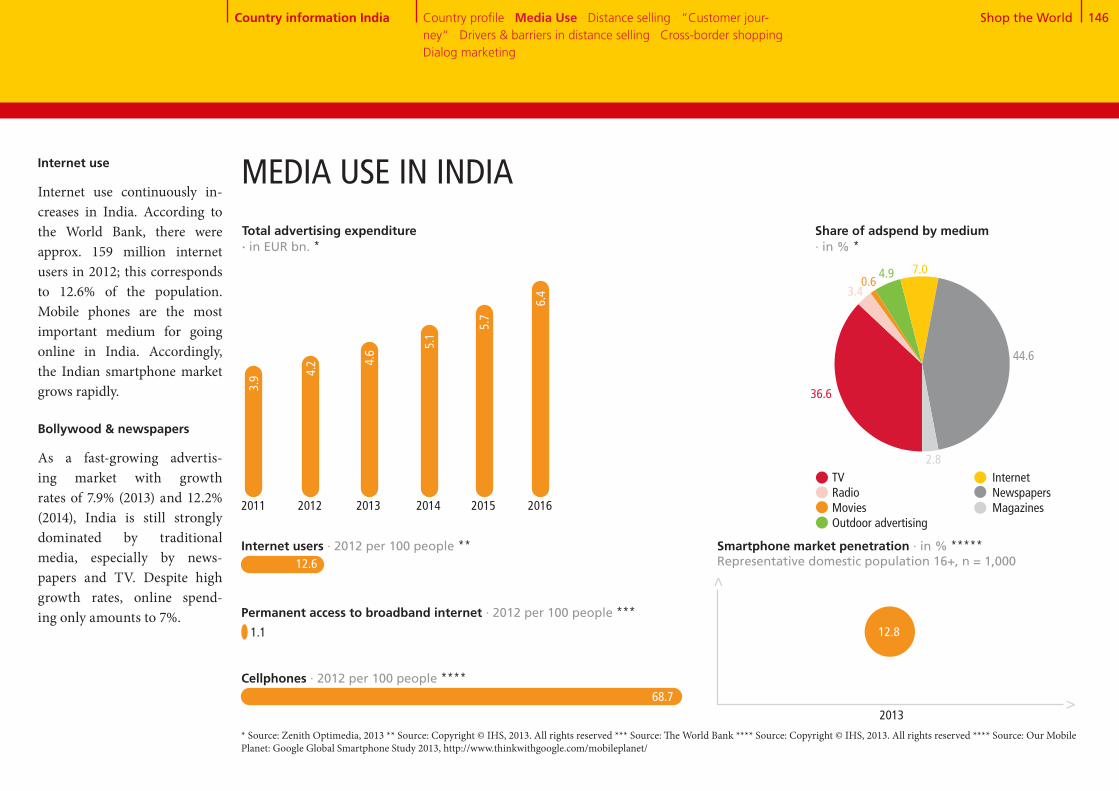
Shop the World 146
37+3+1+5+7+44+3
Country information India Country profile · Media Use · Distance selling · “Customer jour-ney“ · Drivers & barriers in distance selling · Cross-border shopping · Dialog marketing
MEDIA USE IN INDIA
1.1
68.7
Smartphone market penetration · in % *****Representative domestic population 16+, n = 1,000
Internet users · 2012 per 100 people **
Permanent access to broadband internet · 2012 per 100 people ***
Cellphones · 2012 per 100 people ****
2013
12.8
Share of adspend by medium · in % *
TV Radio Movies Outdoor advertising
Total advertising expenditure · in EUR bn. *
Internet Newspapers Magazines
>>
* Source: Zenith Optimedia, 2013 ** Source: Copyright © IHS, 2013. All rights reserved *** Source: The World Bank **** Source: Copyright © IHS, 2013. All rights reserved **** Source: Our Mobile Planet: Google Global Smartphone Study 2013, http://www.thinkwithgoogle.com/mobileplanet/
2011 2012 2013 2014 2015
5.7
12.6
5.1
4.6
4.2
3.9
2016
6.4
7.0
44.6
2.8
4.90.6
3.4
36.6
Internet use
Internet use continuously in-creases in India. According to the World Bank, there were approx. 159 million internet users in 2012; this corresponds to 12.6% of the population. Mobile phones are the most important medium for going online in India. Accordingly, the Indian smartphone market grows rapidly.
Bollywood & newspapers
As a fast-growing advertis- ing market with growth rates of 7.9% (2013) and 12.2% (2014), India is still strongly dominated by traditional media, especially by news-papers and TV. Despite high growth rates, online spend- ing only amounts to 7%.
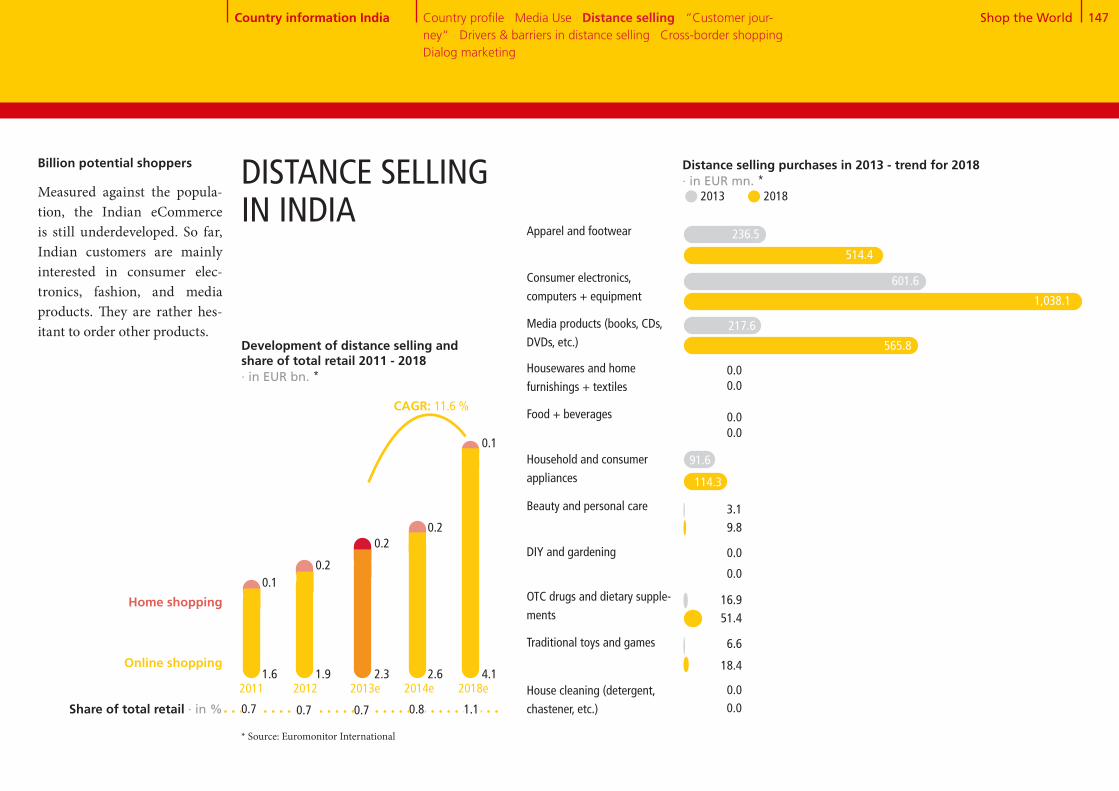
Shop the World 147
Distance selling purchases in 2013 - trend for 2018 · in EUR mn. * 2013 2018
Apparel and footwear
Consumer electronics,
computers + equipment
Media products (books, CDs,
DVDs, etc.)
Housewares and home
furnishings + textiles
Food + beverages
Household and consumer
appliances
Beauty and personal care
DIY and gardening
OTC drugs and dietary supple-
ments
Traditional toys and games
House cleaning (detergent,
chastener, etc.)
Billion potential shoppers
Measured against the popula-tion, the Indian eCommerce is still underdeveloped. So far, Indian customers are mainly interested in consumer elec- tronics, fashion, and media products. They are rather hes-itant to order other products.
DISTANCE SELLING IN INDIA
514.4
1,038.1
601.6
565.8
217.6
0.00.0
91.6
114.3
9.8
0.0
0.0
16.9
18.4
6.6
0.0
Development of distance selling and share of total retail 2011 - 2018 · in EUR bn. *
CAGR: 11.6 %
Home shopping
Online shopping1.6 1.9 2.3
0.10.2
0.2
2.6 4.1
0.2
0.1
2011 2012 2013e 2014e 2018e
Share of total retail · in % 0.7 0.7 0.7 0.8 1.1
* Source: Euromonitor International
236.5
0.0
Country information India Country profile · Media Use · Distance selling · “Customer jour-ney“ · Drivers & barriers in distance selling · Cross-border shopping · Dialog marketing
0.0
3.1
51.4
0.0

Shop the World 148
Non-users of distance selling - future plans · in % *
79+2184
+16
More orders in the future
Currently, four fifths of Indian consumers surveyed are dis- tance selling clients. Although the number of orders is still below the global average, the future holds enormous poten-tial.
Use of distance selling · in % *
79.1
20.9
India
Globally
83.5
16.5
Number of orders in the previous year · in % *
1 to 5 orders
6 to 10 orders
11 to 20 orders
No orders
23.3
37.2
10.4
20.9
8.2
20.5
35.9
15.2
16.5
12.0
Future ordering behavior (current users) · in % *
More frequently than in the last
12 months
Just as frequently as in the last
12 months
Less frequently than in the last
12 months
25.0
69.7
55.2
38.8
5.3 6.1
Yes85.8
India
Globally
Yes70.5
No14.2
No29.5
Yes No
India Globally India Globally
DISTANCE SELLING IN INDIA
* Source: DHL Global Mail 2013 ∙ n Global from 1,275 to 11,265 ∙ n India from 91 to 501
Country information India Country profile · Media Use · Distance selling · "Customer jour-ney“ · Drivers & barriers in distance selling · Cross-border shopping · Dialog marketing
More than 20 orders

Shop the World 149
Globally*
50.9
Gender · in % Male Female
Age · in % <30 yrs. 30-49 yrs. 50 yrs. +
Occupation · in % Employed Unemployed
Education · in % Lower educational level Medium and higher level of education
Media affinity: Online · in % yes**
Community size · in % Rural (<50,000 inhabitants) Non-rural/urban (>50,000 inhabitants)
Minors in the household · Ø
Household type · in % Single 2-person household without children Household with children Household with 3 adults
Mobile Internet usage · in % Yes No
Gross household income · in % Low income Medium income High income
Media affinity: Classic · in % yes**
Media affinity: Dialog marketing · in % yes** 75.3
72.9
94.1
58.019.0
23.0
28.371.7
28.668.4
49.5
43.1
50.5
14.3
98.4
93.1
1.3
0.8
85.7
Heavy users: Young and urban
The typical distance selling customer is mainly male and young. The under thirties age-group is disproportionately large. Most heavy users work and live in urban centers, live in households with children and have relatively high incomes. In terms of their affinity for media, heavy users are an ideal target group: In global compar- ison, all media are exception- ally popular, although online media sees the greatest take-up.
DISTANCE SELLING IN INDIA
* Source: DHL Global Mail 2013 ∙ n Global from 2,661 to 11,265 ∙ n India from 126 to 501 ** media affinity for online / classic / dialog marketing, if at least one medium from the respective area was rated 5 or 6 on a scale of 1 "absolutely not useful" to 6 "very useful" *** the top third of most active mail order users
44.327.1
14.4
36.4
46.9
36.5
80.8
33.734.232.1
45.754.3
22.443.0
50.0
28.6
50.0
29.4
85.6
63.6
0.7
23.411.2
70.6
Country information India Country profile · Media Use · Distance selling · “Customer jour-ney“ · Drivers & barriers in distance selling · Cross-border shopping · Dialog marketing
***
India*
43.516.2
3.0
11.2
69.4
69.7
88.8
44.726.129.2
43.456.6
36.357.5
48.3
40.2
51.7
23.3
97.0
88.8
0.9
4.41.8
76.7
6.9
Heavy users* Global heavy users*
1.6
5.9
2.3

Shop the World 150
Search engines
Customer ratings in blogs or forums
Product test ratings / expert test reports
Product check in a retail store
Retailer or manufacturer website
Online marketplace
Catalog
Mail advertising
Social media platforms, such as Facebook and Twitter
Apps (on smartphone, iPad, or tablet)
Recommendations from friends, acquaintances, and colleagues
Customer ratings on the supplier’s website
Price comparison sites
Large selection of products
Recommendation and experiences of friends, acquaintances, and colleagues
Official test seals, reviews, and test reports of independent institutions
Attractive product line
Favorable prices, promotions, & special offers
Straightforward return process
Free returns
Choice of preferred payment methods
Fast delivery
Free delivery
Good customer service
Positive customer ratings on the internet
“CUSTOMER JOURNEY“ – SEARCHING FOR PRODUCT INFORMATION
Search for product information · India in % * Globally
34.2 35.5
53.2
20.2 23.4
45.4 44.2
24.7 23.9
43.5 45.8
52.3 42.5
31.1 25.1
25.5 15.1
38.5 15.1
20.2 9.7
40.7 37.8
Criteria for choosing a vendor · India in % *
Globally
57.4
38.3 40.6
17.6 13.7
20.7
11.1 8.8
18.3 26.6
15.9 14.9
35.1 51.7
13.9 12.9
18.8 20.8
24.3 22.6
28.8 25.7
40.2 45.2
30.6 18.5
23.5
Customer service comes first
Social media play a compar- atively important role in India when searching for products. Customer service is of above- average importance when select-ing a provider (30.6% versus 18.5% globally).
* Source: DHL Global Mail 2013 ∙ n Global from 9,386 to 10,617 ∙ n India from 391 to 480, multiple mentioning
Country information India Country profile · Media Use · Distance selling · “Customer jour-ney“ · Drivers & barriers in distance selling · Cross-border shopping · Dialog marketing

Shop the World 151
Usefulness of advertising media · in % *, **
5 and 63 and 41 and 2
Ø
35.36.6 58.126.1 43.8 30.1
Online advertising
* Source: DHL Global Mail 2013 ∙ n Global from 10,218 to 10,384 ∙ n India from 459 to 472 ** scale from 1 "absolutely not useful“ to 6 very useful“
Open for advertising
There is great openness for all advertising media in India. In addition to search engines and price-comparison sites, Indian consumers rate social media and online advertising as par- ticularly useful. However, clas-sic ads in newspapers and mag- azines are eagerly studied as well.
ACCEPTANCE OF ADVERTISING MEDIA
India Globally
Country information India Country profile · Media Use · Distance selling · “Customer jour-ney“ · Drivers & barriers in distance selling · Cross-border shopping · Dialog marketing
Television advertising
5 and 63 and 41 and 2
4.63.6
Ø
33.97.4 58.730.6 41.8 27.6
4.63.4
40.221.3 38.538.7 40.4 20.9Social media
India Globally
Advertising letters
3.93.1
32.18.0 59.933.9 37.6 28.5
4.63.4
Product suggestions in online shops
36.38.5 55.218.9 45.1 36.0
4.53.9
24.22.8 73.16.5 28.7 64.8
5.14.8
28.84.9 66.39.1 31.7 59.1
4.94.6
38.510.3 51.229.9 43.9 26.2
India Globally
Household advertising
4.43.4
39.89.2 51.029.0 46.7 24.3
India Globally
Advertisements in mag- azines and periodicals
4.43.4
39.08.1 52.934.8 43.1 22.1
India Globally
Advertisements in newspapers
4.53.2
41.716.0 42.241.8 40.7 17.6
India Globally
Billboard advertise-ments
4.13.0
40.625.8 33.544.3 38.8 16.9
India Globally
Radio
3.72.9
38.112.9 49.019.3 44.2 36.6
India Globally
Catalogs from vendors
4.33.9
India Globally
India Globally
India Globally
Internet search engines
India Globally
Price comparison sites
India Globally
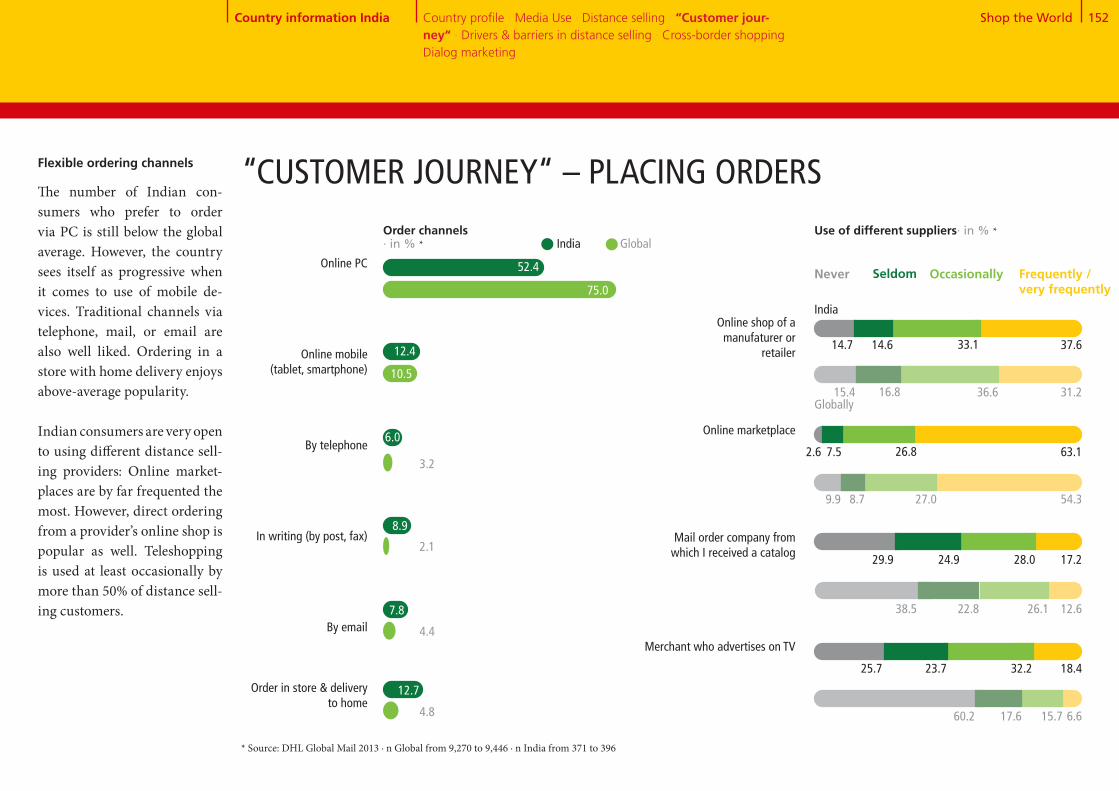
Shop the World 152
Online PC
Online mobile (tablet, smartphone)
By telephone
In writing (by post, fax)
By email
Order in store & delivery to home
Online marketplace
Mail order company from which I received a catalog
Merchant who advertises on TV
Online shop of a manufaturer or
retailer
Use of different suppliers· in % *
Never Frequently / very frequently
Occasionally
* Source: DHL Global Mail 2013 ∙ n Global from 9,270 to 9,446 ∙ n India from 371 to 396
India Global
52.4
6.0
8.9
7.8
75.0
3.2
2.1
4.4
“CUSTOMER JOURNEY“ – PLACING ORDERSFlexible ordering channels
The number of Indian con- sumers who prefer to order via PC is still below the global average. However, the country sees itself as progressive when it comes to use of mobile de-vices. Traditional channels via telephone, mail, or email are also well liked. Ordering in a store with home delivery enjoys above-average popularity.
Indian consumers are very open to using different distance sell-ing providers: Online market-places are by far frequented the most. However, direct ordering from a provider’s online shop is popular as well. Teleshopping is used at least occasionally by more than 50% of distance sell-ing customers.
14.7 37.614.6
15.4 31.216.8
33.1
36.6
India
Globally
2.6 63.17.5
9.9 54.38.7
26.8
27.0
29.9 17.224.9
38.5 12.622.8
28.0
26.1
25.7 18.423.7
60.2 6.617.6
32.2
15.7
12.4
10.5
12.7
4.8
Order channels · in % *
Country information India Country profile · Media Use · Distance selling · “Customer jour-ney“ · Drivers & barriers in distance selling · Cross-border shopping · Dialog marketing
Seldom
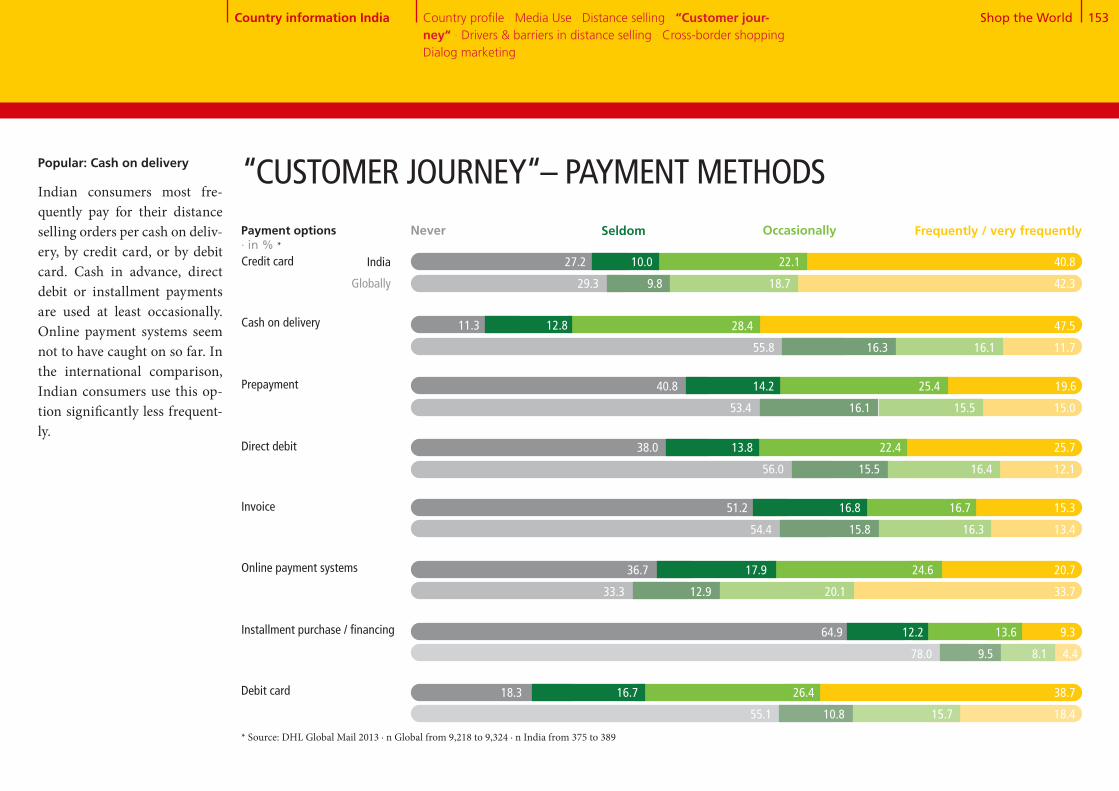
Shop the World 153
Popular: Cash on delivery
Indian consumers most fre-quently pay for their distance selling orders per cash on deliv- ery, by credit card, or by debit card. Cash in advance, direct debit or installment payments are used at least occasionally. Online payment systems seem not to have caught on so far. In the international comparison, Indian consumers use this op- tion significantly less frequent-ly.
Cash on delivery
Prepayment
Direct debit
Credit card
* Source: DHL Global Mail 2013 ∙ n Global from 9,218 to 9,324 ∙ n India from 375 to 389
“CUSTOMER JOURNEY“– PAYMENT METHODS
Online payment systems
Installment purchase / financing
Debit card
Invoice
Payment options · in % *
Never Frequently / very frequentlyOccasionally
India
Globally
27.2 10.0 22.1 40.8
29.3 9.8 18.7 42.3
11.3 12.8 28.4 47.5
55.8 16.3 16.1 11.7
40.8 14.2 25.4 19.6
53.4 16.1 15.5 15.0
38.0 13.8 22.4 25.7
56.0 15.5 16.4 12.1
51.2 16.8 16.7 15.3
54.4 15.8 16.3 13.4
36.7 17.9 24.6 20.7
33.3 12.9 20.1 33.7
64.9 12.2 13.6 9.3
78.0 9.5 8.1 4.4
18.3 16.7 26.4 38.7
55.1 10.8 15.7 18.4
Country information India Country profile · Media Use · Distance selling · “Customer jour-ney“ · Drivers & barriers in distance selling · Cross-border shopping · Dialog marketing
Seldom
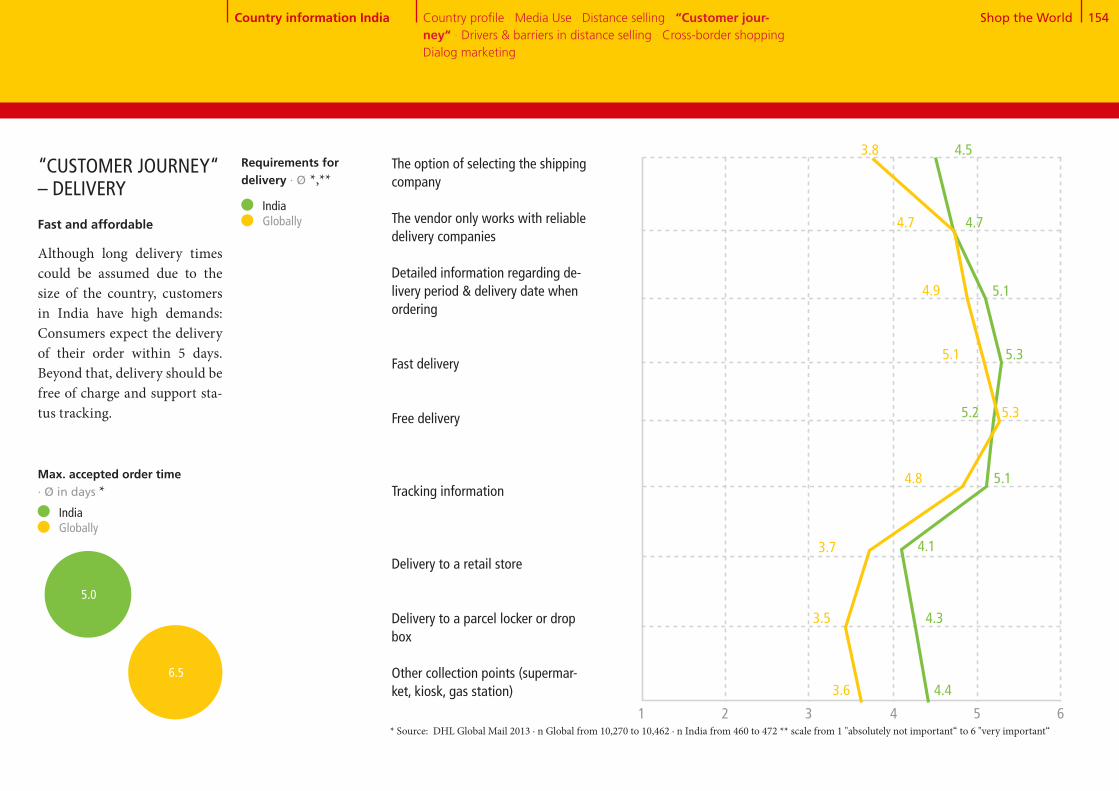
Shop the World 154
The option of selecting the shipping company The vendor only works with reliable delivery companies
Detailed information regarding de-livery period & delivery date when ordering
Fast delivery
Free delivery
Tracking information
Delivery to a retail store
Delivery to a parcel locker or drop box
Other collection points (supermar-ket, kiosk, gas station)
India Globally
4.4
4.3
4.1
5.2
5.1
5.3
4.5
5.1
4.7
Max. accepted order time · Ø in days *
3.6
3.5
3.7
5.3
4.8
5.1
3.8
4.9
4.7
* Source: DHL Global Mail 2013 ∙ n Global from 10,270 to 10,462 ∙ n India from 460 to 472 ** scale from 1 "absolutely not important“ to 6 "very important“
Fast and affordable
Although long delivery times could be assumed due to the size of the country, customers in India have high demands: Consumers expect the delivery of their order within 5 days. Beyond that, delivery should befree of charge and support sta-tus tracking.
“CUSTOMER JOURNEY“ – DELIVERY
1 2 3 4 5 6
Requirements for delivery · Ø *,**
Country information India Country profile · Media Use · Distance selling · “Customer jour-ney“ · Drivers & barriers in distance selling · Cross-border shopping · Dialog marketing
5.0
6.5
India Globally
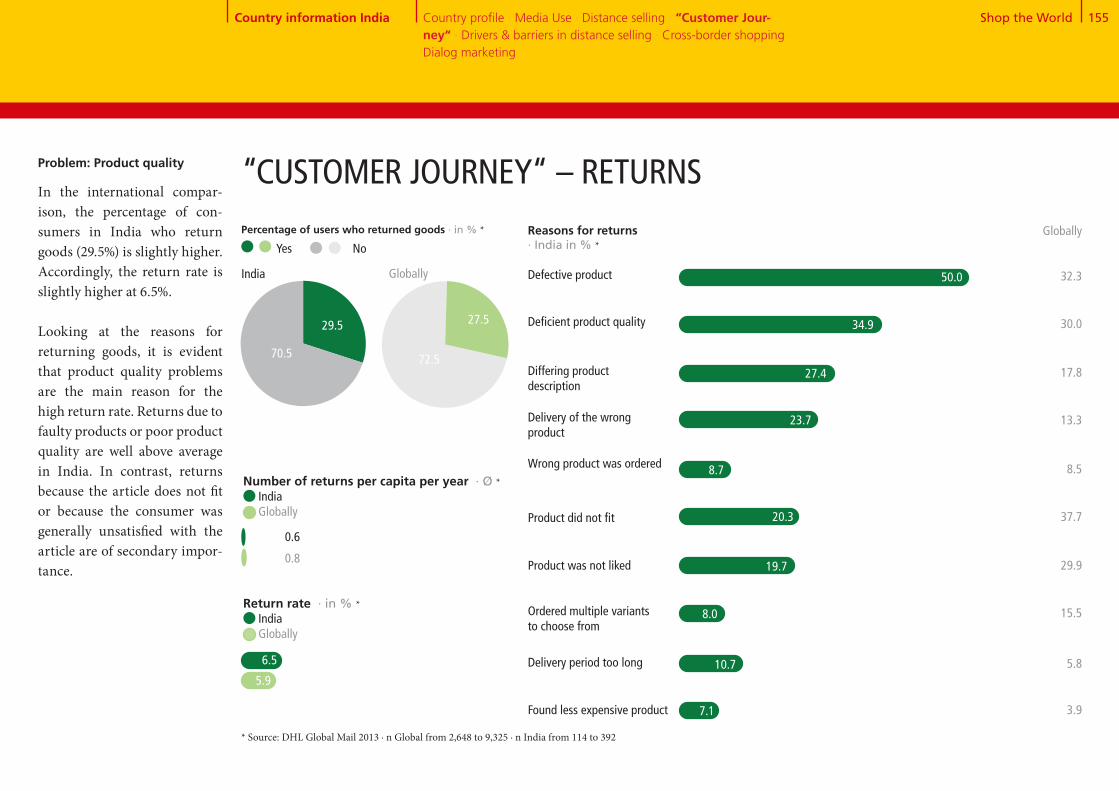
Shop the World 155
30+70
72+28
Number of returns per capita per year · Ø * India Globally
0.8
0.6
Return rate · in % * India Globally
5.9
Reasons for returns · India in % *
Defective product 50.0
Percentage of users who returned goods · in % *
29.5
70.5
India Globally
Yes No
“CUSTOMER JOURNEY“ – RETURNSProblem: Product quality
In the international compar- ison, the percentage of con- sumers in India who return goods (29.5%) is slightly higher. Accordingly, the return rate is slightly higher at 6.5%.
Looking at the reasons for returning goods, it is evident that product quality problems are the main reason for the high return rate. Returns due to faulty products or poor product quality are well above average in India. In contrast, returns because the article does not fit or because the consumer was generally unsatisfied with the article are of secondary impor- tance.
27.5
72.5
* Source: DHL Global Mail 2013 ∙ n Global from 2,648 to 9,325 ∙ n India from 114 to 392
Differing product description
Delivery of the wrong product
Wrong product was ordered
Product did not fit
Ordered multiple variants to choose from
Delivery period too long
Found less expensive product
Deficient product quality
Product was not liked
27.4
23.7
20.3
19.7
8.0
10.7
7.1
Globally
32.3
30.0
17.8
13.3
8.5
37.7
29.9
15.5
5.8
3.9
34.9
8.7
Country information India Country profile · Media Use · Distance selling · “Customer Jour-ney“ · Drivers & barriers in distance selling · Cross-border shopping · Dialog marketing
6.5

Shop the World 156
High delivery costs
Uncertain delivery
Concern about misuse of payment data
No demand because all products are obtainable locally
Long delivery times
Unknown product quality
No try-on possible before purchase
Complicated return process
No personal advice
No personal contact person for problems
Doubts regarding data protection or the dissemination of data to third parties
Concern about counterfeited products, product piracy
Product can only be obtained via distance selling
Easy price comparison
Shopping 24/7
Location-independent ordering
Higher product quality
Lower prices
Greater selection
Option to deliver to a preferred location
DRIVERS & BARRIERS IN DISTANCE SELLING Barriers
· India in % *
50.8
54.6
72.6
63.5
7.8
59.1
46.0
67.3
53.4
49.8
53.0
Globally
36.6
24.2
34.4
3.9
25.8
48.5
64.9
44.1
21.5
22.0
29.8
34.1
Shopping everywhere
The most convincing argumentfor distance selling is the geo- graphical independence of the order. The unknown quality of the goods and a lack of personalservice are hindering factors.
Drivers · India in % *
Globally
* Source: DHL Global Mail 2013 ∙ n Global from 10,509 to 10,864 ∙ n India from 475 to 487
49.9
52.3
64.2
74.6
26.0
21.1
21.5
33.4
12.2
27.3
56.9
55.7
47.0
32.3
32.0
24.8
35.1
Country information India Country profile · Media Use · Distance selling · “Customer jour-ney“ · Drivers & barriers in distance selling · Cross-border shopping · Dialog marketing
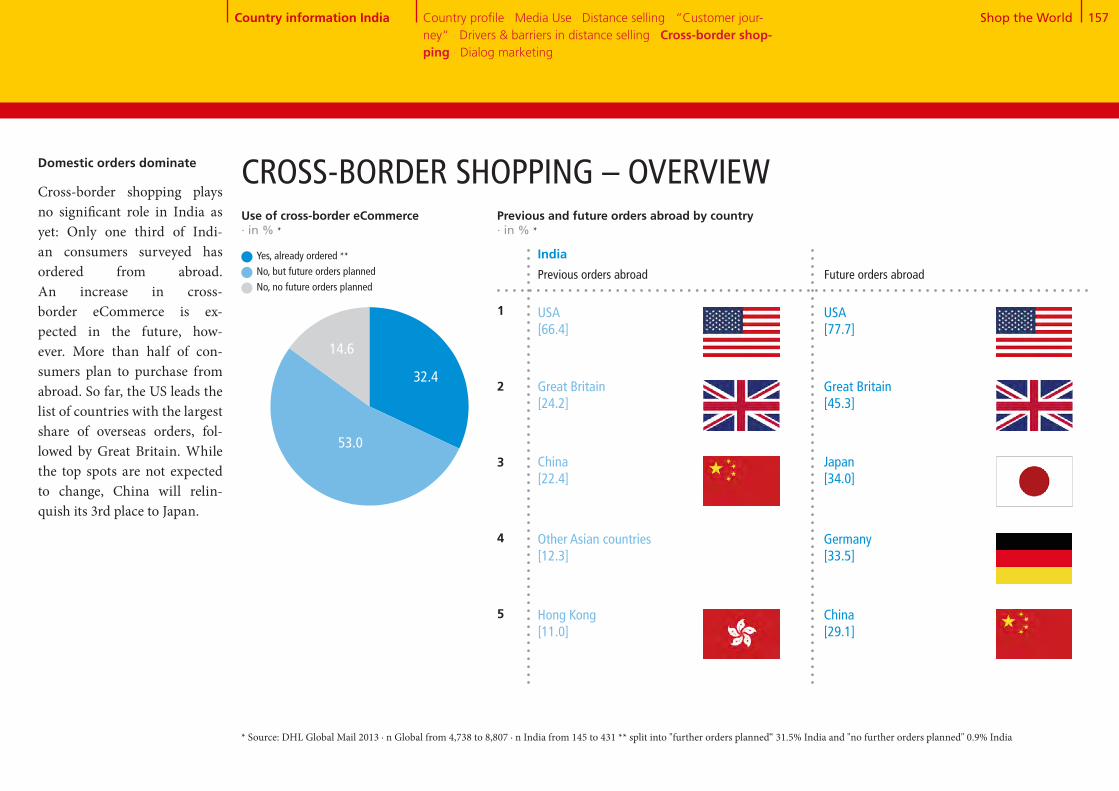
Shop the World 157
32+53+15CROSS-BORDER SHOPPING – OVERVIEW
Previous orders abroad
Previous and future orders abroad by country · in % *
Other Asian countries[12.3]
Hong Kong[11.0]
1
2
3
4
5
USA[66.4]
Great Britain[24.2]
China[22.4]
Future orders abroad
India
* Source: DHL Global Mail 2013 ∙ n Global from 4,738 to 8,807 ∙ n India from 145 to 431 ** split into "further orders planned“ 31.5% India and "no further orders planned" 0.9% India
Domestic orders dominate
Cross-border shopping plays no significant role in India as yet: Only one third of Indi-an consumers surveyed has ordered from abroad. An increase in cross- border eCommerce is ex-pected in the future, how- ever. More than half of con- sumers plan to purchase from abroad. So far, the US leads the list of countries with the largest share of overseas orders, fol- lowed by Great Britain. While the top spots are not expected to change, China will relin-quish its 3rd place to Japan.
Germany[33.5]
China[29.1]
USA[77.7]
Great Britain[45.3]
Japan[34.0]
Country information India Country profile · Media Use · Distance selling · “Customer jour-ney“ · Drivers & barriers in distance selling · Cross-border shop-ping · Dialog marketing
Use of cross-border eCommerce · in % *
Yes, already ordered **No, but future orders planned No, no future orders planned
53.0
32.4
14.6
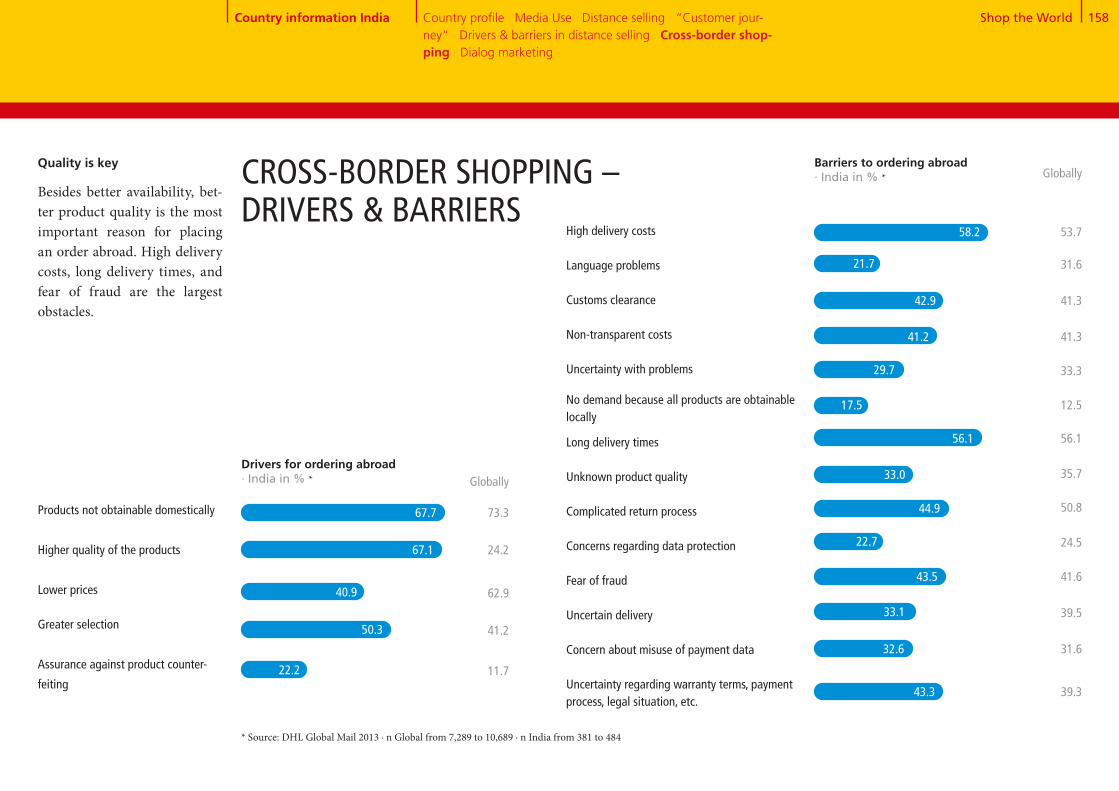
Shop the World 158
Products not obtainable domestically
Higher quality of the products
Lower prices
Greater selection
Assurance against product counter-
feiting
High delivery costs Language problems
Customs clearance
Non-transparent costs
Uncertainty with problems
No demand because all products are obtainable locally
Long delivery times
Unknown product quality
Complicated return process
Concerns regarding data protection Fear of fraud Uncertain delivery
Concern about misuse of payment data
Uncertainty regarding warranty terms, payment process, legal situation, etc.
Drivers for ordering abroad· India in % *
Barriers to ordering abroad · India in % *
Globally
73.3
24.2
62.9
41.2
11.7
Globally
53.7
31.6
41.3
41.3
33.3
12.5
56.1
35.7
50.8
24.5
41.6
39.5
31.6
39.3
Quality is key
Besides better availability, bet-ter product quality is the most important reason for placing an order abroad. High delivery costs, long delivery times, and fear of fraud are the largest obstacles.
* Source: DHL Global Mail 2013 ∙ n Global from 7,289 to 10,689 ∙ n India from 381 to 484
58.2
21.7
42.9
41.2
29.7
17.5
56.1
33.0
44.9
22.7
43.5
33.1
32.6
43.3
67.7
67.1
40.9
50.3
22.2
Country information India Country profile · Media Use · Distance selling · “Customer jour-ney“ · Drivers & barriers in distance selling · Cross-border shop-ping · Dialog marketing
CROSS-BORDER SHOPPING – DRIVERS & BARRIERS
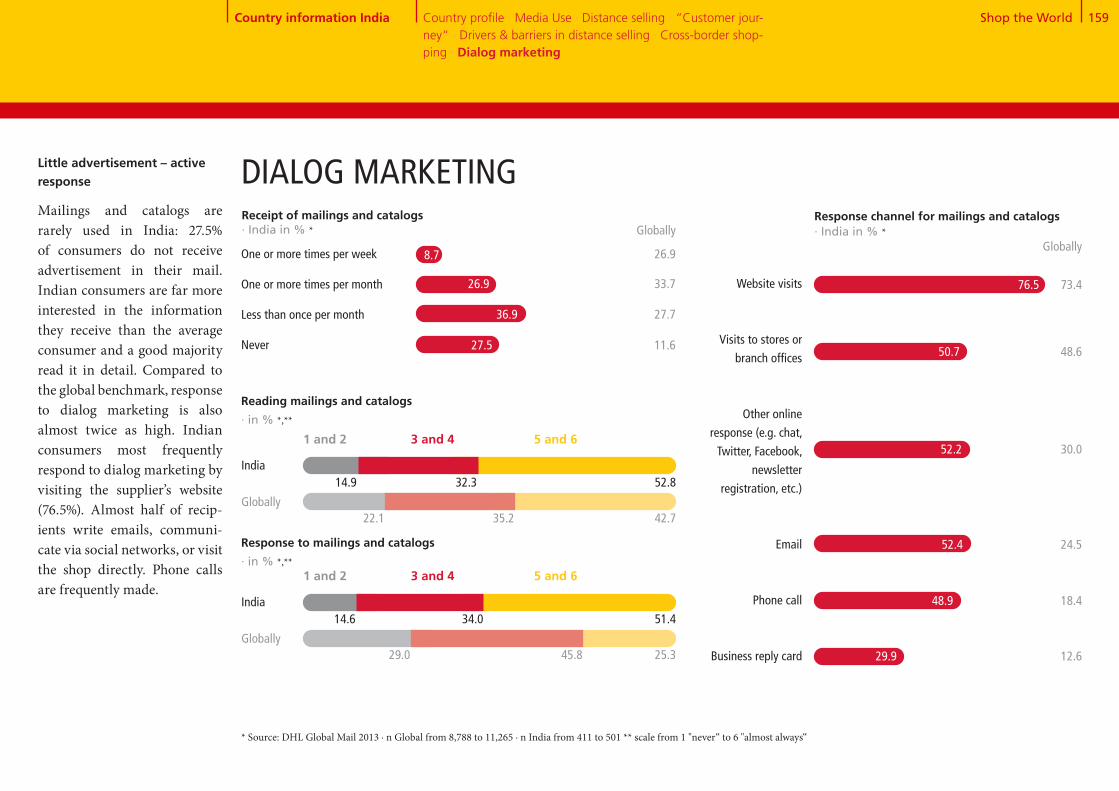
Shop the World 159
Receipt of mailings and catalogs · India in % *
5 and 63 and 41 and 2
DIALOG MARKETING
Reading mailings and catalogs
· in % *,**
India
Globally
14.9 32.3 52.8
22.1 35.2 42.7
5 and 63 and 41 and 2
Response to mailings and catalogs · in % *,**
India
Globally
14.6 34.0 51.4
29.0 45.8 25.3
Response channel for mailings and catalogs · India in % * Globally
Website visits
Visits to stores or
branch offices
Other online
response (e.g. chat,
Twitter, Facebook,
newsletter
registration, etc.)
Phone call
Business reply card
76.5 73.4
48.6
30.0
24.5
18.4
12.6
* Source: DHL Global Mail 2013 ∙ n Global from 8,788 to 11,265 ∙ n India from 411 to 501 ** scale from 1 "never“ to 6 "almost always“
Little advertisement – active response
Mailings and catalogs are rarely used in India: 27.5% of consumers do not receive advertisement in their mail. Indian consumers are far more interested in the information they receive than the average consumer and a good majority read it in detail. Compared to the global benchmark, response to dialog marketing is also almost twice as high. Indian consumers most frequently respond to dialog marketing by visiting the supplier’s website (76.5%). Almost half of recip- ients write emails, communi- cate via social networks, or visit the shop directly. Phone calls are frequently made.
Globally
One or more times per week
One or more times per month
Less than once per month
Never
26.9
33.7
27.7
11.6 50.7
52.2
52.4
48.9
29.9
8.7
26.9
36.9
27.5
Country information India Country profile · Media Use · Distance selling · “Customer jour-ney“ · Drivers & barriers in distance selling · Cross-border shop-ping · Dialog marketing

Country InformationItaly
Cristian and Massimiliano
Italian eCommerce customers live in rural areas, they are price-sensitive and like to order fashion and groceries.

Shop the World 161
9.2
Population 0 - 15 years
Italian economy * COUNTRY PROFILE ITALY
Roma (Rome) 3,306
Milano (Milan) 2,916
* Source: Fischer World Almanac 2014, Germany Trade & Invest ** Source: Metropolitan areas with 1 million inhabitants and more; United Nations, Department of Economic and Social Affairs, Po-pulation Division (2012). World Urbanization Prospects: The 2011 Revision, CD-ROM Edition. *** Source: Copyright © IHS, 2013. All rights reserved **** Source: Copyright © IHS, 2013. All rights reserved
Number of households Ø Household sizeUnemployment rateInflation rate
-2.6
Economic growth · in % ****
>
>
-1.8
0.6
2011 2012 2013
Age distribution · 2013 in mn.
Population 65 years and older
Population, total · 2013 in mn. 61.0 ***
Country information Italy Country profile · Media Use · Distance selling · “Customer jour-ney“ · Drivers & barriers in distance selling · Cross-border shopping · Dialog marketing
Population 16 - 64 years
· 2013 in mn.· 2013· 2013 in %· 2013 in %
20.5 3.0
12.21.2
After a brief recovery in 2010 and 2011, Italy is headed into recession again. The economic performance shrunk by 2.6% in 2012 and by 1.8% in 2013. The domestic demand slumped in particular. The consequences of the crisis can mainly be felt in the labor market. The un-employment rate increased in 2013 to 12.2 %. The south of the country and the young popu-lation are particularly affected. Structural deficiencies are the main reason for the prolonged economic crisis: The corporate landscape is characterized by small under-capitalized family businesses, the labor market is inflexible, the public authorities highly indebted, research and development poorly developed,and the infrastructure is insuf-ficient. Because of these rea-sons, Italy will most likely re-main Europe’s problem child in the coming years.
39.1
12.7
Napoli (Naples) 2.348
Torino (Turin) 1,620
Metropolitan areas with 1 million inhabitants or more · 2011 in thousands **
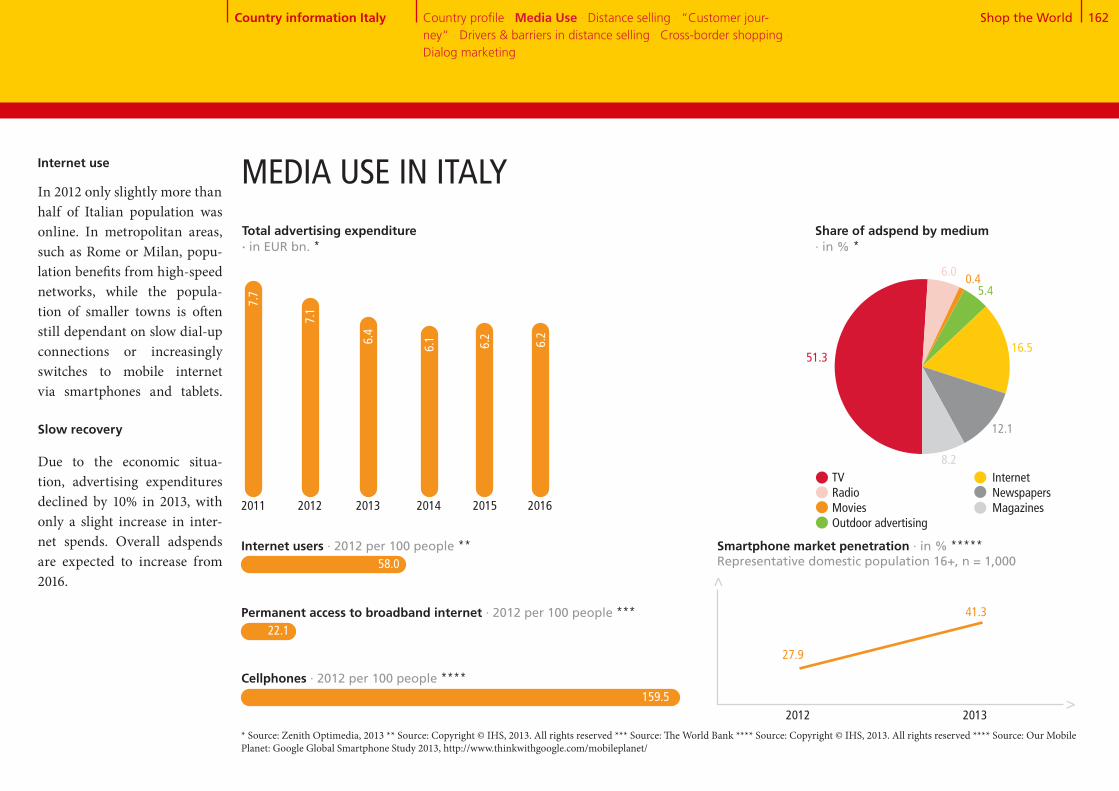
Shop the World 162
51+6+1+5+17+12+8MEDIA USE IN ITALY
22.1
159.5
Smartphone market penetration · in % *****Representative domestic population 16+, n = 1,000
27.9
Internet users · 2012 per 100 people **
Permanent access to broadband internet · 2012 per 100 people ***
Cellphones · 2012 per 100 people ****
2012 2013
41.3
Share of adspend by medium · in % *
TV Radio Movies Outdoor advertising
Total advertising expenditure · in EUR bn. *
Internet Newspapers Magazines
>>
* Source: Zenith Optimedia, 2013 ** Source: Copyright © IHS, 2013. All rights reserved *** Source: The World Bank **** Source: Copyright © IHS, 2013. All rights reserved **** Source: Our Mobile Planet: Google Global Smartphone Study 2013, http://www.thinkwithgoogle.com/mobileplanet/
2011 2012 2013 2014 2015
6.2
58.0
6.16.
4
7.1
7.7
2016
6.2
Country information Italy Country profile · Media Use · Distance selling · “Customer jour-ney“ · Drivers & barriers in distance selling · Cross-border shopping · Dialog marketing
16.5
12.1
8.2
5.40.4
6.0
51.3
Internet use
In 2012 only slightly more thanhalf of Italian population was online. In metropolitan areas, such as Rome or Milan, popu-lation benefits from high-speed networks, while the popula-tion of smaller towns is often still dependant on slow dial-up connections or increasingly switches to mobile internet via smartphones and tablets.
Slow recovery Due to the economic situa- tion, advertising expenditures declined by 10% in 2013, with only a slight increase in inter-net spends. Overall adspends are expected to increase from 2016.

Shop the World 163
Apparel and footwear
Consumer electronics,
computers + equipment
Media products (books, CDs,
DVDs, etc.)
Housewares and home
furnishings + textiles
Food + beverages
Household and consumer
appliances
Beauty and personal care
DIY and gardening
OTC drugs and dietary supple-
ments
Traditional toys and games
House cleaning (detergent,
chastener, etc.)
Buon appetito!
With an average growth of 12.7 % per year, the Italian dis- tance selling market is one of the fastest growing markets in Europe. Fashion, media prod-ucts, and, above all, groceries are very popular with Italian consumers.
DISTANCE SELLING IN ITALY
1,454.7
998.4
817.5
1,351.8
688.6
1,572.8
92.8
16.0
9.3
115.0
52.4
33.2
45.9
Development of distance selling and share of total retail 2011 - 2018 · in EUR bn. *
CAGR: 12.7%
Home shopping
Online shopping3.7 4.4 5.2
1.21.2
1.2
6.0 10.5
1.2
1.1
2011 2012 2013e 2014e 2018e
Share of total retail · in % 1.7 1.9 2.3 2.6 4.2
* Source: Euromonitor International
924.1
42.1
Country information Italy Country profile · Media Use · Distance selling · “Customer jour-ney“ · Drivers & barriers in distance selling · Cross-border shopping · Dialog marketing
857.4
97.5
125.1
202.8
190.7
177.8
223.2
Distance selling purchases in 2013 - trend for 2018 · in EUR mn. * 2013 2018
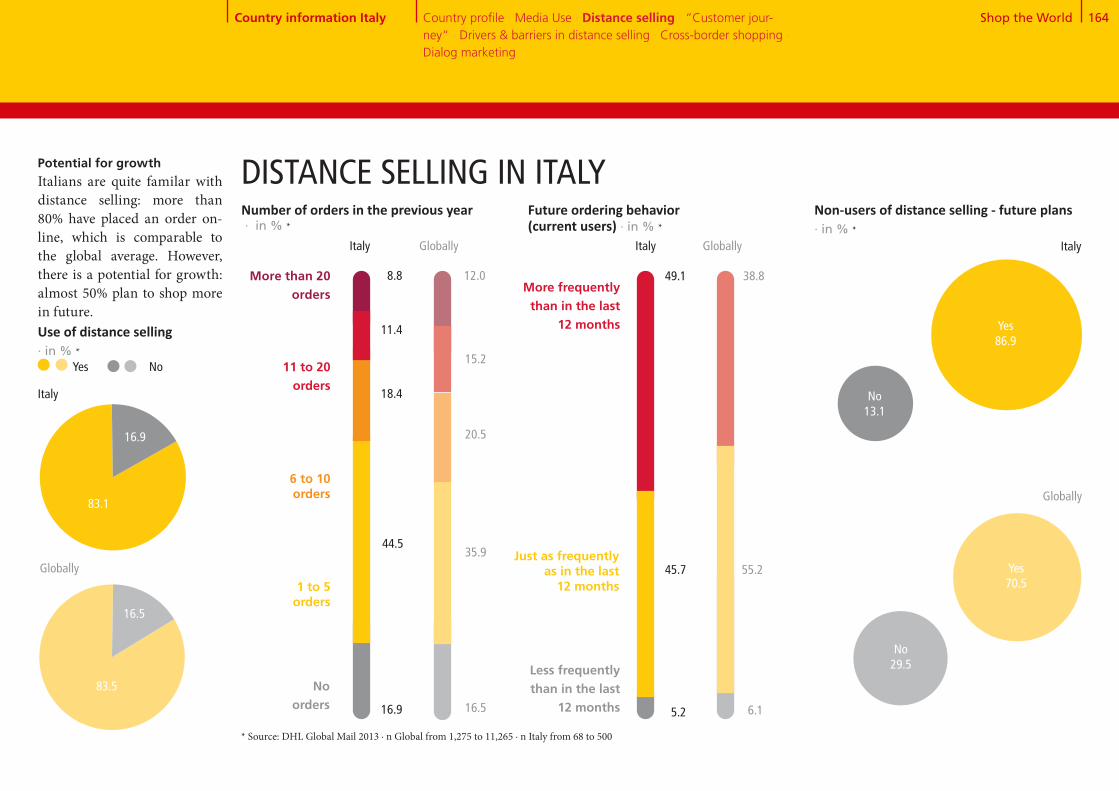
Shop the World 164
83+1784
+16
Potential for growth Italians are quite familar with distance selling: more than 80% have placed an order on-line, which is comparable to the global average. However, there is a potential for growth: almost 50% plan to shop more in future.Use of distance selling · in % *
83.1
16.9
Italy
Globally
83.5
16.5
Number of orders in the previous year · in % *
1 to 5 orders
6 to 10 orders
11 to 20 orders
No orders
18.4
44.5
11.4
16.9
8.8
20.5
35.9
15.2
16.5
12.0
Future ordering behavior (current users) · in % *
More frequently than in the last
12 months
Just as frequently as in the last
12 months
Less frequently than in the last
12 months
45.7
49.1
55.2
38.8
5.2 6.1
Non-users of distance selling - future plans · in % *
Yes86.9
Italy
Globally
Yes70.5
No13.1
No29.5
Yes No
Italy Globally Italy Globally
DISTANCE SELLING IN ITALY
* Source: DHL Global Mail 2013 ∙ n Global from 1,275 to 11,265 ∙ n Italy from 68 to 500
Country information Italy Country profile · Media Use · Distance selling · “Customer jour-ney“ · Drivers & barriers in distance selling · Cross-border shopping · Dialog marketing
More than 20 orders
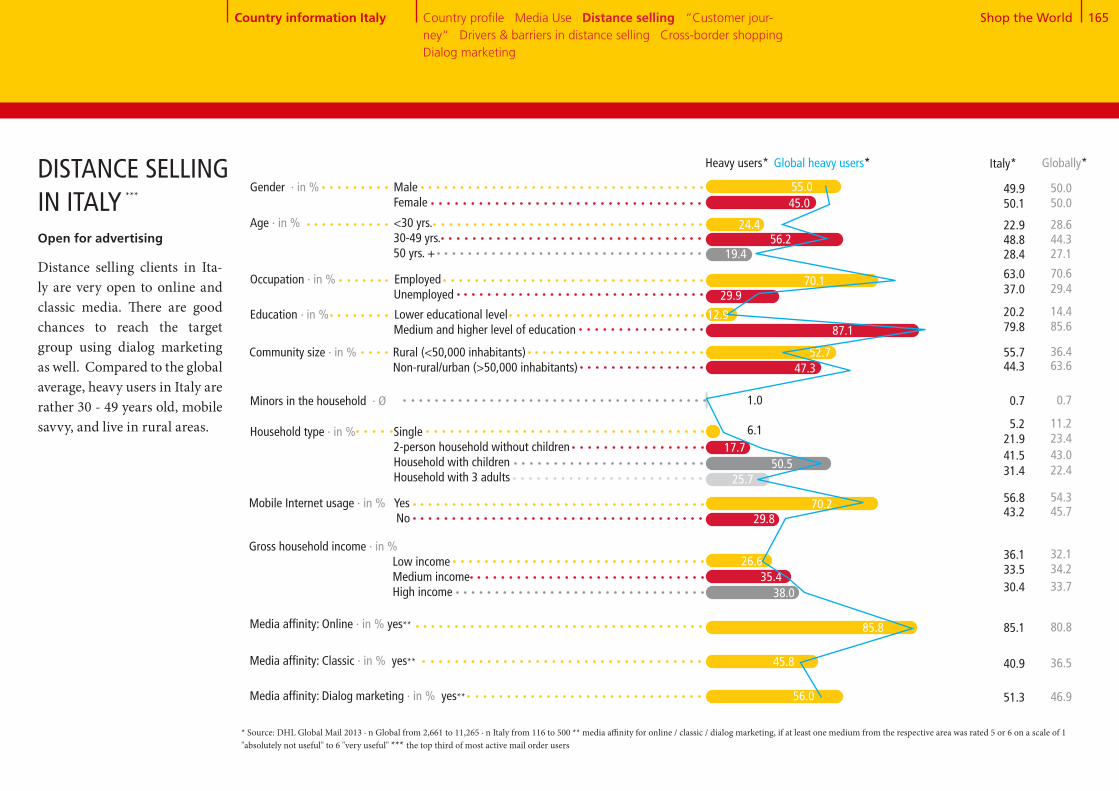
Shop the World 165
Globally*
56.2
Gender · in % Male Female
Age · in % <30 yrs. 30-49 yrs. 50 yrs. +
Occupation · in % Employed Unemployed
Education · in % Lower educational level Medium and higher level of education
Media affinity: Online · in % yes**
Community size · in % Rural (<50,000 inhabitants) Non-rural/urban (>50,000 inhabitants)
Minors in the household · Ø
Household type · in % Single 2-person household without children Household with children Household with 3 adults
Mobile Internet usage · in % Yes No
Gross household income · in % Low income Medium income High income
Media affinity: Classic · in % yes**
Media affinity: Dialog marketing · in % yes** 56.0
45.8
85.8
38.035.4
26.6
29.870.2
25.750.5
45.0
24.4
55.0
29.9
87.1
47.3
1.0
17.76.1
70.1
Open for advertising
Distance selling clients in Ita-ly are very open to online and classic media. There are good chances to reach the target group using dialog marketing as well. Compared to the global average, heavy users in Italy are rather 30 - 49 years old, mobile savvy, and live in rural areas.
DISTANCE SELLING IN ITALY
* Source: DHL Global Mail 2013 ∙ n Global from 2,661 to 11,265 ∙ n Italy from 116 to 500 ** media affinity for online / classic / dialog marketing, if at least one medium from the respective area was rated 5 or 6 on a scale of 1 "absolutely not useful" to 6 "very useful" *** the top third of most active mail order users
44.327.1
14.4
36.4
46.9
36.5
80.8
33.734.232.1
45.754.3
22.443.0
50.0
28.6
50.0
29.4
85.6
63.6
0.7
23.411.2
70.6
Country information Italy Country profile · Media Use · Distance selling · “Customer jour-ney“ · Drivers & barriers in distance selling · Cross-border shopping · Dialog marketing
***
Italy*
48.828.4
20.2
55.7
51.3
40.9
85.1
30.433.536.1
43.256.8
31.441.5
50.1
22.9
49.9
37.0
79.8
44.3
0.7
21.95.2
63.0
19.4
52.7
Heavy users* Global heavy users*
12.9
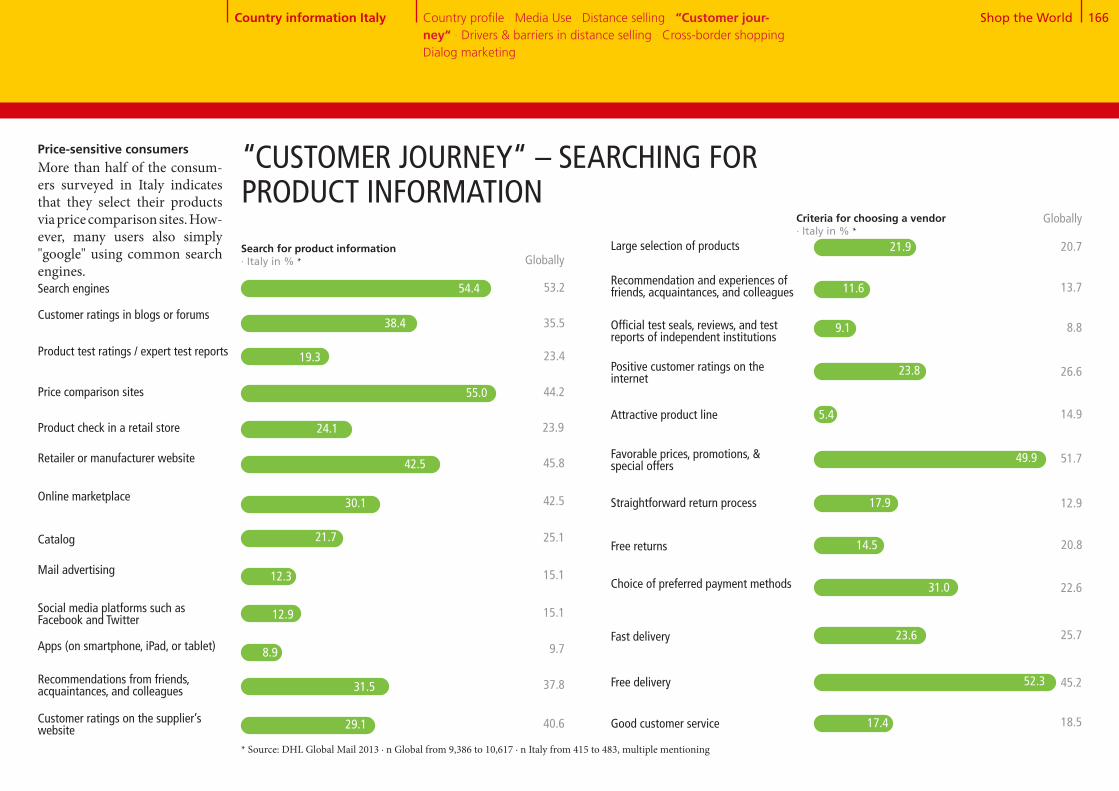
Shop the World 166
Search engines
Customer ratings in blogs or forums
Product test ratings / expert test reports
Product check in a retail store
Retailer or manufacturer website
Online marketplace
Catalog
Mail advertising
Social media platforms such as Facebook and Twitter
Apps (on smartphone, iPad, or tablet)
Recommendations from friends, acquaintances, and colleagues
Customer ratings on the supplier’s website
Price comparison sites
Large selection of products
Recommendation and experiences of friends, acquaintances, and colleagues
Official test seals, reviews, and test reports of independent institutions
Attractive product line
Favorable prices, promotions, & special offers
Straightforward return process
Free returns
Choice of preferred payment methods
Fast delivery
Free delivery
Good customer service
Positive customer ratings on the internet
“CUSTOMER JOURNEY“ – SEARCHING FOR PRODUCT INFORMATION
Search for product information · Italy in % * Globally
35.5
53.2
23.4
44.2
23.9
45.8
42.5
25.1
15.1
15.1
9.7
37.8
Criteria for choosing a vendor · Italy in % *
Globally
40.6
11.6 13.7
20.7
9.1 8.8
23.8 26.6
5.4 14.9
49.9 51.7
17.9 12.9
14.5 20.8
31.0 22.6
23.6 25.7
52.3 45.2
17.4 18.5
21.9
Price-sensitive consumersMore than half of the consum-ers surveyed in Italy indicates that they select their products via price comparison sites. How- ever, many users also simply "google" using common search engines.
* Source: DHL Global Mail 2013 ∙ n Global from 9,386 to 10,617 ∙ n Italy from 415 to 483, multiple mentioning
Country information Italy Country profile · Media Use · Distance selling · “Customer jour-ney“ · Drivers & barriers in distance selling · Cross-border shopping · Dialog marketing
38.4
19.3
55.0
24.1
42.5
30.1
21.7
12.3
12.9
8.9
31.5
54.4
29.1

Shop the World 167
Usefulness of advertising media · in % *, **
5 and 63 and 41 and 2
Ø
42.521.6 35.926.1 43.8 30.1
Online advertising
* Source: DHL Global Mail 2013 ∙ n Global from 10,218 to 10,384 ∙ n Italy from 473 to 478 ** scale from 1 "absolutely not useful“ to 6 very useful“
High affinity for advertising
In Italy, advertisements are gen- erally evaluated as useful for purchasing decisions with greater than average frequency. Search engines and price com-parison sites are most popular. Of the traditional media, cata-logs and TV ads are particular-ly liked.
ACCEPTANCE OF ADVERTISING MEDIA
Italy Globally
Country information Italy Country profile · Media Use · Distance selling · “Customer jour-ney“ · Drivers & barriers in distance selling · Cross-border shopping · Dialog marketing
Television advertising
5 and 63 and 41 and 2
3.83.6
Ø
40.824.0 35.230.6 41.8 27.6
3.73.4
45.031.8 23.238.7 40.4 20.9Social media
Italy Globally
Advertising letters
3.33.1
43.725.1 31.233.9 37.6 28.5
3.63.4
Product suggestions in online shops
46.015.4 38.618.9 45.1 36.0
4.03.9
25.44.6 70.06.5 28.7 64.8
4.94.8
25.65.3 69.19.1 31.7 59.1
4.94.6
48.625.0 26.429.9 43.9 26.2
Italy Globally
Household advertising
3.53.4
49.123.1 27.829.0 46.7 24.3
Italy Globally
Advertisements in mag- azines and periodicals
3.63.4
44.430.4 25.234.8 43.1 22.1
Italy Globally
Advertisements in newspapers
3.43.2
46.231.1 22.741.8 40.7 17.6
Italy Globally
Billboard advertise-ments
3.33.0
48.729.8 21.544.3 38.8 16.9
Italy Globally
Radio
3.32.9
45.914.5 39.619.3 44.2 36.6
Italy Globally
Catalogs from vendors
4.03.9
Italy Globally
Italy Globally
Italy Globally
Internet search engines
Italy Globally
Price comparison sites
Italy Globally

Shop the World 168
Online PC
Online mobile (tablet, smartphone)
By telephone
In writing (by post, fax)
By email
Order in store & delivery to home
Online marketplace
Mail order company from which I received a catalog
Merchant who advertises on TV
Online shop of a manufaturer or
retailer
Use of different suppliers · in % *
Never Seldom Frequently / very frequently
Occasionally
* Source: DHL Global Mail 2013 ∙ n Global from 9,270 to 9,446 ∙ n Italy from 409 to 415
Italy Global
69.3
4.6
3.1
5.5
75.0
3.2
2.1
4.4
“CUSTOMER JOURNEY“– PLACING ORDERSMany roads lead to Rome
Italian consumers are open to all channels: On the one hand, 12 % of the Italian distance sell-ing clients already use tablets and smartphones as primary ordering channel. On the other hand, 13.2 % primarily order through traditional offline channels (by phone, in writing, in stores).When looking into the dis-tribution channels, a versatile image can be observed in com-parison to the the rest of the world. Online marketplaces, which are used by almost half of the consumers, are of highest importance. Opinions differ with respect to catalogs: The Italian target group contains slightly more intensive users as well as more opponents of cat-alog ordering. There is a small group that still favors teleshop- ping.
18.8 33.714.4
15.4 31.216.8
33.1
36.6
Italy
Globally
11.4 53.59.8
9.9 54.38.7
25.2
27.0
45.2 15.618.7
38.5 12.622.8
20.4
26.1
61.7 8.016.1
60.2 6.617.6
14.2
15.7
12.0
10.5
5.5
4.8
Order channels · in % *
Country information Italy Country profile · Media Use · Distance selling · “Customer jour-ney“ · Drivers & barriers in distance selling · Cross-border shopping · Dialog marketing
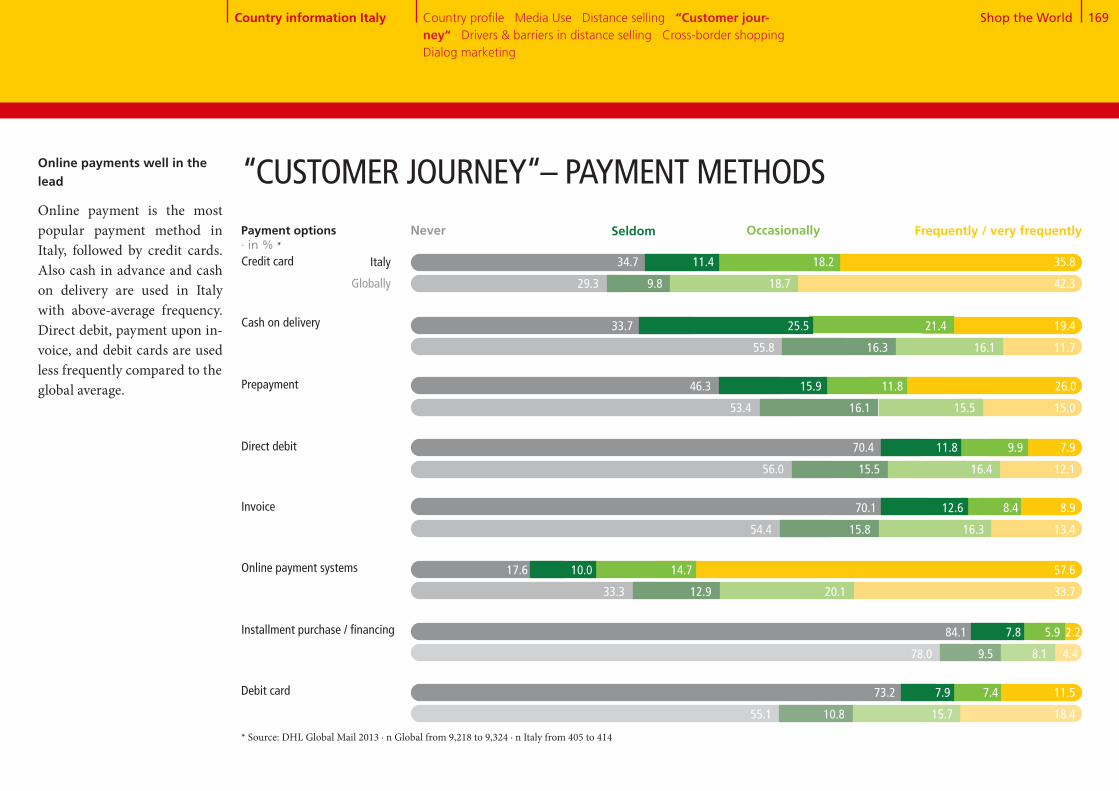
Shop the World 169
Online payments well in the lead
Online payment is the most popular payment method in Italy, followed by credit cards. Also cash in advance and cash on delivery are used in Italy with above-average frequency. Direct debit, payment upon in-voice, and debit cards are used less frequently compared to theglobal average.
Cash on delivery
Prepayment
Direct debit
Credit card
* Source: DHL Global Mail 2013 ∙ n Global from 9,218 to 9,324 ∙ n Italy from 405 to 414
“CUSTOMER JOURNEY“– PAYMENT METHODS
Online payment systems
Installment purchase / financing
Debit card
Invoice
Payment options · in % *
Never Seldom Frequently / very frequentlyOccasionally
Italy
Globally
34.7 11.4 18.2 35.8
29.3 9.8 18.7 42.3
33.7 25.5 21.4 19.4
55.8 16.3 16.1 11.7
46.3 15.9 11.8 26.0
53.4 16.1 15.5 15.0
70.4 11.8 9.9 7.9
56.0 15.5 16.4 12.1
70.1 12.6 8.4 8.9
54.4 15.8 16.3 13.4
17.6 10.0 14.7 57.6
33.3 12.9 20.1 33.7
84.1 7.8 5.9 2.2
78.0 9.5 8.1 4.4
73.2 7.9 7.4 11.5
55.1 10.8 15.7 18.4
Country information Italy Country profile · Media Use · Distance selling · “Customer jour-ney“ · Drivers & barriers in distance selling · Cross-border shopping · Dialog marketing

Shop the World 170
The option of selecting the shipping company The vendor only works with reliable delivery companies
Detailed information regarding de-livery period & delivery date when ordering
Fast delivery
Free delivery
Tracking information
Delivery to a retail store
Delivery to a parcel locker or drop box
Other collection points (supermar-ket, kiosk, gas station)
Italy Globally
3.8
3.7
3.9
5.4
5.1
5.2
4.0
4.8
4.8
Max. accepted order time · Ø in days *
3.6
3.5
3.7
5.3
4.8
5.1
3.8
4.9
4.7
* Source: DHL Global Mail 2013 ∙ n Global from 10,270 to 10,462 ∙ n Italy from 471 to 476 ** scale from 1 "absolutely not important“ to 6 "very important“
Realistic expectations
The accepted delivery time of 6.5 days as well as the delivery expectations are in line with the global reference values. Naturally, the price-conscious Italian consumers clearly prefer free deliveries.
“CUSTOMER JOURNEY“ – DELIVERY
1 2 3 4 5 6
Requirements for delivery · Ø *,**
Country information Italy Country profile · Media Use · Distance selling · “Customer jour-ney“ · Drivers & barriers in distance selling · Cross-border shopping · Dialog marketing
6.5
6.5
Italy Globally
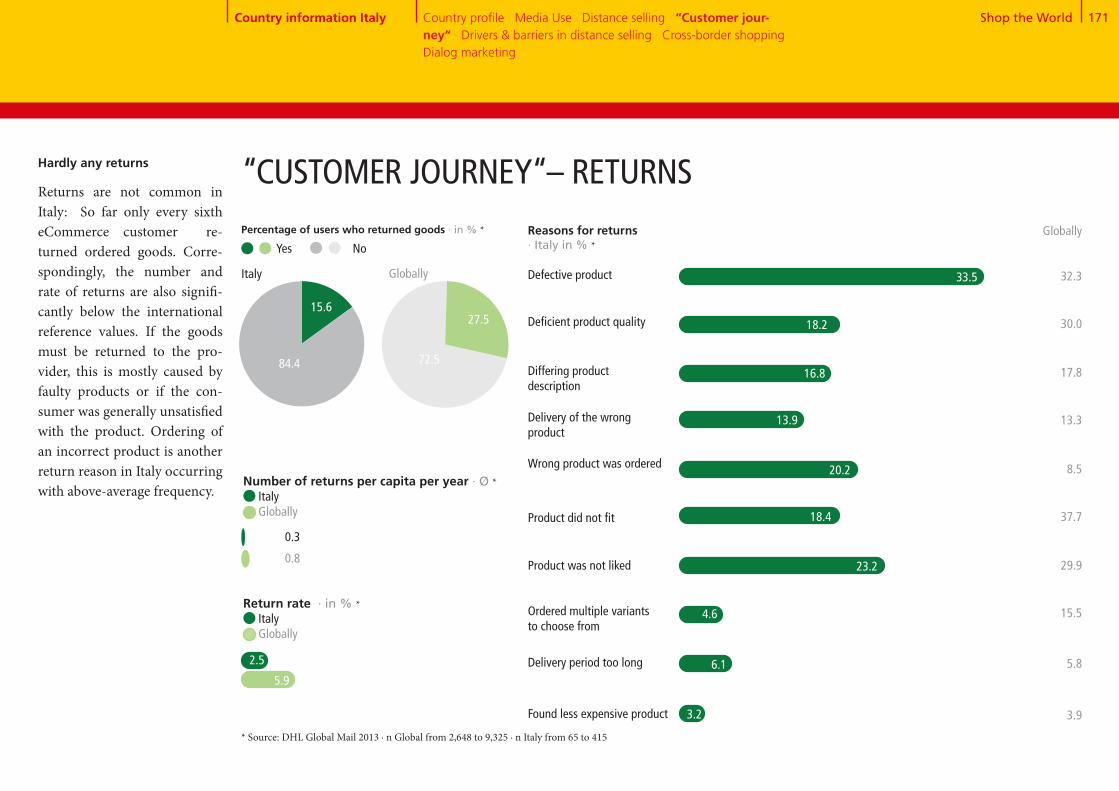
Shop the World 171
15+85
72+28
Number of returns per capita per year · Ø * Italy Globally
0.8
0.3
Return rate · in % * Italy Globally
5.9
Reasons for returns · Italy in % *
Defective product 33.5
Percentage of users who returned goods · in % *
15.6
84.4
Italy Globally
Yes No
“CUSTOMER JOURNEY“– RETURNSHardly any returns
Returns are not common in Italy: So far only every sixth eCommerce customer re-turned ordered goods. Corre- spondingly, the number and rate of returns are also signifi-cantly below the international reference values. If the goods must be returned to the pro-vider, this is mostly caused by faulty products or if the con- sumer was generally unsatisfied with the product. Ordering of an incorrect product is another return reason in Italy occurring with above-average frequency.
27.5
72.5
* Source: DHL Global Mail 2013 ∙ n Global from 2,648 to 9,325 ∙ n Italy from 65 to 415
Differing product description
Delivery of the wrong product
Wrong product was ordered
Product did not fit
Ordered multiple variants to choose from
Delivery period too long
Found less expensive product
Deficient product quality
Product was not liked
16.8
13.9
18.4
23.2
4.6
6.1
3.2
Globally
32.3
30.0
17.8
13.3
8.5
37.7
29.9
15.5
5.8
3.9
18.2
20.2
Country information Italy Country profile · Media Use · Distance selling · “Customer jour-ney“ · Drivers & barriers in distance selling · Cross-border shopping · Dialog marketing
2.5

Shop the World 172
High delivery costs
Uncertain delivery
Concern about misuse of payment data
No demand because all products are obtainable locally
Long delivery times
Unknown product quality
No try-on possible before purchase
Complicated return process
No personal advice
No personal contact person for problems
Doubts regarding data protection or the dissemination of data to third parties
Concern about counterfeited products, product piracy
Product can only be obtained via distance selling
Easy price comparison
Shopping 24/7
Location-independent ordering
Higher product quality
Lower prices
Greater selection
Option to deliver to a preferred location
DRIVERS & BARRIERS IN DISTANCE SELLING Barriers
· Italy in % *
50.8
54.6
72.6
63.5
7.8
59.1
46.0
67.3
71.9
40.6
40.8
Globally
36.6
24.2
34.4
3.9
25.8
48.5
64.9
44.1
21.5
22.0
29.8
34.1
Price-sensitive target group
Better prices are clearly the main reason for using distance selling in Italy. Overall, there is little concern regarding barri-ers to distance selling.
Drivers · Italy in % *
Globally
* Source: DHL Global Mail 2013 ∙ n Global from 10,509 to 10,864 ∙ n Italy from 482 to 482
46.6
57.9
67.4
60.9
5.2
33.2
23.0
32.5
4.1
16.5
21.1
63.0
40.7
14.9
21.2
21.9
28.2
Country information Italy Country profile · Media Use · Distance selling · “Customer jour-ney“ · Drivers & barriers in distance selling · Cross-border shopping · Dialog marketing
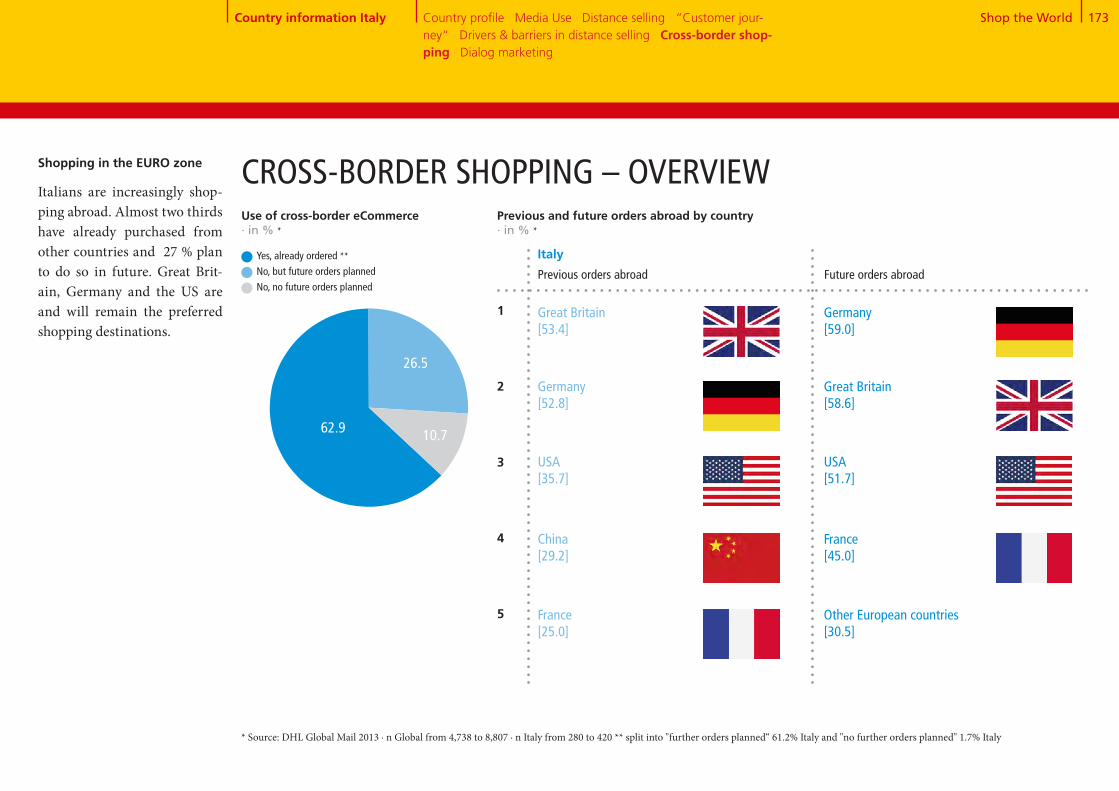
Shop the World 173
63+26+11
CROSS-BORDER SHOPPING – OVERVIEW
Previous orders abroad
Previous and future orders abroad by country · in % *
China[29.2]
France[25.0]
1
2
3
4
5
Great Britain[53.4]
Germany[52.8]
USA[35.7]
Future orders abroad
Italy
* Source: DHL Global Mail 2013 ∙ n Global from 4,738 to 8,807 ∙ n Italy from 280 to 420 ** split into "further orders planned“ 61.2% Italy and "no further orders planned" 1.7% Italy
Shopping in the EURO zone
Italians are increasingly shop-ping abroad. Almost two thirds have already purchased from other countries and 27 % plan to do so in future. Great Brit-ain, Germany and the US are and will remain the preferred shopping destinations.
France[45.0]
Other European countries[30.5]
Germany[59.0]
Great Britain[58.6]
USA[51.7]
Country information Italy Country profile · Media Use · Distance selling · “Customer jour-ney“ · Drivers & barriers in distance selling · Cross-border shop-ping · Dialog marketing
Use of cross-border eCommerce· in % *
Yes, already ordered **No, but future orders planned No, no future orders planned
26.5
62.9 10.7
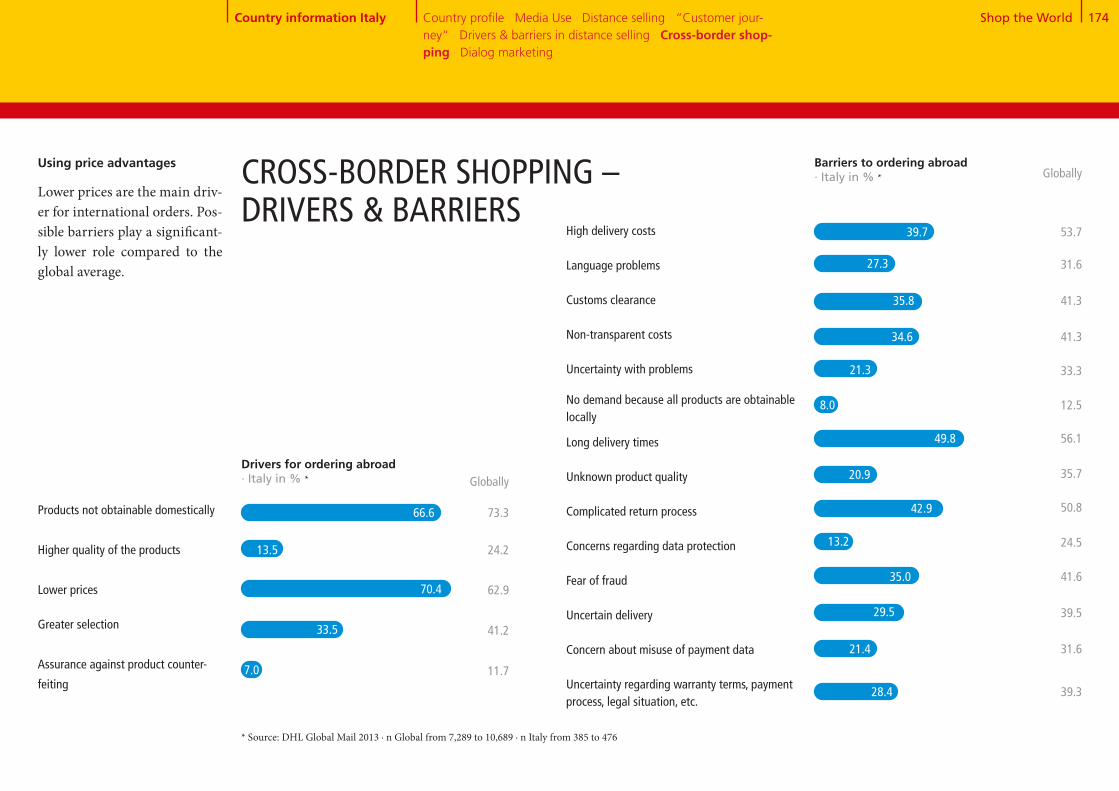
Shop the World 174
Products not obtainable domestically
Higher quality of the products
Lower prices
Greater selection
Assurance against product counter-
feiting
High delivery costs Language problems
Customs clearance
Non-transparent costs
Uncertainty with problems
No demand because all products are obtainable locally
Long delivery times
Unknown product quality
Complicated return process
Concerns regarding data protection Fear of fraud Uncertain delivery
Concern about misuse of payment data
Uncertainty regarding warranty terms, payment process, legal situation, etc.
Drivers for ordering abroad· Italy in % *
Barriers to ordering abroad · Italy in % *
Globally
73.3
24.2
62.9
41.2
11.7
Globally
53.7
31.6
41.3
41.3
33.3
12.5
56.1
35.7
50.8
24.5
41.6
39.5
31.6
39.3
Using price advantages
Lower prices are the main driv-er for international orders. Pos-sible barriers play a significant-ly lower role compared to the global average.
CROSS-BORDER SHOPPING – DRIVERS & BARRIERS
* Source: DHL Global Mail 2013 ∙ n Global from 7,289 to 10,689 ∙ n Italy from 385 to 476
39.7
27.3
35.8
34.6
21.3
8.0
49.8
20.9
42.9
13.2
35.0
29.5
21.4
28.4
66.6
13.5
70.4
33.5
7.0
Country information Italy Country profile · Media Use · Distance selling · “Customer jour-ney“ · Drivers & barriers in distance selling · Cross-border shop-ping · Dialog marketing

Shop the World 175
Receipt of mailings and catalogs · Italy in % *
5 and 63 and 41 and 2
DIALOG MARKETING
Reading mailings and catalogs
· in % *,**
Italy
Globally
14.6 29.6 55.7
22.1 35.2 42.7
5 and 63 and 41 and 2
Response to mailings and catalogs · in % *,**
Italy
Globally
23.9 46.1 30.0
29.0 45.8 25.3
Response channel for mailings and catalogs · Italy in % * Globally
Website visits
Visits to stores or
branch offices
Other online
response (e.g. chat,
Twitter, Facebook,
newsletter
registration, etc.)
Phone call
Business reply card
72.5 73.4
48.6
30.0
24.5
18.4
12.6
* Source: DHL Global Mail 2013 ∙ n Global from 8,788 to 11,265 ∙ n Italy from 406 to 500 ** scale from 1 "never“ to 6 "almost always“
Open dialog
Many Italian consumers re- ceive mailings and catalogs very frequently and read them with great interest. Further-more, Italians love to respond: Visiting the website is clearly ahead - also globally. Paying a visit to the store of the adver-tising company is popular as well.
Globally
One or more times per week
One or more times per month
Less than once per month
Never
26.9
33.7
27.7
11.6 56.5
30.4
27.1
14.5
14.2
34.2
38.8
22.1
4.8
Country information Italy Country profile · Media Use · Distance selling · “Customer jour-ney“ · Drivers & barriers in distance selling · Cross-border shop-ping · Dialog marketing

CountryInformationJapan
Tomoki
Japanese online customers are highly educated,urban and have high incomes. They order almost everything, but better not from abroad.

Shop the World 177
17.9
Population 0 - 15 years
The economy in Japan * COUNTRY PROFILE JAPAN
Tokyo 36,933
Osaka-Kobe 11,430
* Source: Fischer World Almanac 2014, Germany Trade & Invest ** Source: Metropolitan areas with 1 million inhabitants and more; United Nations, Department of Economic and Social Affairs, Po-pulation Division (2012). World Urbanization Prospects: The 2011 Revision, CD-ROM Edition. *** Source: Copyright © IHS, 2013. All rights reserved **** Source: Copyright © IHS, 2013. All rights reserved
Number of households Ø Household sizeUnemployment rateInflation rate
1.4
Economic growth · in % ****
>
>
1.6
-0.4
2011 2012 2013
Age distribution · 2013 in mn.
Population 65 years and older
Population, total · 2013 in mn. 126.5 ***
Country information Japan Country profile · Media Use · Distance selling · “Customer jour-ney“ · Drivers & barriers in distance selling · Cross-border shopping · Dialog marketing
Population 16 - 64 years
· 2013 in mn.· 2013· 2013 in %· 2013 in %
45.0 2.84.00.4
Japan‘s economy is in good shape. In 2013 the GDP increased by 1.6%, for 2014 the OECD predicts a growth of 1.5 %. The development is sustained by domestic demand. There are a couple of reasons for this trend. The significant inflation during the past years has been overcome through fiscal policy of the Bank of Japan. In ad- dition the low exchange rate of the Yen supports the Japanese export economy. On the other side contrasting developments can be noticed. The increase in excise tax beginning of 2014 is considered a stumbling block for the economy‘s development. It affects numerous industries and private consumption. It is in discussion to provide low income households with extra cash payments in order to miti- gate the consequences.
78.1
30.5Sendai 2,401
Kyoto 1,804 Nagoya
3,300
Hiroshima 2,103
Fukuoka- Kitakyushu
2,845
Sapporo 2,714
Metropolitan areas with 1 million inhabitants or more · 2011 in thousands **
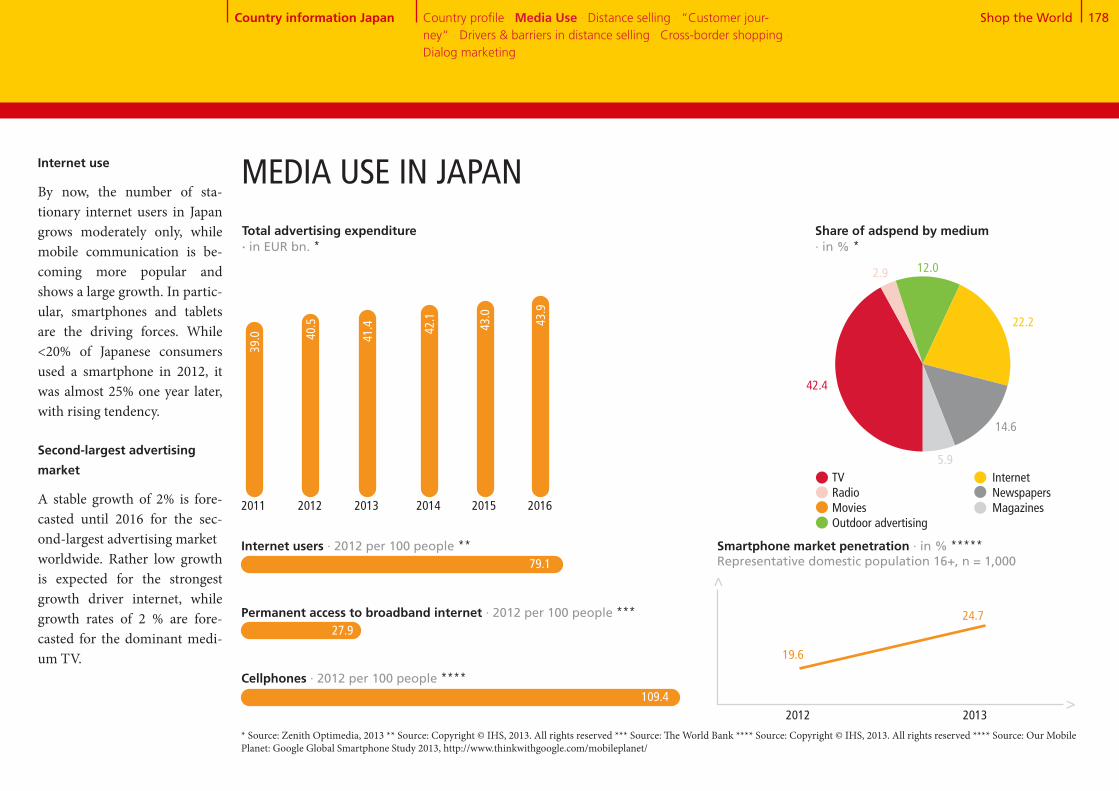
Shop the World 178
42+3+12+22+15+6MEDIA USE IN JAPAN
27.9
109.4
Smartphone market penetration · in % *****Representative domestic population 16+, n = 1,000
19.6
Internet users · 2012 per 100 people **
Permanent access to broadband internet · 2012 per 100 people ***
Cellphones · 2012 per 100 people ****
2012 2013
24.7
Share of adspend by medium · in % *
TV Radio Movies Outdoor advertising
Total advertising expenditure · in EUR bn. *
Internet Newspapers Magazines
>>
* Source: Zenith Optimedia, 2013 ** Source: Copyright © IHS, 2013. All rights reserved *** Source: The World Bank **** Source: Copyright © IHS, 2013. All rights reserved **** Source: Our Mobile Planet: Google Global Smartphone Study 2013, http://www.thinkwithgoogle.com/mobileplanet/
2011 2012 2013 2014 2015
43.0
79.1
42.1
41.4
40.5
39.0
2016
43.9
Country information Japan Country profile · Media Use · Distance selling · “Customer jour-ney“ · Drivers & barriers in distance selling · Cross-border shopping · Dialog marketing
22.2
14.6
5.9
12.02.9
42.4
Internet use
By now, the number of sta- tionary internet users in Japan grows moderately only, while mobile communication is be- coming more popular and shows a large growth. In partic- ular, smartphones and tablets are the driving forces. While <20% of Japanese consumers used a smartphone in 2012, it was almost 25% one year later, with rising tendency.
Second-largest advertising
market
A stable growth of 2% is fore- casted until 2016 for the sec-ond-largest advertising marketworldwide. Rather low growth is expected for the strongest growth driver internet, while growth rates of 2 % are fore- casted for the dominant medi-um TV.

Shop the World 179
Low growth rates
Due to a high level of market saturation, the third-largest distance selling market shows little growth only. Groceries, cosmetics, and healthcare prod- ucts are the most popular cat- egories purchased in Japan. Further growth is mainly ex-pected in consumer electronics, media products, groceries, and fashion.
DISTANCE SELLING IN JAPAN
12,746.3
Distance selling purchases in 2013 - trend for 2018 · in EUR mn. * 2013 2018
Apparel and footwear
3,905.3
2,795.5
8,606.8
6,201.9
2,667.2
2,477.3
8,217.3
1,590.0
1,682.7
2,848.3
1,085.4
1,023.3
2,739.0
619.8
413.0
208.1
Consumer electronics,
computers + equipment
Media products (books, CDs,
DVDs, etc.)
housewares and home
furnishings + textiles
Food + beverages
Household and consumer
appliances
Beauty and personal care
DIY and gardening
OTC drugs and dietary supple-
ments
Traditional toys and games
House cleaning (detergent, chastener, etc.)
Development of Distance selling and share of total retail 2011 - 2018 · in EUR bn. *
CAGR: 4.8%
Home shopping
Online shopping29.2 32.3 35.4
23.122.6
22.0
38.8 52.1
21.6
20.4
2011 2012 2013e 2014e 2018e
Share of total retail · in % 6.3 6.5 6.8 7.1 8.5
* Source: Euromonitor International
9,921.6
189.7
Country information Japan Country profile · Media Use · Distance selling · “Customer jour-ney“ · Drivers & barriers in distance selling · Cross-border shopping · Dialog marketing
6,240.0
2,573.4
2,863.6

Shop the World 180
86+1484
+16
Saturated market
Japan features a strongly de-veloped distance selling mar-ket. Based on the Japanese con- sumer feedback, this will con- tinue. 95% of surveyed users are planning to order at least as often as in the last 12 months.Use of distance selling · in % *
85.7
14.3
Japan
Globally
83.5
16.5
Number of orders in the previous year · in % *
1 to 5 orders
6 to 10 orders
11 to 20 orders
More than 20 orders
No orders
20.3
27.1
20.2
14.3
18.1
20.5
35.9
15.2
16.5
12.0
Future ordering behavior (current users) · in % *
More frequently than in the last
12 months
Just as frequently as in the last
12 months
Less frequently than in the last
12 months
74.9
19.6
55.2
38.8
5.4 6.1
Non-users of distance selling - future plans · in % *
Yes47.7
Japan
Globally
Yes70.5
No52.3
No29.5
Yes No
Japan Globally Japan Globally
DISTANCE SELLING IN JAPAN
* Source: DHL Global Mail 2013 ∙ n Global from 1,275 to 11,265 ∙ n Japan from 44 to 514
Country information Japan Country profile · Media Use · Distance selling · “Customer jour-ney“ · Drivers & barriers in distance selling · Cross-border shopping · Dialog marketing

Shop the World 181
Globally*
50.7
Gender · in % Male Female
Age · in % <30 yrs. 30-49 yrs. 50 yrs. +
Occupation · in % Employed Unemployed
Education · in % Lower educational level Medium and higher level of education
25.9
Media affinity: Online · in % yes**
Community size · in % Rural (<50,000 inhabitants) Non-rural/urban (>50,000 inhabitants)
Minors in the household · Ø
Household type · in % Single 2-person household without children Household with children Household with 3 adults
Mobile Internet usage · in % Yes No
Gross household income · in % Low income Medium income High income
Media affinity: Classic · in % yes**
Media affinity: Dialog marketing · in % yes** 37.0
28.0
84.0
54.825.7
19.4
53.646.4
26.539.4
52.2
22.0
47.8
35.5
74.1
85.6
0.7
21.512.6
64.5
Urban structure dominant Japan‘s society is very much concentrated in urban areas. Accordingly, the majority of eCommerce customers lives in urban centers. The group of heavy users can be increasingly found in the group of older consumers, who do not work anymore. Within this group only 46.4% are using mobile devices, which is significantly below the global average.
DISTANCE SELLING IN JAPAN
* Source: DHL Global Mail 2013 ∙ n Global from 2,661 to 11,265 ∙ n Japan from 125 to 514 ** media affinity for online / classic / dialog marketing, if at least one medium from the respective area was rated 5 or 6 on a scale of 1 "absolutely not useful" to 6 "very useful" *** the top third of most active mail order users
44.327.1
14.4
36.4
46.9
36.5
80.8
33.734.232.1
45.754.3
22.443.0
50.0
28.6
50.0
29.4
85.6
63.6
0.7
23.411.2
70.6
Country information Japan Country profile · Media Use · Distance selling · “Customer jour-ney“ · Drivers & barriers in distance selling · Cross-border shopping · Dialog marketing
***
Japan*
45.732.2
30.2
16.4
34.0
26.1
78.1
38.328.832.9
62.637.4
26.737.0
49.7
22.2
50.3
34.2
69.8
83.6
0.7
20.615.6
65.8
27.3
14.4
Heavy users* Global heavy users*

Shop the World 182
Search engines
Customer ratings in blogs or forums
Product test ratings / expert test reports
Product check in a retail store
Retailer or manufacturer website
Online marketplace
Catalog
Mail advertising
Social media platforms such as Facebook and Twitter
Apps (on smartphone, iPad, or tablet)
Recommendations from friends, acquaintances, and colleagues
Customer ratings on the supplier’s website
Price comparison sites
Large selection of products
Recommendation and experiences of friends, acquaintances, and colleagues
Official test seals, reviews, and test reports of independent institutions
Attractive product line
Favorable prices, promotions, & special offers
Straightforward return process
Free returns
Choice of preferred payment methods
Fast delivery
Free delivery
Good customer service
Positive customer ratings on the internet
“CUSTOMER JOURNEY“ – SEARCHING FOR PRODUCT INFORMATION
Search for product information · Japan in % * Globally
23.4 35.5
53.2
6.9 23.4
54.0 44.2
29.3 23.9
45.7 45.8
40.3 42.5
24.2 25.1
9.1 15.1
9.2 15.1
7.1 9.7
17.7 37.8
Criteria for choosing a vendor · Japan in % *
Globally
44.3
34.2 40.6
7.8 13.7
20.7
6.1 8.8
39.3 26.6
10.3 14.9
64.2 51.7
4.8 12.9
13.0 20.8
24.0 22.6
18.5 25.7
62.8 45.2
11.5 18.5
6.9
The price mattersPrice comparison sites are the most important source for prod-uct information searches. Along with that, affordable prices and free-of-charge delivery are key criteria for selecting a distance selling provider.
* Source: DHL Global Mail 2013 ∙ n Global from 9,386 to 10,617 ∙ n Japan from 437 to 475, multiple mentioning
Country information Japan Country profile · Media Use · Distance selling · “Customer jour-ney“ · Drivers & barriers in distance selling · Cross-border shopping · Dialog marketing
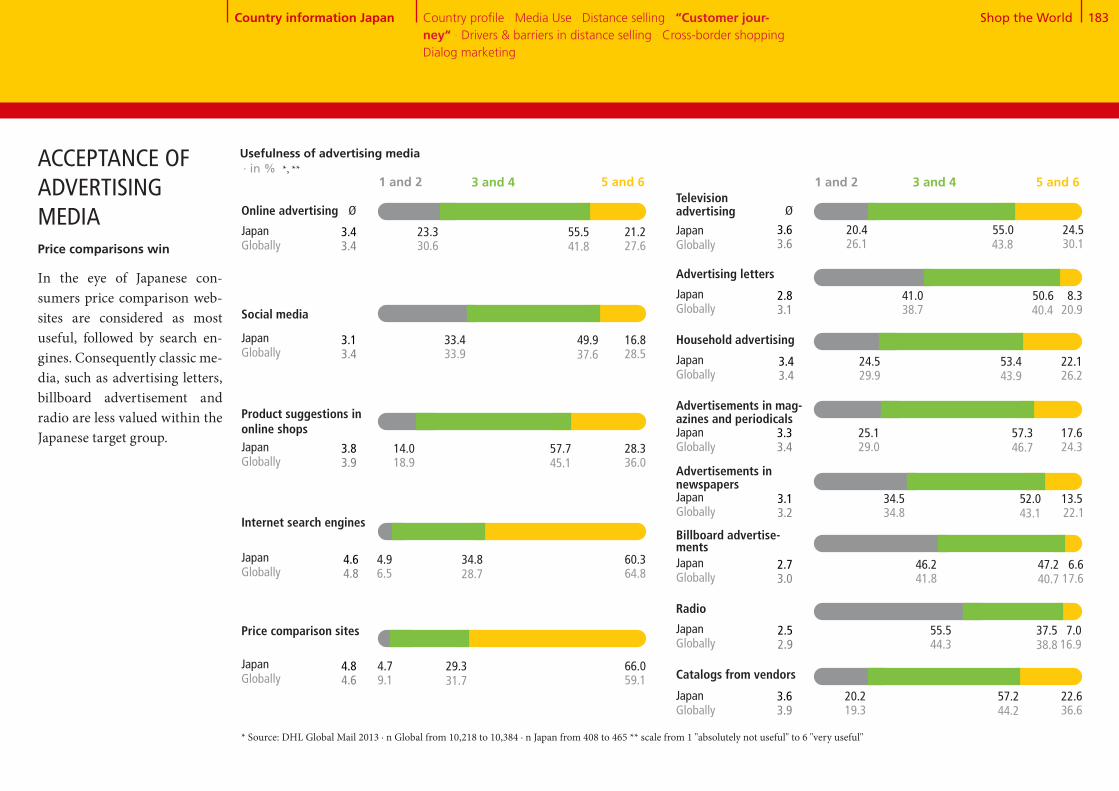
Shop the World 183
Usefulness of advertising media · in % *, **
5 and 63 and 41 and 2
Ø
55.020.4 24.526.1 43.8 30.1
Online advertising
* Source: DHL Global Mail 2013 ∙ n Global from 10,218 to 10,384 ∙ n Japan from 408 to 465 ** scale from 1 "absolutely not useful" to 6 "very useful"
Price comparisons win In the eye of Japanese con- sumers price comparison web-sites are considered as most useful, followed by search en-gines. Consequently classic me-dia, such as advertising letters, billboard advertisement and radio are less valued within the Japanese target group.
ACCEPTANCE OF ADVERTISING MEDIA
Japan Globally
Country information Japan Country profile · Media Use · Distance selling · “Customer jour-ney“ · Drivers & barriers in distance selling · Cross-border shopping · Dialog marketing
Television advertising
5 and 63 and 41 and 2
3.63.6
Ø
55.523.3 21.230.6 41.8 27.6
3.43.4
50.641.0 8.338.7 40.4 20.9Social media
Japan Globally
Advertising letters
2.83.1
49.933.4 16.833.9 37.6 28.5
3.13.4
Product suggestions in online shops
57.714.0 28.318.9 45.1 36.0
3.83.9
34.84.9 60.36.5 28.7 64.8
4.64.8
29.34.7 66.09.1 31.7 59.1
4.84.6
53.424.5 22.129.9 43.9 26.2
Japan Globally
Household advertising
3.43.4
57.325.1 17.629.0 46.7 24.3
Japan Globally
Advertisements in mag- azines and periodicals
3.33.4
52.034.5 13.534.8 43.1 22.1
Japan Globally
Advertisements in newspapers
3.13.2
47.246.2 6.641.8 40.7 17.6
Japan Globally
Billboard advertise-ments
2.73.0
37.555.5 7.044.3 38.8 16.9
Japan Globally
Radio
2.52.9
57.220.2 22.619.3 44.2 36.6
Japan Globally
Catalogs from vendors
3.63.9
Japan Globally
Japan Globally
Japan Globally
Internet search engines
Japan Globally
Price comparison sites
Japan Globally

Shop the World 184
Use of different suppliers · in % *
Online marketplace
Mail order company from which I received a catalog
Merchant who advertises on TV
Never Seldom Frequently / very frequently
Occasionally
Online shop of a manufaturer or retailer
* Source: DHL Global Mail 2013 ∙ n Global from 9,270 to 9,446 ∙ n Japan from 430 to 441
Japan Global
Online PC
Online mobile (tablet, smartphone)
By telephone
In writing (by post, fax)
By email
Order in store & delivery to home
85.0
1.3
0.7
1.8
75.0
3.2
2.1
4.4
“CUSTOMER JOURNEY“– PLACING ORDERSOnline rules
85% of the Japanese dis- tance selling clients mainly place their orders via PC. Around every tenth person uses a tablet or smartphone. Only 3 % use offline ordering chan-nels. This distance to offline channels can also be seen in the very limited use of catalogs, which are not even recognized anymore by almost half of the consumers. The extraordinary preference for online channels can be seen in the high us- age intensity of online market- places. With around two thirds, Japanese consumers visit these places significantly more fre-quently than the global average. However, online shops follow with a significant gap in second place. Teleshopping is of almost no importance.
20.8 24.414.8
15.4 31.216.8
40.0
36.6
Japan
Globally
6.3 65.94.8
9.9 54.38.7
23.0
27.0
48.0 6.019.7
38.5 12.622.8
26.3
26.1
68.5 3.017.6
60.2 6.617.6
10.9
15.7
10.2
10.5
1.0
4.8
Ordering methods in the mail order business · in % *
Country information Japan Country profile · Media Use · Distance selling · “Customer jour-ney“ · Drivers & barriers in distance selling · Cross-border shopping · Dialog marketing
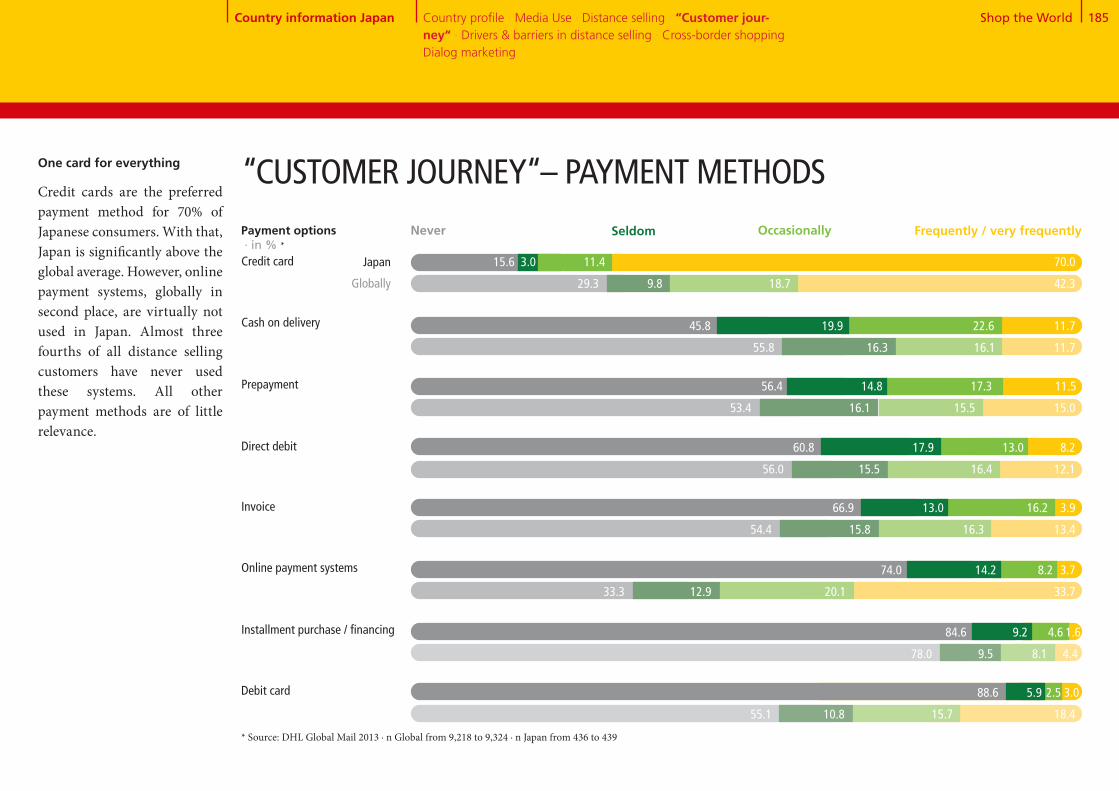
Shop the World 185
One card for everything
Credit cards are the preferred payment method for 70% of Japanese consumers. With that, Japan is significantly above the global average. However, online payment systems, globally in second place, are virtually not used in Japan. Almost three fourths of all distance selling customers have never used these systems. All other payment methods are of little relevance.
Cash on delivery
Prepayment
Direct debit
Credit card
* Source: DHL Global Mail 2013 ∙ n Global from 9,218 to 9,324 ∙ n Japan from 436 to 439
“CUSTOMER JOURNEY“– PAYMENT METHODS
Online payment systems
Installment purchase / financing
Debit card
Invoice
Payment options · in % *
Never Seldom Frequently / very frequentlyOccasionally
Japan
Globally
15.6 3.0 11.4 70.0
29.3 9.8 18.7 42.3
45.8 19.9 22.6 11.7
55.8 16.3 16.1 11.7
56.4 14.8 17.3 11.5
53.4 16.1 15.5 15.0
60.8 17.9 13.0 8.2
56.0 15.5 16.4 12.1
66.9 13.0 16.2 3.9
54.4 15.8 16.3 13.4
74.0 14.2 8.2 3.7
33.3 12.9 20.1 33.7
84.6 9.2 4.6 1.6
78.0 9.5 8.1 4.4
88.6 5.9 2.5 3.0
55.1 10.8 15.7 18.4
Country information Japan Country profile · Media Use · Distance selling · “Customer jour-ney“ · Drivers & barriers in distance selling · Cross-border shopping · Dialog marketing

Shop the World 186
The option of selecting the shipping company The vendor only works with reliable delivery companies
Detailed information regarding de-livery period & delivery date when ordering
Fast delivery
Free delivery
Tracking information
Delivery to a retail store
Delivery to a parcel locker or drop box
Other collection points (supermar-ket, kiosk, gas station)
Japan Globally
3.1
3.0
3.1
5.4
4.3
4.8
3.5
4.6
4.3
Max. accepted order time · Ø in days *
3.6
3.5
3.7
5.3
4.8
5.1
3.8
4.9
4.7
* Source: DHL Global Mail 2013 ∙ n Global from 10,270 to 10,462 ∙ n Japan from 455 to 469 ** scale from 1 "absolutely not important" to 6 "very important“
Free delivery is important
For Japanese consumers it is most important to have free delivery of orders. An average transit time of 6.3 days is beingaccepted (global average).
“CUSTOMER JOURNEY“ – DELIVERY
1 2 3 4 5 6
Requirements for delivery · Ø *,**
Country information Japan Country profile · Media Use · Distance selling · “Customer jour-ney“ · Drivers & barriers in distance selling · Cross-border shopping · Dialog marketing
6.3
6.5
Japan Globally

Shop the World 187
86+14
72+28
Number of returns per capita per year · Ø * Japan Globally
0.8
0.3
Return rate · in % * Japan Globally
5.9
Reasons for returns · Japan in % *
Defective product 36.6
Percentage of users who returned goods · in % *
13.7
86.3
Japan Globally
Yes No
“CUSTOMER JOURNEY“ – RETURNSReturns do not exist!
To return a product seems to be a sign of discourtesy in the opinion of Japanese distance selling customers. Barely every seventh consumer returned products in the past. The rate of returns is with 2% respec- tively low and significantly be-low the global average. A return is mainly caused by a faulty product. It almost never hap-pens in Japan that a product is returned because the consumer is generally unsatisfied with it. So far, it has been unthinkable in Japan to purposefully order several variants for selection.
27.5
72.5
* Source: DHL Global Mail 2013 ∙ n Global from 2,648 to 9,325 ∙ n Japan from 60 to 441
Differing product description
Delivery of the wrong product
Wrong product was ordered
Product did not fit
Ordered multiple variants to choose from
Delivery period too long
Found less expensive product
Deficient product quality
Product was not liked
15.2
11.8
33.4
5.0
0.0
1.7
1.7
Globally
32.3
30.0
17.8
13.3
8.5
37.7
29.9
15.5
5.8
3.9
24.8
8.4
Country information Japan Country profile · Media Use · Distance selling · “Customer jour-ney“ · Drivers & barriers in distance selling · Cross-border shopping · Dialog marketing
2.0
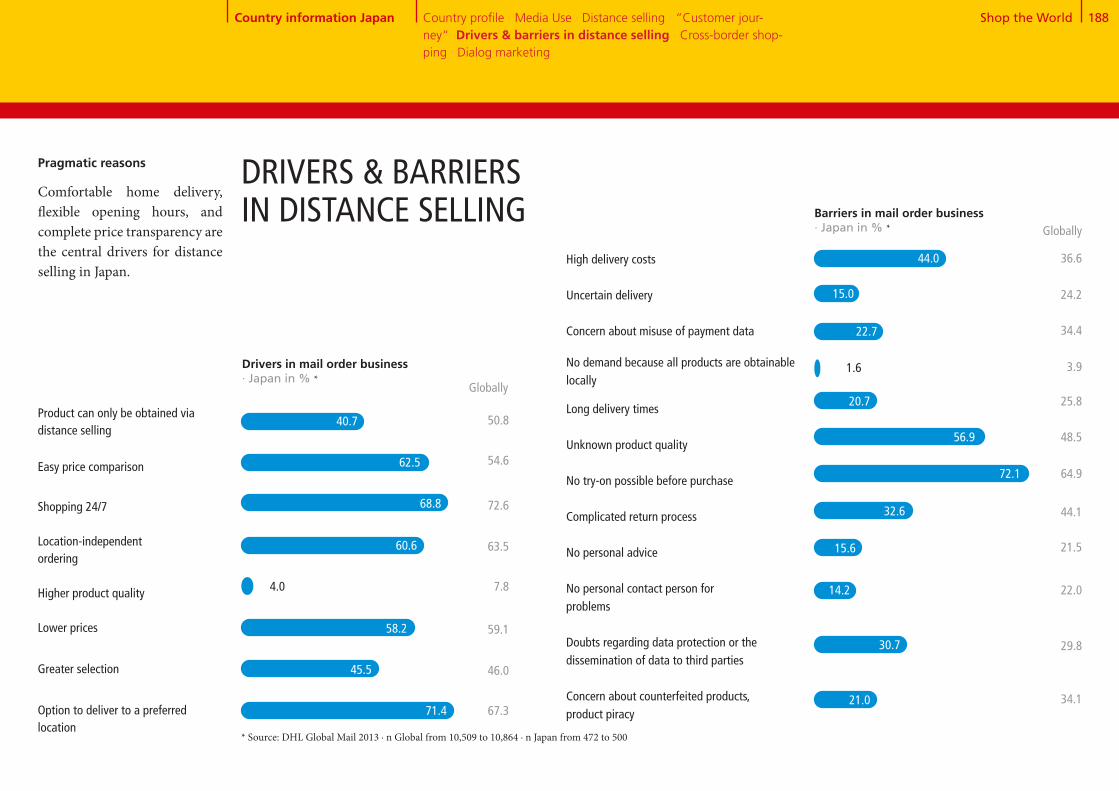
Shop the World 188
High delivery costs
Uncertain delivery
Concern about misuse of payment data
No demand because all products are obtainable locally
Long delivery times
Unknown product quality
No try-on possible before purchase
Complicated return process
No personal advice
No personal contact person for problems
Doubts regarding data protection or thedissemination of data to third parties
Concern about counterfeited products, product piracy
Product can only be obtained via distance selling
Easy price comparison
Shopping 24/7
Location-independent ordering
Higher product quality
Lower prices
Greater selection
Option to deliver to a preferred location
DRIVERS & BARRIERS IN DISTANCE SELLING Barriers in mail order business
· Japan in % *
50.8
54.6
72.6
63.5
7.8
59.1
46.0
67.3
58.2
45.5
71.4
Globally
36.6
24.2
34.4
3.9
25.8
48.5
64.9
44.1
21.5
22.0
29.8
34.1
Pragmatic reasons
Comfortable home delivery, flexible opening hours, and complete price transparency are the central drivers for distance selling in Japan.
Drivers in mail order business · Japan in % *
Globally
* Source: DHL Global Mail 2013 ∙ n Global from 10,509 to 10,864 ∙ n Japan from 472 to 500
40.7
62.5
68.8
60.6
4.0
44.0
15.0
22.7
1.6
20.7
56.9
72.1
32.6
15.6
14.2
30.7
21.0
Country information Japan Country profile · Media Use · Distance selling · “Customer jour-ney“· Drivers & barriers in distance selling · Cross-border shop-ping · Dialog marketing
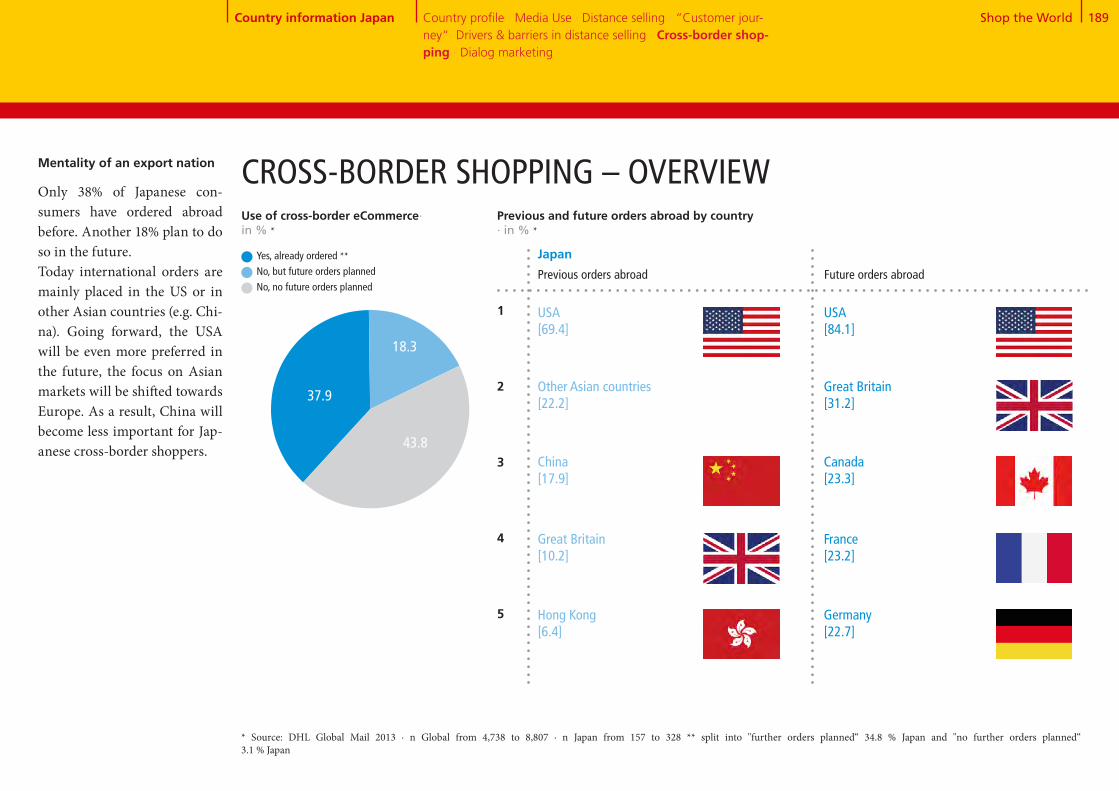
Shop the World 189
38+18+44CROSS-BORDER SHOPPING – OVERVIEW
Previous orders abroad
Previous and future orders abroad by country · in % *
Great Britain[10.2]
Hong Kong[6.4]
1
2
3
4
5
USA[69.4]
Other Asian countries[22.2]
China[17.9]
Future orders abroad
Japan
* Source: DHL Global Mail 2013 ∙ n Global from 4,738 to 8,807 ∙ n Japan from 157 to 328 ** split into "further orders planned“ 34.8 % Japan and "no further orders planned“ 3.1 % Japan
Mentality of an export nation
Only 38% of Japanese con- sumers have ordered abroad before. Another 18% plan to do so in the future. Today international orders are mainly placed in the US or in other Asian countries (e.g. Chi-na). Going forward, the USA will be even more preferred in the future, the focus on Asian markets will be shifted towards Europe. As a result, China will become less important for Jap- anese cross-border shoppers.
France[23.2]
Germany[22.7]
USA[84.1]
Great Britain[31.2]
Canada[23.3]
Country information Japan Country profile · Media Use · Distance selling · “Customer jour-ney“· Drivers & barriers in distance selling · Cross-border shop-ping · Dialog marketing
Use of cross-border eCommerce·in % *
Yes, already ordered **No, but future orders planned No, no future orders planned
18.3
37.9
43.8
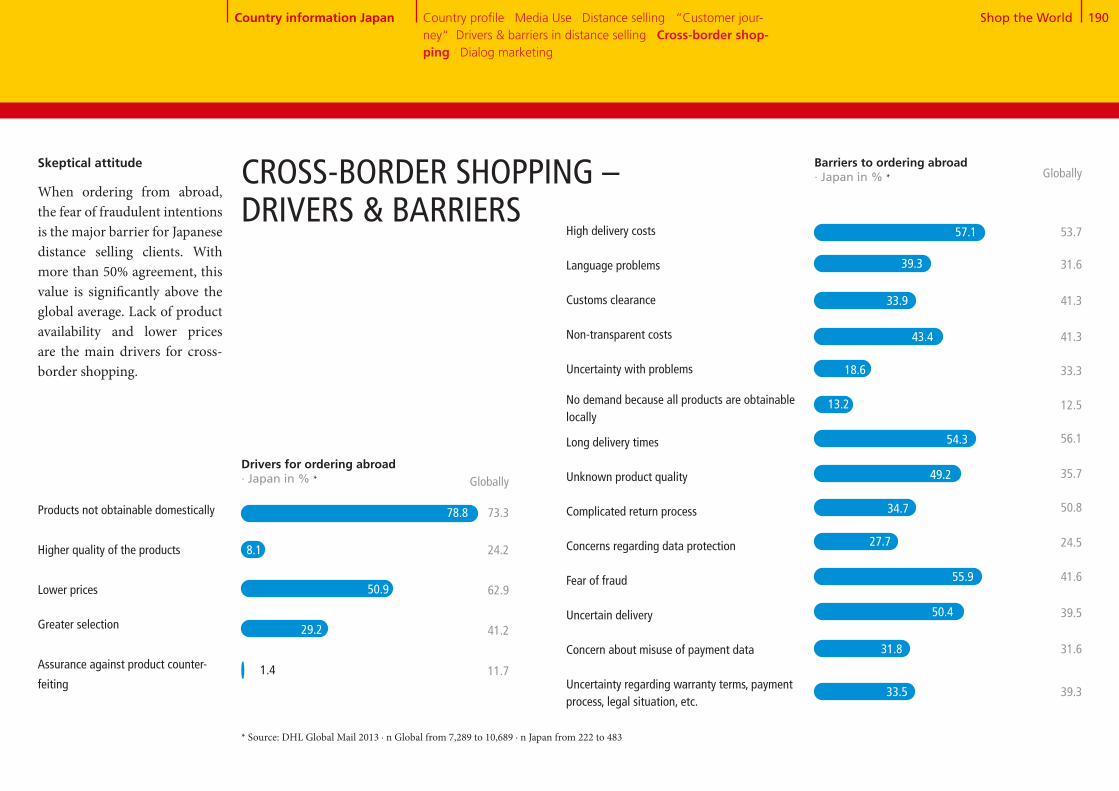
Shop the World 190
Products not obtainable domestically
Higher quality of the products
Lower prices
Greater selection
Assurance against product counter-
feiting
High delivery costs Language problems
Customs clearance
Non-transparent costs
Uncertainty with problems
No demand because all products are obtainable locally
Long delivery times
Unknown product quality
Complicated return process
Concerns regarding data protection Fear of fraud Uncertain delivery
Concern about misuse of payment data
Uncertainty regarding warranty terms, payment process, legal situation, etc.
Drivers for ordering abroad· Japan in % *
Barriers to ordering abroad · Japan in % *
Globally
73.3
24.2
62.9
41.2
11.7
Globally
53.7
31.6
41.3
41.3
33.3
12.5
56.1
35.7
50.8
24.5
41.6
39.5
31.6
39.3
Skeptical attitude
When ordering from abroad, the fear of fraudulent intentionsis the major barrier for Japanesedistance selling clients. With more than 50% agreement, this value is significantly above the global average. Lack of product availability and lower prices are the main drivers for cross- border shopping.
CROSS-BORDER SHOPPING – DRIVERS & BARRIERS
* Source: DHL Global Mail 2013 ∙ n Global from 7,289 to 10,689 ∙ n Japan from 222 to 483
57.1
39.3
33.9
43.4
18.6
13.2
54.3
49.2
34.7
27.7
55.9
50.4
31.8
33.5
78.8
8.1
50.9
29.2
1.4
Country information Japan Country profile · Media Use · Distance selling · “Customer jour-ney“· Drivers & barriers in distance selling · Cross-border shop-ping · Dialog marketing

Shop the World 191
Receipt of mailings and catalogs · Japan in % *
5 and 63 and 41 and 2
DIALOG MARKETING
Reading mailings and catalogs · in % *,**
Japan
Globally
25.7 42.5 31.8
22.1 35.2 42.7
5 and 63 and 41 and 2
Response to mailings and catalogs · in % *,**
Japan
Globally
43.7 44.4 11.8
29.0 45.8 25.3
Response channel for mailings and catalogs · Japan in % * Globally
Website visits
Visits to stores or
branch offices
Other online
response (e.g. chat,
Twitter, Facebook,
newsletter
registration, etc.)
Phone call
Business reply card
51.0 73.4
48.6
30.0
24.5
18.4
12.6
* Source: DHL Global Mail 2013 ∙ n Global from 8,788 to 11,265 ∙ n Japan from 355 to 514 ** scale from 1 "never“ to 6 "almost always“
Polite reservation
In Japan, mailings or catalogs are less common: 16% nev-er receive advertisement in their letterbox. Mailings are frequently read by barely one third. Only every tenth re- cipient responds to dialog mar-keting. The most commonly used response is a visit to the website of the advertising com-pany. However, the frequency is much below the global aver-age. Visits to the store are even rarer. However, response cards are used above global average.
Globally
One or more times per week
One or more times per month
Less than once per month
Never
26.9
33.7
27.7
11.6 15.2
11.3
8.5
9.0
17.1
21.1
47.7
14.8
16.4
Country information Japan Country profile · Media Use · Distance selling · “Customer jour- ney“ · Drivers & barriers in distance selling · Cross-border shopping · Dialog marketing
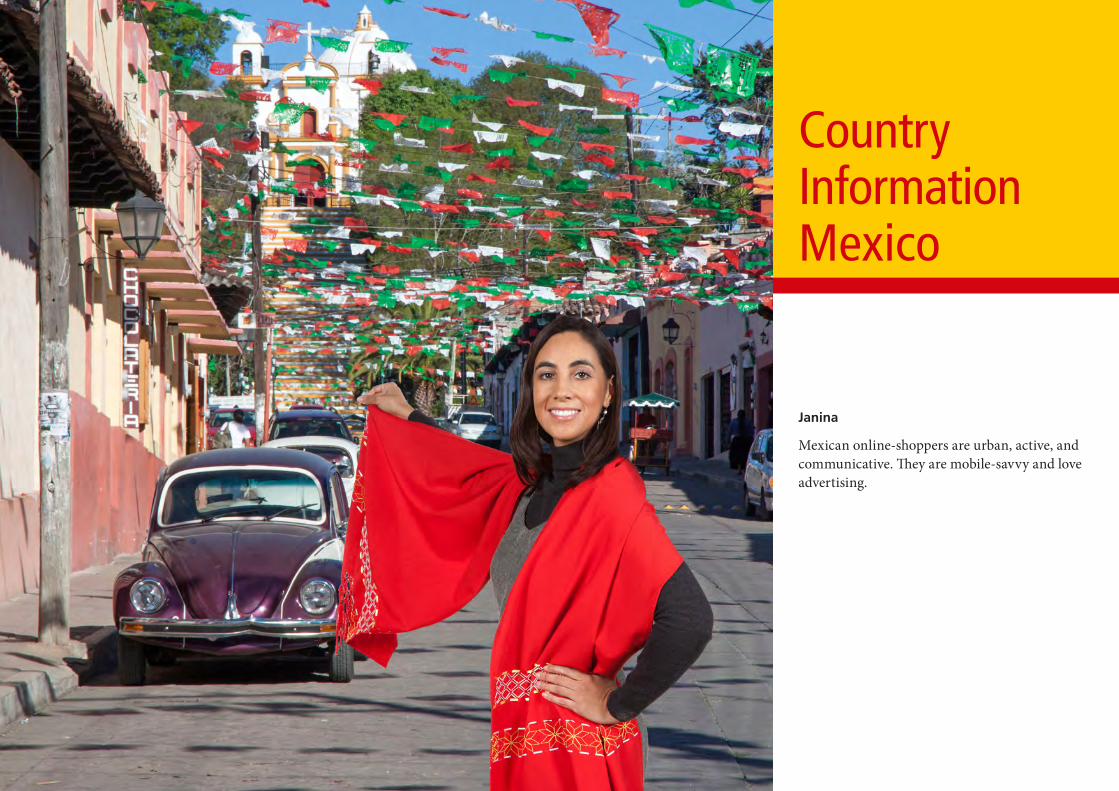
Country Information Mexico
Janina
Mexican online-shoppers are urban, active, and communicative. They are mobile-savvy and love advertising.

Shop the World 193
35.0
Population 0 - 15 years
Mexican economy * COUNTRY PROFILE MEXICO
Guadalajara 4,442
* Source: Fischer World Almanac 2014, Germany Trade & Invest ** Source: Metropolitan areas with 1 million inhabitants and more; United Nations, Department of Economic and Social Affairs, Po-pulation Division (2012). World Urbanization Prospects: The 2011 Revision, CD-ROM Edition. *** Source: Copyright © IHS, 2013. All rights reserved **** Source: Copyright © IHS, 2013. All rights reserved
Number of households Ø Household sizeUnemployment rateInflation rate
3.9
Economic growth · in % ****
>
>
1.3
4.0
2011 2012 2013
Age distribution · 2013 in mn.
Population 65 years and older
Population, total · 2013 in mn. 116.1 ***
Country information Mexico
Population 16 - 64 years
· 2013 in mn.· 2013· 2013 in %· 2013 in %
23.8 4.94.93.8
After strong economic growth in 2011 and 2012, the economictrend in Mexico has significant-ly decreased in 2013. Growth was particularly slowed down by the low government spend-ing after the change of govern- ment at the end of 2012 and by weak exports caused by the limited demand for indus- trial goods in the US. There were also lower transfers of Mexicans living abroad. From 2014 on, investments and consumption are supposed to grow again. The new govern-ment has initiated comprehen-sive reforms for deregulations and privatization of the domes- tic market, which is expected to attract foreign investments.
73.5
7.6
Monterrey 4,100
Tijuana1,757
Toluca de Lerdo 1,702
Querétaro 1,101
Torreón 1,218
Ciudad Juárez1,332
Puebla 2,296
The ten largest conurbations in Mexico · 2011 in thousand. **
León de los Aldamas 1,613Ciudad de México
(Mexico City)20,142
Country profile · Media Use · Distance selling · "Customer jour-ney“ · Drivers & barriers in distance selling · Cross-border shopping · Dialog marketing

Shop the World 194
64+10+1+3+12+7+3MEDIA USE IN MEXICO
10.9
86.8
Smartphone market penetration · in % *****Representative domestic population 16+, n = 1,000
19.6
Internet users · 2012 per 100 people **
Permanent access to broadband internet · 2012 per 100 people ***
Cellphones · 2012 per 100 people ****
2012 2013
36.8
Share of adspend by medium · in % *
TV Radio Movies Outdoor advertising
Total advertising expenditure · in EUR bn. *
Internet Newspapers Magazines
>>
* Source: Zenith Optimedia, 2013 ** Source: Copyright © IHS, 2013. All rights reserved *** Source: The World Bank **** Source: Copyright © IHS, 2013. All rights reserved **** Source: Our Mobile Planet: Google Global Smartphone Study 2013, http://www.thinkwithgoogle.com/mobileplanet/
2011 2012 2013 2014 2015
5.3
38.4
4.8
4.3
4.1
3.8
2016
Country information Mexico
12.2
6.53.0
3.21.4
9.764.0
5.9
Internet use
The Mexican government aims to increase internet usage. Only 38% of the population are currently online and broad- band is expanding at a slow pace. A telecommunication re-form passed in 2013 to stimu-late competition and prevent companies from holding a dom- inant position in the market.
TV and online video
As a growing advertising mar-ket, Mexico will be strongly dominated by TV until 2016. However, online spends are de-veloping fast: with 38%, online advertisement showed the high-est growth of the entire region in 2013. Especially online video shows potential: 81.3% of all internet users watch an average of 107.2 videos per month.
Country profile · Media Use · Distance selling · “Customer jour-ney“ · Drivers & barriers in distance selling · Cross-border shopping · Dialog marketing

Shop the World 195
Distance selling purchases in 2013 - trend for 2018 · in EUR mn. * 2013 2018
Apparel and footwear
Consumer electronics,
computers + equipment
Media products (books, CDs,
DVDs, etc.)
Housewares and home
furnishings + textiles
Food + beverages
Household and consumer
appliances
Beauty and personal care
DIY and gardening
OTC drugs and dietary supple-
ments
Traditional toys and games
House cleaning (detergent,
chastener, etc.)
Country profile · Media Use · Distance selling · "Customer jour-ney“ · Drivers & barriers in distance selling · Cross-border shopping · Dialog marketing
High growth rates
With an average growth of 16.5% per year, Mexico belongsto the fastest growing dis- tance selling markets (globally +11%). Particularly sales in consumer electronics, media products, food, and homewares are expected to grow signifi-cantly over the next years.
DISTANCE SELLING IN MEXICO
416.4
1,392.1
761.9
1,592.7
760.5
75.8
41.1
333.0
250.0
710.6
107.3
23.8
15.3
35.5
66.5
47.5
34.1
Development of distance selling and share of total retail 2011 - 2018 · in EUR bn. *
CAGR: 16.5%
Home shopping
Online shopping1.8 2.6 3.9
0.3
0.3
0.3
4.8 8.6
0.3
0.3
2011 2012 2013e 2014e 2018e
Share of total retail · in % 1.4 1.9 2.5 3.0 4.5
* Source: Euromonitor International
207.5
19.2
Country information Mexico
91.9
71.5
48.7

Shop the World 196
73+2784
+16
High potential in Mexico
More than two thirds of the Mexicans are already active in distance selling. And there is still room for growth: 50% of the surveyed users plan to shop more in the future.
Use of distance selling · in % *
72.8
27.2
Mexico
Globally
83.5
16.5
Number of orders in the previous year · in % *
1 to 5 orders
6 to 10 orders
11 to 20 orders
More than 20 orders
No orders
17.9
48.2
4.1
27.2
2.5
20.5
35.9
15.2
16.5
12.0
Future ordering behavior (current users) · in % *
More frequently than in the last
12 months
Just as frequently as in the last
12 months
Less frequently than in the last
12 months
42.1
50.0
55.2
38.8
7.9 6.1
Non-users of distance selling - future plans · in % *
Yes77.7
Mexico
Globally
Yes70.5
No22.3
No29.5
Yes No
Mexico Globally Mexico Globally
DISTANCE SELLING IN MEXICO
* Source: DHL Global Mail 2013 ∙ n Global from 1.275 to 11.265 ∙ n Mexico from 99 to 512
Country information Mexico Country profile · Media Use · Distance selling · "Customer jour-ney“ · Drivers & barriers in distance selling · Cross-border shopping · Dialog marketing

Shop the World 197
Globally*
49.6
Gender · in % Male Female
Age · in % <30 yrs. 30-49 yrs. 50 yrs. +
Occupation · in % Employed Unemployed
Education · in % Lower educational level Medium and higher level of education
0.8
Media affinity: Online · in % yes**
Community size · in % Rural (<50,000 inhabitants) Non-rural/urban (>50,000 inhabitants)
Minors in the household · Ø
Household type · in % Single 2-person household without children Household with children Household with 3 adults
Mobile Internet usage · in % Yes No
Gross household income · in % Low income Medium income High income
Media affinity: Classic · in % yes**
Media affinity: Dialog marketing · in % yes** 67.5
60.4
94.5
39.627.5
32.9
28.072.0
14.375.4
51.748.3
13.8
99.2
85.1
1.2
7.92.4
86.2
Heavy users: The wind of change
Mexican‘s ‚heavy users‘, (par- ticularly active distance selling customers) have a clear profile:41.6% are younger than 30. They mostly come from the urban environment and live in large families. The affinity for communication media is par- ticularly strong: To a large ex-tend they are mobile-savvy and love all kinds of advertising.
DISTANCE SELLING IN MEXICO
* Source: DHL Global Mail 2013 ∙ n Global from 2.661 to 11.265 ∙ n Mexico from 113 to 512 ** media affinity for online / classic / dialog marketing, if at least one medium from the respective area was rated 5 or 6 on a scale of 1 "absolutely not useful" to 6 "very useful" *** the top third of most active mail order users
44.327.1
14.4
36.4
46.9
36.5
80.8
33.734.232.1
45.754.3
22.443.0
50.0
28.6
50.0
29.4
85.6
63.6
0.7
23.411.2
70.6
Country information Mexico
***
Mexico*
44.117.0
3.2
17.5
67.8
61.1
89.2
27.628.843.6
44.056.0
20.067.1
52.3
38.9
47.7
23.7
96.8
82.5
1.2
9.83.2
76.3
8.8
14.9
Heavy users* Global heavy users*
41.6
Country profile · Media Use · Distance selling · "Customer jour-ney“ · Drivers & barriers in distance selling · Cross-border shopping · Dialog marketing

Shop the World 198Country profile · Media Use · Distance selling · “Customer jour-ney“ · Drivers & barriers in distance selling · Cross-border shopping · Dialog marketing
Search engines
Customer ratings in blogs or forums
Product test ratings / expert test reports
Product check in a retail store
Retailer or manufacturer website
Online marketplace
Catalog
Mail advertising
Social media platforms such as Facebook and Twitter
Apps (on smartphone, iPad, or tablet)
Recommendations from friends, acquaintances, and colleagues
Customer ratings on the supplier’s website
Price comparison sites
Large selection of products
Recommendation and experiences of friends, acquaintances, and colleagues
Official test seals, reviews, and test reports of independent institutions
Attractive product line
Favorable prices, promotions, & special offers
Straightforward return process
Free returns
Choice of preferred payment methods
Fast delivery
Free delivery
Good customer service
Positive customer ratings on the internet
“CUSTOMER JOURNEY“ – SEARCHING FOR PRODUCT INFORMATION
Search for product information · Mexico in % * Globally
32.8 35.5
53.2
18.3 23.4
26.9 44.2
25.2 23.9
50.4 45.8
36.5 42.5
32.3 25.1
33.6 15.1
29.3 15.1
12.0 9.7
44.6 37.8
Criteria for choosing a vendor · Mexico in % *
Globally
44.5
35.2 40.6
Choice of preferred payment methods
20.6 13.7
20.7
9.5 8.8
20.3 26.6
12.6 14.9
47.6 51.7
13.3 12.9
16.1 20.8
34.7 22.6
29.0 25.7
39.8 45.2
23.6 18.5
19.8
Retailer websites are importantWebsites of merchants or manu- facturers are the most important sources for product informa- tion searches in Mexico. Along with that, affordable prices and free-of-charge delivery are key criteria for selecting a distance selling provider.
* Source: DHL Global Mail 2013 ∙ n Global from 9.386 to 10.617 ∙ n Mexico from 372 to 465, multiple mentioning
Country information Mexico

Shop the World 199
Usefulness of advertizing media · in % *, **
5 and 63 and 41 and 2
Ø
37.210.2 52.526.1 43.8 30.1
Online advertising
* Source: DHL Global Mail 2013 ∙ n Global from 10,218 to 10,384 ∙ n Mexico from 455 to 462 ** scale from 1 "absolutely not useful“ to 6 very useful“
Divine target group
In Mexico, advertising is great fun: It addresses interest- ed consumers who see online advertising and social networks as very useful compared to the global average. Also all classic media channels are well per- ceived in Mexico.
Mexico Globally
Country information Mexico
Television advertising
5 and 63 and 41 and 2
4.43.6
Ø
34.39.3 56.430.6 41.8 27.6
4.53.4
41.018.8 40.138.7 40.4 20.9Social media
Mexico Globally
Advertising letters
3.93.1
33.012.2 54.933.9 37.6 28.5
4.43.4
Product suggestions in online shops
34.67.3 58.118.9 45.1 36.0
4.53.9
24.66.4 69.06.5 28.7 64.8
4.94.8
25.66.7 67.79.1 31.7 59.1
4.84.6
42.015.6 42.329.9 43.9 26.2
Mexico Globally
Household advertising
4.13.4
41.911.8 46.329.0 46.7 24.3
Mexico Globally
Advertisements in mag- azines and periodicals
4.23.4
40.520.2 39.334.8 43.1 22.1
Mexico Globally
Advertisements in newspapers
3.93.2
43.821.1 35.141.8 40.7 17.6
Mexico Globally
Billboard advertise-ments
3.83.0
41.524.2 34.344.3 38.8 16.9
Mexico Globally
Radio
3.72.9
34.011.5 54.519.3 44.2 36.6
Mexico Globally
Catalogs from vendors
4.43.9
MexicoGlobally
MexicoGlobally
Mexico Globally
Internet search engines
Mexico Globally
Price comparison sites
Mexico Globally
ACCEPTANCE OF ADVERTISING MEDIA
Country profile · Media Use · Distance selling · "Customer jour-ney“ · Drivers & barriers in distance selling · Cross-border shopping · Dialog marketing

Shop the World 200
Online PC
Online mobile (tablet, smartphone)
By telephone
In writing (by post, fax)
By email
Order in store & delivery to home
Country profile · Media Use · Distance selling · "Customer jour-ney“ · Drivers & barriers in distance selling · Cross-border shopping · Dialog marketing
Online marketplace
Merchant who advertises on TV
Online shop of a manufaturer or
retailer
Use of different suppliers · in % *
Mail order company from which I received a catalog
Never Seldom Frequently / very frequently
Occasionally
* Source: DHL Global Mail 2013 ∙ n Global from 9.270 to 9.446 ∙ n Mexico from 369 to 373
Mexico Global
54.9
7.6
5.0
8.7
75.0
3.2
2.1
4.4
“CUSTOMER JOURNEY“ – PLACING ORDERS
There are many ways to reach the goal
Mexicans like to order digitally:More than half of all users order online on their PC; an-other 11% use mobile devices, and 9% send emails to place their orders. Ordering in a store with home delivery also enjoys above-average popularity. Mex-icans use tradtitional catalogs more frequently than the global average. The same is true for teleshopping. More than half of all respondents claimed to be active teleshoppers. In com- parison, fewer Mexicans than the global average use online shops and online marketplaces.
25.4 24.814.0
15.4 31.216.8
35.8
36.6
Mexico
Globally
15.6 38.413.5
9.9 54.38.7
32.5
27.0
34.7 16.418.9
38.5 12.622.8
30.1
26.1
46.7 7.620.1
60.2 6.617.6
25.7
15.7
11.4
10.5
12.4
4.8
Order channels · in % *
Country information Mexico
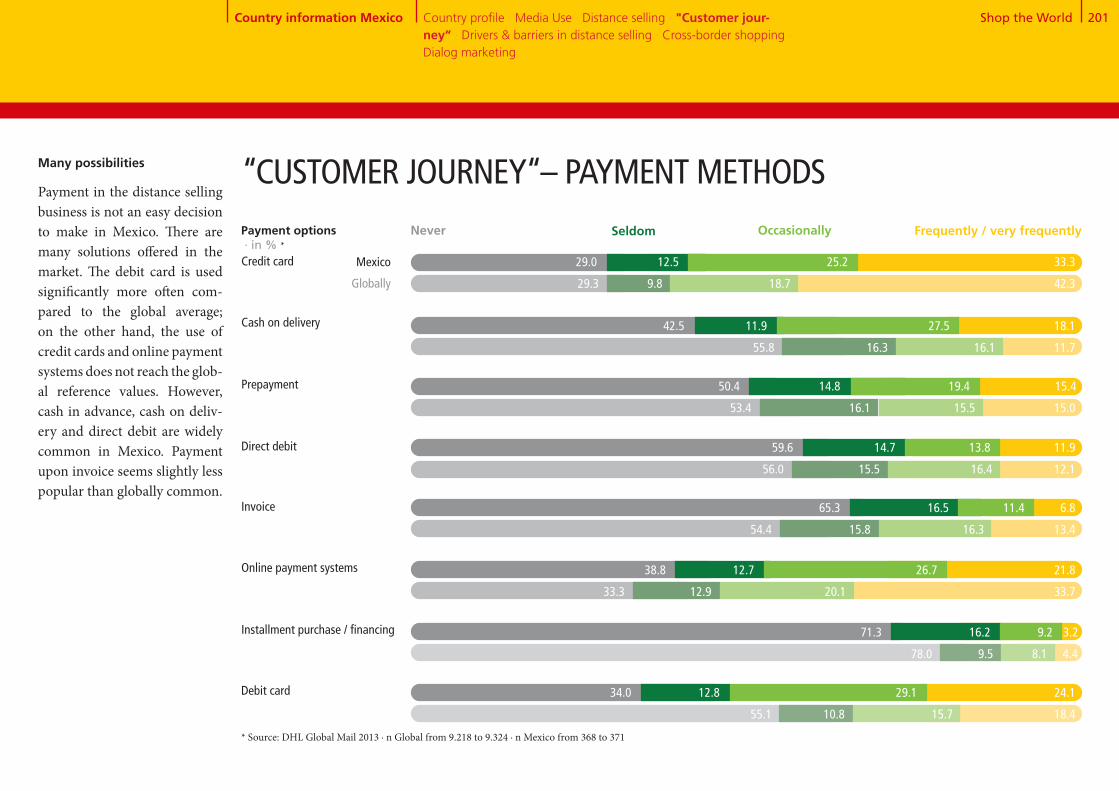
Shop the World 201
Many possibilities
Payment in the distance selling business is not an easy decision to make in Mexico. There are many solutions offered in the market. The debit card is used significantly more often com-pared to the global average; on the other hand, the use of credit cards and online payment systems does not reach the glob- al reference values. However, cash in advance, cash on deliv- ery and direct debit are widely common in Mexico. Payment upon invoice seems slightly less popular than globally common.
Cash on delivery
Prepayment
Direct debit
Credit card
* Source: DHL Global Mail 2013 ∙ n Global from 9.218 to 9.324 ∙ n Mexico from 368 to 371
“CUSTOMER JOURNEY“– PAYMENT METHODS
Online payment systems
Installment purchase / financing
Debit card
Invoice
Payment options · in % *
Never Seldom Frequently / very frequentlyOccasionally
Mexico
Globally
29.0 12.5 25.2 33.3
29.3 9.8 18.7 42.3
42.5 11.9 27.5 18.1
55.8 16.3 16.1 11.7
50.4 14.8 19.4 15.4
53.4 16.1 15.5 15.0
59.6 14.7 13.8 11.9
56.0 15.5 16.4 12.1
65.3 16.5 11.4 6.8
54.4 15.8 16.3 13.4
38.8 12.7 26.7 21.8
33.3 12.9 20.1 33.7
71.3 16.2 9.2 3.2
78.0 9.5 8.1 4.4
34.0 12.8 29.1 24.1
55.1 10.8 15.7 18.4
Country information Mexico Country profile · Media Use · Distance selling · "Customer jour-ney“ · Drivers & barriers in distance selling · Cross-border shopping · Dialog marketing
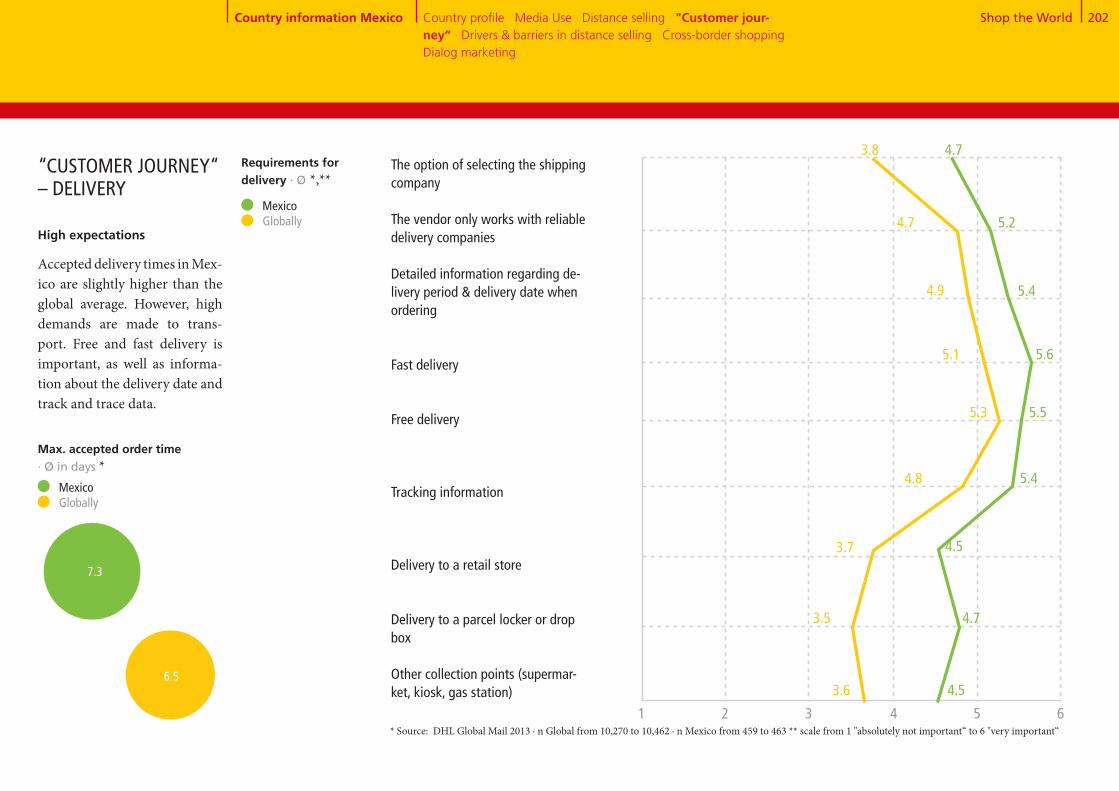
Shop the World 202
The option of selecting the shipping company The vendor only works with reliable delivery companies
Detailed information regarding de-livery period & delivery date when ordering
Fast delivery
Free delivery
Tracking information
Delivery to a retail store
Delivery to a parcel locker or drop box
Other collection points (supermar-ket, kiosk, gas station)
Country profile · Media Use · Distance selling · "Customer jour-ney“ · Drivers & barriers in distance selling · Cross-border shopping · Dialog marketing
Mexico Globally
4.5
4.7
4.5
5.5
5.4
5.6
4.7
5.4
5.2
Max. accepted order time · Ø in days *
3.6
3.5
3.7
5.3
4.8
5.1
3.8
4.9
4.7
* Source: DHL Global Mail 2013 ∙ n Global from 10,270 to 10,462 ∙ n Mexico from 459 to 463 ** scale from 1 "absolutely not important“ to 6 "very important“
High expectations
Accepted delivery times in Mex- ico are slightly higher than the global average. However, high demands are made to trans-port. Free and fast delivery is important, as well as informa- tion about the delivery date and track and trace data.
“CUSTOMER JOURNEY“ – DELIVERY
1 2 3 4 5 6
Requirements for delivery · Ø *,**
Country information Mexico
7.3
6.5
Mexico Globally

Shop the World 203
15+85
72+28
Number of returns per capita per year · Ø * Mexico Globally
0.8
0.3
Return rate · in % * Mexico Globally
5.9
Reasons for returns · Mexico in % *
Defective product 44.1
Percentage of users who returned goods · in % *
14.5
85.5
Mexico Globally
Yes No
“CUSTOMER JOURNEY“ – RETURNSLow return rates
Only 14.5% of the distance sell-ing clients in Mexico return ordered goods. This value is sig-nificantly lower than the global average of 27.5%. The per capita of return deliveries is also very low; only 3% of the orders are returned. If, however, a return delivery is made, the reasons often relate to quality: a defec-tive product was delivered or the product quality is disap-pointing. Also, faulty product descriptions and incorrectly delivered products are very fre-quent reasons for returns. Very rarely, a product is returned because it does not fit or people don't like it.
27.5
72.5
* Source: DHL Global Mail 2013 ∙ n Global from 2.648 to 9.325 ∙ n Mexico from 54 to 372
Differing product description
Delivery of the wrong product
Wrong product was ordered
Product did not fit
Ordered multiple variants to choose from
Delivery period too long
Found less expensive product
Deficient product quality
Product was not liked
25.7
29.5
9.2
7.4
0.0
27.9
7.6
Globally
32.3
30.0
17.8
13.3
8.5
37.7
29.9
15.5
5.8
3.9
35.2
11.2
Country information Mexico
3.0
Country profile · Media Use · Distance selling · "Customer jour-ney“ · Drivers & barriers in distance selling · Cross-border shopping · Dialog marketing
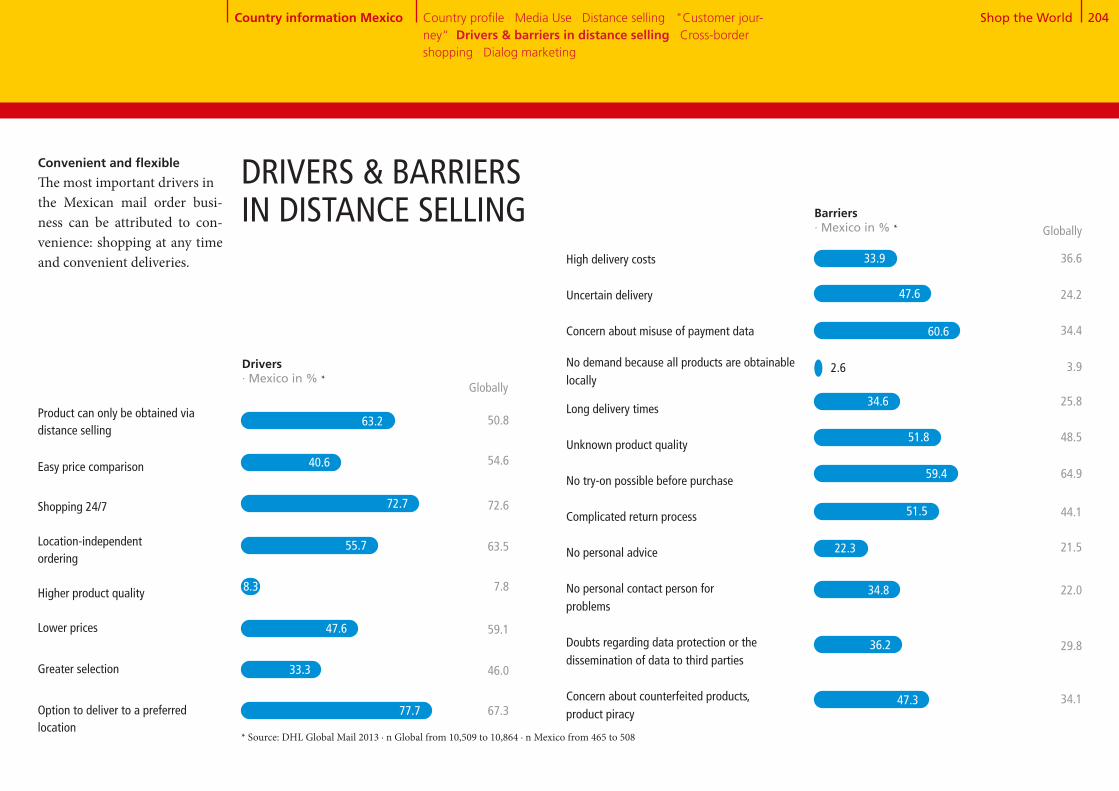
Shop the World 204
High delivery costs
Uncertain delivery
Concern about misuse of payment data
No demand because all products are obtainable locally
Long delivery times
Unknown product quality
No try-on possible before purchase
Complicated return process
No personal advice
No personal contact person for problems
Doubts regarding data protection or thedissemination of data to third parties
Concern about counterfeited products, product piracy
Product can only be obtained via distance selling
Easy price comparison
Shopping 24/7
Location-independent ordering
Higher product quality
Lower prices
Greater selection
Option to deliver to a preferred location
Country profile · Media Use · Distance selling · "Customer jour-ney“· Drivers & barriers in distance selling · Cross-border shopping · Dialog marketing
DRIVERS & BARRIERS IN DISTANCE SELLING Barriers
· Mexico in % *
50.8
54.6
72.6
63.5
7.8
59.1
46.0
67.3
47.6
33.3
77.7
Globally
36.6
24.2
34.4
3.9
25.8
48.5
64.9
44.1
21.5
22.0
29.8
34.1
Convenient and flexible
The most important drivers inthe Mexican mail order busi-ness can be attributed to con-venience: shopping at any time and convenient deliveries.
Drivers · Mexico in % *
Globally
* Source: DHL Global Mail 2013 ∙ n Global from 10,509 to 10,864 ∙ n Mexico from 465 to 508
63.2
40.6
72.7
55.7
8.3
33.9
47.6
60.6
2.6
34.6
51.8
59.4
51.5
22.3
34.8
36.2
47.3
Country information Mexico

Shop the World 205
37+47+16
Previous orders abroad
Previous and future orders abroad by country · in % *
Canada[8.7]
European countries[8.6]
1
2
3
4
5
USA[87.1]
China[14.5]
Hong Kong[8.7]
Future orders abroad
Mexico
* Source: DHL Global Mail 2013 ∙ n Global from 4,738 to 8,807 ∙ n Mexico from 172 to 434 ** split into "further orders planned“ 35.9% Mexico and "no further orders planned“ 1.4% Mexico
Shopping in the US
Cross-border shopping plays no significant role in Mexico as yet:Only one third of Mexican consumers surveyed has order- ed from abroad. An increase in cross-border eCommerce is ex-pected in the future, however. About half of consumers plan to purchase from abroad.
The US is and will remain by far the most popular shopping des-tination for Mexicans.
Japan[22.1]
France[16.5]
USA[92.0]
Canada[30.0]
China[22.6]
Country information Mexico
Use of cross-border eCommerce · in % *
Yes, already ordered **No, but future orders planned No, no future orders planned
46.6
37.3
16.2
Country profile · Media Use · Distance selling · "Customer jour-ney“ · Drivers & barriers in distance selling · Cross-border shop-ping · Dialog marketing
CROSS-BORDER SHOPPING – OVERVIEW
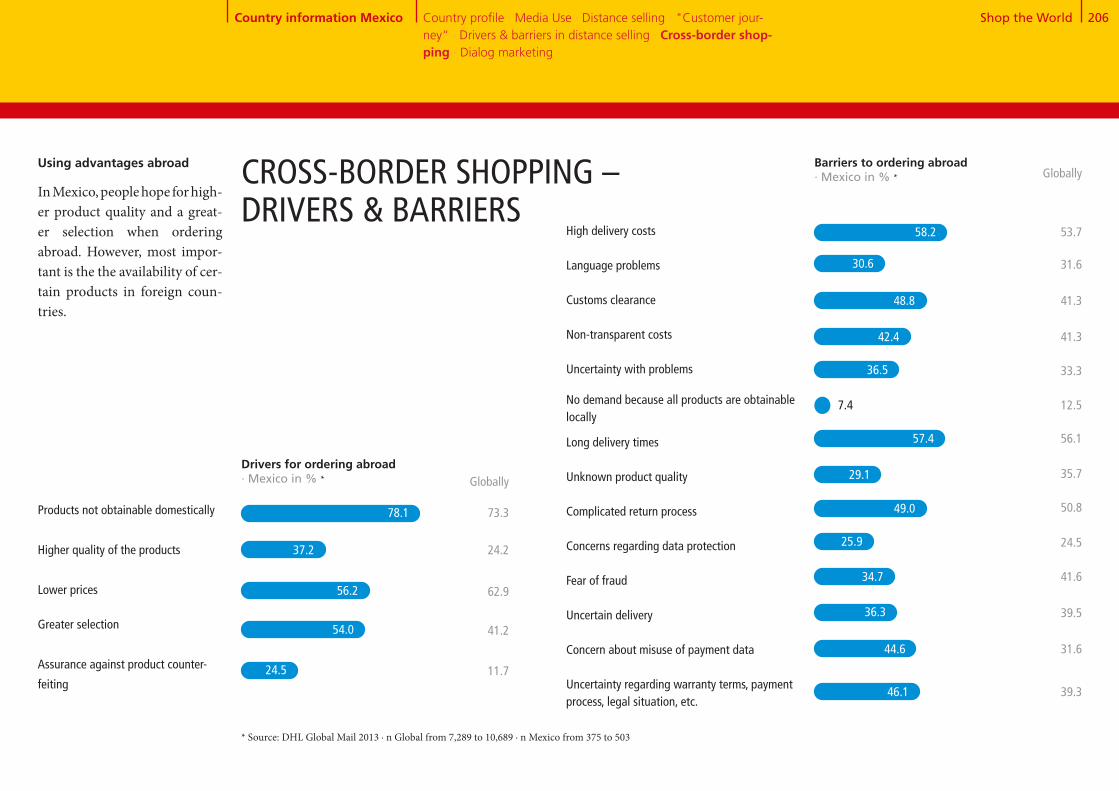
Shop the World 206
Products not obtainable domestically
Higher quality of the products
Lower prices
Greater selection
Assurance against product counter-
feiting
High delivery costs Language problems
Customs clearance
Non-transparent costs
Uncertainty with problems
No demand because all products are obtainable locally
Long delivery times
Unknown product quality
Complicated return process
Concerns regarding data protection Fear of fraud Uncertain delivery
Concern about misuse of payment data
Uncertainty regarding warranty terms, payment process, legal situation, etc.
CROSS-BORDER SHOPPING – DRIVERS & BARRIERS
Country profile · Media Use · Distance selling · "Customer jour-ney“ · Drivers & barriers in distance selling · Cross-border shop-ping · Dialog marketing
Drivers for ordering abroad· Mexico in % *
Barriers to ordering abroad · Mexico in % *
Globally
73.3
24.2
62.9
41.2
11.7
Globally
53.7
31.6
41.3
41.3
33.3
12.5
56.1
35.7
50.8
24.5
41.6
39.5
31.6
39.3
Using advantages abroad
In Mexico, people hope for high- er product quality and a great- er selection when ordering abroad. However, most impor- tant is the the availability of cer-tain products in foreign coun-tries.
* Source: DHL Global Mail 2013 ∙ n Global from 7,289 to 10,689 ∙ n Mexico from 375 to 503
58.2
30.6
48.8
42.4
36.5
7.4
57.4
29.1
49.0
25.9
34.7
36.3
44.6
46.1
78.1
37.2
56.2
54.0
24.5
Country information Mexico
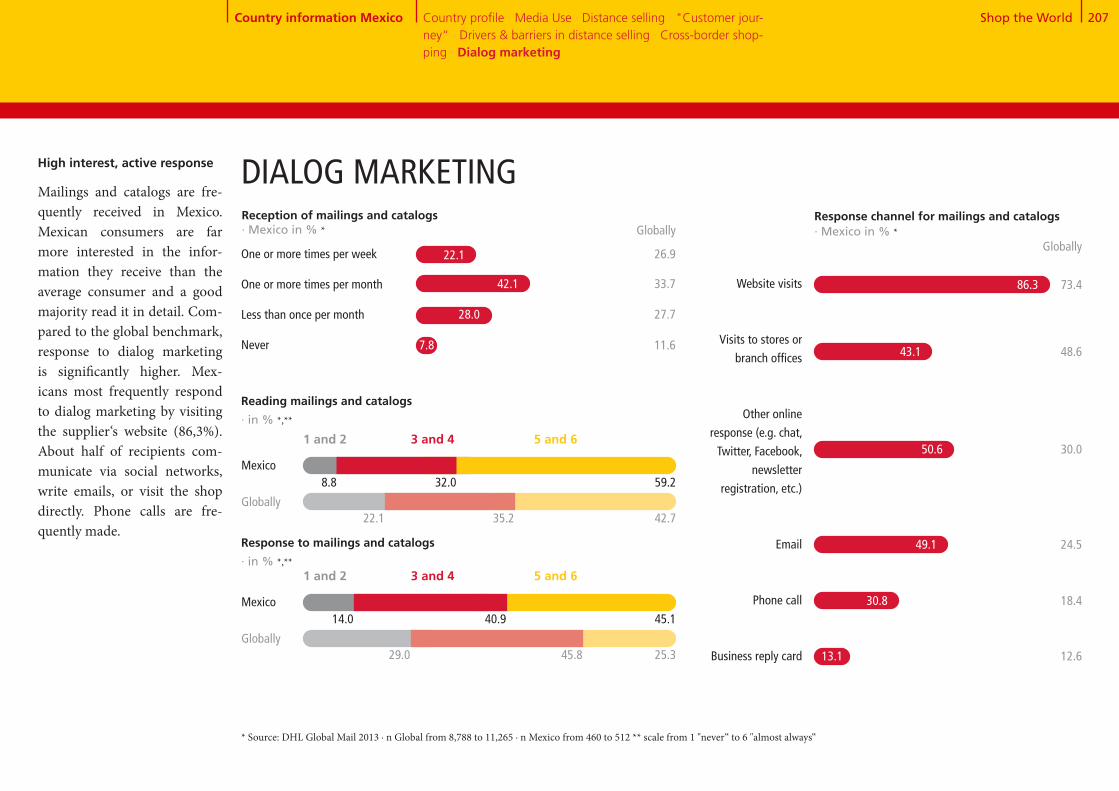
Shop the World 207
Reception of mailings and catalogs · Mexico in % *
5 and 63 and 41 and 2
DIALOG MARKETING
Reading mailings and catalogs
· in % *,**
Mexico
Globally
8.8 32.0 59.2
22.1 35.2 42.7
5 and 63 and 41 and 2
Response to mailings and catalogs · in % *,**
Mexico
Globally
14.0 40.9 45.1
29.0 45.8 25.3
Response channel for mailings and catalogs · Mexico in % * Globally
Website visits
Visits to stores or
branch offices
Other online
response (e.g. chat,
Twitter, Facebook,
newsletter
registration, etc.)
Phone call
Business reply card
86.3 73.4
48.6
30.0
24.5
18.4
12.6
* Source: DHL Global Mail 2013 ∙ n Global from 8,788 to 11,265 ∙ n Mexico from 460 to 512 ** scale from 1 "never“ to 6 "almost always“
High interest, active response
Mailings and catalogs are fre-quently received in Mexico. Mexican consumers are far more interested in the infor-mation they receive than the average consumer and a good majority read it in detail. Com-pared to the global benchmark, response to dialog marketing is significantly higher. Mex-icans most frequently respond to dialog marketing by visiting the supplier‘s website (86,3%). About half of recipients com-municate via social networks, write emails, or visit the shop directly. Phone calls are fre-quently made.
Globally
One or more times per week
One or more times per month
Less than once per month
Never
26.9
33.7
27.7
11.6 43.1
50.6
49.1
30.8
13.1
22.1
42.1
28.0
7.8
Country information Mexico Country profile · Media Use · Distance selling · "Customer jour-ney“ · Drivers & barriers in distance selling · Cross-border shop-ping · Dialog marketing

CountryInformationThe Netherlands
Mirella and Nick
Dutch eShoppers live in rural areas and have rather high incomes. They are price-sensitive and would buy anything that makes their home more comfort- able.

Shop the World 209
3.1
Population 0 - 15 years
Dutch economy * COUNTRY PROFILE THE NETHERLANDS
* Source: Fischer World Almanac 2014, Germany Trade & Invest ** Source: Metropolitan areas with 1 million inhabitants and more; United Nations, Department of Economic and Social Affairs, Po-pulation Division (2012). World Urbanization Prospects: The 2011 Revision, CD-ROM Edition. *** Source: Copyright © IHS, 2013. All rights reserved **** Source: Copyright © IHS, 2013. All rights reserved
Number of households Ø Household sizeUnemployment rateInflation rate
-1.3
Economic growth · in % ****
>
>
-0.8 1.0
2011 2012 2013
Age distribution · 2013 in mn.
Population 65 years and older
Population, total · 2013 in mn. 16.7 ***
Country information The Netherlands
Country profile · Media Use · Distance selling · “Customer jour-ney“ · Drivers & barriers in distance selling · Cross-border shopping · Dialog marketing
Population 16 - 64 years
· 2013 in mn.· 2013· 2013 in %· 2013 in %
6.92.48.32.5
The Netherlands are in a dif-ficult economic situation. Af-ter a short recovery phase in 2011, the economy declined in the following two years and the projections for 2014 are also tentative. The Centraal Planbu-erau (CPB; Office for Central Planning) expects a slight upward trend of approx. 1%. The economy is particular-ly suffering from low pri- vate consumption. In the face of the weak real estate mar-ket and declining wages, consumers act very hesitant. Foreign investors, however, continue to trust in the Dutch investment climate. The advan-tages of the business location are, among others, enterprise- friendly approval procedures, generous legal standards, and a high willingness to invest.
10.9
2.7
Metropolitan areas with 1 million inhabitants or more · 2011 in thousands **
Amsterdam1,049
Rotterdam1,010
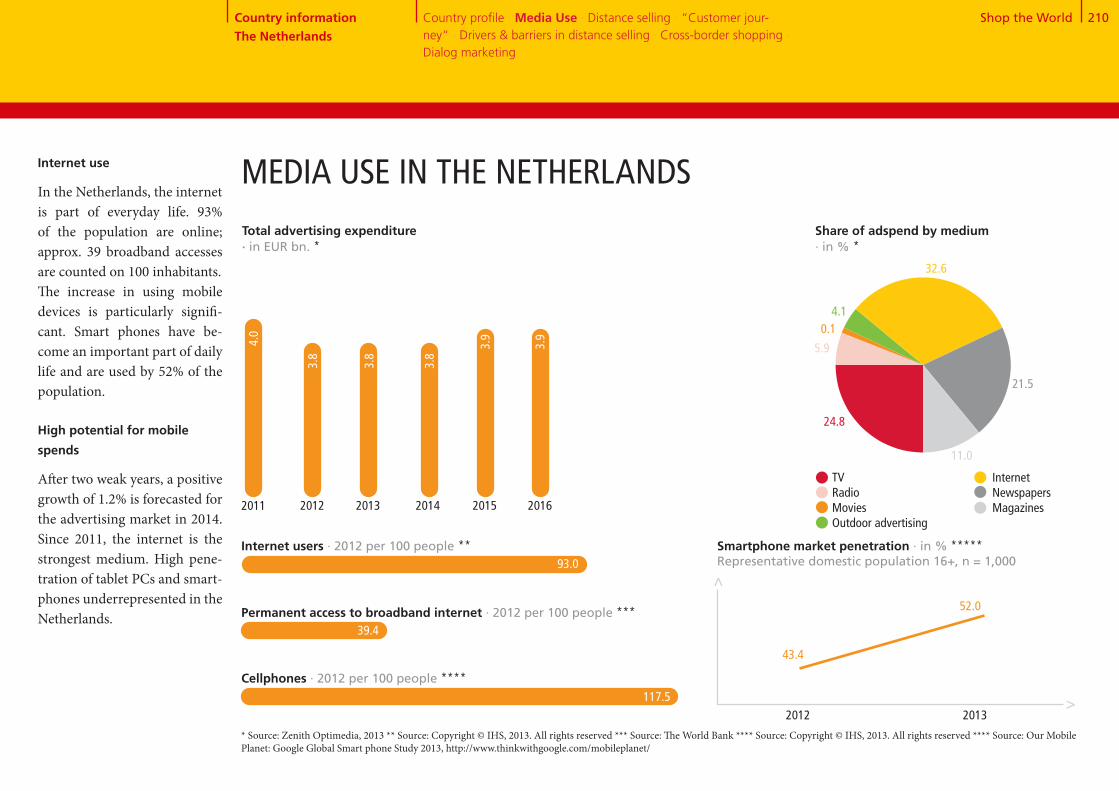
Shop the World 210
25+6+1+4+32+21+11MEDIA USE IN THE NETHERLANDS
39.4
117.5
Smartphone market penetration · in % *****Representative domestic population 16+, n = 1,000
43.4
Internet users · 2012 per 100 people **
Permanent access to broadband internet · 2012 per 100 people ***
Cellphones · 2012 per 100 people ****
2012 2013
52.0
Share of adspend by medium · in % *
TV Radio Movies Outdoor advertising
Total advertising expenditure · in EUR bn. *
Internet Newspapers Magazines
>>
* Source: Zenith Optimedia, 2013 ** Source: Copyright © IHS, 2013. All rights reserved *** Source: The World Bank **** Source: Copyright © IHS, 2013. All rights reserved **** Source: Our Mobile Planet: Google Global Smart phone Study 2013, http://www.thinkwithgoogle.com/mobileplanet/
2011 2012 2013 2014 2015
3.9
93.0
3.8
3.8
3.8
4.0
2016
Country information The Netherlands
Country profile · Media Use · Distance selling · “Customer jour-ney“ · Drivers & barriers in distance selling · Cross-border shopping · Dialog marketing
32.6
21.5
11.0
4.10.1
5.9
24.8
3.9
Internet use
In the Netherlands, the internetis part of everyday life. 93% of the population are online; approx. 39 broadband accesses are counted on 100 inhabitants.The increase in using mobile devices is particularly signifi-cant. Smart phones have be- come an important part of daily life and are used by 52% of the population.
High potential for mobile
spends
After two weak years, a positive growth of 1.2% is forecasted for the advertising market in 2014. Since 2011, the internet is the strongest medium. High pene- tration of tablet PCs and smart- phones underrepresented in the Netherlands.

Shop the World 211
Home improvement
Apart from the global best- sellers such as clothing, con- sumer electronics and media products, the Dutch like to or-der products that make them feel comfortable at home, par-ticularly food, housewares, DIY and gardening.
DISTANCE SELLING IN THE NETHERLANDS
1,064.3
Distance selling purchases in 2013 - trend for 2018 · in EUR mn. * 2013 2018
Apparel and footwear
853.8
823.9
756.3
585.1
74.6
68.9
734.3
246.0
280.1
78.2
287.7
224.3
29.8
96.6
89.1
28.8
Consumer electronics,
computers + equipment
Media products (books, CDs,
DVDs, etc.)
Housewares and home
furnishings + textiles
Food + beverages
Household and consumer
appliances
Beauty and personal care
DIY and gardening
OTC drugs and dietary supple-
ments
Traditional toys and games
House cleaning (detergent,
chastener, etc.)
Development of distance selling and share of total retail 2011 - 2018 · in EUR bn. *
CAGR: 5.7%
Home shopping
Online shopping3.5 3.8 4.1
0.4
0.40.4
4.4 5.7
0.3
0.2
2011 2012 2013e 2014e 2018e
Share of total retail · in % 4.3 4.6 4.9 5.2 6.4
* Source: Euromonitor International
873.3
25.3
Country information The Netherlands
Country profile · Media Use · Distance selling · “Customer jour-ney“ · Drivers & barriers in distance selling · Cross-border shopping · Dialog marketing
499.1
58.2
43.7

Shop the World 212
81+1984
+16
Almost on a global level
In the Netherlands, the use of distance selling as well as the order volumes per user are slightly below global average.
Use of distance selling · in % *
81.4
18.6
The Netherlands
Globally
83.5
16.5
Number of orders in the previous year · in % *
1 to 5 orders
6 to 10 orders
11 to 20 orders
More than 20 orders
No orders
19.2
41.3
14.3
18.6
6.6
20.5
35.9
15.2
16.5
12.0
Future ordering behavior (current users) · in % *
More frequently than in the last
12 months
Just as frequently as in the last
12 months
Less frequently than in the last
12 months
63.5
27.6
55.2
38.8
8.9 6.1
Non-users of distance selling - future plans · in % *
Yes57.3
The Netherlands
Globally
Yes70.5
No42.7
No29.5
Yes No
The Netherlands Globally The Netherlands Globally
DISTANCE SELLING IN THE NETHERLANDS
* Source: DHL Global Mail 2013 ∙ n Global from 1,275 to 11,265 ∙ n The Netherlands from 49 to 512
Country information The Netherlands
Country profile · Media Use · Distance selling · “Customer jour-ney“ · Drivers & barriers in distance selling · Cross-border shopping · Dialog marketing

Shop the World 213
Globally*
46.2
Gender · in % Male Female
Age · in % <30 yrs. 30-49 yrs. 50 yrs. +
Occupation · in % Employed Unemployed
Education · in % Lower educational level Medium and higher level of education
Media affinity: Online · in % yes**
Community size · in % Rural (<50,000 inhabitants) Non-rural/urban (>50,000 inhabitants)
Minors in the household · Ø
Household type · in % Single 2-person household without children Household with children Household with 3 adults
Mobile Internet usage · in % Yes No
Gross household income · in % Low income Medium income High income
Media affinity: Classic · in % yes**
Media affinity: Dialog marketing · in % yes** 40.8
24.4
79.4
45.032.9
22.1
31.668.4
14.335.7
50.2
25.5
49.8
31.3
97.3
44.2
0.8
28.2
68.7High income in rural areas
Compared with the global average, Dutch distance sell-ing customers are rather old and live in small households in rural areas.In contrast, Dutch heavy users have higher incomes, tend to be middle-aged, and many of them live with children in their household.
DISTANCE SELLING IN THE NETHER- LANDS
* Source: DHL Global Mail 2013 ∙ n Global from 2,661 to 11,265 ∙ n The Netherlands from 112 to 512 ** media affinity for online / classic / dialog marketing, if at least one medium from the respective area was rated 5 or 6 on a scale of 1 "absolutely not useful" to 6 "very useful" *** the top third of most active mail order users
44.327.1
14.4
36.4
46.9
36.5
80.8
33.734.232.1
45.754.3
22.443.0
50.0
28.6
50.0
29.4
85.6
63.6
0.7
23.411.2
70.6
Country information The Netherlands
Country profile · Media Use · Distance selling · “Customer jour-ney“ · Drivers & barriers in distance selling · Cross-border shopping · Dialog marketing
***
The Netherlands*
41.333.6
4.9
56.3
39.7
23.4
72.7
32.338.629.0
44.355.7
15.231.7
49.6
25.1
50.4
37.9
95.1
43.7
0.7
28.924.2
62.1
28.3
55.8
Heavy users* Global heavy users*
21.8
2.7
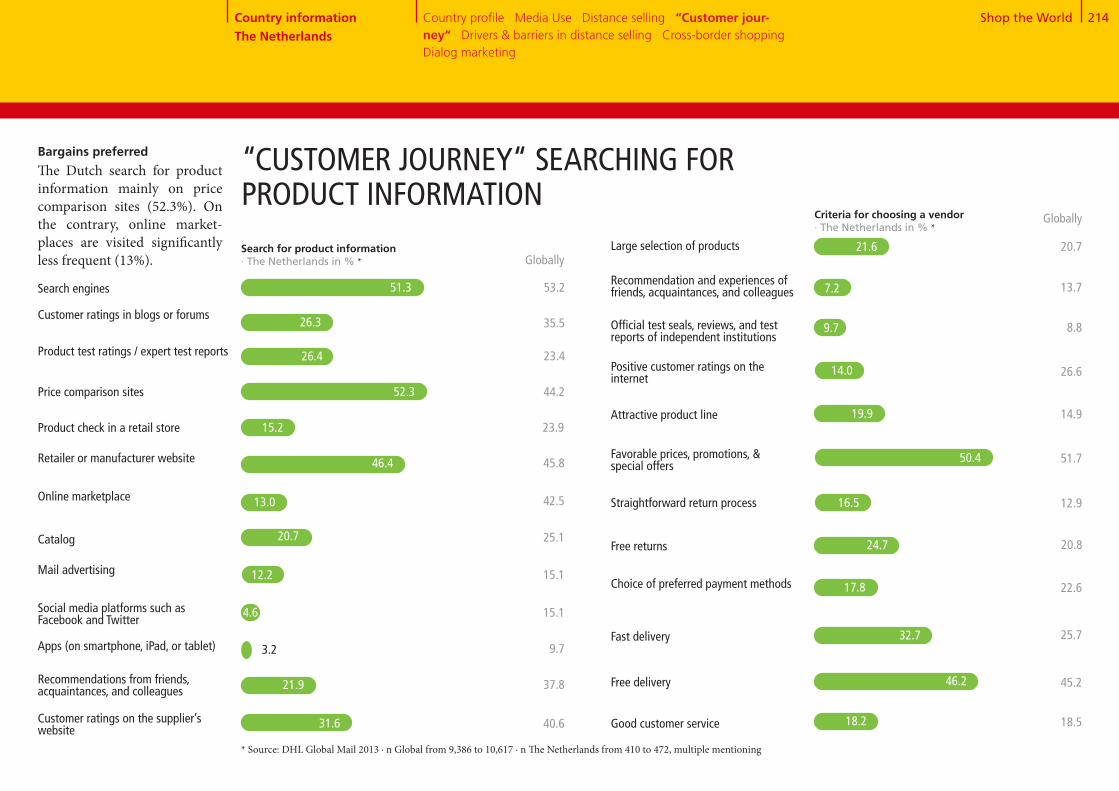
Shop the World 214
Search engines
Customer ratings in blogs or forums
Product test ratings / expert test reports
Product check in a retail store
Retailer or manufacturer website
Online marketplace
Catalog
Mail advertising
Social media platforms such as Facebook and Twitter
Apps (on smartphone, iPad, or tablet)
Recommendations from friends, acquaintances, and colleagues
Customer ratings on the supplier’s website
Price comparison sites
Large selection of products
Recommendation and experiences of friends, acquaintances, and colleagues
Official test seals, reviews, and test reports of independent institutions
Attractive product line
Favorable prices, promotions, & special offers
Straightforward return process
Free returns
Choice of preferred payment methods
Fast delivery
Free delivery
Good customer service
Positive customer ratings on the internet
“CUSTOMER JOURNEY“ SEARCHING FOR PRODUCT INFORMATION
Search for product information · The Netherlands in % * Globally
26.3 35.5
53.2
26.4 23.4
52.3 44.2
15.2 23.9
46.4 45.8
13.0 42.5
20.7 25.1
12.2 15.1
4.6 15.1
3.2 9.7
21.9 37.8
Criteria for choosing a vendor· The Netherlands in % *
Globally
51.3
31.6 40.6
7.2 13.7
20.7
9.7 8.8
14.0 26.6
19.9 14.9
50.4 51.7
16.5 12.9
24.7 20.8
17.8 22.6
32.7 25.7
46.2 45.2
18.2 18.5
21.6
Bargains preferred
The Dutch search for product information mainly on price comparison sites (52.3%). On the contrary, online market- places are visited significantly less frequent (13%).
* Source: DHL Global Mail 2013 ∙ n Global from 9,386 to 10,617 ∙ n The Netherlands from 410 to 472, multiple mentioning
Country information The Netherlands
Country profile · Media Use · Distance selling · “Customer jour-ney“ · Drivers & barriers in distance selling · Cross-border shopping · Dialog marketing

Shop the World 215
Usefulness of advertising media · in % *, **
5 and 63 and 41 and 2
Ø
49.133.8 17.126.1 43.8 30.1
Online advertising
* Source: DHL Global Mail 2013 ∙ n Global from 10,218 to 10,384 ∙ n The Netherlands from 451 to 457 ** scale from 1 "absolutely not useful“ to 6 "very useful“
Big challenges
The Dutch are rather wary when it comes to advertising media. In general they do not consider advertising media to be particularly useful. Only price comparison websites and serach engines are considered to be usefull by more than 50% of respondents.
ACCEPTANCE OF ADVERTISING MEDIA
Globally
Country information The Netherlands
Country profile · Media Use · Distance selling · “Customer jour-ney“ · Drivers & barriers in distance selling · Cross-border shopping · Dialog marketing
Television advertising
5 and 63 and 41 and 2
3.23.6
Ø
39.743.1 17.130.6 41.8 27.6
2.93.4
39.242.2 18.638.7 40.4 20.9Social media Globally
Advertising letters
3.03.1
38.147.9 14.133.9 37.6 28.5
2.83.4
Product suggestions in online shops
50.027.3 22.718.9 45.1 36.0
3.43.9
37.19.2 53.76.5 28.7 64.8
4.54.8
31.77.4 60.99.1 31.7 59.1
4.64.6
42.036.4 21.629.9 43.9 26.2Globally
Household advertising
3.23.4
50.235.8 14.029.0 46.7 24.3Globally
Advertisements in mag- azines and periodicals
3.03.4
43.742.3 14.034.8 43.1 22.1Globally
Advertisements in newspapers
2.93.2
41.948.3 9.841.8 40.7 17.6Globally
Billboard advertise-ments
2.73.0
35.654.0 10.444.3 38.8 16.9Globally
Radio
2.62.9
47.524.0 28.519.3 44.2 36.6Globally
Catalogs from vendors
3.53.9
The NetherlandsGlobally
Globally
Globally
Internet search engines
Globally
Price comparison sites
Globally
The Netherlands
The Netherlands
The Netherlands
The Netherlands
The Netherlands
The Netherlands
The Netherlands
The Netherlands
The Netherlands
The Netherlands
The Netherlands
The Netherlands

Shop the World 216
Use of different suppliers · in % *
Merchant who advertises on TV
Never Seldom Frequently / very frequently
Occasionally
* Source: DHL Global Mail 2013 ∙ n Global from 9,270 to 9,446 ∙ n The Netherlands from 408 to 417
The Netherlands Global
Online PC
Online mobile (tablet, smartphone)
By telephone
In writing (by post, fax)
By email
Order in store & delivery to home
82.7
0.9
1.0
3.7
75.0
3.2
2.1
4.4
“CUSTOMER JOURNEY“– PLACING ORDERSOrdered via PC
At 87.2%, the PC is the primary way of ordering in distance sell-ing in the Netherlands. This figure is significantly higher than the global level (75%). In contrast, the use of mobile devices is below global aver- age. All other ordering meth-ods play a minimal role in the Netherlands. Online market-places are not frequently used in Holland to order goods, yet. Only 33.4% of all distance sell- ing customers use such plat-forms often / very often for their orders. This will probably change, when amazon launches it‘s Dutch website. The usage of online shops does not reach the global level either. Tele- shopping is of interest for few Dutch distance selling cus- tomers: only 28.5% use this way of ordering (vs. 39.9% globally).
22.6 22.416.2
15.4 31.216.8
38.9
36.6
The Netherlands
Globally
10.8 33.412.8
9.9 54.38.7
43.0
27.0
38.3 12.319.8
38.5 12.622.8
29.6
26.1
71.5 2.715.0
60.2 6.617.6
10.8
15.7
8.5
10.5
3.1
4.8
Order channels· in % *
Country information The Netherlands
Country profile · Media Use · Distance selling · “Customer jour-ney“ · Drivers & barriers in distance selling · Cross-border shopping · Dialog marketing
Online marketplace
Mail order company from which I received a catalog
Online shop of a manufaturer or
retailer
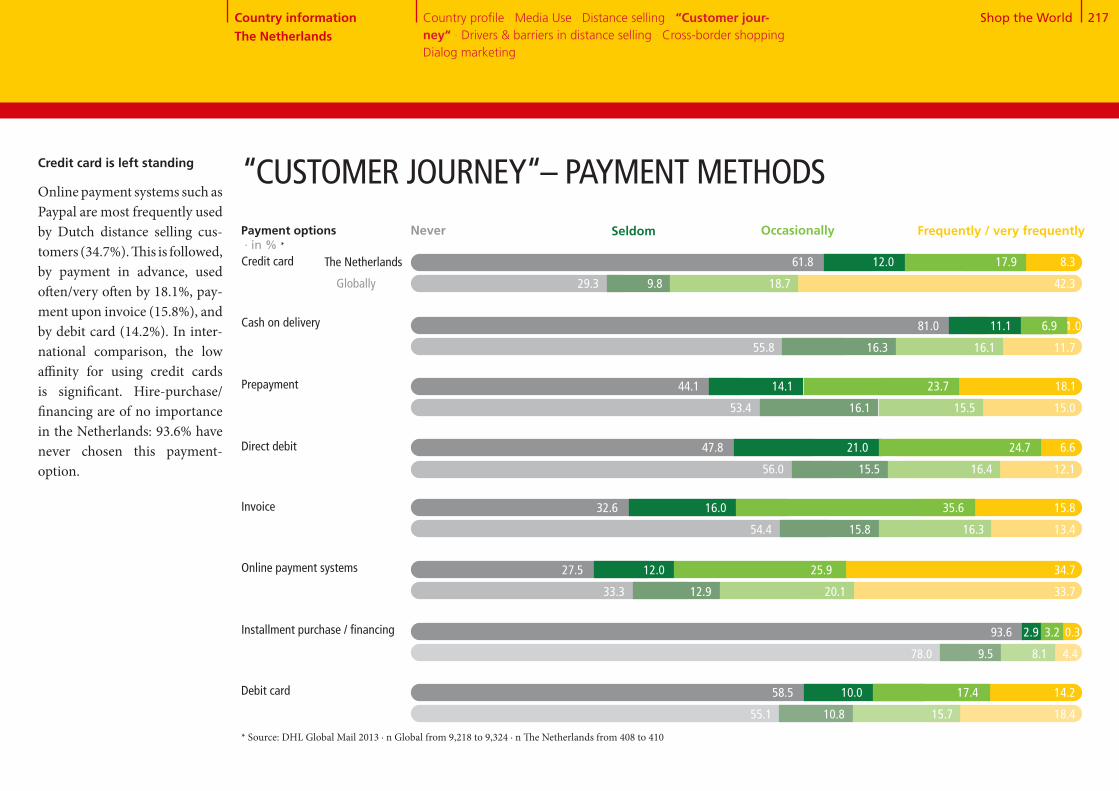
Shop the World 217
Credit card is left standing
Online payment systems such as Paypal are most frequently used by Dutch distance selling cus- tomers (34.7%). This is followed, by payment in advance, used often/very often by 18.1%, pay-ment upon invoice (15.8%), and by debit card (14.2%). In inter- national comparison, the low affinity for using credit cards is significant. Hire-purchase/financing are of no importance in the Netherlands: 93.6% have never chosen this payment- option.
Cash on delivery
Prepayment
Direct debit
Credit card
* Source: DHL Global Mail 2013 ∙ n Global from 9,218 to 9,324 ∙ n The Netherlands from 408 to 410
“CUSTOMER JOURNEY“– PAYMENT METHODS
Online payment systems
Installment purchase / financing
Debit card
Invoice
Payment options · in % *
Never Seldom Frequently / very frequentlyOccasionally
The Netherlands
Globally
61.8 12.0 17.9 8.3
29.3 9.8 18.7 42.3
81.0 11.1 6.9 1.0
55.8 16.3 16.1 11.7
44.1 14.1 23.7 18.1
53.4 16.1 15.5 15.0
47.8 21.0 24.7 6.6
56.0 15.5 16.4 12.1
32.6 16.0 35.6 15.8
54.4 15.8 16.3 13.4
27.5 12.0 25.9 34.7
33.3 12.9 20.1 33.7
93.6 2.9 3.2 0.3
78.0 9.5 8.1 4.4
58.5 10.0 17.4 14.2
55.1 10.8 15.7 18.4
Country information The Netherlands
Country profile · Media Use · Distance selling · “Customer jour-ney“ · Drivers & barriers in distance selling · Cross-border shopping · Dialog marketing

Shop the World 218
The option of selecting the shipping company The vendor only works with reliable delivery companies
Detailed information regarding de-livery period & delivery date when ordering
Fast delivery
Free delivery
Tracking information
Delivery to a retail store
Delivery to a parcel locker or drop box
Other collection points (supermar-ket, kiosk, gas station)
The Netherlands Globally
3.6
3.7
3.6
5.1
4.3
4.9
3.5
4.6
4.6
Max. accepted order time· Ø in days *
3.6
3.5
3.7
5.3
4.8
5.1
3.8
4.9
4.7
* Source: DHL Global Mail 2013 ∙ n Global from 10,270 to 10,462 ∙ n The Netherlands from 454 to 461 ** scale from 1 "absolutely not important“ to 6 "very important“
Lightning-fast delivery
It must be fast: In the Nether-lands, the accepted delivery time is with 4.9 days lower thanthe global average. The require- ments for deliveries are at a level similar to the global pro- file. Shipment-tracking is sig- nificantly less important.
“CUSTOMER JOURNEY“ – DELIVERY
1 2 3 4 5 6
Requirements for delivery · Ø *,**
Country information The Netherlands
Country profile · Media Use · Distance selling · “Customer jour-ney“ · Drivers & barriers in distance selling · Cross-border shopping · Dialog marketing
4.9
6.5
The Netherlands Globally
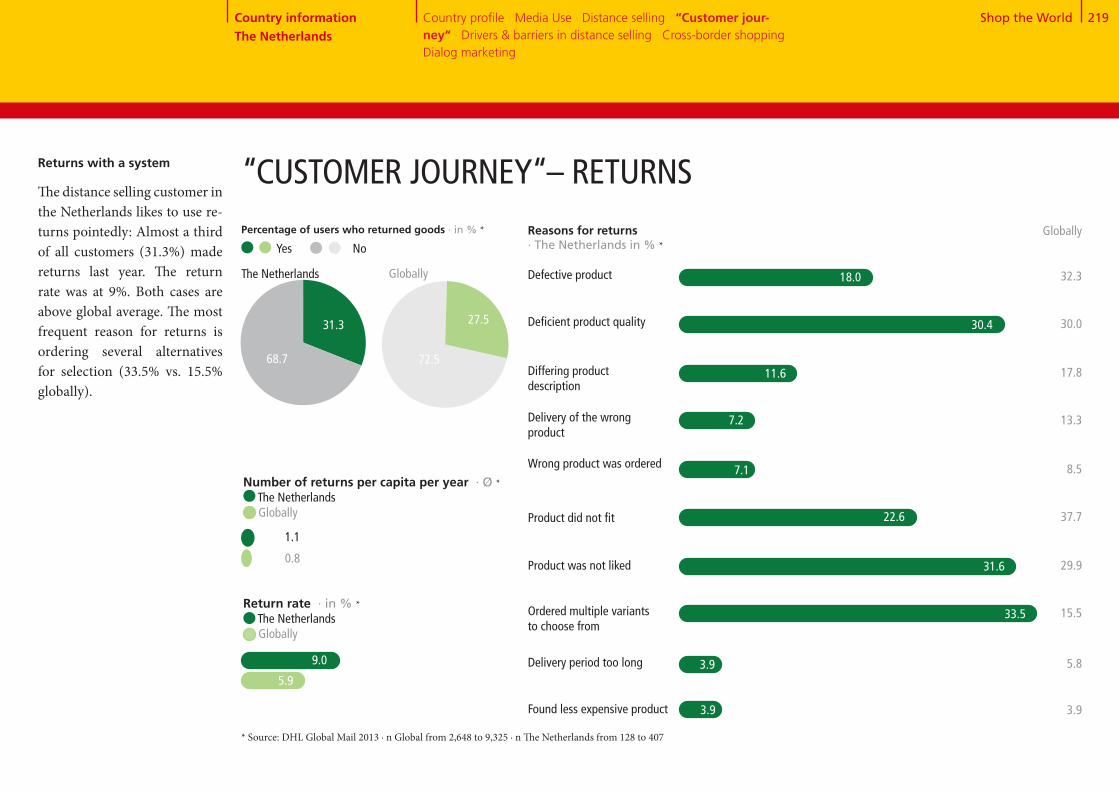
Shop the World 219
31+69
72+28
Number of returns per capita per year · Ø * The Netherlands Globally
0.8
1.1
Return rate · in % * The Netherlands Globally
5.9
Reasons for returns · The Netherlands in % *
Defective product 18.0
Percentage of users who returned goods · in % *
31.3
68.7
The Netherlands Globally
Yes No
“CUSTOMER JOURNEY“– RETURNSReturns with a system
The distance selling customer in the Netherlands likes to use re-turns pointedly: Almost a third of all customers (31.3%) made returns last year. The return rate was at 9%. Both cases are above global average. The most frequent reason for returns is ordering several alternatives for selection (33.5% vs. 15.5% globally).
27.5
72.5
* Source: DHL Global Mail 2013 ∙ n Global from 2,648 to 9,325 ∙ n The Netherlands from 128 to 407
Differing product description
Delivery of the wrong product
Wrong product was ordered
Product did not fit
Ordered multiple variants to choose from
Delivery period too long
Found less expensive product
Deficient product quality
Product was not liked
11.6
7.2
22.6
31.6
33.5
3.9
3.9
Globally
32.3
30.0
17.8
13.3
8.5
37.7
29.9
15.5
5.8
3.9
30.4
7.1
Country information The Netherlands
Country profile · Media Use · Distance selling · “Customer jour-ney“ · Drivers & barriers in distance selling · Cross-border shopping · Dialog marketing
9.0
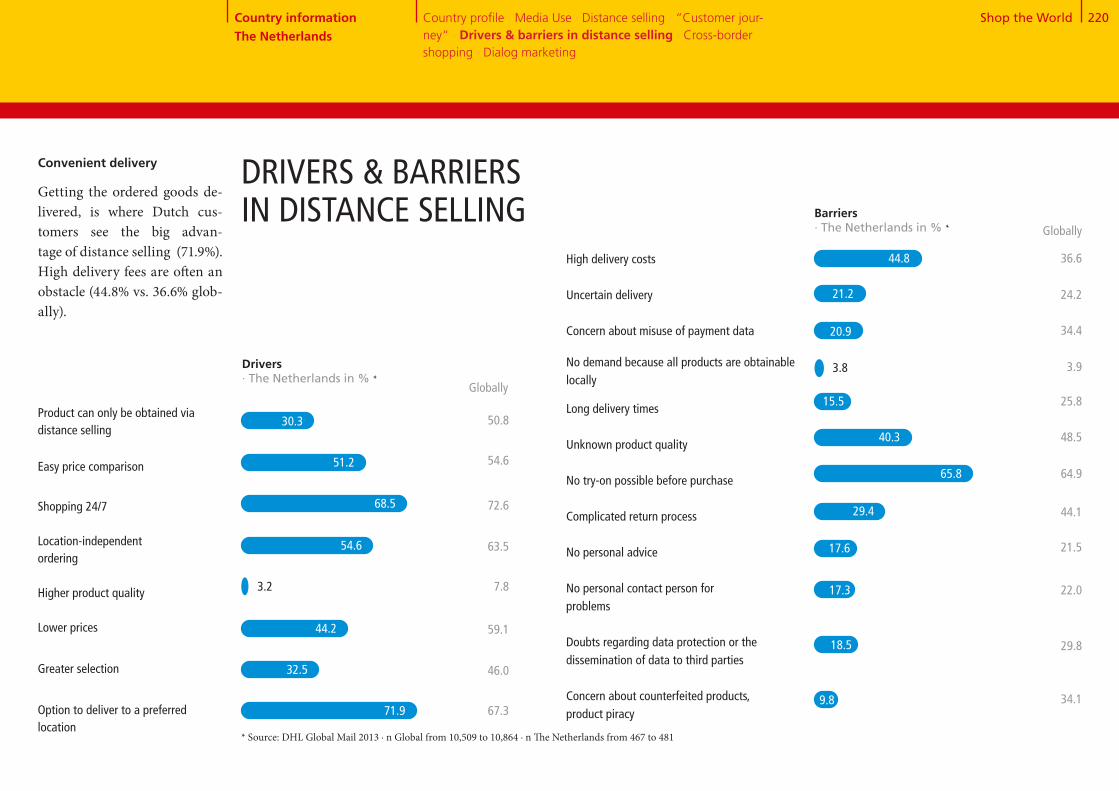
Shop the World 220
High delivery costs
Uncertain delivery
Concern about misuse of payment data
No demand because all products are obtainable locally
Long delivery times
Unknown product quality
No try-on possible before purchase
Complicated return process
No personal advice
No personal contact person for problems
Doubts regarding data protection or thedissemination of data to third parties
Concern about counterfeited products, product piracy
Product can only be obtained via distance selling
Easy price comparison
Shopping 24/7
Location-independent ordering
Higher product quality
Lower prices
Greater selection
Option to deliver to a preferred location
DRIVERS & BARRIERS IN DISTANCE SELLING Barriers
· The Netherlands in % *
50.8
54.6
72.6
63.5
7.8
59.1
46.0
67.3
44.2
32.5
71.9
Globally
36.6
24.2
34.4
3.9
25.8
48.5
64.9
44.1
21.5
22.0
29.8
34.1
Convenient delivery
Getting the ordered goods de-livered, is where Dutch cus- tomers see the big advan- tage of distance selling (71.9%). High delivery fees are often an obstacle (44.8% vs. 36.6% glob- ally).
Drivers · The Netherlands in % *
Globally
* Source: DHL Global Mail 2013 ∙ n Global from 10,509 to 10,864 ∙ n The Netherlands from 467 to 481
30.3
51.2
68.5
54.6
3.2
44.8
21.2
20.9
3.8
15.5
40.3
65.8
29.4
17.6
17.3
18.5
9.8
Country information The Netherlands
Country profile · Media Use · Distance selling · “Customer jour-ney“ · Drivers & barriers in distance selling · Cross-border shopping · Dialog marketing

Shop the World 221
50+10+40CROSS-BORDER SHOPPING – OVERVIEW
Previous orders abroad
Previous and future orders abroad by country · in % *
China[22.3]
Other European countries[15.8]
1
2
3
4
5
Germany[42.0]
USA[41.0]
Great Britain[31.3]
Future orders abroad
The Netherlands
* Source: DHL Global Mail 2013 ∙ n Global from 4,738 to 8,807 ∙ n The Netherlands from 165 to 347 ** split into "further orders planned“ 46.8% The Netherlands and "no further orders planned“ 2.9% The Netherlands
50:50 domestic vs. abroad
One half of the Dutch distance selling customers have already ordered abroad; the other half has so far only ordered within the country‘s borders. A large part plans to continue to re-frain from ordering abroad. At 39.7%, this value is significantly higher than the international average (20.5%). Prefered des-tinations for cross-border shop-ping are Germany and the US, followed by Great Britain and China.
China[34.0]
Other European countries[31.0]
USA[66.1]
Germany[57.2]
Great Britain[52.1]
Country information The Netherlands
Country profile · Media Use · Distance selling · “Customer jour-ney“ · Drivers & barriers in distance selling · Cross-border shop-ping · Dialog marketing
Use of cross-border eCommerce · in % *
Yes, already ordered **No, but future orders planned No, no future orders planned
49.7 39.7
10.6
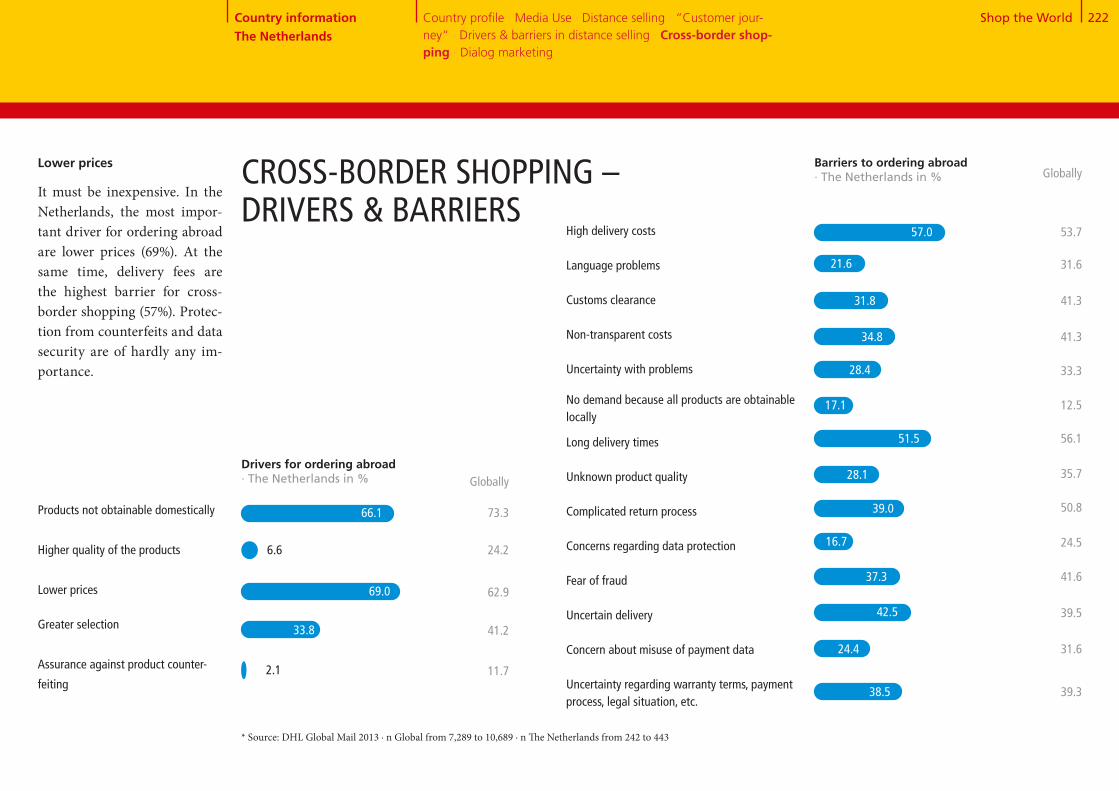
Shop the World 222
Products not obtainable domestically
Higher quality of the products
Lower prices
Greater selection
Assurance against product counter-
feiting
High delivery costs Language problems
Customs clearance
Non-transparent costs
Uncertainty with problems
No demand because all products are obtainable locally
Long delivery times
Unknown product quality
Complicated return process
Concerns regarding data protection Fear of fraud Uncertain delivery
Concern about misuse of payment data
Uncertainty regarding warranty terms, payment process, legal situation, etc.
Drivers for ordering abroad· The Netherlands in %
Barriers to ordering abroad · The Netherlands in %
Globally
73.3
24.2
62.9
41.2
11.7
Globally
53.7
31.6
41.3
41.3
33.3
12.5
56.1
35.7
50.8
24.5
41.6
39.5
31.6
39.3
Lower prices
It must be inexpensive. In the Netherlands, the most impor- tant driver for ordering abroad are lower prices (69%). At the same time, delivery fees are the highest barrier for cross- border shopping (57%). Protec-tion from counterfeits and data security are of hardly any im-portance.
CROSS-BORDER SHOPPING – DRIVERS & BARRIERS
* Source: DHL Global Mail 2013 ∙ n Global from 7,289 to 10,689 ∙ n The Netherlands from 242 to 443
57.0
21.6
31.8
34.8
28.4
17.1
51.5
28.1
39.0
16.7
37.3
42.5
24.4
38.5
66.1
6.6
69.0
33.8
2.1
Country information The Netherlands
Country profile · Media Use · Distance selling · “Customer jour-ney“ · Drivers & barriers in distance selling · Cross-border shop-ping · Dialog marketing

Shop the World 223
Reception of mailings and catalogers · The Netherlands in % *
5 and 63 and 41 and 2
DIALOG MARKETING
Reading mailings and catalogs
· in % *,**
The Netherlands
Globally
23.7 32.5 43.8
22.1 35.2 42.7
5 and 63 and 41 and 2
Response to mailings and catalogs · in % *,**
Globally
29.2 51.3 19.6
29.0 45.8 25.3
Response channel for mailings and catalogers . The Netherlands in % * Globally
Website visits
Visits to stores or
branch offices
Other online
response (e.g. chat,
Twitter, Facebook,
newsletter
registration, etc.)
Phone call
Business reply card
61.1 73.4
48.6
30.0
24.5
18.4
12.6
* Source: DHL Global Mail 2013 ∙ n Global from 8,788 to 11,265 ∙ n The Netherlands from 394 to 512 ** scale from 1 "never“ to 6 "almost always“
High mailing density
Many Dutch distance selling customers receive catalogs and mailings at least once a week (39.8% vs. 26.9% globally). Reading such offers is at glob-al level. As many as 43% state they often read the product of-ferings. Further reactions are rather hesitant, though. Apart from visiting stores (54.3% vs. 48.6% globally), all other re-sponse channels are used less frequently than in global aver-age.
Globally
One or more times per week
One or more times per month
Less than once per month
Never
26.9
33.7
27.7
11.6 54.3
19.0
15.3
6.1
5.4
39.8
24.7
26.9
8.6
Country information The Netherlands
Country profile · Media Use · Distance selling · “Customer jour-ney“ · Drivers & barriers in distance selling · Cross-border shop-ping · Dialog marketing
The Netherlands

Country InformationPoland
Kasia and Maria
Polish eCommerce customers are rather young and price-sensitive but hesitant to use mobile devices.

Shop the World 225Country profile · Media Use · Distance selling · “Customer jour-ney“ · Drivers & barriers in distance selling · Cross-border shopping · Dialog marketing
6.1
Population 0 - 15 years
Polish economy * COUNTRY PROFILE POLAND
Warszawa (Warsaw) 1,718
* Source: Fischer World Almanac 2014, Germany Trade & Invest ** Source: Metropolitan areas with 1 million inhabitants and more; United Nations, Department of Economic and Social Affairs, Po-pulation Division (2012). World Urbanization Prospects: The 2011 Revision, CD-ROM Edition. *** Source: Copyright © IHS, 2013. All rights reserved **** Source: Copyright © IHS, 2013. All rights reserved
Number of households Ø Household sizeUnemployment rateInflation rate
1.9
Economic growth · in % ****
>
>
1.6
4.5
2011 2012 2013
Age distribution · 2013 in mn.
Population 65 years and older
Population, total · 2013 in mn. 38.3 ***
Country information Poland
Population 16 - 64 years
· 2013 in mn.· 2013· 2013 in %· 2013 in %
13.12.9
10.40.9
The Polish economy is slowly gaining speed again, after growth was as low as 1.9% of the GDP in 2012 and decreased to 1.6% in 2013. The forecast for 2014 is more optimistic. The outlooks range from 2.2% ac-cording to the European Com-mission to 2.7% as forecasted by Morgan Stanley Bank. Janusz Jankowiak, Head Economist at Polish Business Roundta- bles, sees the net exports as the main driver of growth. Domes- tic demand can probably not add too much to the recovery in the mid-term. The background of this is foremost to be found in the difficult labor situation. The unemployment rate has continuously increased for the past two years and added up to 10.4% at the end of 2013.
26.8
5.5
Metropolitan areas with 1 million inhabitants or more · 2011 in thousands **

Shop the World 226
52+7+2+7+20+5+7MEDIA USE IN POLAND
16.6
132.7
Smartphone market penetration · in % *****Representative domestic population 16+, n = 1,000
15.5
Internet users · 2012 per 100 people **
Permanent access to broadband internet · 2012 per 100 people ***
Cellphones · 2012 per 100 people ****
2012 2013
35.0
Share of adspend by medium · in % *
TV Radio Movies Outdoor advertising
Total advertising expenditure · in EUR bn. *
Internet Newspapers Magazines
>>
* Source: Zenith Optimedia, 2013 ** Source: Copyright © IHS, 2013. All rights reserved *** Source: The World Bank **** Source: Copyright © IHS, 2013. All rights reserved **** Source: Our Mobile Planet: Google Global Smart phone Study 2013, http://www.thinkwithgoogle.com/mobileplanet/
2011 2012 2013 2014 2015
1.6
65.0
1.6
1.5
1.6
1.7
2016
1.6
Country information Poland Country profile · Media Use · Distance selling · “Customer jour-ney“ · Drivers & barriers in distance selling · Cross-border shopping · Dialog marketing
20.3
4.57.0
7.0
1.87.1
52.3
Internet use
Due to multi-billion dollar in-vestments into the systematic expansion of the broadband network, almost two thirds of all Polish use the internet to-day; mobile communication also gains more and more im-portance. From 2012 to 2013 alone, the number of smart phone users doubled to approx. 13 million which means market penetration of 35%.
Goodbye to newspapers & magazines
After three years of massive decline in advertising expendi-tures, a slight increase of 0.6% is expected for 2014. At 7.3% in 2014, the internet spends show the highest growth rate. For newspapers and magazines, a dramatic decline of about -20% per annum is forecasted until 2016.
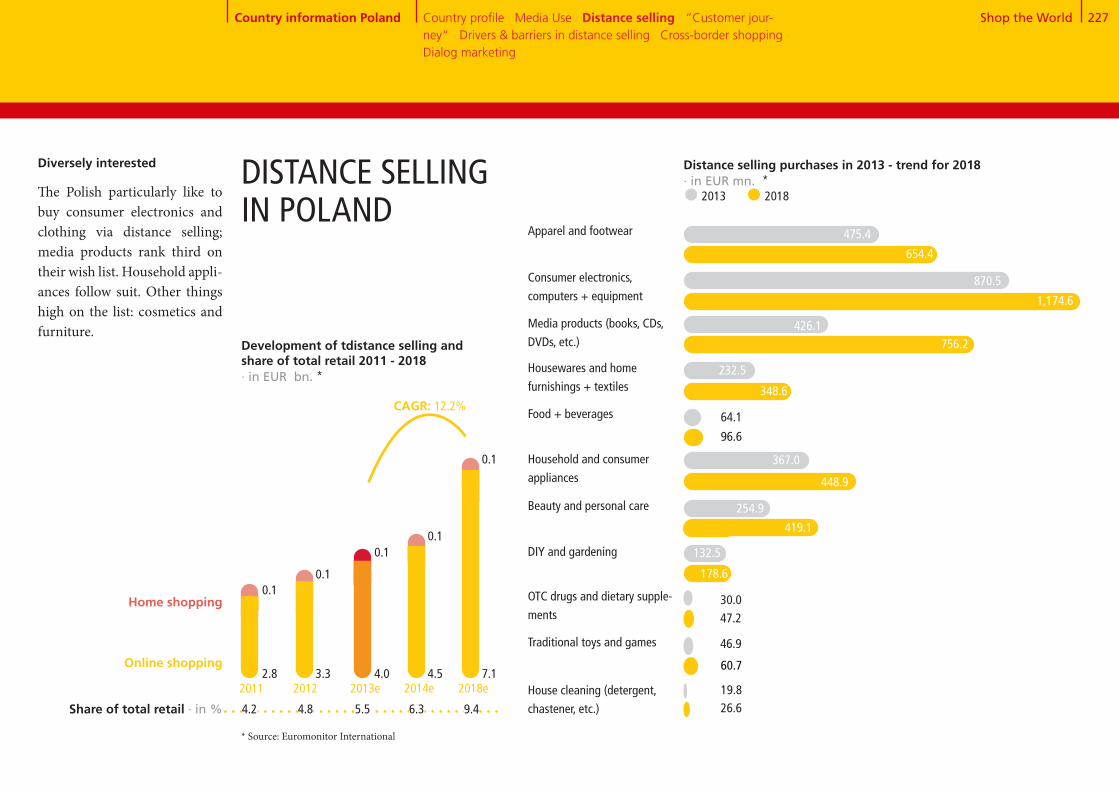
Shop the World 227
Apparel and footwear
Consumer electronics,
computers + equipment
Media products (books, CDs,
DVDs, etc.)
Housewares and home
furnishings + textiles
Food + beverages
Household and consumer
appliances
Beauty and personal care
DIY and gardening
OTC drugs and dietary supple-
ments
Traditional toys and games
House cleaning (detergent,
chastener, etc.)
Diversely interested
The Polish particularly like to buy consumer electronics and clothing via distance selling; media products rank third on their wish list. Household appli-ances follow suit. Other things high on the list: cosmetics and furniture.
DISTANCE SELLING IN POLAND
654.4
1,174.6
870.5
756.2426.1
348.6
232.5
96.6
367.0
448.9
419.1
178.6
132.5
30.0
60.7
46.9
26.6
Development of tdistance selling and share of total retail 2011 - 2018 · in EUR bn. *
CAGR: 12.2%
Home shopping
Online shopping2.8 3.3 4.0
0.10.1
0.1
4.5 7.1
0.1
0.1
2011 2012 2013e 2014e 2018e
Share of total retail · in % 4.2 4.8 5.5 6.3 9.4
* Source: Euromonitor International
475.4
19.8
Country information Poland Country profile · Media Use · Distance selling · “Customer jour-ney“ · Drivers & barriers in distance selling · Cross-border shopping · Dialog marketing
64.1
254.9
47.2
Distance selling purchases in 2013 - trend for 2018 · in EUR mn. * 2013 2018
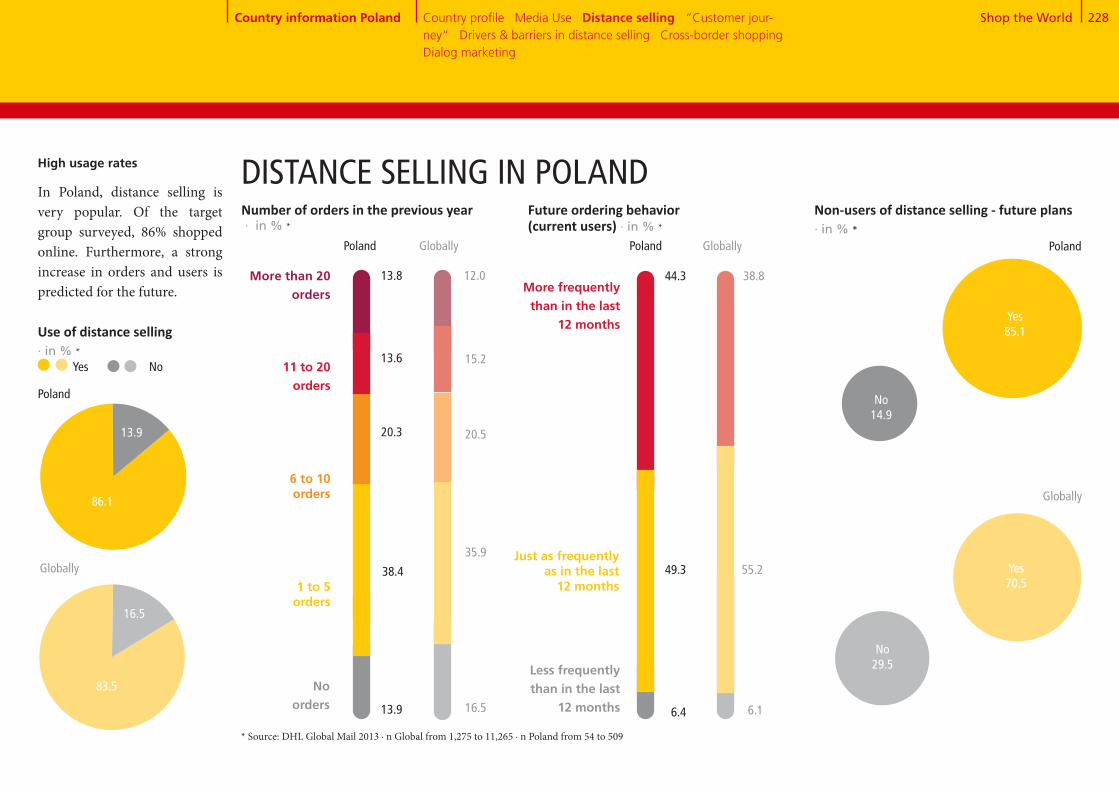
Shop the World 228
86+1484
+16
High usage rates
In Poland, distance selling is very popular. Of the target group surveyed, 86% shopped online. Furthermore, a strong increase in orders and users is predicted for the future.
Use of distance selling · in % *
86.1
13.9
Poland
Globally
83.5
16.5
Number of orders in the previous year · in % *
1 to 5 orders
6 to 10 orders
11 to 20 orders
No orders
20.3
38.4
13.6
13.9
13.8
20.5
35.9
15.2
16.5
12.0
Future ordering behavior (current users) · in % *
More frequently than in the last
12 months
Just as frequently as in the last
12 months
Less frequently than in the last
12 months
49.3
44.3
55.2
38.8
6.4 6.1
Non-users of distance selling - future plans · in % *
Yes85.1
Poland
Globally
Yes70.5
No14.9
No29.5
Yes No
Poland Globally Poland Globally
DISTANCE SELLING IN POLAND
* Source: DHL Global Mail 2013 ∙ n Global from 1,275 to 11,265 ∙ n Poland from 54 to 509
Country information Poland Country profile · Media Use · Distance selling · “Customer jour-ney“ · Drivers & barriers in distance selling · Cross-border shopping · Dialog marketing
More than 20 orders

Shop the World 229
Globally*
42.5
Gender · in % Male Female
Age · in % <30 yrs. 30-49 yrs. 50 yrs. +
Occupation · in % Employed Unemployed
Education · in % Lower educational level Medium and higher level of education
Media affinity: Online · in % yes**
Community size · in % Rural (<50,000 inhabitants) Non-rural/urban (>50,000 inhabitants)
Minors in the household · Ø
Household type · in % Single 2-person household without children Household with children Household with 3 adults
Mobile Internet usage · in % Yes No
Gross household income · in % Low income Medium income High income
Media affinity: Classic · in % yes**
Media affinity: Dialog marketing · in % yes** 55.6
39.0
87.1
47.226.3
26.4
45.554.5
24.944.4
50.5
36.2
49.5
20.4
96.5
65.6
0.7
27.23.6
79.6
Average profile
The profile of the Polish dis-tance selling client represents the global average. However, the slightly higher educational level, hesitant mobile internet use, and rather high affinity for online media and dialog mar-keting are remarkable. Heavy useres tend to be young with high incomes.
DISTANCE SELLING IN POLAND
* Source: DHL Global Mail 2013 ∙ n Global from 2,661 to 11,265 ∙ n Poland from 106 to 509 ** media affinity for online / classic / dialog marketing, if at least one medium from the respective area was rated 5 or 6 on a scale of 1 "absolutely not useful" to 6 "very useful" *** the top third of most active users
44.327.1
14.4
36.4
46.9
36.5
80.8
33.734.232.1
45.754.3
22.443.0
50.0
28.6
50.0
29.4
85.6
63.6
0.7
23.411.2
70.6
Country information Poland Country profile · Media Use · Distance selling · “Customer jour-ney“ · Drivers & barriers in distance selling · Cross-border shopping · Dialog marketing
***
Poland*
38.830.3
3.3
38.8
52.9
37.2
85.9
35.929.035.1
57.742.3
27.940.0
50.4
30.9
49.6
27.1
96.7
61.2
0.6
26.55.7
72.9
21.3
34.4
Heavy users* Global heavy users*
3.5
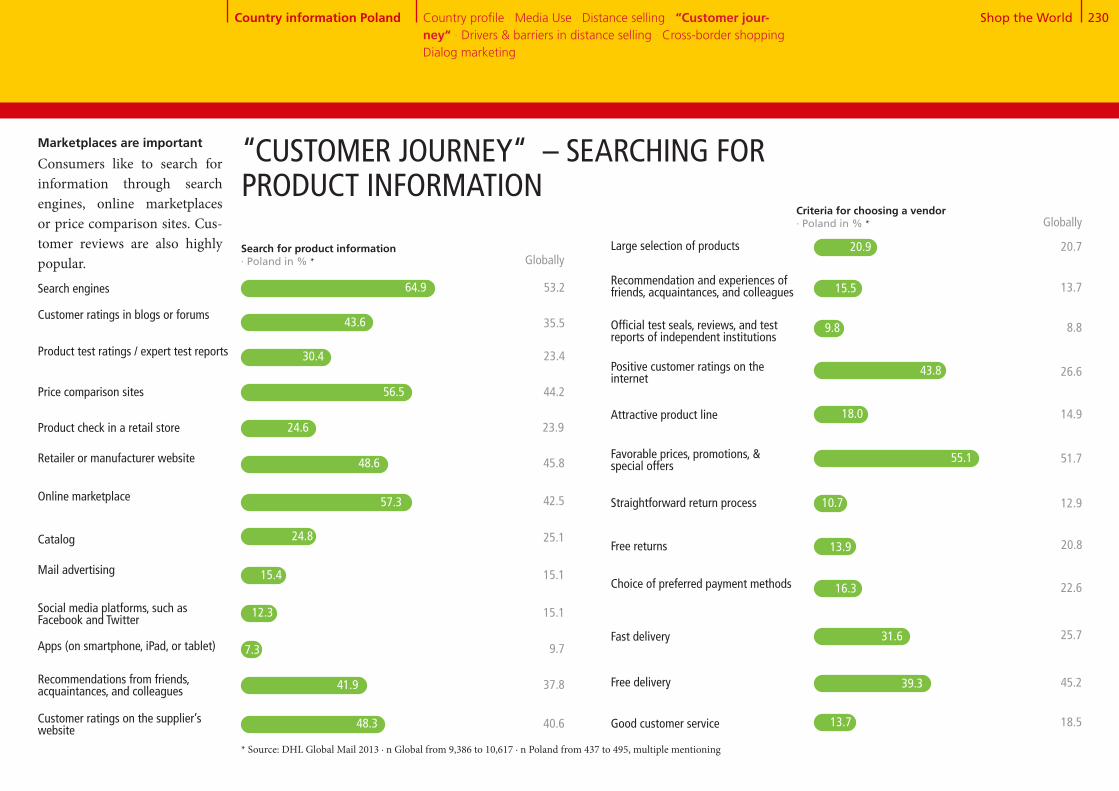
Shop the World 230
Search engines
Customer ratings in blogs or forums
Product test ratings / expert test reports
Product check in a retail store
Retailer or manufacturer website
Online marketplace
Catalog
Mail advertising
Social media platforms, such as Facebook and Twitter
Apps (on smartphone, iPad, or tablet)
Recommendations from friends, acquaintances, and colleagues
Customer ratings on the supplier’s website
Price comparison sites
Large selection of products
Recommendation and experiences of friends, acquaintances, and colleagues
Official test seals, reviews, and test reports of independent institutions
Attractive product line
Favorable prices, promotions, & special offers
Straightforward return process
Free returns
Choice of preferred payment methods
Fast delivery
Free delivery
Good customer service
Positive customer ratings on the internet
“CUSTOMER JOURNEY“ – SEARCHING FOR PRODUCT INFORMATION
Search for product information · Poland in % * Globally
43.6 35.5
53.2
30.4 23.4
56.5 44.2
24.6 23.9
48.6 45.8
57.3 42.5
24.8 25.1
15.4 15.1
12.3 15.1
7.3 9.7
41.9 37.8
Criteria for choosing a vendor · Poland in % * Globally
64.9
48.3 40.6
15.5 13.7
20.7
9.8 8.8
43.8 26.6
18.0 14.9
55.1 51.7
10.7 12.9
13.9 20.8
16.3 22.6
31.6 25.7
39.3 45.2
13.7 18.5
20.9
Marketplaces are important
Consumers like to search for information through search engines, online marketplaces or price comparison sites. Cus- tomer reviews are also highly popular.
* Source: DHL Global Mail 2013 ∙ n Global from 9,386 to 10,617 ∙ n Poland from 437 to 495, multiple mentioning
Country information Poland Country profile · Media Use · Distance selling · “Customer jour-ney“ · Drivers & barriers in distance selling · Cross-border shopping · Dialog marketing

Shop the World 231
Usefulness of advertising media · in % *, **
5 and 63 and 41 and 2
Ø
46.927.5 25.626.1 43.8 30.1
Online advertising
* Source: DHL Global Mail 2013 ∙ n Global from 10,218 to 10,384 ∙ n Poland from 483 to 491 ** scale from 1 "absolutely not useful“ to 6 very useful“
Online search and catalogs
Polish consumers rate price comparison sites and search engines high in usefulness. Ad-ditionally, the catalog continues to be a well-esteemed medium in Poland.
ACCEPTANCE OF ADVERTISING MEDIA
Poland Globally
Country information Poland
Television advertising
5 and 63 and 41 and 2
3.53.6
Ø
46.825.4 27.830.6 41.8 27.6
3.53.4
41.434.3 24.338.7 40.4 20.9Social media
Poland Globally
Advertising letters
3.33.1
40.828.3 31.033.9 37.6 28.5
3.53.4
Product suggestions in online shops
48.419.9 31.718.9 45.1 36.0
3.73.9
23.34.5 72.26.5 28.7 64.8
5.04.8
26.06.7 67.29.1 31.7 59.1
4.94.6
44.629.1 26.329.9 43.9 26.2
Poland Globally
Household advertising
3.53.4
46.732.0 21.329.0 46.7 24.3
Poland Globally
Advertisements in mag- azines and periodicals
3.23.4
45.430.7 24.034.8 43.1 22.1
Poland Globally
Advertisements in newspapers
3.33.2
40.741.1 18.241.8 40.7 17.6
Poland Globally
Billboard advertise-ments
3.03.0
41.039.1 19.944.3 38.8 16.9
Poland Globally
Radio
3.02.9
46.113.2 40.719.3 44.2 36.6
Poland Globally
Catalogs from vendors
4.13.9
Poland Globally
Poland Globally
Poland Globally
Internet search engines
Poland Globally
Price comparison sites
Poland Globally
Country profile · Media Use · Distance selling · “Customer jour-ney“ · Drivers & barriers in distance selling · Cross-border shopping · Dialog marketing
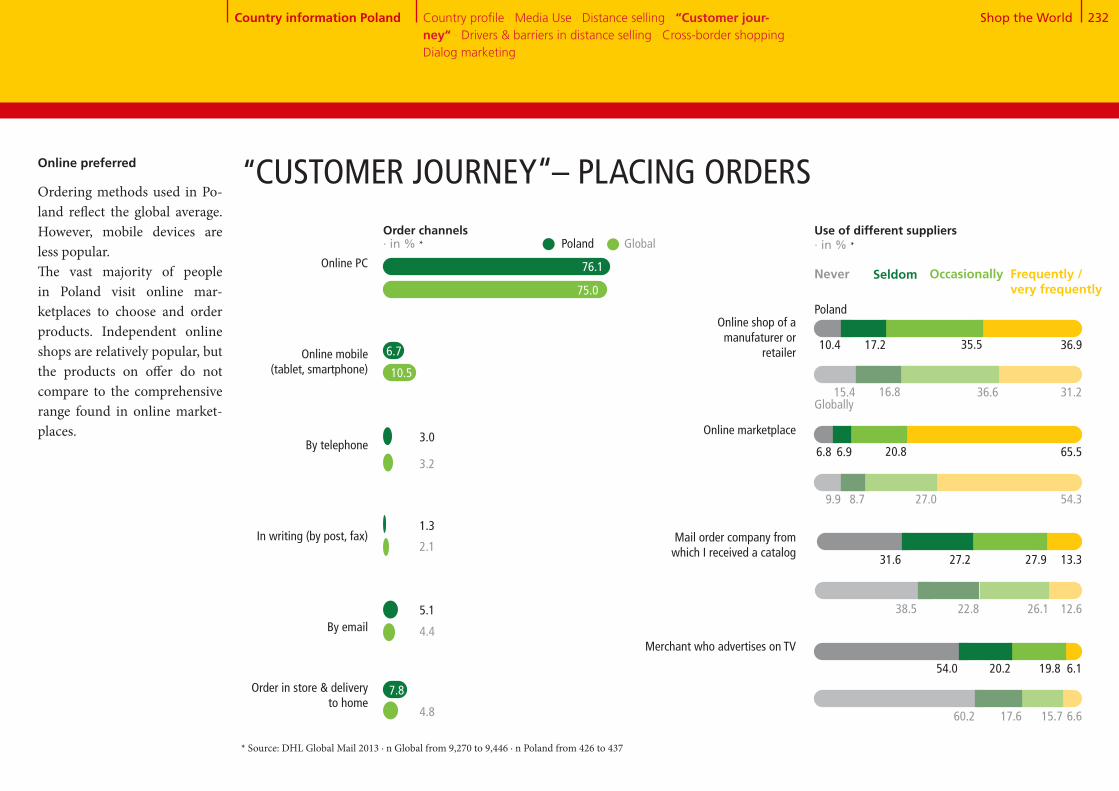
Shop the World 232
SeldomOnline PC
Online mobile (tablet, smartphone)
By telephone
In writing (by post, fax)
By email
Order in store & delivery to home
Country profile · Media Use · Distance selling · “Customer jour-ney“ · Drivers & barriers in distance selling · Cross-border shopping · Dialog marketing
Online marketplace
Mail order company from which I received a catalog
Merchant who advertises on TV
Online shop of a manufaturer or
retailer
Use of different suppliers · in % *
Never Frequently / very frequently
Occasionally
* Source: DHL Global Mail 2013 ∙ n Global from 9,270 to 9,446 ∙ n Poland from 426 to 437
Poland Global
76.1
3.0
1.3
5.1
75.0
3.2
2.1
4.4
“CUSTOMER JOURNEY“– PLACING ORDERSOnline preferred
Ordering methods used in Po-land reflect the global average. However, mobile devices are less popular.The vast majority of people in Poland visit online mar-ketplaces to choose and order products. Independent online shops are relatively popular, but the products on offer do not compare to the comprehensive range found in online market-places.
10.4 36.917.2
15.4 31.216.8
35.5
36.6
Poland
Globally
6.8 65.56.9
9.9 54.38.7
20.8
27.0
31.6 13.327.2
38.5 12.622.8
27.9
26.1
54.0 6.120.2
60.2 6.617.6
19.8
15.7
6.7
10.5
4.8
Order channels · in % *
Country information Poland
7.8
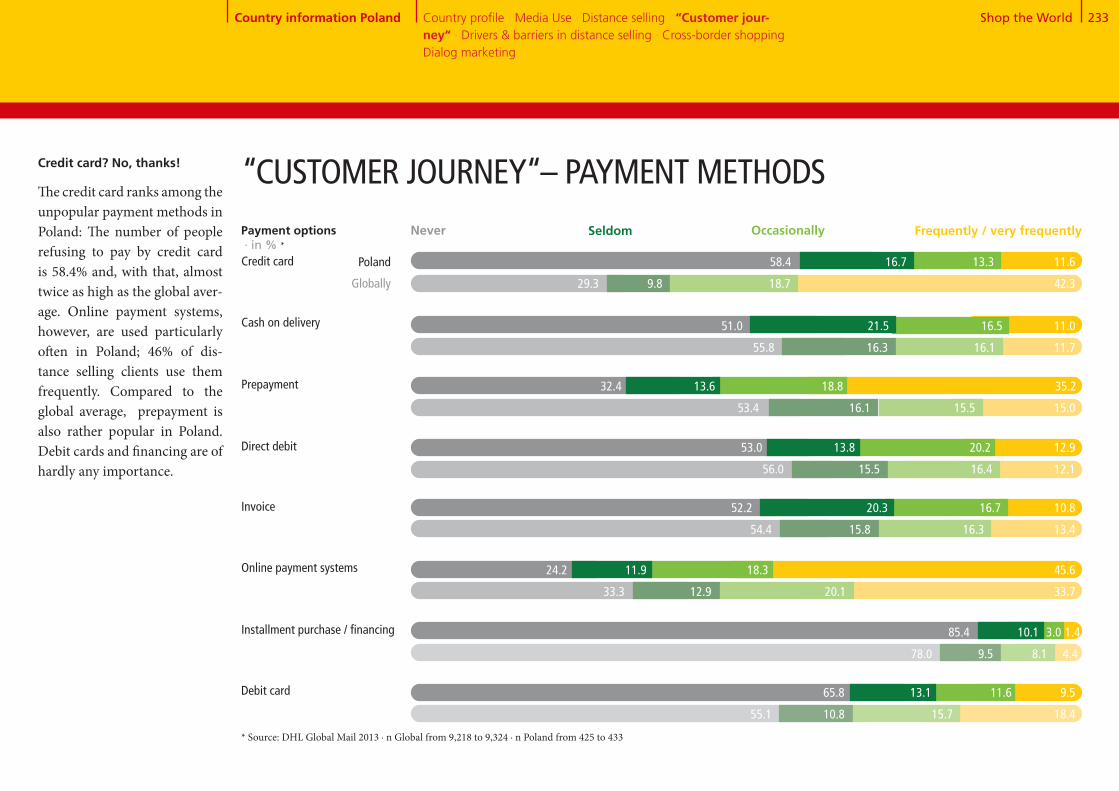
Shop the World 233
Credit card? No, thanks!
The credit card ranks among the unpopular payment methods inPoland: The number of people refusing to pay by credit card is 58.4% and, with that, almost twice as high as the global aver-age. Online payment systems, however, are used particularly often in Poland; 46% of dis- tance selling clients use them frequently. Compared to the global average, prepayment is also rather popular in Poland. Debit cards and financing are of hardly any importance.
Cash on delivery
Prepayment
Direct debit
Credit card
* Source: DHL Global Mail 2013 ∙ n Global from 9,218 to 9,324 ∙ n Poland from 425 to 433
“CUSTOMER JOURNEY“– PAYMENT METHODS
Online payment systems
Installment purchase / financing
Debit card
Invoice
Payment options · in % *
Never Frequently / very frequentlyOccasionally
Poland
Globally
58.4 16.7 13.3 11.6
29.3 9.8 18.7 42.3
51.0 21.5 16.5 11.0
55.8 16.3 16.1 11.7
32.4 13.6 18.8 35.2
53.4 16.1 15.5 15.0
53.0 13.8 20.2 12.9
56.0 15.5 16.4 12.1
52.2 20.3 16.7 10.8
54.4 15.8 16.3 13.4
24.2 11.9 18.3 45.6
33.3 12.9 20.1 33.7
85.4 10.1 3.0 1.4
78.0 9.5 8.1 4.4
65.8 13.1 11.6 9.5
55.1 10.8 15.7 18.4
Country information Poland Country profile · Media Use · Distance selling · “Customer jour-ney“ · Drivers & barriers in distance selling · Cross-border shopping · Dialog marketing
Seldom
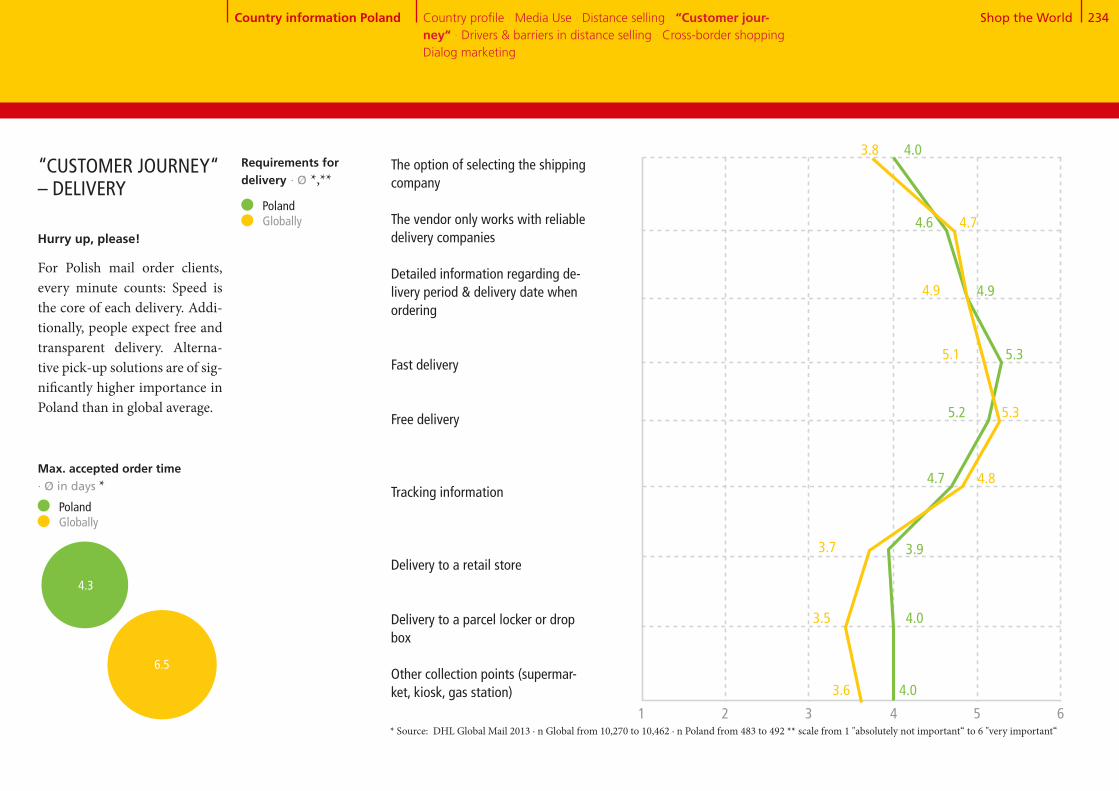
Shop the World 234
The option of selecting the shipping company The vendor only works with reliable delivery companies
Detailed information regarding de-livery period & delivery date when ordering
Fast delivery
Free delivery
Tracking information
Delivery to a retail store
Delivery to a parcel locker or drop box
Other collection points (supermar-ket, kiosk, gas station)
Country profile · Media Use · Distance selling · “Customer jour-ney“ · Drivers & barriers in distance selling · Cross-border shopping · Dialog marketing
Poland Globally
4.0
4.0
3.9
5.2
4.7
5.3
4.0
4.9
4.6
Max. accepted order time · Ø in days *
3.6
3.5
3.7
5.3
4.8
5.1
3.8
4.9
4.7
* Source: DHL Global Mail 2013 ∙ n Global from 10,270 to 10,462 ∙ n Poland from 483 to 492 ** scale from 1 "absolutely not important“ to 6 "very important“
Hurry up, please!
For Polish mail order clients, every minute counts: Speed is the core of each delivery. Addi-tionally, people expect free and transparent delivery. Alterna- tive pick-up solutions are of sig-nificantly higher importance in Poland than in global average.
“CUSTOMER JOURNEY“ – DELIVERY
1 2 3 4 5 6
Requirements for delivery · Ø *,**
Country information Poland
4.3
6.5
Poland Globally

Shop the World 235
82+18
72+28
Number of returns per capita per year · Ø * Poland Globally
0.8
0.4
Return rate · in % * Poland Globally
5.9
Reasons for returns · Poland in % *
Defective product 26.5
Percentage of users who returned goods · in % *
18.3
81.7
Poland Globally
Yes No
“CUSTOMER JOURNEY“– RETURNSReturn-free zone
Returns are very rare in Poland. As little as every fifth distance selling client admits to a return and, with that, contributes to a return-rate of only 3.4% which is way below average. The main reasons for returns in Poland are defects to the products or their quality; however, these are of less importance than in international comparison. An-other reason that is listed with above-average frequency is a differing product description, or having ordered or received the wrong product. Problems based on ill-fitting, disliking or having ordered a selection of products emerge significantly less frequently.
27.5
72.5
* Source: DHL Global Mail 2013 ∙ n Global from 2,648 to 9,325 ∙ n Poland from 79 to 435
Differing product description
Delivery of the wrong product
Wrong product was ordered
Product did not fit
Ordered multiple variants to choose from
Delivery period too long
Found less expensive product
Deficient product quality
Product was not liked
24.8
18.7
15.3
19.2
2.6
3.7
Globally
32.3
30.0
17.8
13.3
8.5
37.7
29.9
15.5
5.8
3.9
23.9
14.0
Country information Poland
3.4
2.6
Country profile · Media Use · Distance selling · “Customer jour-ney“ · Drivers & barriers in distance selling · Cross-border shopping · Dialog marketing

Shop the World 236
High delivery costs
Uncertain delivery
Concern about misuse of payment data
No demand because all products are obtainable locally
Long delivery periods
Unknown product quality
No try-on possible before purchase
Complicated return of the products
No personal advice
No personal contact person for problems
Doubts regarding data protection or thedissemination of data to third parties
Concern about counterfeited products, product piracy
Product can only be obtained via distance selling
Easy price comparison
Shopping 24/7
Location-independent ordering
Higher product quality
Lower prices
Greater selection
Option to deliver to a preferred location
Country profile · Media Use · Distance selling · “Customer jour-ney“· Drivers & barriers in distance selling · Cross-border shopping · Dialog marketing
DRIVERS & BARRIERS IN DISTANCE SELLING Barriers
· Poland in % *
50.8
54.6
72.6
63.5
7.8
59.1
46.0
67.3
69.8
53.8
84.0
Globally
36.6
24.2
34.4
3.9
25.8
48.5
64.9
44.1
21.5
22.0
29.8
34.1
A host of good reasons
Polish mail order clients clear-ly are offenders by conviction: Comfortable delivery, high flex- ibility in time, and easy bar- gaining are all good reasons.
Drivers · Poland in % *
Globally
* Source: DHL Global Mail 2013 ∙ n Global from 10,509 to 10,864 ∙ n Poland from 492 to 500
54.9
68.5
83.1
68.0
7.5
34.9
38.4
23.2
2.0
15.8
52.5
75.3
40.2
20.0
13.8
30.6
49.7
Country information Poland

Shop the World 237
34+53+13
CROSS-BORDER SHOPPING – OVERVIEW
Previous orders abroad
Previous and future orders abroad by country · in % *
Great Britain[22.6]
Hong Kong[14.4]
1
2
3
4
5
USA[32.2]
Germany[32.1]
China[24.0]
Future orders abroad
Poland
* Source: DHL Global Mail 2013 ∙ n Global from 4,738 to 8,807 ∙ n Poland from 146 to 409 ** split into "further orders planned“ 30.4% Poland and "no further orders planned“ 3.7% Poland
Shopping without limits
As of now, Poland is a little be-hind on ordering from abroad; in the future, people intend to shop much more across the country's borders. 86.8% in-tend to order from abroad. The US and Germany are on the top ranks there; in the future, the German eCommerce mar-ket will benefit in particular. Highest growth rates are to be expected. Many other European neighbors, such as Great Britain and France, are also on the list of many consumers.
France[43.2]
Other European countries[42.6]
Germany[75.9]
USA[61.9]
Great Britain[47.6]
Country information Poland
Use of cross-border eCommerce · in % *
Yes, already ordered **No, but future orders planned No, no future orders planned
52.7 34.1
13.2
Country profile · Media Use · Distance selling · “Customer jour-ney“ · Drivers & barriers in distance selling · Cross-border shop-ping · Dialog marketing
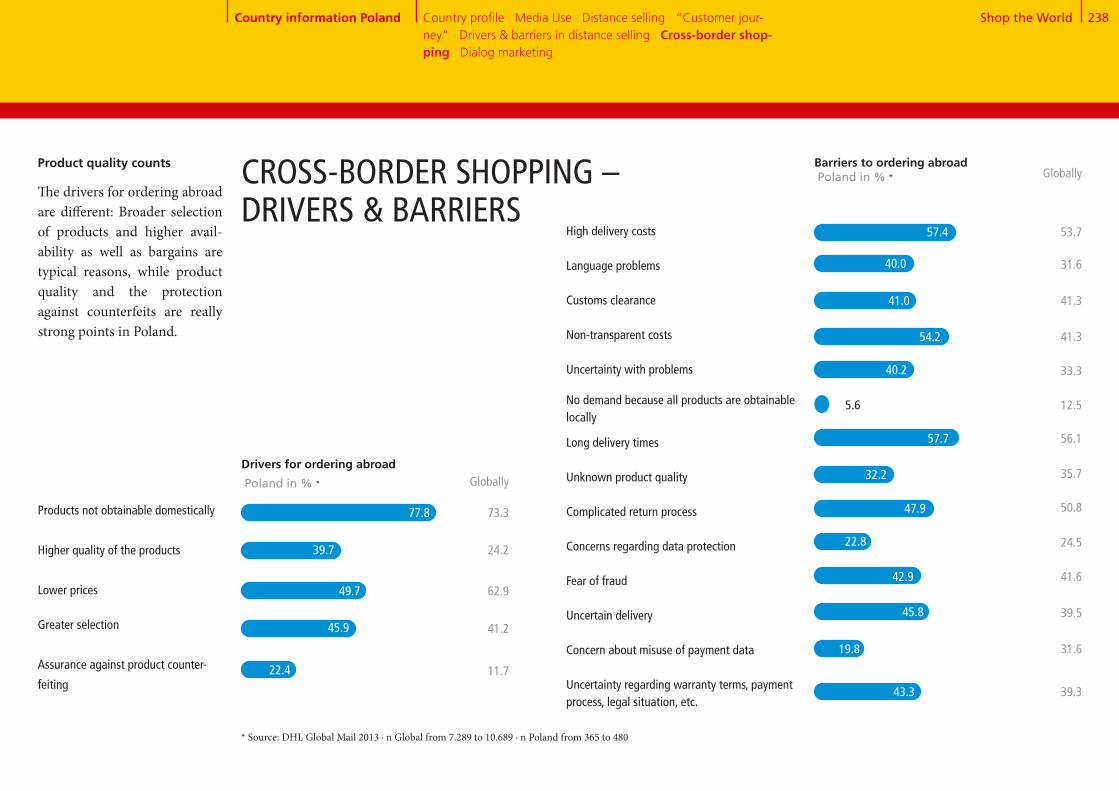
Shop the World 238
Products not obtainable domestically
Higher quality of the products
Lower prices
Greater selection
Assurance against product counter-
feiting
High delivery costs Language problems
Customs clearance
Non-transparent costs
Uncertainty with problems
No demand because all products are obtainable locally
Long delivery times
Unknown product quality
Complicated return process
Concerns regarding data protection Fear of fraud Uncertain delivery
Concern about misuse of payment data
Uncertainty regarding warranty terms, payment process, legal situation, etc.
Country profile · Media Use · Distance selling · “Customer jour-ney“ · Drivers & barriers in distance selling · Cross-border shop-ping · Dialog marketing
Drivers for ordering abroad
Poland in % *
Barriers to ordering abroad Poland in % *
Globally
73.3
24.2
62.9
41.2
11.7
Globally
53.7
31.6
41.3
41.3
33.3
12.5
56.1
35.7
50.8
24.5
41.6
39.5
31.6
39.3
Product quality counts
The drivers for ordering abroad are different: Broader selection of products and higher avail- ability as well as bargains are typical reasons, while product quality and the protection against counterfeits are really strong points in Poland.
CROSS-BORDER SHOPPING – DRIVERS & BARRIERS
* Source: DHL Global Mail 2013 ∙ n Global from 7.289 to 10.689 ∙ n Poland from 365 to 480
57.4
40.0
41.0
54.2
40.2
5.6
57.7
32.2
47.9
22.8
42.9
45.8
19.8
43.3
77.8
39.7
49.7
45.9
22.4
Country information Poland

Shop the World 239
Reception of mailings and catalogs · Poland in % *
5 and 63 and 41 and 2
DIALOG MARKETING
Reading mailings and catalogs
· in % *,**
Poland
Globally
19.9 31.7 48.4
22.1 35.2 42.7
5 and 63 and 41 and 2
Response to mailings and catalogs · in % *,**
Poland
Globally
31.9 45.9 22.2
29.0 45.8 25.3
Response channel for mailings and catalogs · Poland in % * Globally
Website visits
Visits to stores or
branch offices
Other online
response (e.g. chat,
Twitter, Facebook,
newsletter
registration, etc.)
Phone call
Business reply card
83.6 73.4
48.6
30.0
24.5
18.4
12.6
* Source: DHL Global Mail 2013 ∙ n Global from 8,788 to 11,265 ∙ n Poland from 376 to 509 ** scale from 1 "never“ to 6 "almost always“
Great pleasure in reading
Reception of mailings and cat- alogs via mail does not yet reach the international level. It is particularly positive, though, that above-average pleasure in reading and dealing with these mailings can be seen: 48.4% read intensively whatever finds its way into their mailboxes at home. The preferred response channels are diverse: The digital path to the provider is clearly preferred (visiting the website: 83.6%); however, people also like to go to a store. A short call or, particularly, is used by more consumers in Poland than on average.
Globally
One or more times per week
One or more times per month
Less than once per month
Never
26.9
33.7
27.7
11.6 61.4
38.7
37.7
22.8
25.1
18.5
32.6
39.9
9.0
Country information Poland Country profile · Media Use · Distance selling · “Customer jour-ney“ · Drivers & barriers in distance selling · Cross-border shop-ping · Dialog marketing
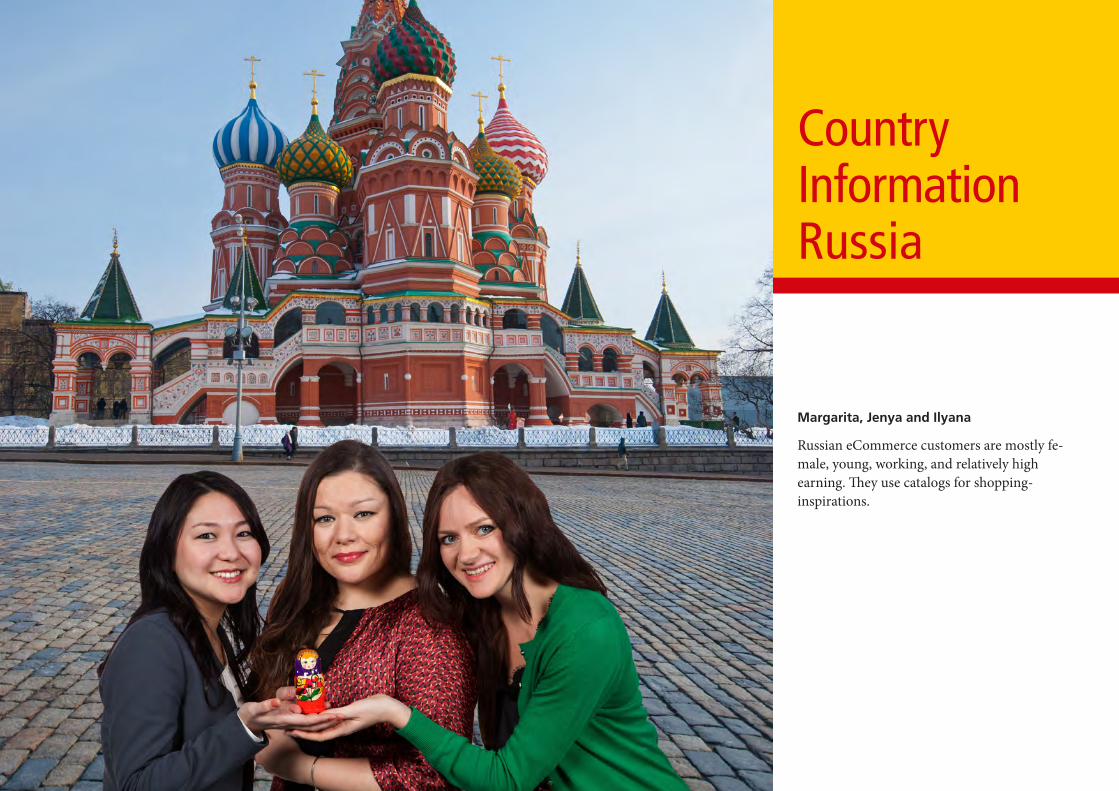
Country Information Russia
Margarita, Jenya and Ilyana
Russian eCommerce customers are mostly fe- male, young, working, and relatively high earning. They use catalogs for shopping- inspirations.
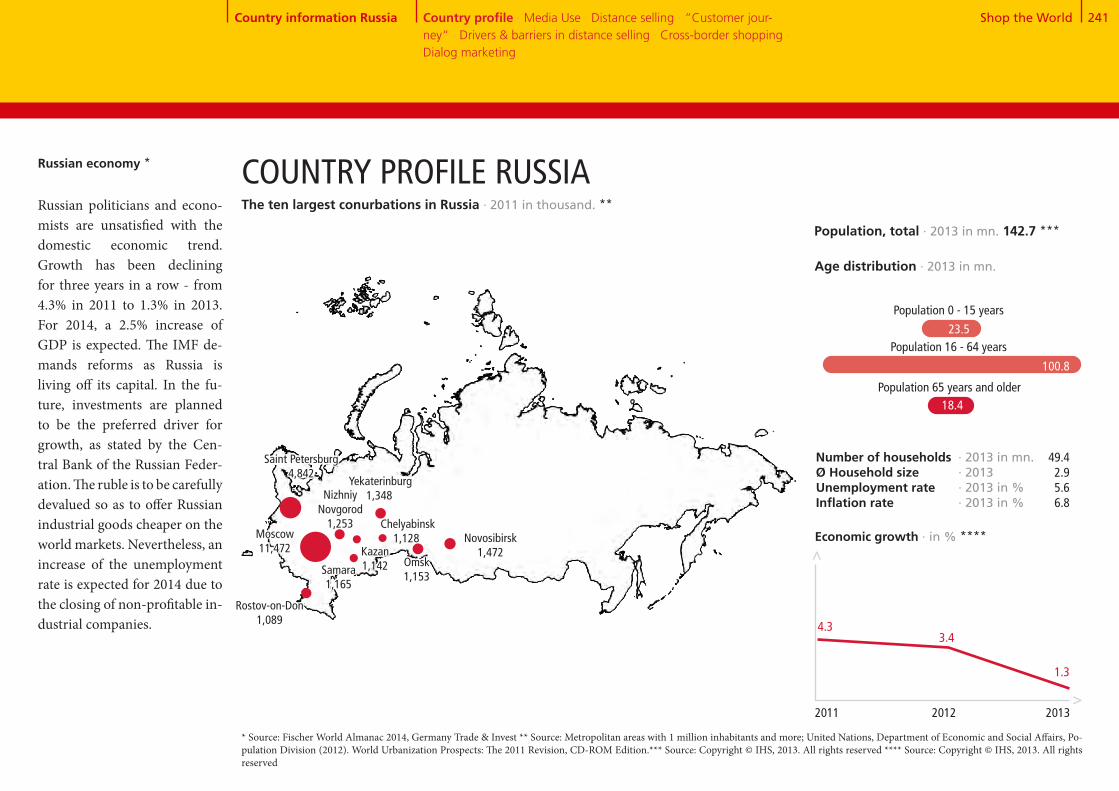
Shop the World 241
23.5
Population 0 - 15 years
Russian economy * COUNTRY PROFILE RUSSIA
Moscow 11,472
Saint Petersburg 4,842
* Source: Fischer World Almanac 2014, Germany Trade & Invest ** Source: Metropolitan areas with 1 million inhabitants and more; United Nations, Department of Economic and Social Affairs, Po-pulation Division (2012). World Urbanization Prospects: The 2011 Revision, CD-ROM Edition.*** Source: Copyright © IHS, 2013. All rights reserved **** Source: Copyright © IHS, 2013. All rights reserved
Number of households Ø Household sizeUnemployment rateInflation rate
3.4
Economic growth · in % ****
>
>
1.3
4.3
2011 2012 2013
Age distribution · 2013 in mn.
Population 65 years and older
Population, total · 2013 in mn. 142.7 ***
Country information Russia Country profile · Media Use · Distance selling · “Customer jour-ney“ · Drivers & barriers in distance selling · Cross-border shopping · Dialog marketing
Population 16 - 64 years
· 2013 in mn.· 2013· 2013 in %· 2013 in %
49.42.95.66.8
Russian politicians and econo- mists are unsatisfied with the domestic economic trend. Growth has been declining for three years in a row - from 4.3% in 2011 to 1.3% in 2013. For 2014, a 2.5% increase of GDP is expected. The IMF de-mands reforms as Russia is living off its capital. In the fu-ture, investments are planned to be the preferred driver for growth, as stated by the Cen-tral Bank of the Russian Feder- ation. The ruble is to be carefully devalued so as to offer Russian industrial goods cheaper on the world markets. Nevertheless, an increase of the unemployment rate is expected for 2014 due to the closing of non-profitable in-dustrial companies.
100.8
18.4
Novosibirsk 1,472
Yekaterinburg1,348
Chelyabinsk 1,128
Samara1,165
NizhniyNovgorod
1,253
Omsk 1,153
Rostov-on-Don 1,089
Kazan1,142
The ten largest conurbations in Russia · 2011 in thousand. **
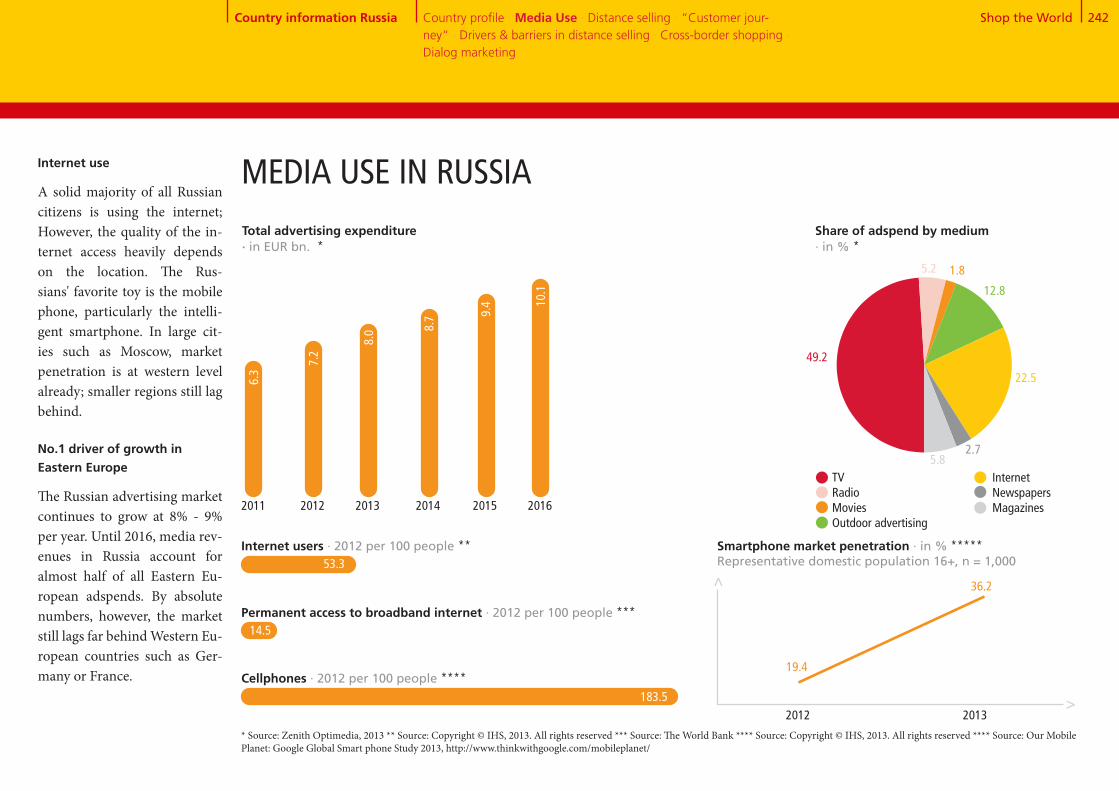
Shop the World 242
49+5+2+12+23+3+6MEDIA USE IN RUSSIA
14.5
183.5
Smartphone market penetration · in % *****Representative domestic population 16+, n = 1,000
19.4
Internet users · 2012 per 100 people **
Permanent access to broadband internet · 2012 per 100 people ***
Cellphones · 2012 per 100 people ****
2012 2013
36.2
Share of adspend by medium · in % *
TV Radio Movies Outdoor advertising
Total advertising expenditure · in EUR bn. *
Internet Newspapers Magazines
>>
* Source: Zenith Optimedia, 2013 ** Source: Copyright © IHS, 2013. All rights reserved *** Source: The World Bank **** Source: Copyright © IHS, 2013. All rights reserved **** Source: Our Mobile Planet: Google Global Smart phone Study 2013, http://www.thinkwithgoogle.com/mobileplanet/
2011 2012 2013 2014 2015
9.4
53.3
8.7
8.0
7.2
6.3
2016
10.1
Country information Russia Country profile · Media Use · Distance selling · “Customer jour-ney“ · Drivers & barriers in distance selling · Cross-border shopping · Dialog marketing
22.5
2.75.8
12.8
1.85.2
49.2
Internet use
A solid majority of all Russian citizens is using the internet; However, the quality of the in-ternet access heavily depends on the location. The Rus- sians' favorite toy is the mobile phone, particularly the intelli-gent smartphone. In large cit-ies such as Moscow, market penetration is at western level already; smaller regions still lag behind.
No.1 driver of growth in Eastern Europe
The Russian advertising market continues to grow at 8% - 9% per year. Until 2016, media rev- enues in Russia account for almost half of all Eastern Eu-ropean adspends. By absolute numbers, however, the market still lags far behind Western Eu-ropean countries such as Ger-many or France.

Shop the World 243
Everything for homes and gardens
Russia is the largest distance selling market in Eastern Eu- rope. Russian customers order consumer electronics in dis-tinctly above-average num-bers. Also, they enjoy working in their homes and gardens, as shown by the comparably high orders of household appliances and gardening equipment.
DISTANCE SELLING IN RUSSIA
4.681.6
Apparel and footwear
4.495.8
2.763.4
2,439.3
1,971.7
1,473.3
950.7
832.8
736.4
1,244.8
716.5
1,309.5
950.3
210.6
249.1
131.3
60.1
Consumer electronics,
computers + equipment
Media products (books, CDs,
DVDs, etc.)
Housewares and home
furnishings + textiles
Food + beverages
Household and consumer
appliances
Beauty and personal care
DIY and gardening
OTC drugs and dietary supple-
ments
Traditional toys and games
House cleaning (detergent, chastener, etc.)
Development of distance selling and share of total retail 2011 - 2018 · in EUR bn. *
CAGR: 11.9%
Home shopping
Online shopping6.5 8.8 11.2
2.62.8
3.2
13.8 21.9
3.3
3.4
2011 2012 2013e 2014e 2018e
Share of total retail · in % 2.8 3.2 3.6 4.1 5.0
* Source: Euromonitor International
2,723.2
32.1
Country information Russia Country profile · Media Use · Distance selling · “Customer jour-ney“ · Drivers & barriers in distance selling · Cross-border shopping · Dialog marketing
346.0
550.3
389.7
Distance selling purchases in 2013 - trend for 2018 · in EUR mn. * 2013 2018

Shop the World 244
84+16
78+22
Great potential
More than three quarters of all respondents order via dis- tance selling. In the future, an in- crease in both the number of customers and the frequency of ordering is expected.
Use of distance selling · in % *
78.0
22.0
Russia
Globally
83.5
16.5
Number of orders in the previous year · in % *
1 to 5 orders
6 to 10 orders
11 to 20 orders
More than 20 orders
No orders
15.1
48.5
10.0
22.0
4.5
20.5
35.9
15.2
16.5
12.0
Future ordering behavior (current users) · in % *
More frequently than in the last
12 months
Just as frequently as in the last
12 months
Less frequently than in the last
12 months
45.3
49.6
55.2
38.8
5.1 6.1
Non-users of distance selling - future plans · in % *
Yes71.4
Russia
Globally
Yes70.5
No28.6
No29.5
Yes No
Russia Globally Russia Globally
DISTANCE SELLING IN RUSSIA
* Source: DHL Global Mail 2013 ∙ n Global from 1,275 to 11,265 ∙ n Russia from 70 to 512
Country information Russia Country profile · Media Use · Distance selling · “Customer jour-ney“ · Drivers & barriers in distance selling · Cross-border shopping · Dialog marketing

Shop the World 245
Globally*
46.4
Gender · in % Male Female
Age · in % <30 yrs. 30-49 yrs. 50 yrs. +
Occupation · in % Employed Unemployed
Education · in % Lower educational level Medium and higher level of education
1.5
Media affinity: Online · in % yes**
Community size · in % Rural (<50,000 inhabitants) Non-rural/urban (>50,000 inhabitants)
Minors in the household · Ø
Household type · in % Single 2-person household without children Household with children Household with 3 adults
Mobile Internet usage · in % Yes No
Gross household income · in % Low income Medium income High income
Media affinity: Classic · in % yes**
Media affinity: Dialog marketing · in % yes** 57.0
37.7
88.5
54.127.0
18.8
35.564.5
14.663.8
63.3
35.8
36.7
13.7
98.5
87.1
1.0
17.04.6
86.3Heavy users are female
Almost wo thirds of the Russian heavy users are female. Com- pared with the global aver- age, they are rather young, well educated, live in households with children and have an com-parably high household in- come. Affinity towards media is rather high, especially dialog marketing is particularly popu-lar in this target group.
DISTANCE SELLING IN RUSSIA
* Source: DHL Global Mail 2013 ∙ n Global from 2,661 to 11,265 ∙ n Russia from 111 to 512 ** media affinity for online / classic / dialog marketing, if at least one medium from the respective area was rated 5 or 6 on a scale of 1 "absolutely not useful" to 6 "very useful" *** the top third of most active users
44.327.1
14.4
36.4
46.9
36.5
80.8
33.734.232.1
45.754.3
22.443.0
50.0
28.6
50.0
29.4
85.6
63.6
0.7
23.411.2
70.6
Country information Russia Country profile · Media Use · Distance selling · “Customer jour-ney“ · Drivers & barriers in distance selling · Cross-border shopping · Dialog marketing
***
Russia*
44.028.7
2.3
15.0
51.2
35.4
84.1
35.729.434.9
46.853.2
21.149.8
52.4
27.4
47.6
21.7
97.7
85.0
0.7
22.96.3
78.3
17.8
12.9
Heavy users* Global heavy users*

Shop the World 246
“CUSTOMER JOURNEY“ – SEARCHING FOR PRODUCT INFORMATION
Search for product information · Russia in % * Globally
41.6 35.5
53.2
28.3 23.4
40.9 44.2
22.3 23.9
42.4 45.8
29.8 42.5
36.9 25.1
15.3 15.1
18.3 15.1
6.0 9.7
36.3 37.8
Criteria for choosing a vendor · Russia in % * Globally
Search engines 50.6
Customer ratings in blogs or forums
Product test ratings / expert test reports
Product check in a retail store
Retailer or manufacturer website
Online marketplace
Catalog
Mail advertising
Social media platforms such as Face-book and Twitter
Apps (on smartphone, iPad, or tablet)
Recommendations from friends, acquaintances, and colleagues
36.3 40.6Customer ratings on the supplier‘s website
Price comparison sites
Large selection of products
Recommendation and experiences of friends, acquaintances, and colleagues
Official test seals, reviews, and test reports of independent institutions
Attractive product line
Favorable prices, promotions, & special offers
Straightforward return process
Free returns
Choice of preferred payment methods
Fast delivery
Free delivery
Good customer service
Positive customer ratings on the internet
18.0 13.7
20.7
7.5 8.8
28.5 26.6
20.9 14.9
54.7 51.7
11.1 12.9
12.4 20.8
24.3 22.6
20.3 25.7
44.9 45.2
15.5 18.5
30.2
Catalog highly popular
In Russia, the use of online marketplaces is still relatively insignificant. Instead, catalogs are used comparatively often to find inspiration for purchases.
* Source: DHL Global Mail 2013 ∙ n Global from 9,386 to 10,617 ∙ n Russia from 399 to 477, multiple mentioning
Country information Russia Country profile · Media Use · Distance selling · “Customer jour-ney“ · Drivers & barriers in distance selling · Cross-border shopping · Dialog marketing

Shop the World 247
Usefulness of advertising media · in % *, **
5 and 63 and 41 and 2
Ø
42.829.1 28.126.1 43.8 30.1
Online advertising
* Source: DHL Global Mail 2013 ∙ n Global from 10,218 to 10,384 ∙ n Russia from 460 to 473 ** scale from 1 "absolutely not useful" to 6 "very useful“
Useful research tools
In Russia, research via search engines and price-comparison sites is seen as the most useful source when searching for de- sired products. The high affinity towards catalogs comes again visible: 45.3% assign top grades for their usefulness.
ACCEPTANCE OF ADVERTISING MEDIA
RussiaGlobally
Country information Russia Country profile · Media Use · Distance selling · “Customer jour-ney“ · Drivers & barriers in distance selling · Cross-border shopping · Dialog marketing
Television advertising
5 and 63 and 41 and 2
3.53.6
Ø
44.034.2 21.830.6 41.8 27.6
3.23.4
38.944.4 16.838.7 40.4 20.9Social media
RussiaGlobally
Advertising letters
2.93.1
40.428.5 31.133.9 37.6 28.5
3.53.4
Product suggestions in online shops
40.914.9 44.218.9 45.1 36.0
4.13.9
27.54.5 68.16.5 28.7 64.8
4.94.8
32.49.4 58.29.1 31.7 59.1
4.64.6
46.735.2 18.129.9 43.9 26.2
RussiaGlobally
Household advertising
3.13.4
46.431.2 22.529.0 46.7 24.3
RussiaGlobally
Advertisements in mag- azines and periodicals
3.33.4
40.442.6 17.034.8 43.1 22.1
RussiaGlobally
Advertisements in newspapers
3.03.2
43.140.1 16.941.8 40.7 17.6
RussiaGlobally
Billboard advertise-ments
3.03.0
37.945.7 16.444.3 38.8 16.9
RussiaGlobally
Radio
2.82.9
42.212.5 45.319.3 44.2 36.6
RussiaGlobally
Catalogs from vendors
4.23.9
RussiaGlobally
RussiaGlobally
RussiaGlobally
Internet search engines
RussiaGlobally
Price comparison sites
RussiaGlobally
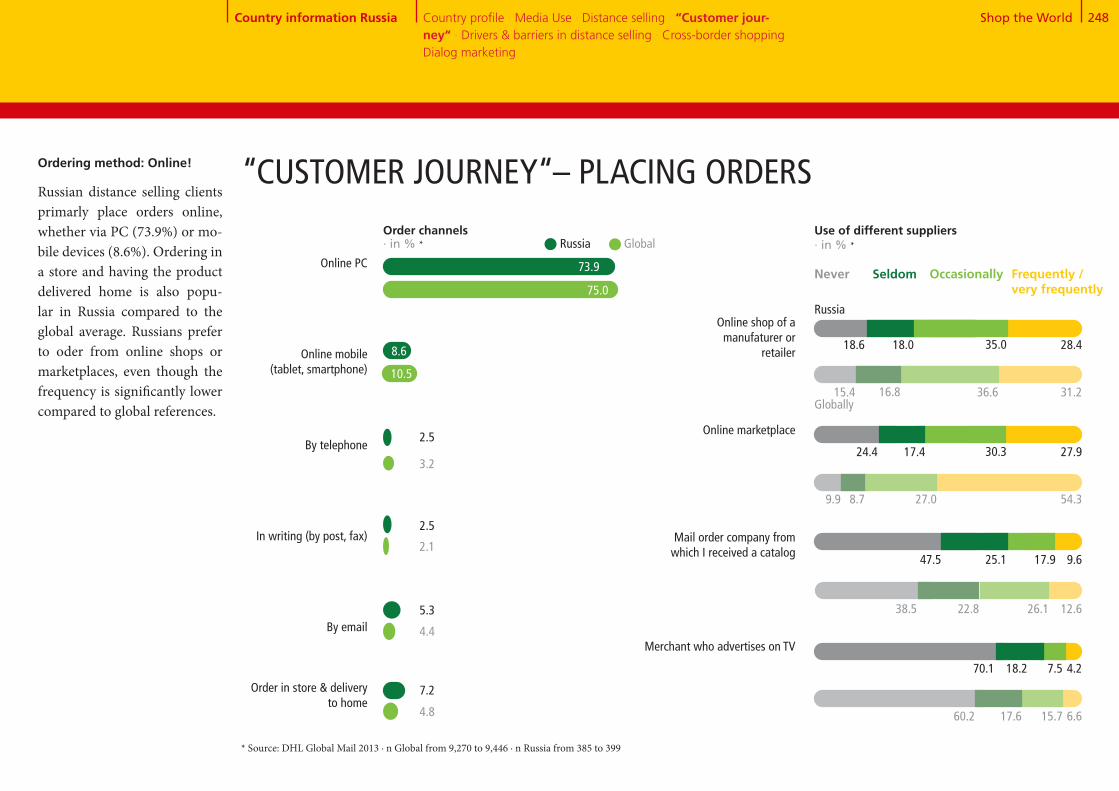
Shop the World 248
SeldomOnline PC
Online mobile (tablet, smartphone)
By telephone
In writing (by post, fax)
By email
Order in store & delivery to home
Online marketplace
Mail order company from which I received a catalog
Merchant who advertises on TV
Online shop of a manufaturer or
retailer
Use of different suppliers · in % *
Never Frequently / very frequently
Occasionally
* Source: DHL Global Mail 2013 ∙ n Global from 9,270 to 9,446 ∙ n Russia from 385 to 399
Russia Global
73.9
2.5
2.5
5.3
75.0
3.2
2.1
4.4
“CUSTOMER JOURNEY“– PLACING ORDERSOrdering method: Online!
Russian distance selling clients primarly place orders online, whether via PC (73.9%) or mo-bile devices (8.6%). Ordering in a store and having the product delivered home is also popu-lar in Russia compared to the global average. Russians prefer to oder from online shops or marketplaces, even though the frequency is significantly lower compared to global references.
18.6 28.418.0
15.4 31.216.8
35.0
36.6
Russia
Globally
24.4 27.917.4
9.9 54.38.7
30.3
27.0
47.5 9.625.1
38.5 12.622.8
17.9
26.1
70.1 4.218.2
60.2 6.617.6
7.5
15.7
8.6
10.5
7.2
4.8
Order channels · in % *
Country information Russia Country profile · Media Use · Distance selling · “Customer jour-ney“ · Drivers & barriers in distance selling · Cross-border shopping · Dialog marketing
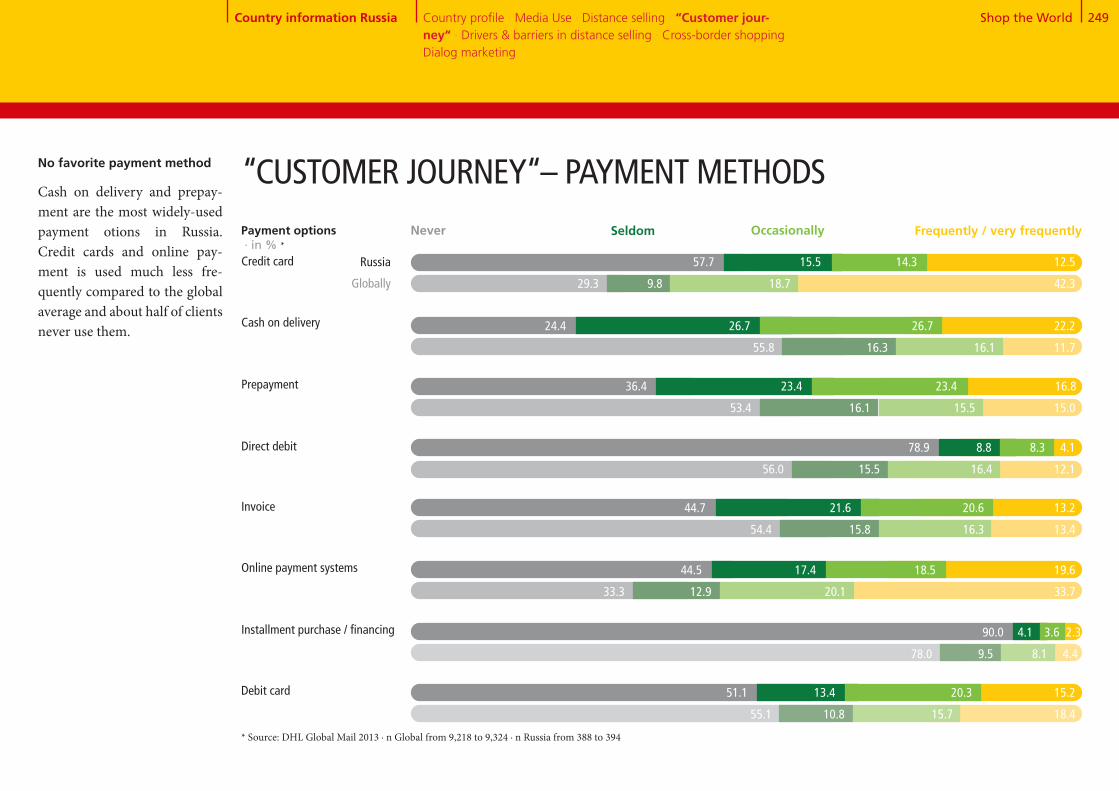
Shop the World 249
No favorite payment method
Cash on delivery and prepay-ment are the most widely-used payment otions in Russia. Credit cards and online pay-ment is used much less fre-quently compared to the global average and about half of clients never use them. Cash on delivery
Prepayment
Direct debit
Credit card
* Source: DHL Global Mail 2013 ∙ n Global from 9,218 to 9,324 ∙ n Russia from 388 to 394
“CUSTOMER JOURNEY“– PAYMENT METHODS
Online payment systems
Installment purchase / financing
Debit card
Invoice
Payment options · in % *
Never Frequently / very frequentlyOccasionally
Russia
Globally
57.7 15.5 14.3 12.5
29.3 9.8 18.7 42.3
24.4 26.7 26.7 22.2
55.8 16.3 16.1 11.7
36.4 23.4 23.4 16.8
53.4 16.1 15.5 15.0
78.9 8.8 8.3 4.1
56.0 15.5 16.4 12.1
44.7 21.6 20.6 13.2
54.4 15.8 16.3 13.4
44.5 17.4 18.5 19.6
33.3 12.9 20.1 33.7
90.0 4.1 3.6 2.3
78.0 9.5 8.1 4.4
51.1 13.4 20.3 15.2
55.1 10.8 15.7 18.4
Country information Russia Country profile · Media Use · Distance selling · “Customer jour-ney“ · Drivers & barriers in distance selling · Cross-border shopping · Dialog marketing
Seldom
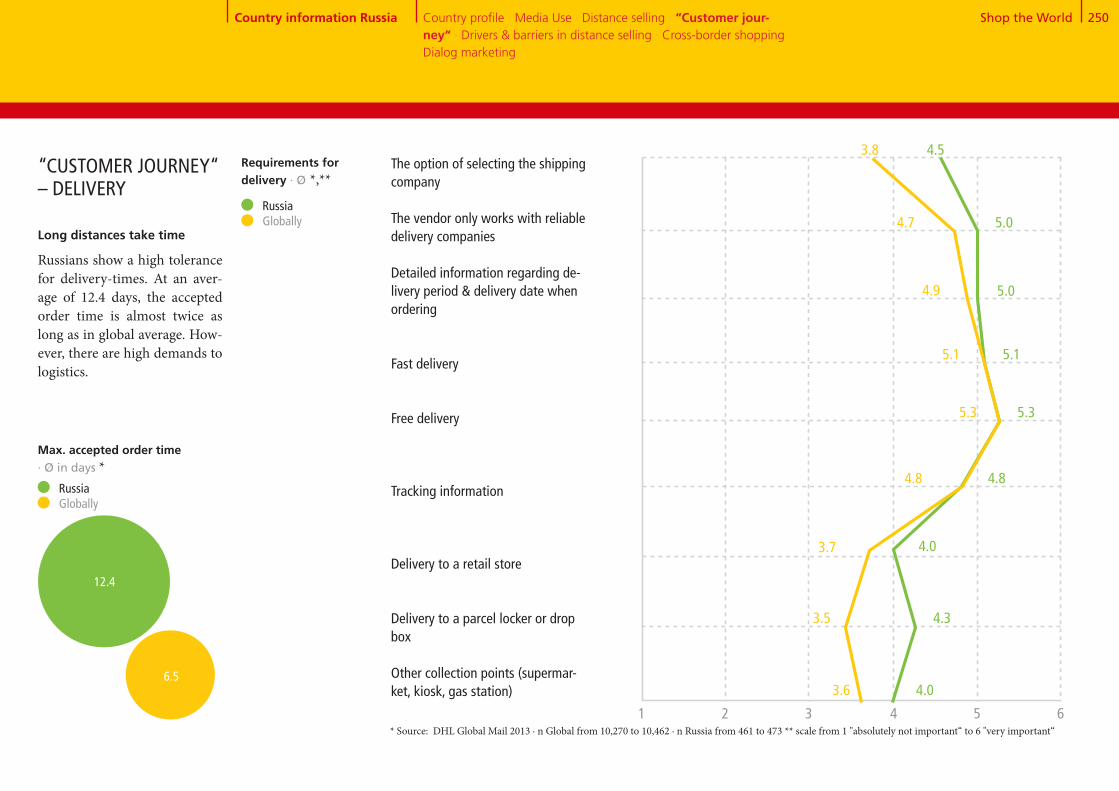
Shop the World 250
The option of selecting the shipping company The vendor only works with reliable delivery companies
Detailed information regarding de-livery period & delivery date when ordering
Fast delivery
Free delivery
Tracking information
Delivery to a retail store
Delivery to a parcel locker or drop box
Other collection points (supermar-ket, kiosk, gas station)
Russia Globally
4.0
4.3
4.0
5.3
4.8
5.1
4.5
5.0
5.0
Max. accepted order time · Ø in days *
3.6
3.5
3.7
5.3
4.8
5.1
3.8
4.9
4.7
* Source: DHL Global Mail 2013 ∙ n Global from 10,270 to 10,462 ∙ n Russia from 461 to 473 ** scale from 1 "absolutely not important“ to 6 "very important“
Long distances take time
Russians show a high tolerance for delivery-times. At an aver-age of 12.4 days, the accepted order time is almost twice as long as in global average. How-ever, there are high demands to logistics.
“CUSTOMER JOURNEY“ – DELIVERY
1 2 3 4 5 6
Requirements for delivery · Ø *,**
Country information Russia Country profile · Media Use · Distance selling · “Customer jour-ney“ · Drivers & barriers in distance selling · Cross-border shopping · Dialog marketing
12.4
6.5
Russia Globally
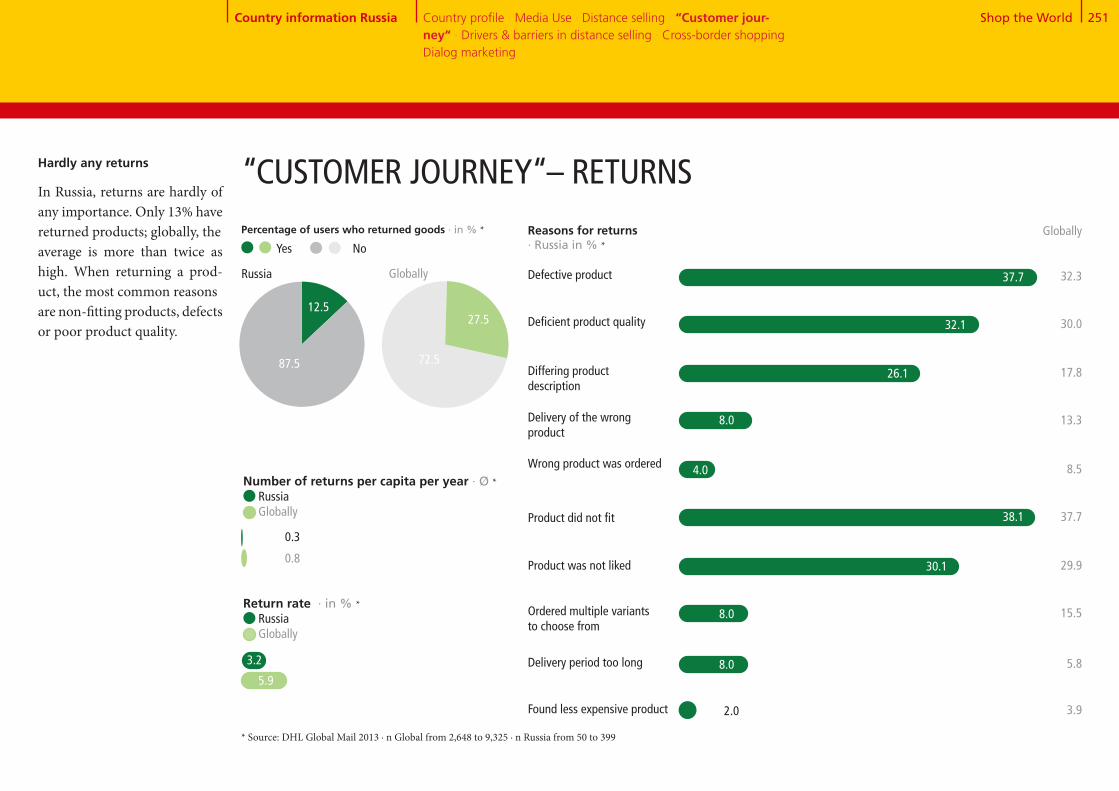
Shop the World 251
13+87
72+28
Number of returns per capita per year · Ø * Russia Globally
0.8
0.3
Return rate · in % * Russia Globally
5.9
Reasons for returns · Russia in % *
Defective product 37.7
Percentage of users who returned goods · in % *
12.5
87.5
Russia Globally
Yes No
“CUSTOMER JOURNEY“– RETURNSHardly any returns
In Russia, returns are hardly of any importance. Only 13% have returned products; globally, theaverage is more than twice as high. When returning a prod-uct, the most common reasonsare non-fitting products, defectsor poor product quality.
27.5
72.5
* Source: DHL Global Mail 2013 ∙ n Global from 2,648 to 9,325 ∙ n Russia from 50 to 399
Differing product description
Delivery of the wrong product
Wrong product was ordered
Product did not fit
Ordered multiple variants to choose from
Delivery period too long
Found less expensive product
Deficient product quality
Product was not liked
26.1
8.0
38.1
30.1
8.0
8.0
2.0
Globally
32.3
30.0
17.8
13.3
8.5
37.7
29.9
15.5
5.8
3.9
32.1
4.0
Country information Russia Country profile · Media Use · Distance selling · “Customer jour-ney“ · Drivers & barriers in distance selling · Cross-border shopping · Dialog marketing
3.2

Shop the World 252
High delivery costs
Uncertain delivery
Concern about misuse of payment data
No demand because all products are obtainable locally
Long delivery periods
Unknown product quality
No try-on possible before purchase
Complicated return of the products
No personal advice
No personal contact person for problems
Doubts regarding data protection or the dissemination of data to third parties
Concern about counterfeited products, product piracy
Product can only be obtained via distance selling
Easy price comparison
Shopping 24/7
Location-independent ordering
Higher product quality
Lower prices
Greater selection
Option to deliver to a preferred location
DRIVERS & BARRIERS IN DISTANCE SELLING Barriers
· Russia in % *
50.8
54.6
72.6
63.5
7.8
59.1
46.0
67.3
55.4
48.1
40.7
Globally
36.6
24.2
34.4
3.9
25.8
48.5
64.9
44.1
21.5
22.0
29.8
34.1
Exclusive products
Exclusivity of the products is a strong driver for eCommerce in Russia. Major barriers are the questionable product qual-ity and concerns about product piracy.
Drivers · Russia in % *
Globally
* Source: DHL Global Mail 2013 ∙ n Global from 10,509 to 10,864 ∙ n Russia from 471 to 505
67.3
44.8
68.8
56.1
6.1
35.3
28.2
22.0
3.8
46.3
62.6
66.4
48.4
19.0
24.1
28.7
51.1
Country information Russia Country profile · Media Use · Distance selling · “Customer jour-ney“ · Drivers & barriers in distance selling · Cross-border shopping · Dialog marketing
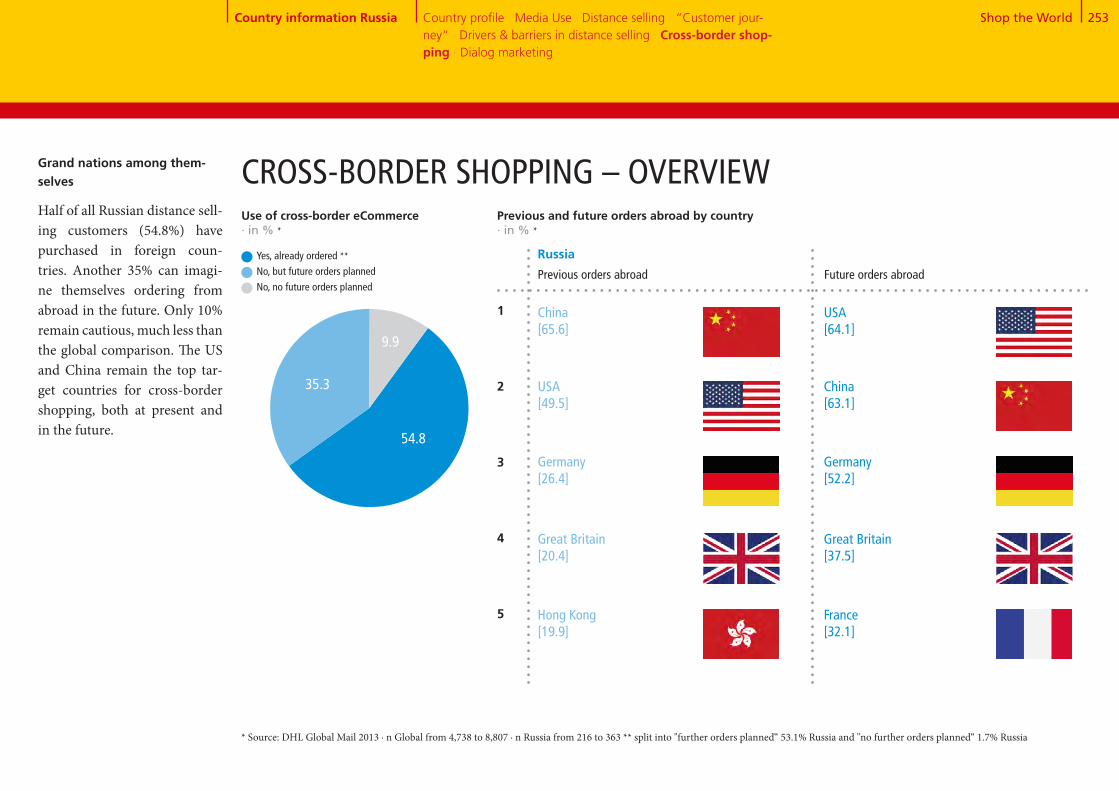
Shop the World 253
55+35+10CROSS-BORDER SHOPPING – OVERVIEW
Previous orders abroad
Previous and future orders abroad by country · in % *
Great Britain[20.4]
Hong Kong[19.9]
1
2
3
4
5
China[65.6]
USA[49.5]
Germany[26.4]
Future orders abroad
Russia
* Source: DHL Global Mail 2013 ∙ n Global from 4,738 to 8,807 ∙ n Russia from 216 to 363 ** split into "further orders planned“ 53.1% Russia and "no further orders planned“ 1.7% Russia
Grand nations among them-selves
Half of all Russian distance sell-ing customers (54.8%) have purchased in foreign coun-tries. Another 35% can imagi-ne themselves ordering from abroad in the future. Only 10% remain cautious, much less than the global comparison. The US and China remain the top tar-get countries for cross-border shopping, both at present and in the future.
Great Britain[37.5]
France[32.1]
USA[64.1]
China[63.1]
Germany[52.2]
Country information Russia Country profile · Media Use · Distance selling · “Customer jour-ney“ · Drivers & barriers in distance selling · Cross-border shop-ping · Dialog marketing
Use of cross-border eCommerce· in % *
Yes, already ordered **No, but future orders planned No, no future orders planned
35.3
54.8
9.9

Shop the World 254
Products not obtainable domestically
Higher quality of the products
Lower prices
Greater selection
Assurance against product counter-
feiting
High delivery costs Language problems
Customs clearance
Non-transparent costs
Uncertainty with problems
No demand because all products are obtainable locally
Long delivery times
Unknown product quality
Complicated return process
Concerns regarding data protection Fear of fraud Uncertain delivery
Concern about misuse of payment data
Uncertainty regarding warranty terms, payment process, legal situation, etc.
Drivers for ordering abroad
· Russia in % *
Barriers to ordering abroad · Russia in % *
Globally
73.3
24.2
62.9
41.2
11.7
Globally
53.7
31.6
41.3
41.3
33.3
12.5
56.1
35.7
50.8
24.5
41.6
39.5
31.6
39.3
Lower prices are tempting
The strongest drivers for foreignorders are lower prices and the availability of products. How-ever, some of the major barriers for purchasing abroad include long delivery times and compli-cated returns processes.
CROSS-BORDER SHOPPING – DRIVERS & BARRIERS
* Source: DHL Global Mail 2013 ∙ n Global from 7,289 to 10,689 ∙ n Russia from 347 to 497
46.1
37.0
39.0
43.7
34.0
12.3
60.2
41.2
52.7
21.5
35.7
34.3
17.9
38.3
68.9
46.4
73.5
53.6
33.2
Country information Russia Country profile · Media Use · Distance selling · “Customer jour-ney“ · Drivers & barriers in distance selling · Cross-border shop-ping · Dialog marketing

Shop the World 255
Receipt of mailings and catalogs · Russia in % *
5 and 63 and 41 and 2
DIALOG MARKETING
Reading mailings and catalogs · in % *,**
Russia
Globally
27.4 35.5 37.0
22.1 35.2 42.7
5 and 63 and 41 and 2
Response to mailings and catalogs · in % *,**
Russia
Globally
31.1 44.9 24.1
29.0 45.8 25.3
Response channel for mailings and catalogs · Russia in % * Globally
Website visits
Visits to stores or
branch offices
Other online
response (e.g. chat,
Twitter, Facebook,
newsletter
registration, etc.)
Phone call
Business reply card
77.6 73.4
48.6
30.0
24.5
18.4
12.6
* Source: DHL Global Mail 2013 ∙ n Global from 8,788 to 11,265 ∙ n Russia from 383 to 512 ** scale from 1 "never“ to 6 "almost always“
Cautious behavior
Mailing frequency in Russia is slightly below the global aver-age. Russians also read and re-spond to direct marketing ini- tiatives less often. By far the most common response chan-nel is visiting the provider‘s website. Clients also pay a visit to the local store.
Globally
One or more times per week
One or more times per month
Less than once per month
Never
26.9
33.7
27.7
11.6 41.5
31.3
21.1
15.9
13.0
22.1
36.7
29.9
11.3
Country information Russia Country profile · Media Use · Distance selling · “Customer jour-ney“ · Drivers & barriers in distance selling · Cross-border shop-ping · Dialog marketing

Country Information South Korea
Jacklyn
South Korean distance selling clients live in large households in urban areas. They are price-sensitive, love advertising and like to shop in the US.
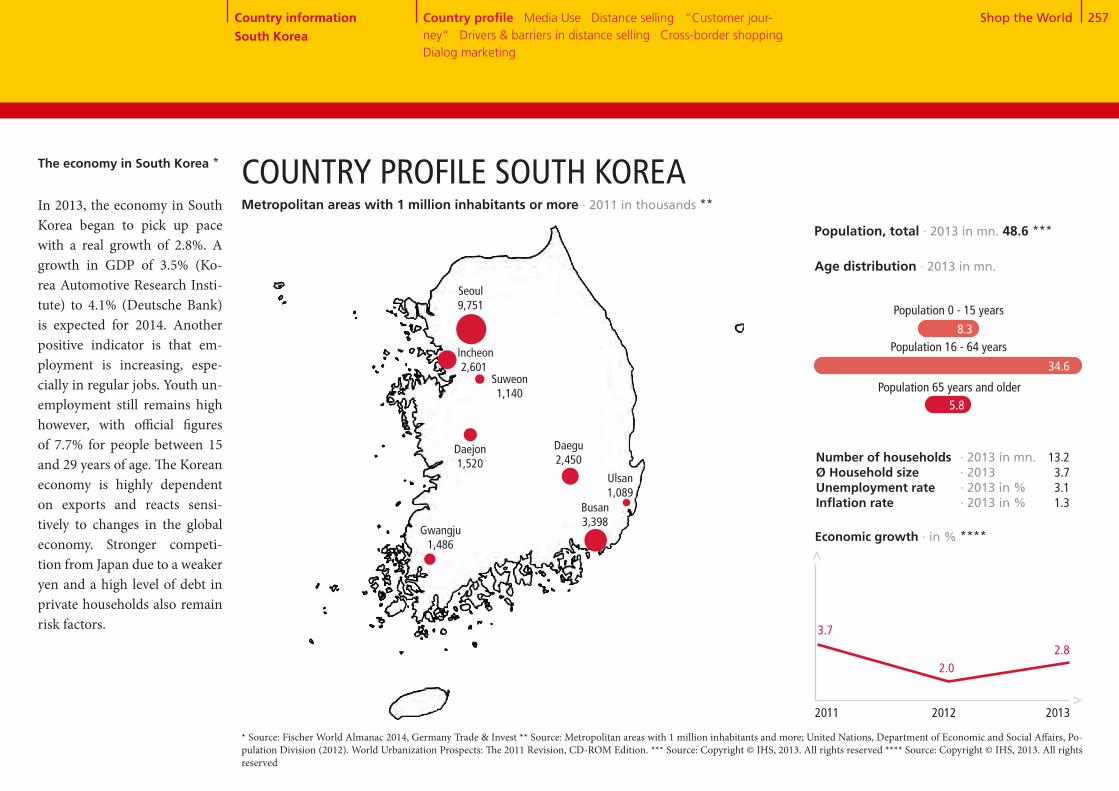
Shop the World 257Country information South Korea
8.3
Population 0 - 15 years
The economy in South Korea * COUNTRY PROFILE SOUTH KOREA
Seoul 9,751
* Source: Fischer World Almanac 2014, Germany Trade & Invest ** Source: Metropolitan areas with 1 million inhabitants and more; United Nations, Department of Economic and Social Affairs, Po-pulation Division (2012). World Urbanization Prospects: The 2011 Revision, CD-ROM Edition. *** Source: Copyright © IHS, 2013. All rights reserved **** Source: Copyright © IHS, 2013. All rights reserved
Number of households Ø Household sizeUnemployment rateInflation rate
2.0
Economic growth · in % ****
>
>
2.8
3.7
2011 2012 2013
Age distribution · 2013 in mn.
Population 65 years and older
Population, total · 2013 in mn. 48.6 ***
Population 16 - 64 years
· 2013 in mn.· 2013· 2013 in %· 2013 in %
13.23.73.11.3
In 2013, the economy in South Korea began to pick up pace with a real growth of 2.8%. A growth in GDP of 3.5% (Ko-rea Automotive Research Insti- tute) to 4.1% (Deutsche Bank) is expected for 2014. Another positive indicator is that em-ployment is increasing, espe- cially in regular jobs. Youth un-employment still remains high however, with official figures of 7.7% for people between 15 and 29 years of age. The Korean economy is highly dependent on exports and reacts sensi- tively to changes in the global economy. Stronger competi- tion from Japan due to a weaker yen and a high level of debt in private households also remain risk factors.
34.6
5.8
Metropolitan areas with 1 million inhabitants or more · 2011 in thousands **
Daegu 2,450
Daejon 1,520
Gwangju 1,486
Busan 3,398
Incheon 2,601
Suweon 1,140
Ulsan 1,089
Country profile · Media Use · Distance selling · “Customer jour-ney“ · Drivers & barriers in distance selling · Cross-border shopping · Dialog marketing

Shop the World 258
38+2+1+4+30+21+4
Country information South Korea
MEDIA USE IN SOUTH KOREA
37.6
110.4
Smartphone market penetration · in % *****Representative domestic population 16+, n = 1,000
Internet users · 2012 per 100 people **
Permanent access to broadband internet · 2012 per 100 people ***
Cellphones · 2012 per 100 people ****
2013
Internet use
Nowhere in the world are smartphones as popular as in South Korea. 73% of the population own a smartphone. In the global race to provide the fastest mobile internet, the government in Seoul is pushing ahead with plans to extend the internet with broadband cables, which should allow users to surf at previously unattained speeds.
High-speed internet and mobile ads
Advertising expenditures are expected to grow by 7.9% in 2014. Especially mobile ad spending will increase with the development of smartphones and tablets. Various advertis- ing platforms based on smart- phones have emerged.
Share of adspend by medium · in % *
TV Radio Movies Outdoor advertising
Total advertising expenditure · in EUR bn. *
Internet Newspapers Magazines
>>
* Source: Zenith Optimedia, 2013 ** Source: Copyright © IHS, 2013. All rights reserved *** Source: The World Bank **** Source: Copyright © IHS, 2013. All rights reserved **** Source: Our Mobile Planet: Google Global Smart phone Study 2013, http://www.thinkwithgoogle.com/mobileplanet/
2011 2012 2013 2014 201510
.1
84.1
8.9
8.38.4
7.8
2016
10.8 30.4
21.6
3.6
3.70.7
1.6
38.4
73.0
Country profile · Media Use · Distance selling · “Customer jour-ney“ · Drivers & barriers in distance selling · Cross-border shopping · Dialog marketing
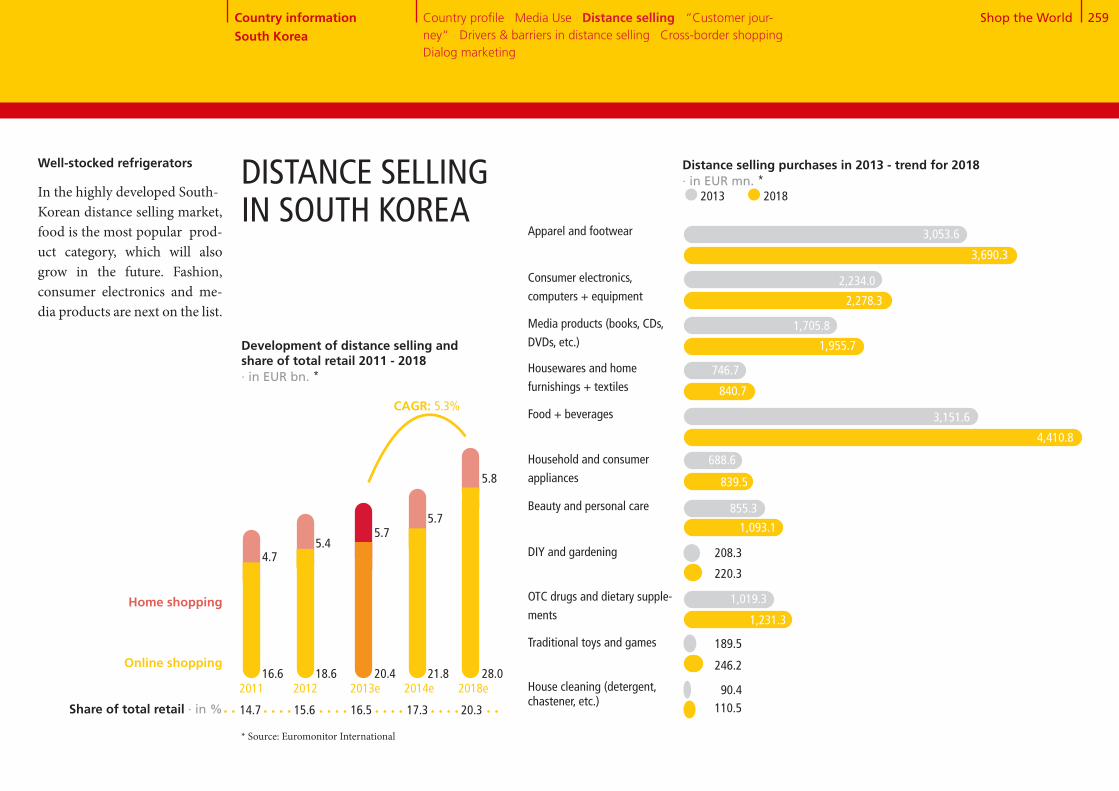
Shop the World 259
Distance selling purchases in 2013 - trend for 2018 · in EUR mn. * 2013 2018
Well-stocked refrigerators
In the highly developed South-Korean distance selling market, food is the most popular prod-uct category, which will also grow in the future. Fashion, consumer electronics and me-dia products are next on the list.
DISTANCE SELLING IN SOUTH KOREA
3,690.3
Apparel and footwear
2,278.3
2,234.0
1,955.7
1,705.8
840.7
746.7
4,410.8
688.6
839.5
1,093.1
220.3
208.3
1,019.3
246.2
189.5
110.5
Consumer electronics,
computers + equipment
Media products (books, CDs,
DVDs, etc.)
Housewares and home
furnishings + textiles
Food + beverages
Household and consumer
appliances
Beauty and personal care
DIY and gardening
OTC drugs and dietary supple-
ments
Traditional toys and games
House cleaning (detergent, chastener, etc.)
Development of distance selling and share of total retail 2011 - 2018 · in EUR bn. *
CAGR: 5.3%
Home shopping
Online shopping16.6 18.6 20.4
4.75.4
5.7
21.8 28.0
5.7
5.8
2011 2012 2013e 2014e 2018e
Share of total retail · in % 14.7 15.6 16.5 17.3 20.3
* Source: Euromonitor International
3,053.6
90.4
Country information South Korea
3,151.6
855.3
1,231.3
Country profile · Media Use · Distance selling · “Customer jour-ney“ · Drivers & barriers in distance selling · Cross-border shopping · Dialog marketing

Shop the World 260
88+1284+16
Distance selling fever
Almost 90% of all South Ko- reans surveyed make use of the possibilities that distance sell-ing offers. In addition, the ma-jority of current non-users also expressed a desire to purchase products via distance selling in the future.Use of distance selling · in % *
88.4
11.6
South Korea
Globally
83.5
16.5
Number of orders in the previous year · in % *
1 to 5 orders
6 to 10 orders
11 to 20 orders
No orders
21.2
31.9
15.7
11.6
19.5
20.5
35.9
15.2
16.5
12.0
Future ordering behavior (current users) · in % *
More frequently than in the last
12 months
Just as frequently as in the last
12 months
Less frequently than in the last
12 months
62.3
30.5
55.2
38.8
7.2 6.1
Non-users of distance selling - future plans · in % *
Yes76.6
South Korea
Globally
Yes70.5
No23.4
No29.5
Yes No
South Korea Globally South Korea Globally
DISTANCE SELLING IN SOUTH KOREA
* Source: DHL Global Mail 2013 ∙ n Global from 1.275 to 11.265 ∙ n South Korea from 43 to 521
Country information South Korea
Country profile · Media Use · Distance selling · “Customer jour-ney“ · Drivers & barriers in distance selling · Cross-border shopping · Dialog marketing
More than 20 orders
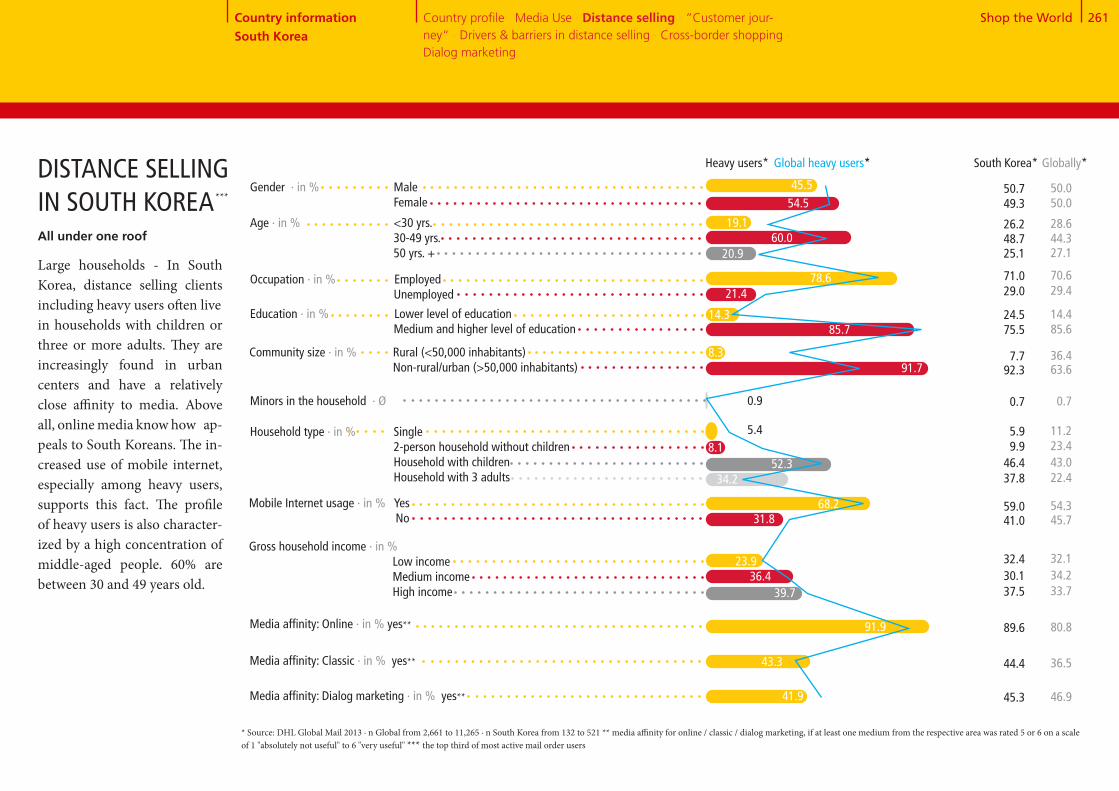
Shop the World 261
Globally*
60.0
Gender · in % Male Female
Age · in % <30 yrs. 30-49 yrs. 50 yrs. +
Occupation · in % Employed Unemployed
Education · in % Lower level of education Medium and higher level of education
14.3
Media affinity: Online · in % yes**
Community size · in % Rural (<50,000 inhabitants) Non-rural/urban (>50,000 inhabitants)
Minors in the household · Ø
Household type · in % Single 2-person household without children Household with children Household with 3 adults
Mobile Internet usage · in % Yes No
Gross household income · in % Low income Medium income High income
Media affinity: Classic · in % yes**
Media affinity: Dialog marketing · in % yes** 41.9
43.3
91.9
39.736.4
23.9
31.868.2
34.252.3
54.5
19.1
45.5
21.4
85.7
91.7
0.9
8.15.4
78.6
All under one roof
Large households - In South Korea, distance selling clients including heavy users often livein households with children or three or more adults. They are increasingly found in urban centers and have a relatively close affinity to media. Above all, online media know how ap-peals to South Koreans. The in-creased use of mobile internet, especially among heavy users, supports this fact. The profile of heavy users is also character- ized by a high concentration of middle-aged people. 60% are between 30 and 49 years old.
DISTANCE SELLING IN SOUTH KOREA
* Source: DHL Global Mail 2013 ∙ n Global from 2,661 to 11,265 ∙ n South Korea from 132 to 521 ** media affinity for online / classic / dialog marketing, if at least one medium from the respective area was rated 5 or 6 on a scale of 1 "absolutely not useful" to 6 "very useful" *** the top third of most active mail order users
44.327.1
14.4
36.4
46.9
36.5
80.8
33.734.232.1
45.754.3
22.443.0
50.0
28.6
50.0
29.4
85.6
63.6
0.7
23.411.2
70.6
Country information South Korea
***
South Korea*
48.725.1
24.5
7.7
45.3
44.4
89.6
37.530.132.4
41.059.0
37.846.4
49.3
26.2
50.7
29.0
75.5
92.3
0.7
9.95.9
71.0
20.9
8.3
Heavy users* Global heavy users*
Country profile · Media Use · Distance selling · “Customer jour-ney“ · Drivers & barriers in distance selling · Cross-border shopping · Dialog marketing
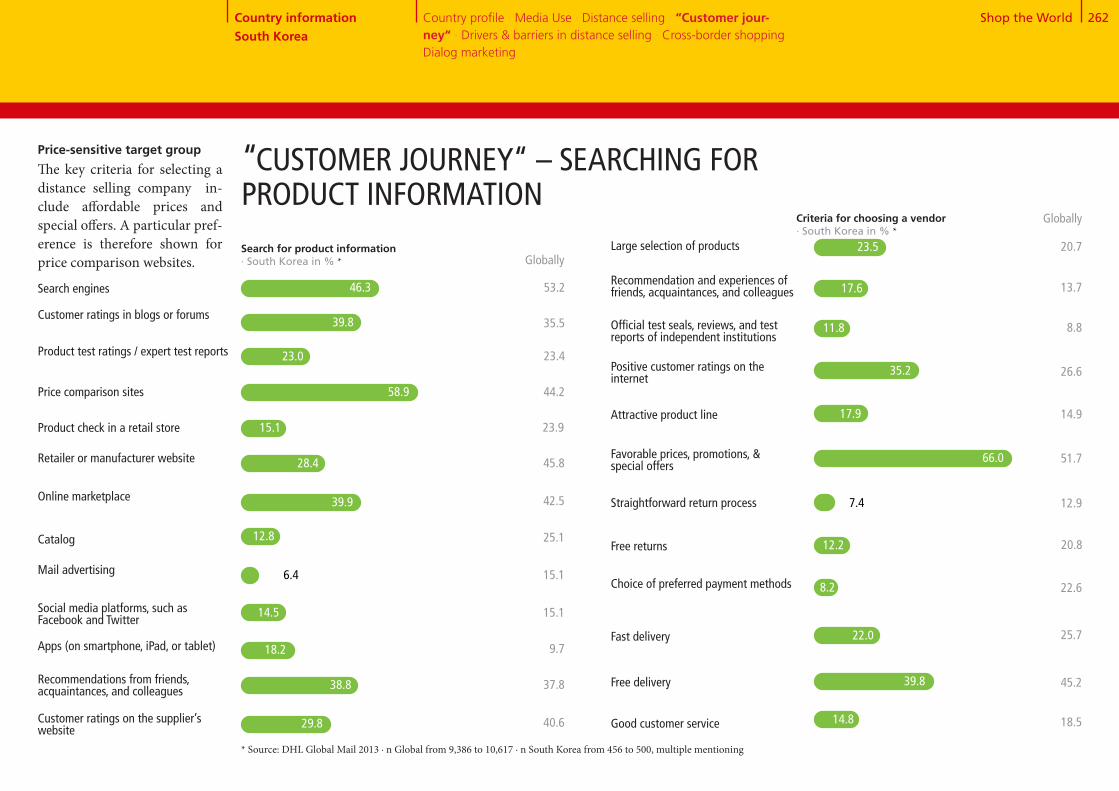
Shop the World 262
Search engines
Customer ratings in blogs or forums
Product test ratings / expert test reports
Product check in a retail store
Retailer or manufacturer website
Online marketplace
Catalog
Mail advertising
Social media platforms, such as Facebook and Twitter
Apps (on smartphone, iPad, or tablet)
Recommendations from friends, acquaintances, and colleagues
Customer ratings on the supplier’s website
Price comparison sites
Large selection of products
Recommendation and experiences of friends, acquaintances, and colleagues
Official test seals, reviews, and test reports of independent institutions
Attractive product line
Favorable prices, promotions, & special offers
Straightforward return process
Free returns
Choice of preferred payment methods
Fast delivery
Free delivery
Good customer service
Positive customer ratings on the internet
“CUSTOMER JOURNEY“ – SEARCHING FOR PRODUCT INFORMATION
Search for product information · South Korea in % * Globally
39.8 35.5
53.2
23.0 23.4
58.9 44.2
15.1 23.9
28.4 45.8
39.9 42.5
12.8 25.1
6.4 15.1
14.5 15.1
18.2 9.7
38.8 37.8
Criteria for choosing a vendor · South Korea in % *
Globally
46.3
29.8 40.6
17.6 13.7
20.7
11.8 8.8
35.2 26.6
17.9 14.9
66.0 51.7
7.4 12.9
12.2 20.8
8.2 22.6
22.0 25.7
39.8 45.2
14.8 18.5
23.5
Price-sensitive target group
The key criteria for selecting a distance selling company in- clude affordable prices and special offers. A particular pref- erence is therefore shown for price comparison websites.
* Source: DHL Global Mail 2013 ∙ n Global from 9,386 to 10,617 ∙ n South Korea from 456 to 500, multiple mentioning
Country information South Korea
Country profile · Media Use · Distance selling · “Customer jour-ney“ · Drivers & barriers in distance selling · Cross-border shopping · Dialog marketing
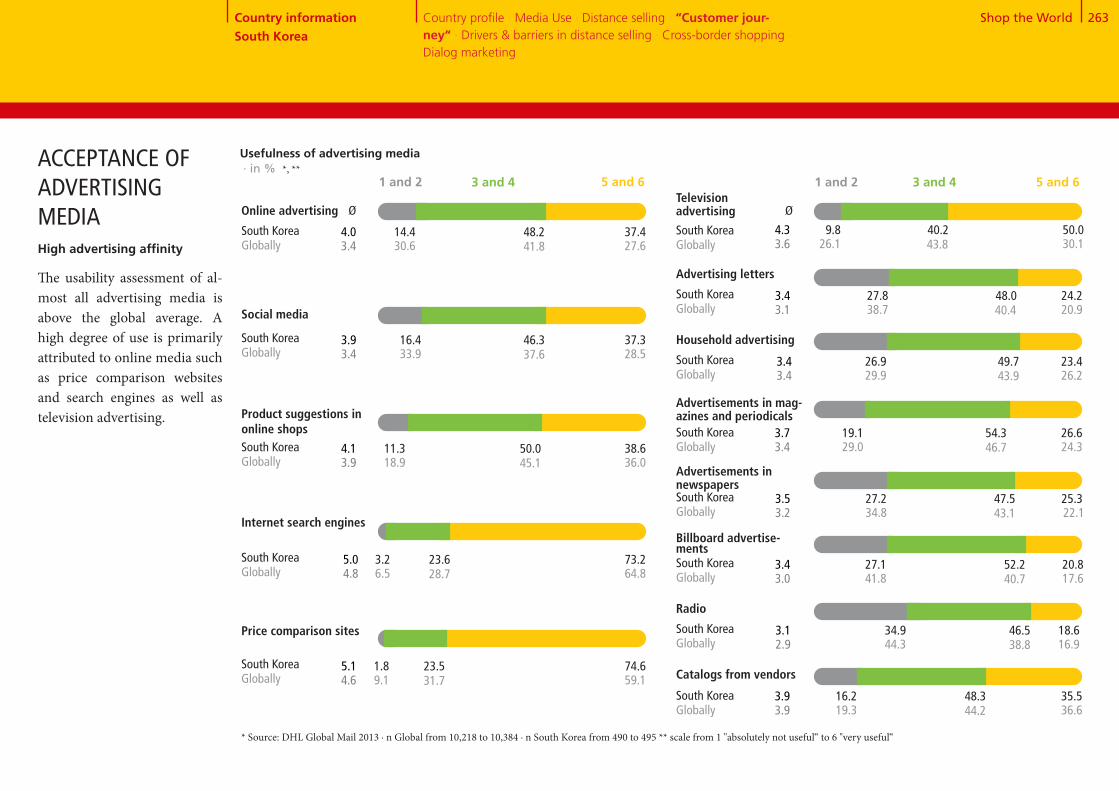
Shop the World 263
Usefulness of advertising media · in % *, **
5 and 63 and 41 and 2
Ø
40.29.8 50.026.1 43.8 30.1
Online advertising
* Source: DHL Global Mail 2013 ∙ n Global from 10,218 to 10,384 ∙ n South Korea from 490 to 495 ** scale from 1 "absolutely not useful“ to 6 "very useful“
High advertising affinity
The usability assessment of al-most all advertising media is above the global average. A high degree of use is primarily attributed to online media such as price comparison websites and search engines as well as television advertising.
ACCEPTANCE OF ADVERTISING MEDIA
South KoreaGlobally
Country information South Korea
Television advertising
5 and 63 and 41 and 2
4.33.6
Ø
48.214.4 37.430.6 41.8 27.6
4.03.4
48.027.8 24.238.7 40.4 20.9Social media
South KoreaGlobally
Advertising letters
3.43.1
46.316.4 37.333.9 37.6 28.5
3.93.4
Product suggestions in online shops
50.011.3 38.618.9 45.1 36.0
4.13.9
23.63.2 73.26.5 28.7 64.8
5.04.8
23.51.8 74.69.1 31.7 59.1
5.14.6
49.726.9 23.429.9 43.9 26.2
South KoreaGlobally
Household advertising
3.43.4
54.319.1 26.629.0 46.7 24.3
South KoreaGlobally
Advertisements in mag- azines and periodicals
3.73.4
47.527.2 25.334.8 43.1 22.1
South KoreaGlobally
Advertisements in newspapers
3.53.2
52.227.1 20.841.8 40.7 17.6
South KoreaGlobally
Billboard advertise-ments
3.43.0
46.534.9 18.644.3 38.8 16.9
South KoreaGlobally
Radio
3.12.9
48.316.2 35.519.3 44.2 36.6
South KoreaGlobally
Catalogs from vendors
3.93.9
South KoreaGlobally
South KoreaGlobally
South KoreaGlobally
Internet search engines
South KoreaGlobally
Price comparison sites
South KoreaGlobally
Country profile · Media Use · Distance selling · “Customer jour-ney“ · Drivers & barriers in distance selling · Cross-border shopping · Dialog marketing

Shop the World 264
Online PC
Online mobile (tablet, smartphone)
By telephone
In writing (by post, fax)
By email
Order in store & delivery to home
Country profile · Media Use · Distance selling · “Customer jour-ney“ · Drivers & barriers in distance selling · Cross-border shopping · Dialog marketing
Online marketplace
Mail order company from which I received a catalog
Merchant who advertises on TV
Online shop of a manufaturer or
retailer
Use of different suppliers · in % *
Never Seldom Frequently / very frequently
Occasionally
* Source: DHL Global Mail 2013 ∙ n Global from 9.270 to 9.446 ∙ n South Korea from 455 to 459
South Korea Global
70.5
6.5
1.5
1.7
75.0
3.2
2.1
4.4
“CUSTOMER JOURNEY“– PLACING ORDERSMobile: anything is possible
South Koreans are mobile- savvy. 15.3% specify mobile devices as their preferred ordering method. The PC is the number 1 ordering channel, but is less dominant compared to the global average. When searching for products, South Koreans prefer to visit online marketpla ces rather than in- dependent online shops. Ca t- alogs are seldom used in South Korea, whereas teleshop- ping enjoys great popularity. While around 60% refrain from using this ordering channel globally, only a 20% do so in South Korea.
23.3 15.621.8
15.4 31.216.8
39.3
36.6
South Korea
Globally
8.7 54.16.4
9.9 54.38.7
30.8
27.0
39.6 4.627.2
38.5 12.622.8
28.6
26.1
20.4 13.716.2
60.2 6.617.6
49.7
15.7
15.3
10.5
4.5
4.8
Order channels · in % *
Country information South Korea

Shop the World 265
Credit card in 1st place
In South Korea, the credit card is the payment method of choice. Two out of three distance selling clients use their credit card for eCommerce frequently to very frequently. Advance payment and debit card payment are second and third on the list. Installment purchases are used to a similar extent. Compared to the global average, installment purchases are quite popular in South Ko-rea. Online payment, payment by invoice or cash on delivery are rarely used.
Cash on delivery
Prepayment
Direct debit
Credit card
* Source: DHL Global Mail 2013 ∙ n Global from 9.218 to 9.324 ∙ n South Korea from 449 to 458
“CUSTOMER JOURNEY“ – PAYMENT METHODS
Online payment systems
Installment purchase / financing
Debit card
Invoice
Payment options· in % *
Never Seldom Frequently / very frequentlyOccasionally
South Korea
Globally
10.1 4.2 18.8 67.0
29.3 9.8 18.7 42.3
66.1 18.2 11.8 3.8
55.8 16.3 16.1 11.7
41.0 15.5 20.8 22.6
53.4 16.1 15.5 15.0
33.8 18.0 33.1 15.0
56.0 15.5 16.4 12.1
66.5 19.5 11.3 2.7
54.4 15.8 16.3 13.4
55.9 17.8 18.3 8.0
33.3 12.9 20.1 33.7
35.9 15.0 34.6 14.5
78.0 9.5 8.1 4.4
46.0 13.9 23.8 16.4
55.1 10.8 15.7 18.4
Country information South Korea
Country profile · Media Use · Distance selling · “Customer jour-ney“ · Drivers & barriers in distance selling · Cross-border shopping · Dialog marketing
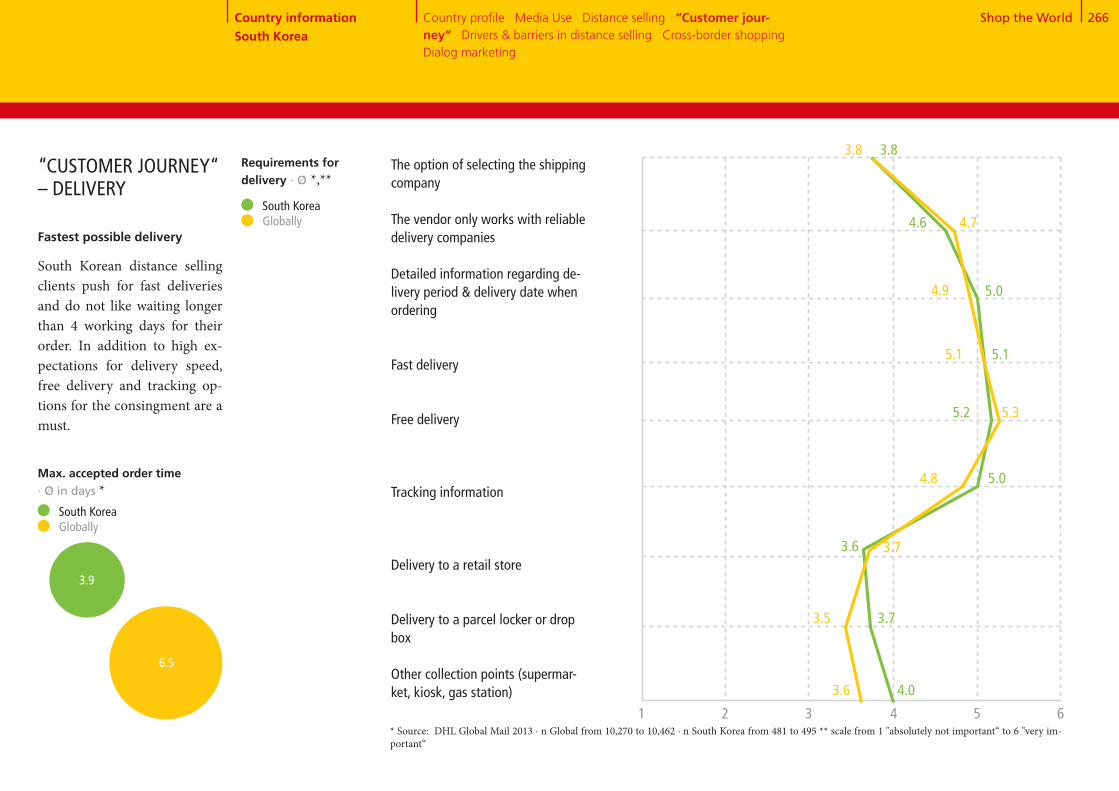
Shop the World 266
The option of selecting the shipping company The vendor only works with reliable delivery companies
Detailed information regarding de-livery period & delivery date when ordering
Fast delivery
Free delivery
Tracking information
Delivery to a retail store
Delivery to a parcel locker or drop box
Other collection points (supermar-ket, kiosk, gas station)
Country profile · Media Use · Distance selling · “Customer jour-ney“ · Drivers & barriers in distance selling · Cross-border shopping · Dialog marketing
South Korea Globally
4.0
3.7
3.6
5.2
5.0
5.1
3.8
5.0
4.6
Max. accepted order time · Ø in days *
3.6
3.5
3.7
5.3
4.8
5.1
3.8
4.9
4.7
* Source: DHL Global Mail 2013 ∙ n Global from 10,270 to 10,462 ∙ n South Korea from 481 to 495 ** scale from 1 "absolutely not important“ to 6 "very im-portant“
Fastest possible delivery
South Korean distance selling clients push for fast deliveries and do not like waiting longer than 4 working days for their order. In addition to high ex-pectations for delivery speed, free delivery and tracking op-tions for the consingment are a must.
“CUSTOMER JOURNEY“ – DELIVERY
1 2 3 4 5 6
Requirements for delivery · Ø *,**
Country information South Korea
3.9
6.5
South Korea Globally
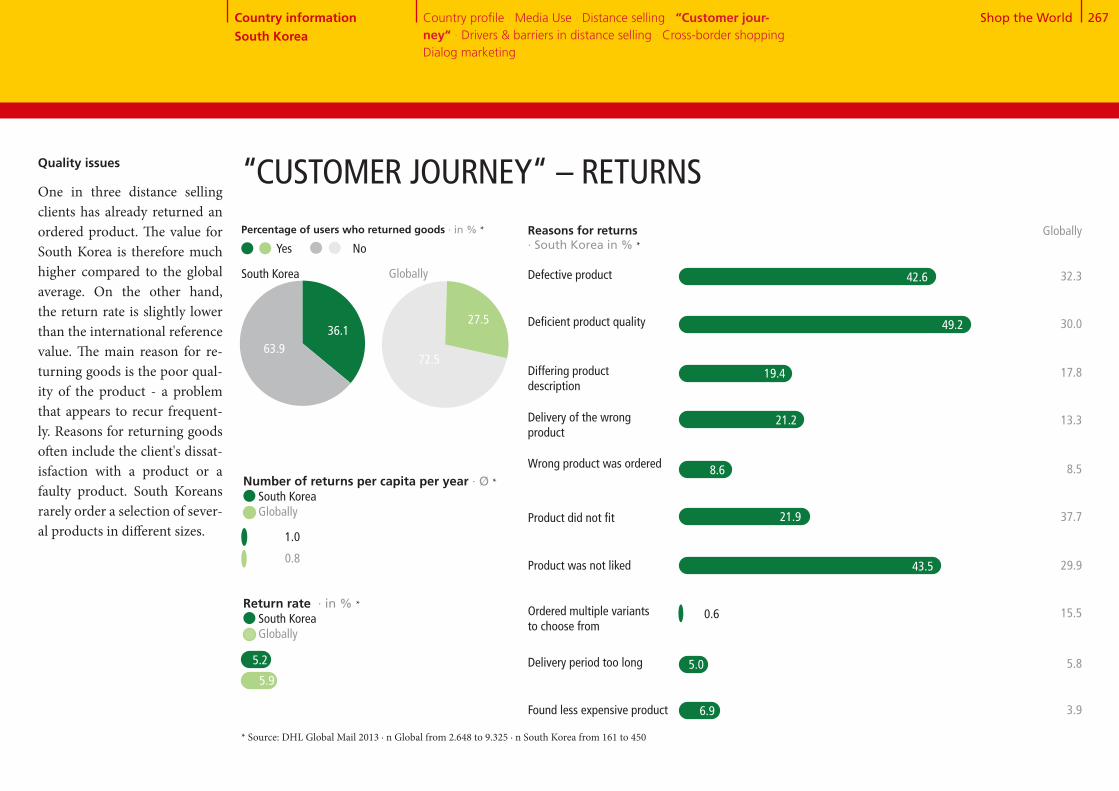
Shop the World 267
36+64
72+28
Number of returns per capita per year · Ø * South Korea Globally
0.8
1.0
Return rate · in % * South Korea Globally
5.9
Reasons for returns · South Korea in % *
Defective product 42.6
Percentage of users who returned goods · in % *
36.163.9
South Korea Globally
Yes No
“CUSTOMER JOURNEY“ – RETURNSQuality issues
One in three distance selling clients has already returned an ordered product. The value for South Korea is therefore much higher compared to the global average. On the other hand, the return rate is slightly lower than the international reference value. The main reason for re-turning goods is the poor qual-ity of the product - a problem that appears to recur frequent-ly. Reasons for returning goods often include the client's dissat- isfaction with a product or a faulty product. South Koreans rarely order a selection of sever-al products in different sizes.
27.5
72.5
* Source: DHL Global Mail 2013 ∙ n Global from 2.648 to 9.325 ∙ n South Korea from 161 to 450
Differing product description
Delivery of the wrong product
Wrong product was ordered
Product did not fit
Ordered multiple variants to choose from
Delivery period too long
Found less expensive product
Deficient product quality
Product was not liked
19.4
21.2
21.9
43.5
0.6
5.0
6.9
Globally
32.3
30.0
17.8
13.3
8.5
37.7
29.9
15.5
5.8
3.9
49.2
8.6
Country information South Korea
5.2
Country profile · Media Use · Distance selling · “Customer jour-ney“ · Drivers & barriers in distance selling · Cross-border shopping · Dialog marketing

Shop the World 268
High delivery costs
Uncertain delivery
Concern about misuse of payment data
No demand because all products are obtainable locally
Long delivery periods
Unknown product quality
No try-on possible before purchase
Complicated return of the products
No personal advice
No personal contact person for problems
Doubts regarding data protection or the dissemination of data to third parties
Concern about counterfeited products, product piracy
Product can only be obtained via distance selling
Easy price comparison
Shopping 24/7
Location-independent ordering
Higher product quality
Lower prices
Greater selection
Option to deliver to a preferred location
Country profile · Media Use · Distance selling · “Customer jour-ney“· Drivers & barriers in distance selling · Cross-border shopping · Dialog marketing
DRIVERS & BARRIERS IN DISTANCE SELLING Barriers
· South Korea in % *
50.8
54.6
72.6
63.5
7.8
59.1
46.0
67.3
66.1
42.4
55.0
Globally
36.6
24.2
34.4
3.9
25.8
48.5
64.9
44.1
21.5
22.0
29.8
34.1
Bargain hunters
Price transparency and low prices are the main drivers for distance selling in Korea. Con-venient shopping from any- where at any time is also im-portant.
Drivers · South Korea in % *
Globally
* Source: DHL Global Mail 2013 ∙ n Global from 10.509 to 10.864 ∙ n South Korea from 494 to 512
23.8
61.1
66.4
67.6
8.1
18.3
13.7
17.0
3.1
21.9
66.0
72.8
53.1
17.0
18.0
29.2
34.2
Country information South Korea
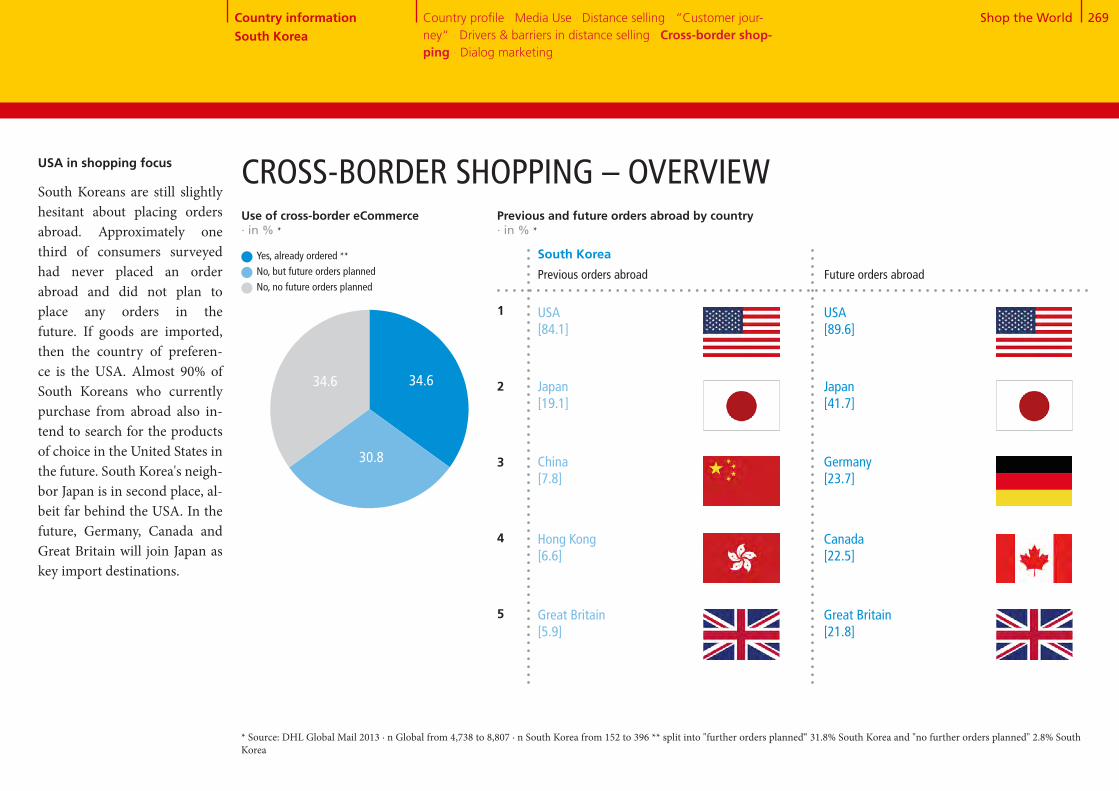
Shop the World 269
35+30+35CROSS-BORDER SHOPPING – OVERVIEW
Previous orders abroad
Previous and future orders abroad by country · in % *
Hong Kong[6.6]
Great Britain[5.9]
1
2
3
4
5
USA[84.1]
Japan[19.1]
China[7.8]
Future orders abroad
South Korea
* Source: DHL Global Mail 2013 ∙ n Global from 4,738 to 8,807 ∙ n South Korea from 152 to 396 ** split into "further orders planned“ 31.8% South Korea and "no further orders planned" 2.8% South Korea
USA in shopping focus
South Koreans are still slightly hesitant about placing orders abroad. Approximately one third of consumers surveyed had never placed an order abroad and did not plan to place any orders in the future. If goods are imported, then the country of preferen-ce is the USA. Almost 90% of South Koreans who currently purchase from abroad also in-tend to search for the products of choice in the United States in the future. South Korea's neigh-bor Japan is in second place, al-beit far behind the USA. In the future, Germany, Canada and Great Britain will join Japan as key import destinations.
Canada[22.5]
Great Britain[21.8]
USA[89.6]
Japan[41.7]
Germany[23.7]
Country information South Korea
Use of cross-border eCommerce · in % *
Yes, already ordered **No, but future orders planned No, no future orders planned
30.8
34.6 34.6
Country profile · Media Use · Distance selling · “Customer jour-ney“ · Drivers & barriers in distance selling · Cross-border shop-ping · Dialog marketing
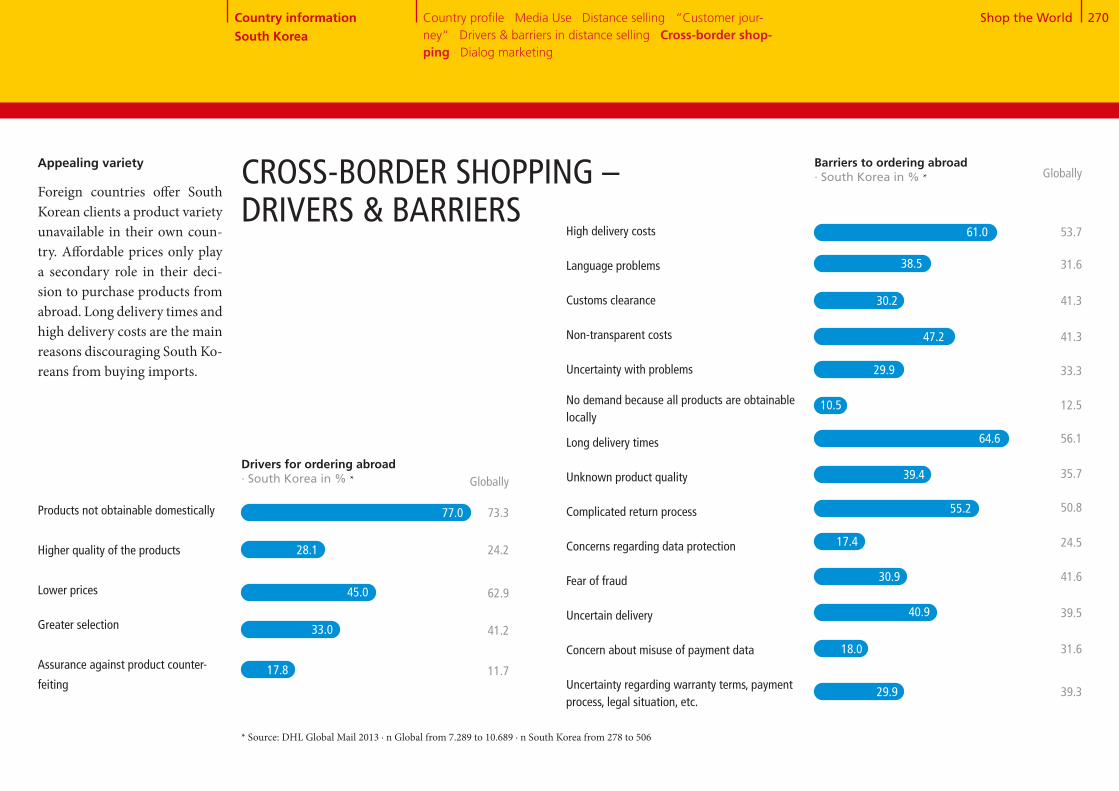
Shop the World 270
Products not obtainable domestically
Higher quality of the products
Lower prices
Greater selection
Assurance against product counter-
feiting
High delivery costs Language problems
Customs clearance
Non-transparent costs
Uncertainty with problems
No demand because all products are obtainable locally
Long delivery times
Unknown product quality
Complicated return process
Concerns regarding data protection Fear of fraud Uncertain delivery
Concern about misuse of payment data
Uncertainty regarding warranty terms, payment process, legal situation, etc.
Country profile · Media Use · Distance selling · “Customer jour-ney“ · Drivers & barriers in distance selling · Cross-border shop-ping · Dialog marketing
Drivers for ordering abroad· South Korea in % *
Barriers to ordering abroad · South Korea in % *
Globally
73.3
24.2
62.9
41.2
11.7
Globally
53.7
31.6
41.3
41.3
33.3
12.5
56.1
35.7
50.8
24.5
41.6
39.5
31.6
39.3
Appealing variety
Foreign countries offer South Korean clients a product variety unavailable in their own coun-try. Affordable prices only play a secondary role in their deci-sion to purchase products from abroad. Long delivery times and high delivery costs are the main reasons discouraging South Ko-reans from buying imports.
CROSS-BORDER SHOPPING – DRIVERS & BARRIERS
* Source: DHL Global Mail 2013 ∙ n Global from 7.289 to 10.689 ∙ n South Korea from 278 to 506
61.0
38.5
30.2
47.2
29.9
10.5
64.6
39.4
55.2
17.4
30.9
40.9
18.0
29.9
77.0
28.1
45.0
33.0
17.8
Country information South Korea

Shop the World 271
Reception of mailings and catalogs · South Korea in % *
5 and 63 and 41 and 2
DIALOG MARKETING
Reading mailings and catalogs · in % *,**
South Korea
Globally
26.7 41.1 32.2
22.1 35.2 42.7
5 and 63 and 41 and 2
Response to mailings and catalogs · in % *,**
South Korea
Globally
34.9 49.2 16.0
29.0 45.8 25.3
Response channel for mailings and catalogs · South Korea in % * Globally
Website visits
Visits to stores or
branch offices
Other online
response (e.g. chat,
Twitter, Facebook,
newsletter
registration, etc.)
Phone call
Business reply card
65.4 73.4
48.6
30.0
24.5
18.4
12.6
* Source: DHL Global Mail 2013 ∙ n Global from 8,788 to 11,265 ∙ n South Korea from 383 to 521 ** scale from 1 "never“ to 6 "almost always“
Low frequency and response
Although a similar number of clients as the global average receive mailings and catalogs, they are received less frequent-ly. Only 5.4% of South Koreans receive direct marketing offers once a week or more. Reading and response rates are signifi-cantly below the global average. Ho wever, if clients respond to advertising, they usually visit the website of the advertiser, respond via Twitter, Facebook & Co. or pay a visit to the local store.
Globally
One or more times per week
One or more times per month
Less than once per month
Never
26.9
33.7
27.7
11.6 32.7
33.5
13.9
26.8
7.3
5.4
36.0
45.4
13.2
Country information South Korea
Country profile · Media Use · Distance selling · “Customer jour-ney“ · Drivers & barriers in distance selling · Cross-border shop-ping · Dialog marketing
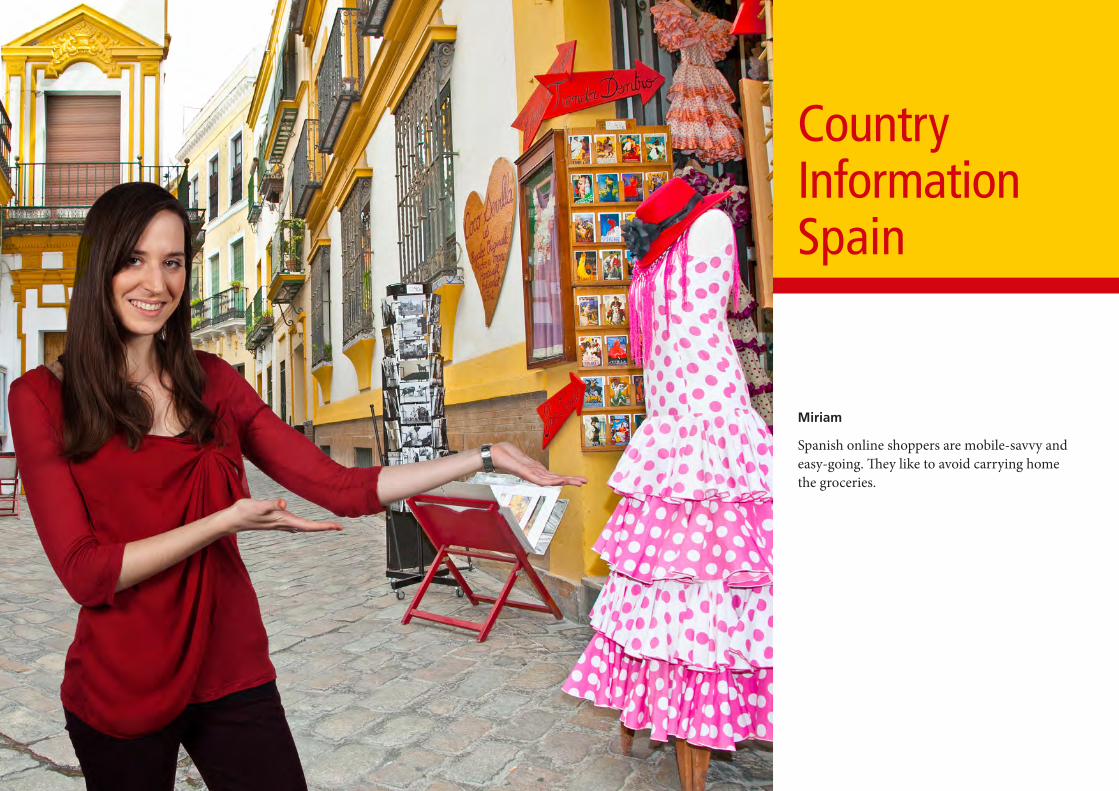
Country Information Spain
Miriam
Spanish online shoppers are mobile-savvy and easy-going. They like to avoid carrying home the groceries.

Shop the World 273Country information Spain Country profile · Media Use · Distance selling · “Customer jour-ney“ · Drivers & barriers in distance selling · Cross-border shopping · Dialog marketing
7.6
Population 0 - 15 years
Spanish economy * COUNTRY PROFILE SPAIN
Madrid 6,405
* Source: Fischer World Almanac 2014, Germany Trade & Invest ** Source: Metropolitan areas with 1 million inhabitants and more; United Nations, Department of Economic and Social Affairs, Po-pulation Division (2012). World Urbanization Prospects: The 2011 Revision, CD-ROM Edition.*** Source: Copyright © IHS, 2013. All rights reserved **** Source: Copyright © IHS, 2013. All rights reserved
Number of households Ø Household sizeUnemployment rateInflation rate
-1.6
Economic growth · in % ****
>
>
-1.20.1
2011 2012 2013
Age distribution · 2013 in mn.
Population 65 years and older
Population, total · 2013 in mn. 46.8 ***
Population 16 - 64 years
· 2013 in mn.· 2013· 2013 in %· 2013 in %
13.93.4
26.31.4
The international finance crisisin 2007 resulted in bursting of a speculative bubble in the realestate sector in Spain and caused a serious economic cri-sis, from which the country has not yet recovered. The economy shrunk in 2012 by 1.6 % and in 2013 by 1.2 %. National debt, social expenditures, and inter- est charges increased enor-mously. Every fourth Span-iard is currently unemployed. Despite that, Spain is daring to hope. According to the Sta-tistical Office INE, a small, ex-port-driven economic growth has been observed in the two last quarters of 2013, which is also supposed to continue in 2014. Fiscal consolidation, fi-nancial market reform, and structural reforms are in prog-ress and the unemployment rate is supposed to decrease as well in 2014.
31.1
8.1
Metropolitan areas with 1 million inhabitants or more · 2011 in thousands **
Barcelona 5,488
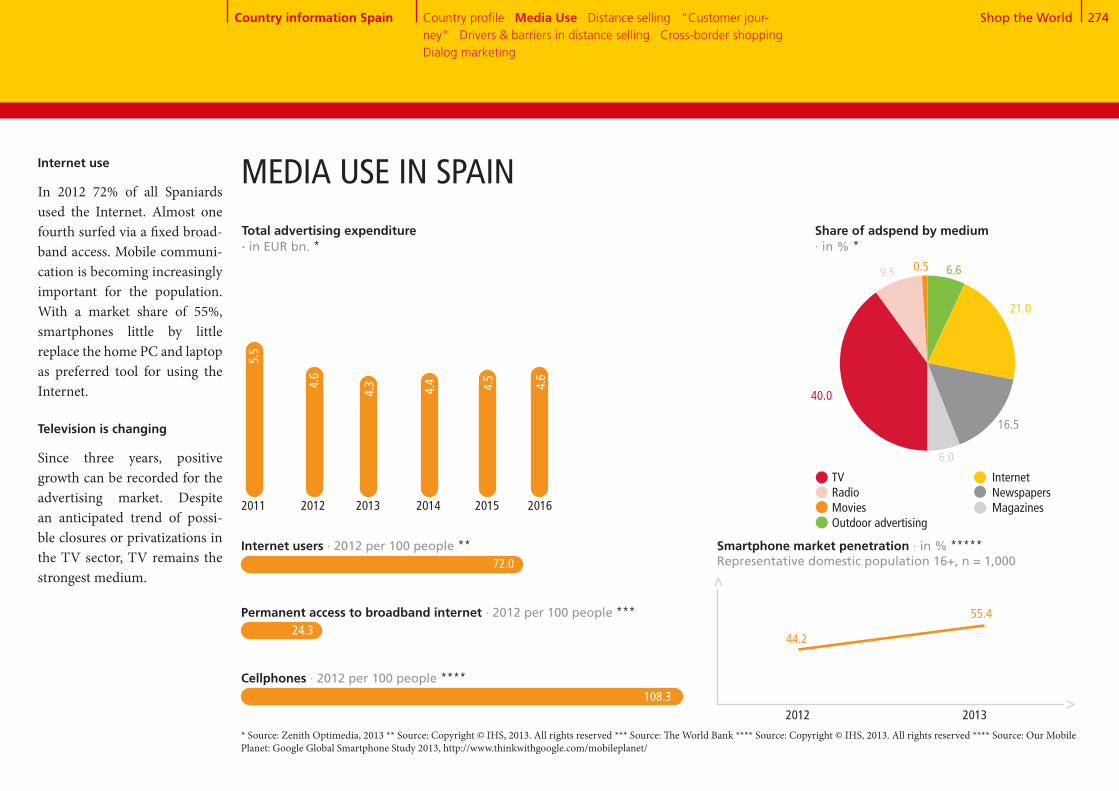
Shop the World 274
40+9+1+7+21+16+6
Country information Spain Country profile · Media Use · Distance selling · “Customer jour-ney“ · Drivers & barriers in distance selling · Cross-border shopping · Dialog marketing
MEDIA USE IN SPAIN
24.3
108.3
Smartphone market penetration · in % *****Representative domestic population 16+, n = 1,000
44.2
Internet users · 2012 per 100 people **
Permanent access to broadband internet · 2012 per 100 people ***
Cellphones · 2012 per 100 people ****
2012 2013
55.4
Share of adspend by medium · in % *
TV Radio Movies Outdoor advertising
Total advertising expenditure · in EUR bn. *
Internet Newspapers Magazines
>>
* Source: Zenith Optimedia, 2013 ** Source: Copyright © IHS, 2013. All rights reserved *** Source: The World Bank **** Source: Copyright © IHS, 2013. All rights reserved **** Source: Our Mobile Planet: Google Global Smartphone Study 2013, http://www.thinkwithgoogle.com/mobileplanet/
2011 2012 2013 2014 20154.
5
72.0
4.4
4.34.
6
5.5
2016
4.6
21.0
16.5
6.0
6.60.59.5
40.0
Internet use
In 2012 72% of all Spaniards used the Internet. Almost one fourth surfed via a fixed broad-band access. Mobile communi-cation is becoming increasingly important for the population. With a market share of 55%, smartphones little by little replace the home PC and laptop as preferred tool for using the Internet.
Television is changing
Since three years, positive growth can be recorded for the advertising market. Despite an anticipated trend of possi- ble closures or privatizations in the TV sector, TV remains the strongest medium.
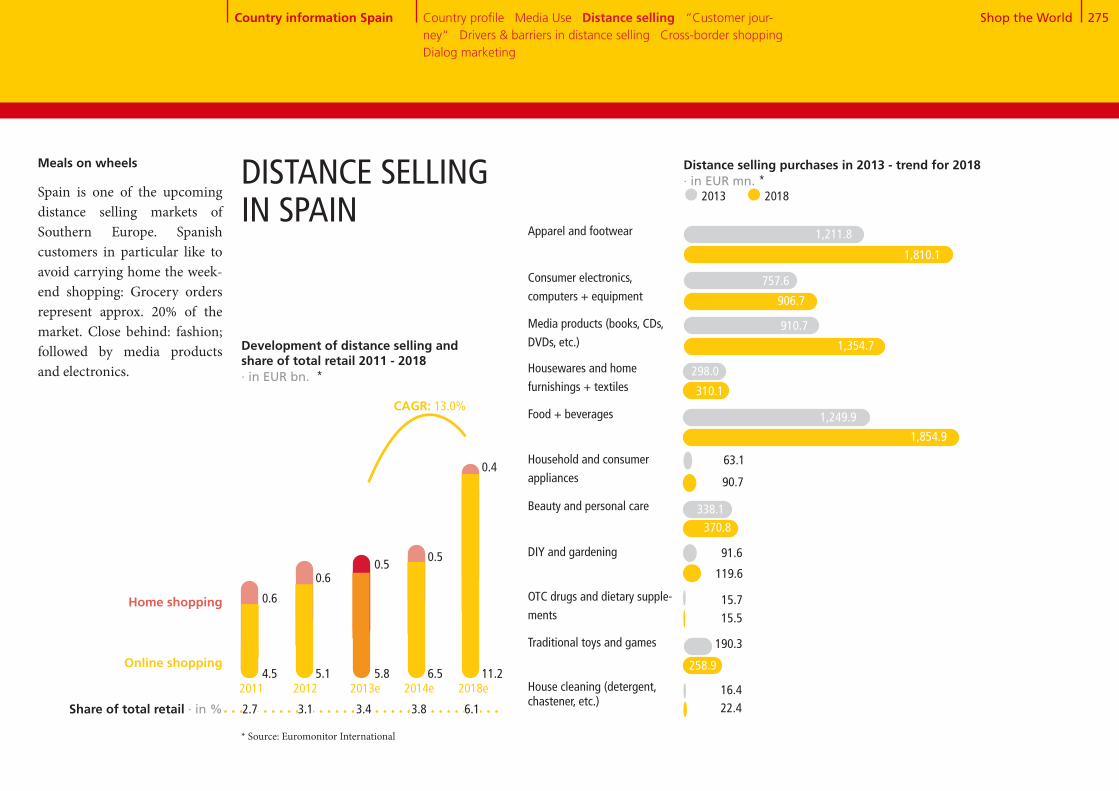
Shop the World 275
Meals on wheels
Spain is one of the upcoming distance selling markets of Southern Europe. Spanish customers in particular like to avoid carrying home the week-end shopping: Grocery orders represent approx. 20% of the market. Close behind: fashion; followed by media products and electronics.
DISTANCE SELLING IN SPAIN
1,810.1
Apparel and footwear
906.7
757.6
1,354.7
910.7
310.1
298.0
1,854.9
63.1
90.7
370.8
119.6
91.6
15.7
258.9
190.3
22.4
Consumer electronics,
computers + equipment
Media products (books, CDs,
DVDs, etc.)
Housewares and home
furnishings + textiles
Food + beverages
Household and consumer
appliances
Beauty and personal care
DIY and gardening
OTC drugs and dietary supple-
ments
Traditional toys and games
House cleaning (detergent, chastener, etc.)
Development of distance selling and share of total retail 2011 - 2018 · in EUR bn. *
CAGR: 13.0%
Home shopping
Online shopping4.5 5.1 5.8
0.6
0.60.5
6.5 11.2
0.5
0.4
2011 2012 2013e 2014e 2018e
Share of total retail · in % 2.7 3.1 3.4 3.8 6.1
* Source: Euromonitor International
1,211.8
16.4
Country information Spain Country profile · Media Use · Distance selling · “Customer jour-ney“ · Drivers & barriers in distance selling · Cross-border shopping · Dialog marketing
1,249.9
338.1
15.5
Distance selling purchases in 2013 - trend for 2018 · in EUR mn. * 2013 2018

Shop the World 276
83+1784
+16
Positive market development
With an already high use den-sity, but a currently low order frequency, Spanish consumers are optimistic regarding their future shopping intentions.
Use of distance selling · in % *
83.1
16.9
Spain
Globally
83.5
16.5
Number of orders in the previous year · in % *
1 to 5 orders
6 to 10 orders
11 to 20 orders
More than 20 orders
No orders
21.3
41.9
11.0
16.9
8.9
20.5
35.9
15.2
16.5
12.0
Future ordering behavior (current users) · in % *
More frequently than in the last
12 months
Just as frequently as in the last
12 months
Less frequently than in the last
12 months
51.2
43.1
55.2
38.8
5.6 6.1
Non-users of distance selling - future plans · in % *
Yes71.3
Spain
Globally
Yes70.5
No28.7
No29.5
Yes No
Spain Globally Spain Globally
DISTANCE SELLING IN SPAIN
* Source: DHL Global Mail 2013 ∙ n Global from 1,275 to 11,265 ∙ n Spain from 56 to 506
Country information Spain Country profile · Media Use · Distance selling · “Customer jour-ney“ · Drivers & barriers in distance selling · Cross-border shopping · Dialog marketing
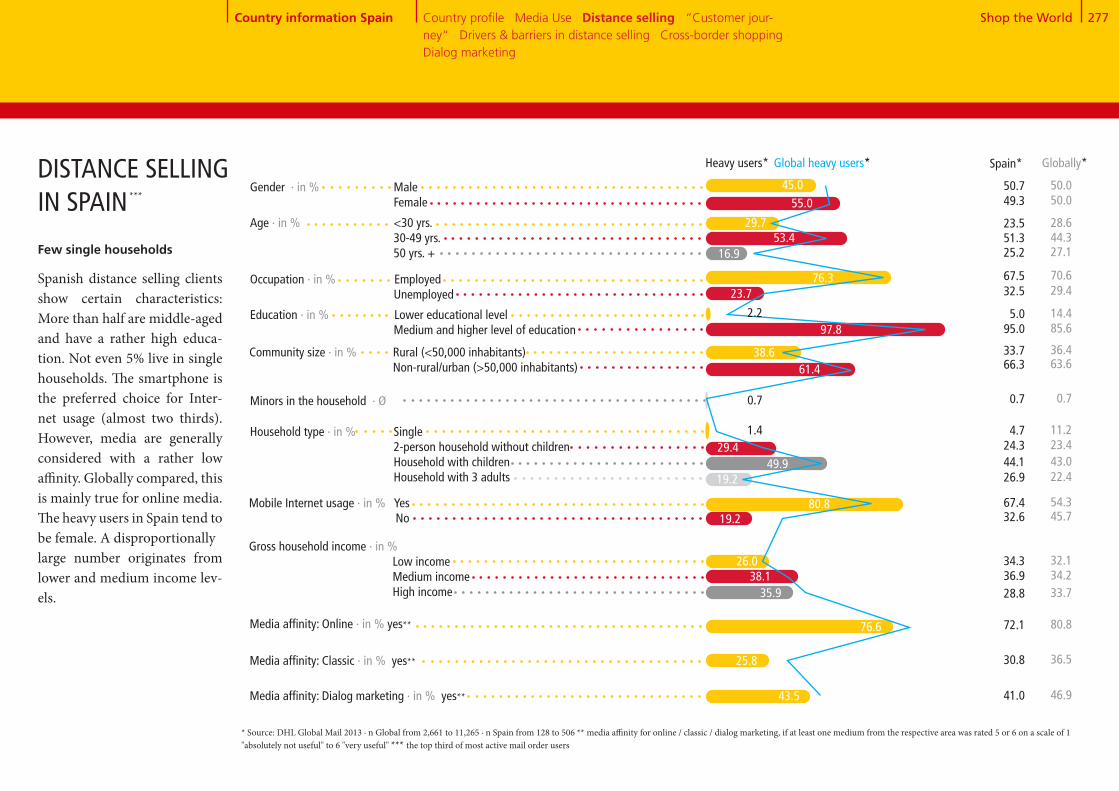
Shop the World 277
Globally*
53.4
Gender · in % Male Female
Age · in % <30 yrs. 30-49 yrs. 50 yrs. +
Occupation · in % Employed Unemployed
Education · in % Lower educational level Medium and higher level of education
Media affinity: Online · in % yes**
Community size · in % Rural (<50,000 inhabitants) Non-rural/urban (>50,000 inhabitants)
Minors in the household · Ø
Household type · in % Single 2-person household without children Household with children Household with 3 adults
Mobile Internet usage · in % Yes No
Gross household income · in % Low income Medium income High income
Media affinity: Classic · in % yes**
Media affinity: Dialog marketing · in % yes** 43.5
25.8
76.6
35.938.1
26.0
19.280.8
19.249.9
55.0
29.7
45.0
23.7
97.8
61.4
0.7
29.41.4
76.3
Few single households
Spanish distance selling clients show certain characteristics: More than half are middle-aged and have a rather high educa-tion. Not even 5% live in single households. The smartphone is the preferred choice for Inter-net usage (almost two thirds). However, media are generally considered with a rather low affinity. Globally compared, this is mainly true for online media. The heavy users in Spain tend tobe female. A disproportionallylarge number originates from lower and medium income lev-els.
DISTANCE SELLING IN SPAIN
* Source: DHL Global Mail 2013 ∙ n Global from 2,661 to 11,265 ∙ n Spain from 128 to 506 ** media affinity for online / classic / dialog marketing, if at least one medium from the respective area was rated 5 or 6 on a scale of 1 "absolutely not useful" to 6 "very useful" *** the top third of most active mail order users
44.327.1
14.4
36.4
46.9
36.5
80.8
33.734.232.1
45.754.3
22.443.0
50.0
28.6
50.0
29.4
85.6
63.6
0.7
23.411.2
70.6
Country information Spain Country profile · Media Use · Distance selling · “Customer jour-ney“ · Drivers & barriers in distance selling · Cross-border shopping · Dialog marketing
***
Spain*
51.325.2
5.0
33.7
41.0
30.8
72.1
28.836.934.3
32.667.4
26.944.1
49.3
23.5
50.7
32.5
95.0
66.3
0.7
24.34.7
67.5
16.9
38.6
Heavy users* Global heavy users*
2.2
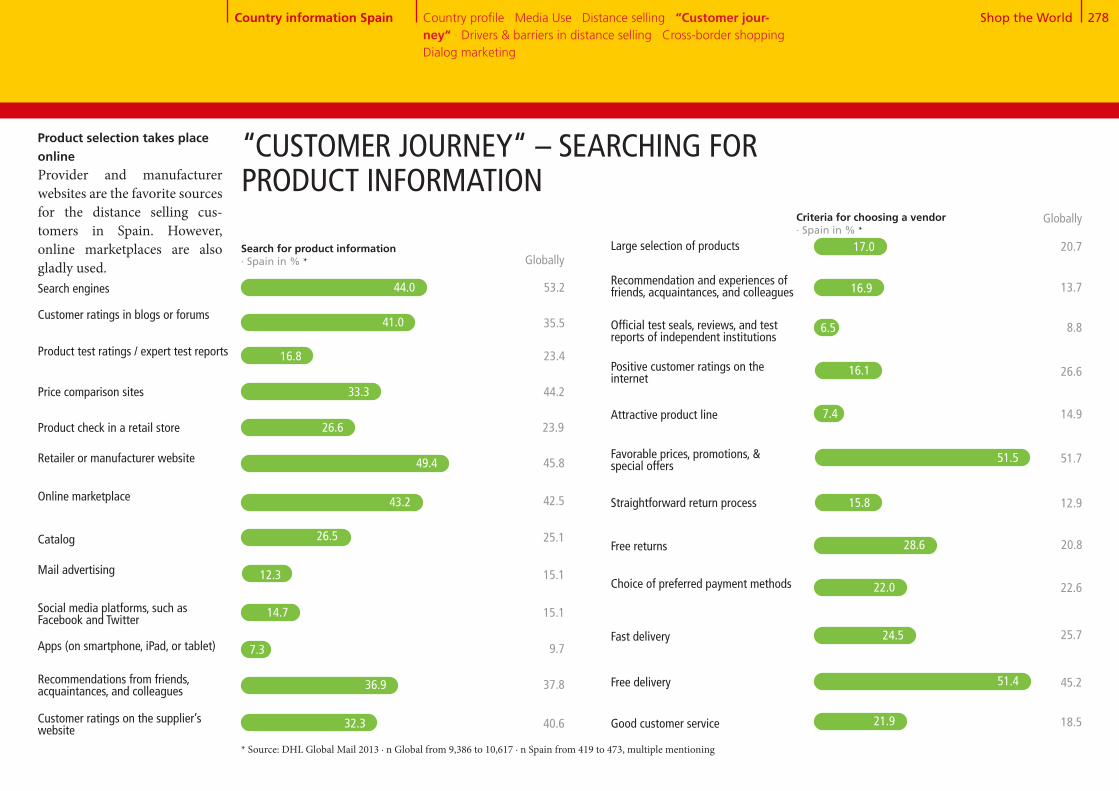
Shop the World 278
Search engines
Customer ratings in blogs or forums
Product test ratings / expert test reports
Product check in a retail store
Retailer or manufacturer website
Online marketplace
Catalog
Mail advertising
Social media platforms, such as Facebook and Twitter
Apps (on smartphone, iPad, or tablet)
Recommendations from friends, acquaintances, and colleagues
Customer ratings on the supplier’s website
Price comparison sites
Large selection of products
Recommendation and experiences of friends, acquaintances, and colleagues
Official test seals, reviews, and test reports of independent institutions
Attractive product line
Favorable prices, promotions, & special offers
Straightforward return process
Free returns
Choice of preferred payment methods
Fast delivery
Free delivery
Good customer service
Positive customer ratings on the internet
“CUSTOMER JOURNEY“ – SEARCHING FOR PRODUCT INFORMATION
Search for product information · Spain in % * Globally
41.0 35.5
53.2
16.8 23.4
33.3 44.2
26.6 23.9
49.4 45.8
43.2 42.5
26.5 25.1
12.3 15.1
14.7 15.1
7.3 9.7
36.9 37.8
Criteria for choosing a vendor · Spain in % *
Globally
44.0
32.3 40.6
16.9 13.7
20.7
6.5 8.8
16.1 26.6
7.4 14.9
51.5 51.7
15.8 12.9
28.6 20.8
22.0 22.6
24.5 25.7
51.4 45.2
21.9 18.5
17.0
Product selection takes place onlineProvider and manufacturer websites are the favorite sourcesfor the distance selling cus- tomers in Spain. However, online marketplaces are also gladly used.
* Source: DHL Global Mail 2013 ∙ n Global from 9,386 to 10,617 ∙ n Spain from 419 to 473, multiple mentioning
Country information Spain Country profile · Media Use · Distance selling · “Customer jour-ney“ · Drivers & barriers in distance selling · Cross-border shopping · Dialog marketing
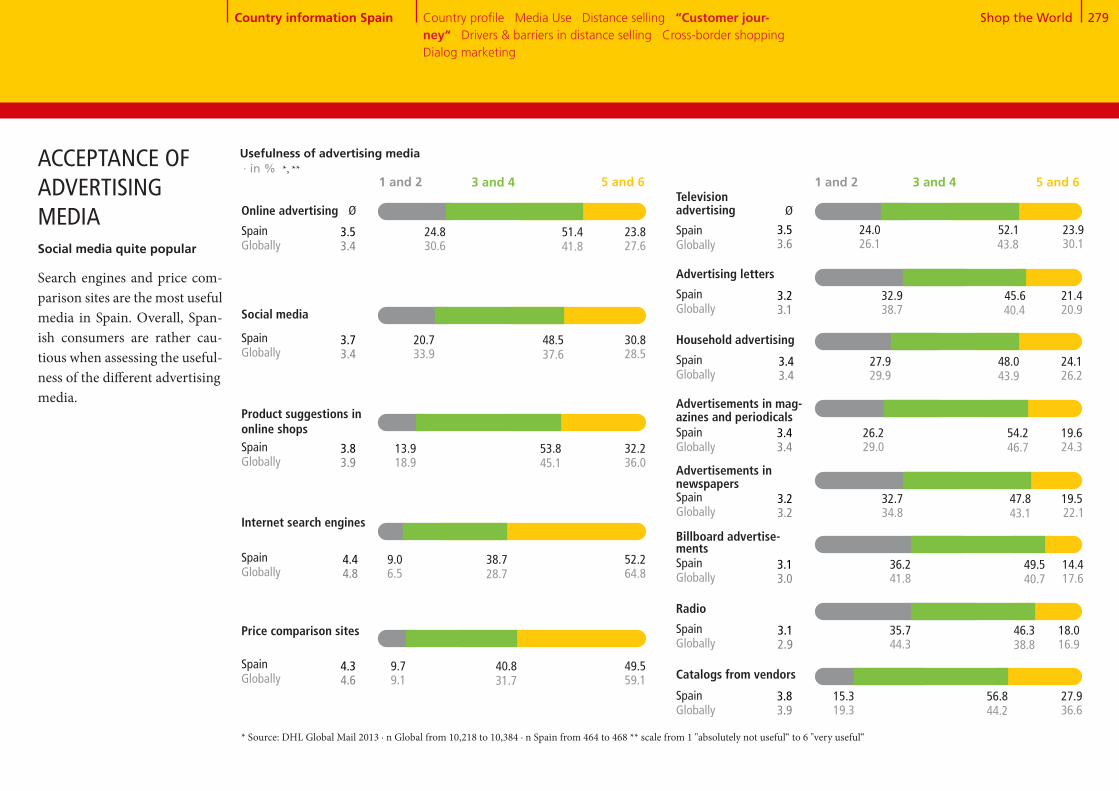
Shop the World 279
Usefulness of advertising media · in % *, **
5 and 63 and 41 and 2
Ø
52.124.0 23.926.1 43.8 30.1
Online advertising
* Source: DHL Global Mail 2013 ∙ n Global from 10,218 to 10,384 ∙ n Spain from 464 to 468 ** scale from 1 "absolutely not useful“ to 6 "very useful“
Social media quite popular
Search engines and price com-parison sites are the most useful media in Spain. Overall, Span-ish consumers are rather cau-tious when assessing the useful-ness of the different advertising media.
ACCEPTANCE OF ADVERTISING MEDIA
SpainGlobally
Country information Spain Country profile · Media Use · Distance selling · “Customer jour-ney“ · Drivers & barriers in distance selling · Cross-border shopping · Dialog marketing
Television advertising
5 and 63 and 41 and 2
3.53.6
Ø
51.424.8 23.830.6 41.8 27.6
3.53.4
45.632.9 21.438.7 40.4 20.9Social media
SpainGlobally
Advertising letters
3.23.1
48.520.7 30.833.9 37.6 28.5
3.73.4
Product suggestions in online shops
53.813.9 32.218.9 45.1 36.0
3.83.9
38.79.0 52.26.5 28.7 64.8
4.44.8
40.89.7 49.59.1 31.7 59.1
4.34.6
48.027.9 24.129.9 43.9 26.2
SpainGlobally
Household advertising
3.43.4
54.226.2 19.629.0 46.7 24.3
SpainGlobally
Advertisements in mag- azines and periodicals
3.43.4
47.832.7 19.534.8 43.1 22.1
SpainGlobally
Advertisements in newspapers
3.23.2
49.536.2 14.441.8 40.7 17.6
SpainGlobally
Billboard advertise-ments
3.13.0
46.335.7 18.044.3 38.8 16.9
SpainGlobally
Radio
3.12.9
56.815.3 27.919.3 44.2 36.6
SpainGlobally
Catalogs from vendors
3.83.9
SpainGlobally
SpainGlobally
SpainGlobally
Internet search engines
SpainGlobally
Price comparison sites
SpainGlobally

Shop the World 280
Online PC
Online mobile (tablet, smartphone)
By telephone
In writing (by post, fax)
By email
Order in store & delivery to home
Online marketplace
Mail order company from which I received a catalog
Merchant who advertises on TV
Online shop of a manufaturer or
retailer
Use of different suppliers · in % *
Never Seldom Frequently / very frequently
Occasionally
* Source: DHL Global Mail 2013 ∙ n Global from 9,270 to 9,446 ∙ n Spain from 414 to 421
Spain Global
70.0
2.3
2.6
6.8
75.0
3.2
2.1
4.4
“CUSTOMER JOURNEY“– PLACING ORDERSOnline or on site
A majority of consumers pre-fers ordering online via the PC. However, Spanish dis- tance selling clients slightly pre-fer ordering at the local store and have the purchases deliv- ered to their homes. Providers offering their products via on-line marketplaces have the best chances. Furthermore, cus- tomers use online shops more often than the global average.
12.8 33.511.6
15.4 31.216.8
42.1
36.6
Spain
Globally
10.8 44.56.4
9.9 54.38.7
38.3
27.0
41.5 8.626.2
38.5 12.622.8
23.7
26.1
64.2 3.118.4
60.2 6.617.6
14.3
15.7
9.9
10.5
8.5
4.8
Order channels · in % *
Country information Spain Country profile · Media Use · Distance selling · “Customer jour-ney“ · Drivers & barriers in distance selling · Cross-border shopping · Dialog marketing

Shop the World 281
No purchases on credit
Online payment systems and credit cards are the most im-portant payment methods for Spanish distance selling clients.While credit cards are used comparatively less frequently, online payment systems are rel- atively common in Spain. The same applies to debit cards, which are used significantly more often in Spain compared to the global average. Advance payments and payments upon invoice are used much less fre-quently. Around two thirds nev- er use this payment methods. Financing and installment purchases are currently of no importance.
Cash on delivery
Prepayment
Direct debit
Credit card
* Source: DHL Global Mail 2013 ∙ n Global from 9,218 to 9,324 ∙ n Spain from 412 to 418
“CUSTOMER JOURNEY“– PAYMENT METHODS
Online payment systems
Installment purchase / financing
Debit card
Invoice
Payment options · in % *
Never Seldom Frequently / very frequentlyOccasionally
Spain
Globally
30.9 10.6 26.0 32.5
29.3 9.8 18.7 42.3
37.7 20.3 26.4 15.7
55.8 16.3 16.1 11.7
64.0 12.8 15.0 8.2
53.4 16.1 15.5 15.0
54.6 16.5 20.9 8.0
56.0 15.5 16.4 12.1
68.7 12.5 12.3 6.6
54.4 15.8 16.3 13.4
23.6 8.8 23.7 43.9
33.3 12.9 20.1 33.7
81.8 9.1 7.2 1.9
78.0 9.5 8.1 4.4
36.8 9.1 25.5 28.6
55.1 10.8 15.7 18.4
Country information Spain Country profile · Media Use · Distance selling · “Customer jour-ney“ · Drivers & barriers in distance selling · Cross-border shopping · Dialog marketing

Shop the World 282
The option of selecting the shipping company The vendor only works with reliable delivery companies
Detailed information regarding de-livery period & delivery date when ordering
Fast delivery
Free delivery
Tracking information
Delivery to a retail store
Delivery to a parcel locker or drop box
Other collection points (supermar-ket, kiosk, gas station)
Spain Globally
4.1
4.2
4.4
5.4
4.9
5.0
3.8
5.0
4.7
Max. accepted order time · Ø in days *
3.6
3.5
3.7
5.3
4.8
5.1
3.8
4.9
4.7
* Source: DHL Global Mail 2013 ∙ n Global from 10,270 to 10,462 ∙ n Spain from 463 to 471 ** scale from 1 "absolutely not important“ to 6 "very important“
High demands
While a whole week is acceptedfor distance selling deliveries, high demands are placed on the supplier. Options for delivery to different locations, e.g. shops, drop boxes, or supermarkets, are particularly requested in Spain.
“CUSTOMER JOURNEY“ – DELIVERY
1 2 3 4 5 6
Requirements for delivery · Ø *,**
Country information Spain Country profile · Media Use · Distance selling · “Customer jour-ney“ · Drivers & barriers in distance selling · Cross-border shopping · Dialog marketing
7.1
6.5
Spain Globally

Shop the World 283
20+80
72+28
Number of returns per capita per year · Ø * Spain Globally
0.8
0.4
Return rate · in % * Spain Globally
5.9
Reasons for returns · Spain in % *
Defective product 31.6
Percentage of users who returned goods · in % *
20.2
79.8
Spain Globally
Yes No
“CUSTOMER JOURNEY“– RETURNSAverage return rate
The number of returns by Span- ish distance selling clients is slightly below average. Approx. every fifth returned something in the past. The number of re-turns and the return rate are also very low. Therefore, it is not a surprise that many product return reasons are mentioned significantly less frequently: In particular, non-fitting products or general dissatisfaction with the product are less important in Spain than globally. Defec- tive products are the main rea-son for returns.
27.5
72.5
* Source: DHL Global Mail 2013 ∙ n Global from 2,648 to 9,325 ∙ n Spain from 85 to 420
Differing product description
Delivery of the wrong product
Wrong product was ordered
Product did not fit
Ordered multiple variants to choose from
Delivery period too long
Found less expensive product
Deficient product quality
Product was not liked
17.6
16.5
9.3
15.4
9.5
5.7
5.9
Globally
32.3
30.0
17.8
13.3
8.5
37.7
29.9
15.5
5.8
3.9
16.6
5.9
Country information Spain Country profile · Media Use · Distance selling · “Customer jour-ney“ · Drivers & barriers in distance selling · Cross-border shopping · Dialog marketing
4.8
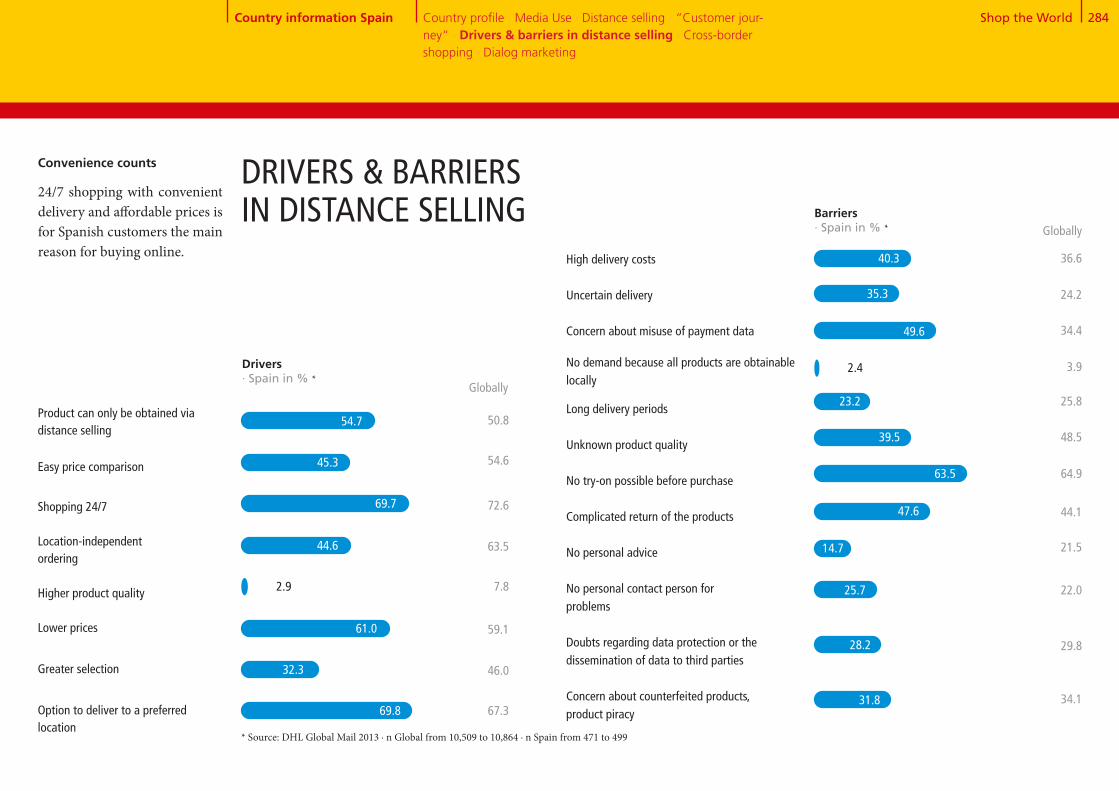
Shop the World 284
High delivery costs
Uncertain delivery
Concern about misuse of payment data
No demand because all products are obtainable locally
Long delivery periods
Unknown product quality
No try-on possible before purchase
Complicated return of the products
No personal advice
No personal contact person for problems
Doubts regarding data protection or thedissemination of data to third parties
Concern about counterfeited products, product piracy
Product can only be obtained via distance selling
Easy price comparison
Shopping 24/7
Location-independent ordering
Higher product quality
Lower prices
Greater selection
Option to deliver to a preferred location
DRIVERS & BARRIERS IN DISTANCE SELLING Barriers
· Spain in % *
50.8
54.6
72.6
63.5
7.8
59.1
46.0
67.3
61.0
32.3
69.8
Globally
36.6
24.2
34.4
3.9
25.8
48.5
64.9
44.1
21.5
22.0
29.8
34.1
Convenience counts
24/7 shopping with convenient delivery and affordable prices is for Spanish customers the main reason for buying online.
Drivers · Spain in % *
Globally
* Source: DHL Global Mail 2013 ∙ n Global from 10,509 to 10,864 ∙ n Spain from 471 to 499
54.7
45.3
69.7
44.6
2.9
40.3
35.3
49.6
2.4
23.2
39.5
63.5
47.6
14.7
25.7
28.2
31.8
Country information Spain Country profile · Media Use · Distance selling · “Customer jour-ney“ · Drivers & barriers in distance selling · Cross-border shopping · Dialog marketing

Shop the World 285
61+26+13
CROSS-BORDER SHOPPING – OVERVIEW
Previous orders abroad
Previous and future orders abroad by country · in % *
Germany[31.8]
Hong Kong[20.5]
1
2
3
4
5
Great Britain[48.6]
China[44.6]
USA[41.8]
Future orders abroad
Spain
* Source: DHL Global Mail 2013 ∙ n Global from 4,738 to 8,807 ∙ n Spain from 263 to 405 ** split into "further orders planned“ 58.6 % Spain and "no further orders planned" 2 % Spain
No clear import favorite
Spanish consumers already liketo frequently order from abroad. More than 60% use this possibility. Furthermore, every forth user plans to purchase from abroad in the future. Cur-rently there are no preferences in the shopping destination when ordering from abroad. The same is expected for the future. However, Great Britain, China, USA, and Germany are popular. In the future, these countries will be increasingly visible on the shopping map. Also the neighbouring country France will join this group in the future. China
[50.8]
France[45.3]
USA[66.6]
Great Britain[58.2]
Germany[55.8]
Country information Spain Country profile · Media Use · Distance selling · “Customer jour-ney“ · Drivers & barriers in distance selling · Cross-border shop-ping · Dialog marketing
Use of cross-border eCommerce· in % *
Yes, already ordered **No, but future orders planned No, no future orders planned
26.0
60.6
13.4

Shop the World 286
Products not obtainable domestically
Higher quality of the products
Lower prices
Greater selection
Assurance against product counter-
feiting
High delivery costs Language problems
Customs clearance
Non-transparent costs
Uncertainty with problems
No demand because all products are obtainable locally
Long delivery times
Unknown product quality
Complicated return process
Concerns regarding data protection Fear of fraud Uncertain delivery
Concern about misuse of payment data
Uncertainty regarding warranty terms, payment process, legal situation, etc.
Drivers for ordering abroad· Spain in % *
Barriers to ordering abroad · Spain in % *
Globally
73.3
24.2
62.9
41.2
11.7
Globally
53.7
31.6
41.3
41.3
33.3
12.5
56.1
35.7
50.8
24.5
41.6
39.5
31.6
39.3
Complicated returns
Main drivers for cross-border shopping are the availability of products and lower prices. Long delivery times and com-plicated return processes are seen as obstacles.
CROSS-BORDER SHOPPING – DRIVERS & BARRIERS
* Source: DHL Global Mail 2013 ∙ n Global from 7,289 to 10,689 ∙ n Spain from 366 to 485
44.9
32.2
34.0
31.8
37.9
9.6
49.3
26.7
55.9
21.2
36.9
40.0
37.5
38.0
71.2
6.3
70.9
38.7
6.3
Country information Spain Country profile · Media Use · Distance selling · “Customer jour-ney“ · Drivers & barriers in distance selling · Cross-border shop-ping · Dialog marketing

Shop the World 287
Receipt of mailings and catalogs · Spain in % *
5 and 63 and 41 and 2
DIALOG MARKETING
Reading mailings and catalogs · in % *,**
Spain
Globally
13.2 35.3 51.5
22.1 35.2 42.7
5 and 63 and 41 and 2
Response to mailings and catalogs · in % *,**
Spain
Globally
18.7 54.5 26.9
29.0 45.8 25.3
Response channel for mailings and catalogs · Spain in % * Globally
Website visits
Visits to stores or
branch offices
Other online
response (e.g. chat,
Twitter, Facebook,
newsletter
registration, etc.)
Phone call
Business reply card
79.9 73.4
48.6
30.0
24.5
18.4
12.6
* Source: DHL Global Mail 2013 ∙ n Global from 8,788 to 11,265 ∙ n Spain from 455 to 506 ** scale from 1 "never“ to 6 "almost always“
Catalogs are appreciated
Only one in twenty Spanish dis- tance selling clients does not receive any mailings or cata-logs. The frequency, however, is slightly below the interna- tional level. Almost one fifth re- ceives communication mate-rial of this type once or sever-al times a week. Spanish con- sumers like to read direct mails. They also tend to respond more frequently. 79.9% visit the web-site while 56.8% follow up with a visit to a local retail outlet. Off-line response channels, such as phone calls or response cards, are used less frequently.
Globally
One or more times per week
One or more times per month
Less than once per month
Never
26.9
33.7
27.7
11.6 56.8
37.1
30.3
13.6
5.4
20.2
41.0
32.5
6.3
Country information Spain Country profile · Media Use · Distance selling · “Customer jour-ney“ · Drivers & barriers in distance selling · Cross-border shop-ping · Dialog marketing
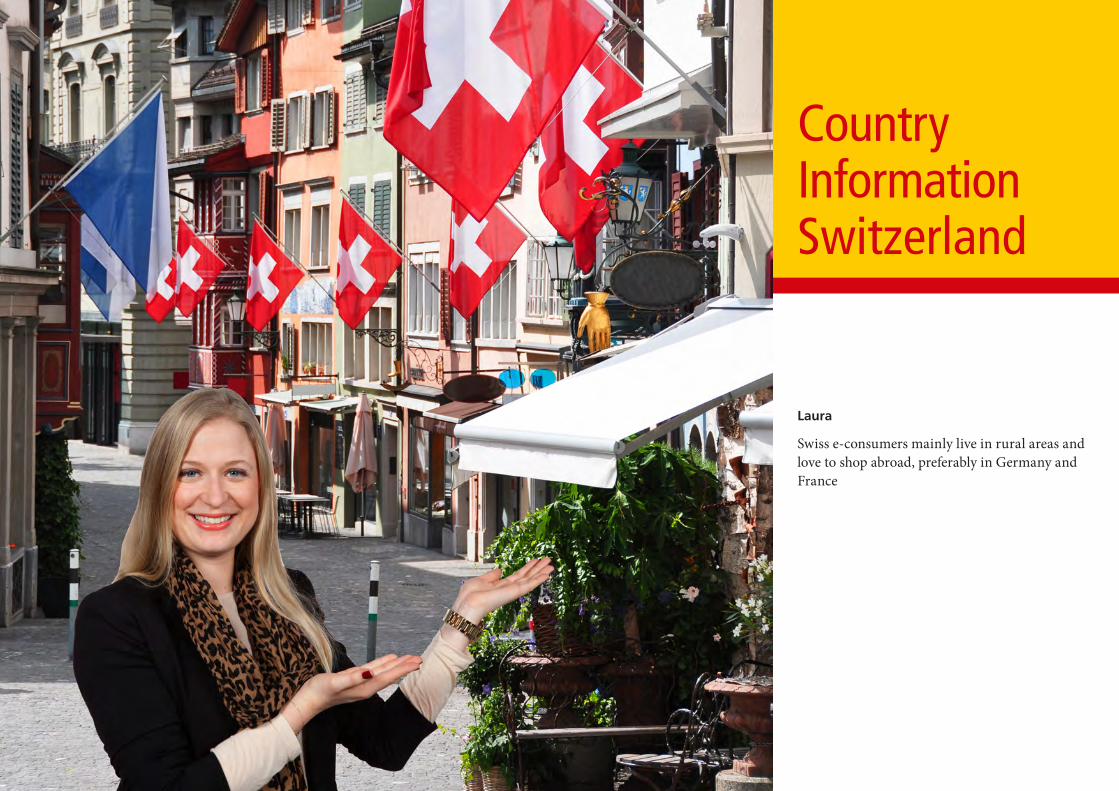
Country Information Switzerland
Laura
Swiss e-consumers mainly live in rural areas and love to shop abroad, preferably in Germany and France
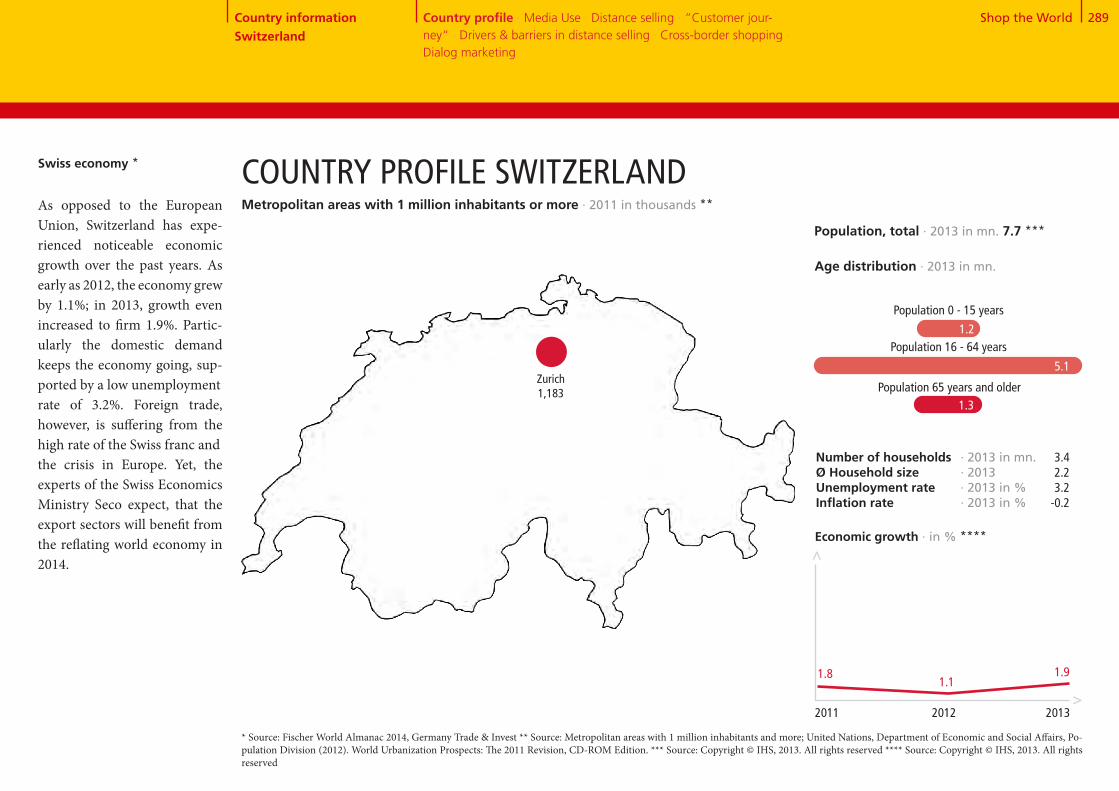
Shop the World 289Country information Switzerland
Country profile · Media Use · Distance selling · “Customer jour-ney“ · Drivers & barriers in distance selling · Cross-border shopping · Dialog marketing
1.2
Population 0 - 15 years
Swiss economy * COUNTRY PROFILE SWITZERLAND
Zurich 1,183
* Source: Fischer World Almanac 2014, Germany Trade & Invest ** Source: Metropolitan areas with 1 million inhabitants and more; United Nations, Department of Economic and Social Affairs, Po-pulation Division (2012). World Urbanization Prospects: The 2011 Revision, CD-ROM Edition. *** Source: Copyright © IHS, 2013. All rights reserved **** Source: Copyright © IHS, 2013. All rights reserved
Number of households Ø Household sizeUnemployment rateInflation rate
1.1
Economic growth · in % ****
>
>
1.91.8
2011 2012 2013
Age distribution · 2013 in mn.
Population 65 years and older
Population, total · 2013 in mn. 7.7 ***
Population 16 - 64 years
· 2013 in mn.· 2013· 2013 in %· 2013 in %
3.42.23.2
-0.2
As opposed to the European Union, Switzerland has expe-rienced noticeable economic growth over the past years. As early as 2012, the economy grewby 1.1%; in 2013, growth even increased to firm 1.9%. Partic- ularly the domestic demand keeps the economy going, sup-ported by a low unemploymentrate of 3.2%. Foreign trade, however, is suffering from the high rate of the Swiss franc andthe crisis in Europe. Yet, the experts of the Swiss Economics Ministry Seco expect, that the export sectors will benefit from the reflating world economy in 2014.
5.1
1.3
Metropolitan areas with 1 million inhabitants or more · 2011 in thousands **

Shop the World 290
29+4+1+11+14+24+17
Country information Switzerland
Country profile · Media Use · Distance selling · “Customer jour-ney“ · Drivers & barriers in distance selling · Cross-border shopping · Dialog marketing
MEDIA USE IN SWITZERLAND
41.9
135.3
Smartphone market penetration · in % *****Representative domestic population 16+, n = 1,000
42.7
Internet users · 2012 per 100 people **
Permanent access to broadband internet · 2012 per 100 people ***
Cellphones · 2012 per 100 people ****
2012 2013
54.0
Share of adspend by medium · in % *
TV Radio Movies Outdoor advertising
Total advertising expenditure · in EUR bn. *
Internet Newspapers Magazines
>>
* Source: Zenith Optimedia, 2013 ** Source: Copyright © IHS, 2013. All rights reserved *** Source: The World Bank **** Source: Copyright © IHS, 2013. All rights reserved **** Source: Our Mobile Planet: Google Global Smart phone Study 2013, http://www.thinkwithgoogle.com/mobileplanet/
2011 2012 2013 2014 2015
4.5
85.2
4.54.5
4.4
4.4
2016
4.5
13.5
24.2
17.8
10.8
0.6
4.3
28.7
Internet use
The internet is clearly inte- grated into the Swiss‘s every day life and fast internet connec-tions are available almost every- where. As smartphones are spreading, the use of mo- bile internet is becoming more frequent. As many as 54% of all Swiss already own a smart- phone. Thus, the alpine coun-try belongs to the mobile world elite.
Online video, TV, and cinema
At 0.3%-0.6%, future growth of adspends will be lower than in the past. However, advertising expenditures for online video, TV, and cinema are growing strongly. Innovative formats also contribute to an increase in out of home advertising.
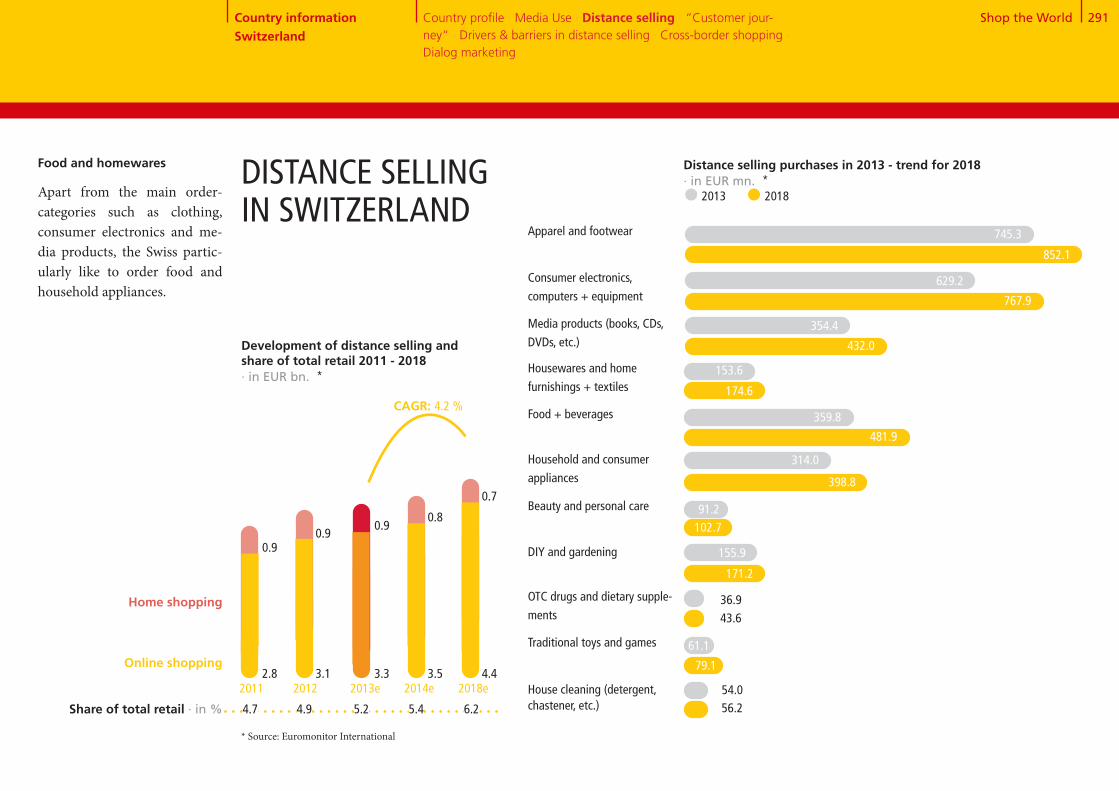
Shop the World 291
Distance selling purchases in 2013 - trend for 2018 · in EUR mn. * 2013 2018
Food and homewares
Apart from the main order- categories such as clothing, consumer electronics and me-dia products, the Swiss partic- ularly like to order food and household appliances.
DISTANCE SELLING IN SWITZERLAND
852.1
Apparel and footwear
767.9
629.2
432.0
354.4
174.6
153.6
481.9
314.0
398.8
102.7
171.2
155.9
36.9
79.1
61.1
56.2
Consumer electronics,
computers + equipment
Media products (books, CDs,
DVDs, etc.)
Housewares and home
furnishings + textiles
Food + beverages
Household and consumer
appliances
Beauty and personal care
DIY and gardening
OTC drugs and dietary supple-
ments
Traditional toys and games
House cleaning (detergent, chastener, etc.)
Development of distance selling and share of total retail 2011 - 2018 · in EUR bn. *
CAGR: 4.2 %
Home shopping
Online shopping2.8 3.1 3.3
0.90.9
0.9
3.5 4.4
0.8
0.7
2011 2012 2013e 2014e 2018e
Share of total retail · in % 4.7 4.9 5.2 5.4 6.2
* Source: Euromonitor International
745.3
54.0
Country information Switzerland
Country profile · Media Use · Distance selling · “Customer jour-ney“ · Drivers & barriers in distance selling · Cross-border shopping · Dialog marketing
359.8
91.2
43.6
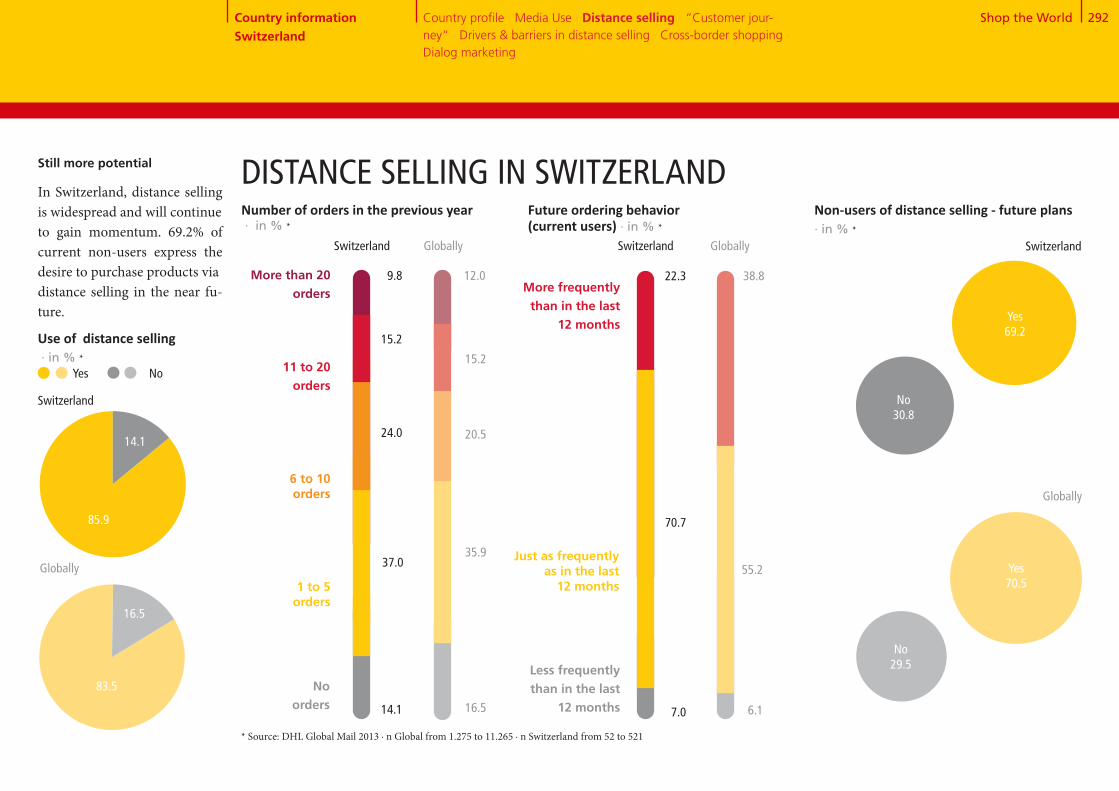
Shop the World 292
86+1484
+16
Still more potential
In Switzerland, distance selling is widespread and will continueto gain momentum. 69.2% of current non-users express the desire to purchase products viadistance selling in the near fu-ture.
Use of distance selling · in % *
85.9
14.1
Switzerland
Globally
83.5
16.5
Number of orders in the previous year · in % *
1 to 5 orders
6 to 10 orders
11 to 20 orders
More than 20 orders
No orders
24.0
37.0
15.2
14.1
9.8
20.5
35.9
15.2
16.5
12.0
Future ordering behavior (current users) · in % *
More frequently than in the last
12 months
Just as frequently as in the last
12 months
Less frequently than in the last
12 months
70.7
22.3
55.2
38.8
7.0 6.1
Non-users of distance selling - future plans · in % *
Yes69.2
Switzerland
Globally
Yes70.5
No30.8
No29.5
Yes No
Switzerland Globally Switzerland Globally
DISTANCE SELLING IN SWITZERLAND
* Source: DHL Global Mail 2013 ∙ n Global from 1.275 to 11.265 ∙ n Switzerland from 52 to 521
Country information Switzerland
Country profile · Media Use · Distance selling · “Customer jour-ney“ · Drivers & barriers in distance selling · Cross-border shopping · Dialog marketing
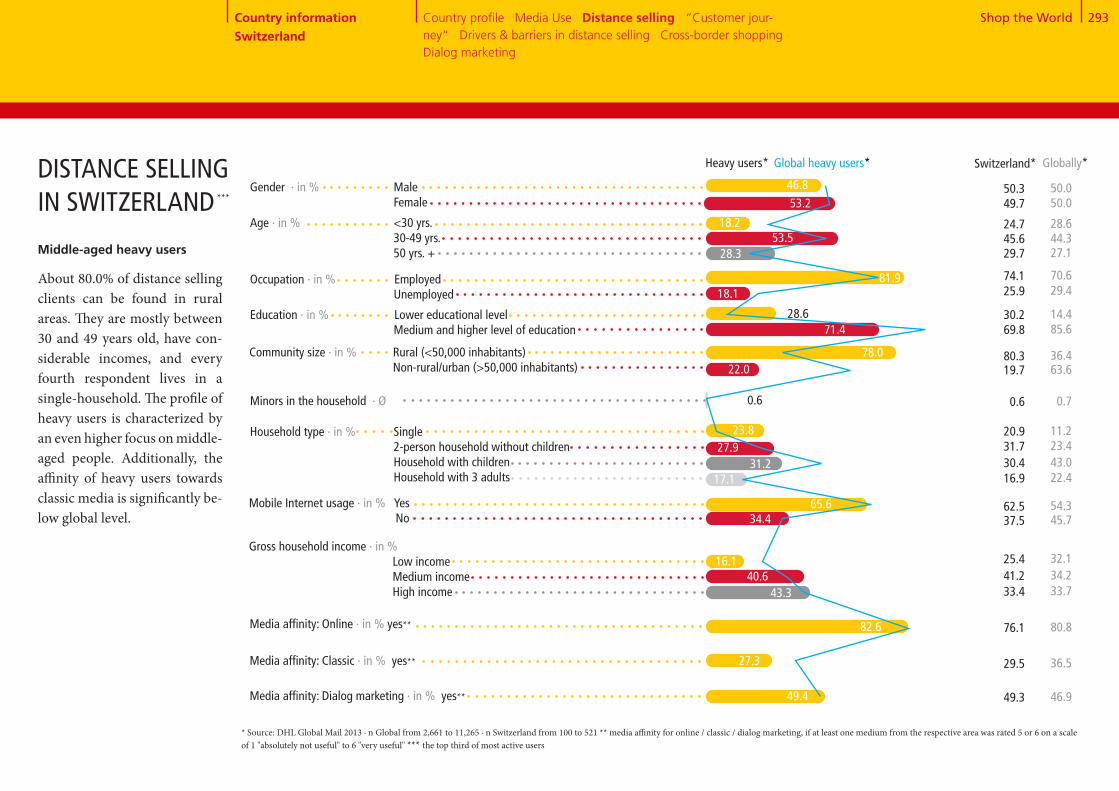
Shop the World 293
Globally*
53.5
Gender · in % Male Female
Age · in % <30 yrs. 30-49 yrs. 50 yrs. +
Occupation · in % Employed Unemployed
Education · in % Lower educational level Medium and higher level of education
28.6
Media affinity: Online · in % yes**
Community size · in % Rural (<50,000 inhabitants) Non-rural/urban (>50,000 inhabitants)
Minors in the household · Ø
Household type · in % Single 2-person household without children Household with children Household with 3 adults
Mobile Internet usage · in % Yes No
Gross household income · in % Low income Medium income High income
Media affinity: Classic · in % yes**
Media affinity: Dialog marketing · in % yes** 49.4
27.3
82.6
43.340.6
16.1
34.465.6
17.131.2
53.2
18.2
46.8
18.1
71.4
22.0
0.6
27.923.8
81.9
Middle-aged heavy users
About 80.0% of distance selling clients can be found in rural areas. They are mostly between 30 and 49 years old, have con-siderable incomes, and every fourth respondent lives in a single-household. The profile of heavy users is characterized by an even higher focus on middle- aged people. Additionally, the affinity of heavy users towards classic media is significantly be-low global level.
DISTANCE SELLING IN SWITZERLAND
* Source: DHL Global Mail 2013 ∙ n Global from 2,661 to 11,265 ∙ n Switzerland from 100 to 521 ** media affinity for online / classic / dialog marketing, if at least one medium from the respective area was rated 5 or 6 on a scale of 1 "absolutely not useful" to 6 "very useful" *** the top third of most active users
44.327.1
14.4
36.4
46.9
36.5
80.8
33.734.232.1
45.754.3
22.443.0
50.0
28.6
50.0
29.4
85.6
63.6
0.7
23.411.2
70.6
Country information Switzerland
Country profile · Media Use · Distance selling · “Customer jour-ney“ · Drivers & barriers in distance selling · Cross-border shopping · Dialog marketing
***
Switzerland*
45.629.7
30.2
80.3
49.3
29.5
76.1
33.441.225.4
37.562.5
16.930.4
49.7
24.7
50.3
25.9
69.8
19.7
0.6
31.720.9
74.1
28.3
78.0
Heavy users* Global heavy users*
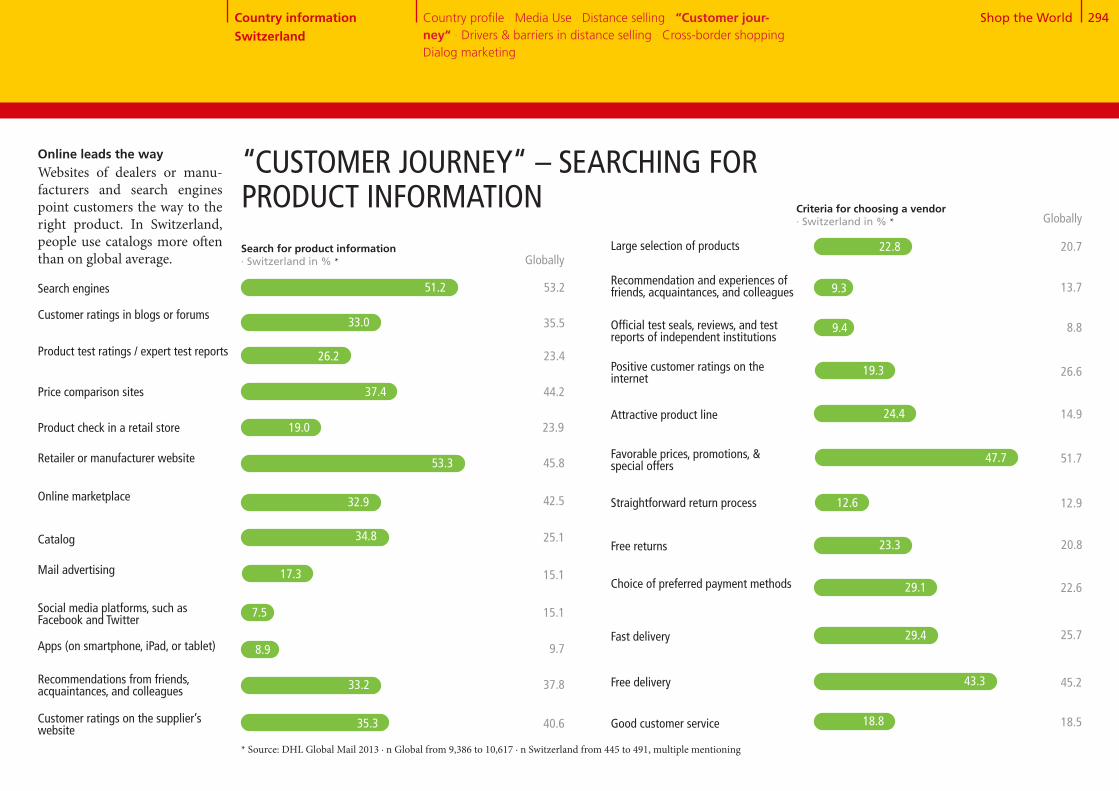
Shop the World 294
Search engines
Customer ratings in blogs or forums
Product test ratings / expert test reports
Product check in a retail store
Retailer or manufacturer website
Online marketplace
Catalog
Mail advertising
Social media platforms, such as Facebook and Twitter
Apps (on smartphone, iPad, or tablet)
Recommendations from friends, acquaintances, and colleagues
Customer ratings on the supplier’s website
Price comparison sites
Large selection of products
Recommendation and experiences of friends, acquaintances, and colleagues
Official test seals, reviews, and test reports of independent institutions
Attractive product line
Favorable prices, promotions, & special offers
Straightforward return process
Free returns
Choice of preferred payment methods
Fast delivery
Free delivery
Good customer service
Positive customer ratings on the internet
“CUSTOMER JOURNEY“ – SEARCHING FOR PRODUCT INFORMATIONSearch for product information · Switzerland in % * Globally
33.0 35.5
53.2
26.2 23.4
37.4 44.2
19.0 23.9
53.3 45.8
32.9 42.5
34.8 25.1
17.3 15.1
7.5 15.1
8.9 9.7
33.2 37.8
Criteria for choosing a vendor · Switzerland in % * Globally
51.2
35.3 40.6
9.3 13.7
20.7
9.4 8.8
19.3 26.6
24.4 14.9
47.7 51.7
12.6 12.9
23.3 20.8
29.1 22.6
29.4 25.7
43.3 45.2
18.8 18.5
22.8
Online leads the wayWebsites of dealers or manu- facturers and search engines point customers the way to the right product. In Switzerland, people use catalogs more often than on global average.
* Source: DHL Global Mail 2013 ∙ n Global from 9,386 to 10,617 ∙ n Switzerland from 445 to 491, multiple mentioning
Country information Switzerland
Country profile · Media Use · Distance selling · “Customer jour-ney“ · Drivers & barriers in distance selling · Cross-border shopping · Dialog marketing
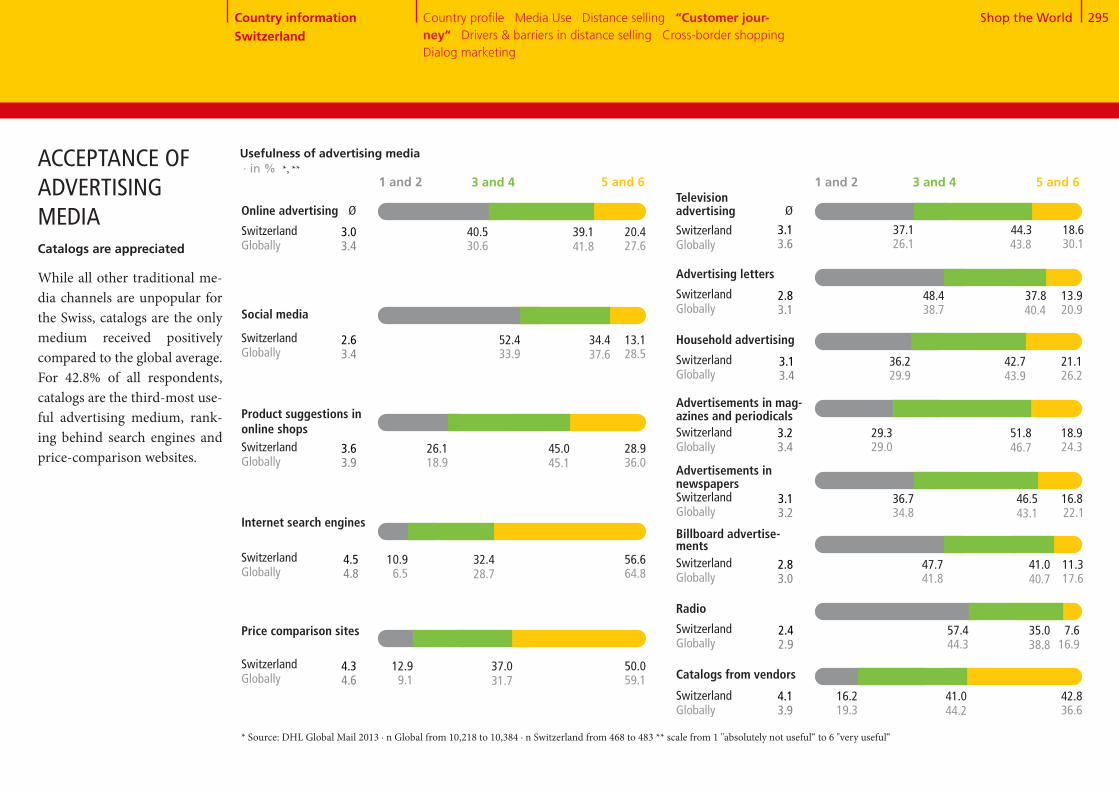
Shop the World 295
Usefulness of advertising media · in % *, **
5 and 63 and 41 and 2
Ø
44.337.1 18.626.1 43.8 30.1
Online advertising
* Source: DHL Global Mail 2013 ∙ n Global from 10,218 to 10,384 ∙ n Switzerland from 468 to 483 ** scale from 1 "absolutely not useful“ to 6 "very useful“
Catalogs are appreciated
While all other traditional me-dia channels are unpopular for the Swiss, catalogs are the only medium received positively compared to the global average.For 42.8% of all respondents, catalogs are the third-most use-ful advertising medium, rank-ing behind search engines and price-comparison websites.
ACCEPTANCE OF ADVERTISING MEDIA
SwitzerlandGlobally
Country information Switzerland
Country profile · Media Use · Distance selling · “Customer jour-ney“ · Drivers & barriers in distance selling · Cross-border shopping · Dialog marketing
Television advertising
5 and 63 and 41 and 2
3.13.6
Ø
39.140.5 20.430.6 41.8 27.6
3.03.4
37.848.4 13.938.7 40.4 20.9Social media
SwitzerlandGlobally
Advertising letters
2.83.1
34.452.4 13.133.9 37.6 28.5
2.63.4
Product suggestions in online shops
45.026.1 28.918.9 45.1 36.0
3.63.9
32.410.9 56.66.5 28.7 64.8
4.54.8
37.012.9 50.09.1 31.7 59.1
4.34.6
42.736.2 21.129.9 43.9 26.2
SwitzerlandGlobally
Household advertising
3.13.4
51.829.3 18.929.0 46.7 24.3
SwitzerlandGlobally
Advertisements in mag- azines and periodicals
3.23.4
46.536.7 16.834.8 43.1 22.1
SwitzerlandGlobally
Advertisements in newspapers
3.13.2
41.047.7 11.341.8 40.7 17.6
SwitzerlandGlobally
Billboard advertise-ments
2.83.0
35.057.4 7.644.3 38.8 16.9
SwitzerlandGlobally
Radio
2.42.9
41.016.2 42.819.3 44.2 36.6
SwitzerlandGlobally
Catalogs from vendors
4.13.9
SwitzerlandGlobally
SwitzerlandGlobally
SwitzerlandGlobally
Internet search engines
SwitzerlandGlobally
Price comparison sites
SwitzerlandGlobally
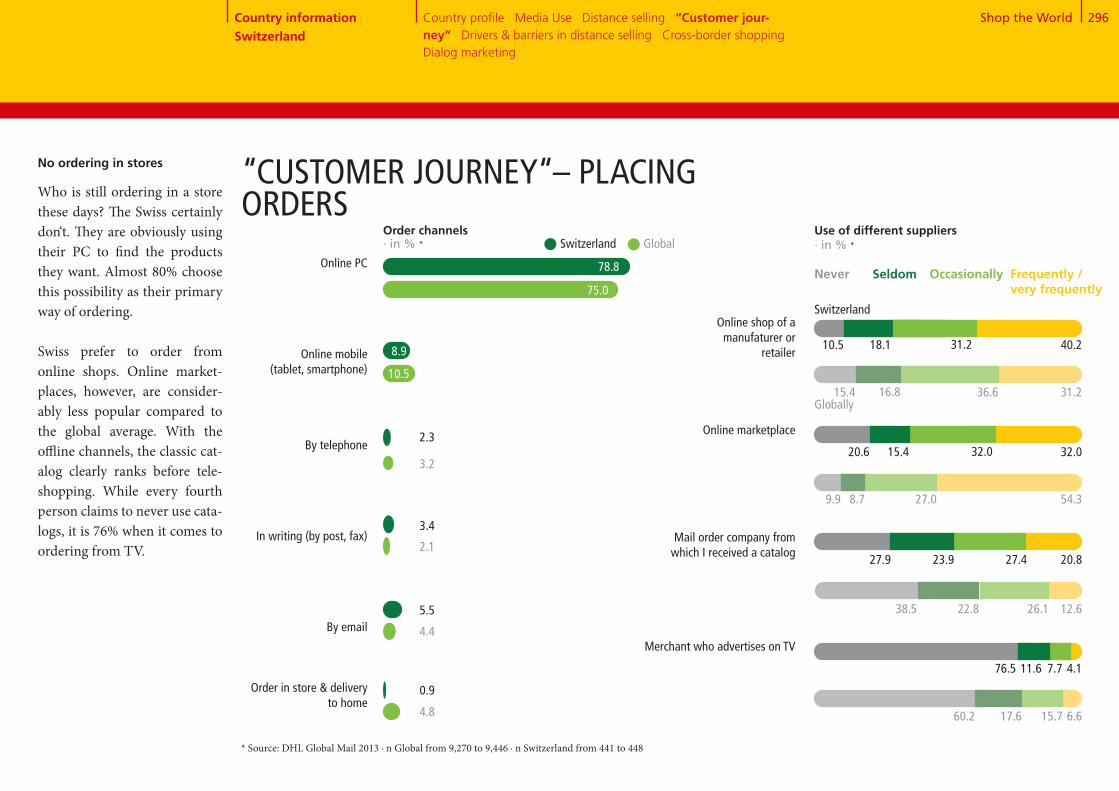
Shop the World 296
SeldomOnline PC
Online mobile (tablet, smartphone)
By telephone
In writing (by post, fax)
By email
Order in store & delivery to home
Online marketplace
Mail order company from which I received a catalog
Merchant who advertises on TV
Online shop of a manufaturer or
retailer
Use of different suppliers · in % *
Never Frequently / very frequently
Occasionally
* Source: DHL Global Mail 2013 ∙ n Global from 9,270 to 9,446 ∙ n Switzerland from 441 to 448
Switzerland Global
78.8
2.3
3.4
5.5
75.0
3.2
2.1
4.4
“CUSTOMER JOURNEY“– PLACING ORDERS
No ordering in stores
Who is still ordering in a store these days? The Swiss certainly don‘t. They are obviously using their PC to find the products they want. Almost 80% choose this possibility as their primary way of ordering.
Swiss prefer to order from online shops. Online market- places, however, are consider-ably less popular compared to the global average. With the offline channels, the classic cat- alog clearly ranks before tele- shopping. While every fourth person claims to never use cata-logs, it is 76% when it comes to ordering from TV.
10.5 40.218.1
15.4 31.216.8
31.2
36.6
Switzerland
Globally
20.6 32.015.4
9.9 54.38.7
32.0
27.0
27.9 20.823.9
38.5 12.622.8
27.4
26.1
76.5 4.111.6
60.2 6.617.6
7.7
15.7
8.9
10.5
0.9
4.8
Order channels · in % *
Country information Switzerland
Country profile · Media Use · Distance selling · “Customer jour-ney“ · Drivers & barriers in distance selling · Cross-border shopping · Dialog marketing

Shop the World 297
Invoice me, please!
Swiss distance selling clients prefer to pay for goods after receiving them: 44.4% fre-quently use this payment op-tion. Credit cards are used sim- ilarly often. However, 20% of all respondents never use a credit card for their purchase. Online payment systems, which are quite popular elsewhere, are rarely used in Switzerland.
Cash on delivery
Prepayment
Direct debit
Credit card
* Source: DHL Global Mail 2013 ∙ n Global from 9,218 to 9,324 ∙ n Switzerland from 438 to 443
“CUSTOMER JOURNEY“– PAYMENT METHODS
Online payment systems
Installment purchase / financing
Debit card
Invoice
Payment options · in % *
Never Frequently / very frequentlyOccasionally
Switzerland
Globally
20.0 11.7 24.3 44.0
29.3 9.8 18.7 42.3
70.9 14.1 10.4 4.7
55.8 16.3 16.1 11.7
45.4 22.5 17.7 14.4
53.4 16.1 15.5 15.0
80.5 9.7 4.0 5.7
56.0 15.5 16.4 12.19.0
14.2 32.3 44.4
54.4 15.8 16.3 13.4
44.9 16.7 20.0 18.4
33.3 12.9 20.1 33.7
84.7 6.9 4.5 3.9
78.0 9.5 8.1 4.4
78.0 8.4 6.4 7.1
55.1 10.8 15.7 18.4
Country information Switzerland
Country profile · Media Use · Distance selling · “Customer jour-ney“ · Drivers & barriers in distance selling · Cross-border shopping · Dialog marketing
Seldom
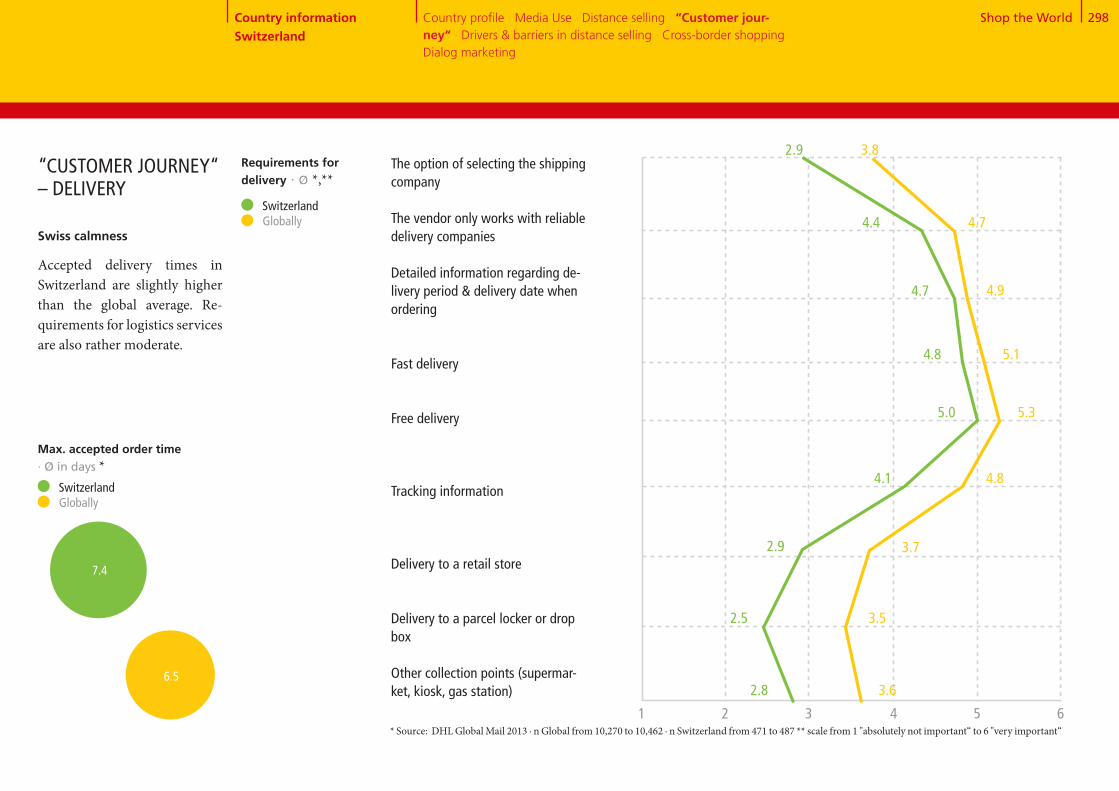
Shop the World 298
The option of selecting the shipping company The vendor only works with reliable delivery companies
Detailed information regarding de-livery period & delivery date when ordering
Fast delivery
Free delivery
Tracking information
Delivery to a retail store
Delivery to a parcel locker or drop box
Other collection points (supermar-ket, kiosk, gas station)
Switzerland Globally
2.8
2.5
2.9
5.0
4.1
4.8
2.9
4.7
4.4
Max. accepted order time · Ø in days *
3.6
3.5
3.7
5.3
4.8
5.1
3.8
4.9
4.7
* Source: DHL Global Mail 2013 ∙ n Global from 10,270 to 10,462 ∙ n Switzerland from 471 to 487 ** scale from 1 "absolutely not important“ to 6 "very important“
Swiss calmness
Accepted delivery times in Switzerland are slightly higher than the global average. Re- quirements for logistics services are also rather moderate.
“CUSTOMER JOURNEY“ – DELIVERY
1 2 3 4 5 6
Requirements for delivery · Ø *,**
Country information Switzerland
Country profile · Media Use · Distance selling · “Customer jour-ney“ · Drivers & barriers in distance selling · Cross-border shopping · Dialog marketing
7.4
6.5
Switzerland Globally

Shop the World 299
34+66
72+28
Number of returns per capita per year · Ø * Switzerland Globally
0.8
1.1
Return rate · in % * Switzerland Globally
5.9
Reasons for returns · Switzerland in % *
Defective product 15.8
Percentage of users who returned goods · in % *
34.1
65.9
Switzerland Globally
Yes No
“CUSTOMER JOURNEY“– RETURNSSwitzerland - The land of returns
In Switzerland, returns are common. Every third customer has already returned a product. The average number of returns per capita is also higher than on global average. Reasons for returning goods can attributed to three main aspects: In most cases, the product simply did not fit. Also, it is quite common that people do not like the prod- uct or that the customer takes his shopping experience home and orders multiple variants to have a wider choice.
27.5
72.5
* Source: DHL Global Mail 2013 ∙ n Global from 2,648 to 9,325 ∙ n Switzerland from 148 to 430
Differing product description
Delivery of the wrong product
Wrong product was ordered
Product did not fit
Ordered multiple variants to choose from
Delivery period too long
Found less expensive product
Deficient product quality
Product was not liked
16.1
6.8
59.9
44.0
31.7
3.3
0.7
Globally
32.3
30.0
17.8
13.3
8.5
37.7
29.9
15.5
5.8
3.9
26.9
8.8
Country information Switzerland
Country profile · Media Use · Distance selling · “Customer jour-ney“ · Drivers & barriers in distance selling · Cross-border shopping · Dialog marketing
9.4
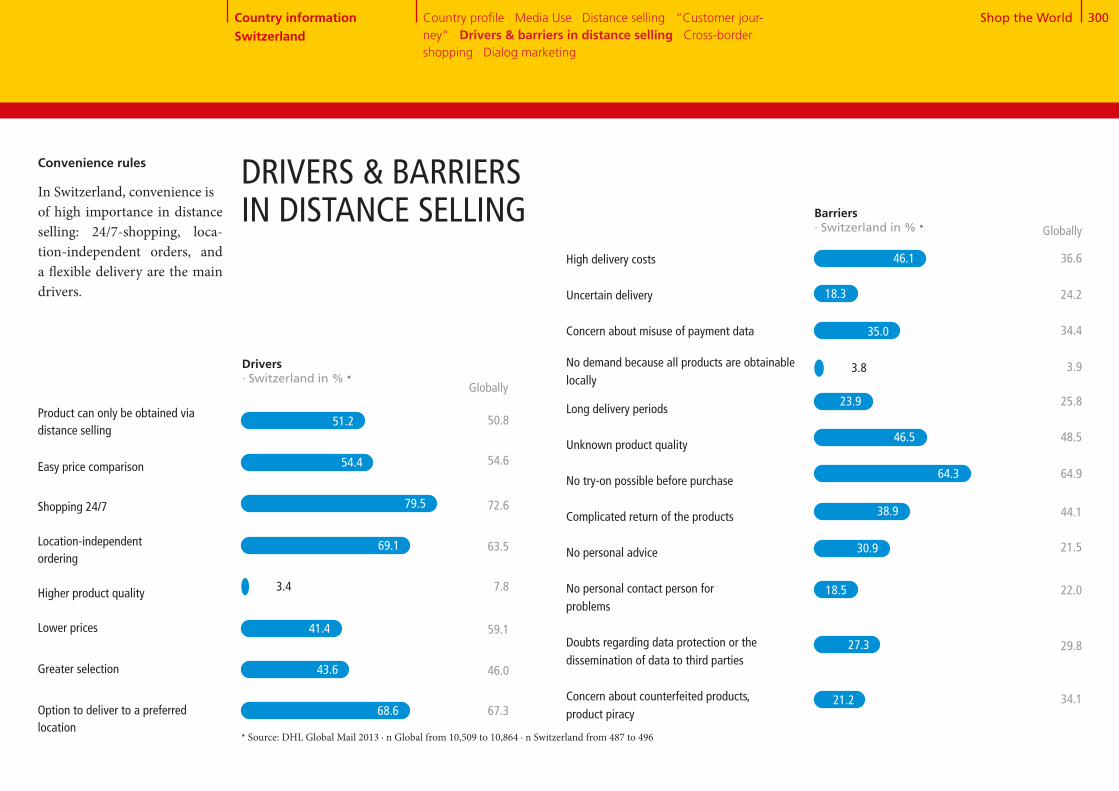
Shop the World 300
High delivery costs
Uncertain delivery
Concern about misuse of payment data
No demand because all products are obtainable locally
Long delivery periods
Unknown product quality
No try-on possible before purchase
Complicated return of the products
No personal advice
No personal contact person for problems
Doubts regarding data protection or thedissemination of data to third parties
Concern about counterfeited products, product piracy
Product can only be obtained via distance selling
Easy price comparison
Shopping 24/7
Location-independent ordering
Higher product quality
Lower prices
Greater selection
Option to deliver to a preferred location
DRIVERS & BARRIERS IN DISTANCE SELLING Barriers
· Switzerland in % *
50.8
54.6
72.6
63.5
7.8
59.1
46.0
67.3
41.4
43.6
68.6
Globally
36.6
24.2
34.4
3.9
25.8
48.5
64.9
44.1
21.5
22.0
29.8
34.1
Convenience rules
In Switzerland, convenience isof high importance in distance selling: 24/7-shopping, loca- tion-independent orders, and a flexible delivery are the main drivers.
Drivers · Switzerland in % *
Globally
* Source: DHL Global Mail 2013 ∙ n Global from 10,509 to 10,864 ∙ n Switzerland from 487 to 496
51.2
54.4
79.5
69.1
3.4
46.1
18.3
35.0
3.8
23.9
46.5
64.3
38.9
30.9
18.5
27.3
21.2
Country information Switzerland
Country profile · Media Use · Distance selling · “Customer jour-ney“ · Drivers & barriers in distance selling · Cross-border shopping · Dialog marketing

Shop the World 301
77+12+11CROSS-BORDER SHOPPING – OVERVIEW
Previous orders abroad
Previous and future orders abroad by country · in % *
Great Britain[24.1]
China[14.3]
1
2
3
4
5
Germany[62.3]
France[41.6]
USA[37.3]
Future orders abroad
Switzerland
* Source: DHL Global Mail 2013 ∙ n Global from 4,738 to 8,807 ∙ n Switzerland from 369 to 451 ** split into "further orders planned“ 71.7% Switzerland and "no further orders planned" 5.7% Switzerland
Who invented it?
The Swiss – this could be the answer to the question about the country that discovered ordering abroad. After all, just over three fourths of all cus- tomers in Switzerland have al-ready used cross-border shop-ping. This value is significantly higher than the global average. Additionally, only 11% of re- spondents do not intend to order from abroad. Preferred shopping destinations are Ger-many and France, followed by the US and Great Britain.
Great Britain[42.2]
Other European countries[36.5]
Germany[77.5]
France[58.1]
USA[56.2]
Country information Switzerland
Country profile · Media Use · Distance selling · “Customer jour-ney“ · Drivers & barriers in distance selling · Cross-border shop-ping · Dialog marketing
Use of cross-border eCommerce · in % *
Yes, already ordered **No, but future orders planned No, no future orders planned
11.6
77.4
11.0

Shop the World 302
Products not obtainable domestically
Higher quality of the products
Lower prices
Greater selection
Assurance against product counter-
feiting
High delivery costs Language problems
Customs clearance
Non-transparent costs
Uncertainty with problems
No demand because all products are obtainable locally
Long delivery times
Unknown product quality
Complicated return process
Concerns regarding data protection Fear of fraud Uncertain delivery
Concern about misuse of payment data
Uncertainty regarding warranty terms, payment process, legal situation, etc.
Drivers for ordering abroad· Switzerland in % *
Barriers to ordering abroad · Switzerland in % *
Globally
73.3
24.2
62.9
41.2
11.7
Globally
53.7
31.6
41.3
41.3
33.3
12.5
56.1
35.7
50.8
24.5
41.6
39.5
31.6
39.3
Great variety and low prices
It is well-known that Switzer-land has high living expenses. It is thus not surprising that customers are driven to look for cheaper prices abroad. But awider variety of products of- fered in other countries is evenmore important.
CROSS-BORDER SHOPPING – DRIVERS & BARRIERS
* Source: DHL Global Mail 2013 ∙ n Global from 7,289 to 10,689 ∙ n Switzerland from 427 to 500
59.7
19.4
52.2
44.1
29.5
7.0
46.8
32.9
60.3
23.2
30.5
34.2
30.4
33.6
81.5
3.6
77.2
42.9
1.4
Country information Switzerland
Country profile · Media Use · Distance selling · “Customer jour-ney“ · Drivers & barriers in distance selling · Cross-border shop-ping · Dialog marketing
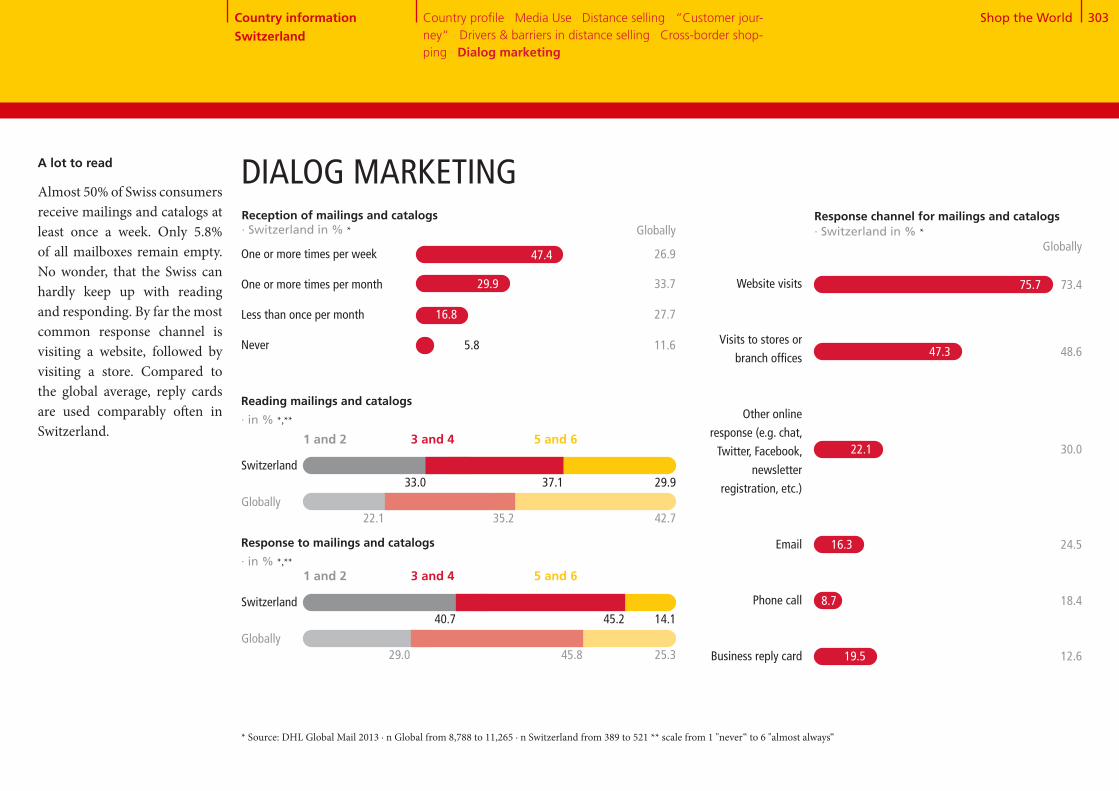
Shop the World 303
Reception of mailings and catalogs · Switzerland in % *
5 and 63 and 41 and 2
DIALOG MARKETING
Reading mailings and catalogs
· in % *,**
Switzerland
Globally
33.0 37.1 29.9
22.1 35.2 42.7
5 and 63 and 41 and 2
Response to mailings and catalogs · in % *,**
Switzerland
Globally
40.7 45.2 14.1
29.0 45.8 25.3
Response channel for mailings and catalogs · Switzerland in % * Globally
Website visits
Visits to stores or
branch offices
Other online
response (e.g. chat,
Twitter, Facebook,
newsletter
registration, etc.)
Phone call
Business reply card
75.7 73.4
48.6
30.0
24.5
18.4
12.6
* Source: DHL Global Mail 2013 ∙ n Global from 8,788 to 11,265 ∙ n Switzerland from 389 to 521 ** scale from 1 "never“ to 6 "almost always“
A lot to read
Almost 50% of Swiss consumers receive mailings and catalogs at least once a week. Only 5.8% of all mailboxes remain empty. No wonder, that the Swiss can hardly keep up with reading and responding. By far the most common response channel is visiting a website, followed by visiting a store. Compared to the global average, reply cards are used comparably often in Switzerland.
Globally
One or more times per week
One or more times per month
Less than once per month
Never
26.9
33.7
27.7
11.6 47.3
22.1
16.3
8.7
19.5
47.4
29.9
16.8
5.8
Country information Switzerland
Country profile · Media Use · Distance selling · “Customer jour-ney“ · Drivers & barriers in distance selling · Cross-border shop-ping · Dialog marketing
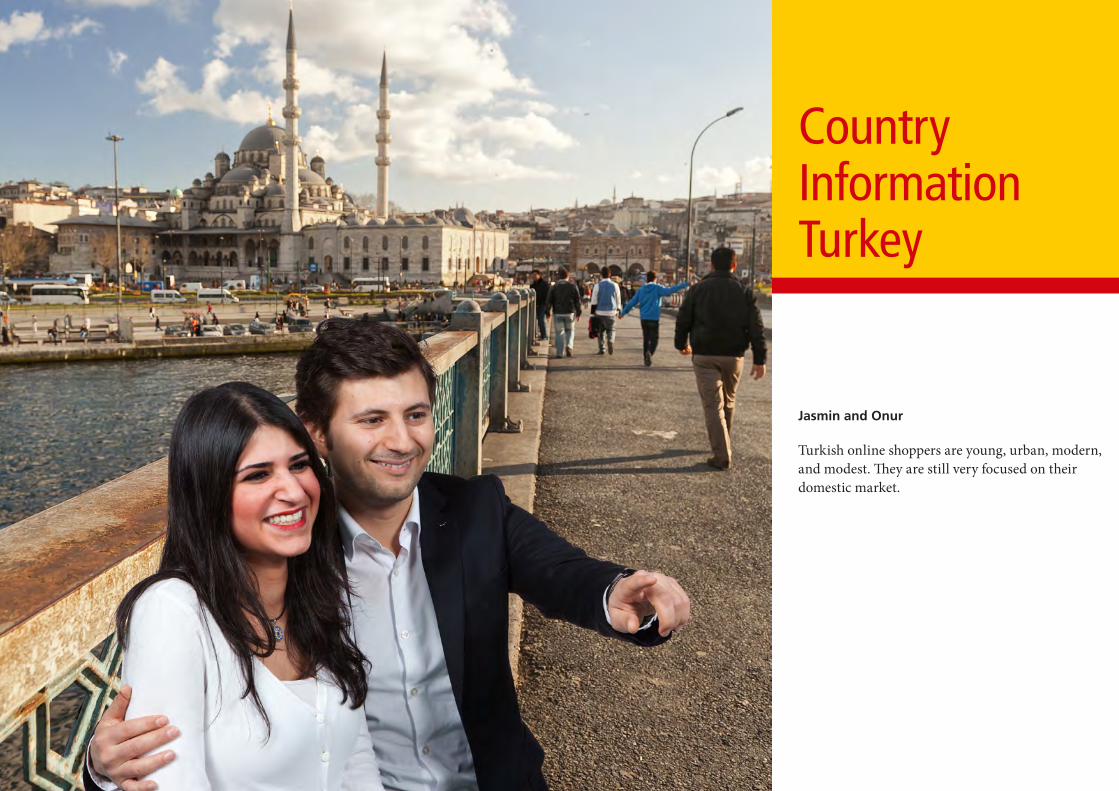
Country InformationTurkey
Jasmin and Onur
Turkish online shoppers are young, urban, modern, and modest. They are still very focused on their domestic market.
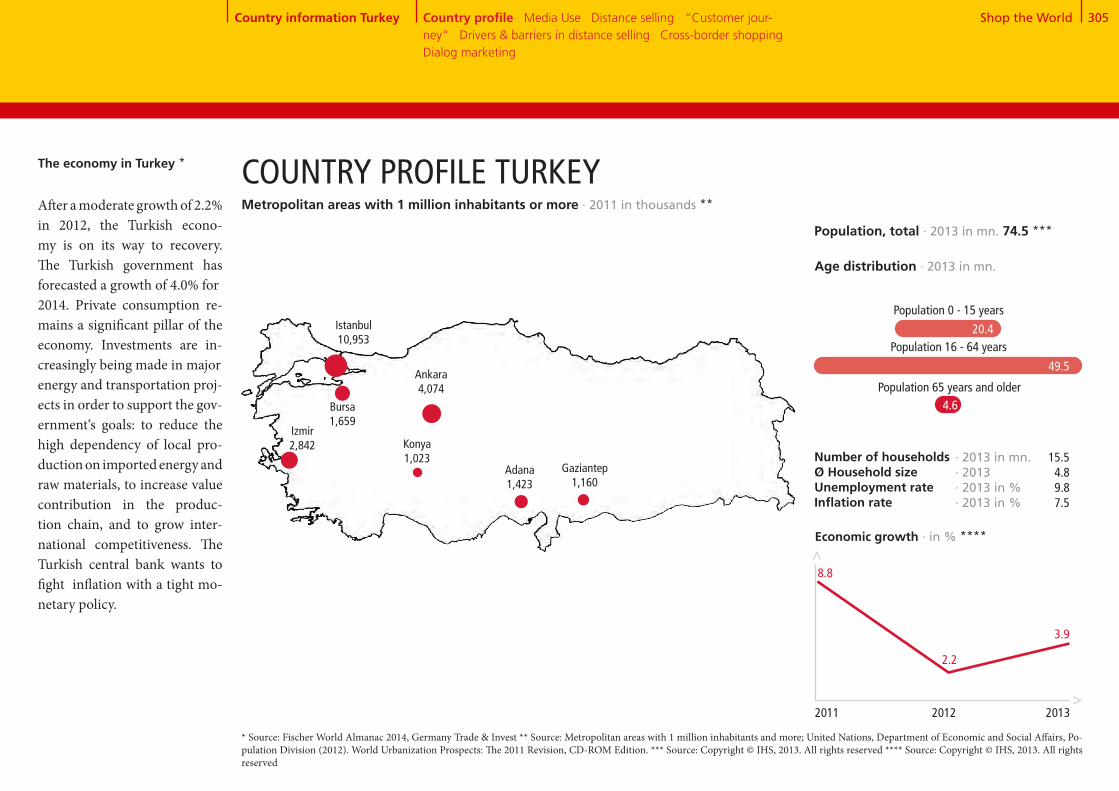
Shop the World 305Country information Turkey Country profile · Media Use · Distance selling · “Customer jour-ney“ · Drivers & barriers in distance selling · Cross-border shopping · Dialog marketing
20.4
Population 0 - 15 years
The economy in Turkey * COUNTRY PROFILE TURKEY
Istanbul 10,953
* Source: Fischer World Almanac 2014, Germany Trade & Invest ** Source: Metropolitan areas with 1 million inhabitants and more; United Nations, Department of Economic and Social Affairs, Po-pulation Division (2012). World Urbanization Prospects: The 2011 Revision, CD-ROM Edition. *** Source: Copyright © IHS, 2013. All rights reserved **** Source: Copyright © IHS, 2013. All rights reserved
Number of households Ø Household sizeUnemployment rateInflation rate
2.2
Economic growth · in % ****
>
>
3.9
8.8
2011 2012 2013
Age distribution · 2013 in mn.
Population 65 years and older
Population, total · 2013 in mn. 74.5 ***
Population 16 - 64 years
· 2013 in mn.· 2013· 2013 in %· 2013 in %
15.54.89.87.5
After a moderate growth of 2.2% in 2012, the Turkish econo- my is on its way to recovery. The Turkish government has forecasted a growth of 4.0% for2014. Private consumption re-mains a significant pillar of the economy. Investments are in-creasingly being made in majorenergy and transportation proj-ects in order to support the gov- ernment‘s goals: to reduce the high dependency of local pro-duction on imported energy and raw materials, to increase value contribution in the produc- tion chain, and to grow inter- national competitiveness. The Turkish central bank wants to fight inflation with a tight mo-netary policy.
49.5
4.6
Metropolitan areas with 1 million inhabitants or more · 2011 in thousands **
Adana 1,423
Bursa 1,659
Gaziantep 1,160
Ankara 4,074
Izmir 2,842 Konya
1,023

Shop the World 306
51+2+1+7+19+18+2
Country information Turkey Country profile · Media Use · Distance selling · “Customer jour-ney“ · Drivers & barriers in distance selling · Cross-border shopping · Dialog marketing
MEDIA USE IN TURKEY
10.5
90.8
Smartphone market penetration · in % *****Representative domestic population 16+, n = 1,000
14.0
Internet users · 2012 per 100 people **
Permanent access to broadband internet · 2012 per 100 people ***
Cellphones · 2012 per 100 people ****
2012 2013
29.6
Internet use
In Turkey, about half of the pop- ulation is online, but broad- band distribution is not yet high. Only 11% of inhabitants have access to broadband. That should change soon. The num-ber of broadband subscribers is to increase to at least 30 million (~40%) by 2023, the 100-year anniversary of the existence of the Turkish Republic.
Adverstising market
The strongest growth of the advertising market (15.1% in 2014) is predicted to con- tinue until 2016. TV spending still makes up more than 50% of total expenditures. With high growth rates, the share of Internet advertising spend con- tinues to grow but is still far from replacing TV as the most powerful medium.
Share of adspend by medium · in % *
TV Radio Movies Outdoor advertising
Total advertising expenditure · in EUR bn. *
Internet Newspapers Magazines
>>
* Source: Zenith Optimedia, 2013 ** Source: Copyright © IHS, 2013. All rights reserved *** Source: The World Bank **** Source: Copyright © IHS, 2013. All rights reserved **** Source: Our Mobile Planet: Google Global Smart phone Study 2013, http://www.thinkwithgoogle.com/mobileplanet/
2011 2012 2013 2014 20153.
1
45.1
2.7
2.4
2.2
2.0
2016
3.4
19.4
18.1
1.9
6.31.02.3
50.9

Shop the World 307
Convenient grocery shopping
With a size of € 2.9 bn, the Turk- ish distance selling market still has strong growth potential. Turkish customers in partic- ular enjoy purchasing food online. Orders make up al-most 25% of the market, which makes it quite unique. Almost as popular: consumer electron- ics.
DISTANCE SELLING IN TURKEY
870.6
Distance selling purchases in 2013 - trend for 2018 · in EUR mn. * 2013 2018
Apparel and footwear
1,292.1
677.2
356.9
226.6
340.3
222.6
561.0
101.0
167.6
77.3
87.2
43.5
23.9
33.9
25.3
0.0
Consumer electronics,
computers + equipment
Media products (books, CDs,
DVDs, etc.)
Housewares and home
furnishings + textiles
Food + beverages
Household and consumer
appliances
Beauty and personal care
DIY and gardening
OTC drugs and dietary supple-
ments
Traditional toys and games
House cleaning (detergent,
chastener, etc.)
Development of distance selling and share of total retail 2011 - 2018 · in EUR bn. *
CAGR: 12.4%
Home shopping
Online shopping1.3 1.7 2.2
0.7
0.7
0.7
2.6 4.7
0.7
0.5
2011 2012 2013e 2014e 2018e
Share of total retail · in % 1.4 1.6 1.8 2.0 3.0
* Source: Euromonitor International
404.4
0.0
Country information Turkey Country profile · Media Use · Distance selling · “Customer jour-ney“ · Drivers & barriers in distance selling · Cross-border shopping · Dialog marketing
720.8
49.3
55.6
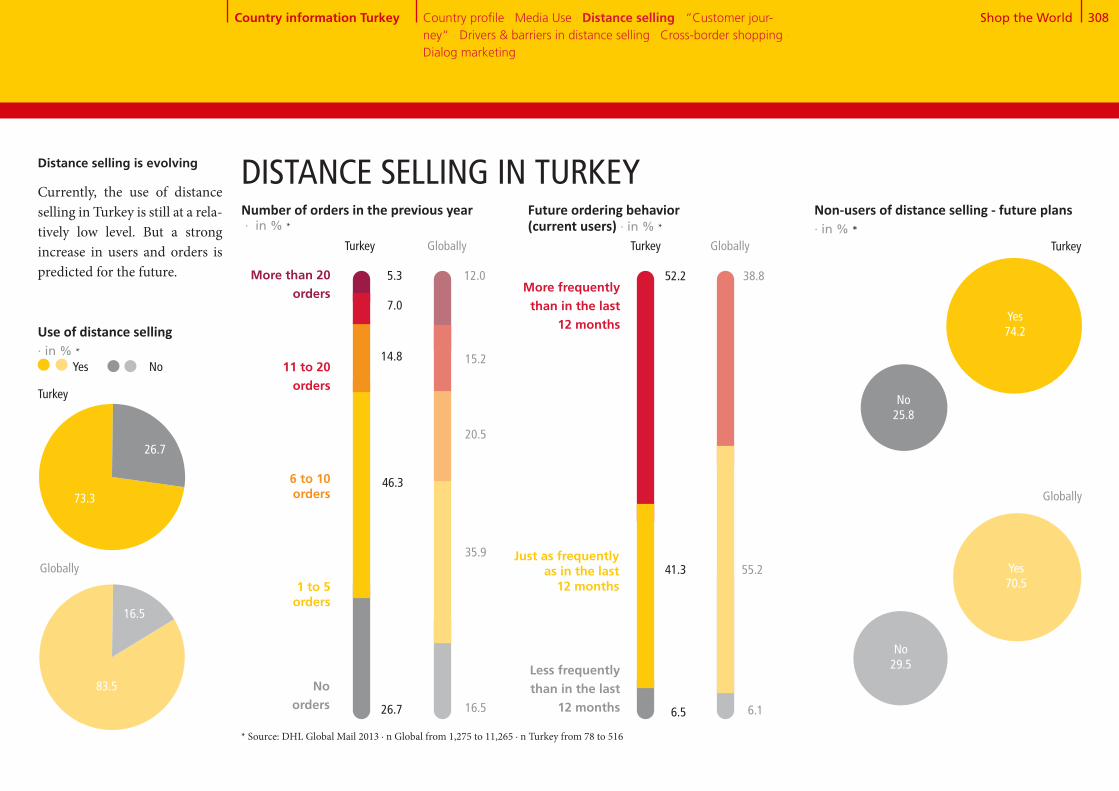
Shop the World 308
73+2784
+16
Distance selling is evolving
Currently, the use of distance selling in Turkey is still at a rela- tively low level. But a strong increase in users and orders is predicted for the future.
Use of distance selling · in % *
73.3
26.7
Turkey
Globally
83.5
16.5
Number of orders in the previous year · in % *
1 to 5 orders
6 to 10 orders
11 to 20 orders
More than 20 orders
No orders
14.8
46.3
7.0
26.7
5.3
20.5
35.9
15.2
16.5
12.0
Future ordering behavior (current users) · in % *
More frequently than in the last
12 months
Just as frequently as in the last
12 months
Less frequently than in the last
12 months
41.3
52.2
55.2
38.8
6.5 6.1
Non-users of distance selling - future plans · in % *
Yes74.2
Turkey
Globally
Yes70.5
No25.8
No29.5
Yes No
Turkey Globally Turkey Globally
DISTANCE SELLING IN TURKEY
* Source: DHL Global Mail 2013 ∙ n Global from 1,275 to 11,265 ∙ n Turkey from 78 to 516
Country information Turkey Country profile · Media Use · Distance selling · “Customer jour-ney“ · Drivers & barriers in distance selling · Cross-border shopping · Dialog marketing

Shop the World 309
Globally*
41.5
Gender · in % Male Female
Age · in % <30 yrs. 30-49 yrs. 50 yrs. +
Occupation · in % Employed Unemployed
Education · in % Lower educational level Medium and higher level of education
9.5
Media affinity: Online · in % yes**
Community size · in % Rural (<50,000 inhabitants) Non-rural/urban (>50,000 inhabitants)
Minors in the household · Ø
Household type · in % Single 2-person household without children Household with children Household with 3 adults
Mobile Internet usage · in % Yes No
Gross household income · in % Low income Medium income High income
Media affinity: Classic · in % yes**
Media affinity: Dialog marketing · in % yes** 50.8
48.9
89.1
36.927.5
21.978.1
26.944.6
52.1
43.3
47.9
29.1
90.5
91.4
0.6
24.44.1
70.9
Young, urban, modern
The profile of a heavy user of distance selling in Turkey can be clearly differentiated from the global reference image by several features. This crucial target group is considerably younger, more urban, and more familiar with electronic media. The smartphone is a constant companion in day-to-day life. Over three-fourths of these customers already use mobile devices. In addition, they have a lower household income than the global average and are more likely to live in large households with several adults.
DISTANCE SELLING IN TURKEY
* Source: DHL Global Mail 2013 ∙ n Global from 2,661 to 11,265 ∙ n Turkey from 113 to 516 ** media affinity for online / classic / dialog marketing, if at least one medium from the respective area was rated 5 or 6 on a scale of 1 "absolutely not useful" to 6 "very useful" *** the top third of most active distance selling users
44.327.1
14.4
36.4
46.9
36.5
80.8
33.734.232.1
45.754.3
22.443.0
50.0
28.6
50.0
29.4
85.6
63.6
0.7
23.411.2
70.6
Country information Turkey Country profile · Media Use · Distance selling · “Customer jour-ney“ · Drivers & barriers in distance selling · Cross-border shopping · Dialog marketing
***
Turkey*
47.418.6
15.8
10.0
49.2
44.2
83.7
30.934.534.7
41.758.3
29.949.1
50.9
34.0
49.1
33.9
84.2
90.0
0.8
16.54.5
66.1
15.2
8.6
Heavy users* Global heavy users*
35.6

Shop the World 310
“CUSTOMER JOURNEY“ SEARCHING FOR PRODUCT INFORMATION
Search for product information · Turkey in % * Globally
38.0 35.5
53.2
22.5 23.4
51.2 44.2
28.5 23.9
43.9 45.8
37.7 42.5
32.3 25.1
25.3 15.1
32.9 15.1
12.9 9.7
50.3 37.8
Criteria for choosing a vendor· Turkey in % *
Globally
Search engines 60.3
Customer ratings in blogs or forums
Product test ratings / expert test reports
Product check in a retail store
Retailer or manufacturer website
Online marketplace
Catalog
Mail advertising
Social media platforms such as Facebook and Twitter
Apps (on smartphone, iPad, or tablet)
Recommendations from friends, acquaintances, and colleagues
46.0 40.6Customer ratings on the supplier’s website
Price comparison sites
Large selection of products
Recommendation and experiences of friends, acquaintances, and colleagues
Official test seals, reviews, and test reports of independent institutions
Attractive product line
Favorable prices, promotions, & special offers
Straightforward return process
Free returns
Choice of preferred payment methods
Fast delivery
Free delivery
Good customer service
Positive customer ratings on the internet
13.6 13.7
20.7
7.7 8.8
25.1 26.6
9.4 14.9
42.2 51.7
18.7 12.9
26.7 20.8
16.1 22.6
25.5 25.7
35.4 45.2
18.3 18.5
17.2
Many "likes“ are convincing
Besides search engines and price comparison websites, rec- ommendations from friends and social media platforms are are most important for productinformation in Turkey.
* Source: DHL Global Mail 2013 ∙ n Global from 9,386 to 10,617 ∙ n Turkey from 371 to 464, multiple selections
Country information Turkey Country profile · Media Use · Distance selling · “Customer jour-ney“ · Drivers & barriers in distance selling · Cross-border shopping · Dialog marketing

Shop the World 311
Usefulness of advertising media · in % *, **
5 and 63 and 41 and 2
Ø
42.020.2 37.826.1 43.8 30.1
Online advertising
* Source: DHL Global Mail 2013 ∙ n Global from 10,218 to 10,384 ∙ n Turkey from 434 to 447 ** scale from 1 "absolutely not useful“ to 6 very useful“
Good standing for media
Turkish consumers perceive advertising quite valuable. This applies especially to online me-dia. Typical of the country is the strong orientation towards recommendations in social net-works and product recommen-dations in online shops.
ACCEPTANCE OF ADVERTISING MEDIA
Turkey Globally
Country information Turkey Country profile · Media Use · Distance selling · “Customer jour-ney“ · Drivers & barriers in distance selling · Cross-border shopping · Dialog marketing
Television advertising
5 and 63 and 41 and 2
3.93.6
Ø
44.423.6 32.130.6 41.8 27.6
3.73.4
39.933.8 26.338.7 40.4 20.9Social media
Turkey Globally
Advertising letters
3.33.1
35.417.8 46.933.9 37.6 28.5
4.13.4
Product suggestions in online shops
39.114.6 46.318.9 45.1 36.0
4.23.9
23.27.7 69.16.5 28.7 64.8
4.94.8
28.27.6 64.29.1 31.7 59.1
4.84.6
42.026.0 32.029.9 43.9 26.2
Turkey Globally
Household advertising
3.73.4
46.326.4 27.429.0 46.7 24.3
Turkey Globally
Advertisements in mag- azines and periodicals
3.63.4
44.128.6 27.334.8 43.1 22.1
Turkey Globally
Advertisements in newspapers
3.53.2
45.425.7 28.941.8 40.7 17.6
Turkey Globally
Billboard advertise-ments
3.63.0
37.144.9 18.044.3 38.8 16.9
Turkey Globally
Radio
3.02.9
45.220.1 34.719.3 44.2 36.6
Turkey Globally
Catalogs from vendors
3.93.9
Turkey Globally
Turkey Globally
Turkey Globally
Internet search engines
Turkey Globally
Price comparison sites
Turkey Globally

Shop the World 312
Use of different suppliers · in % *
Online marketplace
Mail order company from which I received a catalog
Merchant who advertises on TV
Never Seldom Frequently / very frequently
Occasionally
Online shop of a manufaturer or retailer
* Source: DHL Global Mail 2013 ∙ n Global from 9,270 to 9,446 ∙ n Turkey from 347 to 375
Turkey Global
Online PC
Online mobile (tablet, smartphone)
By telephone
In writing (by post, fax)
By email
Order in store & delivery to home
57.2
5.7
2.2
12.0
75.0
3.2
2.1
4.4
“CUSTOMER JOURNEY“ – PLACING ORDERSOnline orders below average
The number of Turkish con- sumers who prefer to order via PC is still below the glob- al average. However, the country sees itself as pro-gressive when it comes to use of mobile devices. Ordering via email or in a store with home delivery enjoys above- average popularity. In com-parison to global penetration, online marketplaces are used cautiously in Turkey.
10.1 31.922.7
15.4 31.216.8
35.3
36.6
Turkey
Globally
7.8 43.415.6
9.9 54.38.7
33.2
27.0
32.4 11.227.3
38.5 12.622.8
29.1
26.1
46.6 7.723.9
60.2 6.617.6
21.8
15.7
11.4
10.5
11.5
4.8
Order channels · in % *
Country information Turkey Country profile · Media Use · Distance selling · “Customer jour-ney“ · Drivers & barriers in distance selling · Cross-border shopping · Dialog marketing
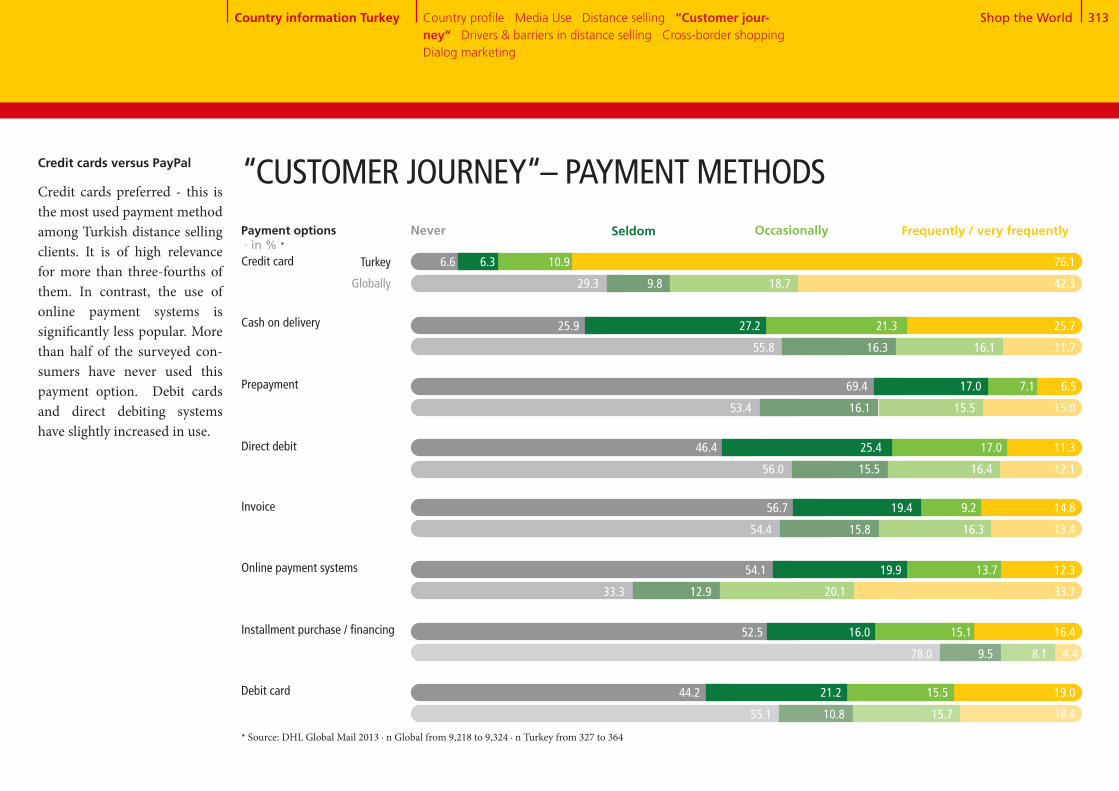
Shop the World 313
Credit cards versus PayPal
Credit cards preferred - this is the most used payment methodamong Turkish distance selling clients. It is of high relevance for more than three-fourths of them. In contrast, the use of online payment systems is significantly less popular. More than half of the surveyed con- sumers have never used this payment option. Debit cards and direct debiting systems have slightly increased in use.
Cash on delivery
Prepayment
Direct debit
Credit card
* Source: DHL Global Mail 2013 ∙ n Global from 9,218 to 9,324 ∙ n Turkey from 327 to 364
“CUSTOMER JOURNEY“– PAYMENT METHODS
Online payment systems
Installment purchase / financing
Debit card
Invoice
Payment options · in % *
Never Seldom Frequently / very frequentlyOccasionally
Turkey
Globally
6.6 6.3 10.9 76.1
29.3 9.8 18.7 42.3
25.9 27.2 21.3 25.7
55.8 16.3 16.1 11.7
69.4 17.0 7.1 6.5
53.4 16.1 15.5 15.0
46.4 25.4 17.0 11.3
56.0 15.5 16.4 12.1
56.7 19.4 9.2 14.8
54.4 15.8 16.3 13.4
54.1 19.9 13.7 12.3
33.3 12.9 20.1 33.7
52.5 16.0 15.1 16.4
78.0 9.5 8.1 4.4
44.2 21.2 15.5 19.0
55.1 10.8 15.7 18.4
Country information Turkey Country profile · Media Use · Distance selling · “Customer jour-ney“ · Drivers & barriers in distance selling · Cross-border shopping · Dialog marketing
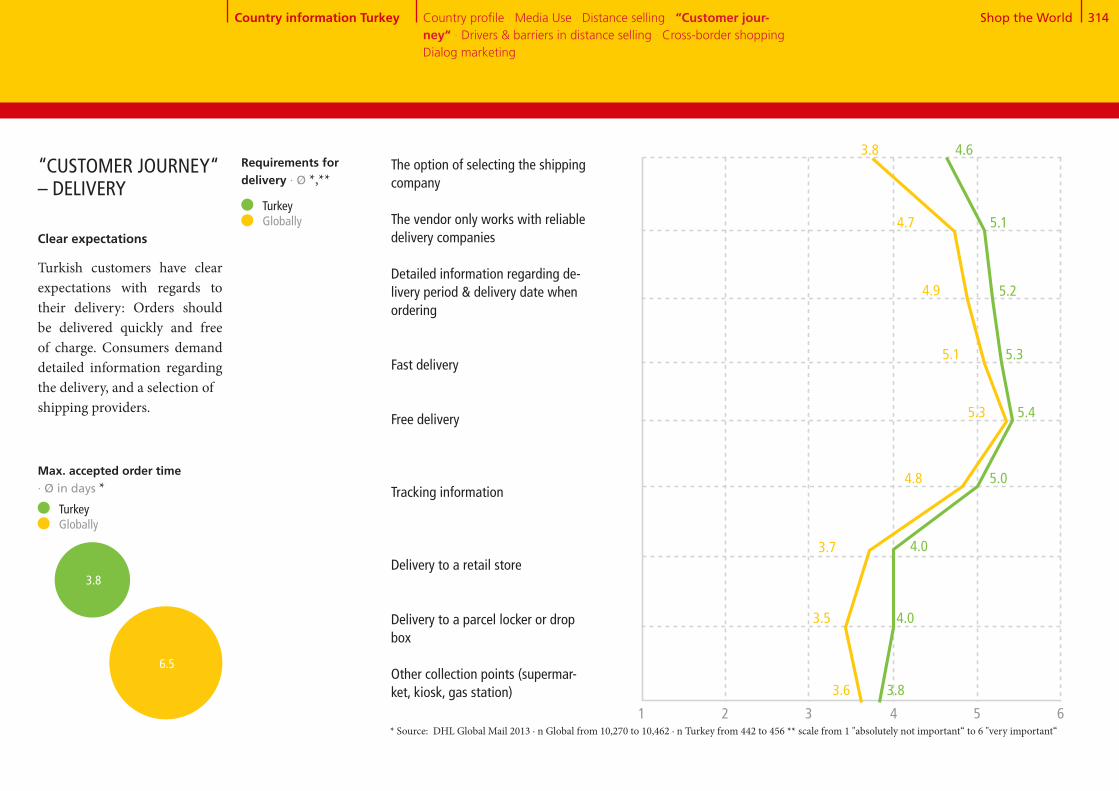
Shop the World 314
Turkey Globally
The option of selecting the shipping company The vendor only works with reliable delivery companies
Detailed information regarding de-livery period & delivery date when ordering
Fast delivery
Free delivery
Tracking information
Delivery to a retail store
Delivery to a parcel locker or drop box
Other collection points (supermar-ket, kiosk, gas station) 3.8
4.0
4.0
5.4
5.0
5.3
4.6
5.2
5.1
Max. accepted order time · Ø in days *
3.6
3.5
3.7
5.3
4.8
5.1
3.8
4.9
4.7
* Source: DHL Global Mail 2013 ∙ n Global from 10,270 to 10,462 ∙ n Turkey from 442 to 456 ** scale from 1 "absolutely not important“ to 6 "very important“
Clear expectations
Turkish customers have clear expectations with regards to their delivery: Orders should be delivered quickly and free of charge. Consumers demand detailed information regarding the delivery, and a selection ofshipping providers.
“CUSTOMER JOURNEY“ – DELIVERY
1 2 3 4 5 6
Requirements for delivery · Ø *,**
Country information Turkey Country profile · Media Use · Distance selling · “Customer jour-ney“ · Drivers & barriers in distance selling · Cross-border shopping · Dialog marketing
3.8
6.5
Turkey Globally
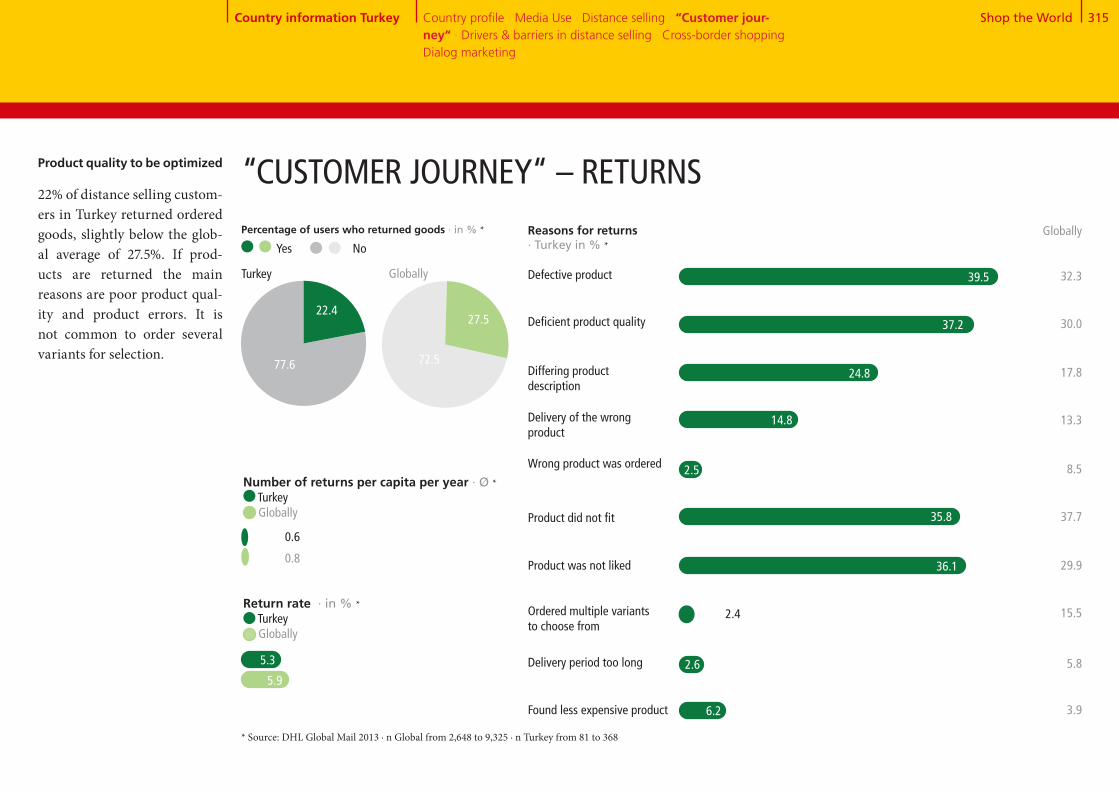
Shop the World 315
78+22
72+28
Number of returns per capita per year · Ø * Turkey Globally
0.8
0.6
Return rate · in % * Turkey Globally
5.9
Reasons for returns · Turkey in % *
Defective product 39.5
Percentage of users who returned goods · in % *
22.4
77.6
Turkey Globally
Yes No
“CUSTOMER JOURNEY“ – RETURNSProduct quality to be optimized
22% of distance selling custom-ers in Turkey returned ordered goods, slightly below the glob- al average of 27.5%. If prod-ucts are returned the main reasons are poor product qual-ity and product errors. It is not common to order several variants for selection.
27.5
72.5
* Source: DHL Global Mail 2013 ∙ n Global from 2,648 to 9,325 ∙ n Turkey from 81 to 368
Differing product description
Delivery of the wrong product
Wrong product was ordered
Product did not fit
Ordered multiple variants to choose from
Delivery period too long
Found less expensive product
Deficient product quality
Product was not liked
24.8
14.8
35.8
36.1
2.4
2.6
6.2
Globally
32.3
30.0
17.8
13.3
8.5
37.7
29.9
15.5
5.8
3.9
37.2
2.5
Country information Turkey Country profile · Media Use · Distance selling · “Customer jour-ney“ · Drivers & barriers in distance selling · Cross-border shopping · Dialog marketing
5.3

Shop the World 316
High delivery costs
Uncertain delivery
Concern about misuse of payment data
No demand because all products are obtainable locally
Long delivery periods
Unknown product quality
No try-on possible before purchase
Complicated return of the products
No personal advice
No personal contact person for problems
Doubts regarding data protection or thedissemination of data to third parties
Concern about counterfeited products, product piracy
Product can only be obtained via distance selling
Easy price comparison
Shopping 24/7
Location-independent ordering
Higher product quality
Lower prices
Greater selection
Option to deliver to a preferred location
DRIVERS & BARRIERS IN DISTANCE SELLING Barriers
· Turkey in % *
50.8
54.6
72.6
63.5
7.8
59.1
46.0
67.3
64.7
33.6
74.8
Globally
36.6
24.2
34.4
3.9
25.8
48.5
64.9
44.1
21.5
22.0
29.8
34.1
Convenience & price
The most important drivers for distance selling can be attri- buted to convenience: shopping around the clock, location inde-pendent ordering and delivery locations to choose from. Low prices and product comparisons are also very important.
Drivers · Turkey in % *
Globally
* Source: DHL Global Mail 2013 ∙ n Global from 10,509 to 10,864 ∙ n Turkey from 451 to 499
43.7
64.7
74.4
75.0
17.7
21.5
25.8
50.3
7.0
33.9
54.3
63.3
47.8
22.3
34.6
41.6
61.3
Country information Turkey Country profile · Media Use · Distance selling · “Customer jour-ney“· Drivers & barriers in distance selling · Cross-border shopping · Dialog marketing

Shop the World 317
22+48+30CROSS-BORDER SHOPPING – OVERVIEW
Previous orders abroad
Previous and future orders abroad by country · in % *
Great Britain[15.4]
Germany[12.1]
1
2
3
4
5
USA[49.1]
China[40.4]
Hong Kong[18.5]
Future orders abroad
Turkey
* Source: DHL Global Mail 2013 ∙ n Global from 4,738 to 8,807 ∙ n Turkey from 91 to 357 ** split into "further orders planned“ 21.6% Turkey and "no further orders planned" 0.6% Turkey
Opening towards the world
Distance selling orders in Tur-key are still very focused on the home market. Only one in five has ever considered a foreign country for orders. However, there is a high future interest for cross-border shopping. Almost 60% of the surveyed users are planning to order abroad. Pre-ferred destinations will be the US and Germany.
France[33.4]
Japan[29.0]
USA[78.2]
Germany[56.6]
China[37.3]
Country information Turkey Country profile · Media Use · Distance selling · “Customer jour-ney“· Drivers & barriers in distance selling · Cross-border shop-ping · Dialog marketing
Use of cross-border eCommerce · in % *
Yes, already ordered **No, but future orders planned No, no future orders planned
48.0
22.229.9
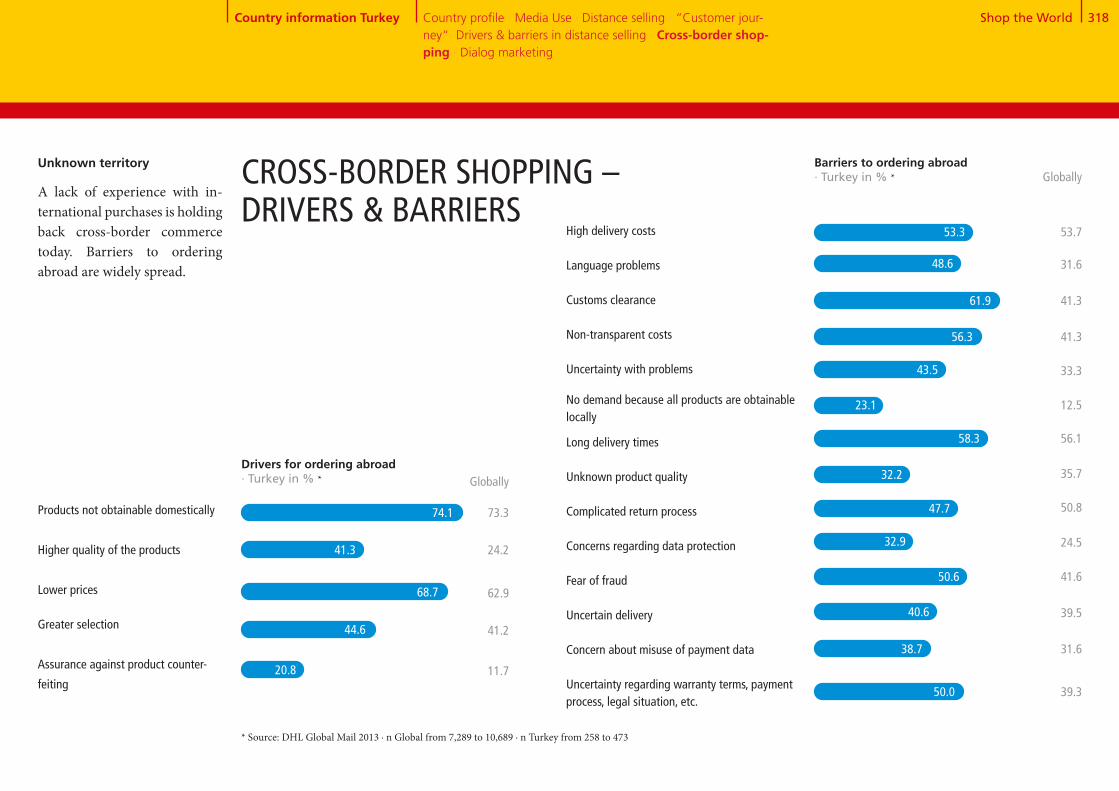
Shop the World 318
Products not obtainable domestically
Higher quality of the products
Lower prices
Greater selection
Assurance against product counter-
feiting
High delivery costs Language problems
Customs clearance
Non-transparent costs
Uncertainty with problems
No demand because all products are obtainable locally
Long delivery times
Unknown product quality
Complicated return process
Concerns regarding data protection Fear of fraud Uncertain delivery
Concern about misuse of payment data
Uncertainty regarding warranty terms, payment process, legal situation, etc.
Drivers for ordering abroad· Turkey in % *
Barriers to ordering abroad · Turkey in % *
Globally
73.3
24.2
62.9
41.2
11.7
Globally
53.7
31.6
41.3
41.3
33.3
12.5
56.1
35.7
50.8
24.5
41.6
39.5
31.6
39.3
Unknown territory
A lack of experience with in- ternational purchases is holding back cross-border commerce today. Barriers to ordering abroad are widely spread.
CROSS-BORDER SHOPPING – DRIVERS & BARRIERS
* Source: DHL Global Mail 2013 ∙ n Global from 7,289 to 10,689 ∙ n Turkey from 258 to 473
53.3
48.6
61.9
56.3
43.5
23.1
58.3
32.2
47.7
32.9
50.6
40.6
38.7
50.0
74.1
41.3
68.7
44.6
20.8
Country information Turkey Country profile · Media Use · Distance selling · “Customer jour-ney“· Drivers & barriers in distance selling · Cross-border shop-ping · Dialog marketing
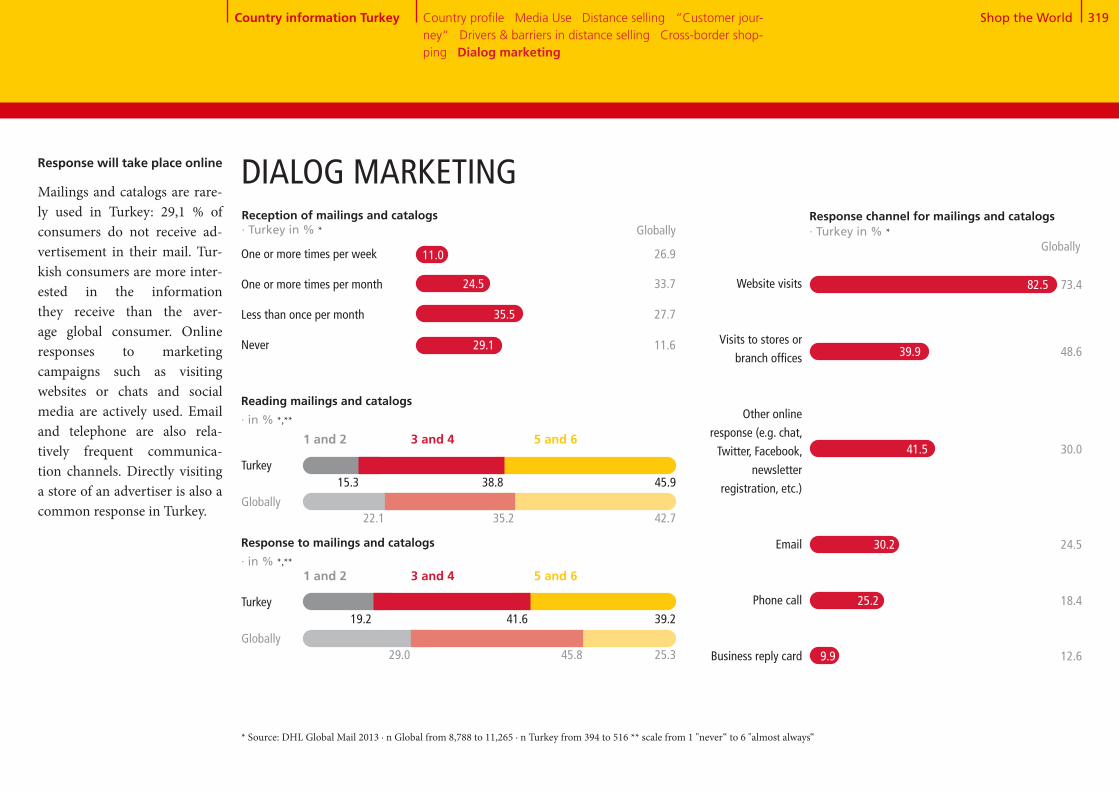
Shop the World 319
Reception of mailings and catalogs · Turkey in % *
5 and 63 and 41 and 2
DIALOG MARKETING
Reading mailings and catalogs
· in % *,**
Turkey
Globally
15.3 38.8 45.9
22.1 35.2 42.7
5 and 63 and 41 and 2
Response to mailings and catalogs · in % *,**
Turkey
Globally
19.2 41.6 39.2
29.0 45.8 25.3
Response channel for mailings and catalogs · Turkey in % * Globally
Website visits
Visits to stores or
branch offices
Other online
response (e.g. chat,
Twitter, Facebook,
newsletter
registration, etc.)
Phone call
Business reply card
82.5 73.4
48.6
30.0
24.5
18.4
12.6
* Source: DHL Global Mail 2013 ∙ n Global from 8,788 to 11,265 ∙ n Turkey from 394 to 516 ** scale from 1 "never“ to 6 "almost always“
Response will take place online
Mailings and catalogs are rare- ly used in Turkey: 29,1 % of consumers do not receive ad-vertisement in their mail. Tur-kish consumers are more inter- ested in the information they receive than the aver-age global consumer. Online responses to marketing campaigns such as visiting websites or chats and social media are actively used. Email and telephone are also rela- tively frequent communica- tion channels. Directly visiting a store of an advertiser is also a common response in Turkey.
Globally
One or more times per week
One or more times per month
Less than once per month
Never
26.9
33.7
27.7
11.6 39.9
41.5
30.2
25.2
9.9
11.0
24.5
35.5
29.1
Country information Turkey Country profile · Media Use · Distance selling · “Customer jour-ney“ · Drivers & barriers in distance selling · Cross-border shop-ping · Dialog marketing

Country InformationUSA
Adam
American distance selling clients like mobile devices and they are the world champions in online shopping.
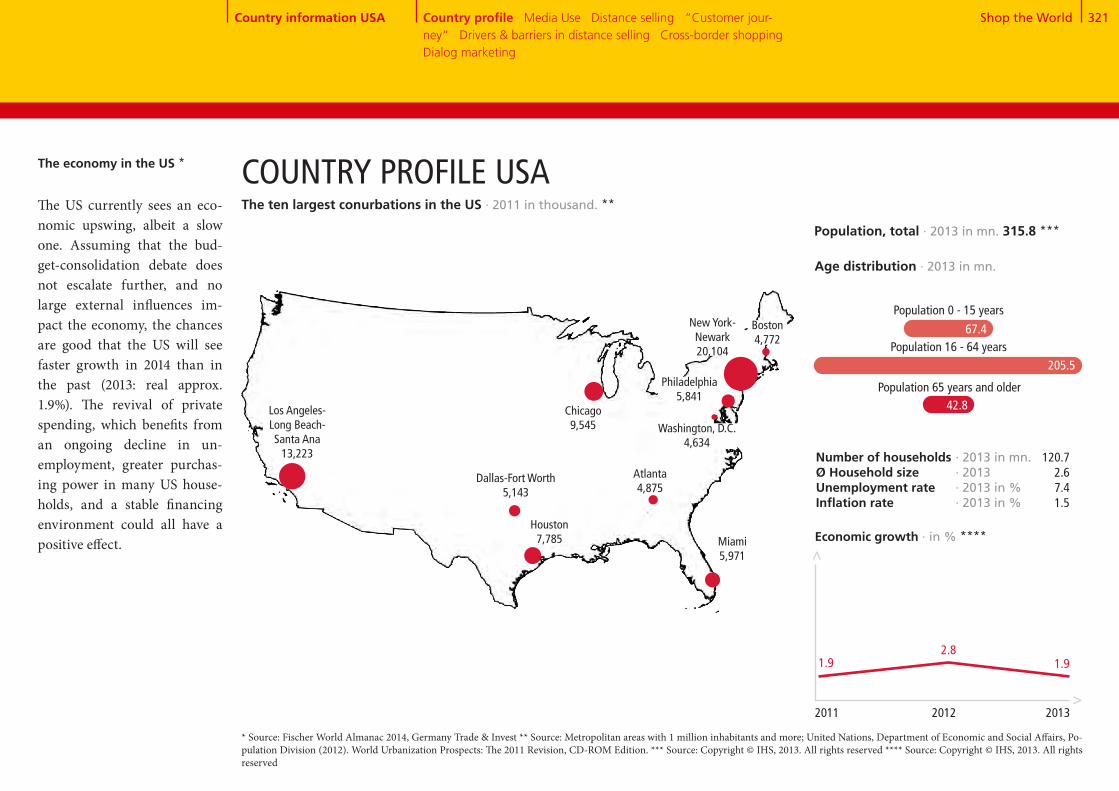
Shop the World 321Country information USA Country profile · Media Use · Distance selling · “Customer jour-ney“ · Drivers & barriers in distance selling · Cross-border shopping · Dialog marketing
67.4
Population 0 - 15 years
The economy in the US * COUNTRY PROFILE USA
New York- Newark 20,104
Los Angeles- Long Beach- Santa Ana
13,223
* Source: Fischer World Almanac 2014, Germany Trade & Invest ** Source: Metropolitan areas with 1 million inhabitants and more; United Nations, Department of Economic and Social Affairs, Po-pulation Division (2012). World Urbanization Prospects: The 2011 Revision, CD-ROM Edition. *** Source: Copyright © IHS, 2013. All rights reserved **** Source: Copyright © IHS, 2013. All rights reserved
Number of households Ø Household sizeUnemployment rateInflation rate
2.8
Economic growth · in % ****
>
>
1.91.9
2011 2012 2013
Age distribution · 2013 in mn.
Population 65 years and older
Population, total · 2013 in mn. 315.8 ***
Population 16 - 64 years
· 2013 in mn.· 2013· 2013 in %· 2013 in %
120.72.67.41.5
The US currently sees an eco-nomic upswing, albeit a slow one. Assuming that the bud-get-consolidation debate does not escalate further, and no large external influences im-pact the economy, the chances are good that the US will see faster growth in 2014 than in the past (2013: real approx. 1.9%). The revival of private spending, which benefits from an ongoing decline in un- employment, greater purchas-ing power in many US house-holds, and a stable financing environment could all have a positive effect.
205.5
42.8
Washington, D.C. 4,634
Dallas-Fort Worth 5,143
Houston 7,785
Chicago 9,545
Philadelphia 5,841
Boston 4,772
Atlanta 4,875
Miami 5,971
The ten largest conurbations in the US · 2011 in thousand. **

Shop the World 322
39+10+1+5+21+14+10
Country information USA Country profile · Media Use · Distance selling · “Customer jour-ney“ · Drivers & barriers in distance selling · Cross-border shopping · Dialog marketing
MEDIA USE IN THE USA
28.0
98.7
Smartphone market penetration · in % *****Representative domestic population 16+, n = 1,000
43,5
Internet users · 2012 per 100 people **
Permanent access to broadband internet · 2012 per 100 people ***
Cellphones · 2012 per 100 people ****
2012 2013
56.4
Internet use
In 2012, 81% of people in the US used the internet, even though broadband access is still a pro-blem. Only 28 out of 100 inha-bitants have access to broad- band. The technical require-ment for wide mobile use of the internet lies in smartphones, which have seen a dramatic increase - from 44% in 2012 to 56% in 2013.
Solid growth on first place
In 2016, the US remains the world’s largest advertising mar-ket by far. With solid growth of 4%-5%, the US also con- tributes most to the increase in global advertising spends. TV will continue to hold its posi- tion as the strongest media channel until 2016. Internet spends will increase at 18% within the next two years, mostly driven by mobile, social and video platforms.
Share of adspend by medium · in % *
TV Radio Movies Outdoor advertising
Total advertising expenditure · in EUR bn. *
Internet Newspapers Magazines
>>
* Source: Zenith Optimedia, 2013 ** Source: Copyright © IHS, 2013. All rights reserved *** Source: The World Bank **** Source: Copyright © IHS, 2013. All rights reserved **** Source: Our Mobile Planet: Google Global Smart phone Study 2013, http://www.thinkwithgoogle.com/mobileplanet/
2011 2012 2013 2014 201514
3.2
81.0
136.
9
130.
5
125.
8
120.
2
2016
149.
3
21.7
13.7
10.7
4.70.510.2
38.5

Shop the World 323
Distance selling purchases in 2013 - trend for 2018 · in EUR mn. * 2013 2018
Apparel and footwear
Consumer electronics,
computers + equipment
Media products (books, CDs,
DVDs, etc.)
Housewares and home
furnishings + textiles
Food + beverages
Household and consumer
appliances
Beauty and personal care
DIY and gardening
OTC drugs and dietary supple-
ments
Traditional toys and games
House cleaning (detergent,
chastener, etc.)
The superlative
When it comes to mere shipping of goods, the US is unrivaled. Even if the mar-ket is below the global level, with average growth of 7.3% p.a., there is much potential for growth in household appli- ances, media products, and food.
DISTANCE SELLING IN THE US
46,922.0
16,409.0
18,121.8
40,037.1
20,605.0
9,003.0
7,869.5
7,576.2
5,197.715,829.4
5,658.9
3,964.4
2,965.4
4,306.7
2,103.0
1,973.8
227.2
Development of distance selling and share of total retail 2011 - 2018 · in EUR bn. *
CAGR: 7.3%
Home shopping
Online shopping116.9 135.6 157.2
77.473.5
69.9
176.4 268.0
65.9
54.7
2011 2012 2013e 2014e 2018e
Share of total retail · in % 9.6 10.1 10.6 11.2 14.0
* Source: Euromonitor International
32,263.9
202.8
Country information USA Country profile · Media Use · Distance selling · “Customer jour-ney“ · Drivers & barriers in distance selling · Cross-border shopping · Dialog marketing
4,534.4
4,850.5
6,551.4
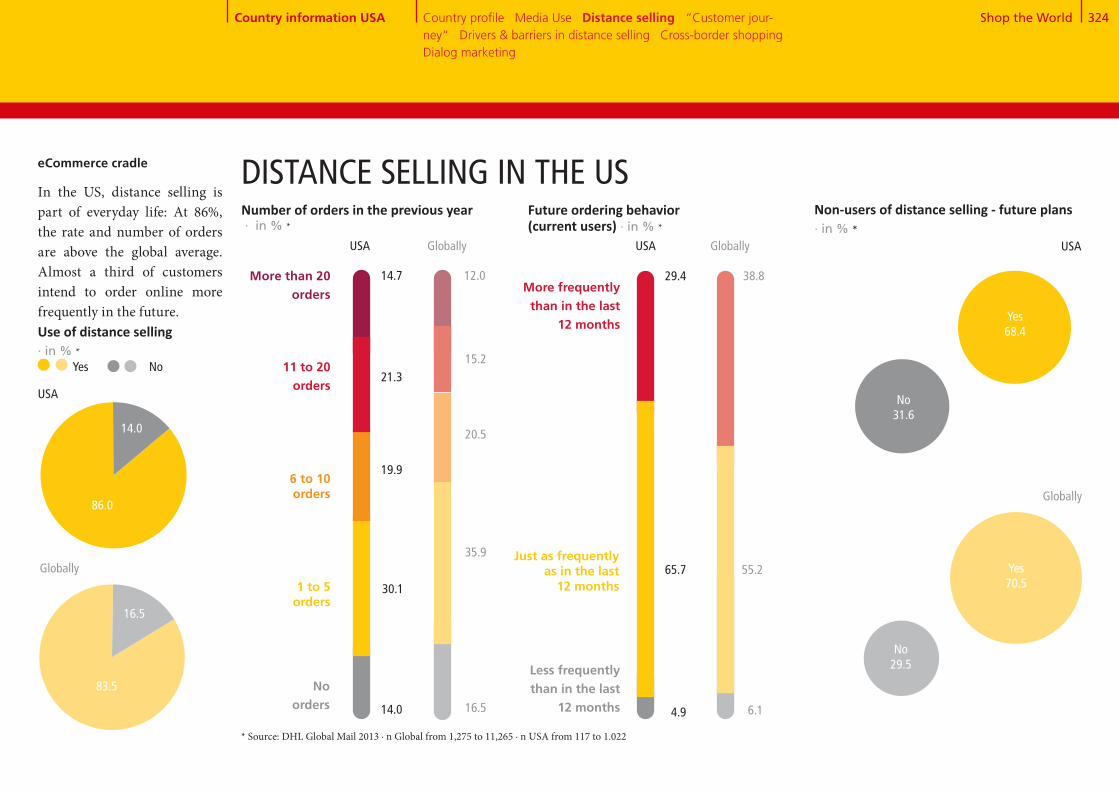
Shop the World 324
Non-users of distance selling - future plans · in % *
86+1484
+16
eCommerce cradle
In the US, distance selling is part of everyday life: At 86%, the rate and number of orders are above the global average. Almost a third of customers intend to order online more frequently in the future.Use of distance selling · in % *
86.0
14.0
USA
Globally
83.5
16.5
Number of orders in the previous year · in % *
1 to 5 orders
6 to 10 orders
11 to 20 orders
No orders
19.9
30.1
21.3
14.0
14.7
20.5
35.9
15.2
16.5
12.0
Future ordering behavior (current users) · in % *
More frequently than in the last
12 months
Just as frequently as in the last
12 months
Less frequently than in the last
12 months
65.7
29.4
55.2
38.8
4.9 6.1
Yes68.4
USA
Globally
Yes70.5
No31.6
No29.5
Yes No
USA Globally USA Globally
DISTANCE SELLING IN THE US
* Source: DHL Global Mail 2013 ∙ n Global from 1,275 to 11,265 ∙ n USA from 117 to 1.022
Country information USA Country profile · Media Use · Distance selling · “Customer jour-ney“ · Drivers & barriers in distance selling · Cross-border shopping · Dialog marketing
More than 20 orders
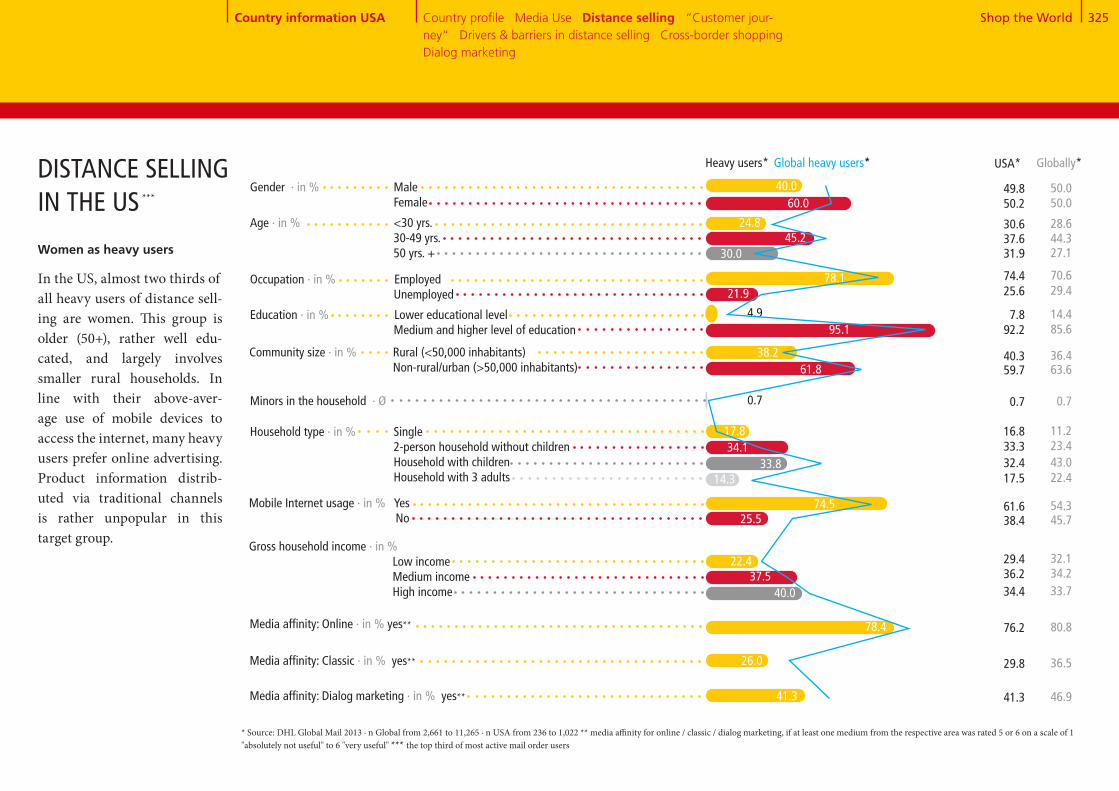
Shop the World 325
Globally*
45.2
Gender · in % Male Female
Age · in % <30 yrs. 30-49 yrs. 50 yrs. +
Occupation · in % Employed Unemployed
Education · in % Lower educational level Medium and higher level of education
4.9
Media affinity: Online · in % yes**
Community size · in % Rural (<50,000 inhabitants) Non-rural/urban (>50,000 inhabitants)
Minors in the household · Ø
Household type · in % Single 2-person household without children Household with children Household with 3 adults
Mobile Internet usage · in % Yes No
Gross household income · in % Low income Medium income High income
Media affinity: Classic · in % yes**
Media affinity: Dialog marketing · in % yes** 41.3
26.0
78.4
40.037.5
22.4
25.574.5
14.333.8
60.0
24.8
40.0
21.9
95.1
61.8
0.7
34.117.8
78.1
Women as heavy users
In the US, almost two thirds ofall heavy users of distance sell-ing are women. This group is older (50+), rather well edu- cated, and largely involves smaller rural households. In line with their above-aver-age use of mobile devices to access the internet, many heavy users prefer online advertising. Product information distrib- uted via traditional channels is rather unpopular in this target group.
DISTANCE SELLING IN THE US
* Source: DHL Global Mail 2013 ∙ n Global from 2,661 to 11,265 ∙ n USA from 236 to 1,022 ** media affinity for online / classic / dialog marketing, if at least one medium from the respective area was rated 5 or 6 on a scale of 1 "absolutely not useful" to 6 "very useful" *** the top third of most active mail order users
44.327.1
14.4
36.4
46.9
36.5
80.8
33.734.232.1
45.754.3
22.443.0
50.0
28.6
50.0
29.4
85.6
63.6
0.7
23.411.2
70.6
Country information USA Country profile · Media Use · Distance selling · “Customer jour-ney“ · Drivers & barriers in distance selling · Cross-border shopping · Dialog marketing
***
USA*
37.631.9
7.8
40.3
41.3
29.8
76.2
34.436.229.4
38.461.6
17.532.4
50.2
30.6
49.8
25.6
92.2
59.7
0.7
33.316.8
74.4
30.0
38.2
Heavy users* Global heavy users*
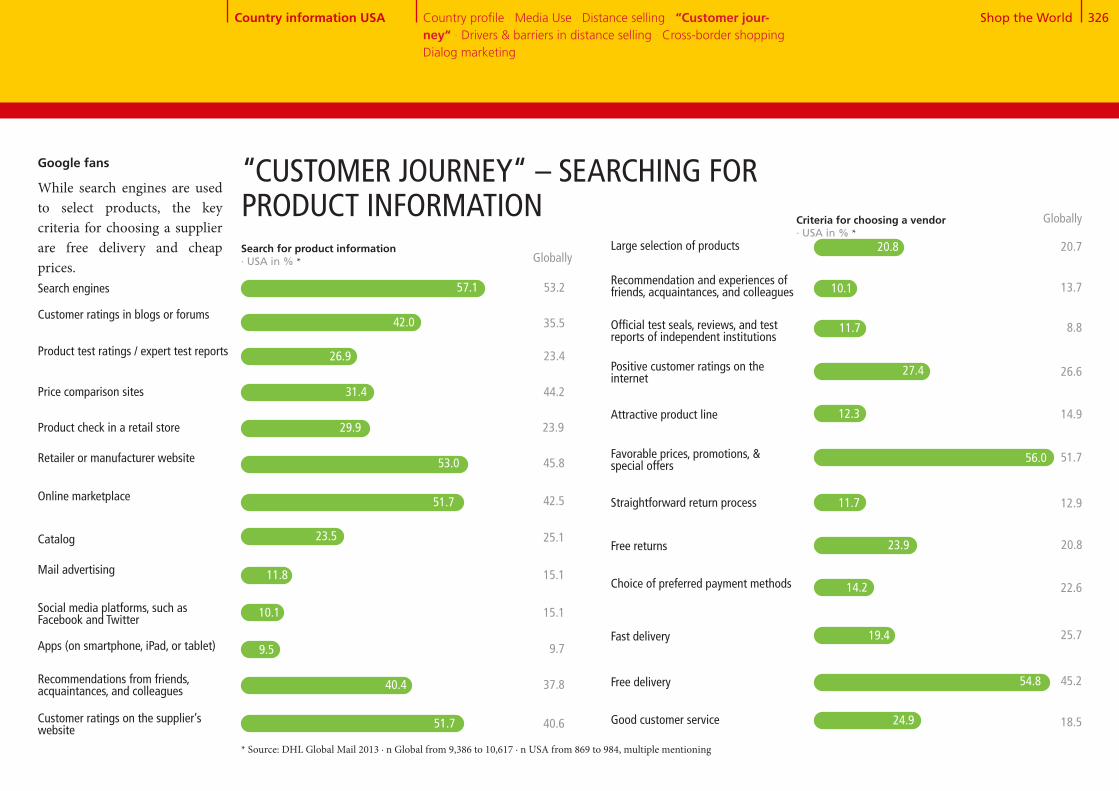
Shop the World 326
Search engines
Customer ratings in blogs or forums
Product test ratings / expert test reports
Product check in a retail store
Retailer or manufacturer website
Online marketplace
Catalog
Mail advertising
Social media platforms, such as Facebook and Twitter
Apps (on smartphone, iPad, or tablet)
Recommendations from friends, acquaintances, and colleagues
Customer ratings on the supplier’s website
Price comparison sites
Large selection of products
Recommendation and experiences of friends, acquaintances, and colleagues
Official test seals, reviews, and test reports of independent institutions
Attractive product line
Favorable prices, promotions, & special offers
Straightforward return process
Free returns
Choice of preferred payment methods
Fast delivery
Free delivery
Positive customer ratings on the internet
“CUSTOMER JOURNEY“ – SEARCHING FOR PRODUCT INFORMATIONSearch for product information · USA in % * Globally
42.0 35.5
53.2
26.9 23.4
31.4 44.2
29.9 23.9
53.0 45.8
51.7 42.5
23.5 25.1
11.8 15.1
10.1 15.1
9.5 9.7
40.4 37.8
Criteria for choosing a vendor · USA in % *
Globally
57.1
51.7 40.6 Good customer service
10.1 13.7
20.7
11.7 8.8
27.4 26.6
12.3 14.9
56.0 51.7
11.7 12.9
23.9 20.8
14.2 22.6
19.4 25.7
54.8 45.2
24.9 18.5
20.8
Google fans
While search engines are used to select products, the key criteria for choosing a supplier are free delivery and cheap prices.
* Source: DHL Global Mail 2013 ∙ n Global from 9,386 to 10,617 ∙ n USA from 869 to 984, multiple mentioning
Country information USA Country profile · Media Use · Distance selling · “Customer jour-ney“ · Drivers & barriers in distance selling · Cross-border shopping · Dialog marketing

Shop the World 327
Usefulness of advertising media · in % *, **
5 and 63 and 41 and 2
Ø
43.231.8 25.026.1 43.8 30.1
Online advertising
* Source: DHL Global Mail 2013 ∙ n Global from 10,218 to 10,384 ∙ n USA from 941 to 961 ** scale from 1 "absolutely not useful" to 6 "very useful"
Online advertising popular
Consumers in the US rate ad-vertising more critically than the global average. Search en-gines and price comparison websites are ranked the most useful.
ACCEPTANCE OF ADVERTISING MEDIA
USA Globally
Country information USA Country profile · Media Use · Distance selling · “Customer jour-ney“ · Drivers & barriers in distance selling · Cross-border shopping · Dialog marketing
Television advertising
5 and 63 and 41 and 2
3.43.6
Ø
38.542.3 19.130.6 41.8 27.6
3.03.4
33.653.4 13.038.7 40.4 20.9Social media
USA Globally
Advertising letters
2.63.1
31.550.2 18.333.9 37.6 28.5
2.83.4
Product suggestions in online shops
44.026.5 29.518.9 45.1 36.0
3.53.9
27.49.4 63.26.5 28.7 64.8
4.74.8
37.316.6 46.19.1 31.7 59.1
4.24.6
39.539.8 20.729.9 43.9 26.2
USA Globally
Household advertising
3.13.4
43.336.8 19.829.0 46.7 24.3
USA Globally
Advertisements in mag- azines and periodicals
3.13.4
33.449.1 17.534.8 43.1 22.1
USA Globally
Advertisements in newspapers
2.83.2
28.062.5 9.541.8 40.7 17.6
USA Globally
Billboard advertise-ments
2.33.0
35.851.9 12.444.3 38.8 16.9
USA Globally
Radio
2.62.9
40.625.3 34.119.3 44.2 36.6
USA Globally
Catalogs from vendors
3.73.9
USA Globally
USA Globally
USA Globally
Internet search engines
USA Globally
Price comparison sites
USA Globally
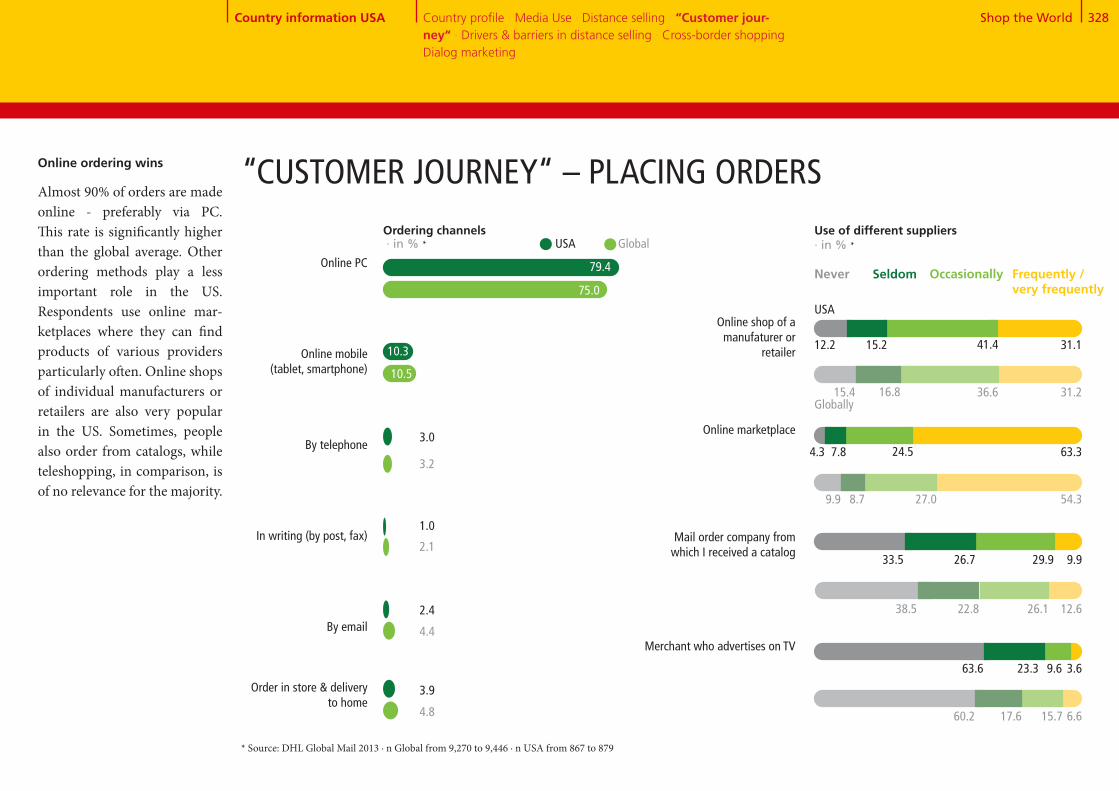
Shop the World 328
Online PC
Online mobile (tablet, smartphone)
By telephone
In writing (by post, fax)
By email
Order in store & delivery to home
Online marketplace
Mail order company from which I received a catalog
Merchant who advertises on TV
Online shop of a manufaturer or
retailer
Use of different suppliers · in % *
Never Frequently / very frequently
Occasionally
* Source: DHL Global Mail 2013 ∙ n Global from 9,270 to 9,446 ∙ n USA from 867 to 879
USA Global
79.4
3.0
1.0
2.4
75.0
3.2
2.1
4.4
“CUSTOMER JOURNEY“ – PLACING ORDERSOnline ordering wins
Almost 90% of orders are made online - preferably via PC. This rate is significantly higher than the global average. Other ordering methods play a less important role in the US. Respondents use online mar-ketplaces where they can find products of various providers particularly often. Online shops of individual manufacturers or retailers are also very popular in the US. Sometimes, people also order from catalogs, while teleshopping, in comparison, is of no relevance for the majority.
12.2 31.115.2
15.4 31.216.8
41.4
36.6
USA
Globally
4.3 63.37.8
9.9 54.38.7
24.5
27.0
33.5 9.926.7
38.5 12.622.8
29.9
26.1
63.6 3.623.3
60.2 6.617.6
9.6
15.7
10.3
10.5
3.9
4.8
Ordering channels · in % *
Country information USA Country profile · Media Use · Distance selling · “Customer jour-ney“ · Drivers & barriers in distance selling · Cross-border shopping · Dialog marketing
Seldom
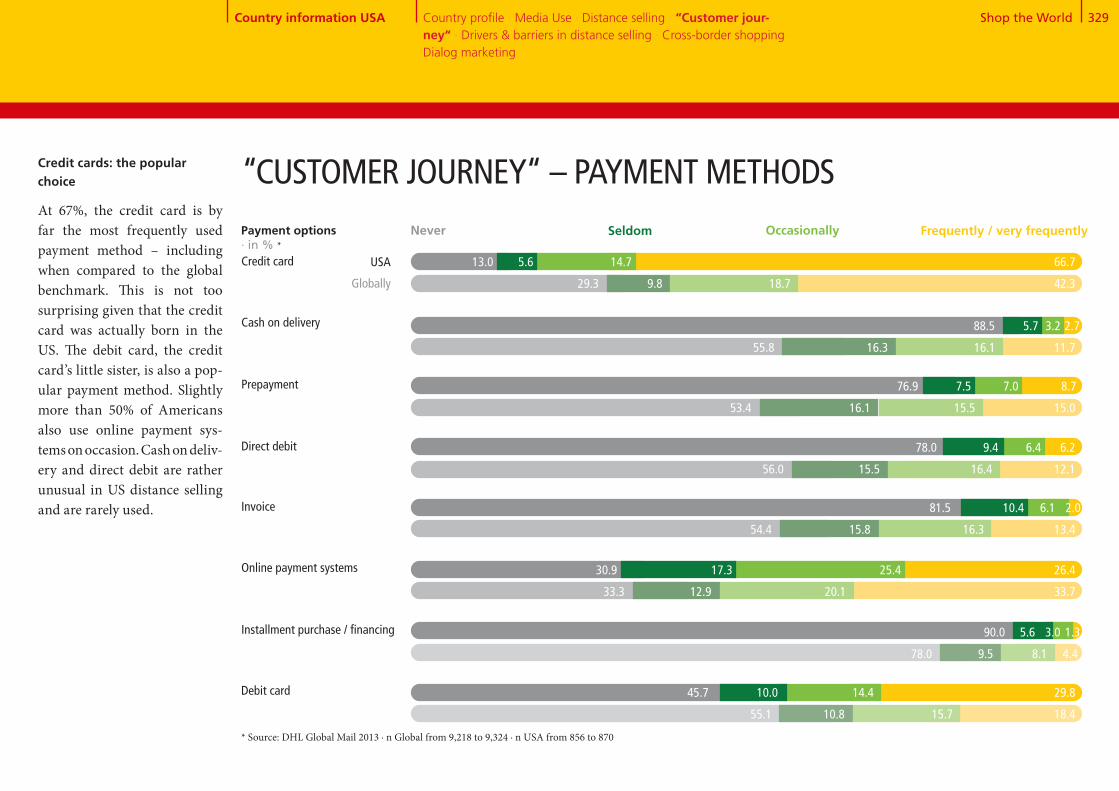
Shop the World 329
Credit cards: the popular choice
At 67%, the credit card is by far the most frequently used payment method – including when compared to the global benchmark. This is not too surprising given that the credit card was actually born in the US. The debit card, the credit card’s little sister, is also a pop- ular payment method. Slightly more than 50% of Americans also use online payment sys-tems on occasion. Cash on deliv- ery and direct debit are rather unusual in US distance selling and are rarely used.
Cash on delivery
Prepayment
Direct debit
Credit card
* Source: DHL Global Mail 2013 ∙ n Global from 9,218 to 9,324 ∙ n USA from 856 to 870
“CUSTOMER JOURNEY“ – PAYMENT METHODS
Online payment systems
Installment purchase / financing
Debit card
Invoice
Payment options · in % *
Never Frequently / very frequentlyOccasionally
USA
Globally
13.0 5.6 14.7 66.7
29.3 9.8 18.7 42.3
88.5 5.7 3.2 2.7
55.8 16.3 16.1 11.7
76.9 7.5 7.0 8.7
53.4 16.1 15.5 15.0
78.0 9.4 6.4 6.2
56.0 15.5 16.4 12.1
81.5 10.4 6.1 2.0
54.4 15.8 16.3 13.4
30.9 17.3 25.4 26.4
33.3 12.9 20.1 33.7
90.0 5.6 3.0 1.3
78.0 9.5 8.1 4.4
45.7 10.0 14.4 29.8
55.1 10.8 15.7 18.4
Country information USA Country profile · Media Use · Distance selling · “Customer jour-ney“ · Drivers & barriers in distance selling · Cross-border shopping · Dialog marketing
Seldom
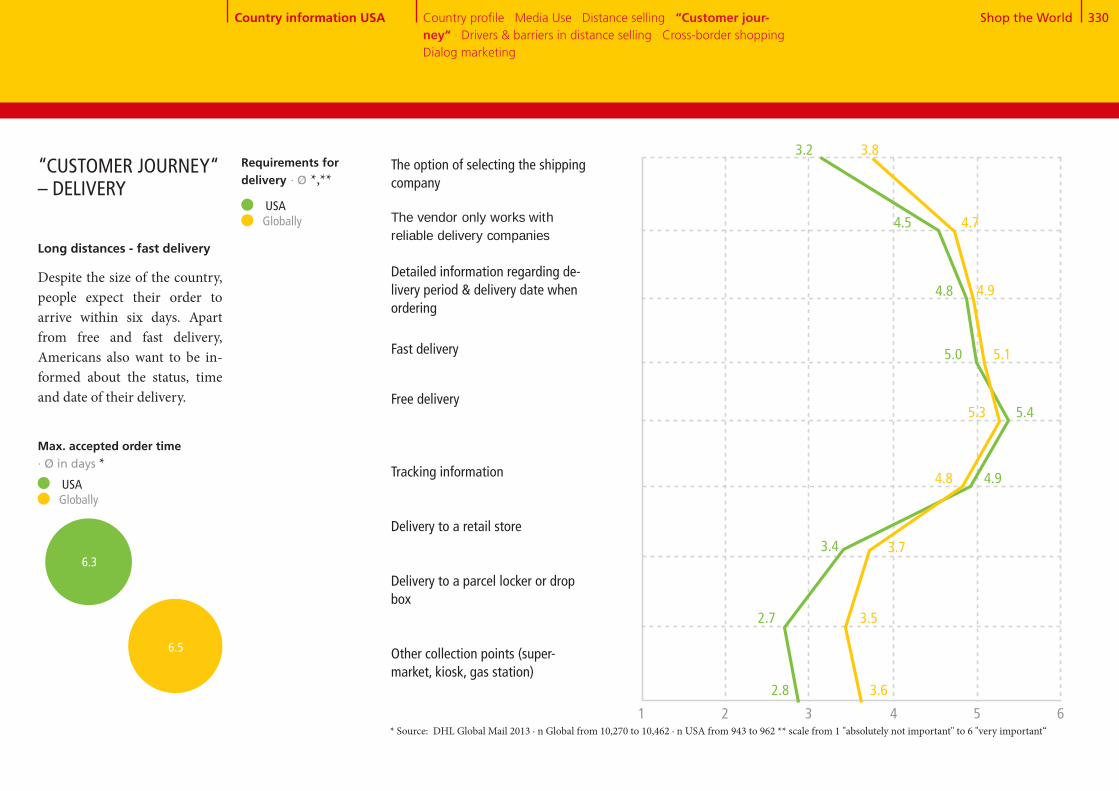
Shop the World 330
USA Globally
The option of selecting the shipping company The vendor only works with reliable delivery companies
Detailed information regarding de-livery period & delivery date when ordering
Fast delivery
Free delivery
Tracking information
Delivery to a retail store
Delivery to a parcel locker or drop box
Other collection points (super- market, kiosk, gas station)
2.8
2.7
3.4
5.4
4.9
5.0
3.2
4.8
4.5
Max. accepted order time · Ø in days *
3.6
3.5
3.7
5.3
4.8
5.1
3.8
4.9
4.7
* Source: DHL Global Mail 2013 ∙ n Global from 10,270 to 10,462 ∙ n USA from 943 to 962 ** scale from 1 "absolutely not important" to 6 "very important“
Long distances - fast delivery
Despite the size of the country, people expect their order to arrive within six days. Apart from free and fast delivery, Americans also want to be in-formed about the status, time and date of their delivery.
“CUSTOMER JOURNEY“ – DELIVERY
1 2 3 4 5 6
Requirements for delivery · Ø *,**
Country information USA Country profile · Media Use · Distance selling · “Customer jour-ney“ · Drivers & barriers in distance selling · Cross-border shopping · Dialog marketing
6.3
6.5
USA Globally
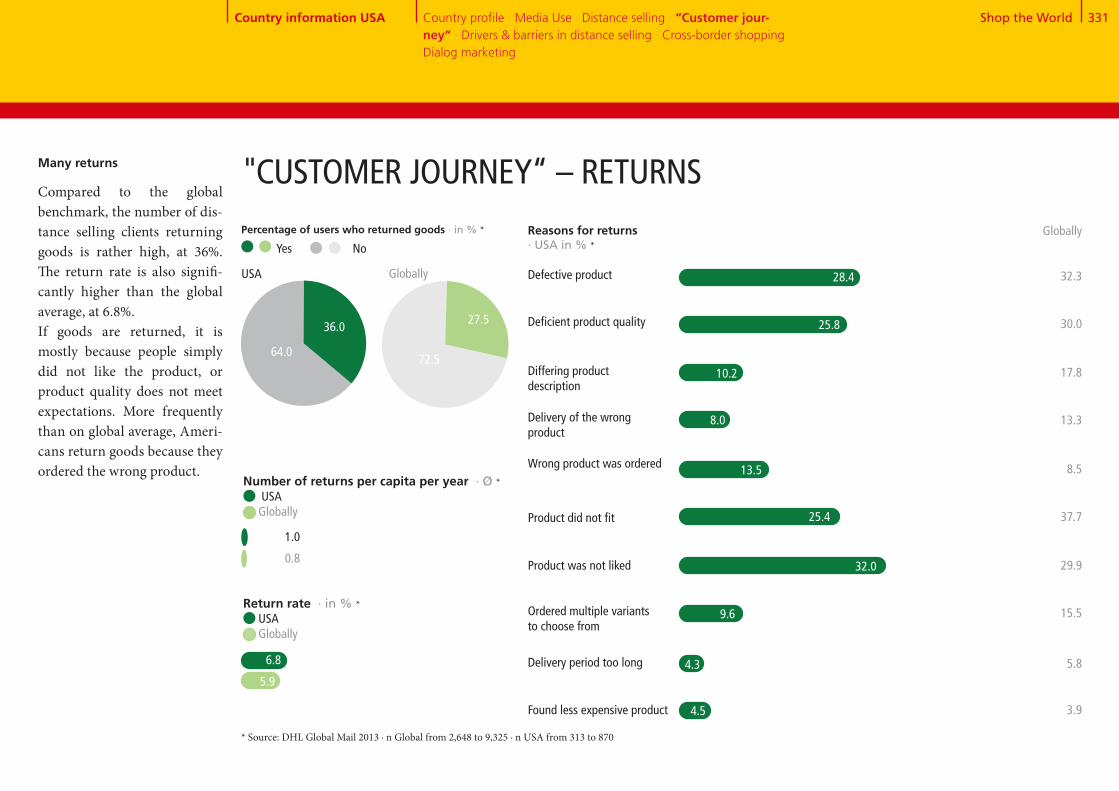
Shop the World 331
64+36 72+28
Number of returns per capita per year · Ø * USA Globally
0.8
1.0
Return rate · in % * USA Globally
5.9
Reasons for returns · USA in % *
Defective product 28.4
Percentage of users who returned goods · in % *
36.0
64.0
USA Globally
Yes No
"CUSTOMER JOURNEY“ – RETURNSMany returns
Compared to the global benchmark, the number of dis- tance selling clients returning goods is rather high, at 36%. The return rate is also signifi-cantly higher than the global average, at 6.8%.If goods are returned, it is mostly because people simply did not like the product, or product quality does not meet expectations. More frequently than on global average, Ameri-cans return goods because they ordered the wrong product.
27.5
72.5
* Source: DHL Global Mail 2013 ∙ n Global from 2,648 to 9,325 ∙ n USA from 313 to 870
Differing product description
Delivery of the wrong product
Wrong product was ordered
Product did not fit
Ordered multiple variants to choose from
Delivery period too long
Found less expensive product
Deficient product quality
Product was not liked
10.2
8.0
25.4
32.0
9.6
4.3
4.5
Globally
32.3
30.0
17.8
13.3
8.5
37.7
29.9
15.5
5.8
3.9
25.8
13.5
Country information USA Country profile · Media Use · Distance selling · “Customer jour-ney“ · Drivers & barriers in distance selling · Cross-border shopping · Dialog marketing
6.8

Shop the World 332
High delivery costs
Uncertain delivery
Concern about misuse of payment data
No demand because all products are obtainable locally
Long delivery periods
Unknown product quality
No try-on possible before purchase
Complicated return of the products
No personal advice
No personal contact person for problems
Doubts regarding data protection or the dissemination of data to third parties
Concern about counterfeited products, product piracy
Product can only be obtained via distance selling
Easy price comparison
Shopping 24/7
Location-independent ordering
Higher product quality
Lower prices
Greater selection
Option to deliver to a preferred location
DRIVERS & BARRIERS IN DISTANCE SELLING Barriers
· USA in % *
50.8
54.6
72.6
63.5
7.8
59.1
46.0
67.3
57.3
52.8
72.4
Globally
36.6
24.2
34.4
3.9
25.8
48.5
64.9
44.1
21.5
22.0
29.8
34.1
Convenience rules
Distance selling allows shop-ping around the clock; addition- ally, the goods are conveniently delivered to the doorstep.
Drivers · USA in % *
Globally
* Source: DHL Global Mail 2013 ∙ n Global from 10,509 to 10,864 ∙ n USA from 960 to 983
63.9
45.3
75.1
67.2
6.1
49.1
18.5
29.0
2.5
32.1
44.0
69.5
49.5
12.6
15.6
25.6
21.1
Country information USA Country profile · Media Use · Distance selling · “Customer jour-ney“ · Drivers & barriers in distance selling · Cross-border shopping · Dialog marketing

Shop the World 333
44+24+32CROSS-BORDER SHOPPING – OVERVIEW
Previous orders abroad
Previous and future orders abroad by country · in % *
Japan[20.2]
Canada[31.2]
1
2
3
4
5
China[48.1]
Great Britain[40.5]
Hong Kong[22.4]
Future orders abroad
USA
* Source: DHL Global Mail 2013 ∙ n Global from 4,738 to 8,807 ∙ n USA from 381 to 785 ** split into "further orders planned“ 38.1% USA and "no further orders planned" 5.7% USA
Few orders from abroad
So far, only two fifths of dis- tance selling clients have shopped internationally; this is slightly lower than the global comparison. However, two-thirds of Americans plan to shop abroad in the future. US shoppers mainly order in Chi-na, Great Britain, and Canada. In the future, China will lose its leading position. The top destinations for cross-border shopping will than be English- speaking Great Britain and Canada followed by Japan.
Canada[69.8]
Germany[38.5]
Great Britain[70.9]
China[44.0]
Japan[46.0]
Country information USA Country profile · Media Use · Distance selling · “Customer jour-ney“ · Drivers & barriers in distance selling · Cross-border shop-ping · Dialog marketing
Use of cross-border eCommerce · in % *
Yes, already ordered **No, but future orders planned No, no future orders planned
23.6
43.8
32.6

Shop the World 334
Products not obtainable domestically
Higher quality of the products
Lower prices
Greater selection
Assurance against product counter-
feiting
High delivery costs Language problems
Customs clearance
Non-transparent costs
Uncertainty with problems
No demand because all products are obtainable locally
Long delivery times
Unknown product quality
Complicated return process
Concerns regarding data protection Fear of fraud Uncertain delivery
Concern about misuse of payment data
Uncertainty regarding warranty terms, payment process, legal situation, etc.
Drivers for ordering abroad
· USA in % *
Barriers to ordering abroad · USA in % *
Globally
73.3
24.2
62.9
41.2
11.7
Globally
53.7
31.6
41.3
41.3
33.3
12.5
56.1
35.7
50.8
24.5
41.6
39.5
31.6
39.3
Availability and prices
If Americans order from abroad, it is often because products are not available in the US or because people ex-pect lower prices.High delivery costs and long delivery times speak against ordering from abroad. Another barrier is the more difficult process involved in product returns.
CROSS-BORDER SHOPPING – DRIVERS & BARRIERS
* Source: DHL Global Mail 2013 ∙ n Global from 7,289 to 10,689 ∙ n USA from 550 to 948
62.3
31.6
31.1
38.4
39.3
21.7
69.4
48.9
54.8
30.8
51.1
40.8
40.6
41.9
65.2
12.4
53.6
29.1
3.7
Country information USA Country profile · Media Use · Distance selling · “Customer jour-ney“ · Drivers & barriers in distance selling · Cross-border shop-ping · Dialog marketing

Shop the World 335
Receipt of mailings and catalogs · USA in % *
5 and 63 and 41 and 2
DIALOG MARKETING
Reading mailings and catalogs · in % *,**
USA
Globally
23.1 44.5 32.4
22.1 35.2 42.7
5 and 63 and 41 and 2
Response to mailings and catalogs · in % *,**
USA
Globally
35.0 48.0 17.0
29.0 45.8 25.3
Response channel for mailings and catalogs · USA in % * Globally
Website visits
Visits to stores or
branch offices
Other online
response (e.g. chat,
Twitter, Facebook,
newsletter
registration, etc.)
Phone call
Business reply card
74.7 73.4
48.6
30.0
24.5
18.4
12.6
* Source: DHL Global Mail 2013 ∙ n Global from 8,788 to 11,265 ∙ n USA from 801 to 1,022 ** scale from 1 "never“ to 6 "almost always“
A lot of mail, a lot of reluctance
In the US, there is a reciprocal relationship between the num-ber of mailings received and the willingness to respond to them. While almost two thirds of Americans receive mailings and catalogs at least once a month (more frequently than the global average), only one third actually reads them. Only 17% of respondents respond to dialog marketing.The most frequent form of re- sponse from people who are interested in what the mailing has to offer is visiting the sup-plier’s website, store or retail outlet. The response card is hardly ever used in this highly digitized country.
Globally
One or more times per week
One or more times per month
Less than once per month
Never
26.9
33.7
27.7
11.6 46.9
18.8
14.3
17.6
7.1
33.1
41.3
17.7
7.8
Country information USA Country profile · Media Use · Distance selling · “Customer jour-ney“ · Drivers & barriers in distance selling · Cross-border shop-ping · Dialog marketing

Shop the World 336
22
Gender (quota) · in % * Male Female
Age (quota) · in % * 16-24 yrs. 25-34 yrs. 35-44 yrs. 45-54 yrs. 55-64 yrs.
Occupation · in % * Employed Unemployed
Education · in % * Lower educational level Medium and higher level of education
14
Community size · in % * Rural (<50,000 inhabitants) Non-rural/urban (>50,000 inhabitants)
Household type · in % * Single 2-person household without children Household with children Household with 3 adults
Mobile Internet usage · in % * Yes NoGross household income · in % * Low income Medium income High income 34
3432
4654
2243
50
18
50
29
86
64
2311
71
22
36
2117
AU AT BR CA CN FR DE IN IT JP MX NL PL RU KR ES CH TR UK US
522 510 512 512 1,040 505 514 501 500 514 512 512 509 512 521 506 521 516 504 1,022
Countries analyzed / number of cases per country
Methodology
Quantitative online survey using an online access panel
Basic population
Online population in 20 coun-tries; country-dependent quota process by age and gender .
Sample size
n = 11,265
Weighting
The total value is calculated as a weighted mean with every coun-try contributing 5% to the total; case figures are shown as un-weighted values .
Interview duration
approx . 13 minutes (median)
Field time
Oct . 28th to Nov . 15th, 2013
Notes on the methodology used: Rounding differences
Due to the fact that figures have been rounded, the total might be not exactly 100 per cent .
Appendix Methodology: Study design and sample size
Methodology: Study design and sample size
* Source: DHL Global Mail 2013 ∙ All values in %, n (total) = 9,525-11,265

Shop the World 337
Usage of distance selling and number of orders in the previous yearHow often have you bought goods via distance selling in the last 12 months?
Future ordering behavior (current users)How often do you think to buy goods via distance seilling in the next 12 months?
Non-users of distance selling-future plansCould you envisage to buy goods via dis-tance selling in the next 12 months?
GenderPlease indicate your gender .
AgeHow old are you?
OccupationAre you employed?
EducationWhat is your level of education?
Community sizeHow large is the community or town you live in?
Minors in the householdHow many people in your household are minors?
Household typeHow many people live with you in your household?
Mobile Internet usageWhere do you use the internet?
Gross household incomeHow much is your gross annual household income?
Search for product informationIf you wish to place an order via distance selling: How and where do you get your initial information about the products?
Criteria for choosing a distance selling vendorWhich of the following criteria is par-ticularly important when selecting a distance selling vendor (Internet and/or catalog)?
Usefulness of advertising mediaHow useful do you find the following media in obtaining this information?
Distance selling order channelsHow often have you personally used mail order in the last 12 months using the following media?
Use of different distance selling suppliersAnd where have you ordered in the last 12 months?
PaymentAnd how have you paid for your goods in the last 12 months?
Accepted order timesWhat delivery times do you find accept-able when buying by distance selling?
Requirements for deliveryThe focus now is on the delivery of the products that you have ordered: How important to you are the following aspects relating to the delivery?
Percentage of users who returned goods and number of returns How many returns have you personally made in relation to orders in the last 12 months?
Appendix Questionnaire
Reasons for returnsFor what reasons have you personally returned goods to the vendor? DriversFrom your point of view, what are the advantages of buying by distance selling?
BarriersFrom your point of view, what are dis-advantages of buying by distance selling?
Use of cross-border eCommerce Have you ever ordered goods from abroad? Can you imagine yourself order-ing abroad in future?
Previous cross-border shopping by countryIn which countries have you already made orders?
Future cross-border shopping by countryIn which countries can you imagine yourself ordering abroad in the future?
Drivers for cross-border shoppingFrom your point of view, what are the ad-vantages for ordering abroad?
Barriers to ordering abroadFrom your point of view, what are the disadvantages of ordering ordering abroad?
Receipt of mailings and catalogsHow often have you received advertising or catalogs by mail in the last 12 months?
Reading mailings and catalogsHow often do you read advertis-ing or catalogs that you receive by mail?
Response to mailings and catalogsAll in all: How often have you responded to advertising or catalogs received in the mail in the last 12 months, e .g . by visit-ing the relevant website, placing an order, visiting the store, etc .?
Response channel for mailings and catalogsHave you already responded in the specified manner to advertising or cata- logs received by mail in the last 12 months?
Questionnaire

Shop the World 338
Deutsche Post AG
Represented by the Board: Dr. Frank Appel, CEO Ken Allen Roger Crook Jürgen Gerdes John Gilbert Lawrence A. Rosen Angela Titzrath
Chairman of the Supervisory Board:Prof. Wulf von Schimmelmann
Commercial Register: District Court of Bonn, HRB 6792VAT ID .: DE 169838187
Address:Charles-de-Gaulle-Straße 20 ZIP/ Town: 53113 Bonn Phone: +49 / (0) 228 / 18 20
Contact:Email: [email protected] Website: www.dhl.com
Study design and implementation:Deutsche Post AG, Market Research Service Center/ MRSC
Project management: Susanne Fischer, Deutsche Post AG
Project management and editorial: Birgit Bünnigmann, Bettina Schletter, Gabriele Thümmler, Simone Weithöner, all of Deutsche Post AG
Layout: Meavision Media GmbH
Regulating authority according to Article 5 (1) No. 3 German Telemedia Act for the Carriage of letters weighing up to 1,000 Grams: Federal Network Agency for Electricity, Gas, Telecommunications, Post and Railway (BNetzA), Tulpenfeld 4, 53113 Bonn, Phone: +49 / (0) 228 / 14-0, www.bundesnetzagentur.de
Commercial property rights: All of the texts, photos, data and graphical designs used in this document are protected by copyright and database rights. This content may only be used with the prior consent of the rights holder.
Legal notice