shoalhaven illawarra riparian cover mapping study · table 4. final cover classes used for the...
TRANSCRIPT

Shoalhaven Illawarra riparian cover mapping study

Prepared for the Southern Rivers CMA by
NSW Department of Water and Energy Level 17, 227 Elizabeth Street GPO Box 3889 Sydney NSW 2001T 02 8281 7777 F 02 8281 [email protected]
Shoalhaven Illawarra riparian cover mapping study
May 2008
ISBN 978 0 7347 5884 2
Acknowledgements
Funded by the Southern Rivers Catchment Management Authority through the Natural Heritage Trust.
Written by Martin Mutendeudzi and Tim Haeusler
NSW Department of Water and Energy would like to acknowledge the contribution of: Project Steering Committee for their valuable advice throughout the project: Williams, S. (DWE); Cole, R. (SRCMA) and Rendell, R. (SRCMA)
This publication may be cited as:
Mutendeudzi, M and Haeusler, T. (2008) Shoalhaven Illawarra riparian cover mapping study. Southern Rivers Catchment Management Authority and Department of Water and Energy, Sydney.
© State of New South Wales through the Department of Water and Energy, 2008
This work may be freely reproduced and distributed for most purposes, however some restrictions apply. Contact the Department of Water and Energy for copyright information.
Disclaimer: While every reasonable effort has been made to ensure that this document is correct at the time of publication, the State of New South Wales, its agents and employees, disclaim any and all liability to any person in respect of anything or the consequences of anything done or omitted to be done in reliance upon the whole or any part of this document.
DWE 07_128

Shoalhaven Illawarra riparian cover mapping study
Contents
Abstract ................................................................................................................................... iv
1 Introduction ...................................................................................................................1 1.1 Importance of riparian vegetation.......................................................................1 1.2 Objectives of this riparian cover mapping study.................................................2
2 Study Area ....................................................................................................................3 2.1 Topography........................................................................................................4 2.2 Climate ...............................................................................................................4 2.3 Land use. ...........................................................................................................6 2.4 Geology..............................................................................................................6 2.5 Vegetation ..........................................................................................................7
3 Methods ........................................................................................................................8 3.1 Literature review.................................................................................................8 3.2 Adopted method.................................................................................................9
Step 1. Defining the riparian zone.....................................................................9 Step 2: Subset riparian areas and classify SPOT-5 images ...........................10 Step 3: Generate landscape metrics (patch analysis).....................................13 Step 4: Standardise metrics and generate a riparian woody cover score.......15
4 Results ........................................................................................................................17 4.1 Land cover .......................................................................................................17
4.1.1 Woody vegetation cover .......................................................................17 4.1.2 Bare and almost-bare cover..................................................................17 4.1.3 Weed cover...........................................................................................19 4.1.4 Riparian cover class landuse associations ...........................................19
4.2 Woody cover patch statistics............................................................................20 4.2.1 Average patch size ...............................................................................20 4.2.2 Patch density ........................................................................................22 4.2.3 Largest patch index...............................................................................22 4.2.4 Mean nearest neighbour .......................................................................22
4.3 Woody riparian cover score .............................................................................22 4.3.1 Riparian woody cover score..................................................................22 4.3.2 Subcatchment based riparian woody cover score ................................24
4.4 Summary of results for all subcatchments .......................................................28
5 Discussion...................................................................................................................29 5.1 application to investment strategies .................................................................29
5.1.1 General rehabilitation principles............................................................29 5.2 Shoalhaven Illawarra riparian protection and rehabilitation priorities
based on the woody cover type .......................................................................30
NSW Department of Water and Energy | Southern Rivers Catchment Management Authority | May 2008 page i
Shoalhaven Illawarra riparian cover mapping study
5.3 Shoalhaven Illawarra investment priorities.......................................................34 5.4 Relevance of data to catchment target, and the future monitoring
programs..........................................................................................................35 5.5 Limitations of the methods ...............................................................................35
5.5.1 Limitations of SPOT-5 images ..............................................................36 5.5.2 Limitations of landscape metrics and woody cover scores ...................36 5.5.3 Comparison with other riparian assessment methods ..........................37
5.6 Additional studies .............................................................................................38
6 References..................................................................................................................39
7 Appendices .................................................................................................................43 Appendix 1. Spot-5 Image Information.......................................................................43 Appendix 2. Land use mapping codes .......................................................................44
8 Subcatchment Report Cards.......................................................................................46
Figures Figure 1. Shoalhaven Illawarra catchments showing subcatchment and zonal
boundaries .........................................................................................................3 Figure 2. Longterm average annual rainfall of the Shoalhaven Illawarra area and
monthly average rainfall (mm) distributions (modelled data from longterm records CRA, 2002) ...........................................................................................5
Figure 3. Summary of riparian cover mapping procedure for the Shoalhaven-Illawarra area. ..................................................................................................11
Figure 4. Illustration of a grid tile, riparian area and classified patches...........................15 Figure 5. Percentage cover of Woody (left) and Bare/Almost Bare (right) within
riparian lands of the Shoalhaven-Illawarra area. Note: % values exclude areas classified as water..................................................................................19
Figure 6. Mean patch size for woody vegetation for the subcatchments of the Shoalhaven-Illawarra. ......................................................................................21
Figure 7. Median patch size for woody vegetation for the subcatchments of the Shoalhaven-Illawarra. ......................................................................................21
Figure 8. Woody cover patch statistics for the Shoalhaven-Illawarra area, including patch density, largest patch index , mean nearest neighbour and proximity index. ................................................................................................23
Figure 9. Subcatchment mean aggregate woody riparian cover scores based upon management tile data.......................................................................................25
Figure 10. Subcatchment median aggregate woody riparian cover scores based upon management tile data..............................................................................26
Figure 11. Woody riparian cover scores for the Shoalhaven-Illawarra using the subcatchment based analysis. .........................................................................27
Tables Table 1. Land use composition within the Shoalhaven Illawarra study area....................6
NSW Department of Water and Energy | Southern Rivers Catchment Management Authority | May 2008 page ii

Shoalhaven Illawarra riparian cover mapping study
Table 2. Rules for the determination of buffer widths.....................................................10 Table 3. SPOT-5 spectral range and spatial resolution. ................................................12 Table 4. Final Cover Classes used for the Shoalhaven-Illawarra riparian cover
mapping ...........................................................................................................12 Table 5. Riparian cover class area for all subcatchments and cover types ...................18 Table 6. Comparisons of subcatchment cover classes across overall study area
and within each geographic zone. Catchments ranked from 1 through 21, best to worst...............................................................................................18
Table 7. Distribution of cover class areas across landuse types. ..................................20 Table 8. Summary of results for the Woody cover class for all subcatchments in
order of descending riparian cover score (ie best through to degraded). ........28 Table 9. Priority rehabilitation actions for Shoalhaven Illawarra riparian zones.............31
NSW Department of Water and Energy | Southern Rivers Catchment Management Authority | May 2008 page iii
Shoalhaven Illawarra riparian cover mapping study
Abstract This study maps the riparian vegetation cover for the Shoalhaven Illawarra area using SPOT-5 Satellite imagery. Riparian areas were defined using a combination of Strahler stream order and landform modelling. The riparian areas for each of the 21 sub-catchments were classified into six cover classes: woody, non-woody, bare, almost bare, water and wherever possible willows, using the unsupervised classification method.
A variety of spatial metrics were calculated to describe the distribution of each cover type (eg. total area, percentage cover and fragmentation indices). Detailed reporting is provided for the woody cover type and a general riparian cover score generated for each subcatchment to enable comparisons at a subcatchment level. In order to make comparisons within sub-catchments, a similar score was generated at a management level by applying a 500 metre grid across each subcatchment, and calculating metrics for each grid tile.
Subcatchments are ranked according to the adopted rehabilitation principle of protecting intact vegetation first, before directing rehabilitation efforts out from theses areas. General rehabilitation priorities are provided for each subcatchment.
Together with the broad-scale ranking of subcatchments, individual subcatchment report cards are provided that present general and calculated landscape metrics for the cover classes considered most relevant for management purposes. The information from these report cards can be used to address management priorities within subcatchments, for example, the setting of priorities for more detailed assessments of river processes and ecology. The data could also be integrated with other data to assist in the study of other catchment based processes such as the identification of sediment sources.
In conjunction with this report and the individual report cards, the project has produced an extensive spatial data set which can be used as an ongoing information and management tool. This data set has the potential to be used for the performance monitoring of the Southern Rivers Catchment Management Authority’s Water Management Target W5 (a) by providing a benchmark condition. The method adopted in this study could be repeated in the future to identify changes in riparian cover condition and assess these against implemented management actions.
It is important to stress that this project is not suggesting that riparian land cover alone is a complete indicator of catchment or river health. Rather, the unavailability and cost of collecting data for other catchment health themes such as habitat, water quality, and aquatic biota at a river basin scale made it necessary to use riparian land cover as the cost effective indicator of riparian condition.
NSW Department of Water and Energy | Southern Rivers Catchment Management Authority | May 2008 page iv

Shoalhaven Illawarra riparian cover mapping study
1 Introduction Riparian vegetation, including floodplain forests along rivers, is recognised as an important part of river ecosystems (Muller, 1997) and there is an increasing demand by community and government to include riparian vegetation in conservation, and rehabilitation management projects.
Riparian areas are defined as transitional zones that adjoin a body of water (eg. riverbanks, flood plains and wetland fringes) and are functionally defined as any land which directly influences or is influenced by a body of water (LWRRDC 1999).
1.1 IMPORTANCE OF RIPARIAN VEGETATION
Riparian vegetation provides a number of important functions, including: o Root masses for stream bank stability; o Filters for sediment and nutrient runoff; o Shade to control water temperature; o Food source to streams from litter fall; o Large woody debris for stream channel development; and, o Habitat for both aquatic and terrestrial flora (Congalton et al., 2002).
Riparian buffer zones have been found to be effective in decreasing non-point source pollutants (including nitrogen (N), phosphorous (P), heavy metals, pesticides, herbicides and overland flow wastewater treatment systems) in streams (Narumalani, et al.,1997). Lowrance et al. (1985) found that N removal by denitrification and storage by woody vegetation was six times as much as N output to stream flow. United States Department of Agriculture Forest Service (1991) investigations report that P is significantly reduced by the filtering action of riparian vegetation because about 85% of the available P is transported with the small soil particles comprising the sediment.
Riparian vegetation exerts a major control on stream temperature through shading of the water surface (Davies et al., 2004). Research has shown that in-stream water temperatures impact on biodiversity and river health when upper lethal temperature limits of resident aquatic fauna are exceeded. Control of stream temperature through riparian shading has been suggested to be an area where restoration targets can be set and the amount of vegetation required to meet these targets can be determined from published relationships between stream temperature, solar radiation indices (calculated from digital elevation models) and riparian vegetation mapping (Davies et al., 2004).
Riparian vegetation and stream health and function are especially vulnerable to land-use change, particularly human activities that involve vegetation clearing including grazing, urban development and intensive agriculture (Oates, 2000; Snyder, et al. 2005; Wang et al., 2001). Human settlement has historically concentrated around rivers and is a major determinant of riparian structure and function (Dynesius & Nilsson, 1994). Jansen et al. (2005) report that the introduction of domestic stock has been one of the biggest impacts on riparian areas, with grazing being the major landuse on over 60% of Australia’s land surface (Wilson, 1990). Other threats to riparian vegetation include climate change (drought), fire, weed ingress and hydrological changes due to flow regulation and extraction (Thurtell and McNeil, 2005).
NSW Department of Water and Energy | Southern Rivers Catchment Management Authority | May 2008 page 1

Shoalhaven Illawarra riparian cover mapping study
1.2 OBJECTIVES OF THIS RIPARIAN COVER MAPPING STUDY
The importance of riparian vegetation is recognised by the Southern Rivers Catchment Management Authority (SRCMA) through their Water Management Target W5 (a), which states, “By 2016 an additional 2,000ha of riparian vegetation will be actively managed for improved riverine ecosystem condition” (SRCMA, 2007, p.80). In order to meet the intentions of this target, the SRCMA requires a strategic approach that will assist them in setting investment priorities with respect to riparian rehabilitation and conservation protection programs. Such an approach could also assist with secondary priorities for reviewing the catchment target and assist with performance monitoring.
The primary objective of this study was to develop and apply a cost effective, repeatable process to assist prioritisation of riparian management investment at a broad subcatchment scale, within the constraints of the existing data resources of the NSW Government.
To achieve this aim, a method was developed to map and characterise riparian land-cover using SPOT-5 satellite images. This method, developed and trialled in the Reedy Creek catchment, and described in detail in Mutendeudzi (2006), quantifies the spatial distribution of riparian vegetation cover within a matrix of 500m grid squares across the study area.
Insufficient data were available for other physical chemical (e.g. geomorphology, temperature, PH and dissolved oxygen) or biological (macroinvertebrate and fish) metrics to enable these to be included in any prioritisation process. To collect such data would have been outside the financial and temporal scope of the project. A geomorphic assessment is available for the trunk streams of the Shoalhaven catchment (Brierley et.al, 1999) but not in sufficient detail to allow a full comparison of subcatchments, and similar information was not available for the remainder of the study area. Detailed geomorphic assessments of bed degradation at a sub catchment scale have also been undertaken in some areas but whilst this data is useful to prioritise between individual erosion locations at a local level, the lack of spatial coverage of such data provides little assistance in broader priority setting. In 1999, the NSW Government undertook the stressed rivers assessment for most freshwater catchments in NSW (DLWC, 1999). The study was based on existing data, and although the emphasis was on hydrologic issues, assessments of environmental stress were undertaken and took into account issues such as riparian vegetation, fish passage and catchment landuse pressure. This assessment was however considered too superficial to adequately assist the SRCMA to prioritise investment.
It is important to stress that this project is not suggesting that riparian land cover alone is a complete indicator of catchment or river health. Rather, the unavailability and cost of collecting data for other catchment health themes such as habitat, water quality, and aquatic biota at a river basin scale made it necessary to use riparian land cover as the cost effective indicator of riparian condition.
NSW Department of Water and Energy | Southern Rivers Catchment Management Authority | May 2008 page 2

Shoalhaven Illawarra riparian cover mapping study
NSW Department of Water and Energy | Southern Rivers Catchment Management Authority | May 2008 page 3
2 Study Area The study area covers some 9,000 square kilometres and comprises the Shoalhaven River catchment and the smaller coastal catchments from the Illawarra south to Durras, (Figure 1). To maintain a level of consistency with other studies undertaken within the catchment, the subcatchment boundaries used were those used for the Water Sharing Plan process with a minor variation, that being the sub-division of the Lower Shoalhaven subcatchment at the tidal limit to create the Shoalhaven Estuary subcatchment. This separation was to account for potential vegetation differences between the estuarine and freshwater sections.
Figure 1. Shoalhaven Illawarra catchments showing subcatchment and zonal boundaries
Shoalhaven Estuary
Boro Creek
Mid-Shoalhaven River
Lower Shoalhaven
Shoalhaven River Gorge
Jervis Bay / Sussex Inlet
Upper Shoalhaven
Reedy Creek
Corang Endrick
Nerrimunga Creek
Lower Kangaroo
River
Mangarlowe River
Wollongong
Kangaroo River
Milton- Ulladulla
Bungonia Creek
Broughton Creek
Minnamurra River
Macquarie Rivulet
Murramarang- Durrras
Gerringong - Geroa
NOWRA
KIAMA
NERRIGA
MARULAN
GOULBURN
ULLADULLA
MOSS VALE
BRAIDWOOD
WOLLONGONG
SUSSEX INLET
BATEMANS BAY
KANGAROO VALLEY
0 8 164
Kilometres ¹
LegendTown
ZoneCoastal
Mid
Western
Main Road

Shoalhaven Illawarra riparian cover mapping study
2.1 TOPOGRAPHY
The following description of the topography of the Shoalhaven River and its catchment is largely based upon descriptions provided in Brierley et al. (1999). The Shoalhaven River and its minor tributaries flow predominantly in a northerly direction, with the headwaters rising at elevations of 1100-1400m in elevation. The valley floor immediately downstream of these headwater reaches ranges in width from 300-1000m. Near the town of Braidwood, at the foot of the Budawang Ranges, the river has an elevation of around 670m. As the river flows through the Shoalhaven Plain the topographic relief decreases with surrounding hills rising rarely more than 100m. The valley floor in this area is between 5-6km wide and tributaries are incised 20-30m below the plain. Tributaries which rise to the west of the Shoalhaven River generally drain areas of higher elevation than those which drain from the east.
Upstream of the Corang River confluence near Welcome Reef, the river passes through a much different topography with relief increasing considerably as the main trunk stream cuts deeper into the Shoalhaven Plain flowing through a sandstone gorge some 300-500m in depth. Many tributaries enter through this section including the Kangaroo River, which drains from the high rainfall areas to the east until it joins the Shoalhaven River at Tallowa Dam, a major concrete water supply dam of 43m in height. Approximately 20km downstream of the dam the valley floor opens out as the river flows out from the gorge onto the deltaic plain section of the tidal reaches.
A coastal plain runs between the northern end of the study area (north of Wollongong) and Nowra. This coastal strip is bounded on the west by the Illawarra escarpment consisting of steep sandstone cliffs, which rise up to 600m in elevation. South of Nowra, hilly terrain and small plains dominate the topography along the coast.
2.2 CLIMATE
The study area climate can be described in general terms as cool and relatively dry for the inland subcatchments. In contrast, the coastal subcatchments have a relatively mild and wetter climate. On average the subcatchments in the Western Zone (Figure 2) receive the least amount of annual rainfall (650-900mm), primarily due to the rain-shadow effect of the Australian Alps, which tend to shelter most of the catchment from the southerly and westerly rain-bearing air streams in the winter and spring months (McAlpine and Yapp, 1969). Coastal subcatchments by contrast, receive the highest rainfall (1100-1500mm) dominated by the orographic uplift of maritime air over the Budawang Ranges and the Illawarra escarpment (Higginson, 1970). Annual average rainfall for the Mid Zone subcatchments ranges considerably (750-1550mm) given the east-west rainfall gradient.
Seasonality of rainfall is generally dominated by late summer falls, particularly in the east. Wetter periods do occur in the month of June for some of the more western subcatchments, but on average, these falls are not of the same magnitude as those received in the summer months (Figure 2 and Individual Report Cards).
NSW Department of Water and Energy | Southern Rivers Catchment Management Authority | May 2008 page 4

Shoalhaven Illawarra riparian cover mapping study
Figure 2. Longterm average annual rainfall of the Shoalhaven Illawarra area and monthly average rainfall (mm) distributions (modelled data from longterm records CRA, 2002)
Average Annual Rainfall (mm)600 - 700
700 - 800
800 - 900
900 - 1,000
1,000 - 1,100
1,100 - 1,200
1,200 - 1,300
1,300 - 1,400
1,400 - 1,500
1,500 - 1,600
1,600 - 1,700
1,700 - 1,800
1,800 - 1,900
1,900 - 2,000
2,000 - 2,100
0
40
80
120
160
J F M A M J J A S O N D
0
40
80
120
160
J F M A M J J A S O N D
0
40
80
120
160
J F M A M J J A S O N D
NSW Department of Water and Energy | Southern Rivers Catchment Management Authority | May 2008 page 5

Shoalhaven Illawarra riparian cover mapping study
2.3 LAND USE.
A general breakdown of land use for the entire study area (Table 1) shows that grazing is the predominant use, followed by conservation areas such as National Parks, State forests and other conservation areas on private lands (such as treelots, windbreaks, tree corridors or other lands fenced for environmental restoration). Grazing is wide spread within the Western Zone (48%) and Coastal Zone (25%) subcatchments. National Parks, the second most predominant land use, is concentrated within the Mid Zone subcatchments (46%) with smaller area areas present within the Western Zone (12%) and Coastal Zone (16%) subcatchments. Urban land use accounts for only a small percentage overall (2.3%) and is concentrated along the Coastal Zone subcatchments where it accounts for 8% of total lands. Rural residential land accounts for 3.5% of the total study area and is concentrated in the Western (5.5%) and Coastal zones (4.1%). Detailed maps of land use for each subcatchment are provided in the report card section
Table 1. Land use composition within the Shoalhaven Illawarra study area. Percentage of Area Coastal Mid Western Total Study AreaGrazing 24.7 17.3 48.3 29.7National Parks 16.2 46.4 11.6 26.5Private conservation 23.3 24.9 20.2 22.9State Forests 6.3 2.7 7.0 5.1Other Public Lands 10.8 3.0 2.0 4.8Rural Residential 4.1 1.4 5.5 3.5Forestry/Plantations 1.1 3.9 5.0 3.5Urban 8.2 0.2 0.1 2.3Unmapped 3.0 0.0 0.0 0.8Industry/Intensive Agriculture 2.2 0.1 0.1 0.7Cropping 0.2 0.1 0.1 0.1
NB. Land use data derived from DNR (2004) land use mapping classes provided in Appendix 2.
2.4 GEOLOGY
The following summary of the geology of the study area has been synthesised from information presented by Branagan and Packham (2000).
The upper, western parts of the catchment lie on an edge of the Lachlan Fold Belt, a geological province which is dominated by Ordovician- and Silurian-age quartz-rich sedimentary rocks including silty sandstone, greywacke, quartzite, siltstone, phyllites, shales and slates. The western subcatchment also contain broad areas of Siluro-Devonian granite intrusion (Braidwood and Boro granites), separated in the far south by a narrow north-south band of Silurian volcanic rocks; a small area of Devonian granite and porphyry in the Marulan/Bungonia area; and distinctive patches of old inactive alluvial sediments (gravels, sands, clays) to the north and west of Braidwood.
In the Mid and Coastal Zones, from about Nerriga-Wingello and east, the catchment becomes dominated by the younger Permian rocks of the Sydney Basin, from the Morton Plateau east to Jervis Bay and north to Budderoo and the Woronora Plateau. These Zones are dominated by massive quartz sandstone and conglomerate plateaus and escarpments, and coastal foothills of siltstones, shales and fine sandstones. Small isolated areas of Tertiary basalt and dolerite are scattered across the western edge of the Mid Zone, including Sassafras, Tolwong and Caoura. Larger areas of richer soil occur in the catchment's Coastal
NSW Department of Water and Energy | Southern Rivers Catchment Management Authority | May 2008 page 6

Shoalhaven Illawarra riparian cover mapping study
Zone, including Permian volcanics (latites, tuffs and basalts) around Kiama, Mesozoic-age monzonite rocks at Milton, and significant areas of Quaternary alluvial sediments on coastal floodplains, including the Shoalhaven and behind Lake Illawarra and Jervis Bay.
2.5 VEGETATION
Tindell et al. (2004) provides the most comprehensive assessment of the vegetation in the catchment through what is commonly referred to as the P5MA project, as it is the Priority Five mapping area for the State-wide vegetation mapping program. This project mapped all extant vegetation within the study area greater than two hectares in area. Unfortunately, much of the riparian zone was not mapped as the linear nature of riparian vegetation rarely produces intact stands of vegetation greater than two hectares. The project does however provide an excellent resource at a catchment scale and is the basis for the following description.
The catchment's vegetation patterns broadly follow patterns of geology, climate and landform. The higher, cooler western parts of the catchment are dominated by grassy woodlands on undulating granite and clay soils, and shrubby dry sclerophyll forests on poorer sedimentary rock types. These dry shrubby forests grade into moist sclerophyll forests where rainfall increases, on higher tableland ranges and on the escarpment to the east. Tableland areas of impeded drainage and accumulated sediment support upland swamps and bogs, while cold alluvial flats support wet tussock grasslands. Distinctive riparian shrublands are found along the upper Shoalhaven, grading into tall River Oak forest as the Shoalhaven enters the gorge. The upper gorge cuts through older Lachlan Fold Belt sediments and supports areas of dry grassy woodlands and forests, with pockets of dry rainforest in areas protected from fire. The lower gorge slopes are dominated by sandstone rocks and shrubby dry sclerophyll forests, but are also influenced by coastal rainfall and contain areas of tall moist sclerophyll forest on sheltered slopes and areas influenced by weathering of richer shale strata. The adjacent sandstone plateaus support a patchy mosaic of low dry sclerophyll forests, mallee woodlands, heathlands and swamps, with patterns influenced by rainfall, soil depth and fire history. As rainfall increases towards the coast, plateau gullies and protected escarpment slopes are increasingly dominated by wet sclerophyll forest, with fire-protected sites supporting various rainforest types depending on elevation and fertility. Along the less fertile coastal foothills a range of wet and dry shrubby forests occur depending on aspect and soil, while more fertile coastal geologies (such as siltstones around Wollongong, Berry and Nowra, Kiama volcanics and Milton monzonite) support grassy woodlands in rainshadow areas and subtropical rainforest in the wettest areas. Coastal floodplains support a range of tall wet eucalypt forests, lowland rainforest, swamp forests, and lowland swamps, grading into swamp oak forests, estuarine scrubs, saltmarshes and mangroves with increasing salinity. Headlands and beaches along the catchment's coastline support littoral rainforest, coastal sand forests and scrubs, headland heaths and grasslands.
The most threatened vegetation types in the catchment are those restricted to higher fertility soils in gentler terrain targeted by agriculture, including tableland grasslands, grassy woodlands, swamps and bogs, and coastal grassy woodlands and floodplain vegetation including lowland rainforests, swamp forests and swamps. More recent urban, industrial and recreation pressures are largely coastal, and threaten littoral rainforests, headland grasslands, saltmarshes, dune forests and grassy woodlands.
NSW Department of Water and Energy | Southern Rivers Catchment Management Authority | May 2008 page 7

Shoalhaven Illawarra riparian cover mapping study
3 Methods
3.1 LITERATURE REVIEW
Remote sensing and Geographic Information System (GIS) technologies have been used widely to produce consistent and cost-effective information describing forest vegetation, including riparian areas (Apan et al. 2002; Narumalani et al. 1997; Khorram et al. 2003; Congalton et al. 1993, Bauer et al. 1994; Wolter et al. 1995). Hewitt (1990) used Landsat TM data to map riparian land-cover classes from rivers, lakes and wetlands and achieved classification accuracy of 80%. Khorram et al. (2003) achieved an Overall Accuracy of 77% with IKONOS satellite data mapping watershed land cover and land use. Talukdar (2004) reports Overall Accuracy of 96%and Kappa statistic 93% classifying wetland features using SPOT-5 data.
Many studies have been conducted to evaluate and/or compare the results of this relatively new technology against older technology and methods involving aerial photographs (Harvey and Hill 2001; Muller 1997; Congalton et al.; 2002, Forghani et al. 2003, Rogan and Chen 2004). Air-photographs were superior at identifying structural characteristics of riparian vegetation (Congalton et al.; 2002). Many studies recommend or advocate use of high-resolution (e.g SPOT-5, IKONOS, and Quickbird2), 10m or better and multi-band satellite data to effectively describe riparian vegetation.
While there is a lot of literature with descriptive definitions of the riparian zone, there is limited literature with detailed information on how to spatially delineate the riparian zone in accordance with those definitions. Many studies resorted to using fixed width stream buffers often based on some guidelines. Apan, et al. (2002) used a range of buffer width from a minimum of 50m and a maximum 200m. Buffer widths ranging from 3m to 200m have been found to be effective in removing non-point source pollution (Narumalani et al. (1997). In their study, Narumalani et al. (1997) used 30m and 60m buffer widths, depending on the Soil Capability Class (USDA Forest Service) of the soil unit. Snyder et al. (2005) used a 30m buffer on all streams as this was a common metric used for restoration efforts in the catchment they were studying. Keller (undated) used a modelling approach in which the following variables were used to estimate the riparian zone at any particular point along the stream:
o Wetness index, o Maximum soil permeability, o Flood category, o Change in elevation from nearest body of water, and o Distance to nearest body of water.
In general terms though, the literature review appears to show that the image resolution is a significant factor in the choice of the buffer used with wide buffers tending to be associated with the more coarse imagery.
Apan, et al. (2002) used the Patch Analyst computer program (McGarigal and Marks, 1995) to calculate land cover composition and configuration measures or landscape metrics from riparian cover maps obtained through classifying Landsat TM imagery. They used the metrics to describe and analyse riparian landscape structures and changes through time. Snyder et al. (2005) went further and used land cover maps derived from fine resolution satellite imagery to derive land cover composition and configuration measures or landscape metrics and explored their relationship with stream health for a range of small watersheds.
NSW Department of Water and Energy | Southern Rivers Catchment Management Authority | May 2008 page 8

Shoalhaven Illawarra riparian cover mapping study
NSW Department of Water and Energy | Southern Rivers Catchment Management Authority | May 2008 page 9
The stream health rankings they used were derived from a combination of physical measurements and macroinvertebrate and fish biological indices. By incorporating the heterogenous land cover types, topographic information and the spatial configuration of landscape variables, logistic regression models of stream health rankings were developed. The Patch Analyst program is used to calculate a range of useful landscape metrics. Fragmentation is one such metric and is used by the Montreal Process1 as an indicator of biodiversity of forest types (Riitters, et al., 2003).
Snyder et al. (2005) found that Impervious Surface Area (ISA) is an important variable in predicting stream health. The same authors also found land cover of the riparian zone to be significant predictor of stream health but land cover throughout the subcatchment a more powerful predictor. Snyder et al. (2005) report that streams of a catchment are likely to in poor condition when the Impervious Surface Area (ISA) proportion exceeds 30% and that catchments where the ISA was less 8% were in excellent health. Theses results indicate that management practices designed to improve stream water quality should focus on the amount of ISA and tree cover in both the catchment and within the riparian buffer zone.
In Australia, Davies et al. (2004) report wide-ranging positive benefits of managing stream temperature through use of riparian vegetation.
3.2 ADOPTED METHOD
A pilot study, based on the Reedy Creek subcatchment, was undertaken to develop a method that would be applied to the whole study area comprising 21 subcatchments. The developed method is described in detail in Mutendeudzi (2006). Consequently, only brief descriptions of the method will be provided in this report. Figure 3 summarises the process undertaken to develop the products presented in this report. Each step is briefly described in the sections below.
Step 1. Defining the riparian zone
The riparian zone upon which all analyses for this project are based was generated by applying specific buffer widths to the NSW Land and Property Information (LPI) 1:25000 streams dataset. The buffer widths adopted for this project (Table 2) are based on landform type and Strahler stream order. Landforms were modelled using a combination of the FLAG UPNESS index (Roberts et al. 1997) and the Multi-resolution Valley Bottom Flatness (MRVBF) topographic index (John Gallant, CSIRO Land & Water, pers. com.) to produce six landform types as described in Mutendeudzi (2006). The combination of the two landform indices was required as the FLAG UPNESS wetness index tended to overestimate the riparian widths (Mutendeudzi, 2006).
The buffer width rules adopted took into consideration national guidelines set by Land and Water Australia in Price et al. (2004), field inspections to assess the representativeness of the buffer widths, and discussions with the SRCMA to obtain agreement as to the suitability of the buffer widths for the practical implementation of rehabilitation and conservation works. It should be noted from Table 2 that streams identified as being of 1st order have not been given a riparian width for the lower slopes, mid slopes and ridgetop/upper slopes landforms. A reconnaissance survey undertaken to assist the development of the riparian width rules concluded that many streams identified as 1st order on the 1:25000 topographic map in these landforms were little more than drainage depressions with no discernable channel or riparian
1 The Montreal Process is one of several groups of regional governments including Australia, United States, Canada and 9 other countries with temperate and boreal forests that have adopted criteria and indicators for sustainable forestry.

Shoalhaven Illawarra riparian cover mapping study
zone, and were often located in what would be considered prime agricultural land. Discussions with the SRCMA and the project team concluded that it would be difficult to convince landholders to manage such highly productive lands for riparian conservation, particularly where no discernable riparian land was evident (Mutendeudzi, 2006).
Step 2: Subset riparian areas and classify SPOT-5 images
The riparian areas, as defined from the rules above, were extracted from the SPOT-5 satellite images and classified in Erdas Imagine® using the unsupervised classification method. SPOT-5 images consist of four bands of multispectral data and one band of panchromatic (Table 3). The images used in this study were acquired in the summer of 2004 and autumn-early winter 2005 (Appendix 1). By incorporating data from ortho-rectified air-photography (acquired in the summer of 2001/2002) and vegetation data (Tindell et al. 2004), six final cover classes (Table 4) were recognised and analysed. The spectral signature of woody weeds was not sufficiently unique to be automatically classified from the SPOT-5 imagery. However, willows could be identified manually from the ortho-rectified air photography, at least in the drier western subcatchments. Unfortunately weed identification in the wetter coastal subcatchments could not be carried out with any degree of confidence. For this reason, the Weeds cover class statistics are not reported for the Coastal Zone and some Mid Zone subcatchments.
Table 2. Rules for the determination of buffer widths.
Landform Stream Order Buffer Width (m)
Lowland alluvial fills >=4 30 Lowland alluvial fills 2-3 10 Lowland alluvial fills 1 5 Rises in lowland alluvial hills >=4 30 Rises in lowland alluvial hills 2-3 10 Rises in lowland alluvial hills 1 5 Valley fill between upland hills >=4 30 Valley fill between upland hills 2-3 10 Valley fill between upland hills 1 5 Lower slopes (foothills) >=4 20 Lower slopes (foothills) 2-3 10 Lower slopes (foothills) 1 0 Mid slopes >=4 20 Mid slopes 2-3 10 Mid slopes 1 0 Ridgetops and upper slopes >=4 10 Ridgetops and upper slopes 2-3 5 Ridgetops and upper slopes 1 0
NSW Department of Water and Energy | Southern Rivers Catchment Management Authority | May 2008 page 10

Shoalhaven Illawarra riparian cover mapping study
Figure 3. Summary of riparian cover mapping procedure for the Shoalhaven-Illawarra area.
NSW Department of Water and Energy | Southern Rivers Catchment Management Authority | May 2008 page 11

Shoalhaven Illawarra riparian cover mapping study
Table 3. SPOT-5 spectral range and spatial resolution.
Band Spatial resolution Spectral range Panchromatic 2.5 m 0.48 - 0.71 µm B1 : green 10 m 0.50 - 0.59 µm B2 : red 10 m 0.61 - 0.68 µm B3 : near infrared 10 m 0.78 - 0.89 µm B4 : mid infrared 20 m 1.58 - 1.75 µm
Table 4. Final Cover Classes used for the Shoalhaven-Illawarra riparian cover mapping
Land Cover Class
Description Photo example
Woody Areas where native trees or shrubs dominate the land cover. Some small areas of evergreen exotics such as pines are included but deciduous woody exotic weeds are excluded. Photo: An example of a Woody area – Tea-tree shrubs at front on left and mixed Eucalyptus species in the background.
Non-woody Areas where the dominant land cover is, is a combination of, terrestrial or aquatic non-woody plants including grasses, forbs, aquatic and macrophytes such as rushes and sedges. Photo: Example of a Non-woody area – Poa spp. on river flats.
Water Areas where the surface cover is dominated by water (both shallow and deep). May also include bare wet mud. Photo: An example of the Water class – the pool together with the wet mud in the foreground form the Water class
Bare Areas devoid of vegetation cover. Examples of areas included in this class are roads (both dirt and sealed), sand bars, badly eroded areas, river crossings and rock out-crops.
Photo: An example of a Bare area - sandbar and eroded bank.
NSW Department of Water and Energy | Southern Rivers Catchment Management Authority | May 2008 page 12

Shoalhaven Illawarra riparian cover mapping study
NSW Department of Water and Energy | Southern Rivers Catchment Management Authority | May 2008 page 13
Land Cover Class
Description Photo example
Almost Bare Areas that are practically devoid of or with very minimal, vegetation cover. While these areas may overlap with the Bare land cover class, a separate class was considered useful because of their potential to more quickly recover or convert to the non-woody vegetation class with seasonal or moisture changes. These areas include heavily grazed, dry and/or ploughed paddocks. Photo: An example of an Almost Bare area – heavily grazed paddock adjacent to a stream.
Weeds (willows)
Areas where the predominant land cover consists of woody exotic vegetation. Willows (Salix spp.) form the primary weed that could be reliably identified from the imagery. Photo: An example of a stand of Weeds – willows in senescence (shedding leaves).
Step 3: Generate landscape metrics (patch analysis)
The Patch Analyst (GRID) program, a FRAGSTATS interface (McGarigal and Marks, 1995.), was used in ArcView® 3.3 to calculate riparian landscape metrics or measures that quantify the composition and spatial configuration of the riparian land cover.
Generally, data are grouped into ecologically functional or management based units before calculating the landscape metrics. Landscape metrics are then calculated for riparian zones/areas within the ecologically functional or management units and the results for the individual units are compared against one another. A logical grouping for this study would have been river reaches. However, owing to the incompleteness of the ecologically functional units data for the study area, landscape metrics were calculated for management units discussed and agreed to by the SRCMA as 500m area squares. Consequently the study area was subdivided into 500m grid square tiles and each grid tile was allocated a unique identifier before calculating landscape (patch) metrics for each tile. Figure 4 illustrates the relationships between riparian cover classes, riparian area and grid-tiles in a subcatchment.
In addition to the detailed analysis at the management unit level described above, the patch analysis was also undertaken on the riparian vegetation at the subcatchment level where the “landscape” was deemed to be the subcatchment boundaries. This analysis undertaken in the Fragstats 3.3 stand-alone computer program (McGarigal et al., 2002) provides more generalised landscape metrics useful for comparisons at a subcatchment level, and also has the advantage of assessing patches which may extend over the arbitrary boundaries of the 500m grid squares. The subcatchment analysis included some additional metrics which were considered useful at the subcatchment scale, but deemed inappropriate at the grid tile scale, due to the arbitrary boundaries of the grid potentially dividing or truncating individual patches that extend beyond the boundaries of the management tile.

Shoalhaven Illawarra riparian cover mapping study
Although the Patch Analyst program can calculate in excess of 40 landscape metrics with respect to such attributes as size, density, edge, shape, diversity, interspersion and core area, only those landscape metrics considered useful for this project were used.
Percent Landscape is a basic measure of landscape composition and quantifies the proportional abundance of each cover type in the landscape or riparian zone. Percent Landscape equals the percentage of the riparian area comprised of a particular cover type. It is a measure useful for describing the relative distribution of each of the cover types. A high percentage of the woody vegetation cover type is considered a positive trait, conversely, a high proportion of the bare cover type would be considered a negative trait.
Mean Patch Size equals the total area of all patches of the same land-cover type divided by the number of patches. Although data is available for each of the cover types identified (in the digital database), only data for the woody cover type is reported on in this text. A larger value for mean patch size indicates less fragmentation, and for the woody cover type, is considered a positive trait. Larger patch sizes can also be considered to be more resilient to the edge effects which may result from adjacent cleared areas.
Median Patch Size equals the value representing the midpoint of the range of patch sizes (ie. 50% of patches are larger and 50% are smaller). Median patch size is another measure of the average patch size within the landscape unit. Median patch size provides better indication of the range of values occurring in the landscape unit. A higher value indicates less fragmentation, more resilience to edge effects, and for the woody cover type, is considered a positive trait.
Largest Patch Index quantifies the percentage of total landscape area comprised by the largest patch in the landscape and as such it is a measure of dominance of the largest patch in the landscape. A higher value generally indicates less fragmentation, and for the woody cover type, is considered a positive trait. Mean Nearest Neighbour is a measure of isolation or inter-patch connectivity. Mean Nearest Neighbour is the average distance (in metres) between nearest neighbouring patches of the same land-cover type, based on patch edge-to-edge distance. A higher value indicates a larger distance between patches, and for the woody cover type is considered a negative trait.
Patch Density is a measure of spatial configuration or fragmentation of land cover patches. Patch Density expresses the number of patches of a particular land-cover type on a per hectare basis. This landscape metric facilitates comparison among landscapes of varying size. Patch density is a direct measure of fragmentation, a higher number of patches per hectare indicates smaller patch sizes, and for the woody vegetation type, is considered a negative trait. Patch density was calculated at the subcatchment level only.
Proximity Index is a dimensionless number which represents the degree of fragmentation within a certain search radius. For this study a search radius of 500m was used. A proximity index value of zero occurs if no patches of the same cover type occur within the radius. The value increases as more patches of the same cover type occur and those patches become closer and more contiguous. Higher values of proximity index for the woody cover can be considered a positive trait. Proximity index can be calculated at the subcatchment level only.
NSW Department of Water and Energy | Southern Rivers Catchment Management Authority | May 2008 page 14

Shoalhaven Illawarra riparian cover mapping study
Figure 4. Illustration of a grid tile, riparian area and classified patches.
almost barebarenon-woodywaterweedswoody
Landscape Cover Class
# Example of a patch
#Tile riparian area
#
7000 0 7000 14000 Meters
50 0 50 100 Meters
#
Reedy CreekSub-catchment
#
Zoom-in view of a single500 m square tileOverlay grid of
500 m tiles
Step 4: Standardise metrics and generate a riparian woody cover score
NSW Department of Water and Energy | Southern Rivers Catchment Management Authority | May 2008 page 15

Shoalhaven Illawarra riparian cover mapping study
Management grid-tile level
Three woody riparian cover class landscape metrics were considered suitable for generating an aggregate woody cover score for within subcatchment comparisons at the grid-tile management scale. These were mean patch size, largest patch index and percent landscape. Each of the three selected metrics was standardised or rescaled so its values ranged from 0 (minimum) to 1 (maximum) to facilitate direct comparisons between subcatchments.
An aggregate Woody Riparian Cover Score was calculated for each grid tile by summing the three standardised woody cover class metrics on a one-to-one basis, i.e. not preferential weighting was applied to any metric.
To enable comparisons between subcatchments, simple statistical measures of the aggregate Woody Riparian Cover Score for each of the 21 subcatchments of the study area were calculated. The subcatchment means and medians were calculated by considering all grid-tiles contained within a subcatchment boundary together. Further, given the climatic gradient and different land use patterns between coastal and in-land subcatchments, the 21 subcatchments were grouped into three geographical zones (Figure 1) roughly reflecting these trends to allow fairer subcatchment comparisons.
Subcatchment level
In addition to the above, it is also possible to calculate an additional aggregate riparian cover score based upon the patch metrics calculated using the subcatchment boundary as the landscape unit (as opposed to the grid-tile).
As mentioned in the Step 3, the use of the subcatchment boundary as the landscape unit allows the calculation of additional metrics such as patch density, and mean nearest neighbour, both of which were not considered useful at the grid tile management level due to the arbitrary nature of the grid-tile boundaries. A Subcatchment Riparian Woody Cover Score was therefore calculated using the mean patch size, largest patch index and percent landscape metrics (as used at the grid-tile level), with the addition of patch density and mean nearest neighbour.
The individual values of each metric for each subcatchment were standardised in a similar manner to that described above giving values between 0 and 1. In the case of mean nearest neighbour, where a small value is considered advantageous, the standardised value was subtracted from 1, ensuring that the highest values for each metric represented the most desirable condition. The final score is reported as a value between 0 and 100.
NSW Department of Water and Energy | Southern Rivers Catchment Management Authority | May 2008 page 16

Shoalhaven Illawarra riparian cover mapping study
4 Results The riparian zone was classified into six main cover classes (or five where weeds species could not be identified). The overall area of each cover class in each subcatchment is presented in Table 5, and the associated subcatchment rankings are shown in Table 6. Of the most interest are the cover classes of woody, bare, almost bare and for those subcatchments where delineation was possible, weeds. Areas classified as water have been omitted from these general results as this class tends to mask the importance of other classes in those subcatchments which contain large water bodies.
Comprehensive and detailed subcatchment results are presented in the individual report cards located at the end of this report. Subcatchment ranks based on the subcatchment’s mean Total Woody Riparian Cover Score are also presented for both within zone and within study area comparisons.
4.1 LAND COVER
4.1.1 Woody vegetation cover The woody cover type represents the vegetation that is considered most able to provide the beneficial ecological and geomorphological services that were discussed previously in Chapter 1. In terms of actual area, the mid zone subcatchments, with their large areas of reserved vegetation, have the highest proportion of woody vegetation cover within their riparian zones ranging from Mongarlowe with 70%, up to the Lower Shoalhaven, with over 97% of the riparian zone with woody vegetation cover (Figure 5). The mid zone subcatchments rank highly in the comparisons against other subcatchments with four of the five most highly ranked subcatchments being located in the mid zone. Western subcatchments generally rank within the middle of the range with a range of only 37 to 58% woody coverage. Sub catchments within the Coastal zone are quite varied, with several high ranking subcatchments such as Jervis Bay and Murramarang (having woody cover above 80%), amongst some of the most poorly ranked urban subcatchments such as Gerringong and Wollongong with 22 and 34% woody cover, respectively (Table 6).
4.1.2 Bare and almost-bare cover Of potential interest to land managers are the cover classes of Bare and Almost Bare. Bare areas are those which have no vegetation cover and may include areas such as sand bars, badly eroded areas, and also roads (Table 4). Almost-Bare areas are practically devoid of vegetation but are considered to have the potential to quickly recover or convert to a non-woody vegetated state with suitable management intervention or seasonal moisture changes.
Generally the combined coverage of bare and almost bare cover classes is less than 9% of the riparian areas in non-urban subcatchments. Reedy Creek has the largest area of these cover type with 9% of the riparian lands, followed by the other western subcatchments which are most 5-6%. As expected, given the high coverage of Woody vegetation, those subcatchments in mid zone have minimal riparian lands in the bare or almost bare state. Urban subcatchments such as Wollongong and Gerringong have relatively high coverage of bare type covers with 13% and 8%, respectively, most likely due to the high density of roads and other paved areas.
NSW Department of Water and Energy | Southern Rivers Catchment Management Authority | May 2008 page 17

Shoalhaven Illawarra riparian cover mapping study
Table 5. Riparian cover class area for all subcatchments and cover types Woody Non-Woody Almost Bare Bare Weeds
Area (ha) %
Area (ha) %
Area (ha) %
Area (ha) %
Area (ha) %
Western Zone Upper Shoalhaven 1442 58.5 970 39.4 24 1.0 17 0.7 9 0.4 Mid Shoalhaven 2072 37.9 3000 54.9 106 1.9 141 2.6 149 2.7 Reedy Creek 517 36.9 692 49.4 65 4.6 52 3.7 74 5.2 Boro Creek 368 37.6 543 55.5 25 2.5 28 2.8 16 1.6 Nerrimunga 971 44.1 1113 50.5 51 2.3 57 2.6 14 0.6 Bungonia 602 45.4 632 47.6 59 4.4 17 1.3 16 1.2 Mid Zone Mongarlowe 1400 70.5 558 28.1 4 0.2 15 0.8 8 0.4 Shoalhaven Gorge 3121 80.1 554 14.2 22 0.6 196 5.0 2 0.1 Corang River 1810 82.7 364 16.6 3 0.1 11 0.5 1 0.0 Lower Shoalhaven 3402 97.6 60 1.7 2 0.0 24 0.7 Not Mapped Lower Kangaroo 1638 87.2 219 11.7 6 0.3 16 0.9 Not Mapped Kangaroo River 906 79.2 233 20.4 3 0.2 2 0.2 Not Mapped Coastal Zone Murramarang 418 80.1 94 18.0 2 0.3 8 1.6 Not Mapped Milton 1211 77.2 343 21.9 4 0.3 10 0.6 Not Mapped Jervis Bay 2057 85.1 302 12.5 33 1.4 26 1.1 Not Mapped Shoalhaven Estuary 941 57.5 607 37.2 40 2.5 46 2.8 Not Mapped Broughton Creek 369 40.3 535 58.4 9 1.0 3 0.3 Not Mapped Gerringong 71 22.6 219 69.9 5 1.5 19 5.9 Not Mapped Minnamurra 241 41.7 325 56.2 1 0.2 11 1.9 Not Mapped Macquarie Rivulet 250 51.4 227 46.7 0 0.1 9 1.9 Not Mapped Wollongong 381 34.4 579 52.4 3 0.3 143 12.9 Not Mapped
Table 6. Comparisons of subcatchment cover classes across overall study area and within
each geographic zone. Catchments ranked from 1 through 21, best to worst. Woody Non-Woody Almost Bare Bare Weeds
Study Area Rank
WithinZone Rank
Study Area Rank
WithinZone Rank
Study Area Rank
WithinZone Rank
Study Area Rank
WithinZone Rank
Study Area Rank
WithinZone Rank
Western Zone Upper Shoalhaven 10 1 11 6 13 1 6 1 3 1 Mid Shoalhaven 17 4 5 2 16 2 15 4 8 5 Reedy Creek 19 6 8 4 21 6 18 6 9 6 Boro Creek 18 5 4 1 19 4 16 5 7 4 Nerrimunga 14 3 7 3 17 3 14 3 5 2 Bungonia 13 2 9 5 20 5 10 2 6 3 Mid Zone Mongarlowe 9 6 13 1 5 3 7 4 4 3 Shoalhaven Gorge 5 4 18 4 11 6 19 6 2 2 Corang River 4 3 17 3 3 2 3 2 1 1 Lower Shoalhaven 1 1 21 6 1 1 5 3 Not Mapped Lower Kangaroo 2 2 20 5 9 5 8 5 Not Mapped Kangaroo River 7 5 15 2 6 4 1 1 Not Mapped Coastal Zone Murramarang 6 2 16 8 8 4 11 4 Not Mapped Milton 8 3 14 7 7 3 4 2 Not Mapped Jervis Bay 3 1 19 9 14 7 9 3 Not Mapped Shoalhaven Estuary 11 4 12 6 18 9 17 7 Not Mapped Broughton Creek 16 7 2 2 12 6 2 1 Not Mapped Gerringong 21 9 1 1 15 8 20 8 Not Mapped Minnamurra 15 6 3 3 4 2 13 6 Not Mapped Macquarie Rivulet 12 5 10 5 2 1 12 5 Not Mapped Wollongong 20 8 6 4 10 5 21 9 Not Mapped
NSW Department of Water and Energy | Southern Rivers Catchment Management Authority | May 2008 page 18

Shoalhaven Illawarra riparian cover mapping study
Figure 5. Percentage cover of Woody (left) and Bare/Almost Bare (right) within riparian lands of the Shoalhaven-Illawarra area. Note: % values exclude areas classified as water.
5%
1%
6%
2%
2%
1%
1%
5%
5%
1%
9% 1%
0%
5%
6%
1%
2%2%
13%
2%
8%
13%
% Cover of Riparian landsBare or Almost Bare
Excellent
Good
Fair
Poor
Very Poor0 10 205 Km
¹
38%
98%
80%
84%
59%
87%
83%
44%
58%
71%
37%77%
79%
45%
38%
51%
34%
40%
80%
42%
23%
34%
% Cover of Riparian landsWoody vegetation
Excellent
Good
Fair
Poor
Very Poor
4.1.3 Weed cover
Identification of weeds from the SPOT-5 imagery proved difficult in this study due to the lack of distinguishable spectral signature for weeds such as willows, broome, blackberry and privet. Some effort was made to develop methods to identify willow species (Mutendeudzi, 2005) which was successful in the western and some mid-zone catchments but could not be applied to the coastal zone areas due to the willows becoming indistinguishable from other native coastal species. For this reason, results can only be provided for 9 of the 21 subcatchments within the study area.
Reedy Creek subcatchment was the most infested catchment with 5.2% of riparian lands being covered by willows (Table 5 & subcatchment report cards). This result was almost twice that of the next catchment, that being Mid-Shoalhaven with 2.7%. Boro Creek and Bungonia Creek have a moderate level of willow cover with 1.6% and 1.2%, respectively. Other catchments where willows could be identified had relatively little cover ranging from 0.6% for Nerrimunga down to no appreciable willow cover in Corang River subcatchment.
4.1.4 Riparian cover class landuse associations
The distribution of cover types across landuse classes is shown in Table 7. The woody cover type occurs mostly on land classified as having conservation type landuses. The greatest proportion of woody vegetation is located within national parks (34%), followed by private conservation (26%). Woody cover riparian areas on grazing lands accounts for only 14% of the total woody areas.
NSW Department of Water and Energy | Southern Rivers Catchment Management Authority | May 2008 page 19

Shoalhaven Illawarra riparian cover mapping study
Non-woody riparian vegetation mostly occurs on grazing land (72%) and other public lands (11%), as does vegetation mapped as weeds (62% and 28%, respectively). Bare and almost bare areas also largely occur in the grazing and other public lands classes. 50% of almost-bare areas occur in grazing areas which may a reflection of the drought conditions prevalent at the time the imagery was captured. 48% of the bare areas occur in the other public lands category which might be related to road reserves.
Table 7. Distribution of cover class areas across landuse types. Conservation Other Conservation Agriculture Other
National
Parks State
Forests Private
Conservation
Other Public Lands
Grazing Cropping Forestry / Plantations Urban Rural
Residential Industry / Intensive Agriculture
Woody Area (ha) 8116 1690 6213 2861 3235 9 786 183 554 25 % of Cover Class 34.3 7.1 26.2 12.1 13.7 0.0 3.3 0.8 2.3 0.1
Non-Woody Area (ha) 205 27 655 1241 8278 36 222 294 452 68 % of Cover Class 1.8 0.2 5.7 10.8 72.1 0.3 1.9 2.6 3.9 0.6
Water Area (ha) 132 1 146 4072 120 0 12 41 7 15 % of Cover Class 2.9 0.0 3.2 89.6 2.6 0.0 0.3 0.9 0.1 0.3
Almost Bare Area (ha) 9 1 33 121 204 2 5 4 16 6 % of Cover Class 2.2 0.1 8.3 30.0 50.8 0.6 1.3 1.1 4.0 1.6
Bare Area (ha) 25 1 85 381 136 0 11 80 20 59 % of Cover Class 3.1 0.2 10.6 47.8 17.1 0.1 1.3 10.0 2.5 7.4
Weeds Area (ha) 0.2 0.0 8.8 60.5 134.0 0.6 2.9 4.3 4.9 0.1 % of Cover Class 0.1 0.0 4.0 28.0 62.0 0.3 1.3 2.0 2.3 0.0
4.2 WOODY COVER PATCH STATISTICS In the course of this study, it was deemed by the study steering group that in lieu of any pre-European (or natural) riparian vegetation data, the woody vegetation class would be considered the target vegetation cover type or that considered to be most ideal. For this reason, only detailed patch statistics for the woody cover class are reported in this section. Further patch statistics for other cover classes at a subcatchment level are provided in the report card section.
It should be noted that all patch indices should be considered in parallel to provide a full indicator of catchment cover condition. To facilitate this, a combined riparian cover score based upon standardised patch indices are provided in Section 4.3.
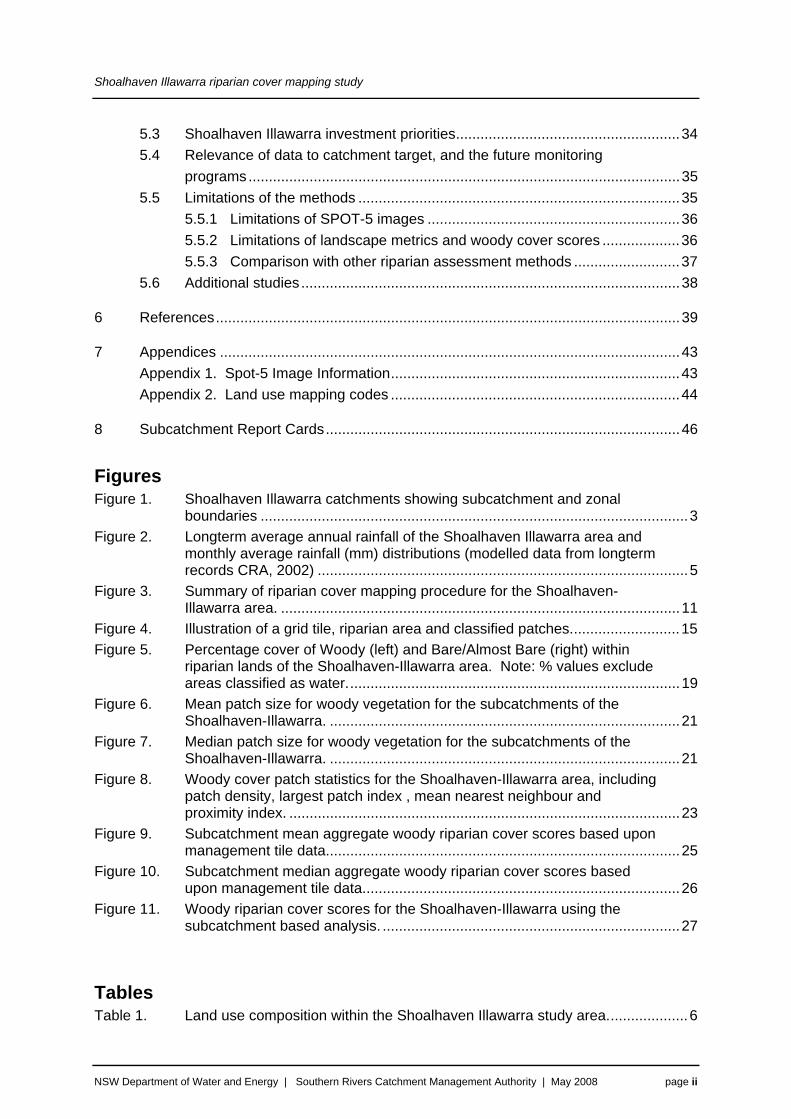
4.2.1 Average patch size The average patch size for woody vegetation in each subcatchment is shown below in terms of both the mean and the median (Figure 6 and Figure 7, respectively). A larger average patch size across the landscape infers less fragmentation and more sustainable patches in terms of resilience to edge effects, both considered to be positive traits.
The mid-zone subcatchments generally have the largest patch sizes, followed by the southern coastal subcatchments. The urban areas of the Illawarra have only small patches of vegetation, so too the agricultural areas of Reedy and Boro subcatchments.
In terms of the mean patch size, the Lower Shoalhaven subcatchment has significantly larger patches as compared to the remainder of the study area. However the median patch size for this catchment shows that it is also the most variable in term of patch size.
NSW Department of Water and Energy | Southern Rivers Catchment Management Authority | May 2008 page 20
Shoalhaven Illawarra riparian cover mapping study
Figure 6. Mean patch size for woody vegetation for the subcatchments of the Shoalhaven-Illawarra.
Mean Patch Size (ha)1.0 - 4.30.7 - 0.90.4 - 0.60.30.1 - 0.2
Upr
Sho
alha
ven
Mid
Sho
alha
ven
Ree
dy
Bor
o
Ner
rimun
ga
Bun
goni
a
Mon
garlo
we
Sho
alha
ven
Gor
ge
Cor
ang
Lwr S
hoal
have
n
Lwr K
anga
roo
Kan
garo
o
Mur
ram
aran
g
Milt
on
Jerv
is
Sho
alha
ven
Est
Bro
ught
on C
k
Ger
ringo
ng
Min
nam
urra
Mac
quar
ie R
vt
Wol
long
ong
0
1
2
3
4
5
6
7
8
Area
(hec
tare
s)
Mean Mean ± 0.95 Conf. Interval
Figure 7. Median patch size for woody vegetation for the subcatchments of the Shoalhaven-Illawarra.
Median Patch Size (ha)0.026 - 0.0330.021 - 0.0250.016 - 0.0200.0045 - 0.0150.0044
Upr
Sho
alha
ven
Mid
Sho
alha
ven
Ree
dy
Bor
o
Ner
rimun
ga
Bun
goni
a
Mon
garlo
we
Sho
alha
ven
Gor
ge
Cor
ang
Lwr S
hoal
have
n
Lwr K
anga
roo
Kan
garo
o
Mur
ram
aran
g
Milt
on
Jerv
is
Sho
alha
ven
Est
Bro
ught
on C
k
Ger
ringo
ng
Min
nam
urra
Mac
quar
ie R
vt
Wol
long
ong
0.0
0.5
1.0
1.5
2.0
2.5
3.0
3.5
4.0
4.5
Area
(hec
tare
s)
Median 25%-75% 5%-95%
NSW Department of Water and Energy | Southern Rivers Catchment Management Authority | May 2008 page 21

Shoalhaven Illawarra riparian cover mapping study
4.2.2 Patch density
Patch density is one of several of the measures describing the degree of fragmentation of the woody cover vegetation and reports the mean number of patches of woody vegetation within a hectare. A subcatchment with a low patch density could be considered to be in better condition that one that has a higher density.
Subcatchments with lower patch densities are generally located in the mid and southern parts of the coastal zone (Figure 8). The Lower Shoalhaven has the lowest patch density with 22 patches/ha with most other adjacent subcatchments within the range of 90-130 patches/ha. The most fragmented subcatchments are those in the west of the study area from Reedy Creek north to Bungonia, with densities of 230-480 patches/ha.
4.2.3 Largest patch index
Largest Patch Index (LPI) quantifies the percentage of total landscape area comprised by the largest patch in the landscape and as such, it is a measure of dominance of the largest patch in the landscape. A large value can generally be considered a positive trait. The index refers only to the largest single patch within the subcatchment and thus must be considered along with other patch statistics to obtain a full understanding of the vegetation distribution.
The Lower Kangaroo subcatchment has the highest LPI within the study area with a value of 32% (Figure 8), followed by the Lower Shoalhaven (20%), Mongarlowe (18%) and Milton (16%). Subcatchments with low LPI values (<3%) are generally located in either urban subcatchments, or the agricultural areas in the west of the study area.
4.2.4 Mean nearest neighbour
Mean nearest neighbour is the average distance (in metres) between nearest neighbouring patches of the same land-cover type and is a measure of isolation or connectivity. A smaller value is considered a positive trait, however the value must be considered in conjunction with other indices such as mean patch size, as the mean nearest neighbour calculations do not take into account the size of nearby patches.
Figure 8 shows that the subcatchment with the smallest average distance between patches in Reedy Creek with a mean of 15 metres. The next best subcatchments are those of the mid-zone and non-urban coastal catchments with values of 21-30m.
4.3 WOODY RIPARIAN COVER SCORE
4.3.1 Riparian woody cover score
Subcatchment summaries for the mean and median of the Woody Riparian Cover Score based upon an analysis on each management grid square are presented in the graphs below. These graphs facilitate the ranking and general comparison of the subcatchments using a combination of statistics suitable at the management unit level (mean patch size, largest patch index and percent landscape.)
NSW Department of Water and Energy | Southern Rivers Catchment Management Authority | May 2008 page 22

Shoalhaven Illawarra riparian cover mapping study
Figure 8. Woody cover patch statistics for the Shoalhaven-Illawarra area, including patch density, largest patch index , mean nearest neighbour and proximity index.
62
440
30079
66
6700
150
600
630
30
1600
150310
280
16
9.3
25
26
44
210
13
0 10 205 Km
¹39
21
28
28
39
29
31
38
28
33
15 30
32
33
34
36
39
33
4438
52
2
4
7
6
3
2013
3
2
32
1
141
18
2
16
10
4
2
5
3
22
170
110
110
77
96
94
130
230
150
480100
150
240
310
250
190
190
190
110
210
Proximity Index(dimensionless)
6700
1600
440 - 630
150 - 310
9.3 - 79
Mean nearestneighbour (metres)
15 - 21
28 - 30
31 - 36
38 - 44
52
Patch density(patches/ha)
22
23 - 130
140 - 210
220 - 310
320 - 480
Largest patchindex (%)
32
16 - 20
10 - 14
4 - 7
1 - 3
NSW Department of Water and Energy | Southern Rivers Catchment Management Authority | May 2008 page 23

Shoalhaven Illawarra riparian cover mapping study
In Figure 9 the mean aggregate woody cover scores for all management tiles in each individual subcatchment is compared. In general terms, the Mid zone subcatchments have highest mean aggregate woody riparian cover scores compared to the Coastal and Western zone subcatchments. Also, within the Mid zone subcatchments, the Lower Shoalhaven subcatchment has the highest mean woody riparian cover score which appears quite distinct from the other subcatchments within the Mid zone. The mean aggregate woody cover scores of the remaining subcatchments in the Mid zone appear to be grouped together. The Mongarlowe subcatchment has the lowest mean aggregate woody riparian cover score in the Mid zone.
Within the Coastal Zone the mean aggregate woody riparian cover scores are widely distributed and appear to form at least four distinct clusters, including two clusters of one subcatchment each. Murramarang, Milton-Ulladulla and Jervis subcatchments form one group and have the highest mean aggregate woody riparian covers scores in the Coastal zone. Shoalhaven Estuary, Broughton Creek, Minnamurra and Macquarie Rivulet subcatchments appear as a cluster. Wollongong and Gerringong appear as separate clusters with the latter having the lowest mean aggregate woody riparian cover score.
Within the Western zone, the Upper Shoalhaven subcatchment has a distinctly high mean riparian woody cover score. Boro, Nerrimunga and Bungonia appear to form a cluster but their mean riparian woody cover scores are well below that of the Upper Shoalhaven subcatchment. Mid Shoalhaven and Reedy Creek appear as separate clusters with the latter having the lowest mean riparian woody cover score.
The median aggregate woody riparian cover scores are compared in Figure 10. A similar pattern to the one described above for the mean aggregate woody riparian cover scores is exhibited. The Mid zone subcatchments generally have the highest median aggregate woody riparian cover scores than the Coastal and Western zones subcatchments. The Upper Shoalhaven in the Western zone again has an exceptionally high median aggregate woody riparian cover score. Figure 10 also shows that in general terms, the Coastal and Western zones subcatchments exhibit larger variations in aggregate woody riparian cover scores between grid tiles as indicated by the 25%-75% percentiles.
4.3.2 Subcatchment based riparian woody cover score
The riparian woody cover scores calculated at the subcatchment level are shown in Figure 11. As would be expected the results show similar trends to those summaries of management tile scores. The subcatchments that are shown to be in good condition are those in the mid-zone, with the Lower Shoalhaven subcatchment rating the best. The less vegetated subcatchments of the western agricultural areas and the eastern urban areas have medium to poor scores whilst the small coastal subcatchment of Gerringong rates very poor in most of the patch indices and has the worst aggregate cover score. The Upper Shoalhaven subcatchment is perhaps the only subcatchment where the results based upon the subcatchment as a whole do differ significantly from those based upon the management tile analysis. In the management tile analysis the subcatchment rates very highly in both the median and mean scores (Figure 9 and Figure 10) however it is shown to have a high degree of variability between each of its management tiles. The catchment generally has tiles that either rate very poorly or very well with respect to the patch indices. However, when the analysis of patches over the whole subcatchment is undertaken and the extra indices of patch density and mean nearest neighbour are included, the rating of the catchment decreases substantially, sitting roughly in the middle of the range across the study area.
NSW Department of Water and Energy | Southern Rivers Catchment Management Authority | May 2008 page 24

Shoalhaven Illawarra riparian cover mapping study
Figure 9. Subcatchment mean aggregate woody riparian cover scores based upon management tile data.
Mean Mean±0.95 CI
Upr
Sho
alha
ven
Mid
Sho
alha
ven
Ree
dy
Bor
o
Ner
rimun
ga
Bun
goni
a
Mon
garlo
we
Sho
alha
ven
Gor
ge
Cor
ang
Lwr
Sho
alha
ven
Lwr
Kan
garo
o
Kan
garo
o
Mur
ram
aran
g
Milt
on
Jerv
is
Sho
alha
ven
Est
Bro
ught
on C
k
Ger
ringo
ng
Min
nam
urra
Mac
quar
ie R
vt
Wol
long
ong
0.1
0.2
0.3
0.4
0.5
0.6
0.7
0.8
0.9
1.0
1.1
1.2
Tota
l Cov
er C
ondi
tion
Sco
re(R
ange
0-3
)
Western Mid Coastal
NSW Department of Water and Energy | Southern Rivers Catchment Management Authority | May 2008 page 25

Shoalhaven Illawarra riparian cover mapping study
Figure 10. Subcatchment median aggregate woody riparian cover scores based upon management tile data.
Median 25%-75% 5%-95%
Upr
Sho
alha
ven
Mid
Sho
alha
ven
Ree
dy
Bor
o
Ner
rimun
ga
Bun
goni
a
Mon
garlo
we
Sho
alha
ven
Gor
ge
Cor
ang
Lwr
Sho
alha
ven
Lwr
Kan
garo
o
Kan
garo
o
Mur
ram
aran
g
Milt
on
Jerv
is
Sho
alha
ven
Est
Bro
ught
on C
k
Ger
ringo
ng
Min
nam
urra
Mac
quar
ie R
vt
Wol
long
ong
0.0
0.2
0.4
0.6
0.8
1.0
1.2
1.4
1.6
1.8
2.0
2.2
Tota
l Cov
er C
ondi
tion
Sco
re(R
ange
0-3
)
Western Mid Coastal
NSW Department of Water and Energy | Southern Rivers Catchment Management Authority | May 2008 page 26

Shoalhaven Illawarra riparian cover mapping study
Figure 11. Woody riparian cover scores for the Shoalhaven-Illawarra using the subcatchment based analysis.
26
89
48
55
38
66
57
29
33
51
26 54
50
28
21
35
25
43
2432
13
21
0 10 205 Kilometres
Riparian Woody Cover ScoreExcellent (67 - 89)
Good (44 - 66)
Fair (30 - 43)
Poor (14 - 29)
Very poor (13-0)
¹
Coastal zone
Mid zone
Western zone
NSW Department of Water and Energy | Southern Rivers Catchment Management Authority | May 2008 page 27

Shoalhaven Illawarra riparian cover mapping study
4.4 SUMMARY OF RESULTS FOR ALL SUBCATCHMENTS
The individual report cards, provided at the back of this report, contain detailed results for all subcatchments, primarily based upon the analysis of each management tile within each subcatchment. The report cards also present general subcatchment statistics, information on climate and landuse, and management tile statistics for the woody, weeds (if available), bare and almost bare cover classes. The primary intended use of the report cards is to enable the comparison of reaches (or management tiles) within the subcatchment boundary. A detailed analysis of the results within each report card will not be undertaken in this section, however to assist in the discussion of potential rehabilitation priorities a summary of results for all subcatchments is provided below in Table 8.
Table 8. Summary of results for the Woody cover class for all subcatchments in order of descending riparian cover score (ie best through to degraded).
Catchment Zone Over-
all Rank
Rank within zone
Riparian Cover Score
% Cover
Number of Patches
Median Patch Size
(ha)
Mean Patch Size
(ha)
Patch Density
(patches/ha)
Mean Nearest
Neighbour (m)
Proximity Index
(no units)
Largest patch Index (%)
Lower Shoalhaven mid 1 1 89 93 785 0.028 4.334 22 21 6723 20
Lower Kangaroo mid 2 2 66 66 1886 0.018 0.869 77 29 1581 32
Corang mid 3 3 57 82 2118 0.033 0.855 96 31 601 14
Jervis Bay coastal 4 1 55 76 3073 0.018 0.682 111 28 300 13
Milton coastal 5 2 54 68 1777 0.015 0.682 100 30 313 16
Mongarlowe River mid 6 4 51 69 3131 0.023 0.447 155 33 630 18
Kangaroo River mid 7 5 50 79 1675 0.025 0.541 146 32 282 10
Shoalhaven Gorge mid 8 6 48 71 4898 0.023 0.637 112 28 440 4
Murramarang coastal 9 3 43 63 760 0.015 0.551 114 33 214 4
Upper Shoalhaven western 10 1 38 58 3188 0.018 0.452 127 39 148 7
Boro western 11 2 35 37 2447 0.020 0.150 249 36 16 1
Shoalhaven Estuary coastal 12 4 33 24 3696 0.013 0.255 94 28 66 3
Macquarie Rivulet coastal 13 5 32 51 922 0.020 0.272 188 38 44 5
Nerrimunga Creek western 14 3 29 44 5066 0.020 0.192 229 38 79 6
Bungonia western 15 4 28 45 3246 0.018 0.186 244 33 30 2
Mid Shoalhaven western 16 5 26 37 9775 0.015 0.212 174 39 62 2
Reedy Creek western 17 6 26 37 6760 0.005 0.077 481 15 152 3
Broughton Ck coastal 18 6 25 38 1898 0.018 0.195 193 39 25 2
Minnamurra coastal 19 7 24 41 1102 0.020 0.219 187 44 26 2
Wollongong coastal 20 8 21 33 3539 0.018 0.108 306 34 9 1
Gerringong coastal 21 9 13 21 720 0.015 0.099 213 52 13 3
NSW Department of Water and Energy | Southern Rivers Catchment Management Authority | May 2008 page 28

Shoalhaven Illawarra riparian cover mapping study
5 Discussion
5.1 APPLICATION TO INVESTMENT STRATEGIES
One of the primary uses of the data produced by this project is to assist in the formulation of investment strategies. In order to do this, a set of guiding principles are required for that investment. Those guiding principles for investment need to take account of ecological restoration and rehabilitation principles, as well as other factors. The following section outlines some of the rehabilitation principles from the literature.
5.1.1 General rehabilitation principles
The general principle often used in ecological restoration and rehabilitation is to protect first and restore second. It is generally agreed that the highest priority for management and rehabilitation should be placed upon protection of high-value, least-disturbed riverine and floodplain assets (Rutherfurd et al. 2000, Koehn et al. 2001; Cottingham et al. 2005). It is especially important to protect those areas or river reaches in good condition, that are representative (rivers which are representative of the classes of rivers that were present at the time of European settlement), demonstrate diverse, unique or highly-valued ecological communities and ecological productivity or provide habitat for colonising organisms that may disperse to newly rehabilitated or available areas (Rutherfurd et al. 2000; Cottingham et al. 2005, NRE., 2002).
The United States Environment Protection Authority (2007) provides the following guiding principles for the restoration of aquatic resources:
• Preserve and protect aquatic resources
• Restore ecological integrity
• Restore natural structure
• Restore natural function
• Work within the watershed/landscape context
• Understand the potential of the watershed
• Address ongoing causes of degradation
• Develop clear, achievable and measurable goals
• Focus on feasibility
• Use reference sites
• Anticipate future changes
• Involve a multi-disciplinary team
• Design for self-sustainability
• Use passive restoration, when appropriate
• Restore native species, avoid non-native species
• Use natural fixes and bioengineering
• Monitor and adapt where changes are necessary
NSW Department of Water and Energy | Southern Rivers Catchment Management Authority | May 2008 page 29

Shoalhaven Illawarra riparian cover mapping study
Rehabilitation should aim to increase the resilience of river ecosystems to natural (and further human-induced) disturbances so that ecosystems become self-sustaining and capable of responding to large-scale processes such as climate change and the condition of catchments (Cottingham et al. 2005; Palmer et al. 2005; Clarke et al. 2003). This principle is particularly relevant to riparian vegetation. If rehabilitation of riparian vegetation patch densities and sizes were a focus, then increasing the size of remanent riparian vegetation patches would have an increased probability of resilience from outside factors. This could be achieved by rehabilitating the smaller patches of degraded areas that may be found between larger patches of riparian vegetation.
Davies et al. (2004) suggest more detailed rehabilitation principles based upon their primary goal of managing high instream temperatures. Their suggested priorities are to: restore lower order streams before higher order streams; restore streams with woody vegetation before lower density or degraded vegetation; restore streams on north-west aspects before south-east aspects; and to restore reaches where soil properties are most favourable for successful vegetation establishment.
Conversely, there is some thinking amongst some practitioners that rehabilitation efforts should be directed towards those areas with greatest degradation. The rationale being that a greater impact upon the health of a river system can be achieved by vegetating or rehabilitating areas that potentially contribute large loads of sediment (and thus nutrients) into a river system.
Other practitioners take a more pragmatic view in that investment in rehabilitation should be directed towards those landholders that are willing to participate. The rationale being that these landholders will usually have an ideological commitment to the rehabilitation of the riparian zone therefore any works are likely to be well maintained and thus more likely to be successful.
5.2 SHOALHAVEN ILLAWARRA RIPARIAN PROTECTION AND REHABILITATION PRIORITIES BASED ON THE WOODY COVER TYPE
The general principles that have been adopted for this project by the steering committee to guide priority setting are those which are generally used in ecological restoration. These being:
• Protect high value, least-disturbed riparian areas in the first instance; and
• Direct rehabilitation or restoration efforts to those areas of good cover before degraded areas.
Priorities and rankings have been based upon the woody cover type only. The woody riparian cover score has been formulated to reflect the adopted rehabilitation principles. Those subcatchments with the highest score are those which meet the criteria for protection and rehabilitation priority based upon factors such as the total cover of woody vegetation and its spatial distribution within the riparian zone. Subcatchments with high percentage cover occurring in fewer patches with small distances between patches will have high scores and thus be of higher priority for protection and rehabilitation. The results and rankings provided in Figure 11 and Table 8 can therefore be considered the recommended priorities at a subcatchment level. Table 9 suggests priority actions for each subcatchment within the study area.
It should however be noted that this method does not identify areas that supported sparse woodlands or may have been naturally devoid of woody vegetation (for example, the Poa
NSW Department of Water and Energy | Southern Rivers Catchment Management Authority | May 2008 page 30
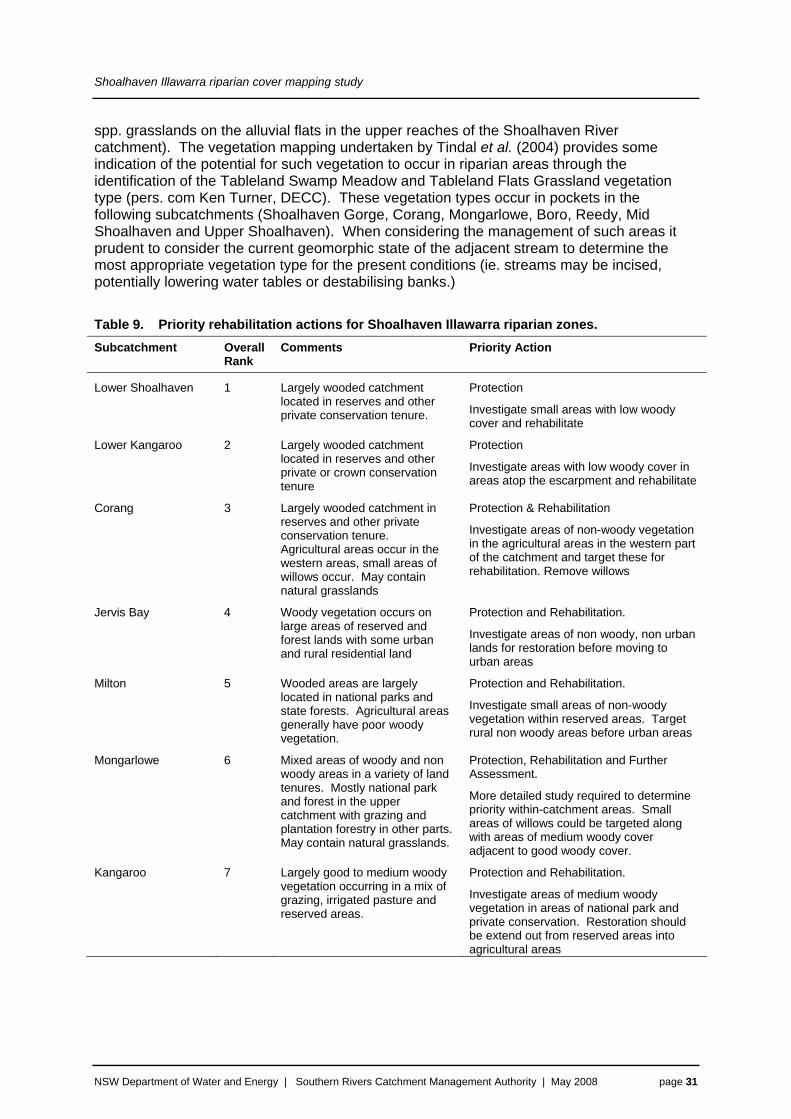
Shoalhaven Illawarra riparian cover mapping study
spp. grasslands on the alluvial flats in the upper reaches of the Shoalhaven River catchment). The vegetation mapping undertaken by Tindal et al. (2004) provides some indication of the potential for such vegetation to occur in riparian areas through the identification of the Tableland Swamp Meadow and Tableland Flats Grassland vegetation type (pers. com Ken Turner, DECC). These vegetation types occur in pockets in the following subcatchments (Shoalhaven Gorge, Corang, Mongarlowe, Boro, Reedy, Mid Shoalhaven and Upper Shoalhaven). When considering the management of such areas it prudent to consider the current geomorphic state of the adjacent stream to determine the most appropriate vegetation type for the present conditions (ie. streams may be incised, potentially lowering water tables or destabilising banks.)
Table 9. Priority rehabilitation actions for Shoalhaven Illawarra riparian zones. Subcatchment Overall
Rank Comments Priority Action
Lower Shoalhaven 1 Largely wooded catchment located in reserves and other private conservation tenure.
Protection
Investigate small areas with low woody cover and rehabilitate
Lower Kangaroo 2 Largely wooded catchment located in reserves and other private or crown conservation tenure
Protection
Investigate areas with low woody cover in areas atop the escarpment and rehabilitate
Corang 3 Largely wooded catchment in reserves and other private conservation tenure. Agricultural areas occur in the western areas, small areas of willows occur. May contain natural grasslands
Protection & Rehabilitation
Investigate areas of non-woody vegetation in the agricultural areas in the western part of the catchment and target these for rehabilitation. Remove willows
Jervis Bay 4 Woody vegetation occurs on large areas of reserved and forest lands with some urban and rural residential land
Protection and Rehabilitation.
Investigate areas of non woody, non urban lands for restoration before moving to urban areas
Milton 5 Wooded areas are largely located in national parks and state forests. Agricultural areas generally have poor woody vegetation.
Protection and Rehabilitation.
Investigate small areas of non-woody vegetation within reserved areas. Target rural non woody areas before urban areas
Mongarlowe 6 Mixed areas of woody and non woody areas in a variety of land tenures. Mostly national park and forest in the upper catchment with grazing and plantation forestry in other parts. May contain natural grasslands.
Protection, Rehabilitation and Further Assessment.
More detailed study required to determine priority within-catchment areas. Small areas of willows could be targeted along with areas of medium woody cover adjacent to good woody cover.
Kangaroo 7 Largely good to medium woody vegetation occurring in a mix of grazing, irrigated pasture and reserved areas.
Protection and Rehabilitation.
Investigate areas of medium woody vegetation in areas of national park and private conservation. Restoration should be extend out from reserved areas into agricultural areas
NSW Department of Water and Energy | Southern Rivers Catchment Management Authority | May 2008 page 31

Shoalhaven Illawarra riparian cover mapping study
NSW Department of Water and Energy | Southern Rivers Catchment Management Authority | May 2008 page 32
Subcatchment Overall Rank
Comments Priority Action
Shoalhaven Gorge 8 Consists mostly of national park and private conservation areas with medium to good woody cover. Some rural residential and grazing occurs in the north west and south west areas with generally poor riparian vegetation cover. May contain natural grasslands in upper section.
Protection and Rehabilitation.
Areas of medium woody vegetation cover in areas of private and public conservation need further investigation. This may be an artefact of the classification process in water storage areas. Small area of willows could be targeted. Areas of good woody cover should be protected before targeting restoration of degraded areas in grazing and rural residential areas
Murramarang 9 Largely consists of good to medium woody vegetation occurring on national park, forest and private conservation areas. Poor vegetation occurs in urban villages and adjacent to coastal lakes and lagoons
Protection and Rehabilitation.
Areas of medium to poor vegetation in mid to upper catchment locations should be investigated and targeted for rehabilitation. Further investigation should also occur to determine the causes of poor vegetation near coastal lagoons as these classifications may be influenced by adjacent water bodies
Upper Shoalhaven 10 National park and state forest reserves are located on the upper slopes of this catchment with good woody vegetation. Foothills and valley floor is agricultural land with generally poor riparian vegetation. May contain natural grasslands.
Protection, Rehabilitation, Further Assessment.
Areas of good vegetation on the upper slopes require protection. Further detailed assessment of the agricultural areas is required to determine most appropriate strategy for rehabilitation. Geomorphic assessment may be required.
Willow removal could be considered, however other weeds such as broome are known to exist in this subcatchment which cannot be identified by the classification process used.
Boro Creek 11 A mixed subcatchment with a range of conservation and agricultural areas. Much of the agricultural areas have poor woody vegetation. Substantial areas of private conservation. Small willow infestations occur in some upstream areas, becoming more substantial downstream. May contain natural grasslands.
Protection, Rehabilitation and Further Assessment.
Good vegetation requires protection. Medium areas may be feasible for rehabilitation but substantial areas of poor woody vegetation are unlikely to be improved in the short term without considerable expenditure. Willow removal in the upstream areas may be easily achieved. Geomorphic assessment may be required to address bare areas.
Shoalhaven Estuary 12 Good woody vegetation cover exists in the upper tributaries but overall poor woody vegetation predominates the catchment due to large urban areas and lack of vegetation on tidal floodplains. Riparian cover classifications along the trunk stream may be influenced by large adjacent water bodies
Protection, Rehabilitation and Further Assessment
Upper tributary areas require protection. Rehabilitation of woody vegetation should be conducted outwards from these areas. Little effort should be expended in urban areas. Further assessment of riparian vegetation should be made along the trunk stream to determine local cover conditions.

Shoalhaven Illawarra riparian cover mapping study
NSW Department of Water and Energy | Southern Rivers Catchment Management Authority | May 2008 page 33
Subcatchment Overall Rank
Comments Priority Action
Macquarie Rivulet 13 Urban areas with poor woody vegetation is prevalent in the lower reaches of the catchment. Grazing accounts for much of the floodplain with medium to good cover, and good woody vegetation is present on the steep escarpment
Protection and Rehabilitation
Escarpment vegetation needs protection. Rehabilitation of the medium to good vegetation along the easterly flowing stream corridors should be the focus. Unlikely to achieve significant outcomes in established urban areas but efforts could be made in greenfield development sites
Nerrimunga Creek 14 Dominated by poor woody vegetation cover on grazing land. Good cover exists mostly on national park, private conservation and rural residential areas. Small pockets of medium willow cover exist.
Protection and Rehabilitation.
Good vegetation cover in reserves and on private land requires protection. Rehabilitation efforts should be directed to areas adjacent to these good areas before proceeding to the generally degraded grazing lands which dominate the centre of the catchment.
Bungonia Creek 15 Grazing is the predominant land use with substantial areas of private conservation areas also. Poor woody vegetation cover is prevalent in the eastern parts. In the west, medium to good woody vegetation exists where larger areas of private conservation occur
Protection and Rehabilitation.
Areas of good vegetation cover on private conservation areas require protection. Rehabilitation of medium cover areas in the north west should be targeted before the generally degraded areas of the south east. Large pockets of willows could be targeted but these generally occur in degraded areas.
Mid Shoalhaven 16 Patchy and sparse woody riparian cover in the central eastern and southern grazing areas. Woody cover is more intact and dominant in national parks and State forests tenures along the western, south east and northern parts of the subcatchment. Large areas of willow infestation. May contain natural grasslands.
Protection and Rehabilitation
Areas of good vegetation need protection in private conservation and state forest areas. Rehabilitation efforts should be directed to areas extending out from these areas as. Grazing areas in central – eastern areas with poor woody cover and extensive weed infestation should be low priority.
Reedy Creek 17 Most of the woody riparian vegetation is found in the southern upper reaches where the predominant land-uses include national parks, state forest and private native forestry. The remainder of the subcatchment has very poor woody cover with extensive willow infestation. May contain natural grasslands.
Protection, Rehabilitation and Further Assessment
Areas of good vegetation on private land or forestry in the southern areas need protection. Several small patches of poor to medium woody cover in these areas could be high priority for rehabilitation, and then areas extending out into the degraded areas. A geomorphic assessment maybe required to address the significant areas classified as bare, although successful rehabilitation will require significant resources and may not be considered a high priority on ecological grounds

Shoalhaven Illawarra riparian cover mapping study
NSW Department of Water and Energy | Southern Rivers Catchment Management Authority | May 2008 page 34
Subcatchment Overall Rank
Comments Priority Action
Broughton Creek 18 Steeper slopes in the west have good woody vegetation cover on private and public conservation areas. Floodplain areas to the east have poor woody vegetation cover on mostly grazing lands
Protection, Rehabilitation and Further Assessment
Areas of good vegetation on private lands require protection. Rehabilitation efforts should extend from the hills towards the plains. Further assessment required at a local level to determine if large water bodies in tidal floodplains are impacting classifications.
Minnamurra 19 Steeper slopes in the south west have relatively good woody vegetation cover, but poor woody cover exists for most other parts of the subcatchment where grazing, intensive agriculture, industry and urban areas predominate.
Protection and Rehabilitation
Good vegetation in the upper slopes should be protected and rehabilitation efforts should extend east from these areas. Where new urban developments occur, efforts should be made to encourage the rehabilitation of riparian corridors.
Wollongong 20 Largely urban catchment with woody cover occurring only in escarpment areas.
Protection and rehabilitation
Existing woody cover needs protection, particularly that on private land. Rehabilitation of urban streams can be encouraged but generally only possible during redevelopment of existing urban areas
Gerringong 21 Small coastal subcatchment where grazing predominates. Only small areas of woody vegetation cover exists
Protection and rehabilitation
Remaining areas of woody vegetation require protection. Where new urban developments occur, efforts should be made to encourage the restoration of riparian corridors.
5.3 SHOALHAVEN ILLAWARRA INVESTMENT PRIORITIES
The investment priorities of the SRCMA may not necessarily match the protection and rehabilitation priorities listed above. The priorities suggested above are just one data set which can be used to assist in the overall investment priorities of the SRCMA.
The SRCMA report that their investment strategy is based upon a general set of guiding principles such as:
• Protection of high quality assets such as endangered ecological communities (EECs), town water supplies, high conservation areas (pristine estuaries, good quality remnant landscapes eg. chains of ponds) and reaches that support valuable organisms or their communities.
• Rehabilitate high recovery potential areas before trying to improve areas in poor condition
• Maintain and improve biodiversity values through the creation of corridors, improved terrestrial and aquatic habitat and the removal of threatening processes where possible.
• Maintain and improve water quality; and
• Development and enhancement of effective partnerships and support interested and committed communities.

Shoalhaven Illawarra riparian cover mapping study
This study ranks the subcatchments of the Shoalhaven Illawarra based upon protection and rehabilitation priorities for the maintenance of woody riparian vegetation. Before investment priorities can be formulated, the SRCMA guiding principles mentioned above and other factors such as land tenure and any rules associated with funding sources will need to be considered. It is not considered to be within the scope of this study to undertake such a task, given many of the investment principles of the SRCMA require value judgements to be made.
The spatial data (GIS data) generated by this project will however, greatly assist the SRCMA in making such considerations. All metrics generated by this study are supplied in digital format for each grid tile. This data, along with any other field or modelling based assessments, will be useful for further analysis at a subcatchment level as well as within subcatchment priority setting. If overlain by other spatial datasets such as cadastre, individual lots (and their owners) can potentially be identified and targeted for investment. Overlaying the priority catchments identified in this study with existing datasets for town water supply catchments, extant vegetation communities, saltmarsh communities, riparian corridor objective setting, or the location of active community partnerships will enable informed riparian investment priorities to be formulated.
Should the SRCMA prefer to target other issues apart from riparian vegetation, such as soil/bank erosion and sediment production, the data for other cover types such as bare and almost bare (provided in the report card section and in the accompanying spatial dataset) will provide valuable indicative information, and will certainly be useful guidance as to where further geomorphological investigations, including modelling sediment exports, should be undertaken. However, it should be noted that this study is a snapshot in time taken in generally low rainfall conditions. Therefore some areas classified as bare, and particularly, almost bare, may easily change to the non-woody cover class given more favourable rainfall conditions.
5.4 RELEVANCE OF DATA TO CATCHMENT TARGET, AND THE FUTURE MONITORING PROGRAMS
The Southern Rivers Catchment Management Authority’s Water Management Target W5 (a) states “By 2016 an additional 2,000ha of riparian vegetation will be actively managed for improved riverine ecosystem condition” (SRCMA, 2007, p.80). The data generated by this riparian cover mapping project provides the SRCMA an estimate of the total area of each of the vegetation cover types (Table 5) and it’s spatial variability (Figure 8 and report cards). Should the method be repeated in the future the total area of each cover type will be able to be compared. Although the method by itself will not identify the riparian area being actively managed (as stated in the target), it will provide an indication of where the total area of woody riparian cover is changing, and if combined with data showing where management intervention has taken place, can provide significant information to judge the performance of management actions towards the target.
5.5 LIMITATIONS OF THE METHODS
The use of SPOT-5 imagery is suitable for broad scale assessment of riparian land cover using the methods outlined in this report and is considered ideal for the comparison of subcatchments across large study areas. However, it does not provide a comprehensive assessment of riparian land condition in sufficient detail at the reach scale as does other methods.
NSW Department of Water and Energy | Southern Rivers Catchment Management Authority | May 2008 page 35
Shoalhaven Illawarra riparian cover mapping study
5.5.1 Limitations of SPOT-5 images
The SPOT-5 imagery is limited by its spectral definition as it consists only of four bands within the visible and infra-red spectrum (Table 3). Although this is sufficient for general identification and assessment of vegetation across large landscapes of variable characteristics, its usefulness is diminished when applied to a smaller landscape such as the riparian zone. In particular the images do not provide enough definition to uniquely identify spectral signatures at the species level such as those between native and non-native species. It was difficult to identify a spectral signature for major weed species such as blackberry, broom or privet despite often there being relatively large patches known to occur. The identification of willows was also not possible without the additional analysis of air photos, and even then, it was not possible in coastal areas where the willow signature was even more similar to that of adjacent vegetation types. A second SPOT-5 image captured in winter was also used in an attempt to identify willow species. The idea being that willows infestations could be identified by their absence from the winter image whilst no foliage was present. Unfortunately during winter, the undergrowth under willow trees projected the same spectral signature of the surrounding vegetation therefore no difference could be ascertained between the winter and summer images.
To obtain the necessary definition to identify species level spectral signatures it will probably be necessary to use hyperspectral data. Hyperspectral data sets are generally composed of about 100 to 200 spectral bands of relatively narrow bandwidths (5-10 nm) as opposed to SPOT-5 which provides 4 spectral bands of larger bandwidths (90-400 nm). The collection or purchase of hyperspectral data is significantly more expensive than that of multispectral data. Currently, satellite borne sensors provide data at a broader spatial scale than that of SPOT-5 (30m pixels as opposed to 10m), however air-borne sensors are also available (eg. HyMap http://www.intspec.com/ accessed 7.9.2007) which can increase the spatial resolution significantly to the order of 5m, and some even down to 25cm (eg. CASI 1500 http://www.itres.com/index.php?page=35 accessed 7.9.2007 ). (Comment: Could locate these in the reference list)
5.5.2 Limitations of landscape metrics and woody cover scores
One potential limitation of the landscape metrics used to calculate the Woody Riparian Cover Score is that they are often based on unnatural ecological boundaries, making them scale dependent (Brown, et al., 2002). This means that the computed values of the landscape metrics used in this project are a function of how the riparian zone and the management units (grid tiles) were determined. It is important, therefore, to stress that the metrics calculated in this project are structural metrics and not functional metrics. That is to say the metrics measure physical composition or configuration only and do not measure patterns with explicit reference to any particular ecological process. In addition, the resolution of the imagery also has an effect on the patch mosaic generated by the classification process and used to generate the landscape metrics.
A common criticism of the landscape metrics is that they do not always sufficiently depict the spatial arrangement of the riparian vegetation patches. For example, two grid tiles may have similar connectivity indices (eg. mean nearest neighbour) but different spatial patterns. The vegetation patches of one grid tile may be oriented across the stream and along the river in the other. By producing appropriate maps from data generated by this project it would be possible to identify grid tiles of interest and then examine in detail the classified data for these tiles and draw appropriate conclusions.
NSW Department of Water and Energy | Southern Rivers Catchment Management Authority | May 2008 page 36

Shoalhaven Illawarra riparian cover mapping study
A deficiency of the method of calculating the Woody Riparian Cover Score which requires noting is the influence of the water class in lowering overall woody riparian cover scores. This problem was evident at the grid tile scale, particularly in the Shoalhaven Gorge and Lower Shoalhaven subcatchments, where large numbers of grid tiles contained large areas of the water class, due either to the watercourse being very wide, or the existence of a dam, and as a result, the grid-tiles rated poorly in terms of the percentage of woody cover. Fortunately, at the subcatchment scale, the impact of large surface areas of water could be mitigated to some degree by excluding the water class from the percentage cover calculations (Figure 5). The result being that subcatchments that contained large areas of water, and relatively intact woody riparian vegetation were not penalised in the calculation of their overall score.
It is important to stress that this project is not suggesting that riparian land cover alone is a complete indicator of catchment or river health. Rather, the unavailability and cost of collecting data for other catchment health themes such as habitat, water quality, and aquatic biota at a river basin scale made it necessary to use riparian land cover as the cost effective indicator of riparian condition.
5.5.3 Comparison with other riparian assessment methods
Many other methods are available for the assessment of the riparian zone. Some of the more commonly used methods are the Index of Stream Condition (Ladson et al., 1999), Sustainable Rivers Audit (SRA) (MDBC, 2007) and River Styles methods (Brierley & Fryirs, 2005).
The ISC and SRA both rely on collecting detailed information at sample sites considered to be representative of the surrounding river reaches. Information is collected on geophysical, biological and chemical properties and processes for each site. The ISC produces scores for hydrology, physical form, streamside vegetation, water quality and biota, and similarly the SRA reports on the themes of hydrology, fish, macroinvertebrates, physical habitat and water processes. Each of these methods measure the condition of the riparian zone but require extensive field based sampling and subsequent processing and would be considerably more expensive than the use of SPOT-5 imagery, particularly when many sites would be required to be able to compare across as well as within subcatchments.
The River Styles method is used to classify river reaches into pre-defined types based upon geomorphological processes. Classification is initially undertaken using a detailed analysis of aerial photographs. In this respect it is similar to the method undertaken in this study as it provides a classification based upon the assessment of the whole reach as opposed to the ISC and SRA which depend upon representative sampling sites. Following classification, individual sites are visited to collect additional geomorphological data (sediment sizes, cross-sections, channel slopes etc.) for each reach. A typical River Styles study will also include an assessment of the geomorphological condition of the river reach. The final usefulness of the River Styles assessment is also dependent upon the level of detail (or scale) imposed by the assessor by the length of the individual river reaches classified.
The type of assessments mentioned above would be useful to provide more detailed information on the biology, geomorphology, hydrology and chemistry of the riparian zone, and would aid the management of river systems. However the studies would be more suitable for reaches or subcatchments identified as a priority for further assessment, as opposed to a general assessment over a major catchment area.
NSW Department of Water and Energy | Southern Rivers Catchment Management Authority | May 2008 page 37

Shoalhaven Illawarra riparian cover mapping study
The method chosen provides a more direct assessment of riparian condition that some of the other indices that would be influenced by riparian condition eg. AUSRIVAS etc.
5.6 ADDITIONAL STUDIES
The objective of the project was to generate data to guide the development of a riparian vegetation investment strategy by facilitating the comparison and ranking of different subcatchments and areas within a subcatchment. As such the data and results generated by this project were designed for strategic planning purposes and are not intended for prescribing types of work required within subcatchments. The latter would need to be supported by intensive on-ground, aerial-photo and geomorphological and biological investigations similar to those mentioned in the previous section.
The Woody Riparian Cover Scores generated by this study are useful for prioritising subcatchments for further investigation. Before significant river rehabilitation works are undertaken, it will be necessary to investigate the geomorphology of the relevant subcatchment. The assessment of geomorphology is a labour intensive process requiring detailed air photo investigation and significant field investigations. Budgetary and time constraints of this project precluded such an approach. However, degradation in riparian vegetation cover is often highly correlated with geomorphic degradation, particularly in mid-catchment landscapes where channel slopes decrease and channels are less confined by valleys. The level of riparian vegetation cover, particularly woody cover, will therefore provide a good indication of the geomorphic condition in many instances and can provide a reasonable method of prioritising where more detailed geomorphic investigations are required. Detailed geomorphic assessments often assign a “recovery potential” status to river reaches. Although it depends upon the river category in question, for many River Styles, the amount of woody riparian vegetation cover evident provides a significant input into the determination of the “recovery potential” of a particular reach (David Outhet, NSW Dept Water & Energy, 2006, pers. com). More wide ranging positive benefits offered by woody riparian cover to catchment health are detailed in Mutendeudzi (2006).
In essence, the data and results of this project on their own cannot decide for the land managers what needs to be done and where. Rather, the data and results generated by this project are designed to inform the land managers about the spatial distribution and composition of riparian land-cover types within the subcatchments of the study area. The data and results of this project can be used to locate and profile potential problems areas, e.g. areas of with low mean Total Woody Riparian Cover Scores, areas with weeds infestation (where mapped) and areas potential prone to erosion (Bare areas). Potentially ‘insecure’ (by reason of tenure) woody riparian cover may also be identified and prioritised for management.
NSW Department of Water and Energy | Southern Rivers Catchment Management Authority | May 2008 page 38

Shoalhaven Illawarra riparian cover mapping study
6 References Apan, A.A., Raine, S.R. and Paterson, M. S., (2002). Mapping and analysis of changes in
riparian landscape of the Lockyer Valley catchment, Queensland, Australia. Landscape and Urban Planning 59 (2002) 43-57.
Bauer, M., Burk, T., Ek, A., Coppin, P., Lime, S., Walsh, T., Walters, D., Befort, W. and Heinzen, F., (1994). Satellite Inventory of Minnesota forest resources. Photogrammetric Engineering and Remote Sensing 60 (3), 287-298.
Bradley, J. 1988. Bringing back the Bush – The Bradley method of bush regeneration. Edited by Larking, J., Lenning, A. & Walker, J. Lansdowne Press. Sydney
Branagan,D.F. & Packham,G.H. (2000). Field Geology of New South Wales. Third Edition. NSW Department of Mineral Resources, Sydney.
Brierley, G and Fryirs, K.A (2005) Geomorphology and River Management: Applications of the River Styles Framework. Blackwell Publishing, Oxford, UK, 398pp. ISBN 1-4051-1516-5
Brierley, G, Nanson, R, Ferguson, R, and Crighton, P.,(1999). River Styles in the Shoalhaven Catchment, South Coast, NSW – A report completed for the NSW Department of Land and Water Conservation. Macquarie Research Pty. Ltd., Sydney.
Brown, D.G., Addink, E. A., Duh, J.D., Bowersox, M.A., (2002). Assessing Uncertainty in Spatial Landscape Metrics Derived from Remote Sensing Data. In: Lenetta, R., Lyon, J.G., Eds. Remote Sensing and GIS Accuracy Assessment, Boca Raton, FL: CRC Press.
Clarke, S.J., Bruce-Burgess, L. & Wharton, G. (2003). Viewpoint – Linking form and function: towards an eco-hydromorphic approach to sustainable river rehabilitation. Aquatic Conservation: Marine and Freshwater Ecosystems 13: 439-450
Congalton, R., K. Birch, R. Jones, and J. Schriever. (2002). Evaluating remotely sensed techniques for mapping riparian vegetation. Computers and Electronics in Agriculture. Vol. 37. pp. 113-126
Cottingham, P., Bond, N., Lake, P.S. & Outhet, D. (2005). Recent lessons on river rehabilitation in eastern Australia. Technical Report. CRC for Freshwater Ecology, Canberra, ACT
Davies, P., Cook, B., Rutherford, K. and Walshe, T. (2004). River and Riparian Land Management Technical Guideline Number 5 Managing high instream temperatures using riparian vegetation. Edited by Siwan Lovett and Phil Price. Land and Water Australia, ISSN 1445-3924.
DLWC (1999) NSW stressed rivers assessment report. Department of Land and Water Conservation, Sydney.
DNR (2004). Landuse mapping of eastern NSW. Digital corporate dataset. Metadata: http://canri.nsw.gov.au/nrdd/records/ANZNS0359100121.html (accessed 23.2.2007)
NSW Department of Water and Energy | Southern Rivers Catchment Management Authority | May 2008 page 39

Shoalhaven Illawarra riparian cover mapping study
Dynesius, M. & Nilsson, C. 1994. Fragmentation and flow regulation of river systems in the northern third of the world. Science 266:753-762.
Forghani, A., Reddy, S. and Smith, C., (2003). Evaluating SPOT-5 Satellite Imagery for National Mapping Division’s Topographic Mapping Program. Spatial Sciences 2003.
Harvey, K.R. and Hill, G.J.E., (2001). Vegetation mapping of a tropical freshwater swamp in the Northern Territory, Australia: a comparison of aerial photography, Landsat TM and SPOT satellite imagery. International Journal of Remote Sensing, 22 , 2911-2925.
Hewitt, M.J., (1990). Synoptic inventory of riparian ecosystems: the utility of Landsat Thematic Mapper data. Forest Eco. Management 33/34, 605-620.
Higginson F.R. (1970). Survey of erosion and landuse within the Shoalhaven valley. J. NSW Soil. Cons. Ser., 26:25-59.
Jansen, A., Robertson, A., Thompson, L. and Wilson, A. (2005) Rapid appraisal of riparian condition. River and riparian land management technical guideline Number 4A, October 2005. Land and Water Australia ISSN 1445-3924.
Koehn, J., Brierley, G., Cant, B and Lucas, A. (2001). River rehabilitation framework. Occasional Paper 01/01, Land and Water Australia, Canberra
Keller, K (undated) Geographic information system based riparian restoration site selection model: Application to the Consumnes river Watershed. http://baydelta.ucdavis.edu/crg_data/albums/userpics/10001/D4.pdf (accessed 22.8.2007).
Khorram, S., Gregory, J., Stallings, D.F., and Cakir, H. (2003). High Resolution Mapping Land Cover Classification of the Hominy Creek Watershed. CEO Technical Report 220. Submitted to Water Resource Research Institute.
Ladson, A.R., White, L.J., Doolan, J.A., Finlayson, B.L., Hart, B.T., Lake, S. & Tilleard, J.W. (1999). Development and testing of an Index of Stream Condition for waterway management in Australia. Freshwater Biology, 41:453-468.
Lowrance, R., Todd, R., Sheridan, J. (1985). Managing riparian ecosystems to control non-point pollution. J. Soil Water Conserv. January/February: 87-91.
LWRRDC (1999) Technical guidelines for riparian management. Land and Water Resources Research and Development Corporation, Canberra.
McAlpine, J.R. and Yapp, G.A. (1969). Climate of the Queanbeyan-Shoalhaven area. In: Lands of the Queanbeyan Shoalhaven area, ACT and NSW. CSIRO Land Research Series No.24 CSIRO, Melbourne
McGarigal, K.,. Cushman S. A, Neel M. C., and Ene E.. (2002) FRAGSTATS: Spatial Pattern Analysis Program for Categorical Maps. Computer software program produced by the authors at the University of Massachusetts, Amherst. www.umass.edu/landeco/research/fragstats/fragstats.html (accessed 15.8.2007)
NSW Department of Water and Energy | Southern Rivers Catchment Management Authority | May 2008 page 40

Shoalhaven Illawarra riparian cover mapping study
McGarigal, K. and Marks, B.J., (1995). FRAGSTATS: Spatial Pattern Analysis Program for Quantifying Landscape Structure. General Technical Report PNW-GTR-351, USDA Forest Service, Pacific Northwest Research Station, Portland, OR., 1995. http://www.umass.edu/landeco/research/fragstats/documents/Metrics (accessed 15.8.2007)
MDBC (2007). The Sustainable Rivers Audit at a glance. Murray Darling Basin Commission. http://www.mdbc.gov.au/SRA. (accessed 3.7.2007)
Muller, E (1997). Mapping riparian vegetation along rivers: old concepts and new methods. J. Aquatic Botany. 58: 411-437.
Mutendeudzi, M (2006). Shoalhaven Illawarra Riparian Cover Mapping: Methods Development, Reedy Creek Pilot Study. NSW Dept. Natural Resources, Sydney.
Narumalani, S., Zhou, Y., Jensen, J.R. (1997). Application of remote sensing and geographic information systems to the delineation and analysis of riparian buffer zones. J. Aquatic Botany 58: 393-409.
NRE. 2002 Victorian River Health Strategy - Healthy Rivers, Healthy Communities & Regional Growth Department of Natural Resources and Environment, Melbourne
Oates, J. (2000). Water Notes – Advisory Notes for Land Managers on Rivers and Wetland Restoration. Water and Rivers Commission. (Western Australian Government). WN10 January 2000
Palmer, M.A., Bernhardt, E.S., Allan, J.D., Lake, P.S., Alexander, G., Brooks, S., Carr, J., Clayton, S., Dahm, C.N., Follstad Shah, J., Galat, D.L. Loss, S.G., Goodwin, P., Hart, D.D., Hassett, B., Jenkinson, R., Kondolf, G.M., Lave, R., Meyer, J.L. O’Donnell, T.K., Pagano, L. & Sudduth, E. ( 2005) Forum: Standards for ecologically successful river rehabilitation. Journal of Applied ecology 2005 42, 208-217
Price, P., Lovett, S. & Lovett, J. (2004) Managing riparian widths. Fact Sheet 13, Land & Water Australia, Canberra.
Riitters, K.H., Coulston, J. W. and Wickham, J.D. (2003). Localising National Fragmentation Statistics with Forest Type Maps. Journal of Forestry, 101 (4) 18-21.
Roberts, D.W., Dowling, T.I. and Walker, J. (1997). FLAG: A fuzzy landscape analysis GIS method for dryland salinity assessment. CSIRO, Land and Water Technical Report 8/97, Canberra, Jul. 1997.
Rogan, J. and Chen, D. (2004). Remote sensing technology for mapping and monitoring land-cover and land-use change. Progress in Planning 61 (2004) 301-325.
SRCMA (2007) Catchment Action Plan, Southern Rivers Catchment Management Authority, January 2007., http://www.southern.cma.nsw.gov.au/pdf_publications/CatchActionPlan5.pdf, (accessed 21.2.2007)
Snyder, M. N., Goetz, S.J. and Wright, R.K., 2005. Stream health rankings predicted by satellite derived land cover metrics. Journal of the American Water Resources Association 41 (3) : 659-677.
NSW Department of Water and Energy | Southern Rivers Catchment Management Authority | May 2008 page 41
Shoalhaven Illawarra riparian cover mapping study
Talukdar, K. (2004) Extraction and classification of wetland features through fusion of remote sensing images in the Okanvango Delta, Botswana. In: Proceedings ISPRS Congress, Istanbul Turkey, July 2004. International Society for Photogrammetry and Remote Sensing International Vol XXXV, ISSN 1682-1750. http://www.isprs.org/istanbul2004/comm7/papers/58.pdf (accessed 13.08.2007)
Thurtell, L and McNeil, D. (2005). Lachlan Riparian Priority Project. NSW Department of Infrastructure, Planning and Natural Resources.
Tindall,D., Pennay,C., Tozer,M.G., Turner,K., & Keith,D.A. (2004). Native Vegetation Map Report Series No. 4 - Araluen, Batemans Bay, Braidwood, Burragorang, Goulburn, Jervis Bay, Katoomba, Kiama, Moss Vale, Penrith, Port Hacking, Sydney, Taralga, Ulladulla, Wollongong. Final Draft Report, April 2005. NSW Department of Environment and Conservation and NSW Department of Infrastructure, Planning and Natural Resources, Sydney
USEPA (2007) Principles for the ecological restoration of aquatic resources. http://www.envirotools.org/factsheets/redevelopment/principle_restoration.shtml. (accessed 7.8.2007)
USDA (1991). Riparian forest buffers: function and design for protection enhancement of water resources. USDA Forest Service, Forest Management, Radnor, PA, p.20.
Wang, L.J., Lyons and Kanehl, P., 2001. Impacts of urbanisation on stream habitat and fish across multiple spatial scales. Environmental Management 28 (2): 255-266.
Wolter, P., Mladenoff, D., Host, G. and Crow, T., 1995. Improve forest classification in the northern Lake States using multi-temporal Landsat imagery. Photogrammetric Engineering and Remote Sensing 61 (9), 1129-1143.
NSW Department of Water and Energy | Southern Rivers Catchment Management Authority | May 2008 page 42

Shoalhaven Illawarra riparian cover mapping study
7 Appendices
APPENDIX 1. SPOT-5 IMAGE INFORMATION
6/02/2005
21/05/2005
25/03/2005
10/04/2005
3/01/2004
3/01/2004
3/01/2004
3/01/2004
Spot5 Image File Name Type Pixel Size Date aquired
sp5xi10_388419s6_030104.img Mulitspectral 10 X 10 m 3/01/2004sp5xi10_388420s6_030104.img Mulitspectral 10 X 10 m 3/01/2004sp5xi10_388421s6_030104.img Mulitspectral 10 X 10 m 3/01/2004sp5xi10_388422s6_030104.img Mulitspectral 10 X 10 m 3/01/2004sp5pan2p5_388419s6_030104.img Panchromatic 2.5 x 2.5 m 3/01/2004sp5pan2p5_388420s6_030104.img Panchromatic 2.5 x 2.5 m 3/01/2004sp5pan2p5_388421s6_030104.img Panchromatic 2.5 x 2.5 m 3/01/2004sp5pan2p5_388422s6_030104.img Panchromatic 2.5 x 2.5 m 3/01/2004sp5xi10_389419_060205.img Mulitspectral 10 X 10 m 6/02/2005sp5xi10_389422_210505.img Mulitspectral 10 X 10 m 21/05/2005sp5xi10_389420_100405.img Mulitspectral 10 X 10 m 10/04/2005sp5xi10_389421_250305.img Mulitspectral 10 X 10 m 25/03/2005sp5pan2p5_389419_060205.img Panchromatic 2.5 x 2.5 m 6/02/2005sp5pan2p5_389422_210505.img Panchromatic 2.5 x 2.5 m 21/05/2005sp5pan2p5_389420_100405.img Panchromatic 2.5 x 2.5 m 10/04/2005sp5pan2p5_389421_250305.img Panchromatic 2.5 x 2.5 m 25/03/2005
NSW Department of Water and Energy | Southern Rivers Catchment Management Authority | May 2008 page 43

Shoalhaven Illawarra riparian cover mapping study
APPENDIX 2. LAND USE MAPPING CODES
DNR(2004) Land use Mapping Codes and Descriptions Land Use Category
Used
Map Code Detail Major Category
Grazing 101 Secondary grassland in forested areas Grazing Grazing 113 Land controlled by Macquarie Generation (Hunter Valley), currently unused or lightly grazed Grazing Grazing 144 Agroforestry Grazing Grazing 4 Volunteer, naturalised, native or improved pastures Grazing Grazing 45 Airstrip (local/farmer, grass or bare surface, not sealed) Transport & Other Cor Grazing 45A Airstrip (local/farmer, grass or bare surface, not sealed) Transport & Other Corridors Grazing 47 Energy corridor Power Generation Grazing 48W Lantana, blackberry and other exotic weed infested grazing land Grazing Grazing 4A Volunteer, naturalised, native or improved pastures within a State Forest Grazing Grazing 4L Volunteer, naturalised, native or improved pastures, with previous evidence of cultivation Grazing Grazing 4R Volunteer, naturalised, native or improved pastures - with more than 30% of ground area having regeneration of native tree species Grazing Grazing 4SR Volunteer, naturalised, native or improved pastures - with more than 30% of ground area having native shrub regeneration Grazing Grazing 4W Volunteer, naturalised, native or improved pastures - with more than 30% of ground area having exotic weeds Grazing Grazing 5 Sown, improved perennial pastures Grazing Grazing 6 Irrigated pastures Grazing Grazing 68 Recently cleared land (cleared of forest vegetation as yet not covered by crop or pasture) Grazing Grazing 8 Farm dam River & Drainage Syst Grazing 83 Degraded land (salt site, eroded area) Grazing Grazing 90 Horse stud and/or horse breeding facilities Intensive Animal Prod Private conservation 122 Constructed wetland for conservation or water improvement Wetland Private conservation 125 Salt treatment or salt demonstration site (discharge and recharge sites) Conservation Area Private conservation 145 Lands fenced and treated for land degradation problems Conservation Area Private conservation 146 Land fenced for riparian management Conservation Area Private conservation 23 Swamp Wetland Private conservation 24 Windbreak or tree corridor Tree & Shrub Cover Private conservation 25 Treelot Conservation Area Private conservation 25E Tree lot - exotic species Tree & Shrub Cover Private conservation 25N Tree lot - native species Conservation Area Private conservation 27 Private conservation agreement Conservation Area Private conservation 67 Native woody shrub Tree & Shrub Cover Private conservation 73 Dunal swamp Wetland Private conservation 74 Floodplain swamp Wetland Private conservation 9 Native forest Tree & Shrub Cover Private conservation 9A Native forest and within a State Forest Tree & Shrub Cover National Parks NP National Park Urban 149 Resort style private land use Urban Urban 155 Surf club and/or coastal car parking facilities Urban Urban 17 Residential Urban Urban 31 Urban recreation Urban Urban 31A Urban recreation within a State Forest Conservation Area Urban 31I Urban recreation - irrigated Urban Urban 61 Research facility Urban Urban 75 Tourist development Urban Urban 77 University or other tertiary institution Urban Urban 92 Government and private facilities - gaol, training centre, school, religious institutions & training centres, Urban Urban 94 Caravan park or mobile home village Urban Urban 94A Caravan park or mobile home village within a State Forest Urban Rural Residential 130 Rural recreation. Blocks are isolated and not associated with an urban area Urban Rural Residential 139 Farm Infrastructure - house, machinery & storage sheds and garden areas Urban
Rural Residential 152 Small to medium forested or wilderness blocks with isolated residential buildings. (Rural residential but the forested extent is worth noting) Urban
Rural Residential 152A Small to medium forested or wilderness blocks with isolated residential buildings. (Rural residential but the forested extent is worth noting) Urban
Rural Residential 18 Rural residential Urban State Forests SF State Forest Other Public Lands 100 Marina River & Drainage Syst Other Public Lands 103 Communications facility Transport & Other Cor Other Public Lands 105 Coastal lake River & Drainage Syst Other Public Lands 106 Estuarine waters River & Drainage Syst Other Public Lands 107 Canal (canal estate, navigation canal) River & Drainage Syst Other Public Lands 109 Cliff/rock outcrop Special Category Other Public Lands 12 River, creek or other incised drainage feature River & Drainage Syst Other Public Lands 12A River, creek or other incised drainage feature within a State Forest; includes cowals in western NSW River & Drainage System Other Public Lands 131 Flood chute (flood runners that are filled with water during and after floods) and designated floodways in irr River & Drainage Syst Other Public Lands 148 SCA unused land Conservation Area Other Public Lands 157 Cultural heritage site - aboriginal or european Conservation Area Other Public Lands 158 Submerged oyster leases Wetland Other Public Lands 19 Road or road reserve Transport & Other Cor Other Public Lands 19A Road or road reserve within a State Forest Transport & Other Corridors Other Public Lands 20 Railway Transport & Other Cor Other Public Lands 21 Floodplain swamp - backswamp Wetland Other Public Lands 22 Floodplain swamp - billabong Wetland
NSW Department of Water and Energy | Southern Rivers Catchment Management Authority | May 2008 page 44

Shoalhaven Illawarra riparian cover mapping study
NSW Department of Water and Energy | Southern Rivers Catchment Management Authority | May 2008 page 45
DNR(2004) Land use Mapping Codes and Descriptions Land Use Category Used
Map Code Detail Major Category
Other Public Lands 32 Defence facility Special Categories Other Public Lands 46 Reservoir River & Drainage Syst Other Public Lands 46A Reservoir within a State Forest River & Drainage System Other Public Lands 47A Energy corridor within a State Forest Power Generation Other Public Lands 50 Cemetery Urban Other Public Lands 51 River training work River & Drainage Syst Other Public Lands 54 Mangrove Wetland Other Public Lands 55 Mudflat Wetland Other Public Lands 55A Mudflat within a State Forest Wetland Other Public Lands 56 Coastal marsh/estuarine swamp Wetland Other Public Lands 57 Drainage channel (from irrigation system or a channel draining a swamp; base of channel is lined) River & Drainage Syst Other Public Lands 59 Foreshores or reserved land to water supply dam (Sydney Water, Hunter Water, SMHEA or Public Works Dam) Conservation Area Other Public Lands 64 Beach Special Categories Other Public Lands 76 Lagoon or inland lake River & Drainage Syst Other Public Lands 80 Water supply pressure reservoir including water filtration plant River & Drainage Syst Other Public Lands 96 Sand spit/estuarine sand island Special Category Other Public Lands 97 No identified use Special Category Other Public Lands 98 Oyster spoil & sheds, but not submerged leases Wetland Other Public Lands 99 Foreshore protection - vegetated foredune (coastal feature) Special Category Other Public Lands NR Nature reserve Conservation Area Other Public Lands SCA SCA land Forestry/Plantations 10 Native forest - logged Tree & Shrub Cover Forestry/Plantations 11 Native forest - regeneration Tree & Shrub Cover Forestry/Plantations 13 Native forest - filter strips in softwood plantation Tree & Shrub Cover Forestry/Plantations 14 Softwood plantation Tree & Shrub Cover Forestry/Plantations 142 Pine planting interspersed amongst eucalypt/shrub forest and/or areas with poor to nil establishment Tree & Shrub Cover Forestry/Plantations 14A Softwood plantation and within a State Forest Tree & Shrub Cover Forestry/Plantations 15 Softwood plantation - nursery Tree & Shrub Cover Forestry/Plantations 52 Poplar plantation Tree & Shrub Cover Cropping 1 Cropping - continuous or rotation Cropping Cropping 104 Pecan, macadamia and other nuts Horticulture Cropping 104I Pecan, macadamia and other nuts Irrigated Horticulture Cropping 116 Cut flowers & herbs Horticulture Cropping 132 Irrigation dam River & Drainage Syst Cropping 2 Orchard - tree fruits Horticulture Cropping 2I Orchard - tree fruits, Irrigated Cropping 3 Vineyard - grape and other vine fruits Horticulture Cropping 35 Eucalypts and other Australaian native species for cut flower arrangements Horticulture Cropping 35I Eucalypts and other Australaian native species for cut flower arrangements, Irrigated Cropping 38 Olives Horticulture Cropping 38I Olives, Irrigated Cropping 39 Vegetables Horticulture Cropping 39I Vegetables, irrigated Cropping 3I Vineyard - grape and other vine fruits, Irrigated Cropping 42 Nursery Horticulture Cropping 53 Building associated with horticultural industry (winery, packing shed) Horticulture Cropping 69 Native shrub plantation (eg tea tree) Horticulture Cropping 81 Shade house or glass house (includes hydroponic use) Horticulture Cropping 84 Fodder crop Cropping Cropping 87 Abandoned orchard and vine lands; trees/vines not maintained and may be dying; regrowth of native shrubs and t Horticulture Cropping 88 Turf farming Horticulture Industry/Intensive Argriculture 43 Derelict mining land Mining & Quarrying Industry/Intensive Argriculture 44 Mine site Mining & Quarrying Industry/Intensive Argriculture 49 Restored mining lands Mining & Quarrying Industry/Intensive Argriculture 7 Quarry Mining & Quarrying Industry/Intensive Argriculture 78 Fly ash dam/spoil dump Mining & Quarrying Industry/Intensive Argriculture 7A Quarry - within a State Forest Mining & Quarrying Industry/Intensive Argriculture 82 Grassland within mining lease Mining & Quarrying Industry/Intensive Argriculture 95 Restored sand mining area Mining & Quarrying Industry/Intensive Argriculture 112 Electricity generation (power station and associated stockpiles, hydro-electric plants Power Generation Industry/Intensive Argriculture 124 Effluent ponds from intensive animal industries Intensive Animal Prod Industry/Intensive Argriculture 159 Dog kennel, dog run for greyhounds Intensive Animal Prod Industry/Intensive Argriculture 16 Industrial/commercial Urban Industry/Intensive Argriculture 165 Sawmill Urban Industry/Intensive Argriculture 26 Intensive animal production Intensive Animal Prod Industry/Intensive Argriculture 26c Intensive animal production - poultry Intensive Animal Production Industry/Intensive Argriculture 26d Intensive animal production -dairy shed Intensive Animal Production Industry/Intensive Argriculture 29 Sewage disposal ponds Urban Industry/Intensive Argriculture 33 Landfill (garbage) Urban Industry/Intensive Argriculture 33A Landfill (garbage) within a State Forest Urban Industry/Intensive Argriculture 34 Aquaculture - fish, prawn, yabbie or beach worm farm River & Drainage Syst Industry/Intensive Argriculture 36 Aerodrome/airport Transport & Other Cor Industry/Intensive Argriculture 60 Abattoir Intensive Animal Prod Industry/Intensive Argriculture 93 Electricity Substation Power generation

Shoalhaven Illawarra riparian cover mapping study
8 Subcatchment Report Cards
NSW Department of Water and Energy | Southern Rivers Catchment Management Authority | May 2008 page 46