shire of wyndham east kimberley
TRANSCRIPT

Shire of Wyndham East Kimberley

1
TABLE OF CONTENTS
Statement by Chief Executive Officer 2
Income Statement by Nature or Type 3
Income Statement by Program 4
Balance Sheet 5
Statement of Changes in Equity 6
Cash Flow Statement 7
Rate Setting Statement 8
Notes to and Forming Part of the Financial Report 9 to 38
Audit Report 39 to 41


3
INCOME STATEMENT
BY NATURE OR TYPE
FOR THE YEAR ENDED 30TH JUNE 2006
NOTE 2006 2006 2005
$ Budget $
$
REVENUES FROM ORDINARY ACTIVITIES
Rates 22 3,581,787 3,571,500 3,270,996
Grants and Subsidies 28 4,027,332 3,416,500 4,149,259
Contributions Reimbursements
and Donations 336,404 607,100 67,441
Fees and Charges 27 1,666,096 1,709,250 1,865,215
Interest Earnings 2(a) 276,090 217,000 256,296
Other Revenue 1,615,004 1,093,950 1,575,688
11,502,713 10,615,300 11,184,895
EXPENSES FROM ORDINARY ACTIVITIES
Employee Costs (3,315,266) (4,014,433) (3,249,664)
Materials and Contracts (4,074,602) (3,652,917) (3,646,272)
Utilities (588,981) (245,400) (623,118)
Depreciation 2(a) (2,519,785) (2,576,000) (2,459,273)
Interest Expenses 2(a) (62,444) (110,900) (100,947)
Insurance (440,851) (297,600) (518,314)
Other Expenditure (1,134,005) (104,200) (902,261)
(12,135,934) (11,001,450) (11,499,849)
(633,221) (386,150) (314,954)
Grants and Subsidies - non-operating 28 2,816,283 4,006,200 1,179,702
Profit on Asset Disposals 20 418,801 931,090 115,636
Loss on Asset Disposals 20 (87,413) (8,100) (53,279)
NET RESULT 2,514,450 4,543,040 927,105
This statement is to be read in conjunction with the accompanying notes.

4
INCOME STATEMENT
BY PROGRAM
FOR THE YEAR ENDED 30TH JUNE 2006 NOTE 2006 2006 2005 $ Budget $ $
REVENUES FROM ORDINARY ACTIVITIES Governance 885 2,000 28,232 General Purpose Funding 6,957,854 6,946,500 6,817,318 Law, Order, Public Safety 81,355 91,500 184,515 Health 142,069 121,650 130,946 Education and Welfare 678,324 1,510,600 96,213 Housing 491,376 629,040 80,363 Community Amenities 968,943 820,300 818,691 Recreation and Culture 1,092,932 2,223,500 1,001,796 Transport 3,747,700 1,496,600 3,091,059 Economic Services 113,670 85,100 87,756 Other Property and Services 462,690 1,617,700 143,344
14,737,798 15,544,490 12,480,233
EXPENSES FROM ORDINARY ACTIVITIES EXCLUDING BORROWING COSTS EXPENSE Governance 563,687 602,850 871,797 General Purpose Funding 221,322 247,300 262,169 Law, Order, Public Safety 364,313 338,050 344,087 Health 347,657 364,250 323,565 Education and Welfare 252,578 256,000 267,612 Housing 174,169 210,400 167,578 Community Amenities 1,509,167 1,353,200 1,437,333 Recreation & Culture 2,885,262 2,876,550 2,721,090 Transport 4,989,074 3,122,150 4,588,969 Economic Services 370,321 389,200 305,091 Other Property and Services 483,354 1,130,600 162,890
2 (a) 12,160,904 10,890,550 11,452,181
BORROWING COSTS EXPENSE Education and Welfare 0 6,500 0 Housing 6,008 9,200 0 Recreation & Culture 50,717 82,900 79,989 Transport 709 1,400 2,069 Economic Services 2,360 4,000 4,179 Other Property and Services 2,650 6,900 14,710
2 (a) 62,444 110,900 100,947
NET RESULT 2,514,450 4,543,040 927,105
This statement is to be read in conjunction with the accompanying notes.

5
BALANCE SHEET
AS AT 30TH JUNE 2006
NOTE 2006 2005
$ $
CURRENT ASSETS Cash and Cash Equivalents 3 5,438,941 3,775,606
Trade and Other Receivables 4 1,125,934 1,311,028
Inventories 5 9,669 12,975
TOTAL CURRENT ASSETS 6,574,544 5,099,609
NON-CURRENT ASSETS Other Receivables 4 72,964 160,181
Property, Plant and Equipment 6 12,519,833 10,908,507
Infrastructure 7 33,159,092 32,827,507
Other Financial Assets 6,682 6,682
TOTAL NON-CURRENT ASSETS 45,758,571 43,902,877
TOTAL ASSETS 52,333,116 49,002,486
CURRENT LIABILITIES Trade and Other Payables 8 1,201,595 1,182,013
Long Term Borrowings 9 157,020 152,373
Provisions 10 180,861 177,484
TOTAL CURRENT LIABILITIES 1,539,476 1,511,870
NON-CURRENT LIABILITIES Long Term Borrowings 9 2,176,453 1,393,672
Provisions 10 223,003 217,210
TOTAL NON-CURRENT LIABILITIES 2,399,456 1,610,882
TOTAL LIABILITIES 3,938,932 3,122,752
NET ASSETS 48,394,184 45,879,734
EQUITY Retained Surplus 45,705,494 42,888,578
Reserves - Cash Backed 11 2,688,690 2,991,156
TOTAL EQUITY 48,394,184 45,879,734
This statement is to be read in conjunction with the accompanying notes.

6
STATEMENT OF CHANGES IN EQUITY
FOR THE YEAR ENDED 30TH JUNE 2006
NOTE 2006 2005
$ $
RETAINED SURPLUS Balance as at 1 July 2005 42,888,578 41,837,818
Net Result 2,514,450 927,105
Transfer from/(to) Reserves 302,466 123,655
Balance as at 30 June 2006 45,705,494 42,888,578
RESERVES - CASH BACKED Balance as at 1 July 2005 2,991,156 3,114,811
Amount Transferred (to)/from Retained Surplus (302,466) (123,655)
Balance as at 30 June 2006 11 2,688,690 2,991,156
TOTAL EQUITY 48,394,184 45,879,734
This statement is to be read in conjunction with the accompanying notes.

7
CASH FLOW STATEMENT
FOR THE YEAR ENDED 30TH JUNE 2006 NOTE 2006 2006 2005 $ Budget $
Cash Flows From Operating Activities $ Receipts Rates 3,719,340 3,642,930 3,588,421 Grants and Subsidies - operating 4,027,332 3,348,170 4,149,259 Contributions, Reimbursements & Donations 336,404 207,100 67,441 Fees and Charges 1,443,507 1,623,788 2,311,467 Interest Earnings 335,180 217,000 256,296 Goods and Services Tax 963,034 0 812,039 Other 1,615,004 1,148,647 1,626,656
12,439,801 10,187,635 12,811,579 Payments Employee Costs (3,249,664) (3,934,144) (2,814,717) Materials and Contracts (3,981,749) (3,579,859) (3,672,851) Utilities (gas, electricity, water, etc) (588,981) (225,768) (623,118) Insurance (440,851) (297,600) (518,314) Interest (62,444) (110,900) (101,801) Goods and Services Tax (912,402) 0 (867,752) Other (1,054,475) (109,410) (1,957,571)
(10,290,566) (8,257,681) (10,556,124) Net Cash Provided By (Used In) Operating Activities 13(b) 2,149,235 1,929,954 2,255,455
Cash Flows from Investing Activities Payments for Purchase of Property, Plant & Equipment (2,832,007) (6,845,900) (878,094) Payments for Construction of Infrastructure (1,916,332) (2,007,750) (2,098,282) Grants/Contributions for the Development of Assets 2,816,283 4,406,200 1,179,702 Proceeds from Sale of Plant & Equipment 617,032 1,389,700 237,146 Net Cash Provided By (Used In) Investing Activities (1,315,024) (3,057,750) (1,559,528)
Cash Flows from Financing Activities Loans to Community Groups 0 0 (30,000) Repayment of Debentures (162,572) (169,000) (188,391) Proceeds from Self Supporting Loans 41,693 31,100 37,780 Proceeds from New Debentures 950,000 1,650,000 30,000 Net Cash Provided By (Used In) Financing Activities 829,121 1,512,100 (150,611)
Net Increase (Decrease) in Cash Held 1,663,332 384,304 545,316 Cash at Beginning of Year 3,775,609 3,327,941 3,230,290 Cash at End of Year 13(a) 5,438,941 3,712,245 3,775,606
This statement is to be read in conjunction with the accompanying notes.

8
RATE SETTING STATEMENT
FOR THE YEAR ENDED 30TH JUNE 2006 2006 2006 NOTE $ Budget $ REVENUES
Governance 885 2,000 General Purpose Funding 3,357,732 3,375,000 Law, Order, Public Safety 73,384 91,500 Health 142,069 121,650 Education and Welfare 678,324 1,510,600 Housing 491,376 629,040 Community Amenities 968,943 820,300 Recreation and Culture 1,033,790 2,223,500 Transport 3,747,700 1,504,700 Economic Services 118,670 85,100 Other Property and Services 456,408 1,617,700 11,069,281 11,981,090 EXPENSES
Governance (588,687) (602,850) General Purpose Funding (251,669) (247,300) Law, Order, Public Safety (362,072) (338,050) Health (347,657) (364,250) Education and Welfare (252,578) (262,500) Housing (181,778) (219,600) Community Amenities (1,498,949) (1,353,200) Recreation & Culture (2,890,356) (2,959,450) Transport (4,952,986) (3,131,650) Economic Services (372,681) (393,200) Other Property and Services (413,660) (1,137,500) (12,113,073) (11,009,550) Adjustments for Cash Budget Requirements:
Non-Cash Expenditure and Revenue (Profit)/Loss on Asset Disposals (331,388) (922,990)
Movement in Accrued Salaries and Wages 31,206 0 Movement in Non-Current Employee Provisions (462) 0 Depreciation on Assets 2,519,785 2,576,000 Capital Expenditure and Revenue
Purchase Land and Buildings (2,174,130) (6,255,000) Purchase Infrastructure Assets - Roads (1,472,008) (1,545,700) Purchase Infrastructure Assets - Parks (24,742) (295,550) Infrastructure Assets - Drainage (594) (25,000) Infrastructure Assets - Footpaths (65,617) (50,000) Infrastructure Assets - Other (353,371) (91,500) Purchase Plant and Equipment (550,693) (467,500) Purchase Furniture and Equipment (107,184) (123,400) Proceeds from Disposal of Assets 617,032 1,389,700 Repayment of Debentures (162,572) (169,000) Proceeds from New Debentures 950,000 1,650,000 Self-Supporting Loan Principal Income 41,693 31,100 Transfers to Reserves (Restricted Assets) (392,320) (1,232,900) Transfers from Reserves (Restricted Assets) 694,786 728,900
ADD Estimated Surplus/(Deficit) July 1 B/Fwd 926,440 259,800 LESS Estimated Surplus/(Deficit) June 30 C/Fwd 2,683,857 0
Amount Req'd to be Raised from Rates 22 (3,581,788) (3,571,500)
This statement is to be read in conjunction with the accompanying notes.

9
NOTES TO AND FORMING PART OF THE FINANCIAL REPORT
FOR THE YEAR ENDED 30TH JUNE 2006
1. SIGNIFICANT ACCOUNTING POLICIES The significant accounting policies which have been adopted in the preparation of this financial
report are:
(a) Basis of Preparation
The financial report is a general purpose financial report which has been prepared in accordance with applicable Australian Accounting Standards, the Local Government Act 1995 (as amended and accompanying regulations (as amended). He report has also been prepared on the accrual basis under the convention of historical cost accounting.
First AIFRSs Financial Report
This is the Shire's first Australian equivalents to International Financial Reporting Standards ("AIFRSs") annual financial report covered by AIFRSs and AASB1 "First Time Adoption of Australian equivalents to International Financial Reporting Standards". The preparation of the annual financial report in accordance with AIFRSs resulted in changes to the accounting policies as compared with the most recent annual financial statements prepared under previous Generally Accepted Accounting Principles ("previous GAAP") The accounting policies set out below have been consistently applied to all periods presented in this financial report. They have also been applied in preparing an opening AIFRSs balance sheet as at 1 July 2004 for the purposes of the transition to Australian Accounting Standards - AIFRSs as required by AASB 1. The impact of the transition from previous GAAP to AIFRSs is explained in Note 35.
Compliance with IFRSs
International Financial Reporting Standards ("IFRSs") form the basis of Australian Accounting Standards adopted by the AASB, being AIFRSs. The financial report of the Shire complies with IFRSs and interpretations adopted by the International Accounting Standards Board except as follows:
• AIFRSs include specific provisions relating to not-for-profit entities. These are not included in IFRSs.
• Australian Accounting Standard AAS27 "Financial Reporting by Local Governments" also applies and there is no equivalent standard in IFRSs.
The principal areas of non-compliance with IFRSs include:
• the recognition of non-reciprocal revenue;
• the definition of value in use for the purposes of estimating the recoverable amount of impaired assets; and
• the offsetting of asset revaluation increments and decrements on a class of asset basis rather than individual asset basis.
10
NOTES TO AND FORMING PART OF THE FINANCIAL REPORT
FOR THE YEAR ENDED 30TH JUNE 2006
1. SIGNIFICANT ACCOUNTING POLICIES (Continued)
(a) Basis of Preparation (Continued) Critical Accounting Estimates
The preparation of a financial report in conformity with Australian Accounting Standards requires management to make judgements, estimates and assumptions that effect the application of policies and reported amounts of assets and liabilities, income and expenses.
The estimates and associated assumptions are based on historical experience and various other factors that are believed to be reasonable under the circumstances. The results of this experience and other factors combine to form the basis of making judgements about carrying values of assets and liabilities not readily apparent from other sources. Actual results may differ from these estimates.
(b) The Local Government Reporting Entity All Funds through which the Council controls resources to carry on its functions have been included
in the financial statements forming part of this financial report. In the process of reporting on the local government as a single unit, all transactions and balances
between those funds (for example, loans and transfers between Funds) have been eliminated. All monies held in the Trust Fund are excluded from the financial statements, but a separate statement
of those monies appears at Note 19 to this financial report.
(c) Goods and Services Tax In accordance with recommended practice, revenues, expenses and assets capitalised are stated net
of any GST recoverable. Receivables and payables in the Balance Sheet are stated inclusive of applicable GST.
(d) Fixed Assets Property, plant and equipment and infrastructure assets are brought to account at cost or
independent or management valuation less, where applicable, any accumulated depreciation, amortisation or impairment losses.
The value of all infrastructure assets (other than land under roads) has been recorded in the Balance
Sheet. Land under roads are excluded from infrastructure in accordance with legislative requirements.

11
NOTES TO AND FORMING PART OF THE FINANCIAL REPORT
FOR THE YEAR ENDED 30TH JUNE 2006
1. SIGNIFICANT ACCOUNTING POLICIES (Continued)
(e) Inventories General Inventories are valued at the lower of cost and net realisable value. Land Held for Resale Land purchased for development and/or resale is valued at the lower of cost and net realisable value.
Cost includes the cost of acquisition, development and interest incurred on the financing of that land during its development. Interest and holding charges incurred after development is complete are recognised as expenses.
Revenue arising from the sale of property is recognised in the Income Statement as at the time of
signing a binding contract of sale.
(f) Depreciation of Non-Current Assets All non-current assets having a limited useful life are separately and systematically depreciated over
their useful lives in a manner which reflects the consumption of the future economic benefits embodied in those assets.
Depreciation is recognised on a straight-line basis, using rates which are reviewed each reporting
period. Major depreciation periods are: Buildings 50 to 100 years
Furniture and Equipment 10 years Plant and Equipment 5 to 15 years Sealed roads and streets
clearing and earthworks not depreciated construction/road base 50 years original surfacing and
major re-surfacing - bituminous seals 20 years
Gravel roads clearing and earthworks not depreciated
construction/road base 50 years gravel sheet 12 years Formed roads (unsealed)
clearing and earthworks not depreciated construction/road base 50 years Footpaths - slab 40 years
(g) Leases
Leases of fixed assets, where substantially all the risks and benefits incidental to the ownership of the asset, but not legal ownership, are transferred to the company, are classified as finance leases. Finance leases are capitalised recording an asset and a liability equal to the present value of the minimum lease payments, including any guaranteed residual value. Leased assets are amortised over their estimated useful lives. Lease payments are allocated between the reduction of the lease liability and the lease interest expense for the period.
Lease payments under operating leases, where substantially all the risks and benefits remain with the lessor, are charged as expenses in the periods in which they are incurred.

12
(h) Investments
All investments are valued at cost and interest on those investments is recognised when accrued.
(i) Impairment In accordance with Australian Accounting Standards the Shire's assets, other than inventories, are assessed at each reporting date to determine whether there is any indication they may be impaired.
Where such an indication exists, an estimate of the recoverable amount of the asset is made in
accordance with AASB 136 "Impairment of Assets" and appropriate adjustments made. An impairment loss is recognised whenever the carrying amount of an asset or its cash-generating
unit exceeds its recoverable amount. Impairment losses are recognised in the Income Statement.
(j) Joint Venture The municipality’s interest in a joint venture has been recognised in the financial statements by
including its share of any assets, liabilities, revenues and expenses of the joint venture within the relevant items reported in the Balance Sheet and Income Statement. Information about the joint venture is set out in Note 16.
(k) Employee Benefits The provisions for employee benefits relates to amounts expected to be paid for long service leave,
annual leave, wages and salaries and are calculated as follows:
(i) Wages, Salaries, Annual Leave and Long Service Leave (Short-term Benefits) The provision for employees’ benefits to wages, salaries, annual leave and long service leave expected
to be settled within 12 months represents the amount the municipality has a present obligation to pay resulting from employees services provided to balance date. The provision has been calculated at nominal amounts based on remuneration rates the Council expects to pay and includes related on-costs.
(ii) Annual Leave and Long Service Leave (Long-term Benefits) The provision for employees’ benefits for annual leave and long service leave expected to be settled
more than 12 months from the reporting date represents the present value of the estimated future cash outflows to be made by the employer resulting from the employees service to balance date.
(l) Rates, Grants, Donations and Other Contributions Rates, grants, donations and other contributions are recognised as revenues when the local
government obtains control over the assets comprising the contributions. Control over assets acquired from rates is obtained at the commencement of the rating period or, where earlier, upon receipt of the rates.
Where contributions recognised as revenues during the reporting period were obtained on the
condition that they be expended in a particular manner or used over a particular period, and those conditions were undischarged as at the reporting date, the nature of and amounts pertaining to those undischarged conditions are disclosed in Note 2(c). That note also discloses the amount of contributions recognised as revenues in a previous reporting period which were obtained in respect of the local government's operation for the current reporting period.
NOTES TO AND FORMING PART OF THE FINANCIAL REPORT
FOR THE YEAR ENDED 30TH JUNE 2006
1. SIGNIFICANT ACCOUNTING POLICIES (Continued)

13
(m) Superannuation The Shire of Wyndham East Kimberley contributes to the Local Government Superannuation Scheme
and the Occupational Superannuation Fund. Both funds are defined contribution schemes.
(n) Interest Rate Risk The Shire's exposure to interest rate risk, which is the risk that a financial instrument's value will
fluctuate as a result of changes in market interest rates, is considered negligible for all financial instruments other than borrowings. Information on interest rate risk as it applies to borrowings is disclosed in Note 21(e).
(o) Credit Risk The maximum exposure to credit risk, excluding the value of any collateral or other security, at
balance date to recognised financial assets is the carrying amount, net of any provisions for doubtful debts, as disclosed in the balance sheet and notes to and forming part of the financial report. The Shire does not have any material credit risk exposure to any single debtor or group of debtors under
(p) Fair Value The fair value of assets and liabilities approximate their carrying values. No financial assets and
financial liabilities are readily traded on organised markets in standardised form. Financial assets where the carrying amount exceeds fair value have not been written down as the Council intends to hold these assets to maturity.
The aggregate fair value and carrying amounts of financial assets and financial liabilities are disclosed
in the balance sheet and in the notes to and forming part of the financial report.
(q) Rounding Off Figures All figures shown in this annual financial report, other than a rate in the dollar, are rounded to the
nearest dollar.
(r) Comparative Figures
Where required, comparative figures have been adjusted to conform with changes in presentation for the current financial year.
NOTES TO AND FORMING PART OF THE FINANCIAL REPORT
FOR THE YEAR ENDED 30TH JUNE 2006
1. SIGNIFICANT ACCOUNTING POLICIES (Continued)

14
2. REVENUES AND EXPENSES 2006 2005 $ $ (a) Result from Ordinary Activities
The Result from Ordinary Activities includes:
(i) Charging as an Expense: Auditors Remuneration - Audit 15,649 15,629
- Other Services 3,000 1,248 Depreciation
Buildings 464,861 483,536 Furniture and Equipment 83,059 82,234 Plant and Equipment 387,117 386,766 Roads 1,316,137 1,268,620 Footpaths 33,874 33,384 Drainage 105,813 103,141 Parks and Ovals 69,117 58,530 Other 59,807 43,062 2,519,785 2,459,273
Interest Expenses Debentures (refer Note 21(a)) 62,444 100,947
62,444 100,947
(ii) Crediting as Revenue: 2006 2006 2005
$ Budget $ $ Interest Earnings
Investments - Reserve Funds 158,454 130,000 150,037
- Other Funds 80,668 70,000 55,157 Other Interest Revenue (refer note 26) 36,968 17,000 51,102 276,090 217,000 256,296
NOTES TO AND FORMING PART OF THE FINANCIAL REPORT
FOR THE YEAR ENDED 30TH JUNE 2006

15
2 REVENUES AND EXPENSES (Continued)
(b) Statement of Objective In order to discharge its responsibilities to the community, the Shire has developed a set of operational
and financial objectives. These objectives have been established both on an overall basis and for each of its broad activities/programs.
Council operations as disclosed in this budget encompass the following service orientated activities/
programs: GENERAL PURPOSE FUNDING Rates, general purpose government grants and interest revenue GOVERNANCE Administration and operation of facilities and services to members of Council; other costs that relate to
the tasks of assisting elected members and ratepayers on matters which do not concern specific council services
LAW, ORDER, PUBLIC SAFETY Supervision of various by-laws, fire prevention, emergency services and animal control HEALTH Food quality and pest control, immunisation services, inspection of abattoir and operation of child
health clinic EDUCATION AND WELFARE Operation of senior citizen's centre, day care centres and pre-school facilities; assistance to playgroups,
retirement villages and other voluntary services HOUSING Provision of staff and residential housing Rubbish Collection services, operation of tips, noise control, administration of the town planning
scheme, maintenance of cemeteries, maintenance of rest centre and storm water drainage maintenance
RECREATION AND CULTURE Maintenance of halls, aquatic centres, recreation centres and various reserves; operation of library and
community development services TRANSPORT Construction and maintenance of streets, roads, bridges; cleaning and lighting of streets, traffic lights;
depot maintenance. ECONOMIC SERVICES The regulation and provision of tourism, area promotion, building control, noxious weeds and vermin
control. OTHER PROPERTY & SERVICES Private works operation, plant repairs, operations and administrative costs AIRPORTS The provision and operation of airport services
COMMUNITY AMENITIES
NOTES TO AND FORMING PART OF THE FINANCIAL REPORT
FOR THE YEAR ENDED 30TH JUNE 2006

16
2006 2005 $ $ (c) Conditions Over Contributions
Grants recognised as revenues in a previous reporting period which were not expended at the close of the previous reporting period (ie opening balances).
Roads to Recovery (Transport) 532,577 0
Youth Centre Funding (Recreation and Culture) 600,000 0 Sustainable Regions Grant (Transport) 88,887 0
1,221,464 0
Add: New grants which were recognised as revenues during the reporting period and which had not yet been fully expended by the contributor.
Roads to Recovery (Transport) 647,900 532,577
Youth Centre Funding (Recreation and Culture) 550,000 600,000 Sustainable Regions Grant (Transport) 0 88,887 Ord Catchment NRM (Enviro Officer) 125,260 0
1,323,160 1,221,464
Less: Grants which were recognised as revenues in a previous reporting period and which were expended in the current reporting period in the manner specified by the contributor.
Roads to Recovery (Transport) 532,577 0
Sustainable Regions Grant (Transport) 62,587 0
595,164 0
Closing balances of unexpended grants 1,949,460 1,221,464 Comprises:
Roads to Recovery (Transport) 647,900 532,577
Youth Centre Funding (Recreation and Culture) 1,150,000 600,000 Sustainable Regions Grant (Transport) 26,300 88,887 Ord Catchment NRM (Enviro Officer) 125,260 0 1,949,460 1,221,464
NOTES TO AND FORMING PART OF THE FINANCIAL REPORT
FOR THE YEAR ENDED 30TH JUNE 2006
2 REVENUES AND EXPENSES (Continued)

17
3. CASH AND CASH EQUIVALENTS Municipal 2,750,251 784,450
Reserves 2,688,690 2,991,156
5,438,941, 3,775,606
Municipal
Unrestricted 753,787 (437,014)
Restricted
Unspent Grants (note 2(c)) 1,949,460 1,221,464
Unspent Loans (note 21(c)) 47,004 0
1,996,464 1,221,464
2,750,251 784,450
The following restrictions have been imposed by regulations or other externally imposed requirements:
Waste Management 103,391 240,931
Airport General 1,782,187 1,756,490
Plant and Equipment 338,285 321,267
Tourism Infrastructure 4,914 4,667
Recreation Participation 15,164 14,401
Leisure Centre 55,221 52,443
Parking 125,274 185,084
Non-Portable Water 59,860 56,849
East Kimberely Tourism 56,512 44,604
Foreshore Reserve 18,081 11,753
Information Technology 7,221 30,600
Staff Entitlement 75,885 72,067
Staff Housing 15,595 200,000
Recreation Hardcourts 31,100 0
2,688,690 2,991,156
NOTES TO AND FORMING PART OF THE FINANCIAL REPORT
FOR THE YEAR ENDED 30TH JUNE 2006

18
4. TRADE AND OTHER RECEIVABLES Current Rates Outstanding 206,371 333,137
Sundry Debtors 963,073 740,484 Less Provision for Doubtful Debts (220,245) (220,245) GST Receivable 80,763 131,395 Loans - Clubs/Institutions 47,620 40,400 Accrued Income 0 30,712 Bonds and Prepayments 48,352 255,145
1,125,934 1,311,028
Non-Current
Loans - Clubs/Institutions 52,175 101,088 Kimberley Tourism Association 0 40,155 Deferred Pensioner Rebates 20,789 18,938 72,964 160,181
INVENTORIES
5. Current Fuel 9,669 12,975
9,669 12,975
NOTES TO AND FORMING PART OF THE FINANCIAL REPORT
FOR THE YEAR ENDED 30TH JUNE 2006
19
NOTES TO AND FORMING PART OF THE FINANCIAL REPORT
FOR THE YEAR ENDED 30TH JUNE 2006
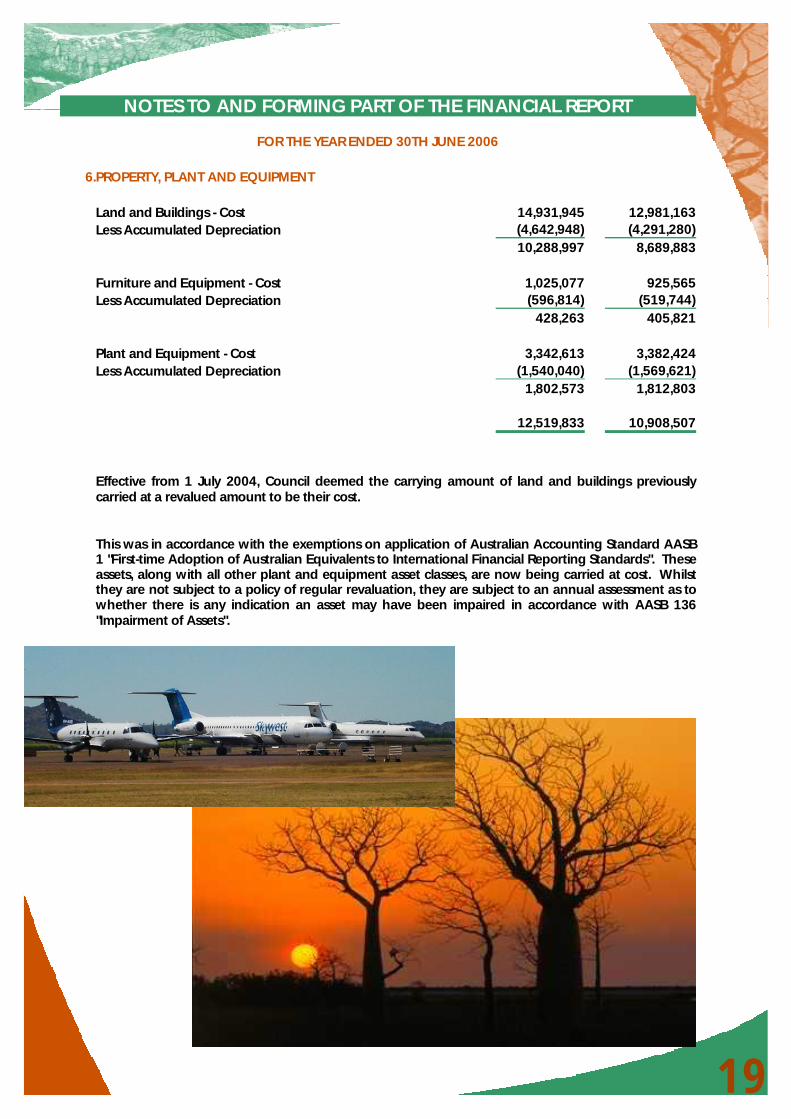
6. PROPERTY, PLANT AND EQUIPMENT 14,931,945 12,981,163 Less Accumulated Depreciation (4,642,948) (4,291,280)
10,288,997 8,689,883 Furniture and Equipment - Cost 1,025,077 925,565 Less Accumulated Depreciation (596,814) (519,744) 428,263 405,821 Plant and Equipment - Cost 3,342,613 3,382,424 Less Accumulated Depreciation (1,540,040) (1,569,621) 1,802,573 1,812,803 12,519,833 10,908,507
Effective from 1 July 2004, Council deemed the carrying amount of land and buildings previously carried at a revalued amount to be their cost.
This was in accordance with the exemptions on application of Australian Accounting Standard AASB 1 "First-time Adoption of Australian Equivalents to International Financial Reporting Standards". These assets, along with all other plant and equipment asset classes, are now being carried at cost. Whilst they are not subject to a policy of regular revaluation, they are subject to an annual assessment as to whether there is any indication an asset may have been impaired in accordance with AASB 136 "Impairment of Assets".
Land and Buildings - Cost

20
NO
TES
TO A
ND
FO
RMIN
G P
AR
T O
F TH
E FI
NA
NC
IAL
REPO
RT
FOR
TH
E YE
AR
END
ED
30
TH J
UN
E 2
00
6
6. P
RO
PERT
Y, P
LAN
T A
ND
EQ
UIP
MEN
T (C
on
tinu
ed)
M
ove
men
ts in
Car
ryin
g A
mo
un
ts
Th
e fo
llow
ing
rep
rese
nts
th
e m
ove
men
t in
th
e ca
rryi
ng
am
ou
nts
of e
ach
cla
ss o
f pro
per
ty, p
lan
t an
d e
qu
ipm
ent
bet
wee
n th
e
beg
inn
ing
an
d t
he
end
of t
he
curr
ent
finan
cial
yea
r.
Lan
d
Fu
rnitu
re
Pl
ant
&
&
&
Bu
ildin
gs
E
qu
ipm
ent
E
qu
ipm
ent
Tota
l
$
$
$
$
Bal
ance
as
at 1
July
20
05
8,6
89
,88
3
4
05
,82
1
1
,81
2,8
03
1
0,9
08
,50
7
Ad
diti
on
s
2,1
74
,13
0
1
07
,18
4
5
50
,69
3
2,8
32
,00
7
(Dis
po
sals
) (1
09
,36
5)
(2
,47
3)
(1
73
,80
6)
(28
5,6
44
)
Reva
luat
ion
- In
crem
ents
0
- (D
ecre
men
ts)
0
Imp
airm
ent -
(lo
sses
)
0
- r
ever
sals
0
Dep
reci
atio
n (
Exp
ense
)
(46
5,6
51
)
(82
,26
9)
(3
87
,11
7)
(93
5,0
37
)
0
Bala
nce
as
at 3
0 Ju
ne
200
6
10
,28
8,9
97
42
8,2
63
1,8
02
,57
3
12
,51
9,8
33
Oth
er M
ove
men
ts

21
NOTES TO AND FORMING PART OF THE FINANCIAL REPORT
FOR THE YEAR ENDED 30TH JUNE 2006
7. INFRASTRUCTURE 2006 2005 $ $
7. INFRASTRUCTURE Roads - Cost 41,144,498 39,672,490
Less Accumulated Depreciation (10,032,413) (8,716,277) 31,112,085 30,956,213 Footpaths - Cost 733,260 667,644 Less Accumulated Depreciation (234,079) (200,206) 499,181 467,438 Drainage - Cost 1,061,616 1,061,023 Less Accumulated Depreciation (895,174) (789,362) 166,442 271,661 Parks & Ovals - Cost 1,328,583 1,303,842 Less Accumulated Depreciation (366,798) (297,682) 961,785 1,006,160 Other Infrastructure - Cost 710,823 357,452 Less Accumulated Depreciation (291,224) (231,417) 419,599 126,035
33,159,092 32,827,507
All infrastructure asset classes, are carried at cost. Whilst they are not subject to a policy of regular revaluation, they are subject to an annual assessment as to wether there is any indication an asset may have been impaired in accordance with AASB 136 "Impairment of Assets".

22
7. IN
FRA
STRU
CTU
RE
(Co
ntin
ued
)
Mo
vem
ents
in C
arry
ing
Am
ou
nts
Park
s
and
Oth
er
R
oad
s
Foo
tpat
hs
D
rain
age
O
vals
Infr
astr
uct
ure
Tota
l
$
$
$
$
$
$
B
alan
ce a
s at
1Ju
ly 2
005
30
,95
6,2
13
46
7,4
38
27
1,6
61
1,0
06
,16
0
1
26
,03
5
3
2,8
27
,50
7
Ad
diti
on
s
1,4
72
,00
8
6
5,6
17
59
4
2
4,7
42
35
3,3
71
1,9
16
,33
2
(Dis
po
sals
)
0
0
0
0
0
0
Reva
luat
ion
- In
crem
ents
0
0
0
0
0
0
- (
Dec
rem
ents
)
0
0
0
0
0
0
Imp
airm
ent -
(lo
sses
)
0
0
0
0
0
0
- r
ever
sals
0
0
0
0
0
0
Dep
reci
atio
n (
Exp
ense
)
(1,3
16
,13
6)
(3
3,8
74
)
(10
5,8
13
)
(69
,11
7)
(5
9,8
07
)
(1,5
84
,74
7)
Oth
er M
ove
men
ts
0
0
0
0
0
0
Bala
nce
as
at 3
0 Ju
ne
200
6
3
1,1
12
,08
5
4
99
,18
1
1
66
,44
2
9
61
,78
5
4
19
,59
9
3
3,1
59
,09
2
The
follo
win
g r
epre
sen
ts t
he
mo
vem
ent
in t
he
carr
yin
g a
mo
un
ts o
f ea
ch c
lass
of
infr
astr
uct
ure
bet
wee
n t
he
beg
inn
ing
an
d t
he
end
of
the
curr
ent
fin
anci
al y
ear.
NO
TES
TO A
ND
FO
RMIN
G P
AR
T O
F TH
E FI
NA
NC
IAL
REPO
RT
FOR
TH
E YE
AR
END
ED
30
TH J
UN
E 2
00
6

23
NOTES TO AND FORMING PART OF THE FINANCIAL REPORT
FOR THE YEAR ENDED 30TH JUNE 2006
8. TRADE AND OTHER PAYABLES Current Sundry Creditors 845,992 749,832
Accrued Expenses 140,267 196,463 Sundry Creditors - ATO 70,626 73,769 Accrued Interest on Loans 0 30,542 Accrued Salaries and Wages 83,430 52,224 Retentions 61,280 79,183 1,201,595 1,182,013
9. LONG-TERM BORROWINGS
Current Secured by Floating Charge Debentures 157,020 152,373
157,020 152,373
Non-Current
Secured by Floating Charge Debentures 2,176,453 1,393,672
2,176,453 1,393,672
Additional detail on borrowings is provided in Note 21.
10. PROVISIONS Current Provision for Annual Leave 153,798 152,076
Provision for RDO 7,280 8,519 Provision for Long Service Leave 19,783 16,889 180,861 177,484
Non-Current Provision for Annual Leave 30,844 45,366
Provision for Long Service Leave 192,159 171,844 223,003 217,210

24
11. RESERVES - CASH BACKED 2006 2006 2005 $ Budget $ $ (a) Waste Management
Opening Balance 240,931 378,454 300,500 Amount Set Aside / Transfer to Reserve 12,763 11,500 14,474 Amount Used / Transfer from Reserve (150,303) (54,600) (74,043) 103,391 335,354 240,931
(b) Airport General Opening Balance 1,756,490 1,825,460 1,813,564 Amount Set Aside / Transfer to Reserve 275,565 536,700 87,357 Amount Used / Transfer from Reserve (249,868) (158,500) (144,431) 1,782,187 2,203,660 1,756,490
(c) Plant and Equipment Opening Balance 321,267 320,641 306,503
Amount Set Aside / Transfer to Reserve 17,018 11,400 14,764 Amount Used / Transfer from Reserve 0 0 0
338,285 332,041 321,267
(d) Tourism Infrastructure Opening Balance 4,667 4,657 4,452 Amount Set Aside / Transfer to Reserve 247 200 215 Amount Used / Transfer from Reserve 0 0 0
4,914 4,857 4,667
(e) Recreation Participation Opening Balance 14,401 14,373 13,739
Amount Set Aside / Transfer to Reserve 763 500 662 Amount Used / Transfer from Reserve 0 0 0
15,164 14,873 14,401
(f) Leisure Centre Opening Balance 52,443 52,341 50,033
Amount Set Aside / Transfer to Reserve 2,778 1,900 2,410 Amount Used / Transfer from Reserve 0 0 0
55,221 54,241 52,443
(g) Parking Opening Balance 185,084 259,581 248,135
Amount Set Aside / Transfer to Reserve 9,805 9,200 61,699 Amount Used / Transfer from Reserve (69,615) 0 (124,750)
125,274 268,781 185,084
(h) Non-Potable Water Opening Balance 56,849 56,738 54,236
Amount Set Aside / Transfer to Reserve 3,011 2,000 2,613 Amount Used / Transfer from Reserve 0 0 0
59,860 58,738 56,849
NOTES TO AND FORMING PART OF THE FINANCIAL REPORT
FOR THE YEAR ENDED 30TH JUNE 2006

25
NOTES TO AND FORMING PART OF THE FINANCIAL REPORT
FOR THE YEAR ENDED 30TH JUNE 2006
(i) Kununurra Preschool Opening Balance 0 0 6,345 Amount Set Aside / Transfer to Reserve 0 0 306 Amount Used / Transfer from Reserve 0 0 (6,651) 0 0 0
(j) Civic Buildings
Opening Balance 0 0 0 Amount Set Aside / Transfer to Reserve 0 301,800 0 Amount Used / Transfer from Reserve 0 (250,000) 0 0 51,800 0
(k) East Kimberley Tourism Opening Balance 44,604 44,517 42,554 Amount Set Aside / Transfer to Reserve 11,908 1,600 2,050 Amount Used / Transfer from Reserve 0 0 0
56,512 46,117 44,604
(l) Staff Entitlements/Housing Opening Balance 0 0 274,750 Amount Set Aside / Transfer to Reserve 0 0 13,235 Amount Used / Transfer from Reserve 0 0 (287,985) 0 0 0
(m) Foreshore Reservation
Opening Balance 11,753 12,295 0 Amount Set Aside / Transfer to Reserve 6,328 12,600 11,753 Amount Used / Transfer from Reserve 0 0 0 18,081 24,895 11,753
(n) Public Open Space Opening Balance 0 0 0
Amount Set Aside / Transfer to Reserve 0 310,600 0 Amount Used / Transfer from Reserve 0 0 0 0 310,600 0
(o) Information Technology Opening Balance 30,600 32,011 0
Amount Set Aside / Transfer to Reserve 1,621 200 30,600 Amount Used / Transfer from Reserve (25,000) (25,000) 0 7,221 7,211 30,600
11. RESERVES - CASH BACKED (continued) 2006 2006 2005 $ Budget $ $
(p) Staff Entitlement Opening Balance 72,067 86,567 0
Amount Set Aside / Transfer to Reserve 3,818 1,600 72,067 Amount Used / Transfer from Reserve 0 (40,800) 0 75,885 47,367 72,067
(q) Staff Housing Opening Balance 200,000 200,856 0
Amount Set Aside / Transfer to Reserve 15,595 0 200,000 Amount Used / Transfer from Reserve (200,000) (200,000) 0 15,595 856 200,000

26
NOTES TO AND FORMING PART OF THE FINANCIAL REPORT
FOR THE YEAR ENDED 30TH JUNE 2006
(r) Recreation Hard courts Opening Balance 0 0 0
Amount Set Aside / Transfer to Reserve 31,100 31,100 0 Amount Used / Transfer from Reserve 0 0 0 31,100 31,100 0 TOTAL CASH BACKED RESERVES 2,688,690 3,792,491 2,991,156 All of the cash backed reserve accounts are supported by money held in financial institutions and match the amount shown as restricted cash in Note 3 to this financial report.
In accordance with council resolutions in relation to each reserve account, the purpose for which the
reserves are set aside are as follows:
11. RESERVES - CASH BACKED (continued) 2006 2006 2005 $ Budget $ $
Waste Management Reserve This reserve is for the upgrade and rationalisation of refuse disposal facilities within the Shire. Airport General Reserve
This reserve is for the improvement of Council's airport facilities, and also acts as the 'float' for transferring the profit or loss on the operations of the airports in line with Council Policy F4.
Plant and Equipment Reserve This reserve is for the purchase of major plant and equipment. Tourism Infrastructure Reserve This reserve is for infrastructure projects intended to improve the attractiveness of the Shire to visitors. Recreation Participation Reserve
This reserve is for projects that encourage and increase in recreation participation for the residents of the Shire.
Leisure Centre Reserve This reserve is for the capital maintenance and upgrading of the Kununurra Leisure Centre. Parking Reserve
This reserve is for land purchases and/or the construction and maintenance of vehicle parking facilities within the Shire.
Non-Potable Water Reserve This reserve is for the development of non-potable water supply in Wyndham. Kununurra Preschool Reserve This reserve is for the maintenance of the Kununurra Pre-School building. Civic Building Reserve This reserve is for the construction and/or capital maintenance of Civic Buildings within the Shire. East Kimberley Tourism Reserve This reserve is for the capital maintenance and/or upgrading of East Kimberley Tourism House.

27
NOTES TO AND FORMING PART OF THE FINANCIAL REPORT
FOR THE YEAR ENDED 30TH JUNE 2006 11. RESERVES - CASH BACKED (continued)
Staff Entitlements/Housing Reserve This reserve is for the Shire employee's entitlements and housing. Foreshore Reserve This reserve is for maintaining the foreshore of Lake Kununurra, funded from the contributions of
leases on portion of reserve 41812. Public Open Space Reserve This reserve is for the purpose of maintaining and developing Public Open Space within the
townsites of Kununurra and Wyndham. Information Technology Replacement Staff Entitlement This reserve is to provide for Shire employee entitlements. Staff Housing This reserve is for the purpose of providing for staff housing requirements. Recreation Hardcourts This reserve is fir the purpose of providing for future capital upgrade of Recreational Hardcourts The Waste Management Reserve, Airport General Reserve, Plant and Equipment Reserve, Tourism
Infrastructure Reserve, Recreation Participation Reserve, Leisure Centre Reserve, Parking Reserve, Non-Potable Water Reserve, Kununurra Pre-School Reserve, Civic Building Reserve, East Kimberley Tourism Reserve, Staff Entitlements/Housing Reserve, Foreshore Reserve, Public Open Space, Information Technology Replacement are not expected to be used technology Replacement, Staff entitlement, Staff Housing and Recreation hardcourts are not expected to be used within a set period as further transfers to the reserve accounts are expected as funds are utilised.
This reserve is for the purpose of replacing the shire's information technology network, communication equipment, hardware and software.
12. RESERVES - ASSET REVALUATION
The Shire of Wyndham East Kimberley did not perform an asset revaluation for the financial period 2005/2006 and no asset revaluation reserve exists.
13. NOTES TO THE CASH FLOW STATEMENT
(a) Reconciliation of Cash
For the purposes of the statement of cash flows, cash includes cash on hand and in banks and investments, net of outstanding bank overdrafts. Cash at the end of the reporting period is reconciled to the related items in the statement of financial position as follows:

28
NOTES TO AND FORMING PART OF THE FINANCIAL REPORT
FOR THE YEAR ENDED 30TH JUNE 2006
13. NOTES TO THE CASH FLOW STATEMENT (continued) 2006 2006 2005 $ Budget $ $ Cash and Cash Equivalents 5,438,941 3,712,245 3,775,606
(b) Reconciliation of Net Cash Provided By
Operating Activities to Net Result Net Result 2,514,450 4,543,040 927,105
Depreciation 2,519,785 2,576,000 2,459,273 (Increase)/Decrease in Receivables 159,188 (27,665) 327,184 (Profit)/Loss on Sale of Asset (331,389) (922,990) (62,357) (Increase)/Decrease in Inventories 3,306 0 (5,292) Increase/(Decrease) in Payables 19,582 87,480 (212,370) Increase/(Decrease) in GST 51,632 0 5,713 Increase / (Decrease) in Interest 19,794 0 25,075 Increase/(Decrease) in Employee Provisions 9,170 80,289 (29,174) Grants/Contributions for
the Development of Assets (2,816,283) (4,406,200) (1,179,702) Net Cash from Operating Activities 2,149,235 1,929,954 2,255,455
(c) Undrawn Borrowing Facilities Credit Standby Arrangements Bank Overdraft limit 1,000,000 1,000,000
Bank Overdraft at Balance Date 0 0 Credit Card limit 9,000 5,000 Credit Card Balance at Balance Date 0 0 Total Amount of Credit Unused 1,009,000 1,005,000
Loan Facilities
Loan Facilities - Current 157,020 152,373 Loan Facilities - Non-Current 2,176,453 1,393,672 Total Facilities in Use at Balance Date 2,333,473 1,546,045
Unused Loan Facilities at Balance Date 47,004 0

29
NOTES TO AND FORMING PART OF THE FINANCIAL REPORT
FOR THE YEAR ENDED 30TH JUNE 2006
15. CONTINGENT LIABILITIES
The Shire of Wyndham East Kimberley has no Contingent Liabilities for the 2005/2006 financial year.
16. JOINT VENTURE The Shire of Wyndham East Kimberley was not involved in any Joint Ventures in the 2005/2006
financial year.
17. TOTAL ASSETS CLASSIFIED BY FUNCTION AND ACTIVITY 2006 2005 $ $ Governance 10,879 10,080
Law, Order, Public Safety 215,169 202,586 Health 57,643 81,052 Education and Welfare 1,249,666 281,503 Housing 1,013,714 1,116,624 Community Amenities 256,197 280,365 Recreation and Culture 4,690,310 4,630,610 Transport 33,760,005 34,599,974 Economic Services 478,036 464,386 Other Property and Services 3,947,308 2,689,715 Unallocated 6,654,188 4,645,591
52,333,116 49,002,486
14. CAPITAL AND LEASING COMMITMENTS
The Shire of Wyndham East Kimberley has no significant nor material leasing commitments for the ended 30th June 2006.
(a) Capital Expenditure Commitments 2006 2005 $ $ Contracted For:
Kununurra Child Care 989,919 0 Kununurra Youth Centre 1,812,166 0 2,802,085 0 Payable:
not later than 1 year Kununurra Child Care 989,919 0
Kununurra Youth Centre 750,000 0 1,739,919 0 The capital expenditure projects outstanding at the end of the current reporting period represents the construction of the new Kununurra Child Care Centre and the new Kununurra Youth Centre.

30
NOTES TO AND FORMING PART OF THE FINANCIAL REPORT
FOR THE YEAR ENDED 30TH JUNE 2006
2006 2005 2004
18. FINANCIAL RATIOS
Current Ratio 1.336 0.616 1.115
Untied Cash to Trade Creditors Ratio 0.764 0.000 2.553
Debt Ratio 0.075 0.031 0.073
Debt Service Ratio 0.019 0.023 0.026
Gross Debt to Revenue Ratio 0.126 0.124 0.143
Gross Debt to
Economically Realisable Assets Ratio 0.122 0.294 0.338
Rate Coverage Ratio 0.255 0.262 0.288
Outstanding Rates Ratio 0.058 0.102 0.209
The above rates are calculated as follows:
Current Ratio Current assets minus restricted current assets
Current liabilities minus liabilities associated with restricted assets
Untied Cash to Trade Creditors Ratio Untied cash
Unpaid trade creditors
Debt Ratio Total assets
Debt Service Ratio Debt Service Cost (Principal & Interest)
Available operating revenue
Gross Debt to Revenue Ratio
Total revenue
Gross Debt to Gross debt
Economically Realisable Assets Ratio Economically realisable assets
Rate Coverage Ratio Net rate revenue
Operating revenue
Outstanding Rates Ratio
Rates collectable
Rates outstanding
Gross debt
Total liabilities

31
NOTES TO AND FORMING PART OF THE FINANCIAL REPORT
FOR THE YEAR ENDED 30TH JUNE 2006 19. TRUST FUNDS
Funds held at balance date over which the Municipality has no control and which are not included in the financial statements are as follows: Balance Amounts Amounts Balance
1-Jul-05 Received Paid 30-Jun-06 $ $ ($) $ House Bond - Ossie Henry 260 0 0 260
ASIC - Airport Security Card 0 1,600 0 1,600 260 1,860
20. DISPOSALS OF ASSETS - 2005/06 FINANCIAL YEAR The following assets were disposed of during the year. Net Book Value Sale Price Profit (Loss)
Actual Budget Actual Budget Actual Budget $ $ $ $ $ $ Hilux - Knx retic 7,640 9,400 10,454 13,800 2,814 4,400
Hilux - WY10357 11,640 0 0 0 (11,640) 0 Holden Utility - Airport 8,643 10,600 12,727 13,300 4,084 2,700 Holden Utility - WY 10354 13,154 0 0 0 (13,154) 0 Hilux Utility - Knx Depot 8,075 10,200 10,909 16,900 2,834 6,700 Hilux Utility - WY10427 12,759 0 0 0 (12,759) 0 Hilux Utility - 1BGT779 6,405 8,400 8,636 11,300 2,231 2,900 Hilux Utility - 1BOC881 12,112 0 11,818 0 (294) 0 Toyota Dual Cab - 1AYI056 2,057 3,600 14,500 13,300 12,443 9,700 Hilux - Dual Cab 1BOC882 14,973 17,900 19,091 20,300 4,118 2,400 Landcruiser - WY101 23,947 36,700 29,545 40,100 5,598 3,400 Toyota 4x4 - 1BPT319 16,668 19,700 19,091 21,400 2,423 1,700 Ride on Mower - WY9412 0 0 6,364 0 6,364 0 Hilux Dual Cab - WY9821 1,024 2,600 13,646 13,300 12,622 10,700 Hilux 4x4 - WY10406 8,415 8,100 11,818 11,300 3,403 3,200 Hilux S/CAB 10,139 0 0 0 (10,139) 0 Hilux 4x4 - WY10405 16,155 0 0 0 (16,155) 0 Kodak i60 -Copier Scanner 2,473 0 0 0 (2,473) 0 Cannon - Laser Printer 0 0 0 0 0 0 3 Kwinana St Wyndham 7,868 8,000 61,445 65,000 53,577 57,000 11 Kwinana St Wyndham 19,667 9,910 78,018 85,000 58,351 75,090 17 Beefwood St Knx 61,033 60,000 308,970 340,000 247,937 280,000 Lot 1064 Carbeen St - Knx 3,104 0 0 0 (3,104) 0 14 Kwinana St - Wyndham 17,693 0 0 0 (17,693) 0 33 Koojarra St - Wyndham 0 12,100 0 75,000 0 62,900 POS Reserve 0 0 0 300,000 0 300,000 3 Ton Truck - WY9719 0 22,400 0 20,000 0 (2,400) Bomg Roller - WY9372 0 15,700 0 10,000 0 (5,700) 0 0
285,644 255,310 617,032 1,070,000 331,388 814,690

32
NO
TES
TO A
ND
FO
RMIN
G P
AR
T O
F TH
E FI
NA
NC
IAL
REPO
RT
FOR
TH
E YE
AR
END
ED
30
TH J
UN
E 2
00
6
21
. INFO
RM
ATI
ON
ON
BO
RRO
WIN
GS
(a)
Deb
entu
re R
epay
men
ts
Pr
inci
pal
N
ew
Prin
cip
al
Prin
cip
al
Inte
rest
1-J
ul-0
5
Loan
s R
epay
men
ts
30
-Ju
n-0
6
Rep
aym
ents
$
$
Act
ual
B
ud
get
A
ctu
al
Bu
dg
et
Act
ual
(**
) B
ud
get
Part
icu
lars
$
$
$
$
$
$
W
elfa
re a
nd
Ed
uca
tion
L1
17
Ku
nu
nu
rra
Ch
ildca
re C
entr
e
9
50
,00
0
0
13
,80
0
95
0,0
00
9
36
,20
0
0
6,5
00
Ho
usi
ng
L1
15
Staf
f Ho
usi
ng
14
9,7
15
7
,39
3
7,3
00
1
42
,32
2
14
2,4
15
6
,00
8
9,2
00
Rec
reat
ion
an
d C
ultu
re
*L1
09
Ord
Riv
er S
po
rts
Clu
b
4
7,4
62
1
8,0
51
1
7,8
00
2
9,4
11
2
9,6
62
1
,96
6
3,1
00
L1
11
KN
X H
isto
rica
l So
ciet
y
13
,36
1
13
,36
1
13
,20
0
0
16
1
37
8
70
0
L11
3 K
NX
Aq
uat
ic C
entr
e R
efu
rbis
hm
ent
8
36
,53
4
41
,31
1
40
,90
0
79
5,2
23
7
95
,63
4
33
,57
1
51
,10
0
L11
4 W
ynd
ham
Rec
reat
ion
Cen
tre
3
50
,89
5
17
,32
8
17
,20
0
33
3,5
67
3
33
,69
5
14
,80
2
21
,50
0
Tr
ansp
ort
L1
12
Park
ing
Lan
d
2
5,0
51
2
5,0
51
2
4,7
00
0
3
51
7
09
1
,40
0
E
con
om
ic S
ervi
ces
*L1
04
Tou
rism
Ho
use
41
,77
4
11
,08
0
11
,00
0
30
,69
4
30
,77
4
1,1
48
2
,30
0
*L1
16
Ag
ricu
ltura
l So
ciet
y C
arav
an P
ark
2
8,8
71
1
2,5
62
2
,30
0
16
,30
9
26
,57
1
1,2
12
1
,70
0
O
ther
Pro
per
ty a
nd
Ser
vice
s
L9
6 K
NX
Dep
ot
5
2,3
83
1
6,4
35
1
6,0
00
3
5,9
47
3
6,3
83
2
,65
0
3,3
00
1,5
46
,04
6
95
0,0
00
1
62
,57
2
16
4,2
00
2
,33
3,4
73
2
,33
1,8
46
6
2,4
44
1
00
,80
0
(*)
Sel
f su
pp
ort
ing
loan
fin
ance
d b
y p
aym
ents
fro
m th
ird
par
ties.
All
oth
er lo
an r
epay
men
ts w
ere
finan
ced
by
gen
eral
pu
rpo
se r
even
ue.
(
**)
Acc
rual
s n
ot
use
d in
200
5/2
00
6 fo
r in
tere
st r
epay
men
ts.
(b)
New
Deb
entu
res
- 20
05/0
6
Am
ou
nt
Bo
rro
wed
In
stitu
tion
Lo
an
Term
To
tal
Inte
rest
A
mo
un
t Use
d
Bal
ance
Ty
pe
(Yea
rs)
Inte
rest
&
Rat
e
U
nsp
ent
A
ctu
al
Bu
dg
et
C
har
ges
%
A
ctu
al
Bu
dg
et
$
Pa
rtic
ula
rs/P
urp
ose
$
$
$
$
$
L1
17
Ku
nu
nu
rra
Ch
ildca
re C
entr
e
95
0,0
00
9
50
,00
0
WA
TC
Deb
ten
ture
2
0
68
0,3
31
5
.91
9
50
,00
0
95
0,0
00
0

33
NO
TES
TO A
ND
FO
RMIN
G P
AR
T O
F TH
E FI
NA
NC
IAL
REPO
RT
FOR
TH
E YE
AR
END
ED
30
TH J
UN
E 2
00
6
21
. INFO
RM
ATI
ON
ON
BO
RRO
WIN
GS
(Co
ntin
ued
)
(c
) Un
spen
t D
eben
ture
s
D
ate
Bal
ance
B
orr
ow
ed
Exp
end
ed
Bal
ance
B
orr
ow
ed
1-J
ul-0
5
Du
rin
g
Du
rin
g
30
-Ju
n-2
00
6
$
Ye
ar
Year
$
Part
icu
lars
$
$
L11
7 K
un
un
urr
a C
hild
care
Cen
tre
1/1
7/2
00
6
0
95
0,0
00
9
02
,99
6
47
,00
4
9
50
,00
0
90
2,9
96
4
7,0
04
(d)
Ove
rdra
ft
C
ou
nci
l est
ablis
hed
an
ove
rdra
ft f
acili
ty o
f $
1,0
00
,00
0 in
20
05
/200
6 to
ass
ist
with
sh
ort
ter
m l
iqu
idity
req
uire
men
ts. T
he
bal
ance
of
the
ban
k o
ver-
dra
ft a
t 1
Ju
ly 2
005
an
d 3
0 Ju
ne
200
6 w
as $
Nil.
(e)
Inte
rest
Rat
e R
isk
2
00
6
2
00
5
B
orr
ow
ing
s
$
$
Flo
atin
g in
tere
st r
ates
0
0
Fixe
d in
tere
st r
ate
mat
uri
ng
-
with
in o
ne
year
0
38
,41
2
- o
ne
to fi
ve y
ears
1
12
,36
1
1
41
,61
8
- o
ver
five
year
s
2
,22
1,1
12
1,3
66
,01
5
No
n in
tere
st b
eari
ng
Tota
l Bo
rro
win
gs
2,3
33
,47
3
1
,54
6,0
45
W
eig
hte
d a
vera
ge
effe
ctiv
e in
tere
st r
ate
6.0
7%
6.1
6%
Co
un
cil's
exp
osu
re t
o in
tere
st r
ate
risk
as
a re
sult
of b
orr
ow
ing
s an
d t
he
effe
ctiv
e w
eig
hte
d a
vera
ge
inte
rest
rat
e o
n th
ese
bo
rro
win
gs
is a
s fo
llow
s:

34
NO
TES
TO A
ND
FO
RMIN
G P
AR
T O
F TH
E FI
NA
NC
IAL
REPO
RT
FOR
TH
E YE
AR
END
ED
30
TH J
UN
E 2
00
6
22
. RA
TIN
G IN
FOR
MA
TIO
N -
200
5/0
6 F
INA
NC
IAL
YEA
R
Rat
e in
N
um
ber
R
atea
ble
R
ate
Inte
rim
B
ack
Tota
l B
ud
get
B
ud
get
Bu
dg
et
Bu
dg
et
$
o
f V
alu
e R
even
ue
Rat
es
Rat
es
Rev
enu
e R
ate
Inte
rim
B
ack
Tota
l
Pr
op
ertie
s $
$
$
$
$
R
even
ue
Rat
e R
ate
Rev
enu
e R
ATE
TYP
E
$
$
$
$
Diff
eren
tial G
ener
al R
ate
G
RV
TO
WN
SITE
S
0.1
02
64
4
1,2
98
2
2,4
43
,66
9 2
,27
9,8
37
2
3,8
71
2
,30
3,7
08
2
,30
7,1
00
5
0,0
00
2,3
57
,10
0
G
RV
OTH
ER
0
.10
26
44
2
8
7,1
56
8
,94
6
8
,94
6
8,9
00
8,9
00
UV
1
0
.00
61
28
8
1
59
,04
7,9
77
3
54
,91
5
6,9
31
3
61
,84
6
36
1,7
00
2
,50
0
3
64
,20
0
U
V 2
0.0
09
81
9
99
1
7,6
60
,86
2
17
3,4
12
17
3,4
12
1
62
,90
0
1
62
,90
0
R
UR
AL
LIV
ING
0.0
11
47
8
91
1
0,0
98
,79
8
11
5,9
14
11
5,9
14
8
7,3
00
87
,30
0
PA
STO
RA
L
0.0
67
02
7
27
2
,54
4,6
16
1
70
,55
8
1
70
,55
8
10
0,4
00
10
0,4
00
MIN
ING
0.0
83
88
3
12
0
3,0
80
,67
2
23
5,6
90
2
2,7
26
2
58
,41
6
27
1,2
00
1
5,0
00
28
6,2
00
Su
b-T
ota
ls
1,7
18
1
14
,96
3,7
49
3,3
39
,27
2
53
,52
8
0
3,3
92
,80
0
3,2
99
,50
0
67
,50
0
0
3,3
67
,00
0
M
inim
um
M
inim
um
Rat
es
$
GR
V T
OW
NSI
TES
6
00
.00
00
3
41
1
,15
3,2
65
2
04
,60
0
2
04
,60
0
19
3,2
00
19
3,2
00
UV
1
7
50
.00
00
1
5
89
3,1
72
1
1,2
50
11
,25
0
12
,00
0
1
2,0
00
PAST
OR
AL
7
50
.00
00
8
3
1,0
49
6
,00
0
6
,00
0
5,3
00
5,3
00
MIN
ING
75
0.0
00
0
12
6
27
6,6
76
9
4,5
00
94
,50
0
11
1,0
00
11
1,0
00
0
0
Sub
-To
tals
4
90
2
,35
4,1
62
3
16
,35
0
0
0
31
6,3
50
3
21
,50
0
0
0
32
1,5
00
3,7
09
,15
0
3,6
88
,50
0
Dis
cou
nts
(re
fer
no
te 2
5)
(1
27
,36
3)
(1
17
,00
0)
Tota
ls
3
,58
1,7
87
3
,57
1,5
00
23
. SPE
CIF
IED
ARE
A R
ATE
- 20
05
/06
FIN
AN
CIA
L YE
AR
The
Shir
e o
f Wyn
dh
am E
ast
Kim
ber
ley
con
du
cted
no
sp
ecifi
ed a
rea
ratin
g fo
r 2
00
5/2
00
6
24
. SE
RV
ICE
CH
AR
GE
S - 2
005
/06
FIN
AN
CIA
L YE
AR
The
Shir
e o
f Wyn
dh
am E
ast
Kim
ber
ley
colle
cted
no
ser
vice
ch
arg
es fo
r th
e 2
00
5/2
006
fin
anci
al y
ear.

35
NOTES TO AND FORMING PART OF THE FINANCIAL REPORT
FOR THE YEAR ENDED 30TH JUNE 2006 25. DISCOUNTS, INCENTIVES, CONCESSIONS, & WRITE-OFFS - 2005/06 FINANCIAL YEAR
Type Disc % Total Budget
Cost/ Cost/
Value Value
$ $
General Rates Discount 5 109,277 100,000
Minimum Rate Discount 5 18,086 17,000
127,363 117,000
A discount on rates is granted to all who pay their rates in full within 35 days of the date of service
appearing on the rate notice.
26. INTEREST CHARGES AND INSTALMENTS - 2005/06 FINANCIAL YEAR Interest Admin. Revenue Budgeted
Rate Charge $ Revenue % $ $
Interest on Unpaid Rates 11 25,215 40,000
Interest on Installments Plan 5 7,668 10,000
Administration Charges 15 4,085 7,000
36,968 57,000
27. FEES & CHARGES 2006 2005 $ $
Governance 0 1,515 General Purpose Funding 55 12,305 Law, Order, Public Safety 15,547 14,825
Health 41,664 35,776 Education & Welfare 37,432 59,653 Housing 0 64,156 Community Amenities 43,669 138,801 Recreation & Culture 227,596 284,865 Transport 1,226,910 1,090,429 Economic Services 70,971 85,136 Other Property & Services 2,252 77,754
1,666,096 1,865,215
There were no changes during the year to the amount of the fees or charges detailed in the original budget.
Ratepayers had the option of paying rates in four equal installments, due on 27th September 2005, 29th November 2005, 31st January 2006 and 27th March 2006. Administration charges and interest applied for the final three installments.

36
NOTES TO AND FORMING PART OF THE FINANCIAL REPORT
FOR THE YEAR ENDED 30TH JUNE 2006 28. GRANT REVENUE 2006 2005 $ $ By Nature and Type:
Grants and Subsidies - operating 4,027,332 4,149,259 Grants and Subsidies - non-operating 2,816,283 1,179,702 6,843,615 5,328,961 By Program:
General Purpose Funding 3,066,399 3,104,244 Law, Order, Public Sector 56,983 137,551 Health 96,038 61,550 Education and Welfare 637,612 33,426 Community Amenities 0 6,018 Housing 50,000 0 Recreation and Culture 815,772 653,219 Transport 2,098,880 1,332,953 Other Property and Services 21,931 0 6,843,615 5,328,961
29. COUNCILLORS’ REMUNERATION 2006 2006 2005 $ Budget $
$ The following fees, expenses and allowances were
paid to council members and/or the president. Meeting Fees 43,250 45,000 34,644
President’s Allowance 10,000 10,000 5,000 Deputy President’s Allowance 2,500 2,500 1,250 Traveling Expenses 13,850 10,000 3,546 Telecommunications Allowance 12,845 13,500 13,500 IT Allowance 9,000 9,000 0 91,445 90,000 57,940
30. EMPLOYEES’ REMUNERATION
Set out below, in bands of $10,000, is the number of employees of the Shire entitled to an annual salary of $100,000 or more.
Salary Range 2006 2005 $
100,000 - 109,999 1 1
31. EMPLOYEE NUMBERS 2006 2005
The number of full-time equivalent Employees at balance date 57 54
32. ECONOMIC DEPENDENCY
A significant portion of revenue is received by way of grants from the State and Federal Government. The total of grant revenue from government sources is disclosed in Note 28.
33. MAJOR LAND TRANSACTIONS
34. TRADING UNDERTAKINGS AND MAJOR TRADING UNDERTAKINGS
Council did not participate in any trading undertakings or major trading undertakings during the 2005/06 financial year.
No Major Land Transaction was undertaken by the Shire of Wyndham East Kimberley in the 2005/2006 financial year.

37
NOTES TO AND FORMING PART OF THE FINANCIAL REPORT
FOR THE YEAR ENDED 30TH JUNE 2006 35. FIRST TIME ADOPTION OF AUSTRALIAN EQUIVALENTS TO INTERNATIONAL FINANCIAL
REPORTING STANDARDS (AIFRSs) (a) Reconciliation of Equity at 1 July 2004 There were no material differences between Equity in the opening AIFRSs Balance Sheet and the eq-
uity in the 1 July 2004 Balance Sheet presented under previous GAAP. (b) Reconciliation of Equity at 30 June 2005 There were no material differences between Equity in the 30 June 2005 Balance Sheet presented un-
der AIFRSs and the equity in the 30 June 2005 Balance Sheet presented under previous GAAP. (c) Reconciliation of Net Result for the Year Ended 30 June 2005 There were no material differences between the Net Result for the year ended 30 June 2005 pre-
sented under AIFRSs and the Net Result for the year ended 30 June 2005 presented under previous GAAP.
(d) Explanation of Material Adjustments to the Cash Flow Statement There are no material differences between the Cash Flow Statement presented under AIFRSs and the
Cash Flow Statement presented under previous GAAP.