shipping trends analysis - fsb online · draft final report shipping trends analysis ... aim of the...
TRANSCRIPT

Draft Final Report
Shipping Trends Analysis
A Document Prepared in Fulfillment of Milestone Number 12 of the U.S. Army Corps of Engineers’ R&D Work Unit Entitled
Impacts of Navigation Trends on Channel Usage and Design
by
Jennifer K. Waters Robert H. Mayer David L. Kriebel
Department of Naval Architecture and Ocean Engineering United States Naval Academy
Annapolis, MD 21402
for
Institute for Water Resources U.S. Army Corps of Engineers
Alexandria, VA 22315
September 2000

DRAFT FINAL REPORT: Shipping Trends Analysis for Impacts of Navigation Trends on Channel Usage and Design
This page intentionally left blank.

DRAFT FINAL REPORT: Shipping Trends Analysis for Impacts of Navigation Trends on Channel Usage and Design
Executive Summary i
Executive Summary Because of the dynamic changes that are occurring in the maritime shipping industry, the U.S. Army Corps of Engineers’ Institute for Water Resources initiated a research and development work unit entitled, “Impacts of Navigation Trends on Channel Usage and Design.” In short, the aim of the work unit is to investigate how future maritime vessel design and usage will impact the design and maintenance of deep-draft navigation channels. The aim of this Shipping Trends Analysis component of the study is to identify current and future navigation trends and analyze them for potential impacts on channel design and safety. An analysis of current trends within the international shipping industry has been conducted. Growth in world trade, increasing containerization, changes in the world fleet, vessel design trends, and operational and organizational changes of the maritime industry have been evaluated. An assessment of future trends resulting from these dynamic changes occurring within the international shipping industry are identified and assessed for their potential impact on channel design and operations. This report draws significantly on data from another U.S. Army Corps of Engineers study entitled, “National Dredging Needs Study (NDNS).” The present report does not regenerate information contained in the NDNS report. Rather, this report augments the NDNS study and elucidates several issues related to vessel characteristics and ship design not fully addressed in the NDNS report. This report summarizes vessel characteristics and trends over the past thirty years and discusses future vessel design issues and corresponding navigation channel design, maintenance and safety impacts. For example, it is shown that the average beam-to-draft ratio has significantly increased over the past thirty years for all merchant vessel types investigated. This vessel parameter trend most directly impacts channel width and layout. Channel width and channel layout features such as bends must enlarge (for same depth) in order to accommodate ships with these changing proportion trends. Channel depth, for this type of vessel change, is impacted to a much lesser degree; an increase in beam-to-draft ratio does not impact typical design conventions for channel depth nearly as significantly. The effect of an increased vessel blockage factor within a channel cross-section also contributes to higher vessel squat experienced, and may likely result in decreased vessel speeds within channels. Other vessel-related issues, such as the impact of tug assistance within navigation channels and two-way traffic, are also addressed in this report.

DRAFT FINAL REPORT: Shipping Trends Analysis for Impacts of Navigation Trends on Channel Usage and Design
ii Executive Summary
This page intentionally left blank.

DRAFT FINAL REPORT: Shipping Trends Analysis for Impacts of Navigation Trends on Channel Usage and Design
Table of Contents iii
Table of Contents
Executive Summary....................................................................................................................i Table of Contents...................................................................................................................... iii List of Tables ............................................................................................................................iv List of Figures ............................................................................................................................v Abbreviations and Acronyms ................................................................................................... vii 1. Introduction....................................................................................................................... 1 2. Background ....................................................................................................................... 3
2.1 Shipping Trends Investigation History.......................................................................... 3 2.2 A Brief Discussion of Significant Vessel Design Characteristics ................................. 5
3. Categorization of Marine Vessels ..................................................................................... 9 4. Analysis and Key Findings ............................................................................................. 13
4.1 Analysis of Shipping Trends........................................................................................ 13 4.2 Analysis of Vessel Design Trends ............................................................................... 15
4.2.1 Containerships....................................................................................................... 16 4.2.2 RO/ROs................................................................................................................. 26 4.2.3 General Cargo/Breakbulk ..................................................................................... 33 4.2.4 Dry Bulk ................................................................................................................ 40 4.2.5 Tankers.................................................................................................................. 48
5. Conclusions ..................................................................................................................... 55 Appendix A: A Brief Discussion of Common Commercial Merchant Vessels
A.1 General Cargo ...........................................................................................................A-3 A.1.1 Containerships....................................................................................................A-4 A.1.2 RO/ROs..............................................................................................................A-5 A.1.3 General Cargo/Breakbulk ...................................................................................A-7
A.2 Bulk Cargo ................................................................................................................A-9 A.2.1 Dry Bulk Vessels ...............................................................................................A-9 A.2.2 Tankers .............................................................................................................A-11 A.2.3 Liquefied Gas Carriers .....................................................................................A-12 A.2.4 Combination Carriers .......................................................................................A-14
A.3 Others ......................................................................................................................A-14

DRAFT FINAL REPORT: Shipping Trends Analysis for Impacts of Navigation Trends on Channel Usage and Design
iv List of Tables
List of Tables
Table 2-1. Ship proportions with possible significant effect on ship design requirements (from Taggart, 1980)......................................................................................................... 7
Table 3-1. A list of representative vessel types (from Ship Design and Construction)......... 10 Table 5-1. Summary of shipping trends and impacts on channel design for different U.S.
regions. ............................................................................................................................ 57

DRAFT FINAL REPORT: Shipping Trends Analysis for Impacts of Navigation Trends on Channel Usage and Design
List of Figures v
List of Figures Figure 2-1. Projected number of annual calls to and from U.S. Ports: 2000-2020 (data
source: NDNS draft report)............................................................................................... 4 Figure 2-2. Projected increase in annual number of port calls from 2000-2020 (data source:
NDNS draft report). .......................................................................................................... 4 Figure 2-3. Illustration of the vessel parameters length (L), beam (B), draft (T) and
submerged volume (∇∇). (From Zubaly’s Applied Naval Architecture.) .......................... 5 Figure 3-1. Vessel categorization by hullform type (from Gillmer and Johnson's
Introduction to Naval Architecture).................................................................................. 9 Figure 3-2. Categorization of vessels used in this report. ...................................................... 11 Figure 4-1. International maritime trade by coastal region; illustration of import/export/total
contributions by tonnage and by value. (Data source: NDNS draft report.).................. 14 Figure 4-2. 1996 statistics of the U.S. maritime trade calling fleet. (Data source: NDNS
draft report.) .................................................................................................................... 15 Figure 4-3. Containerships: Number of ships constructed per year....................................... 18 Figure 4-4. Containerships: DWT constructed per year. ....................................................... 19 Figure 4-5. Containerships: TEU capacity constructed per year. .......................................... 19 Figure 4-6. Containerships: Vessel length vs. year constructed. ........................................... 20 Figure 4-7. Containerships: Vessel beam vs. year constructed. ............................................ 20 Figure 4-8. Containerships: Vessel design draft vs. year constructed. .................................. 21 Figure 4-9. Containerships: Vessel length-to-beam ratio vs. year constructed. .................... 21 Figure 4-10. Containerships: Vessel beam-to-draft ratio vs. year constructed. ..................... 22 Figure 4-11. Containerships: Vessel length-to-draft ratio vs. year constructed. ................... 22 Figure 4-12. Containerships: Vessel DWT vs. year constructed. .......................................... 23 Figure 4-13. Containerships: Vessel L/B vs. DWT. .............................................................. 23 Figure 4-14. Containerships: Vessel B/T vs. DWT. .............................................................. 24 Figure 4-15. Containerships: Vessel L/T vs. DWT. .............................................................. 24 Figure 4-16. Containerships: TEU capacity vs. DWT. .......................................................... 25 Figure 4-17. Containerships: B/T vs. TEU. ........................................................................... 25 Figure 4-18. RO/ROs: Number of Ships constructed per year. ............................................. 27 Figure 4-19. RO/ROs: DWT constructed per year. ............................................................... 27 Figure 4-20. RO/ROs: Vessel length vs. year constructed. ................................................... 28 Figure 4-21. RO/ROs: Vessel beam vs. year constructed...................................................... 28 Figure 4-22. RO/ROs: Vessel design draft vs. year constructed. .......................................... 29 Figure 4-23. RO/ROs: Vessel length-to-beam ratio vs. year constructed.............................. 29 Figure 4-24. RO/ROs: Vessel beam-to-draft ratio vs. year constructed. ............................... 30 Figure 4-25. RO/ROs: Vessel length-to-draft ratio vs. year constructed............................... 30 Figure 4-26. RO/ROs: DWT vs. year constructed. ................................................................ 31 Figure 4-27. RO/ROs: L/B vs. DWT. .................................................................................... 31 Figure 4-28. ROR/ROs: B/T vs. DWT. ................................................................................. 32 Figure 4-29. RO/ROs: L/T vs. DWT. .................................................................................... 32 Figure 4-30. General Cargo/Breakbulk Ships: Number of ships constructed per year. ........ 33 Figure 4-31. General Cargo/Breakbulk Ships: DWT constructed per year. .......................... 34 Figure 4-32. General Cargo/Breakbulk Ships: Vessel length vs. year constructed. .............. 34 Figure 4-33. General Cargo/Breakbulk Ships: Vessel beam vs. year constructed. ............... 35

DRAFT FINAL REPORT: Shipping Trends Analysis for Impacts of Navigation Trends on Channel Usage and Design
vi List of Figures
Figure 4-34. General Cargo/Breakbulk Ships: Vessel design draft vs. year constructed. ..... 35 Figure 4-35. General Cargo/Breakbulk Ships: Vessel length-to-beam ratio vs. year
constructed. ..................................................................................................................... 36 Figure 4-36. General Cargo/Breakbulk Ships: Vessel beam-to-draft ratio vs. year
constructed. ..................................................................................................................... 36 Figure 4-37. General Cargo/Breakbulk Ships: Vessel length-to-draft ratio vs. year
constructed. ..................................................................................................................... 37 Figure 4-38. General Cargo/Breakbulk Ships: Vessel deadweight tonnage vs. year
constructed. ..................................................................................................................... 37 Figure 4-39. General Cargo/Breakbulk Ships: Vessel L/B vs. DWT. ................................... 38 Figure 4-40. General Cargo/Breakbulk Ships: Vessel B/T vs. DWT. ................................... 38 Figure 4-41. General Cargo/Breakbulk Ships: Vessel L/T vs. DWT. ................................... 39 Figure 4-42. Dry Bulkers: Number of ships constructed per year. ........................................ 41 Figure 4-43. Dry Bulkers: Deadweight tonnage constructed per year................................... 41 Figure 4-44. Dry Bulkers: Vessel length vs. year constructed. ............................................. 42 Figure 4-45. Dry Bulkers: Vessel beam vs. year constructed. ............................................... 42 Figure 4-46. Dry Bulkers: Vessel design draft vs. year constructed. .................................... 43 Figure 4-47. Dry Bulkers: Vessel length-to-beam ratio vs. year constructed........................ 43 Figure 4-48. Dry Bulkers: Vessel beam-to-draft ratio vs. year constructed. ......................... 44 Figure 4-49. Dry Bulkers: Vessel length-to-draft ratio vs. year constructed. ........................ 44 Figure 4-50. Dry Bulkers: Vessel deadweight tonnage vs. year constructed. ....................... 45 Figure 4-51. Dry Bulkers: Ratio of vessel deadweight tonnage to length ×× beam ×× draft vs.
year constructed. ............................................................................................................. 45 Figure 4-52. Dry Bulkers: Vessel L/B vs. DWT................................................................... 46 Figure 4-53. Dry Bulkers: Vessel B/T vs. DWT. .................................................................. 46 Figure 4-54. Dry Bulkers: Vessel L/T vs. DWT. ................................................................... 47 Figure 4-55. Tankers: Number of ships constructed per year................................................ 48 Figure 4-56. Tankers: DWT constructed per year. ................................................................ 49 Figure 4-57. Tankers: Vessel length vs. year constructed. .................................................... 49 Figure 4-58. Tankers: Vessel beam vs. year constructed....................................................... 50 Figure 4-59. Tankers: Vessel design draft vs. year constructed. ........................................... 50 Figure 4-60. Tankers: Vessel length-to-beam ratio vs. year constructed. ............................. 51 Figure 4-61. Tankers: Vessel beam-to-draft ratio vs. year constructed. ................................ 51 Figure 4-62. Tankers: Vessel length-to-draft ratio vs. year constructed................................ 52 Figure 4-63. Tankers: Vessel DWT vs. year constructed. ..................................................... 52 Figure 4-64. Tankers: Vessel L/B vs. DWT. ......................................................................... 53 Figure 4-65. Tankers: Vessel B/T vs. DWT. ......................................................................... 53 Figure 4-66. Tankers: Vessel L/T vs. DWT. ......................................................................... 54 Figure 5-1. Beam-to-draft ratio (linear regression) vs. year constructed for different vessel
types. ............................................................................................................................... 56 Figure 5-2. Projected increase in annual number of port calls from 2000-2020. (Data source:
NDNS draft report.) ........................................................................................................ 58 Figure 5-3. Projected percent increase in port calls from 2000-2020. (Data source: NDNS
draft report.) .................................................................................................................... 58 Figure 5-4. Schematic of select items involved in iterative process of channel usage.
Dashed lines indicate relationships that can be strengthened. ........................................ 60

DRAFT FINAL REPORT: Shipping Trends Analysis for Impacts of Navigation Trends on Channel Usage and Design
Abbreviations and Acronyms vii
Abbreviations and Acronyms
B Beam CB Block coefficient; the vessel’s submerged volume divided by the
volume of the rectangle described by L×B×T DWT Deadweight Tonnage; a measure of a vessel’s cargo-carrying capacity IAPH International Association of Ports and Harbors INTUDE Impacts of Navigation Trends on Channel Usage and Design ITR Independent Technical Review L Length N.A. not applicable N.Q. not queried N.R. no response NDNS National Dredging Needs Study O&M Operations and Maintenance PED Preconstruction, Engineering and Design PIANC Permanent International Association of Navigation Congresses PMCL Planning and Management Consultants, Ltd. T Draft USACE U.S. Army Corps of Engineers ∇ Volume of submerged portion of vessel WES Waterways Experiment Station

DRAFT FINAL REPORT: Shipping Trends Analysis for Impacts of Navigation Trends on Channel Usage and Design
viii
This page intentionally left blank.

DRAFT FINAL REPORT: Shipping Trends Analysis for Impacts of Navigation Trends on Channel Usage and Design
Introduction 1
1. Introduction Because of the dynamic changes that are occurring in the maritime shipping industry, the U.S. Army Corps of Engineers’ Institute for Water Resources initiated a research and development work unit entitled, “Impacts of Navigation Trends on Channel Usage and Design” hereafter referred to as “INTUDE.” The INTUDE study is comprised of three interrelated major components: (1) a safety performance review, (2) an assessment of channel design and maintenance practices, and (3) [the present] shipping trends analysis. In short, the overall aim of the work unit is to investigate how changes in maritime vessel design and usage will impact the design and maintenance of deep-draft navigation channels. The key contribution of this Shipping Trends Analysis component of the INTUDE study is to identify current and future navigation trends and analyze them for potential impacts on channel design and safety. An analysis of current trends within the international shipping industry has been conducted. Growth in world trade, increasing containerization, changes in the world fleet, vessel design trends, and operational and organizational changes of the maritime industry have been evaluated. An assessment of future trends resulting from these dynamic changes occurring within the international shipping industry are identified and assessed for their potential impact on channel designs and operations. This report draws significantly on data and findings from another U.S. Army Corps of Engineers study entitled, “National Dredging Needs Study1 (NDNS)” in order to arrive at some of the final conclusions. The present report does not regenerate information contained in the NDNS report. Rather, this report augments the NDNS study and elucidates several issues related to vessel characteristics and ship design not adequately addressed or presented in the NDNS report. Data for the additional analysis work performed for this INTUDE report was provided to the present authors by Planning and Management Consultants, Ltd. (PMCL), the authors of the NDNS report. The data analyzed most extensively was derived from a vessel information database compiled for the NDNS.
1 Norvell, Stuart D., Jack C. Kiefer, and Terry Thomas, “National Dredging Needs Study of U.S. Ports and Harbors,” Planning and Management Consultants, Ltd., Carbondale, IL, May 20, 2000 draft.

DRAFT FINAL REPORT: Shipping Trends Analysis for Impacts of Navigation Trends on Channel Usage and Design
2 Introduction
This page intentionally left blank.
DRAFT FINAL REPORT: Shipping Trends Analysis for Impacts of Navigation Trends on Channel Usage and Design
Background 3
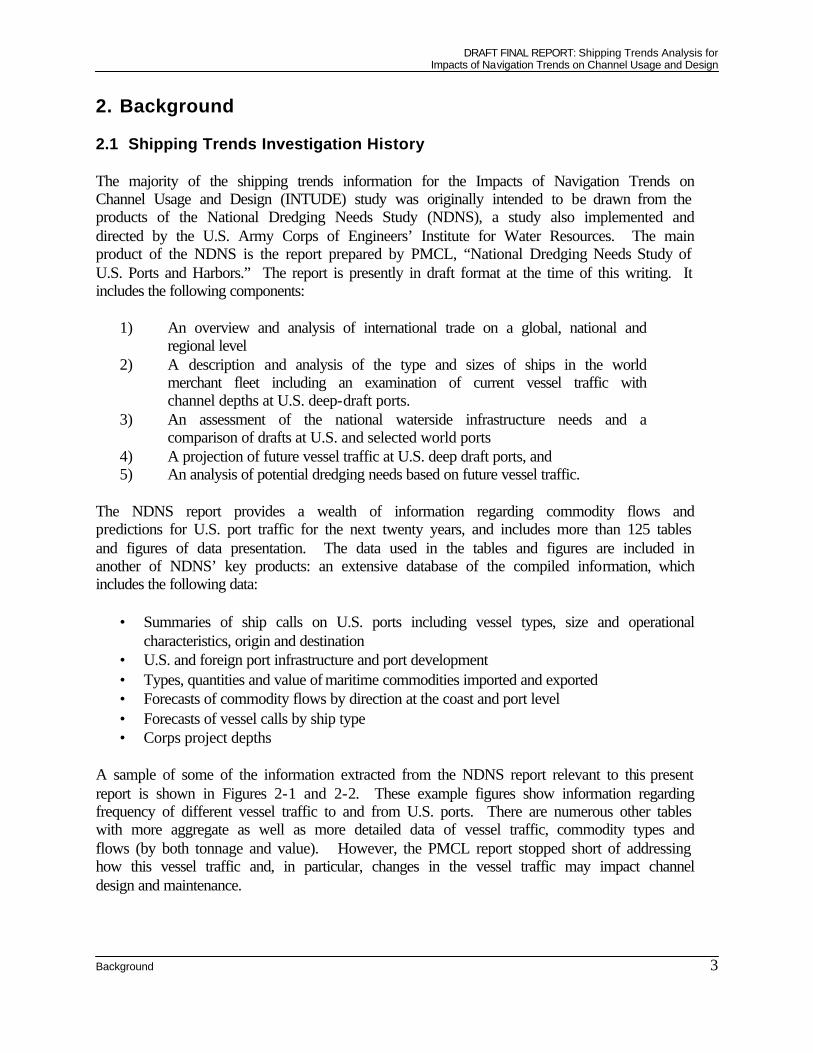
2. Background 2.1 Shipping Trends Investigation History The majority of the shipping trends information for the Impacts of Navigation Trends on Channel Usage and Design (INTUDE) study was originally intended to be drawn from the products of the National Dredging Needs Study (NDNS), a study also implemented and directed by the U.S. Army Corps of Engineers’ Institute for Water Resources. The main product of the NDNS is the report prepared by PMCL, “National Dredging Needs Study of U.S. Ports and Harbors.” The report is presently in draft format at the time of this writing. It includes the following components:
1) An overview and analysis of international trade on a global, national and regional level
2) A description and analysis of the type and sizes of ships in the world merchant fleet including an examination of current vessel traffic with channel depths at U.S. deep-draft ports.
3) An assessment of the national waterside infrastructure needs and a comparison of drafts at U.S. and selected world ports
4) A projection of future vessel traffic at U.S. deep draft ports, and 5) An analysis of potential dredging needs based on future vessel traffic.
The NDNS report provides a wealth of information regarding commodity flows and predictions for U.S. port traffic for the next twenty years, and includes more than 125 tables and figures of data presentation. The data used in the tables and figures are included in another of NDNS’ key products: an extensive database of the compiled information, which includes the following data:
• Summaries of ship calls on U.S. ports including vessel types, size and operational characteristics, origin and destination
• U.S. and foreign port infrastructure and port development • Types, quantities and value of maritime commodities imported and exported • Forecasts of commodity flows by direction at the coast and port level • Forecasts of vessel calls by ship type • Corps project depths
A sample of some of the information extracted from the NDNS report relevant to this present report is shown in Figures 2-1 and 2-2. These example figures show information regarding frequency of different vessel traffic to and from U.S. ports. There are numerous other tables with more aggregate as well as more detailed data of vessel traffic, commodity types and flows (by both tonnage and value). However, the PMCL report stopped short of addressing how this vessel traffic and, in particular, changes in the vessel traffic may impact channel design and maintenance.

DRAFT FINAL REPORT: Shipping Trends Analysis for Impacts of Navigation Trends on Channel Usage and Design
4 Background
0
20
40
60
80
100
120
140
Year 2000 Year 2010 Year 2020
Num
ber o
f Por
t Cal
ls (T
hous
ands
)ContainershipGeneral CargoDry BulkTankersOther
Figure 2-1. Projected number of annual calls to and from U.S. Ports: 2000-2020
(data source: NDNS draft report).
39.8
14.6
24.4
0.4
19.2
6.72.40.0
4.67.12.92.1
4.0
10.12.70.1
0.0
10.0
20.0
30.0
40.0
50.0
60.0
70.0
80.0
Pro
ject
ed In
crea
se in
Ann
ual N
umbe
r of
Cal
ls (T
hous
ands
) 200
0-20
20
Container General Cargo Dry Bulk Tanker
Great LakesPacific CoastGulf CoastAtlantic Coast
Figure 2-2. Projected increase in annual number of port calls from 2000-2020
(data source: NDNS draft report).

DRAFT FINAL REPORT: Shipping Trends Analysis for Impacts of Navigation Trends on Channel Usage and Design
Background 5
A vessel’s physical dimensions and maneuvering characteristics naturally influence how a channel is designed and maintained. To this end, several figures and tables with some analyses of vessel draft are included in the NDNS. However, most other vessel characteristics are all but neglected, with the exception of cargo capacity and a few anecdotal “landmark containership” tabulations of vessel dimensions. Vessel characteristics beyond vessel draft must be seriously considered in order to assess potential impacts to channel design and maintenance. Vessel characteristics and dimensions have changed, will continue to change with time, and have not and will not change evenly or proportionately. Therefore, a large part of the remainder of this report discusses general and particular characteristic trends for vessels involved in maritime cargo trade. The conclusions to this report incorporate the cargo and traffic prediction information extracted from the NDNS report with the vessel characteristics analysis contained herein. 2.2 A Brief Discussion of Significant Vessel Design Characteristics As mentioned previously, draft (distance from the still water level to the lowest point on the vessel below water) is usually the vessel dimension most channel designers and planners investigate and follow most intently. However, there is a serious danger in the channel designers’ and planners’ proclivities to neglect other parameters, and more importantly, the relative proportions of the other vessel dimensions relative to draft. A typical ship hull has a very complex, three-dimensional shape, and in order to fully describe a particular hull shape a large amount of data is required. Basically each point on the hull has a unique location, usually not definable by a simple or even a complex equation. Therefore, in order to compare or categorize vessels, designers and planners will refer to certain gross dimensions and characteristics of a ship such as length, beam (width), and draft. Other significant vessel parameters include vessel depth2, D, submerged volume,∇, and various non-dimensional coefficients such as block coefficient, prismatic coefficient, etc. Some of these parameters are illustrated in Figure 2-3.
Figure 2-3. Illustration of the vessel parameters length (L), beam (B), draft (T) and submerged
volume (∇). (From Zubaly’s Applied Naval Architecture.)
2 Vessel depth is the distance from the keel (bottom) to the main deck or uppermost watertight deck. This parameter is significant with respect to stability and structural (strength) characteristics.

DRAFT FINAL REPORT: Shipping Trends Analysis for Impacts of Navigation Trends on Channel Usage and Design
6 Background
Part of the reason that draft is given such great attention is that it is one of the most easily understood and most easily quantifiable dimensions of a vessel. It is also the most interesting. It changes from voyage to voyage, and changes somewhat during a voyage due to the consumption of fuel, food and other “consumables.” Draft is the one and only vessel parameter that is easily variable and controllable once a vessel has been constructed. Length and beam of a vessel cannot be modified after a ship is constructed. Draft can vary depending on how much weight the vessel is carrying. The more weight the ship is carrying, the larger the draft and vice-versa. A vessel is usually designed with an intended or “design draft,” which is essentially the vessel’s preferred draft for optimal overall performance. However, in operation, it is quite likely that a vessel will sail drafts other than her design draft. A vessel rarely sails at a deeper or heavier draft than the design draft, due to stability concerns and regulations. The most common draft variance is therefore a shallower draft than design draft, also referred to as sailing “light” or “light-loading.” The two most common reasons for this are (1) the cargo quantity or weight (density) is not large enough to “sink” the ship down to her design draft, or (2) the channel or port facility water depths are not large enough to accommodate the vessel at full draft, so the vessel operator intentionally removes cargo or “light loads” to reduce draft so that the vessel will “fit” in the shallower water. From the vessel design standpoint, transiting in and out of ports – although still quite important – is not the only significant operational consideration. Table 2-1 is extracted from Taggart’s Ship Design and Construction; and it presents a succinct summary of the primary ship design parameters and requirements that naval architects commonly address. As can be seen in the table, the parameters associated with port accessibility are length, beam, and draft. However, other parameters – ones not as important to port and berth accessibility – may be quite significant with regard to other vessel design requirements such as fuel consumption and endurance. As shown in the table, some of these other parameters of significant concern to the vessel designer include
• vessel depth — the vertical distance from the bottom of the ship up to the main deck • submerged volume ∇ — the volume of the submerged portion of the vessel; also
referred to as displaced volume • block coefficient CB — the ratio of the underwater volume ∇ divided by the
rectangular block described by L×B×T (see figure 2-3 for clarification) • ratios and functions of other parameters
As with many engineering designs, there are tradeoffs associated with almost all of the parameters. Often a desirable characteristic (e.g., shallow draft) for one design requirement directly conflicts with the desirable characteristics (e.g., deeper draft) for another design requirement. It is the task of the vessel designer to balance the tradeoffs and optimize the vessel for the range of requirements identified.

DRAFT FINAL REPORT: Shipping Trends Analysis for Impacts of Navigation Trends on Channel Usage and Design
Background 7
Table 2-1. Ship proportions with possible significant effect on ship design requirements (from Taggart, 1980).3
Ship Design Requirements L
length B
beam T
draft D
depth
L/∇∇ 1/3, slender-
ness ratio
CB, block coeff B/T L/D
Port accessibility u u u Berth accessibility u u u u Fees governed by admeasurement tonnage u u u u
Pilotage and pier rental costs not based on tonnage u u
Availability of drydocks u u u Rough weather performance u u u u u u u u Calm weather performance u u u u u u Fuel consumption and endurance u u u u u u u u Effective use of overload horsepower u u u Maneuvering and directional stability u u u u u u Longitudinal ship deflection u u u Propeller induced hull vibration u u u u u u u u Capital charges to amortize first cost u u u u u
3 Taggart, Robert, ed., Ship Design and Construction, Society of Naval Architects and Marine Engineers, New York, NY, 1980. Table extracted from Chapter 1: Mission Analysis and Basic Design, p.17.

DRAFT FINAL REPORT: Shipping Trends Analysis for Impacts of Navigation Trends on Channel Usage and Design
8
This page intentionally left blank.

DRAFT FINAL REPORT: Shipping Trends Analysis for Impacts of Navigation Trends on Channel Usage and Design
Categorization of Marine Vessels 9
3. Categorization of Marine Vessels When investigating shipping trends, it is important to characterize what parameters are changing for which vessel types and the underlying reasons why. To that end, it is also important to understand how vessel data is collected and compiled. Vessels can be categorized many different ways. Examples of categorization schemes include by engineering issues (e.g., hullform type, propulsion type), by type of service (e.g., commercial, military) and by cargo type (e.g., containership, tanker). Briefly presented in this section are some generally useful categorization schemes. While the focus of this Shipping Trends Analysis report and the INTUDE parent study lend themselves to preferential categorization of vessels by the type of cargo carried, the other categorizations are listed here for informational, clarification and orientation purposes. In Gilmer and Johnson’s Introduction to Naval Architecture, ships are categorized by hullform type or means of support; i.e., the physical phenomenon that keeps the vessel afloat while underway. The figure reproduced here as Figure 3-1 includes some relatively rare and specialized hull design types such as air-cushion vehicles (ACVs) and hydrofoils, which are seen only in specialized applications, and not in commercial shipping. Most cargo-carrying vessels are strictly of the conventional-displacement or deep-displacement type.
Figure 3-1. Vessel categorization by hullform type
(from Gillmer and Johnson's Introduction to Naval Architecture).
Taggart’s Ship Design and Construction presents three major ship categories: Commercial Vessels, Industrial Vessels, and Service Vessels, as reproduced in table 3-1. Most cargo-carrying vessels fall within the commercial vessel category.

DRAFT FINAL REPORT: Shipping Trends Analysis for Impacts of Navigation Trends on Channel Usage and Design
10 Categorization of Marine Vessels
Table 3-1. A list of representative vessel types (from Ship Design and Construction).
COMMERCIAL VESSELS INDUSTRIAL VESSELS SERVICE VESSELS
• general cargo ships • containerships • tankers • liquefied gas carriers • bulk carriers • ore/bulk/oil carriers
(OBOs) • integrated tug/barges • roll-on/roll-off ships
(RO/ROs) • ferries • barge carriers • heavy-lift ships • chemical tankers • lumber carriers • towboats with barges • passenger ships
• suction dredges • pipe-laying vessels • drilling vessels • semi-submersibles • incinerator vessels • hopper dredged • fish processing vessels • fish catching vessels • fisheries research
vessels • oceanographic
research vessels • hydrographic survey
vessels • ocean mining vessels • seismic exploration
vessels
• tugboats without barges
• offshore supply boats • crewboats • crane support ships • diving support ships • fire boats • pilot boats • towboat without tow
For this present Shipping Trends Analysis report, strictly cargo-carrying commercial merchant vessels are analyzed in depth. There are clearly numerous other vessels that are not included in this group. However, the vessels that are included under this category typically impact National Economic Development (NED) most directly and significantly. The simplified categorization scheme of vessels discussed and analyzed in this present shipping trends analysis report is shown schematically in Figure 3-2. This represents the cargo-carrying commercial merchant vessels addressed in the NDNS report and includes the vessels used in most USACE channel formulation studies. As shown in the figure, most cargo vessels fall into one of two general classifications based on the type of cargo carried: general cargo or bulk cargo. The difference between the two is that bulk cargoes can be pumped or moved easily by similar automated mechanical means, whereas general cargoes cannot. A more detailed discussion of cargo types and associated ship types is included in Appendix A. Each of the two major classification types possesses two dominant (by vessel numbers and transported tonnage) vessel sub-types. Under the general cargo vessel classification, containerships and general cargo/breakbulk vessels are dominant, and under the bulk classification, dry bulkers and tankers are the dominant vessel types. It is these four vessel types that are analyzed most extensively throughout the remainder of this report.

DRAFT FINAL REPORT: Shipping Trends Analysis for Impacts of Navigation Trends on Channel Usage and Design
Categorization of Marine Vessels 11
Containerships RO/ROs*
Merchant Cargo Vessels
General Cargo
Bulk
Automotive Carriers
General Cargo / Breakbulk
Liq. Gas Carriers* LNG LPG
Others*
Comb. Carriers* OBOs
Dry Bulkers
Grain Coal Ore
Tankers Crude Oil Product Chemical
Figure 3-2. Categorization of vessels used in this report.4
4 *The categories “RO/ROs,” “Liquefied Gas Carriers” and “Others” do not appear in all of the analyses presented in this report. Combination carriers, such as OBOs, have been included within the “Dry Bulk” category.

DRAFT FINAL REPORT: Shipping Trends Analysis for Impacts of Navigation Trends on Channel Usage and Design
12 Categorization of Marine Vessels
This page intentionally left blank.

DRAFT FINAL REPORT: Shipping Trends Analysis for Impacts of Navigation Trends on Channel Usage and Design
Analysis and Key Findings 13
4. Analysis and Key Findings 4.1 Analysis of Shipping Trends The NDNS study summarizes vessel traffic and commodity trade regionally, nationally and globally, and considers vessel movements, tonnage movements and associated economic values. The following are some findings extracted from various sections of the NDNS draft report: General International Trade Issues
• Foreign trade – and particularly maritime trade – is critically important to the economy of the United States.
• In general, economic pressure and technological advances have influenced the trend toward larger ships, which as a result have increased channel deepening needs.
• It is projected that there will be a significant overall increase in demand for shipping, due to globalization and large increases in commodity trade. The existing fleet will grow and it is likely that larger ships will be built in pursuit of economic efficiency.
• Shifts in the origin and destinations of U.S. imports and exports are likely. • Overall, the U.S. is a net exporter of agricultural commodities and a net importer of
finished manufactured goods. Based on value, the U.S. maintains trade deficits with most of the world. However, in terms of tonnage, the U.S. is a net exporter of low-value raw materials and agricultural goods.
• Regarding U.S. trading partners: o Trade between the U.S. and Western Europe is mature and is not expected to
grow much in the future. o Trade with developing nations such as Eastern Europe should result in
associated increased cargo flows. o Stronger commerce with Latin America will tend to benefit South Atlantic
and Gulf coasts. o Expected rapid growth in trade with nations in Africa, the Mid-East and the
Indian subcontinent will benefit North and South Atlantic ports. • Figure 4-1 summarizes international maritime trade by coastal region, showing
percentage of cargo tonnage traded and percentage of cargo value traded. Regionally, the following generalizations can be made:
o Pacific Coast ports trade in higher value commodities with Asian nations. o Gulf ports serve as points of origin and/or destination for bulk commodities
such as crude oil and grain. o Atlantic Coast ports handle a wide range of goods shipped mostly to and from
Europe, Latin America and Africa.

DRAFT FINAL REPORT: Shipping Trends Analysis for Impacts of Navigation Trends on Channel Usage and Design
14 Analysis and Key Findings
Total by tonnageImports by tonnage
Exports by tonnage
Total by $ valueImports by $ value
Exports by $ value
Atlan
tic C
oast
Gulf C
oast
Pacifi
c Coa
stGr
eat L
akes
30%35%
23%38%
36%41%
48%51%
43%
18%
15%23%
17%
11%26%43%
48%
35%
5%
4%
7%
1%
1%
1%
0%10%20%30%40%50%60%
Figure 4-1. International maritime trade by coastal region; illustration of import/export/total
contributions by tonnage and by value. (Data source: NDNS draft report.)
Portside Issues
• Port infrastructure and continued development is essential for the vitality of maritime shipping, especially considering the trends toward increasing numbers and sizes of vessels. At present, U.S. ports appear to be comparable to their foreign counterparts with regard to landside infrastructure.
• One of the three greatest revolutions in cargo handling has been containerization. (The other two mentioned by the NDNS are palletization and use of RO/RO cargo loading.) Containerization began in 1955, and since its development from the 1960s onward, the structure of the world maritime fleet has noticeably changed. There are numerous transshipment advantages to containerization, especially for high-value items.
Vessel Types and Characteristics
• The tonnage capacity of containerships in the world fleet has grown the fastest of all vessel types, and is expected to continue growing faster than other vessel types.
• Figure 4-2 illustrates the numbers of vessels and average deadweight tonnage of vessels calling on U.S. ports, as well as an approximate number of port calls by vessel type.
• The NDNS includes several additional presentations of vessel draft and tonnage statistics. It has been the effort of this report to build upon the data presented in the NDNS report in order to arrive at conclusions of impacts of shipping trends and vessel characteristics on channel design.

DRAFT FINAL REPORT: Shipping Trends Analysis for Impacts of Navigation Trends on Channel Usage and Design
Analysis and Key Findings 15
-
10,000
20,000
30,000
40,000
50,000
60,000
70,000
Container General Cargo Bulk Tanker
DW
T, #
Cal
ls
-
500
1,000
1,500
2,000
2,500
3,000
3,500
# V
esse
ls
Average DWT # Calls on US Ports # Vessels
Figure 4-2. 1996 statistics of the U.S. maritime trade calling fleet. (Data source: NDNS draft report.)
As mentioned earlier, while the NDNS has provided an impressive volume of relevant information to the shipping trends analysis, little attention was paid to vessel characteristics beyond tonnage and draft. The remainder of this section, therefore, presents an analysis of vessel data to better highlight vessel changes that have not yet been addressed. The data used was from a vessel database of the world fleet compiled by PMCL for the NDNS. The world fleet was used vice the U.S. fleet, primarily to ensure an unbiased insight into global vessel design characteristics. It is shown in the NDNS that the characteristics of the U.S. fleet closely shadow those of the world fleet, so the general findings based on U.S.-calling vessels only should not vary significantly from the findings presented here. 4.2 Analysis of Vessel Design Trends The vessel characteristics investigated include vessel length, beam, draft, and DWT as well as numerous normalized variations of these parameters. Vessel characteristics are plotted and discussed for each of the following vessel types:
• Containerships • General Cargo/Breakbulk Vessels • RO/ROs • Dry Bulkers • Tankers

DRAFT FINAL REPORT: Shipping Trends Analysis for Impacts of Navigation Trends on Channel Usage and Design
16 Analysis and Key Findings
While RO/ROs are often included in the general cargo category, they were treated separately because of their notably differing vessel characteristics as compared to the rest of the general cargo vessels. An effort was made to present the data for each of the vessel types in a consistent manner. To that end, the following plots are presented for each vessel type:
General Construction Activity • Number of vessels constructed vs. year • Total DWT constructed vs. year
Dimensional Vessel Characteristics – Temporal Presentation • Vessel length vs. year constructed • Vessel beam vs. year constructed • Vessel design draft vs. year constructed
Non-Dimensional Vessel Characteristics – Temporal Presentation • Vessel length-to-beam ratio vs. year constructed • Vessel beam-to-draft ratio vs. year constructed • Vessel length-to-draft ratio vs. year constructed
Vessel Sizes Constructed– Temporal Presentation • Vessel DWT vs. year constructed
Non-Dimensional Vessel Characteristics – Relative to vessel size • Vessel length-to-beam ratio vs. DWT • Vessel beam-to-draft ratio vs. DWT • Vessel length-to-draft ratio vs. DWT
Where appropriate, additional plots are provided for specific vessel types. For example, additional relevant plots of TEU5 capacity are provided for containerships. Note that the vessel database was edited to include vessels for which all presented information was available, and also for which the design draft was greater than or equal to 15 ft (4.6 m) – the commonly-used threshold for “deep-draft” designation. Note also that the most recent years of NDNS data (1998-1999) appear incomplete for most vessel types. 4.2.1 Containerships Containerships are a very unique vessel type for many different reasons. They are clearly the youngest vessel type of the present maritime trade fleet – first appearing less than 50 years ago. Containerships are also the vessel type whose dimensions are most directly and remarkably constrained by shoreside facilities. In contrast to their general cargo vessel cousins, containerships (especially the largest vessels) typically do not have their own cargo loading and unloading cranes, and must rely on the shoreside facilities. 5 TEU stands for “Twenty-Foot Equivalent Unit” and refers to the number of twenty-foot-long containers a vessel can accommodate. Note that most large vessels actually carry primarily FEUs = “Forty-Foot Equivalent Units,” but the cargo capacity is still stated in TEUs. Since an FEU is twice a long as a TEU, a 2,000 FEU ship would be listed as having a 4,000 TEU capacity.

DRAFT FINAL REPORT: Shipping Trends Analysis for Impacts of Navigation Trends on Channel Usage and Design
Analysis and Key Findings 17
Figures 4-3 through 4-5 show containership construction activity during the past thirty years. Through these figures, it is clear that the total number of ships, the total DWT, and the total TEU has been increasing, and most remarkably within the past decade. Figures 4-6 through 4-8 illustrate how vessel dimensions have varied for new construction vessels. Note the plateaus occurring in length at just under 300 m and beam at about 33 m, corresponding to Panamax dimension restrictions. It was only as late as the mid-1990’s that these barriers were broken. This is quite late when compared to other vessel types, partially because containerships and containership design are relatively young as compared to other vessel types that have been in existence for much longer. And even though all vessel types may have certain restrictions on beam growth such as canal dimensions, the beam dimension for containerships has an additional constraint. It is particularly difficult – and in reality nearly impossible – to widen a containership until container cranes are made available with reaches that can span a wider vessel. Figures 4-9 through 4-11 present non-dimensional ratios of vessel characteristics, specifically, length-to-beam, beam-to-draft, and length-to-draft ratios. As shown in Figure 4-9, vessel length-to-beam ratio plateaus at just over 9.0, which corresponds to the ratio associated with Panamax limits. It is interesting, however, that even the very large, clearly post-Panamax vessels stay below this plateau. The reason is most likely a structural one. A vessel that is excessively long relative to its beam or depth requires extremely large (and disproportional) longitudinal structural members to withstand the structural bending moments experienced. A vessel that is more moderate in its dimensional ratios requires structure more proportionally suited to the overall vessel size. Figure 4-12 shows containership vessel DWT construction over time and illustrates the increasing size trends of containerships, especially the recent “boom” in vessel DWT during the past decade. Figures 4-13 through 4-15 again illustrate non-dimensional ratios of vessel dimensions, but here versus DWT, illustrating trends associated with vessel size. It is shown that both L/B and L/T are generally larger for larger vessels. The trend in B/T appears somewhat level, but if concentrating on the larger – say, greater than 50,000 DWT vessels – it appears that B/T tends to increase with increasing DWT. The increasing B/T trend is also shown temporally back in Figure 4-10. TEU capacity versus DWT is shown in Figure 4-16, and clearly illustrates a linear relationship between the two parameters. A more subtle observation is that for a given DWT, present TEU capacity is higher than it used to be. For example, for a 40,000-DWT containership, in the 1970’s TEU capacity was typically below 2,500, while in the 1990’s, the TEU capacity for the same DWT is typically above 2,500. It follows that since B/T is increasing for vessels with larger DWT, and TEU and DWT have a linear relationship, B/T would increase for higher-TEU containerships. This is evident to some extent in Figure 4-17 where vessels with TEU capacities greater than 5,000 have B/T ratios above 3.0.

DRAFT FINAL REPORT: Shipping Trends Analysis for Impacts of Navigation Trends on Channel Usage and Design
18 Analysis and Key Findings
An observation not apparent in any plot is that some liner companies appear to understate the capacity of their ships. For example, the stated capacity of Maersk’s Sovereign Maersk is 6,600 TEUs, but some experts estimate that the actual capacity may be as high as 8,700 TEUs. P&O Nedlloyd has a series of 6,600-TEU ships that have similar drafts and beams but are 47 meters shorter and have tonnages that are 22,000 DWT lower than the Sovereign Maersk. Data in the NDNS report reflect the adjusted 8,700 TEU capacity for the Sovereign Maersk. When plotted with this capacity, the data falls in line with existing containership trends as shown throughout this section. However, had the TEUs capacity not been adjusted, the data would show notable outliers and appear erroneous. This alleged under-reporting of vessel capacity is troublesome for many analysts, because of the difficulty in assessing cargo capacities. Further investigation into this problem should be made.
0
50
100
150
200
250
300
1970 1975 1980 1985 1990 1995Year
Shi
ps
6000+ TEUs5000-6000 TEUs4000-5000 TEUs3000-4000 TEUs2000-3000 TEUs1000-2000 TEUs<1000 TEUs
Figure 4-3. Containerships: Number of ships constructed per year.

DRAFT FINAL REPORT: Shipping Trends Analysis for Impacts of Navigation Trends on Channel Usage and Design
Analysis and Key Findings 19
0
1
2
3
4
5
6
7
8
1970 1975 1980 1985 1990 1995
Mill
ions
Year
DW
T6000+ TEUs5000-6000 TEUs4000-5000 TEUs3000-4000 TEUs2000-3000 TEUs1000-2000 TEUs<1000 TEUs
Figure 4-4. Containerships: DWT constructed per year.
0
100
200
300
400
500
600
1970 1975 1980 1985 1990 1995
Thou
sand
s
Year
TEU
s
6000+ TEUs5000-6000 TEUs4000-5000 TEUs3000-4000 TEUs2000-3000 TEUs1000-2000 TEUs<1000 TEUs
Figure 4-5. Containerships: TEU capacity constructed per year.

DRAFT FINAL REPORT: Shipping Trends Analysis for Impacts of Navigation Trends on Channel Usage and Design
20 Analysis and Key Findings
0
50
100
150
200
250
300
350
400
1950 1960 1970 1980 1990 2000 2010Year Built
Leng
th (m
)
Figure 4-6. Containerships: Vessel length vs. year constructed.
0
5
10
15
20
25
30
35
40
45
50
1950 1960 1970 1980 1990 2000 2010Year Built
Bea
m (m
)
Figure 4-7. Containerships: Vessel beam vs. year constructed.

DRAFT FINAL REPORT: Shipping Trends Analysis for Impacts of Navigation Trends on Channel Usage and Design
Analysis and Key Findings 21
0
2
4
6
8
10
12
14
16
18
1950 1960 1970 1980 1990 2000 2010Year Built
Dra
ft (m
)
Figure 4-8. Containerships: Vessel design draft vs. year constructed.
3
4
5
6
7
8
9
10
11
12
1950 1960 1970 1980 1990 2000 2010Year Built
L/B
Figure 4-9. Containerships: Vessel length-to-beam ratio vs. year constructed.

DRAFT FINAL REPORT: Shipping Trends Analysis for Impacts of Navigation Trends on Channel Usage and Design
22 Analysis and Key Findings
1.0
1.5
2.0
2.5
3.0
3.5
4.0
4.5
1950 1960 1970 1980 1990 2000 2010Year Built
B/T
Figure 4-10. Containerships: Vessel beam-to-draft ratio vs. year constructed.
5
10
15
20
25
30
1950 1960 1970 1980 1990 2000 2010Year Built
L/T
Figure 4-11. Containerships: Vessel length-to-draft ratio vs. year constructed.

DRAFT FINAL REPORT: Shipping Trends Analysis for Impacts of Navigation Trends on Channel Usage and Design
Analysis and Key Findings 23
0
20
40
60
80
100
120
1955 1960 1965 1970 1975 1980 1985 1990 1995 2000 2005
Thou
sand
s
Year Built
DW
T
Figure 4-12. Containerships: Vessel DWT vs. year constructed.
3
4
5
6
7
8
9
10
11
12
0 20,000 40,000 60,000 80,000 100,000 120,000DWT
L/B
1960-19691970-19791980-19891990-2000
Figure 4-13. Containerships: Vessel L/B vs. DWT.

DRAFT FINAL REPORT: Shipping Trends Analysis for Impacts of Navigation Trends on Channel Usage and Design
24 Analysis and Key Findings
1.0
1.5
2.0
2.5
3.0
3.5
4.0
4.5
0 20,000 40,000 60,000 80,000 100,000 120,000DWT
B/T
1960-19691970-19791980-19891990-2000
Figure 4-14. Containerships: Vessel B/T vs. DWT.
5
10
15
20
25
30
0 20,000 40,000 60,000 80,000 100,000 120,000DWT
L/T
1960-19691970-19791980-19891990-2000
Figure 4-15. Containerships: Vessel L/T vs. DWT.

DRAFT FINAL REPORT: Shipping Trends Analysis for Impacts of Navigation Trends on Channel Usage and Design
Analysis and Key Findings 25
0
1,000
2,000
3,000
4,000
5,000
6,000
7,000
8,000
9,000
10,000
0 20,000 40,000 60,000 80,000 100,000 120,000DWT
TEU
1960-19691970-19791980-19891990-2000
Figure 4-16. Containerships: TEU capacity vs. DWT.
1.0
1.5
2.0
2.5
3.0
3.5
4.0
4.5
0 2,000 4,000 6,000 8,000 10,000TEU
B/T
1960-19691970-19791980-19891990-2000
Figure 4-17. Containerships: B/T vs. TEU.

DRAFT FINAL REPORT: Shipping Trends Analysis for Impacts of Navigation Trends on Channel Usage and Design
26 Analysis and Key Findings
4.2.2 RO/ROs Roll-on/roll-off vessels (RO/ROs) are often included in the general cargo category (as they are in the NDNS report), but here are treated separately because their dimensions and overall vessel characteristics are usually significantly different from those of other types of general cargo vessels. For example, B/T ratios for RO/ROs commonly fall between 2.5 to 4.0, while for general cargo vessels, the range is significantly lower – typically between 2.0 and 3.0. Also, L/T ratios for RO/ROs commonly fall between 15 and 25, while for general cargo vessels the range is typically between 12 and 20. The reason for these differences is usually cargo density and ease of arrangement with respect to loading practices. It is by and large much easier to arrange a general cargo ship to effectively utilize cargo space below the waterline, whereas it is more difficult to effectively utilize space below the waterline within RO/ROs since series of interior ramps must be constructed to reach lower decks. RO/RO cargo also tends to be less dense and not pack as tightly as general cargo. For these reasons, RO/ROs generally have shallower drafts for equivalent length and beam dimensions than general cargo vessels. Figures 4-18 through 4-29 illustrate the temporal and dimensional characteristics and trends of RO/RO vessel types. It is interesting that nearly all RO/ROs are within Panamax dimensions. Most of the larger (30,000 - 50,000+ DWT) RO/ROs were constructed in the 1970s; while most RO/RO constructed within the last decade were smaller than 30,000 DWT. With respect to time, L/B is decreasing, B/T is increasing, and L/T is remaining relatively constant for RO/ROs. These trends are not as evident when plotted relative to vessel size.

DRAFT FINAL REPORT: Shipping Trends Analysis for Impacts of Navigation Trends on Channel Usage and Design
Analysis and Key Findings 27
0
20
40
60
80
100
120
140
160
1970 1975 1980 1985 1990 1995Year
Shi
ps40k+DWT30k-40k20k-30k10k-20k<10k
Figure 4-18. RO/ROs: Number of Ships constructed per year
.
0
200
400
600
800
1000
1200
1400
1600
1970 1975 1980 1985 1990 1995
Thou
sand
s
Year
DW
T
40k+DWT30k-40k20k-30k10k-20k<10k
Figure 4-19. RO/ROs: DWT constructed per year.

DRAFT FINAL REPORT: Shipping Trends Analysis for Impacts of Navigation Trends on Channel Usage and Design
28 Analysis and Key Findings
0
50
100
150
200
250
300
350
1960 1965 1970 1975 1980 1985 1990 1995 2000 2005Year
Leng
th (m
)
Figure 4-20. RO/ROs: Vessel length vs. year constructed.
0
5
10
15
20
25
30
35
40
1960 1965 1970 1975 1980 1985 1990 1995 2000 2005Year
Bea
m (m
)
Figure 4-21. RO/ROs: Vessel beam vs. year constructed.

DRAFT FINAL REPORT: Shipping Trends Analysis for Impacts of Navigation Trends on Channel Usage and Design
Analysis and Key Findings 29
0
2
4
6
8
10
12
14
1960 1965 1970 1975 1980 1985 1990 1995 2000 2005Year
Dra
ft (m
)
Figure 4-22. RO/ROs: Vessel design draft vs. year constructed.
0
1
2
3
4
5
6
7
8
9
10
1960 1965 1970 1975 1980 1985 1990 1995 2000 2005Year
L/B
Figure 4-23. RO/ROs: Vessel length-to-beam ratio vs. year constructed.

DRAFT FINAL REPORT: Shipping Trends Analysis for Impacts of Navigation Trends on Channel Usage and Design
30 Analysis and Key Findings
0
1
2
3
4
5
6
7
8
1960 1965 1970 1975 1980 1985 1990 1995 2000 2005Year
B/T
Figure 4-24. RO/ROs: Vessel beam-to-draft ratio vs. year constructed.
0
5
10
15
20
25
30
35
40
1960 1965 1970 1975 1980 1985 1990 1995 2000 2005Year
L/T
Figure 4-25. RO/ROs: Vessel length-to-draft ratio vs. year constructed.

DRAFT FINAL REPORT: Shipping Trends Analysis for Impacts of Navigation Trends on Channel Usage and Design
Analysis and Key Findings 31
0
10
20
30
40
50
60
70
1960 1965 1970 1975 1980 1985 1990 1995 2000 2005
Thou
sand
s
Year
DW
T
Figure 4-26. RO/ROs: DWT vs. year constructed.
0
1
2
3
4
5
6
7
8
9
10
0 10,000 20,000 30,000 40,000 50,000 60,000 70,000DWT
L/B
1960-19691970-19791980-19891990-2000
Figure 4-27. RO/ROs: L/B vs. DWT.

DRAFT FINAL REPORT: Shipping Trends Analysis for Impacts of Navigation Trends on Channel Usage and Design
32 Analysis and Key Findings
0
1
2
3
4
5
6
7
8
0 10,000 20,000 30,000 40,000 50,000 60,000 70,000DWT
B/T
1960-19691970-19791980-19891990-2000
Figure 4-28. ROR/ROs: B/T vs. DWT.
0
5
10
15
20
25
30
35
40
0 10,000 20,000 30,000 40,000 50,000 60,000 70,000DWT
L/T
1960-19691970-19791980-19891990-2000
Figure 4-29. RO/ROs: L/T vs. DWT.

DRAFT FINAL REPORT: Shipping Trends Analysis for Impacts of Navigation Trends on Channel Usage and Design
Analysis and Key Findings 33
4.2.3 General Cargo/Breakbulk Figures 4-30 through 4-41 illustrate vessel trends and characteristics of general cargo vessels. Interestingly, the predominate size range of general cargo carriers has decreased from 10-20,000 DWT in the early 1970’s to less than 10,000 most recently. This is mostly because the majority of large-volume cargo transport is done through specialized vessel types, e.g., containerships. Temporally, L/B for these vessels is clearly significantly decreasing, B/T is increasing and L/T is decreasing. A decreasing trend in B/T is also evident with respect to DWT. Each of these trends seen in general cargo/breakbulk cargo vessel characteristics is more significant than those seen for other vessel types.
0
50
100
150
200
250
300
350
400
1970 1975 1980 1985 1990 1995Year
Shi
ps
40K+DWT30K-40K20K-30K10K-20K<10K
Figure 4-30. General Cargo/Breakbulk Ships: Number of ships constructed per year.

DRAFT FINAL REPORT: Shipping Trends Analysis for Impacts of Navigation Trends on Channel Usage and Design
34 Analysis and Key Findings
0
0.5
1
1.5
2
2.5
3
3.5
4
4.5
5
1970 1975 1980 1985 1990 1995
Mill
ions
Year
DW
T40K+DWT30K-40K20K-30K10K-20K<10K
Figure 4-31. General Cargo/Breakbulk Ships: DWT constructed per year.
0
50
100
150
200
250
300
1940 1950 1960 1970 1980 1990 2000 2010
Year
Leng
th (m
)
Figure 4-32. General Cargo/Breakbulk Ships: Vessel length vs. year constructed.

DRAFT FINAL REPORT: Shipping Trends Analysis for Impacts of Navigation Trends on Channel Usage and Design
Analysis and Key Findings 35
0
5
10
15
20
25
30
35
40
45
1940 1950 1960 1970 1980 1990 2000 2010
Year
Bea
m (m
)
Figure 4-33. General Cargo/Breakbulk Ships: Vessel beam vs. year constructed.
0
2
4
6
8
10
12
14
16
1940 1950 1960 1970 1980 1990 2000 2010
Year
Dra
ft (m
)
Figure 4-34. General Cargo/Breakbulk Ships: Vessel design draft vs. year constructed.

DRAFT FINAL REPORT: Shipping Trends Analysis for Impacts of Navigation Trends on Channel Usage and Design
36 Analysis and Key Findings
0
1
2
3
4
5
6
7
8
9
10
1940 1950 1960 1970 1980 1990 2000 2010
Year
L/B
Figure 4-35. General Cargo/Breakbulk Ships: Vessel length-to-beam ratio vs. year constructed.
0
1
2
3
4
5
6
1940 1950 1960 1970 1980 1990 2000 2010
Year
B/T
Figure 4-36. General Cargo/Breakbulk Ships: Vessel beam-to-draft ratio vs. year constructed.

DRAFT FINAL REPORT: Shipping Trends Analysis for Impacts of Navigation Trends on Channel Usage and Design
Analysis and Key Findings 37
0
5
10
15
20
25
30
35
1940 1950 1960 1970 1980 1990 2000 2010
Year
L/T
Figure 4-37. General Cargo/Breakbulk Ships: Vessel length-to-draft ratio vs. year constructed.
0
10
20
30
40
50
60
1940 1950 1960 1970 1980 1990 2000 2010
Thou
sand
s
Year
DW
T
Figure 4-38. General Cargo/Breakbulk Ships: Vessel deadweight tonnage vs. year constructed.

DRAFT FINAL REPORT: Shipping Trends Analysis for Impacts of Navigation Trends on Channel Usage and Design
38 Analysis and Key Findings
0
1
2
3
4
5
6
7
8
9
10
0 10,000 20,000 30,000 40,000 50,000 60,000DWT
L/B
1943-19591960-19691970-19791980-19891990-2000
Figure 4-39. General Cargo/Breakbulk Ships: Vessel L/B vs. DWT.
0
1
2
3
4
5
6
0 10,000 20,000 30,000 40,000 50,000 60,000DWT
B/T
1943-19591960-19691970-19791980-19891990-2000
Figure 4-40. General Cargo/Breakbulk Ships: Vessel B/T vs. DWT.

DRAFT FINAL REPORT: Shipping Trends Analysis for Impacts of Navigation Trends on Channel Usage and Design
Analysis and Key Findings 39
0
5
10
15
20
25
30
35
0 10,000 20,000 30,000 40,000 50,000 60,000DWT
L/T
1943-19591960-19691970-19791980-19891990-2000
Figure 4-41. General Cargo/Breakbulk Ships: Vessel L/T vs. DWT.

DRAFT FINAL REPORT: Shipping Trends Analysis for Impacts of Navigation Trends on Channel Usage and Design
40 Analysis and Key Findings
4.2.4 Dry Bulk Figures 4-42 through 4-54 illustrate various temporal and dimensional trends of bulker parameters. As with many of the vessel types investigated, bulker construction experienced a severe drought in the late 1980’s, but appears to be recovering and increasing steadily over the past decade. The majority of new construction has shifted from under 25,000 DWT in the 1970s to 100,000 DWT presently. Because of this shift in vessel size, annual DWT constructed in 1998 has exceeded that at any other year even though there were far fewer ships being produced than in the 1970’s and early 1980’s. A “Panamax-breakpoint” is evident in figure 4-45. Bulkers are either clearly designed to Panamax limits (B ≤ 33 m) or they brashly exceed the limit. In other words, there are almost no vessels that are just slightly post-Panamax. Recently, there is a dearth of vessel construction of bulkers between 100,000 DWT and 150,000 DWT; most recent vessel constructions are either less than 100,000 DWT or greater than 150,000 DWT. For bulker construction, L/B is decreasing, B/T is increasing and L/T is remaining constant with respect to time. In addition, DWT/LBT is also notably increasing temporally. This means that more cargo can now be carried on a vessel with given nominal length, beam and draft dimensions than was formerly possible. This apparent increase in cargo capacity is likely due to two factors: (1) vessel propulsion systems have become smaller and lighter, allowing the freed-up space and weight to be replaced by additional cargo, and (2) block coefficients are increasing, i.e., vessel hull shapes are becoming boxier, so that more submerged volume and therefore displacement is created within the “outline” of L×B×T (see Figure 2-3 for clarification).

DRAFT FINAL REPORT: Shipping Trends Analysis for Impacts of Navigation Trends on Channel Usage and Design
Analysis and Key Findings 41
0
100
200
300
400
500
600
700
1970 1975 1980 1985 1990 1995Year
Shi
ps200K+DWT100K-200K50K-100K25K-50K<25K
Figure 4-42. Dry Bulkers: Number of ships constructed per year.
0
5
10
15
20
25
1970 1975 1980 1985 1990 1995
Mill
ions
Year
DW
T
200K+DWT100K-200K50K-100K25K-50K<25K
Figure 4-43. Dry Bulkers: Deadweight tonnage constructed per year.

DRAFT FINAL REPORT: Shipping Trends Analysis for Impacts of Navigation Trends on Channel Usage and Design
42 Analysis and Key Findings
0
50
100
150
200
250
300
350
400
1940 1950 1960 1970 1980 1990 2000 2010
Year
Leng
th (m
)
Figure 4-44. Dry Bulkers: Vessel length vs. year constructed.
0
10
20
30
40
50
60
70
1940 1950 1960 1970 1980 1990 2000 2010
Year
Bea
m (m
)
Figure 4-45. Dry Bulkers: Vessel beam vs. year constructed.

DRAFT FINAL REPORT: Shipping Trends Analysis for Impacts of Navigation Trends on Channel Usage and Design
Analysis and Key Findings 43
0
5
10
15
20
25
1940 1950 1960 1970 1980 1990 2000 2010
Year
Dra
ft (m
)
Figure 4-46. Dry Bulkers: Vessel design draft vs. year constructed.
0
2
4
6
8
10
12
1940 1950 1960 1970 1980 1990 2000 2010
Year
L/B
Figure 4-47. Dry Bulkers: Vessel length-to-beam ratio vs. year constructed.

DRAFT FINAL REPORT: Shipping Trends Analysis for Impacts of Navigation Trends on Channel Usage and Design
44 Analysis and Key Findings
0.0
0.5
1.0
1.5
2.0
2.5
3.0
3.5
4.0
4.5
1940 1950 1960 1970 1980 1990 2000 2010
Year
B/T
Figure 4-48. Dry Bulkers: Vessel beam-to-draft ratio vs. year constructed.
0
5
10
15
20
25
30
35
40
1940 1950 1960 1970 1980 1990 2000 2010
Year
L/T
Figure 4-49. Dry Bulkers: Vessel length-to-draft ratio vs. year constructed.

DRAFT FINAL REPORT: Shipping Trends Analysis for Impacts of Navigation Trends on Channel Usage and Design
Analysis and Key Findings 45
0
50
100
150
200
250
300
350
400
1940 1950 1960 1970 1980 1990 2000 2010
Thou
sand
s
Year
DW
T
Figure 4-50. Dry Bulkers: Vessel deadweight tonnage vs. year constructed.
0.0
0.2
0.4
0.6
0.8
1.0
1.2
1940 1950 1960 1970 1980 1990 2000 2010
Year
DW
T/LB
T
Figure 4-51. Dry Bulkers: Ratio of vessel deadweight tonnage to length × beam × draft vs. year constructed.

DRAFT FINAL REPORT: Shipping Trends Analysis for Impacts of Navigation Trends on Channel Usage and Design
46 Analysis and Key Findings
0
2
4
6
8
10
12
0 100,000 200,000 300,000 400,000
DWT
L/B
1951-19591960-19691970-19791980-19891990-2000
Figure 4-52. Dry Bulkers: Vessel L/B vs. DWT
0.0
0.5
1.0
1.5
2.0
2.5
3.0
3.5
4.0
4.5
0 100,000 200,000 300,000 400,000DWT
B/T
1951-19591960-19691970-19791980-19891990-2000
Figure 4-53. Dry Bulkers: Vessel B/T vs. DWT.

DRAFT FINAL REPORT: Shipping Trends Analysis for Impacts of Navigation Trends on Channel Usage and Design
Analysis and Key Findings 47
0
5
10
15
20
25
30
35
40
0 100,000 200,000 300,000 400,000DWT
L/T
1951-19591960-19691970-19791980-19891990-2000
Figure 4-54. Dry Bulkers: Vessel L/T vs. DWT.

DRAFT FINAL REPORT: Shipping Trends Analysis for Impacts of Navigation Trends on Channel Usage and Design
48 Analysis and Key Findings
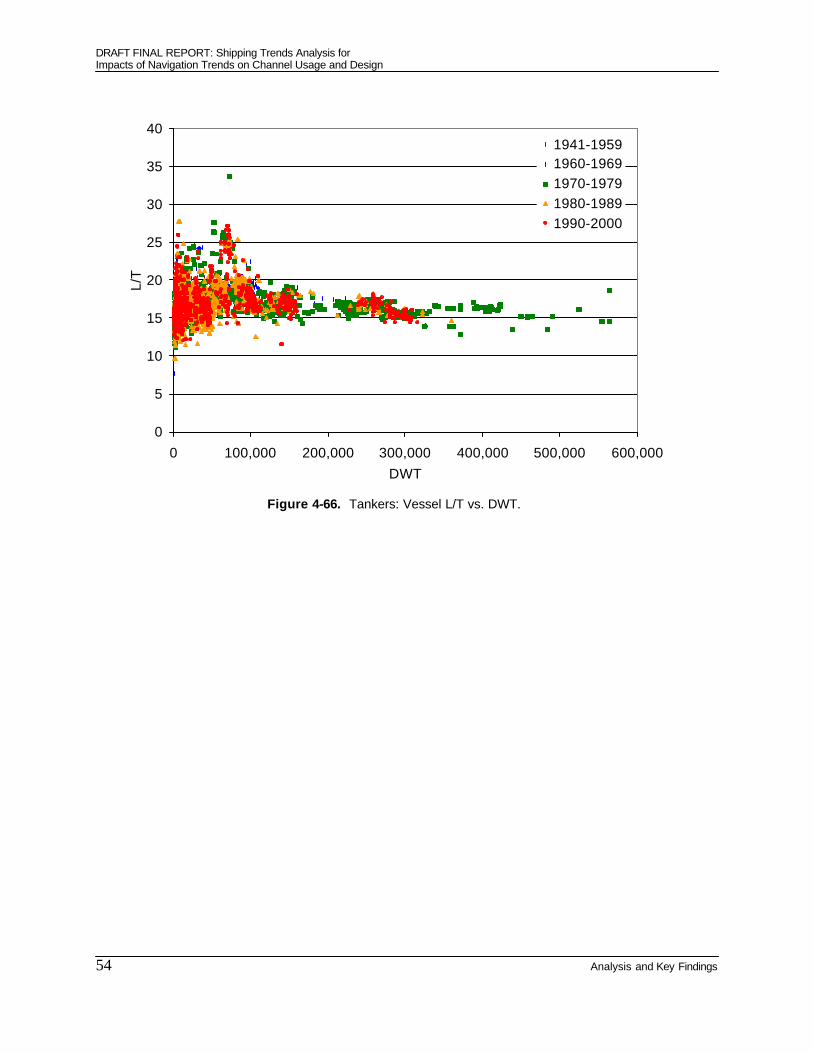
4.2.5 Tankers Tanker vessel characteristics are plotted in Figures 4-55 through 4-66. Tanker sizes increased rapidly until 1975, at which point they dramatically declined. Construction activity recovered slowly. Present maximum vessel sizes have leveled off at about 300,000 DWT. As can be seen in Figure 4-63, there is quite a remarkable void in vessel construction between 150,000 DWT (approximate Suez-max limit) and 250,000 DWT (ULCC) sized vessels. Despite the wild fluctuations in tanker vessel sizes constructed, there are clearly distinguishable trends in non-dimensional parameters. Like all of the other vessel types, L/B is decreasing, B/T is increasing and L/T is remaining roughly constant. Figure 4-64 is particularly telling of trends. During vessel design and construction in the 1970’s, where essentially an absence of port considerations existed (that is, most ULCCs never actually entered a port and therefore never transited a channel) L/B values ranged from 6.0-7.0, and B/T values ranged from 2.0 to 3.0. However, during the 1990’s, when vessels were more moderately sized so as to enable port entry and channel passage, L/B values ranged from 5.0-6.0 and B/T values were typically between 2.5 and 3.5.
0
50
100
150
200
250
300
350
400
450
1970 1975 1980 1985 1990 1995Year
Shi
ps
400k+DWT300k-400k200k-300k100k-200k50k-100k<50k
Figure 4-55. Tankers: Number of ships constructed per year.

DRAFT FINAL REPORT: Shipping Trends Analysis for Impacts of Navigation Trends on Channel Usage and Design
Analysis and Key Findings 49
0
5
10
15
20
25
30
35
40
45
1970 1975 1980 1985 1990 1995
Mill
ions
Year
DW
T400k+DWT300k-400k200k-300k100k-200k50k-100k<50k
Figure 4-56. Tankers: DWT constructed per year.
0
50
100
150
200
250
300
350
400
450
500
1930 1940 1950 1960 1970 1980 1990 2000 2010
Year
Leng
th (m
)
Figure 4-57. Tankers: Vessel length vs. year constructed.

DRAFT FINAL REPORT: Shipping Trends Analysis for Impacts of Navigation Trends on Channel Usage and Design
50 Analysis and Key Findings
0
10
20
30
40
50
60
70
80
90
1930 1940 1950 1960 1970 1980 1990 2000 2010
Year
Bea
m (m
)
Figure 4-58. Tankers: Vessel beam vs. year constructed.
0
5
10
15
20
25
30
35
1930 1940 1950 1960 1970 1980 1990 2000 2010
Year
Dra
ft (m
)
Figure 4-59. Tankers: Vessel design draft vs. year constructed.

DRAFT FINAL REPORT: Shipping Trends Analysis for Impacts of Navigation Trends on Channel Usage and Design
Analysis and Key Findings 51
0
2
4
6
8
10
12
1930 1940 1950 1960 1970 1980 1990 2000 2010
Year
L/B
Figure 4-60. Tankers: Vessel length-to-beam ratio vs. year constructed.
0
1
2
3
4
5
6
1930 1940 1950 1960 1970 1980 1990 2000 2010
Year
B/T
Figure 4-61. Tankers: Vessel beam-to-draft ratio vs. year constructed.

DRAFT FINAL REPORT: Shipping Trends Analysis for Impacts of Navigation Trends on Channel Usage and Design
52 Analysis and Key Findings
0
5
10
15
20
25
30
35
40
1930 1940 1950 1960 1970 1980 1990 2000 2010
Year
L/T
Figure 4-62. Tankers: Vessel length-to-draft ratio vs. year constructed.
0
100
200
300
400
500
600
1930 1940 1950 1960 1970 1980 1990 2000 2010
Thou
sand
s
Year
DW
T
Figure 4-63. Tankers: Vessel DWT vs. year constructed.

DRAFT FINAL REPORT: Shipping Trends Analysis for Impacts of Navigation Trends on Channel Usage and Design
Analysis and Key Findings 53
0
2
4
6
8
10
12
0 100,000 200,000 300,000 400,000 500,000 600,000DWT
L/B
1941-19591960-19691970-19791980-19891990-2000
Figure 4-64. Tankers: Vessel L/B vs. DWT.
0
1
2
3
4
5
6
0 100,000 200,000 300,000 400,000 500,000 600,000DWT
B/T
1941-19591960-19691970-19791980-19891990-2000
Figure 4-65. Tankers: Vessel B/T vs. DWT.
DRAFT FINAL REPORT: Shipping Trends Analysis for Impacts of Navigation Trends on Channel Usage and Design
54 Analysis and Key Findings
0
5
10
15
20
25
30
35
40
0 100,000 200,000 300,000 400,000 500,000 600,000DWT
L/T
1941-19591960-19691970-19791980-19891990-2000
Figure 4-66. Tankers: Vessel L/T vs. DWT.

DRAFT FINAL REPORT: Shipping Trends Analysis for Impacts of Navigation Trends on Channel Usage and Design
Conclusions 55
5. Conclusions This report has summarized current and expected future trends within the international shipping industry. Also presented is a detailed analysis of trends in some critical vessel characteristics over the past 30 years for five groups of commercial vessels, namely Containerships, RO/ROs, General Cargo/Breakbulk Vessels, Dry Bulkers and Tankers. It is the combination of the industry trends and the vessel trends that culminates in the following general and specific conclusions regarding shipping trends. A clearly relevant finding contained within the NDNS report is that containerization is steadily increasing. Also, while tankers and bulkers may transport the most cargo by tonnage, containerships typically carry cargo with the highest value to weight ratio. Therefore, even if bulk cargos continue to outweigh containerized cargos, the containerized cargos may likely “outvalue” the bulk cargoes. In terms of the national economy, more emphasis and attention may need to be placed on containerized cargo and containership traffic concerns. Another finding is that economies of scale are continually driving cargo capacities higher for all vessel types investigated here. It is apparent that for all vessel types investigated during this INTUDE analysis, the following changes in characteristics have been observed:
• L/B is decreasing for all ship types. • B/T is increasing for all ship types. Containership B/T is increasing more slowly than
other vessel types. Figure 5-1 shows a linear regression of B/T data vs. year plotted for each vessel type analyzed.
• L/T is either not changing or decreasing slightly for all ship types. The resultant effect of these changes translates into the following dimensional changes:
• Vessel beam is increasing more quickly than length and draft. • Length is increasing more slowly than beam, at approximately the same rate as draft. • Draft is increasing more slowly than beam, at approximately the same rate as length.
These systematic trends across all vessel types indicate that there must be some underlying causes that are driving vessel designers to increase vessels’ beam dimensions more quickly than length and draft dimensions. In other words, there must be restrictions on vessel length and vessel draft that do not exist for vessel beam.

DRAFT FINAL REPORT: Shipping Trends Analysis for Impacts of Navigation Trends on Channel Usage and Design
56 Conclusions
2.0
2.5
3.0
3.5
1965 1970 1975 1980 1985 1990 1995 2000 2005
Year
B/T
RO/ROs
Containerships
Tankers
Bulkers
General Cargo/Breakbulk
Figure 5-1. Beam-to-draft ratio (linear regression) vs. year constructed for different vessel types.
The length restriction is most likely tied to port berth length limitations. Other length restrictions exist for lock passage, but for vessels without lock transits within their voyages, the berth length is the remaining insurmountable limitation on length. The cause of the draft restriction may be a depth “barrier,” manifested by channel depth and depth increase constraints that prevent – or at the very least discourage – vessel designers from increasing design drafts as quickly as they would otherwise choose to increase cargo-carrying capacity. Although the domestic and international channel design process is set up so as to be able to accommodate larger vessels if proven economically advantageous, the fact is that channel deepening projects often require 10-20 years before completion. From the shipper’s standpoint, when placing a vessel with an assumed 30-year design life into service, it is unlikely that the shipper will want to light-load a vessel for one-third to two-thirds of its service life. Ship designers will therefore strive to accomplish larger cargo capacities by modifying other available vessel dimensions – namely, beam, length (to a lesser extent because of previously mentioned constraints), and CB (block coefficient). The decrease in propulsion plant sizes has also made ship space available for cargo; however, the vessel designer usually has less direct control over changes in sizes of power plants, which are typically technology-driven. In brief, the vessel designer will most likely choose to increase vessel beam and block coefficient to accommodate more cargo. While this will hinder maneuverability, it will allow the larger cargo shipment to get through the channel. Another limitation affecting length and draft may be directly economic. As can be seen in Table 2-1, pilotage and pier rental costs are often a function of vessel length and draft, but

DRAFT FINAL REPORT: Shipping Trends Analysis for Impacts of Navigation Trends on Channel Usage and Design
Conclusions 57
not beam. Therefore it is less expensive on a per-trip basis to have a wider ship than one that is longer or deeper for the same tonnage. Regional Trends Figures 5-2 and 5-3 summarize some of the regional vessel traffic findings from the NDNS report. Specifically, Figure 5-2 indicates the projected increase in annual numbers of vessel calls in 2020 over the number of calls experienced in 2000 by vessel type and U.S. region. Figure 5-3 normalizes those numbers as percentage increases. As can be seen from the two plots, although the Atlantic Coast will experience the largest increase in numbers of containership calls, the gulf coast will experience the largest percentage increase in containership traffic, more than quadrupling the presently experienced containership traffic. The relevant primary issues and concerns are summarized below in Table 5-1.
Table 5-1. Summary of shipping trends and impacts on channel design for different U.S. regions.
Summary of Shipping Trends and Channel Design Concerns Atlantic Coast
• There is a significant projected increase in containership and general cargo vessel traffic on the Atlantic Coast over the next 20 years (92% and 185% respectively).
• It is likely that the vessels involved will have higher beam-to-draft ratios, causing greater channel blockage effects, and associated increased squat. The vessels are likely to operate more slowly and require tug assist more frequently.
• As even larger container cranes become standard at portside installation, there will certainly be a new containership beam “boom” to expand to meet and take advantage of the new crane reach capacity(ies).
• The increased beams, the potential increased use of tugs, and the high wind area of containerships will require greater channel width, and may still impact bank suction and erosion effects, and well as impact vessel traffic patterns.
Gulf Coast
• The Gulf Coast is projected to see the greatest increase (percentage-wise) in containership traffic over the next 20 years – more than 350%. The issues mentioned for the Atlantic Coast apply here.
• An additional complication is introduced regarding traffic congestion. Most of the Gulf Coast ports are already heavily congested and this projected boom of container traffic is likely to worsen the situation. More emphasis must be placed on vessel passing and other routing issues.
Pacific Coast
• The Pacific Coast is projected to see significant and relatively equal increases in Containership and Tanker traffic (150% and 131% respectively). The same issues affecting Atlantic Coast channel design apply here.
• The blockage factor issue may be more critical since a large percentage of the additional vessels will be non-containerships whose beams can be increased more easily.
Great Lakes
• Significant changes to vessels designed for use in this region are not likely. Most vessel transits are already constrained by one or usually several lock passages, and until lock dimensions are significantly modified, vessel dimensions are not likely to change. Vessels are already designed to maximum dimension limits.
• Changes in channel design due to shipping trends would primarily include congestion and one-way vs. two-way traffic issues. In order to transport more cargo and accommodate more visits, vessel traffic density must increase since vessel size cannot.

DRAFT FINAL REPORT: Shipping Trends Analysis for Impacts of Navigation Trends on Channel Usage and Design
58 Conclusions
39.8
19.2
4.64.0 14.6
6.77.110.1
24.4
2.42.92.7
0.40.02.10.10.05.010.015.020.025.030.035.040.0
Projected Increase in Annual Number of Calls (Thousands)
2000-2020
Container
General Cargo
Dry Bulk
Tanker
Atlantic Coast
Gulf Coast
Pacific Coast
Great Lakes
Figure 5-2. Projected increase in annual number of port calls from 2000-2020.
(Data source: NDNS draft report.)
185%
92%80%79%
373%
93%95%103%
150%
66%67%
131%200%
9%
82%48%
0%50%100%150%200%250%300%350%400%
Percentage Increase in Annual Number of
Calls, 2000-2020
Container
General Cargo
Dry Bulk
Tanker
Atlantic Coast
Gulf Coast
Pacific Coast
Great Lakes
Figure 5-3. Projected percent increase in port calls from 2000-2020.
(Data source: NDNS draft report.)

DRAFT FINAL REPORT: Shipping Trends Analysis for Impacts of Navigation Trends on Channel Usage and Design
Conclusions 59
Impacts of Tug Assist As mentioned previously, these shipping trends may lead to vessels operating more slowly and, because of maneuverability concerns, the slowed vessels may require tug assistance. If more and more vessels require the use of tugs to maneuver safely through navigation channels, other issues related to channel design and safety may be introduced. First, a vessel with tug assist usually occupies more channel width and/or more channel length than a vessel operating independently. This introduces the fact that a channel originally designed for say, a 100-ft beam vessel is now accommodating a “compound vessel” with a beam significantly larger than 100 ft – up to 20% or more. These larger compound-vessel dimensions impact not only the required linear dimensions of the channel (e.g., a wider channel may be required), but also may restrict passing within a channel (i.e. a two-way channel may be restricted to one-way use). Even if two-way traffic can still be managed using one or both vessels under tug assist, another complication is introduced. Much of the hydrodynamics of passing vessels has been studied and analyzed for independent vessels; there is not much information on the effects of tug presence on the hydrodynamics in the vicinity of the vessel. Final Observations It is imperative that channel design and maintenance be intimately linked to channel usage and vessel design. When there is a disjoint between channel design or maintenance procedures and channel usage or vessel design, the safety or economics of shipping will be compromised. A simplified schematic of the interrelation between channel design, vessel design, channel usage and safety/efficiency issues is shown in Figure 5-1. The arrows indicate communication or feedback relationships, with the dotted arrows signifying relationships that have opportunities to be strengthened. At present, there seems to be sporadic transfer of design information between channel designers and vessel designers. The present channel design practice involves in-depth consideration of only two vessel characteristics: DWT and draft. While DWT is inseparably linked to the economics of shipping, there are many complexities introduced when design draft is considered without looking at other vessel characteristics.

DRAFT FINAL REPORT: Shipping Trends Analysis for Impacts of Navigation Trends on Channel Usage and Design
60 Conclusions
Channel Design and Maintenance
Vessel Design/ Operating
Characteristics
Channel Usage
Channel Safety/
Efficiency Issues
Economic/Trade
Demands
USACE Guidance/
Procedures/ Policies
Figure 5-4. Schematic of select items involved in iterative process of channel usage. Dashed lines indicate relationships that can be strengthened.

DRAFT FINAL REPORT: Shipping Trends Analysis for Impacts of Navigation Trends on Channel Usage and Design
Conclusions 61
This page intentionally left blank.

DRAFT FINAL REPORT: Shipping Trends Analysis for Impacts of Navigation Trends on Channel Usage and Design
62
APPENDIX A
A Brief Discussion of Common Commercial Merchant Vessels

DRAFT FINAL REPORT: Shipping Trends Analysis for Impacts of Navigation Trends on Channel Usage and Design
A-2 Common Commercial Merchant Vessels

DRAFT FINAL REPORT: Shipping Trends Analysis for Impacts of Navigation Trends on Channel Usage and Design
Common Commercial Merchant Vessels A-3
Appendix A. A Brief Discussion of Common Commercial Merchant Vessels6 A ship’s cargo capacity, speed, power, and bunker capacity (space allocated to carrying fuel) can be chosen to suit the annual amount of cargo a shipowner wants each ship or a fleet of ships to carry on a particular trade route, with ships calling at each port on the route on a regular published schedule. Ships operating in this kind of service are known as cargo liners. Cargoships that do not operate on regular schedules or designated trade routes, but are prepared to call at any port as needed and to transport any type of cargo to any other port within their operating range, are called tramp ships. Tramp ships tend to be somewhat smaller and slower than cargo liners. In the early days of self-propelled steel ships, virtually all cargo ships were general cargo ships or “breakbulk” ships. They were designed to carry any kind of dry cargo, lifting it aboard with their own cargo-handling gear. The modern trend in cargo ship design is toward specialization, either in regard to how the cargo is carried (in bulk, in containers, in barges, in vehicles) or to the type of cargo (oil, chemicals, ore, grain, lumber, liquefied gases). These special types have not supplanted the general cargo ship entirely, but for many trades they predominate because they are more efficient as part of an over-all transportation system. In the ship descriptions that follow, the features of each special type that distinguish it from other types are emphasized. Differences will be found mostly in the size and arrangement of the cargo spaces which make them suitable for special kinds of cargo, in the type of cargo-handling gear installed, and in the nature of the provisions made to access the cargo spaces for efficient loading and discharging. A.1 General Cargo General cargo ships often carry cargo of various types, but the term “general cargo” usually refers to cargo that has been containerized, palletized, or is otherwise too large to be handled by conventional bulk-type techniques (see below). Although it may be confusing that “general cargo” is listed here as a main category and again as a sub-category, it is not a typographical error. Strictly speaking, general cargo vessels encompass a wide variety of vessel types, including containerships, RO/ROs, etc. However, the term “general cargo vessel” is more commonly applied to the smaller vessels with diverse cargo-handling capabilities, as described later in the subsection. If a group of small packages of general cargo is combined into a larger unit before being placed aboard ship, the cargo is said to be unitized. Various methods of unitizing cargo have been developed and special ships have evolved to take advantage of the increase in efficiency of cargo handling that unitization can achieve.
6 This appendix includes sections extracted from Robert B. Zubaly’s Applied Naval Architecture, Cornell Maritime Press, Centreville, MD, 1996.

DRAFT FINAL REPORT: Shipping Trends Analysis for Impacts of Navigation Trends on Channel Usage and Design
A-4 Common Commercial Merchant Vessels
A.1.1 Containerships Containerships are the most ubiquitous of the unitized cargo ships and perhaps the most well-known general cargo vessel. Containerships are specially designed and outfitted to carry cargo that has been unitized by packing it into standard size containers. The advantages to be gained by containerization of cargo are numerous, for example:
• Cargo-handling time and the manpower required for cargo handling are reduced significantly, especially in the vertical cellular type of container-ship, in which containers never have to be shifted transversely or fore and aft after they are lowered into the ship, and lashing, packing, and tying down of cargo inside the holds are eliminated.
• Containerized cargoes allow for the intermodal (road, rail, sea) transport of goods with minimum time spent in transferring cargo between modes.
• Containerized cargo, if it is properly stowed in containers at the point of origin, is less prone to damage of goods during transit than breakbulk cargo is.
• Since the containers can be locked and sealed at the point of origin and not opened except at the final destination point, containerized cargo is less subject to pilferage than breakbulk cargo is.
• Containers keep the cargo inside protected against the weather, so a ship’s cargo capacity can be extended when carrying containers by stowing significant numbers of containers on the weather deck.
The concept of the containership arose in the 1950s out of the desire to reduce the time that a cargo ship spent in port, which was about 50 percent of its time for a typical breakbulk operation. Early containerships, which were converted from other types, soon gave way to the special designs of containerships that are so common in the major finished goods trade routes of the world today. In the pure containership, all cargo is unitized, and the containers are built to standard dimensions developed by international agreement so that they are compatible with the cell guides inside any containership and with the special fittings that are installed on the decks of the ships and on the flatbeds of trucks and railcars for transport over highways and railroads. The universally adopted container width is 8 feet (2.435 meters). Several modular lengths are provided for in the standards, the most common lengths in use being 20 feet (6.055 m) and 40 feet (12.190 m). Longer containers in the 45-foot range have come into use in the1990s. When container sizes were first standardized, a height of 8 feet (2.435 m) was adopted, but in fact, it is not necessary to standardize the height since it does not affect the design of any hardware or fittings, but only the height of a stack of containers, which may be variable. Dry cargo boxes of 8.5 feet height are common, and special-purpose boxes for liquid tanks, granular materials, refrigerated goods, and open-top boxes for odd-sized loads may have heights that vary considerably.

DRAFT FINAL REPORT: Shipping Trends Analysis for Impacts of Navigation Trends on Channel Usage and Design
Common Commercial Merchant Vessels A-5
The typical large containership has most or all of the container holds forward of the deckhouse and engine spaces, so that the engine room, deckhouse, and navigating bridge are in either the aft or nearly aft position. There are exceptions: some of the larger ships have been provided with a small house and navigating bridge forward to improve the forward visibility, which becomes a problem when many tiers of containers are stacked on the deck forward of the wheel-house. Most of the pure containerships have no shipboard container-handling gear, since they depend on the giant container-handling cranes located ashore at the container ports to which they trade. Many kinds of special vehicles and lifting devices have been developed to provide for efficient handling of containers within the terminal where the boxes are taken off trucks or railcars, stacked temporarily, and ultimately moved to and placed aboard the containership. The operation has become so efficient compared with the old breakbulk methods that containerships have supplanted almost all breakbulk cargo liners in the major trade routes for manufactured goods. Breakbulk ships remain essential, of course, to serve ports where container-handling equipment is not available, and to carry cargoes that are not suitable to be stowed in containers (steel rails, plates and shapes, and timber, for example). The “cellular” type of containership, which is the most common of the pure containership types, is characterized by the fact that no containers have to be moved or handled after they are lowered into the hold of the ship. To accomplish this, the holds are fitted with container cell guides made of steel angle bars standing vertically and positioned so that a standard size container fits into a cell without jamming, but securely enough against shifting that it needs no provisions for being tied down or other-wise secured. Each container in a given cell stacks on top of the one below until the cell is filled to the deck. Since the deck must be open above all cells, hatches of containerships are very large. They are made as wide as possible, but some space at the ship sides outboard of the container cells is necessary in order that there be adequate deck structure to provide for the required longitudinal structural strength of the ship. There are no lower decks, only the tank top above the double bottom tanks and the main or weather deck. After the holds or cells are filled, hatch covers are fitted, and special fixtures on the deck and on the hatch covers provide for stacking from two to four tiers of containers on the deck. The deck-stowed containers are secured by lashing or by specially designed buttress structures. The cargo capacity gained by stowing containers on the deck makes up for the inefficient utilization of the cubic space inside the ship that occurs because the box-shaped containers cannot be fitted neatly into curved, ship-shaped holds.
A.1.2 RO/ROs Ships on which wheeled vehicles are loaded by driving them aboard using special ramps and doors for the purpose are called “RO/RO” ships, for “roll-on/roll-off.” Prior to the development of the containership, RO/RO ships (then usually called “trailerships”) were used to carry truck trailers loaded with high-value cargo. When cellular containerships came along, however, trailerships were not competitive with them, because the large amount of wasted space taken up by the wheels and chassis of the trailers made them inefficient as compared to the lift-on/lift-off (“LO/LO”)
DRAFT FINAL REPORT: Shipping Trends Analysis for Impacts of Navigation Trends on Channel Usage and Design
A-6 Common Commercial Merchant Vessels
arrangement of the containerships. In contrast to the inefficient use of cargo volume, however, RO/RO ships are extremely efficient in cargo-handling. They have faster cargo-handling rates and quicker turnaround times (shorter port time) than most other types of ships. To reduce wasted cargo space volume, many modern RO/RO ships employ special wheeled dollies carrying cargo-filled containers to move onto and through the ship, rather than the regular over-the-highway truck bodies carried by the original trailerships. Also, as the RO/RO ships evolved and were custom designed for particular trade routes, many of them have become combination carriers, perhaps with containers stacked on deck and RO/RO decks below. Today, the RO/RO feature is also used when the payload itself consists of vehicles – that is, for the transportation of automobiles, trucks, and military vehicles. The particular configurations of RO/RO vessels are endless in the variety of types and locations of ramps and loading ports that they employ, but all of them must have some ramps or elevators that enable the cargo to be loaded by driving vehicles about the ship. Unlike a barge ship that can load and discharge barges far from a pier or roadstead, the RO/RO ship must be able to berth right next to a suitable shoreside facility. Those that employ only stem ramps, however, need only a minimal amount of berth space, if their anchoring gear is sufficient to keep them in position while loading and discharging cargo. Ramps carried aboard ship are unfolded and extended to the shore to make roadways from ship to shore on which the vehicles can be driven. Ramps and the doors into the ship may be located at the stem, on the side, and sometimes even through the bow. The ramps must be adjustable so that the ship can load at varying stages of the tide. Traffic lanes within the ship and ramps are usually sufficiently wide that loading and discharging of the vehicles can take place simultaneously. This capability contributes to the high cargo-handling efficiency of these ships. RO/RO ships usually have many decks, since only one layer of cargo can be placed on each deck. If some of the cargo spaces are dedicated exclusively to the carriage of ordinary passenger cars, they can be built with very low overhead clearance, or removable platform decks may be used to convert one deep hold space into two or more car decks. There are other special features of RO/RO ships that do not have to be contended with in other types of ships. Among them are the need for very large openings in the transverse bulkheads (the bulkheads are needed to limit flooding in the event of a collision) for the vehicles to pass through. The openings must be fitted with heavy watertight doors that must be gasketed and secured before the ship puts to sea. A substantial and reliable ventilation system must also be installed throughout the cargo holds to clear out the noxious exhaust fumes produced by the vehicles during loading and discharging operations. The deck structure requires special attention as well, since the decks must support very heavy vehicle loads.
DRAFT FINAL REPORT: Shipping Trends Analysis for Impacts of Navigation Trends on Channel Usage and Design
Common Commercial Merchant Vessels A-7
A.1.3 General Cargo/Breakbulk General cargo ships transport all kinds of packaged goods. The cargo spaces, or holds, are separated by transverse bulkheads to limit flooding in case an accident should occur. A double bottom for protection against flooding caused by grounding also forms the main fuel oil tanks, called double bottom tanks. General cargoships range from about 430 to 560 feet in length (130-170 meters), and their deadweight (total weight capacity of cargo, fuel, water, and stores) might be between 12,000 and 17,000 tons. Sea speeds of 14 to 25 knots are common, the lower speeds pertaining to tramps and the higher speeds to liner services. Commonly, the main spaces on the ship are arranged with from three to five cargoholds forward of the deckhouse and machinery spaces, and one or two holds aft. In some cases the machinery space is aft and all cargo spaces are forward of it. Each main cargo hold space consists of a deep lower hold just above the double bottom space, plus one or two deck spaces above the hold, depending on the size of the ship and the number of decks. Access to the holds is through weathertight hatches in the decks. Hatches are made as large as possible without weakening the deck structure, so that the need for moving cargo longitudinally and laterally after it has been lowered through the hatch is minimized, thus making cargo handling as efficient as possible. The traditional arrangement of a single line of hatches, one centered on each hold, has been largely replaced by twin and three-across hatch arrangements to open more of the cargo space below to direct access by the cargo-handling gear. Even with the largest possible hatches, however, some of the cargo loaded into a general cargo ship has to be handled individually inside the hold space by manhandling or by forklift trucks, and all of it has to be secured to or wedged against the internal ship structure or to other cargo to prevent it from shifting and sustaining damage after the ship is at sea. Cargo stowage of breakbulk cargo, which arrives in individual lots as opposed to being consolidated into larger units on pallets or in containers, is thus a process that requires considerable time, man-hours, and the skills of trained stevedores.
General cargo ships are outfitted with shipboard cargo-handling gear capable of lifting aboard and lowering into the hatches a great variety of dry cargoes. The traditional gear consists of cargo derricks mounted on deck between the hatches. The derricks have stationary vertical posts (called masts if they are single and on centerline, kingposts or samson posts if they are in pairs) and movable booms pivoted to the masts or kingposts near their bottoms. Cargo booms rigged with wire ropes and hooks are positioned over the pier and over the hatch during cargo loading so that the cargo can be lifted aboard. Numerous patented pivoting cranes and gantry cranes that run on tracks along the sides of the deck are also employed on modem cargo ships instead of derricks. Compared to derricks, cranes require minimal rigging, and many designs have been shown to be superior to the traditional gear in cargo-handling efficiency. Cargo-loading efficiency is also improved on some ships by having cargo side ports in addition to the hatches in the deck.

DRAFT FINAL REPORT: Shipping Trends Analysis for Impacts of Navigation Trends on Channel Usage and Design
A-8 Common Commercial Merchant Vessels
Flexibility and adaptability to all kinds of cargo are the hallmarks of the general cargo ship, so they usually have some provisions for cargoes other than packaged dry goods. For example, they are often equipped to carry liquid cargoes in cargo tanks, and they may have one or more insulated refrigerated holds for transporting food or fish.
Barge Carriers Barge-carrying cargo ships take the concept of unitization to an extreme in terms of the size of the unit load placed aboard the ship. A fully loaded 40-foot container may weigh as much as 30 tons, but the largest of the barges carried by some barge carriers can contain as much as 834 tons of cargo and weigh as much as1,000 tons when loaded to capacity. Thus the barge carriers have reduced port time to the minimum possible so far. What the barge carrier achieves is a sort of physical separation of the self-propelled ship from its cargo holds, each of which can float and be handled by a tugboat or pushboat in the port area and on inland navigable river routes as well. The barges are so large that they can be stowed with virtually any kind of cargo, even including loaded cargo containers. There are two methods of loading large barges onto the barge ships, and special ship designs have been created for each type. In one system, the loaded barges are lifted aboard the barge ship over the stern. This system is popularly known as the LASH system, which stands for "Lighter Aboard Ship." Each barge, or lighter, can carry up to 370 tons of cargo. A shipboard gantry crane of 500-ton capacity rides on tracks that run along the edges of the deck and along cantilevered extensions of the deck that protrude from the stem of the ship. The barge to be loaded is floated up to the stern of the ship and lifted by the gantry crane; when it is clear of the deck, the crane transports it forward and lowers it into one of the holds of the ship. Additional barges are stowed on deck on top of the hatch covers. Several sizes of LASH ships have been built, the largest of which can carry 89 barges. The second principal barge-carrying ship system, called the Seabee (for sea barge), is designed to carry even larger barges – the 834-ton-capacity barges mentioned above. The loading system for these extremely heavy barges consists of a large elevator, the platform of which is large enough to carry two of the barges, each of which is 97.5 feet (29.7 m) long by 35 feet (10.7 m) wide. The elevator spans the stem of the ship and it can be submerged during loading so that the barge can be floated in place over the elevator platform. The Seabee ship has three decks with no hatches, since access to the decks is through the stem. After a pair of barges is lifted by the elevator to the level of the deck that is being loaded, rolling transporters engage each of the barges and move them forward to a stowed position on the deck. The rapid turnaround of barge carriers in port is attributed not only to the fact that relatively few units each of very large size need to be handled, but also because these ships do not require dock or pier space or any special handling equipment furnished by the port. Thus they are not subject to delays caused by port congestion that require

DRAFT FINAL REPORT: Shipping Trends Analysis for Impacts of Navigation Trends on Channel Usage and Design
Common Commercial Merchant Vessels A-9
other types of ships to line up and wait their turn at a loading facility. Barge carriers have been found to be most useful in trades that involve ports that give access to substantial navigable river networks. For example, the port of New Orleans in the United States is the principal barge ship port because it is the entrance to the vast Mississippi River system.
A.2 Bulk Cargo Bulk vessels are defined as those that carry cargo that is homogeneous and in particle or liquid form and can be transferred by pumps, blowers, conveyers, or grab buckets. Bulk vessels indisputably carry the largest quantity of cargo by weight and volume, yet usually the cargo has relatively low value as compared to general cargo. A.2.1 Dry Bulk Vessels
Second to tankers in the worldwide tonnage of cargoes carried each year are the dry bulk carriers. Their cargoes are contained in their holds without packaging, and they are usually loaded aboard and discharged by shoreside cargo-handling gear. Typical cargoes carried by dry bulk ships are iron ore, coal, bauxite (aluminum ore), phosphate (a rock used to make fertilizers), grains, and raw sugar. Forest products, steel products, and cement are also transported as bulk cargoes. Although shipowners try to engage their bulk carriers in trades in which some kind of bulk cargo is moving in both directions, this is not always possible, and many trades are one way, the return trip being made in ballast, like crude oil tankers. Ship characteristics typical of all bulk ships are that they tend to be large with a single deck, have machinery and deckhouse aft, large hatches, and no cargo gear. Although the densities of the various cargoes carried vary considerably, most bulk materials are more dense when stowed than typical packaged or general dry cargo. Therefore the cargo spaces need not be so voluminous. The result is that bulk ships, like tankers, have a considerable amount of void space inside the hull when they are fully loaded, and the actual volume of cargo occupies only a small amount of the available internal space. The cargo spaces are concentrated about the ship centerline, with wing tanks on both sides. The lower parts of the holds are often hopper-shaped with sloping sides, so that the cargo settles to a central location as it is discharged, making the discharging operation efficient. All structural stiffeners that strengthen the hold sides and bottom are welded on the outside of the plating, making each hold a "smooth side inside" space which facilitates the complete removal of all cargo. Ore Carriers Iron ore is the most dense of the bulk cargoes carried in bulkers, and the single-purpose ore carrier has special features as a result. Ocean ore carriers in the size range from 25,000 to 100,000 deadweight tons are commonplace. The cargo is so dense and the space needed to contain it is so small that wing tanks are quite wide and the inner bottom is very deep. The deep double bottom is provided to keep the heavy cargo centered about at mid-depth of the ship hull, so that satisfactory stability is achieved.

DRAFT FINAL REPORT: Shipping Trends Analysis for Impacts of Navigation Trends on Channel Usage and Design
A-10 Common Commercial Merchant Vessels
The bottoms of the holds require extra structural support underneath because of the large impact loads that occur during cargo loading. Many ore ships have no cargo-handling gear and depend on shore-based equipment to load and discharge cargo. Some, however, are self-unloaders, which makes the unloading operation highly efficient. In a self-unloader, each hold has hopper doors in its bottom, which are opened to deposit the ore on a moving belt installed within the double bottom space. The ore is then transported to other belts or buckets at one end of the cargo section that lift it to deck level and deposit it on a long boom containing another belt that is swung over the side of the ship to deposit the ore on the shore. The modem trend seems to be more toward self-unloaders, so there are numerous versions of specialized unloading equipment. A unique ore carrier design is the Great Lakes ore carrier. Because of special draft and other size restrictions in the ore route from the western reaches of Lake Superior through Lakes Huron and Erie or Michigan to their unloading ports, these ships are of very different proportions than their oceangoing counterparts. They are extremely long, narrow, and shallow, and have a very boxy hull shape. The largest of these “boats” (a traditional Great Lakes appellation for these vessels, no matter how large they are) are sized solely by the dimensions of the Poe Lock at Saulte Ste. Marie (the "Soo") between Lakes Superior and Huron. They are 1,000 feet (305 m) long, 105 feet (32 m) wide, and may have a draft of no more than 32 feet (9.8 m). Grain Ships Grains were among the earliest bulk cargoes to be carried by ship, and they compose an extremely active trade today. Grain ships are configured much like other bulkers, but they are not so large; the typical size ranges from 40,000 to 60,000 tons. Because grains are not as dense as most bulk cargoes, the hold size of a grain ship takes up most of the ship’s cross section, and the double bottom is not so deep as that of an ore carrier. The grain cargoes do present a particular problem. As the ship rolls, the grain near the surface of the load can shift sideways and not return to its original position. The ship will then take a list to one side, and later severe rolling motions may cause further shifting, ultimately resulting in the capsizing of the ship. Because of this unique hazard, very strict regulations are in place for the proper stowage of grain cargoes. Its influence on ship design is that the grain hold has triangular tank spaces at both sides of the upper corners of the hold that slope inward to form a narrow vertical trunk at the top of the much wider hold space. When loading the grain, care must be taken to be sure that the grain level stacks up well into the trunk. The width of the grain surface is thus much reduced, and very little grain can shift as the ship rolls.
DRAFT FINAL REPORT: Shipping Trends Analysis for Impacts of Navigation Trends on Channel Usage and Design
Common Commercial Merchant Vessels A-11
A.2.2 Tankers Tankers are liquid-cargo carriers. Their sizes vary from very small to the largest constructed marine vessels in the world. Crude Oil Tankers During the post-World War II time period when dry cargo ships were evolving in complexity, degree of specialization, and speed, a different sort of evolution was taking place in the design of oil tankers-an evolution in size. The growth of the crude oil tanker from the typical 20,000-deadweight-ton size of the 1940s was at first gradual, to about 100,000 tons by 1960 and 150,000 tons by 1965, but it became explosive during the time the Suez Canal was closed (for seven years, from 1967 to 1975), because the long route from the oilfields in the vicinity of the Persian Gulf around the Cape of Good Hope to Europe and North America made the smaller ships uneconomical. Since it was not necessary to limit their size to navigate the canal, economies of scale took over and the deadweight of the crude oil tankers increased to about 350,000 tons by 1970, and ultimately to 560,000 tons in 1981. Inventing new superlative terms to describe these giants became quite a challenge, as “jumbo” tankers were supplanted by “super,” “mammoth,” VLCC (very large crude carrier), and ULCC (ultra large crude carrier). While such enormous ships can transport massive quantities of oil economically, they are not without their problems. Since loaded ULCCs have drafts that exceed 90 feet, very few ports have water depths sufficient to accommodate them, so special offshore mooring stations connected to the mainland by pipeline have had to be built to off-load them. Furthermore, accidental spills of cargo can pollute large areas of the sea and shorelines because of the sheer quantity of oil that may be released. Another problem is that very few dry-docking facilities are available to handle the largest of the ULCCS. All tankers, whatever their size, have some characteristics in common. The standard arrangement has the engine room, deckhouse, and navigating bridge aft, even on the largest tankers. The cargo spaces are divided into three tanks athwartships by a pair of longitudinal oil-tight bulkheads. The number of such sets of three tanks within the cargo section of a tanker depends on the ship's length, the structural need for transverse bulkheads, and tank size requirements to limit the amount of pollution that might result if the tank is damaged. Cargo tanks in most tankers extend from the bottom plating to the weather deck, there being no need for intermediate decks as in dry cargo ships. The traditional tanker has no double bottom tanks within the cargo tank section of the ship, but antipollution regulations in the 1990s are becoming ever more strict, and tankers with double bottoms and even with double side skins are being built and proposed to minimize the possible extent of pollution of the oceans following marine accidents. Antipollution regulations also require that tankers have segregated ballast arrangements-cargo tanks may not be used for seawater ballast during the ballasted voyages when no cargo is aboard. This procedure reduces the hazard of pollution caused by discharging oily ballast into the sea. It has the added advantage of reducing corrosion of the steel tank structures.

DRAFT FINAL REPORT: Shipping Trends Analysis for Impacts of Navigation Trends on Channel Usage and Design
A-12 Common Commercial Merchant Vessels
Liquid cargo is loaded and discharged from tankers by high-capacity cargo pumps located in special pump rooms on board ship and connected to the tanks by a piping system. Special provision must be made to prevent explosive mixtures of air and oil vapor from developing during cargo-discharging and tank-cleaning operations. Inert gas systems, which replace discharged oil from a tank with a gas containing no oxygen, rather than with air, are typical of such special provisions. Although the extraordinarily large crude oil tankers mentioned above may be the most spectacular development in tanker design and construction in recent decades, they are not the only types worthy of mention. Crude oil tankers of about 80,000 tons deadweight, built to comply with strict antipollution regulations and with drafts and lengths restricted so that they can serve U.S. East Coast and Gulf Coast ports, are numerous, as are “Suezmax” tankers, the largest tankers that can transit the Suez Canal, which are up to about 160,000 tons dead-weight. Product Carriers and Parcel Tankers Smaller tankers (typically 15,000 to 40,000 tons deadweight) are also the norm for transporting refined petroleum products. Product carriers are tankers that are outfitted to carry several different grades of refined products simultaneously without ever having different products share the same pipelines or pumps, so that contamination of products cannot take place. If pump rooms and piping systems similar to single product tankers are fitted, the maximum number of different products is usually four, limited by the number of separate cargo pumps that can practically be installed. In some such tankers, often called parcel tankers, each tank is fitted with its own submerged cargo pump, and more products can be carried without fear of contamination. Special materials and tank coatings can be in-stalled so that non-petroleum products and edible oils and liquids can also be handled. Chemical Tankers The most complex pumping and piping systems are those on the chemical tankers. The deck of a chemical tanker is covered with an elaborate maze of pipes, fittings, and cylindrical tanks made of special materials to carry small quantities of hazardous liquid cargoes. Many different chemicals, including those that are noxious, poisonous, highly corrosive, caustic, or otherwise very hazardous, are carried by such ships. Needless to say, their tank materials and coatings must often be quite specialized, and the measures taken to prevent contamination and accidental discharge of such liquids are highly sophisticated.
A.2.3 Liquefied Gas Carriers Fuel gases that are transported by sea in bulk form as liquids are classed either as LPG (liquid petroleum gas) or LNG (liquid natural gas). LPG cargoes are principally either propane (C3H8) or butane (C4H10), two fuel gases that can be liquefied at ambient temperature by pressurizing them, or at atmospheric pressure by refrigeration to about –50°C (-58°F). When liquefied, LPG is a little heavier than water. LNG is a

DRAFT FINAL REPORT: Shipping Trends Analysis for Impacts of Navigation Trends on Channel Usage and Design
Common Commercial Merchant Vessels A-13
natural mixture of gases, its principal component being methane (CH4), which cannot be liquefied at normal temperatures by pressurizing. It requires the extremely low temperature of –162°C (–260°F) to liquefy it. As a liquid, it is quite light, weighing about half the weight of water. Although some of the characteristics of LNG and LPG are similar, because of the very different boiling temperatures and densities of the two materials, the ships designed to carry them are quite different from one another. LPG Ships Before the advent of the LPG tanker, pressurized tanks of LPG at ambient temperatures were transported by ships. Beginning in the late 1950’s the demand for these fuels justified special ships that could carry them in bulk. Tank systems that controlled either the pressure or the temperature, or both, to maintain the cargo in the liquid state were developed. The majority of modem LPG ships employ fully refrigerated tanks, in which refrigeration alone is sufficient to liquefy the cargo. Special steel alloys must be used for the tanks, because ordinary structural steel would become brittle and crack at the –50°C temperature of the liquefied gas. The tanks are insulated, typically with polyurethane foam, to minimize boil-off. The gases that do boil off are usually reliquefied and returned to the tanks. A double skin or some other form of secondary barrier is installed to contain spilled cargo without allowing it to reach and fracture the ship hull in case a tank should fail. LNG Ships The design of LNG ships is vastly more difficult and the ships are far more costly than LPG ships because of the extremely low temperature of the liquefied cargo. Problems involving costly materials, differential expansion of cold and warmer structures, the extent of insulation required, secondary barriers, and the control of boil-off took many years of research before specially designed ships that could transport LNG safely became a reality in 1964. Because LNG is so light, having a density about half that of water, ship carrying capacity is designated in cubic meters rather than tons. The typical LNG ship has a cargo capacity of about 125,000 cubic meters. They are large ships, about the size of a 100,000-deadweight-ton conventional tanker-about 900 feet long (274 m). They operate at relatively light draft because of the low-density cargo, which makes them particularly vulnerable to problems of wind-induced heeling when beam winds blow against the large exposed area of the ship sides and tanks. A number of different kinds of tank systems have been developed. Self-supporting tanks that are spherical, cylindrical, or prismatic in shape have been tried, made of aluminum or very special nickel steel alloys. The tanks are very large-the spherical tanks in a 125,000 m3 ship are more than 120 feet (36.5 m) in diameter. Thick insulation layers of balsa wood or cork backed with or sandwiched between layers of plywood are used around the tanks, the plywood forming the secondary barrier. Elaborate systems of supporting the tanks in the ship hull while allowing for

DRAFT FINAL REPORT: Shipping Trends Analysis for Impacts of Navigation Trends on Channel Usage and Design
A-14 Common Commercial Merchant Vessels
expansion and contraction of the tanks are essential. Boil-off of the cargo cannot be re-liquefied, because the ships do not carry refrigerating equipment that can achieve the extremely low temperatures required. Instead, the boil-off, which can amount to up to 10 percent of the cargo on a long voyage, is usually piped to the boilers of the steam turbine main propulsion plant where it is useful as a very efficient and clean fuel. Another type of tank system that has been successful is the membrane tank, in which the containment tank is not structurally self-supporting. It consists of thin sheets of stainless steel, nickel, or aluminum deformed into waffled ridges that allow for expansion, backed and supported by insulation of balsa or perlite with plywood. Secondary barriers might be of plywood or a nickel steel alloy. Other containment systems that are variants of the two described above have also been developed.
A.2.4 Combination Carriers
Many types of combination bulk carriers have been developed in order to be able to carry cargoes in both directions on a trade route. The principal types are ore/bulk/oil carriers, or “OBO” ships. By adding pumping, piping, and cargo-oil heating systems to a bulker, and by careful design so that the hold spaces and wing tanks are sized, configured, and outfitted so that they can be utilized for a variety of cargoes on different legs of a voyage, the OBO can profitably carry cargoes of oil, grain, coal, or ore as the trade requires. Typical OBO ships range in size from 70,000 to 250,000 tons. The largest bulkers are ore/oil ships. They have been built as large as 350,000 tons. Like the OBO, these ships must have oil-tight hatches in the spaces used for oil, and pumps and piping systems similar to those of a tanker.
A.3 Others There are arguably several other types of commercial vessels that do not fit neatly – or perhaps at all – into the previously mentioned categories. For example, cargo barges, tug/towboats, passenger vessels, service vessels (harbor tugs, fireboats) and industrial vessels (dredges, fishing boats, research ships) are widely represented vessel types. These “other” vessel types are an integral part of maritime trade, but are not treated separately within this report since their vessel dimensions are typically overshadowed by the others that are investigated here. Military, industrial and service vessels are also not included here. Clearly, these vessels are critical to national security and maritime stability, but again are not included explicitly since their dimensional needs are usually not beyond those already covered by the vessel types already discussed.

DRAFT FINAL REPORT: Shipping Trends Analysis for Impacts of Navigation Trends on Channel Usage and Design
Common Commercial Merchant Vessels A-15
This page intentionally left blank.

DRAFT FINAL REPORT: Shipping Trends Analysis for Impacts of Navigation Trends on Channel Usage and Design
A-16 Common Commercial Merchant Vessels