shipping statistics and market review 2017 ssmr_61-3.pdf · shipping statistics and market review...
TRANSCRIPT
InstItute of shIppIng economIcs and LogIstIcs
statIstIcaL pubLIcatIons
Shipping StatiSticS and Market review 2017
Analytical Focus
Volume 61 - No. 3
World Merchant Fleet
World Bulk Carrier MarketWorld Tanker Market
World Container and General Cargo ShippingWorld Merchant Fleet by Ownership PatternsWorld Passenger and Cruise Shipping/ISL Cruise Fleet RegisterWorld Shipbuilding and ShipbuildersMajor Shipping NationsWorld Seaborne Trade and World Port Traffic

© ISL Institute of Shipping Economics and Logistics, Bremen, 2017
All rights reserved. No parts of this publication may be reproduced or transmitted, in any form or by any means, electronic, mechanical, photocopying, recording or any information storage or retrieval system without permission in writing from the editors. The editors do not guarantee the accuracy of the information contained in „ISL Shipping Statistics and Market Review (SSMR)” nor do they accept responsibility for errors or omissions of their consequences.
ISL Shipping Statistics and Market Review (SSMR)Volume 61 - 2017
Published and distributed by:
ISL Institute of Shipping Economics and LogisticsUniversitaetsallee 11-1328359 Bremen, Germany
Orders and subscription:
Phone: +49/421/220 96-0Fax: +49/421/220 96-55eMail: [email protected]: https://shop.isl.org
Subscription prices (Net price):
ISL Shipping Statistics and Market Review (SSMR) Vol. 61 2017Print copy 540.- €Online version 450.- €
ISL SSMR Vol. 61 2017 - Single issues online versionNo. 1/2 World Merchant Fleet 125.- €No. 3 World Tanker Market 95.- €No. 4 World Bulk Carrier Market 95.- €No. 5/6 World Container and General Cargo Shipping 160.- €No. 7 World Merchant Fleet by Ownership Patterns 95.- €No. 8 World Passenger and Cruise Shipping 130.- €No. 9/10 World Shipbuilding and Shipbuilders 95.- €No. 11 Major Shipping Nations 95.- €No. 12 World Seaborne Trade and World Port Traffic 160.- €
ISL Shipping Statistics Yearbook (SSYB) 2016Print copy 365.- €Print copy + digital version (on disk) 395.- €Online version 305.- €
ISL SSMR Vol. 61 2017 & ISL SSYB 2016 - PackagePrint copy 755.- €Print copy + digital version (SSYB on disk) 775.- €Online version 635.- €
All prices including packing and postage except Airmail. In case of inland sales plus VAT (MwSt). Cancellation 3 months before end of calendar year.

Shipping Statistics and Market Review
Institute of Shipping Economics and Logistics
World Tanker Market
ISL Comment ...........................................................
ISL Statistical Tables ................................................
Market Review
Economic Indicators .................................................
World Merchant Fleet ..................................................
Freight and Charter Market .......................................
Shipping Prices and Costs .........................................
World Shipbuilding ...................................................
World Port Traffic .....................................................
3
9
41
44
47
61
64
66
Volume 61 (2017)
ISSN 0947 - 0220
Analytical Focus
(double issues Jan./Feb., May/June and Oct./Nov.)
No 3 - 2017

Abbreviations/Symbols www.isl.org
SSMR March 2017
Abbreviations ARA Antwerp/Rotterdam/Amsterdam range
b/d Barrels per day
BHP Brake horsepower
CESA Community of European Shipbuilders
cgt Compensated gross tonnage
cif Cost, insurance, freight
CIS Commonwealth of Independent States
COD Country of Domicile
CPE Centrally-planned Economies
CPI Consumer price index
cST Centi Stokes
cu.m Cubic metres (also m3)
DB Double bottom
DC Developing Countries
DH Double hull
DIS Danish International Ship Register
DME Developed market economies
DS Double sides
dwt Deadweight tons
d/y Day/year
ECB European Central Bank
EMEs Emerging Market Economies
EU European Union
FY Fiscal year
FAO Food and Agriculture Organization of the United Nations
fio Free in and out
fob Free on board
FT Freight tons
ft Foot
GATT General Agreement on Tariffs and Trade
gt Gross tonnage
HP Horsepower
HT Harbour ton
ibf Intermediate bunker fuel
IEA International Energy Agency
IMF International Monetary Fund
IMO International Maritime Organization
in. Inch
ITF International Transport Workers Federation
km Kilometre
loa Length overall
lbs Pounds
LDT Light displacement tons
LDC Less Developed Countries
LNG Liquefied Natural Gas
LPG Liquefied Petroleum Gas
LT Long ton
m Metre
mbd Million barrel per day
mdo Marine diesel oil
MED Mediterranean
MfA Marine fishing area
mill Million
M/T Motor tanker
MT Metric tons
mtd per ton fob delivered
mth Month
mtw Per ton ex wharf
n.a. Not available
NDRF National Defence Reserve Fleet
n.e.c. Not elsewhere classified
neg. Negligible
NIS Norwegian International Ship Register
no Number
NODC Non-oil Producing Developing Countries
nrt Net register tonnage
nt Net tonnage
NWE,NW Northwest Europe
o.a. Over all
OBO Ore/bulk/oil carrier
OECD Organization for Economic Cooperation and Development
O/O Ore/oil carrier
OPEC Organization of Petroleum Exporting Countries
OR Ordinary Register
P/C Products carrier
Pr/OBO Product/ore-bulk-oil carrier
r Revised
Ro/ro Roll-on/roll-off
RT Revenue ton
SAR Special administration region
SBT Ship segregated ballast tanks
SDR Special drawing rights
SSMR ISL Shipping Statistics and Market Review
ST Short ton
t Ton/tonne
TB Tug/barge
TEU Twenty feet equivalent unit
TKB Tanker barge
T/S Tanker/steam
T/T Tanker/turbine
ULCC Ultra large crude carrier
USAC United States Atlantic Coast
USD US Dollar
VLCC Very large crude carrier
VLOC Very large ore carrier
WS Worldscale
WTO World Trade Organization
YR, YRS Year, Years
Symbols ... Data not available
- Nil
0/0.0 Less than half of unit employed
1995-2004 From 1995 to 2004 inclusive
2002/03 Crop year, fiscal year etc., beginning
in 2002 and terminating in 2003
Billions means a thousand million
Detailed items in tables do not necessarily add to totals because of rounding
For further explanation (e.g. Glossary) please visit: www.isl.org/infoline

Contents – Comment and Statistical Tables www.isl.org
1 SSMR March 2017
Page
ISL Comment – World Tanker Market
CRUDE & PRODUCT TANKER MARKETS COOLING DOWN Asian appetite for crude fuelling seaborne trade ........................................................ 3
Fleet expansion continues accelerated pace ............................................................... 4
Fundamentally challenged? ..................................................................................... 5
Liquid gas tankers ................................................................................................. 5
The shipbuilder’s perspective ................................................................................... 7
The scrap yard’s perspective ................................................................................... 7
�SUMMARY TABLES - COMMENT
Tab. 1 Liquid bulk imports of the top 3 ports per region 2001 – 2016 (million tons and %) ......... 4 Tab. 2 Monthly figures for newbuilding, second hand and scrapping prices ............................... 4 Tab. 3 Tanker order book by ship type as of January 1st, 2015 - 2017 ..................................... 5 Tab. 4 New tanker orders by type during 2014 - 2016 .......................................................... 5 Tab. 5 World tanker fleet by type as of January 1st, 2015 - 2017 ............................................ 6 Tab. 6 World tanker fleet – reductions by type 2014 - 2016 ................................................... 6 Tab. 7 World tanker fleet – additions (newbuildings) by type 2014 - 2016 ............................. 6
FIGURES - COMMENT
Fig. 1 World oil production and consumption 1996 - 2016 ..................................................... 3 Fig. 2 Development of crude oil spot prices (weekly averages) 2011 – 2017 ............................ 3 Fig. 3 Crude oil trade from Middle East/Gulf by direction in 2015 ........................................... 3 Fig. 4 Shares of global refining capacity of the top refining countries as of January 2016 ........... 3 Fig. 5 Monthly time charter rates for selected tanker sizes January 2012 - February 2017 ......... 4 Fig. 6 World tanker fleet - share of the ordered tonnage on the existing fleet 1997 - 2017 ....... 4 Fig. 7 World tanker order book estimated delivery schedule as of January 1st, 2017 ................. 5 Fig. 8 World total tanker fleet – annual tonnage changes January 1st 1999 – January 1st, 2017 . 5 Fig. 9 World tanker fleet – additions and reductions 2003-2016 ............................................ 6 Fig. 10 World tanker fleet – age structure by major types as of January 1st, 2017 ...................... 7
ISL Statistical Tables– World Tanker Market
(1) WORLD TANKER FLEET 1.1 Key Figures on World Tanker Fleet by Ship Type and Size Class 2017 ............................ 9 1.2 World Tanker Fleet Development by Type 2013 - 2017 ................................................ 10 1.3 Total Tanker Fleet by Ownership Patterns .................................................................. 11 1.3.1 Total Tanker Fleet by Major Flags 2016 and 2017 ....................................................... 11 1.3.2 Total Tanker Fleet by Country of Control 2017 ........................................................... 12 1.3.3 Total Tanker Fleet by Year of Build and and Type 2017 ................................................ 13 1.3.4 Total Tanker Fleet by Registered Flag and Country of Control According to
Regions and Type 2013 and 2017 ............................................................................ 14 1.3.5 Total Tanker Fleet by Type and Top 15 Countries of Control 2017 ................................. 15 1.4 Reported broken-up Tankers ................................................................................... 16 1.4.1 Broken-up Tankers by Ship Type 2009 - 2016 ............................................................ 16 1.4.2 Broken-up Tankers by Scrapping Country and Major Country of Control during 2016 ...... 16 1.4.3 Broken-up tankers by Size Class during 2016 ........................................................... 16
9-39
3-8

SSMR March 2017 2�
ISL Statistical Tables– World Tanker Market (continued)
(2) TANKER FLEET MARKET SEGMENTS 2.1 Crude Oil and Product Tankers .............................................................................. 17 2.1.1 By Country of Control 2017 ..................................................................................... 17 2.1.2 By Country Groups and Division of Age 2017 ............................................................. 18 2.1.3 Additions to Fleet by Top Countries of Control 2012 - 2016 .......................................... 18 2.1.4 By Size Class and Year of Build 2017 ........................................................................ 19 2.1.5 Size Dimensions 2017 ............................................................................................ 19
2.2 Oil/Chemical Tankers ............................................................................................ 20 2.2.1 By Country of Control 2017 ..................................................................................... 20 2.2.2 By Country Groups and Division of Age 2017 ............................................................... 21 2.2.3 Additions to Fleet by Top Countries of Control 2012 - 2016 .......................................... 21 2.2.4 By Size Class and Year of Build 2017 ........................................................................ 22 2.2.5 Size Dimensions 2017 ............................................................................................ 22
2.3 Liquid Gas Tankers ................................................................................................ 23 2.3.1 By Country of Control 2017 ..................................................................................... 23 2.3.1 By Country Groups and Division of Age 2017 ............................................................. 24 2.3.3 Additions to Fleet by Top Countries of Control 2012 - 2016 .......................................... 24 2.3.4 By Size Class and Year of Build 2017 ........................................................................ 25 2.3.5 Size Dimensions 2017 ............................................................................................ 25
(3) TANKER MARKET – SHIPPING COSTS AND PRICES 3.1 Second Hand Prices of Tankers, Average Values 2004 - 2016 ...................................... 26 3.2 Contracting Prices for Newbuildings 2004 - 2016 ........................................................ 26
(4) COMMODITIES, SEABORNE TRADE, PORTS Commodities 4.1 Oil Production, Consumption and Reserves ........................................................... 27 4.1.1 Development of the World Crude Oil Production 2010-2016 ......................................... 27 4.1.2 Development of the World Oil Demand 2010-2016 ..................................................... 27 4.1.3 Major Oil Producing Countries 1985, 1990, 2000, 2005, 2008 - 2015 ............................ 28 4.1.4 Major Oil Consuming Countries 1985, 1990, 2000, 2005, 2008 - 2015 ........................... 28 4.1.5 Leading Refining Countries 1985, 1990, 2000, 2005, 2008-2015 .................................. 29 4.1.6 Major Oil Reserves 1985, 1990, 2000, 2005, 2008-2015 ............................................. 29
4.2 Gas Production, Consumption and Reserves .......................................................... 30 4.2.1 Major Gas Producing Countries 1985, 1990, 2000, 2005, 2008 - 2015 ........................... 30 4.2.2 Major Gas Reserves by Country 1985, 1990, 2000, 2005, 2008 - 2015 .......................... 30 4.2.3 Leading Natural Gas – Trade Movements 2015 ........................................................... 31 4.2.4 Liquified Natural Gas – Consumption by Major Countries 2005-2015 ............................. 31
4.3 Seaborne Trade 4.3.1 Crude Oil and Oil Products Trade by Exporting Area 2011 - 2015 .................................. 32 4.3.2 Crude Oil and Oil Products Trade by Importing Area 2011 - 2015 .................................. 32 4.3.3 Export-Import Matrix 2015 ..................................................................................... 32
4.4 Ports ..................................................................................................................... 34 4.4.1 Development of Total Liquid Bulk Traffic at Major Oil Importing Ports 2006 - 2015 .......... 34
(5) FUTURE TANKER TONNAGE - TANKERS ON ORDER 5.1 Existing World Merchant Fleet by Ship Type and Major Areas of Build 2017 .................... 35 5.2 Order Book Development by Ship Type 2012 - 2017 ................................................... 36 5.3 Tankers on Order by Major Countries of Build and Ship Type 2017 ................................ 36 5.4 Tankers on Order by Type and Delivery Schedule 2017 ............................................... 37 5.5 Tankers on Order by Top Country of Build and Delivery Schedule 2017 .......................... 37 5.6 Tankers on Order by Ship Ship Yard and Delivery Schedule 2017 .................................. 37 5.7 Additions to Orderbook by Ship Type ........................................................................ 38 5.7.1 Additions to Orderbook by Ship Type and Major Countries of Build 2014 - 2016 .............. 38 5.7.2 Additions to Orderbook by Ship Type and Major Country of Domicile 2014 - 2016 ............ 39
FIGURES – STATISTICAL TABLES
Fig. 1 Tanker fleet by year of build and type as of January 1st, 2016 ...................................... 13 Fig. 2 Contracting Prices for Newbuildings 1994 - 2016 ........................................................ 26 Fig. 3 Seaborne Crude Oil trade by Region 2004 - 2015 ....................................................... 33
9-39

Comment - World tanker fleet
SSMR March 2017�
www.isl.org
�
CRUDE & PRODUCT TANKER MARKETS COOLING
DOWN
During 2016, tanker time charter rates sank from what have been the highest levels in several years. Although both the seaborne trade and thus the demand for crude and product tankers recorded healthy and above average increases in 2016 as well as in the year before, fleet expansion picked up momentum and the supply/demand balance may actually have turned on shipowners already by the end of 2015.
Regardless of talks about decarbonisation - global oil demand is headed
for the 100mbpd mark
�
Crude oil prices hovered in the US$ 40-US$ 55/bbl range in 2016. Whilst this did not provide another boost to commodity demand like the initial downswing of prices did back in 2015, global oil demand nonetheless grew noticeably by 1.7 % (or 1.6 m b/d), reaching 96.6 mbpd in 2016 according to IEA figures. Whilst this growth is expected to slow to 1.4 % (equivalent to 1.4 mbpd) in 2017, crude oil demand is headed straight for the 100 mbpd mark. On a quarterly level, this level could already be reached as early as 2018Q4.
Asian appetite for crude fuelling seaborne trade
As far as the maritime transport of crude oil is concerned, another strong growth was observed in 2016. Fuelled by continuous demand increases from China and India, seaborne crude oil imports of the entire Asian market exceeded 20 mbpd for the first time in 2016. On a world-wide level, maritime imports of the black gold increased by 4.4 %, reaching 39.0 mbpd according to the most recent CRSL estimates.
This development follows an already strong year with an above-average growth of 3.1 % (2015). Despite the acceleration of demand, time charter rates for larger crude tankers declined in 2016. Market consensus seemed to be that fleet expansion was also gaining speed and this kind of demand-side dynamics would not be sustainable in
Fig. 1: World oil production and consumption 1998 - 2017(mill b/d)
ISL based on U.S. Department of Energy, EIA
Fig. 2: Development of crude oil spot prices (weekly averages) 2011 – 2017
ISL based on U.S. Department of Energy, EIA
Fig. 3: Crude oil trade from Middle East/Gulf by direction in 2015
ISL, based on BP, Statistical review of world energy
Fig. 4: Shares of global refining capacity of the top refining countries as of January 2016
ISL, based on IEA 2017
OECD
OPEC 12
Former Soviet Union
NON-OPEC
0
10
20
30
40
50USA
EU
Japan
China
0
4
8
12
16
20
* 2016 and 2017 = projektions
0
20
40
60
80
100
120
140
US
$/ba
rrel
WTI
Brent
0
50
100
150
200
250
300
China Japan Europe India North America
Singa-pore
Africa others
173.9 157.5131.8 129.7
79.151.8
28.7
254.3
mill
tonn
es
US18%
China15%
Japan4%
India4%
Russia7%
Others52%

Comment - World tanker fleet�
SSMR March 2017�
www.isl.org
4
the long run.
Similarly to the seaborne crude trade, the oil products trade recorded a strong expansion as well in 2016: It grew 4.6 %, reaching 23.2 mbpd (CRSL). This is no match for the staggering expansion observed in 2015 (6.4 %) but it is still way above the long-term average and has thus probably helped to let down time charter rates gently, as the growth of the product fleet gathered momentum similarly to the crude fleet.
Fleet expansion continues accelerated pace
Deliveries of crude tonnage rose by 155 % to 21.3 mdwt in 2016 as owners urged for fast deliveries and yards obviously have been able and willing to comply. Product tanker deliveries had been relatively subdued prior to 2015 and have accelerated gradually since then, seeing 3.4 mdwt delivered in 2015 and 4.9 mdwt in 2016.
The strong demand for crude and product tankers during 2015 and 2016 is also mirrored in the reduced amount of deletions and increased ordering activity. Scrapping of crude and product tonnage fell to the lowest level in years and ordering of oil tankers (all types) almost doubled to 52.3 mdwt in 2015 compared to the previous year (27.5 mdwt).
In 2016, ordering activity declined noticeably – maybe shipowners did not want to overplay their hand and still remembered the not-so-distant past with the not-so-good earnings.
Adding it all up, the crude fleet registered a rather robust expansion of 5.9 % in 2016, product tonnage grew by 4.0 % and the specialist oil/chemical fleet registered an effective capacity growth of 6.6 %.
At the start of 2017, the crude tanker fleet comprised 2,063 units with an aggregated 370 mdwt. At the same time, the product tanker fleet comprised 5,181 units (98 mdwt). Those two types are topped off by the specialised oil/chemical fleet, comprising 5,418 units with an aggregated 108 mdwt. All in all, this added up to 14,512 liquid bulk carriers with a combined capacity of 636.4 mdwt.
After having jammed the orderbook in 2015, shipowners gave the ailing yard industry a bit of a
Tab. 1: Liquid bulk imports of the top 3 ports per region 2012 –2016 (million tons and %)
ISL Port Data Base 2017
Fig. 5: Monthly time charter rates for selected tanker sizes January 2012 - February 2017
ISL, based on Fearnleys Weekly
Tab. 2: Monthly figures for newbuilding, second hand and
scrapping prices�
Source: ISL, based on Fearnleys (Newbuildings) and CRSL (Second hand and scrapping)
Fig. 6: World tanker fleet - share of the ordered tonnage on the existing fleet as of January 1st, 1997 - 2017
�Source: Up to 2011 based on IHS Fairplay, since 2012 on Clarkson Research Services Limited (CRSL). Please see disclaimer
2012 2013 2014 2015 2016
YoY-% change
'15/'16
Average growth
'12-'16
America major 3 158.5 163.8 161.9 164.5 160.8 -2.3 0.4Asia major 3 212.6 212.2 220.8 223.8 225.0 0.5 1.4Europe major 3 228.2 235.3 235.2 252.6 253.8 0.5 2.7
102030405060708090
2012 2013 2014 2015 2016 201710
00 U
S $/
day
VLCC (modern)SUEZMAX (modern)
10
15
20
25
30
35
40
45
2012 2013 2014 2015 2016 2017
1000
US
$/da
y
AFRAMAX (modern)
PRODUCT 80,000 dwt
PRODUCT 47,000 dwt
2015 2016 2017Unit Jan. Jan. Nov. Dec. Jan.
Newbuilding PriceProduct 47000 37.0 35.0 32.0 32.0 32.0 -8.6Aframax 105000 53.0 51.0 45.0 45.0 44.0 -13.7Suezmax 150000 65.0 63.0 54.0 54.0 53.0 -15.9VLCC 300000 97.0 92.0 82.5 82.0 81.0 -12.0
Second hand prices (five years old vessel)305000 dwt 81.0 80.0 60.0 60.0 62.0 -22.5160000 dwt 60.0 60.0 40.0 40.0 41.0 -31.7105000 dwt 46.0 46.0 29.0 29.0 30.0 -34.8C 47000 dwt 27.0 29.0 22.0 22.0 22.5 -22.4
Demolition pricesFar East 250.0 145.0 235.0 245.0 250.0 72.4Pakistan/India 415.0 298.0 285.0 290.0 330.0 10.7
US $/
% change over prev.
year
mill US $
mill US $
0.0
20.0
40.0
60.0
80.0
100.0
1997 1999 2001 2003 2005 2007 2009 2011 2013 2015 2017
%-s
hare
of f
leet
Crude Oil & Oil Chemical Tankers
Liquid Gas Tankers
Comment - World tanker fleet��
SSMR March 2017 � 5
www.isl.org
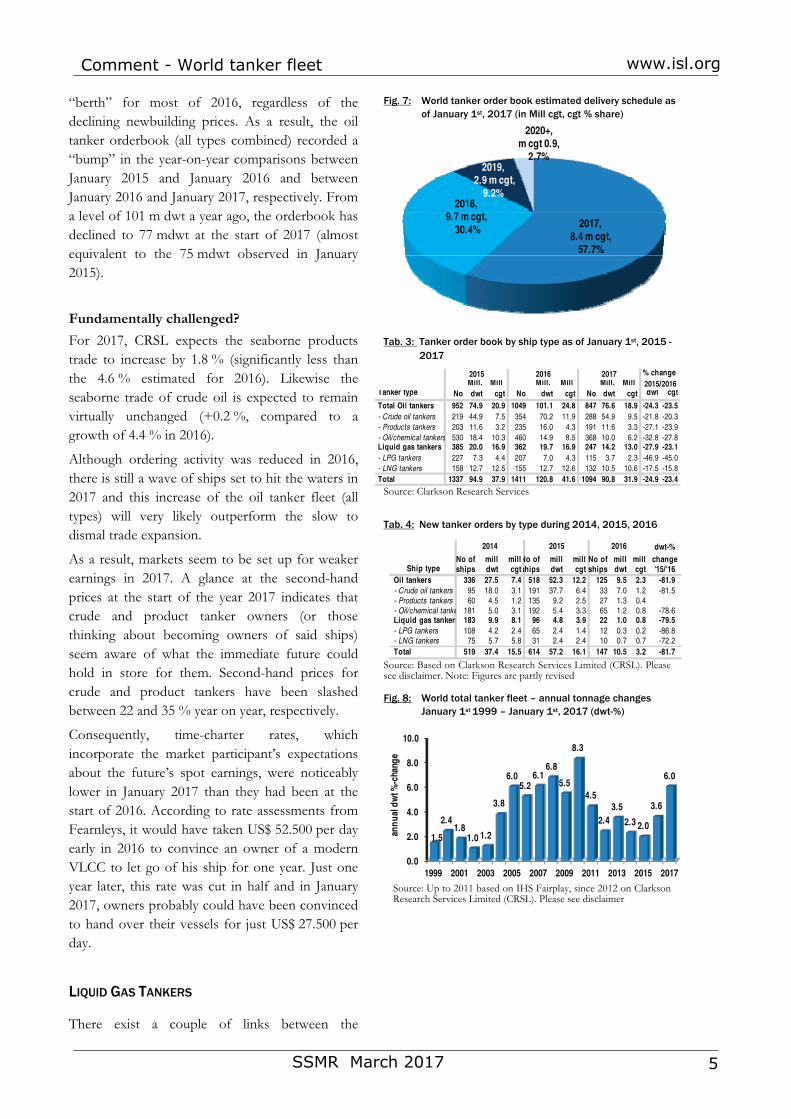
“berth” for most of 2016, regardless of the declining newbuilding prices. As a result, the oil tanker orderbook (all types combined) recorded a “bump” in the year-on-year comparisons between January 2015 and January 2016 and between January 2016 and January 2017, respectively. From a level of 101 m dwt a year ago, the orderbook has declined to 77 mdwt at the start of 2017 (almost equivalent to the 75 mdwt observed in January 2015).
Fundamentally challenged?
For 2017, CRSL expects the seaborne products trade to increase by 1.8 % (significantly less than the 4.6 % estimated for 2016). Likewise the seaborne trade of crude oil is expected to remain virtually unchanged (+0.2 %, compared to a growth of 4.4 % in 2016).
Although ordering activity was reduced in 2016, there is still a wave of ships set to hit the waters in 2017 and this increase of the oil tanker fleet (all types) will very likely outperform the slow to dismal trade expansion.
As a result, markets seem to be set up for weaker earnings in 2017. A glance at the second-hand prices at the start of the year 2017 indicates that crude and product tanker owners (or those thinking about becoming owners of said ships) seem aware of what the immediate future could hold in store for them. Second-hand prices for crude and product tankers have been slashed between 22 and 35 % year on year, respectively.
Consequently, time-charter rates, which incorporate the market participant’s expectations about the future’s spot earnings, were noticeably lower in January 2017 than they had been at the start of 2016. According to rate assessments from Fearnleys, it would have taken US$ 52.500 per day early in 2016 to convince an owner of a modern VLCC to let go of his ship for one year. Just one year later, this rate was cut in half and in January 2017, owners probably could have been convinced to hand over their vessels for just US$ 27.500 per day.
LIQUID GAS TANKERS
There exist a couple of links between the
Fig. 7: World tanker order book estimated delivery schedule as of January 1st, 2017 (in Mill cgt, cgt % share)
�
Tab. 3: Tanker order book by ship type as of January 1st, 2015 - 2017
Source: Clarkson Research Services
Tab. 4: New tanker orders by type during 2014, 2015, 2016
Source: Based on Clarkson Research Services Limited (CRSL). Please see disclaimer. Note: Figures are partly revised
Fig. 8: World total tanker fleet – annual tonnage changes
January 1st 1999 – January 1st, 2017 (dwt-%)
Source: Up to 2011 based on IHS Fairplay, since 2012 on Clarkson Research Services Limited (CRSL). Please see disclaimer
���������
2017, 8.4 m cgt,
57.7%
2018, 9.7 m cgt,
30.4%
2019,2.9 m cgt,
9.2%
2020+, m cgt 0.9,
2.7%
Tanker type dwt cgt
Total Oil tankers 952 74.9 20.9 1049 101.1 24.8 847 76.6 18.9 -24.3 -23.5- Crude oil tankers 219 44.9 7.5 354 70.2 11.9 288 54.9 9.5 -21.8 -20.3- Products tankers 203 11.6 3.2 235 16.0 4.3 191 11.6 3.3 -27.1 -23.9- Oil/chemical tankers 530 18.4 10.3 460 14.9 8.5 368 10.0 6.2 -32.8 -27.8Liquid gas tankers 385 20.0 16.9 362 19.7 16.9 247 14.2 13.0 -27.9 -23.1- LPG tankers 227 7.3 4.4 207 7.0 4.3 115 3.7 2.3 -46.9 -45.0- LNG tankers 158 12.7 12.5 155 12.7 12.6 132 10.5 10.6 -17.5 -15.8Total 1337 94.9 37.9 1411 120.8 41.6 1094 90.8 31.9 -24.9 -23.4
NoMill. dwt
Mill cgt
20172015 2016
NoMill. dwt
Mill cgt No
Mill. dwt
Mill cgt
% change 2015/2016
dwt-%No of mill millNo of mill mill No of mill mill changeships dwt cgtships dwt cgt ships dwt cgt '15/'16
Oil tankers 336 27.5 7.4 518 52.3 12.2 125 9.5 2.3 -81.9- Crude oil tankers 95 18.0 3.1 191 37.7 6.4 33 7.0 1.2 -81.5- Products tankers 60 4.5 1.2 135 9.2 2.5 27 1.3 0.4- Oil/chemical tanke 181 5.0 3.1 192 5.4 3.3 65 1.2 0.8 -78.6Liquid gas tankers 183 9.9 8.1 96 4.8 3.9 22 1.0 0.8 -79.5- LPG tankers 108 4.2 2.4 65 2.4 1.4 12 0.3 0.2 -86.8- LNG tankers 75 5.7 5.8 31 2.4 2.4 10 0.7 0.7 -72.2Total 519 37.4 15.5 614 57.2 16.1 147 10.5 3.2 -81.7
Ship type
2014 2015 2016
0.0
2.0
4.0
6.0
8.0
10.0
1999 2001 2003 2005 2007 2009 2011 2013 2015 2017
1.5
2.41.8
1.0 1.2
3.8
6.05.2
6.16.8
5.5
8.3
4.5
2.43.5
2.3 2.0
3.6
6.0
annu
al d
wt %
-cha
nge

Comment - World tanker fleet�
SSMR March 2017�
www.isl.org
6
developments on the crude and product markets on the one hand and the developments on the LPG and LNG markets on the other hand.
The seaborne trade of LPGs has seen robust demand growth since 2012 according to assessments provided by CRSL. This maritime trade growth has seen both earnings and ordering rise to astonishing levels and consequently led to the inevitable decline of both.
Although the seaborne trade of LPGs is expected to increase by 4.9 % in 2017, the orderbook is still solidly stuffed and time-charter rates for all sizes remained well below 2016 averages early in 2017. Currently, there seem to be simply too many ships on the market.
Early in 2017, the LPG fleet comprised 1,382 units with 30.3 mcbm (22.4 mdwt). In terms of capacity, this is an increase of 17.2 % over the previous year – most certainly a function of the comfortable earnings observed in 2014. Even though ordering activity collapsed in 2016 on the back of poor earnings (12 ships, 0.7 mdwt), the LPG orderbook still contained 115 units (3.7 mdwt) at the start of 2017.
The low LNG prices of the recent years most certainly did not foster the development of new projects and after years of speculative ordering, the markets had been severely oversupplied with spot market tonnage.
Average spot contracts in 2015 and 2016 were estimated to be US$ 36,038 and US$ 33,528 respectively by CRSL. This may not sound poor to crude tanker owners at first. Take into account OPEX estimates of US$ 14,000 per day as well as the need to recover a newbuilding price of around US$ 200,000,000 plus the cost of financing the ship, and US$ 36,000 per day does not sound so attractive any more all of a sudden.
Although the seaborne LNG trade has grown quite substantially since 2014 (246 m tons) reaching 266 m tons in 2016 and is expected to expand to 287 m tons according to the most recent CRSL forecast, there simply seem to be too many vessels out on the ocean looking for employment. During 2016, the cbm capacity of the LNG-fleet has effectively grown by 6.6 %, reaching 68.8 mcbm (468 units, 37.1 m dwt).
Fig. 9: World tanker fleet – additions and reductions 2004-2016 (mill dwt)
Source: Up to 2010 based on IHS Fairplay, since 2011 on Clarkson Research Services Limited (CRSL). Please see disclaimer
Tab. 5: World tanker fleet by type as of January 1st, 2015 - 2017
�Tab. 6: World tanker fleet – reductions by type 2014 - 2016
Tab. 7: World tanker fleet – additions (newbuildings) by type 2014
- 2016 �
Source: Based on Clarkson Research Services Limited (CRSL). Please see disclaimer
�
�
�
�
�
�
�
�
�
0
10
20
30
40
50
60
2004 2006 2008 2010 2012 2014 2016
mill
dw
t
Additions
Reductions
Ship typeTotal Oil tankers 11970 529.5 - 12269 546 - 12662 577 - 5.7- Crude oil tankers 1956 343.9 - 1973 349 - 2063 370 - 5.9- Products tankers 5015 91.5 - 5092 95 - 5181 98 - 4.0- Oil/chemical tankers 4999 94.2 - 5204 102 - 5418 108 - 6.6Liquid gas tankers 1677 49.7 82.5 1770 54.5 90.4 1850 59.5 99.1 9.6- LPG tankers 1262 17.0 22.3 1327 19.4 25.8 1382 22.4 30.3 17.2- LNG tankers 415 32.7 60.3 443 35.0 64.6 468 37.1 68.8 6.6Total 13647 579.2 82.5 14039 600.1 90.4 14512 636.4 99.1 6.0
No
2015 2016 2017mill dwt
mill cbm No
mill dwt
mill cbm
YoY dwt/cbm growth No
mill dwt
mill cbm
2014 2015 2016 capacity-%No of Mill. Mill. No of Mill. Mill. No of Mill. Mill. changeships dwt cbm ships dwt cbm ships dwt cbm '15/'16
Total Oil tankers 124 8.5 - 74 2.5 - 48 2.6 - 5.9- Crude oil tankers 48 6.7 - 14 1.3 - 10 1.4 - 6.5- Product tankers 46 1.2 - 45 0.9 - 23 0.7 - -15.7- Oil/chemical tankers 30 0.6 - 15 0.3 - 15 0.5 - 70.9Liquid gas tankers 32 0.3 0.5 23 0.3 0.4 21 0.4 0.6 55.8- LPG tankers 29 0.2 0.2 20 0.1 0.1 19 0.3 0.3 234.1- LNG tankers 3 0.2 0.3 3 0.2 0.3 2 0.1 0.3 -8.7Total 156 8.8 0.5 97 2.7 0.4 69 3.0 0.6 10.7
Ship type
2015 2016 capacity-%No of Mill. Mill. No of Mill. Mill. No of Mill. Mill. changeships dwt cbm ships dwt cbm ships dwt cbm '15/'16
Total oil tankers 342 17.1 - 340 19.3 - 410 33.2 - 71.7- Crude oil tankers 36 9.3 - 35 8.3 - 104 21.3 - 155.7- Products tankers 132 2.2 - 97 3.4 - 89 4.9 - 45.2- Oil/chemical tanke 174 5.6 - 208 7.6 - 217 7.0 - -8.5Liquid gas tankers 86 3.7 6.4 115 5.1 8.3 122 5.7 9.8 17.4- LPG tankers 53 0.8 1.1 83 2.5 3.6 91 3.2 4.8 31.6- LNG tankers 33 2.8 5.3 32 2.6 4.7 31 2.5 5.0 6.5Total 428 20.8 6.4 455 24.4 8.3 532 38.9 9.8 59.4
Ship type2014

Comment - World tanker fleet��
SSMR March 2017 � 7
www.isl.org
LNG ordering almost collapsed in 2016 (10 ships, 0.7 mdwt), still the orderbook contained 132 ships with an aggregated 10.5 mdwt – roughly half of which was earmarked for delivery in 2016.
The shipbuilder’s perspective
In terms of units, dwt, and cgt, the global orderbook has fallen to a low level at the start of 2017. 58 % of the total 32 mcgt tanker orderbook (both liquid bulk and liquefied gas carriers) is scheduled for delivery in 2017. Looking at the market fundamentals, neither the oil and product fleet nor the gas carrier fleet seem to be in an immediate hurry to go on an ordering spree any time soon.
The scrap yard’s perspective
After two years of relatively weak scrapping activity of crude and product tankers, 2017 could ultimately see a slight uptick in demolition demand from these sectors. As long as time-charter rates for both remain well above OPEX, the trigger for this development yet needs to be pulled.
Fig. 10: World tanker fleet – age structure by major types as of January 1st, 2017 (dwt%-share)
Source: Clarkson Research Services Limited (CRSL). Please see disclaimer
�
�
�
�Sources If not otherwise mentioned, the source for tables and figures concerning the world merchant fleet, special ship type features and order book information is ““based on Clarkson Research Services Limited”, please quote accordingly. In general merchant fleet data refer to ships of 300 gt and over.
Explanatory note - Tanker size classes
Handysize: 10,000 < 40,000 Handymax: 40,000 < 60,000 Panamax: 60,000 - 80,000 Aframax: 80,000 - 120,000 Suezmax: 120,000 - 199,999 VLCC: 200,000 - 324,999 ULCC: >= 325,000
Statistical details “ World Tanker Fleet” �� Key figures p. 9 �� by division of age and type p. 19, 22, 24 �� by size class and ship type p. 19, 22, 24 �� by summer draught, length and broad
and ship type p. 19, 22, 24 �� World tanker fleet ranking by flag p. 11 �� by registered flag and country of control p. 17, 20, 22
Statistical details “Commodities, trade and ports” �� Oil production, consumption and reserves p. 27 - 29 �� Gas production, consumption and reserves p. 30, 31 �� Seaborne crude oil trade p. 32, 33 �� Liquid bulk traffic at major oil importing ports p. 34 �� Freight and charter market p. 50 - 61 �� Shipping Prices and costs p. 62 - 66
Statistical details “The world tanker shipbuilding market” �� Tanker order book and new orders by type p. 36 �� Tankers on order by type and delivery schedule p. 37 �� Additions to the tanker order book by ship type
and major countries of domicile p. 38-39 Guide to relevant market information: �� Simpson Spence & Young: SSY World Oil-Tanker Trend:
www.ssyonline.com �� Clarkson: Oil & Tanker Trades Outlook:
http://www.clarksons.co.uk �� ISL Shipping Statistics Yearbook 2016 �� IEA International Energy Agency: http://www.iea.org �� BP – Statistical Review of World Energy http://www.bp.com �� EIA Energy Information Administration: www.eia.doe.gov
�
0
10
20
30
40
50
60
Crude oil & Product tankers Oil-/Chemical tankers Gas tankers
No
%-s
hare
up to 1996 1997- 2001 2002-2006
2007-2011 2012-2016

�
Institute of Shipping Economics and Logistics
Book Review
ISL SHIPPING STATISTICS YEARBOOK 2016 (ISSN 0721-3220)
The SHIPPING STATISTICS YEARBOOK 2016, published by the INSTITUTE OF SHIPPING ECONOMICS AND LOGISTICS (ISL) is now available. In addition to the print version an online edition is available via “ISL InfoLine”.
The conceptual approach of the ISL Yearbook is designed to inform about developments in shipping, world trade, seaborne trade, com-modity markets, ocean freight and charter rates, individual profiles of shipping and ship-building countries, as well as on world port developments. The most important develop-ment trends are summarised in an analytical market comment on shipping, shipbuilding, and ports.
The ISL Yearbook 2016 is a unique, statistical source distributed around the world and de-signed to meet the requirements of shipown-ers, shipbuilders/repairers, port authorities, brokers, banks, transportation consultants, universities and research institutes. The three main topics with detailed market information are:
The Shipping Market Contains data about the total merchant fleet, broken-up tonnage, casualty returns, spe-cial fleets, shipping costs, seaborne trade, world economy, commodities, and freight and charter markets, as well as more than 30 individual country reports.
Shipbuilding Analyses the current world shipbuilding development according to ship types, shipbuilding countries and shipyards. Also, data on deliveries, newbuilding contracts and order book developments are provided.
Ports and Sea Canals This part contains data on shipping, cargo and container traffic of more than 300 leading world ports for the years 2010-2014, as well as monthly container figures of 61 top con-tainer ports up to September 2015. Key figures for single ports are complemented by analytical summary tables and graphs. All information is based on the ISL PORT DATA BASE which contains time series from 1980 onwards. In addition, this section of the year-book includes traffic figures attributable to the world's major sea canals (St. Lawrence Seaway, Kiel Canal, Panama and Suez Canal).
The ISL SHIPPING STATISTICS YEARBOOK 2016 (432 pages, 443 Statistical Tables with 128 Charts) is available as pdf-download for EUR 305.-, paperback copy for EUR 365.- or paper-back with CD-ROM (pdf format) for EUR 395.-, including packaging and postage, excluding VAT. All ISL publications can be ordered via internet (http://www.isl.org/infoline/).
INSTITUTE OF SHIPPING ECONOMICS AND LOGISTICS (ISL) Universitaetsallee 11-13
28359 Bremen Germany
phone: +49–4 21-2 20 96-35, fax: +49-4 21-2 20 96-55
e-mail: [email protected], web shop: https://shop.isl.org/

Definitions – Merchant fleet and newbuildings www.isl.org
68 SSMR March 2017
Fleet and New Construction Data Country of registration and country of control Country of registration indicates the country of the port of registry of a country (flag). The country of control is defined as the “Real Nationality”, i.e. the home country of the interests behind the primary reference company. None of the information regarding ownership is intended to confirm or otherwise the legal status of the companies or the ships associated with them
Denmark includes Faeroes, Greenland. France includes New Caledonia, French Polynesia, Réunion, Wallis and Futuna Islands.
Netherlands includes Netherlands Antilles, Curacao.
Portugal includes Madeira.
Spain includes Canary Islands.
UK includes Isle of Man and Falkland Island.
US includes Puerto Rico.
Clarkson Research Services Limited Disclaimer “The statistical and graphical Data contained under the heading is drawn from the Clarkson Research Services Limited (“CRSL”) database and other sources. CRSL has advised that: (i) some Data in CRSL's database is derived from estimates or subjective judgments; and (ii) the Data in the databases of other marine data collection agencies may differ from the Data in CRSL's database; and (iii) whilst CRSL has taken reasonable care in the compilation of the statistical and graphical Data and believes it to be accurate and correct, data compilation is subject to limited audit and validation procedures and may accordingly contain errors; and (iv) CRSL, its agents, officers and employees do not accept liability for any loss suffered in consequence of reliance on such Data or in any other manner; and (v) the provision of such Data does not obviate any need to make appropriate further enquiries; and (vi) the provision of such Data is not an endorsement of any commercial policies and/or any conclusions by CRSL”.
Broken-up Tonnage includes ships sold for breaking. Figures on broken-up tonnage are not revised if vessels reported for breaking are trading again.
Merchant Ship Type Structures Based on „An International Classification of Ships by Type“ (ICST (1994)
Definition of terms used in merchant ship structures type classification. Tanker: Single-deck vessel constructed and arranged for the carriage of liquid cargoes in tanks integral to the hull and include crude oil or non-hazardous (IMO code) refined products. Chemical tanker: Vessel constructed and arranged for carrying hazardous (IMO code) cargoes in special tanks. Liquid gas tanker: Vessel constructed and arranged for the carriage of liquefied gases either in integral tanks or independent tanks under pressure or refrigerated. Dry Bulk: Dry cargo vessel. One deck, machinery aft with topside tanks capable of carrying a variety of self-trimming cargoes. Ore Carrier (Bulk Carrier): Dry cargo vessel, one deck, strengthening for ore cargoes. Ore/Bulk/Oil Carrier (OBO): Bulk carrier arranged for the carriage of either bulk dry cargoes or liquid cargoes in the same cargo spaces but not simultaneously. General Cargo: Single or multi-deck general dry cargo vessel with facilities for loading/ discharging cargo. Specialised Carrier (Special Ship): Dry cargo vessel specially designed for the carriage of particular cargoes, incl. car-carriers. Reefer: Specialised dry cargo vessel with 80 % or more insulated cargo space. RoRo Cargo/RoRo Passenger: Vessel arranged for Roll-on Roll-off loading / discharging of vehicles (road and/or rail) as cargo and / or passenger conveyances. Container Ship (Fully Cellular Container Ships): Vessel fitted throughout with fixed or portable cell guides for the carriage of containers above and below the weather deck. Passenger: Vessel which carries more than 12 fare paying passengers whether berthed or unberthed (ferries).
Basic Ship Type Structure and ISL Ship Type Aggregates MERCHANT SHIP STRUCTURES ISL SHIP TYPES Special Fleet Report Broken-up tonnage etc. LIQUID Oil tankers - Crude oil tankers
- Crude/product tankers - Product tankers
Oil tankers " "
Tankers " ""
Oil / Chemical tankers - Oil chemical tankers - Chemical tankers - Other tankers
Oil / Chemical tankers " "
Tankers "
Liquid gas tankers - LNG carriers - LPG carriers - Other liquid gas carriers
Liquid gas tankers " "
Tankers " "
DRY BULK Bulk carriers - bulk carriers - other bulk carriers incl. ore carriers
Bulk carriers "
Bulk carriers " "
- Ore/bulk/oil carriers - Ore/oil carriers - Bulk/oil carriers
" " "
OHTER DRY CARGO General cargo ships of which - Conventional Cargo ships - Special ships - Pure car carriers - Reefer ships - RoRo cargo ships
General cargo ships, of whichConventional Cargo ships
Special ships Pure car carriers
Reefer ships RoRo cargo ships
General cargo ships, of whichConventional Cargo ships
(a) (a) (a)
Container ships - Fully cellular container ships Fully cellular container ships Fully cellular container ships Passenger and
passenger cargo ships (b)
of which - Passenger ships - Cargo/RoRo passenger ships
Passenger and cargo passenger ships, of which Passenger ships
Cargo/RoRo passenger ships
Passenger ships " "
(a)� Included in General Cargo Ships. (b)� Including ships (berthed and unberthed) for passenger transport and passenger carrying vessels like general cargo passenger ships, ro-ro
passenger ships (ferries).
For further explanation (e.g. Trade and Traffic Statistics) please visit: www.isl.org/infoline

ISL InfoLine / Webshop
ISL Institute of Shipping Economics and LogisticsThe ISL - Institute of Shipping Economics and Logistics founded in Bremen in 1954 combines tradition with
modern science; we have since positioned ourselves as one of Europe’s leading institutes in the area of
maritime logistics research, consulting and knowledge transfer. On behalf of our project partners from the
public and private sector, both on national and international level, we ensure that innovative ideas become
solutions with practical applicability. At our offices in Bremen and Bremerhaven, we handle projects from all
over the world in interdisciplinary teams.
www.isl.org ● [email protected]
The ISL InfoLine is your resource of up-to-date market information and completes ISL's service spectrum
with numerous proprietary publications, which are available in the online portal. The key publications are
the ISL Shipping Statistics and Market Review (SSMR), the ISL Shipping Statistics Yearbook (SSYB) and the ISL
Monthly Container Port Monitor (MCPM).
Furthermore, the portal of the ISL InfoLine offers various databases used for market analyses, statistical
publications, information services and customers' enquiries. The focus here is on the ISL Port Database.
www.isl.org/infoline ● [email protected]
ISL InfoCenter / Library / SEABASEThe ISL InfoCenter is the leading institution in Europe for information and documentation in maritime
economics and logistics. It offers professional services about industries, markets and companies within the
knowledge areas of shipping, shipbuilding and ports, transport and logistics as well as economic and trade.
The ISL Library, which exists since 1954, is one of the biggest libraries in the area of maritime economics and
logistics with a total stock of about 126,000 books (January 2016), of which are 32,000 monographs and
32,000 annual publications. A quarterly list of new acquisitions is created, documenting the growth of the ISL
Library. Furthermore 200 professional journals are kept regularly. In addition, digital publications within the
creation of an eLibrary play an increasingly important role. The ISL Library is open to the public and the use
is free of charge
ISL SEABASE functions both as a catalog of the ISL Library as well as a literature database. The catalog
represents round about 125,000 bibliographic records (January 2016) of the ISL Library and is an important
knowledge source for maritime industry as well as research and education. ISL SEABASE research offers a
systematic access to current maritime and logistic knowledge. Besides reference books also market studies,
research and conference reports, economy statistics as well as business and annual reports are included.
Contributions from about 200 national and international professional journals are evaluated selectively after
relevance.
www.isl.org/library ● [email protected]

www.isl.org