ship scale validation of cfd model of self-propelled …...henrik mikkelsen, mads l. ste ensen,...
TRANSCRIPT

General rights Copyright and moral rights for the publications made accessible in the public portal are retained by the authors and/or other copyright owners and it is a condition of accessing publications that users recognise and abide by the legal requirements associated with these rights.
Users may download and print one copy of any publication from the public portal for the purpose of private study or research.
You may not further distribute the material or use it for any profit-making activity or commercial gain
You may freely distribute the URL identifying the publication in the public portal If you believe that this document breaches copyright please contact us providing details, and we will remove access to the work immediately and investigate your claim.
Downloaded from orbit.dtu.dk on: Feb 25, 2020
Ship scale validation of CFD model of self-propelled ship
Mikkelsen, Henrik; L. Steffensen, Mads; Ciortan, Cosmin ; Walther, Jens H.
Published in:MARINE 2019 Computational Methods in Marine Engineering VIII
Publication date:2019
Document VersionPeer reviewed version
Link back to DTU Orbit
Citation (APA):Mikkelsen, H., L. Steffensen, M., Ciortan, C., & Walther, J. H. (2019). Ship scale validation of CFD model of self-propelled ship. In R. Bensow, & J. Ringsberg (Eds.), MARINE 2019 Computational Methods in MarineEngineering VIII (pp. 718-729). International Center for Numerical Methods in Engineering.

VIII International Conference on Computational Methods in Marine EngineeringMARINE 2019
R. Bensow and J. Ringsberg (Eds)
SHIP SCALE VALIDATION OF CFD MODEL OFSELF-PROPELLED SHIP
HENRIK MIKKELSEN∗, MADS L. STEFFENSEN∗, COSMIN CIORTAN†
AND JENS H. WALTHER∗‡
∗Technical University of Denmark (DTU)Department of Mechanical Engineering
Nils Koppels Alle, Building 404, 2700 Kgs. Lyngby, Denmark.e-mail: [email protected], web page: http://www.mek.dtu.dk/
† DNV-GLSection for Hydrodynamic and Stability
Veritasveien 1, 1363 Høvik, Norway
‡ Swiss Federal Institute of Technology ZurichComputational Science & Engineering Laboratory
Clausiusstrasse 33, CH-8092 Switzerland
Key words: Computational fluid dynamics, Ship scale ship propulsion, Sea trial validation,Self-propulsion simulation
Abstract. This paper presents a comparison of towing tank testing, ship scale computationalfluid dynamics (CFD) simulations, sea trial measurements and in-service performance. Thestudy includes extensive convergence tests and validation of both resistance, open-water andself-propulsion CFD simulations in both model and ship scale. The self-propulsion CFD simu-lations are conducted using a novel method. This method includes calculating the wave-makingresistance separately, in order to reduce the computational cost.
The results of the ship scale self-propulsion CFD show an average overestimation of deliveredpower of 2 % compared to the sea trial results, where the predicted delivered power using thetowing tank approach shows an average overestimation of delivered power of 6 %. Both predic-tions are within the uncertainty of the speed trial measurements. The study shows that boththe towing tank approach and ship scale CFD can make reasonable and similar estimations ofthe ship scale performance of a ship. Furthermore, we find that for the present ship, CFD isable to predict performance as accurately as towing tank procedures, indicating that ship scaleCFD is a mature tool for use in future ship designs.
1 INTRODUCTION
Traditionally, the performance of a ship design is estimated by conducting towing tank testson a downscaled version of the ship (model scale). The results from these towing tank tests
1

Henrik Mikkelsen, Mads L. Steffensen, Cosmin Ciortan and Jens H. Walther
are then extrapolated to the scale of the actual ship (ship scale). An alternative to testingin a towing tank is to simulate the flow around the ship using computational fluid dynamics(CFD). CFD simulations can be performed in ship scale, which eliminates scale effects and theneed for extrapolation. A disadvantage of using CFD is modelling errors which occur due tosimplification of the flow physics (e.g. turbulence).
Extensive validation of CFD simulations in model scale has been conducted by e.g [7], whichshowed good agreement with experimental results of the research ship Kriso Container Ship(KCS). Furthermore, validation workshops have been hosted, where the participants blindlysubmit CFD results to be compared with towing tank results [9, 8].
With the increased confidence in model scale, the next step is ship scale CFD, which has beenstudied by e.g. [1]. However, in ship scale publicly accessible validation data is extremely rare.The largest contribution so far on ship scale validation, is the Lloyd’s Register workshop from2016 [11]. A comparison between ship scale CFD and sea trial measurements of a car carrierhas been conducted by [6] showing accurate correspondence.
The present paper includes a comparison between sea trial measurements, ship scale CFD,model tank experiments and in-service performance. It is the first published study, where allthese elements are compared. The conducted self-propulsion CFD simulations in the presentstudy calculate the wave-making resistance in a different way than e.g. [13, 6] since the wave-making resistance is calculated separately. This results in a significantly reduced computationalcost.
The key to a useful comparison is highly accurate sea trial data. Sea trial data generallyhas significant uncertainties because of the lack of control in the experimental environment.There is a focus in the industry on obtaining increasingly accurate sea trial results, as seen withintroduction of the new sea trial procedure ISO 15016:2015 cf. [4]. Besides the difficulties inconducting experiments at such a large scale, it is also important to remember that there aremany stakeholders in a sea trial, each with different interests.
2 THE STUDIED VESSEL AND MEASUREMENTS
The ship considered in the present study is a LPP = 196 m bulk carrier built by a Japaneseshipyard.
2.1 Hull
The hull has been provided as a 3D geometry by the Japanese shipyard. The hull and waterlines of the design and sea trial conditions are shown in Figure 1. The displacement of the shipin sea trial condition is 40.2 % of the displacement in the design condition. The vessel is atdesign speed sailing at a Reynolds number Re =
VDesignLPP
ν ≈ 1.1 × 10⁹ and a Froude number
Fr =VDesign√gLPP
≈ 0.2.
2.2 Propeller
The data of the actual and the stock propeller can be seen in Table 1. Due to confidentialityit has not been possible for the propeller manufacturer to provide the 3D geometry of the actualpropeller. Therefore, the stock propeller has been used for all CFD simulations.
2

Henrik Mikkelsen, Mads L. Steffensen, Cosmin Ciortan and Jens H. Walther
Figure 1: Hull geometry. The upper horizontal line is the water line of the design condition, and thelower horizontal line is the water line of the sea trial condition. Seen from starboard side.
Parameter Actual Stock
Ship scale diameter 6.00 m 6.00 mBoss ratio 0.1417 0.18Pitch ratio (0.7r) 0.7284 0.76Expanded area ratio 0.48 0.58Number of blades 4 4
Table 1: Data of the actual and the stock propeller.
2.3 Appendages
The actual ship is mounted with a rudder, a number of upstream stator fins and bilge keels.The ”to-be-built” 2D-drawings of the stator fins and rudder including rudder bulb have beenprovided by the Japanese shipyard. Based on these drawings, the stator fins and rudder geometryhave been recreated in 3D.
The stator fins are a retrofitted energy saving device and are mounted upstream of thepropeller to produce pre-swirl.
Bilge keels are not included in the CFD simulations since they are not mounted on the modelship in the towing tank test. They are instead accounted for in the towing tank and CFDsimulations by using the standard International Towing Tank Committee (ITTC) method [5].
2.4 Towing tank testing
Towing tank tests of the vessel are conducted by the National Maritime Research Institutein Tokyo, Japan. The tests conducted by the towing tank are resistance tests, open water testsand self-propulsion tests. The results from the towing tank have been extrapolated using thestandard ITTC extrapolation procedure [5].
2.5 Sea trial
Four sister vessels of the same design have been built in total. Speed trials have been con-ducted for each of the four sister ships. In 2015, the International Maritime Organisation (IMO)and ITTC released ISO15016:2015 [4], an updated version of the ISO 15016:2002 standard pro-cedure for carrying out and correcting speed trials. The speed trials of the fourth ship havebeen conducted mostly as described in [4]. The speed trials of the three other ships have beenconducted prior to the release of that procedure, but is assumed to have been conducted usingsimilar procedures. The Japanese shipyard has provided the results of these speed trials for allfour ships. The main measurements in the speed trial are speed, propeller rate of rotation, andthe engine power. After the speed trial, the measurements are corrected for the environment
3

Henrik Mikkelsen, Mads L. Steffensen, Cosmin Ciortan and Jens H. Walther
forces.
2.5.1 Speed measurement and corrections
The speed of the ship during the speed trial is measured using a Differential-GPS (DGPS).The temporary DGPS is installed on top of the bridge and is connected to a laptop. From theDGPS data, the ship speed over ground is calculated by assuming no lateral drift. The shipspeed is recorded during each speed run, with a sampling frequency of about 1 Hz. From therecorded data, a mean ship speed is calculated.
The speed over ground signal is visually inspected, showing only minor fluctuation. Based onobservations, it is concluded that the speed signal is reliable and that the mean is an accuratemeasurement of the actual speed over ground of the ship. To obtain the speed through water,the speed measurement has to be corrected for current. The measured speed is corrected for thetidal current by using double runs: one in the direction against the current and one with thecurrent.
2.5.2 Power measurement and correction
The power of the engine is calculated from the engine rate of rotation and the the fuel index(FI), which is indicating the amount of fuel injected ranging from 0 to 100, using the followingformula provided by the engine manufacturer:
P = Ccyl Ceng n pme (1)
Ceng =60
2π100.7355 × 10⁻³ (2)
pme = 19375FI − 105938 (3)
Here P denotes the engine power in Watts, Ccyl and Ceng are cylinder coefficient provided by theengine manufacturer, n is the rate of revolutions per second, pme is the mean effective pressurein Pascals. The mean effective pressure (pme) is calculated from the fuel index cf. Equation (3)as provided by the engine manufacturer:
Both the rate of rotation and the fuel index are sampled directly from the engine controlsystem. The revolutions per minute of the engine is measured directly on the shaft, and thereis no gear box.
ISO15016:2015 [4] states that the power has to be measured using a torque meter mounteddirectly on a shaft. Such a device is also installed, but the measurements are not used in thespeed trial results.
The measured power is corrected for the difference between the planned and the actualdisplacement of the ship [4]. The planned displacement of the ship in sea trial condition iscalculated before conducting the sea trial, and the actual displacement is measured at thebeginning of the sea trial. The correction is conducted by the shipyard. The difference indisplacements is less than 1 %.
The performance of the ship is corrected for the added wind resistance [4, Annex C]. Thewind correction is based on an estimated drag coefficient, an estimated projected front area and
4
Henrik Mikkelsen, Mads L. Steffensen, Cosmin Ciortan and Jens H. Walther
Resistance TestModel scale
Open Water TestModel scale
Self-Propulsion TestModel scale
Self-Propulsion TestShip scale
Resistance TestShip scale
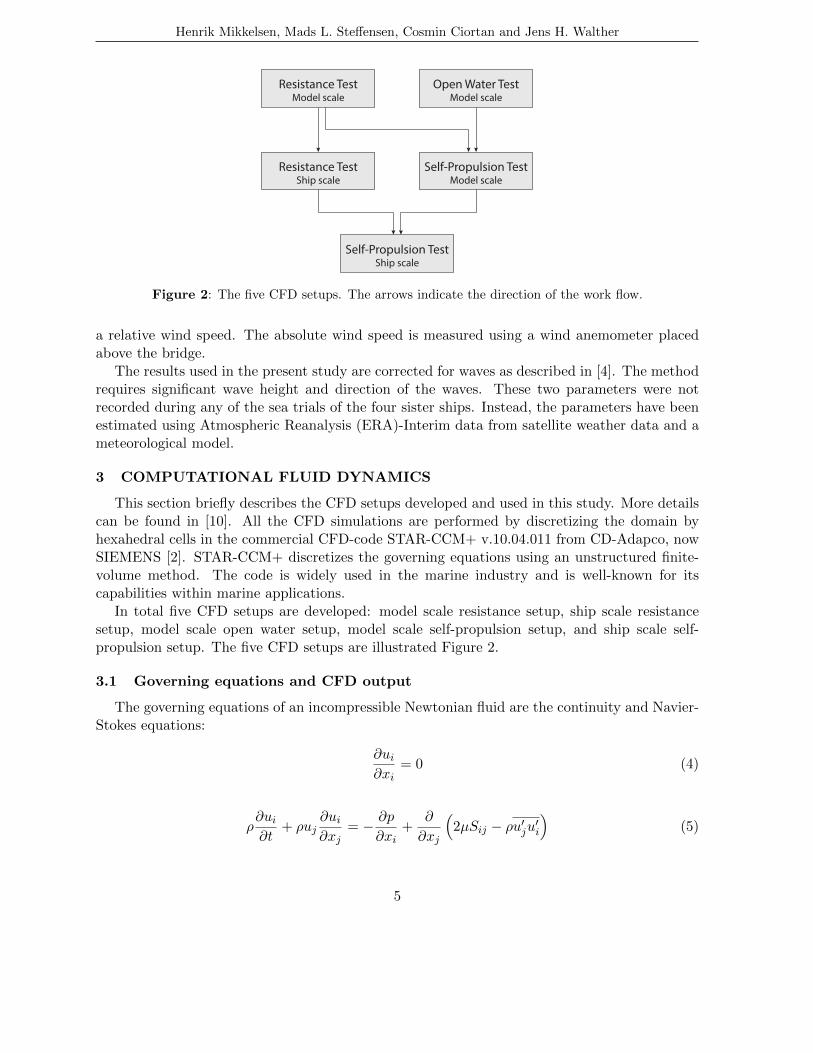
Figure 2: The five CFD setups. The arrows indicate the direction of the work flow.
a relative wind speed. The absolute wind speed is measured using a wind anemometer placedabove the bridge.
The results used in the present study are corrected for waves as described in [4]. The methodrequires significant wave height and direction of the waves. These two parameters were notrecorded during any of the sea trials of the four sister ships. Instead, the parameters have beenestimated using Atmospheric Reanalysis (ERA)-Interim data from satellite weather data and ameteorological model.
3 COMPUTATIONAL FLUID DYNAMICS
This section briefly describes the CFD setups developed and used in this study. More detailscan be found in [10]. All the CFD simulations are performed by discretizing the domain byhexahedral cells in the commercial CFD-code STAR-CCM+ v.10.04.011 from CD-Adapco, nowSIEMENS [2]. STAR-CCM+ discretizes the governing equations using an unstructured finite-volume method. The code is widely used in the marine industry and is well-known for itscapabilities within marine applications.
In total five CFD setups are developed: model scale resistance setup, ship scale resistancesetup, model scale open water setup, model scale self-propulsion setup, and ship scale self-propulsion setup. The five CFD setups are illustrated Figure 2.
3.1 Governing equations and CFD output
The governing equations of an incompressible Newtonian fluid are the continuity and Navier-Stokes equations:
∂ui∂xi
= 0 (4)
ρ∂ui∂t
+ ρuj∂ui∂xj
= − ∂p
∂xi+
∂
∂xj
(2µSij − ρu′ju
′i
)(5)
5

Henrik Mikkelsen, Mads L. Steffensen, Cosmin Ciortan and Jens H. Walther
Figure 3: Wave elevation from model scale resistance simulation.
where ui is the velocity vector, t is time, p is pressure, µ is dynamic viscosity, Sij = 12
(∂ui∂xj
+∂uj∂xi
)is the mean strain rate and u′ is the fluctuating part of the velocity.
The calm free surface in the resistance and self-propulsion simulations is resolved using thevolume of fluid (VOF) method in STAR-CCM+ [2, 3]. The turbulence is modelled using therealisable k-ε turbulence model [2, 12].
One output from the CFD simulations is the total ship resistance, which is calculated byintegrating the shear and pressure force on the entire ship hull excluding the propeller.
The propeller thrust T is calculated by integrating all shear and pressure forces on thepropeller parallel to the shaft axis.
The propeller torque Q is calculated by integrating all moment contribution from both theshear and pressure forces on the propeller around the shaft axis.
3.2 CFD resistance test
The calm water resistance calculation is first created in model scale and validated by com-paring results with the towing tank results. The validated model scale setup is then scaled up toa ship scale setup. Convergence studies are conducted in both the model and ship scale setup.Results of the ship scale CFD setup are compared with the extrapolated resistance data fromthe towing tank data. More details on the CFD resistance setup, can be found in [10].
All resistance simulations are performed in the sea trial condition similarly to the towingtank test and sea trial. The initial CFD setup used to estimate the calm water resistance is anautomated CFD setup developed by OSK-ShipTech A/S. An illustration of the wave elevationin a resistance simulation is shown in Figure 3.
The CFD resistance setup uses a number of different physics models to describe the flowaround the ship. Free surface waves are modelled using volume of fluid [2, 3]. The hull isallowed dynamic pitch and heave motions. The simulations are solved using a 1st order implicitunsteady solver.
After demonstrating good agreement with the towing tank results, the ship scale resistancesetup is created by scaling up the model scale resistance setup with the scaling factor. Theprism layers is changed so the wall y+ is still mostly in the range of 50–100.
6

Henrik Mikkelsen, Mads L. Steffensen, Cosmin Ciortan and Jens H. Walther
Figure 4: Vorticity downstream of propeller in self-propulsion simulation.
3.3 CFD open water
Modelling the open water test using CFD is less complex than modelling the self-propulsiontest because the hull-propeller interaction is not included in the open water setup. The idea isthat a separately validated resistance and open water setup can be combined to a self-propulsionsetup by using the validated mesh and time step settings. This self-propulsion setup can thenbe validated in model scale by comparing it with self-propulsion results from towing tank tests.
The single phase open-water CFD setup is fully resolving the boundary layer with wall y+values approximately equal to one.
The open water setup uses two domains: A stationary domain and a rotating domain. Thetwo domains are connected by an interface. The shape of the stationary domain is a rectangularcuboid. The shape of the rotating domain is a cylinder which is located inside the static domainand around the propeller. In order to better resolve the flow around the propeller, two refinementzones are used to refine the mesh in the volume around the propeller.
The propeller movement can be modelled using two methods: the moving reference frame(MRF) method or the sliding mesh (SM) method. For the open-water simulation, MRF is used.
3.4 CFD self-propulsion
The self-propulsion CFD setup is created by combining the model scale resistance CFD setupwith the propeller and the open water CFD setup. As in the open water setup, the self-propulsionsetup uses two domains; a large static domain, with a small rotating domain inside. The shapeof the static domain is a rectangular cuboid, and the shape of the rotating domain is a cylinder.The resolved flow around propeller is illustrated in Figure 4.
In order to minimize computational cost, the free surface is not included directly in the self-
7

Henrik Mikkelsen, Mads L. Steffensen, Cosmin Ciortan and Jens H. Walther
propulsion simulation. This in conducted by replacing the free surface with a slip wall. Themethod is originally developed and validated at DNV-GL. Instead of modelling the dynamic pitchand heave using the DFBI model, the dynamic pitch and heave of the resistance simulationsare prescribed to the self-propulsion simulations before they are simulated. Removing the freesurface waves from the simulations gives rise to another problem. In reality, a stern wave iscreated by the ship. The stern wave increases the water height above the propeller, whichaffects the flow. In order to resolve this, the symmetry plane is raised to a highest point of thestern wave obtained in the resistance simulation. In the present case, the symmetry plane iselevated 3 % of the draft in the sea trial condition. The decision not to model the free surfacewaves and to raise the calm water surface decreases the measured resistance on the ship. Inorder to compensate for this change, a free surface correction is performed on the results of theself-propulsion simulations. The correction is performed in two steps. The first step is to correctfor not modelling the free surface waves, which reduces the hull resistance by removing the wavemaking resistance. The wave making resistance is quantified by simulating the resistance setupboth with and without the free surface waves. The difference between those two results is thewave making resistance:
RW = RT −RV (6)
where RW is the wave making resistance, RT is the total resistance and RV is the total resistancewithout free surface waves, also referred to as the viscous resistance. In the present study thewave making resistance is approximately 25 % of the total resistance.
The second step is to correct for the raised free surface which increases the resistance onthe hull, because a larger surface area is submerged. The increase in resistance is quantified bysimulating the resistance both with the initial and the raised surface heights without modellingthe free surface. The difference between those two results is the added resistance due to theraised surface ∆RSH , which in the present study is approximately 7 % of the total resistance, isgiven by:
∆RSH = RV,SH −RV (7)
where RV,SH is the viscous resistance with the raised surface height. The resistance of the self-propulsion simulations can then be corrected for wave making resistance and added resistancedue to the raised surface height:
RTm = RV m,SH +RWm − ∆RSHm (8)
where the subscript ’m’ refers to model scale.For the self-propulsion simulations a combination of the two methods is used for increased
computational efficiency. The modelling of the propeller rotation is initialized by using the MRFmethod, followed by the SM method. The SM uses a time step corresponding to two degreesof propeller rotation. These steps with different methods and time steps are used to minimizethe computational cost. One advantage of using the method with the separate calculation ofthe wave-making resistance is that the MRF step can be solved with a steady-state solver.Furthermore, it is not necessary to solve the volume fraction transport equation or to refine
8

Henrik Mikkelsen, Mads L. Steffensen, Cosmin Ciortan and Jens H. Walther
Simulation type Parameter Discrepancy from model tank test
Resistance Total resistance ≈ 0–2 %
Open waterThrust coefficientTorque coefficient
Efficiency
≈ 1–3 %≈ 3–5 %≈ 2–7 %
Self-propulsionThrust coefficientTorque coefficient
Rotation rate
≈ 3–7 %≈ 6–7 %≈ 2–6 %
Table 2: Discrepancy of model scale CFD results from model tank test [10].
the mesh near the free surface. This significantly decreases the computational cost. The self-propulsion simulation has more than double as many cells as the resistance simulation and atime step in the SM step, which is approximately a factor of 30 smaller cf. [10]. However,the computational cost of the self-propulsion simulation, using the present approach, is onlyapproximately 20 % higher than a resistance simulation.
The CFD self-propulsion setup is carried out by changing the rate of revolution of the propelleruntil a force equilibrium is obtained in the sailing direction within a reasonable small tolerance.
The ship scale self-propulsion setup is created by scaling up the model scale self-propulsionsetup according to the scaling factor. The prism layers is changed so the wall y+ is still mostlyin the range of 30–100 on the hull and propeller.
The free surface correction method is changed slightly from model scale to ship scale in orderto account for the roughness resistance, air resistance and bilge keel resistance which are onlyrelevant for the ship scale simulations. The wave making resistance and the added resistance ofthe increased surface height are calculated similarly to Equations (6) and (7).
The ship scale resistance is then calculated using:
RTs =S + SBK
S(RV s,SH + ∆RF ) +RWs +RAAS − ∆RSHs (9)
where the subscript ’s’ refers to ship scale, S is the wetted surface without the bilge keels, SBKis the wetted surface including the bilge keels, ∆RF is the roughness resistance, and RAAS is theair resistance. The correlation allowance CA cf. [5] is not included in the total resistance becauseits purpose is to correct for systematic errors in the towing tank extrapolation procedure.
4 RESULTS AND DISCUSSION
4.1 Validation of the CFD simulations
It is essential to ensure the accuracy of the CFD setup before conclusions are based on theresults of the setup.
Convergence studies have been conducted for both the spatial and temporal discretizationfor all five setups. The discrepancy of the model scale CFD results from the model tank test areshown in Table 2. More details can be found in [10].
Based on the convergence studies and comparisons to the towing tank tests, the results ofthe model scale self-propulsion setup are reasonable. The ship scale set-up has been built up in
9

Henrik Mikkelsen, Mads L. Steffensen, Cosmin Ciortan and Jens H. Walther
the same way as the model scale CFD set-up. All convergence tests and comparisons in shipscale have shown satisfactory results cf. [10].
4.2 Comparison of sea trial and in-service performance data
The results provided by the shipyard are the measured values corrected for wind and current.The procedures of the sea trial and corrections are briefly described in Section 2.5.
The results from the sea trials seen in Figure 5 show high correlation between speed andpower, and low scatter of the data points. This indicates that the accuracy of the speed trialdata is high. However, systematic errors can not be determined solely from the data providedfor this study.
The correction for wind, waves and current is a possible sources for systematic errors. Asmentioned, the ISO 15016:2015 procedure [4] defines strict standards for conducting sea trialsand ensures accurate measurements and corrections. The power measurements based on engineformulas are another possible source for systematic errors.
A way to validate the results from the sea trial is by comparing the results with performancemeasurements on the ship after the delivery while it is in service. The ship owner has providedin-service performance data in sea trial condition corrected for wind and waves by the shipowner. The data is the mean performance of all four sister ships in the first 3-9 months ofoperation. The power is based on torque measurements directly on the shaft and not the enginemanufacturer formula as in case of the sea trial measurements. The ship owner has estimated theuncertainty to be approximately ±3.5 % maximum continuous rating (MCR). Uncertainties inthe performance data includes e.g. uncertainties in the raw torque measurement, the correctionfor wind and waves and the averaging of the data from the four sister ships.
The results of the sea trial are compared to the in-service performance data in Figure 5. Thecomparison shows that the ships use more power in-service than during sea trial. On average,the sea trial data shows 8 % less power than the in-service performance data. This is expectedsince the ships are in excellent condition at the sea trial with minimal fouling on the ship hull.Even though both the sea trial data and the in-service performance data have uncertainties, therelatively low offset in power shows that the sea trial data and the in-service performance datameasures delivered power in the same range. Furthermore, there is only a small scatter of thesea trial data, which indicates good consistency in the measurements.
4.3 Comparison of sea trial, CFD and towing tank test
The sea trial results presented in Section 4.2 are compared to the extrapolated self-propulsionresults from the towing tank test and ship scale CFD in Figure 5. In this comparison, it isassumed that there is no loss in the shaft, which is a reasonable assumption, since there is nogear.
The extrapolated towing tank results are overestimating the power by approximately 3–9 %with an average of 6 % compared to the sea trial results. Considering that towing tank tests areconducted at a much lower Reynolds number and extrapolated, the observed discrepancies aresatisfactory.
Is it important to remember that the extrapolation of the towing tank results are performedby the authors using the standard ITTC procedure [5]. Based on the authors’ experience, many
10
Henrik Mikkelsen, Mads L. Steffensen, Cosmin Ciortan and Jens H. Walther
0.170 0.175 0.180 0.185 0.190 0.195Fn [-]
60
80
100
120
Del
iver
ed P
ower
[% M
CR
]
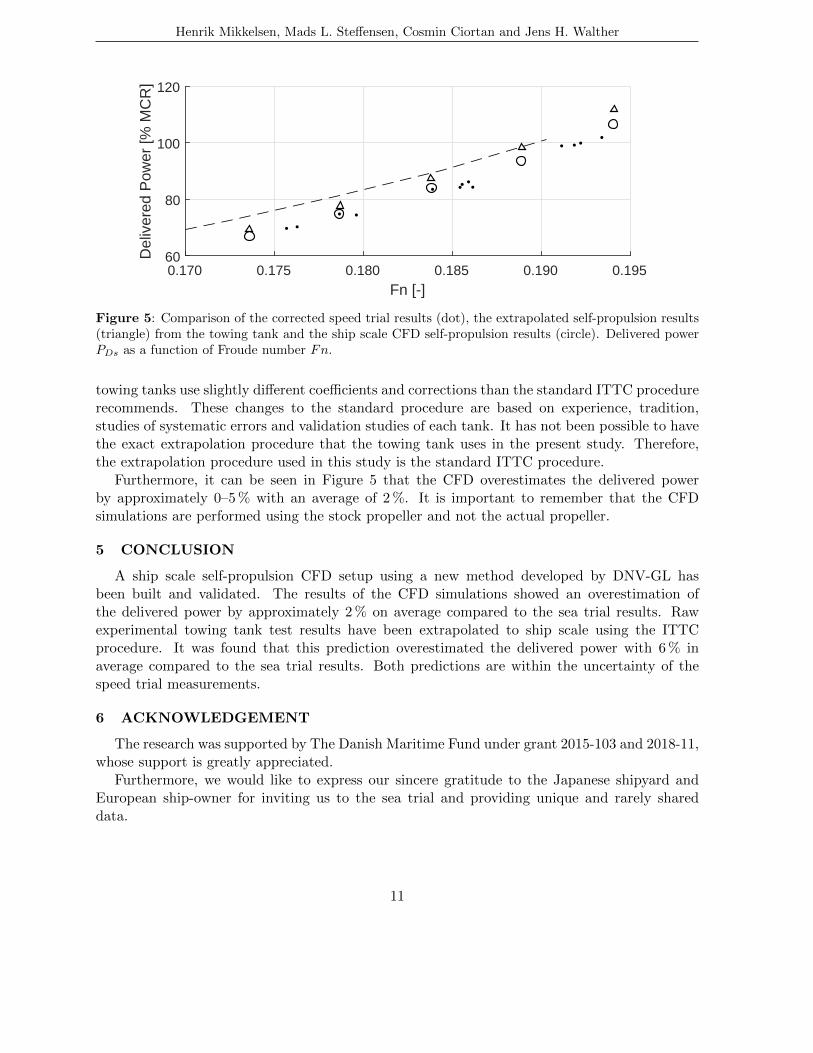
Figure 5: Comparison of the corrected speed trial results (dot), the extrapolated self-propulsion results(triangle) from the towing tank and the ship scale CFD self-propulsion results (circle). Delivered powerPDs as a function of Froude number Fn.
towing tanks use slightly different coefficients and corrections than the standard ITTC procedurerecommends. These changes to the standard procedure are based on experience, tradition,studies of systematic errors and validation studies of each tank. It has not been possible to havethe exact extrapolation procedure that the towing tank uses in the present study. Therefore,the extrapolation procedure used in this study is the standard ITTC procedure.
Furthermore, it can be seen in Figure 5 that the CFD overestimates the delivered powerby approximately 0–5 % with an average of 2 %. It is important to remember that the CFDsimulations are performed using the stock propeller and not the actual propeller.
5 CONCLUSION
A ship scale self-propulsion CFD setup using a new method developed by DNV-GL hasbeen built and validated. The results of the CFD simulations showed an overestimation ofthe delivered power by approximately 2 % on average compared to the sea trial results. Rawexperimental towing tank test results have been extrapolated to ship scale using the ITTCprocedure. It was found that this prediction overestimated the delivered power with 6 % inaverage compared to the sea trial results. Both predictions are within the uncertainty of thespeed trial measurements.
6 ACKNOWLEDGEMENT
The research was supported by The Danish Maritime Fund under grant 2015-103 and 2018-11,whose support is greatly appreciated.
Furthermore, we would like to express our sincere gratitude to the Japanese shipyard andEuropean ship-owner for inviting us to the sea trial and providing unique and rarely shareddata.
11

Henrik Mikkelsen, Mads L. Steffensen, Cosmin Ciortan and Jens H. Walther
REFERENCES
[1] A. M. Castro, P. M. Carrica, and F. Stern. Full scale self-propulsion computations usingdiscretized propeller for the KRISO container ship KCS. Comput. Fluids, 51(1):35–47, 2011.
[2] CD-Adapco. STAR-CCM+ Documentation, Version 10.04, 2015.
[3] C. Hirt and B. Nichols. Volume of fluid (VOF) method for the dynamics of free boundaries.J. Comput. Phys., 39(1):201–225, 1981.
[4] IMO. ISO 15016:2015. MEPC 68/INF.14, 2015.
[5] ITTC. Recommended Procedures and Guidelines, 1978 ITTC Performance PredictionMethod, 2005.
[6] H. Jasak, V. Vukcevic, I. Gatin, and I. Lalovic. CFD validation and grid sensitivity studiesof full scale ship self propulsion. Int. J. Nav. Archit. Ocean Eng., 2018.
[7] J. Kim, I.-R. Park, K.-S. Kim, and S.-H. Van. Numerical Simulation of Turbulent FreeSurface Flow around a Self-Propelled Ship. In Proc. Fifteenth Int. Offshore Polar Eng.Conf., pages 180–186, Seoul, Korea, 2005.
[8] L. Larsson, F. Stern, M. Visonneau, T. Hino, N. Hirata, and J. Kim. PROCEEDINGS,TOKYO 2015 WORKSHOP ON CFD IN SHIP HYDRODYNAMICS. 2015.
[9] L. Larsson, F. Stern, and M. Vsonneau. Gothenburg 2010 A Workshop on Numerical ShipHydrodynamics Editors. II(1652), 2010.
[10] H. Mikkelsen and M. L. Steffensen. Full Scale Validation of CFD Modelof Self-Propelled Ship. Master’s thesis, Technical University of Denmark,https://doi.org/10.13140/RG.2.2.25689.21607, 2016.
[11] D. Ponkratov. 2016 Workshop on Ship Scale Hydrodynamic Computer Simulation. Lloyd’sRegister, 2017.
[12] T.-H. Shih, W. W. Liou, A. Shabbir, Z. Yang, and J. Zhu. A new k-ε eddy viscosity modelfor high Reynolds number turbulent flows. Comput. Fluids, 24(3):227–238, 1995.
[13] C. Zegos and D. Ponkratov. Ship scale CFD free sink, trim & surge self-propulsion simula-tion and direct comparison to sea trials. Rina, R. Inst. Nav. Archit. - Int. Conf. Comput.Appl. Shipbuild., 2:49–57, 2015.
12