shi et al: aided loudness growth and satisfaction with everyday
TRANSCRIPT
*Institute for Sensory Research, Department of Communication Sciences and Disorders, Syracuse University; †Institute forSensory Research, Department of Biomedical and Chemical Engineering, Syracuse University
Lu-Feng Shi, Department of Communication Sciences and Disorders, Syracuse University, Syracuse, New York 13244;Phone: 315-443-5570; Fax: 315-443-1113; E-mail: [email protected]
This work was supported by Grant 5 P01 DC00380 from the National Institutes of Health and Grant R21 DC006057 fromthe National Institute on Deafness and Other Communication Disorders.
Aided Loudness Growth and Satisfaction withEveryday Loudness Perception inCompression Hearing Aid Users
Lu-Feng Shi*
Karen A. Doherty*
Jozef J. Zwislocki†
Abstract
The primary goal of this study was to examine the relationship betweenlisteners’ loudness growth and their satisfaction with loudness when wearingwide-dynamic-range compression (WDRC) hearing aids. An absolute-magnitude-estimate procedure was used to obtain listeners’ unaided and aided loudnessgrowth functions in response to a 500 and 2000 Hz warble tone. In general,listeners’ unaided loudness growth functions were steeper than the averagenormal-hearing listeners’ functions for both frequencies, and their aidedloudness growth functions were shallower than their unaided functions.Loudness growth functions tended to be undercompressed for 500 Hz butovercompressed for 2000 Hz. The Profile of Aided Loudness (PAL) questionnairewas administered to determine listeners’ loudness satisfaction in everydaylistening situations. Most listeners were satisfied with their perception of soft,average, and loud environmental sounds, regardless of how well or not welltheir WDRC aids normalized their aided loudness growth.
Key Words: Compression, hearing aids, loudness growth, loudness satisfaction
Abbreviations: AME = absolute magnitude estimate; ANSI = AmericanNational Standards Institute; APHAB = Abbreviated Profile of Hearing AidBenefit; LGOB = loudness growth in 1/2-octave bands; PAL = Profile of AidedLoudness; WDRC = wide-dynamic-range compression
Sumario
La meta primaria de este estudio fue examinar la relación entre el crecimientode la apreciación subjetiva de la intensidad (sonoridad) en el oyente y susatisfacción con dicha sonoridad ante el uso de auxiliares auditivos concompresión de rango dinámico amplio (WDRC). Se utilizó un procedimientode estimación absoluta de la magnitud para obtener en los sujetos las funcionesde crecimiento de la sonoridad, con amplificación y sin ella, en respuesta atonos modulados de 500 y 2000 Hz. En general, las funciones de crecimientoen la sonoridad sin amplificación mostraron una pendiente más pronunciadaque dichas funciones para normo-oyentes, en ambas frecuencias, y en lasmismas funciones con amplificación, las pendientes fueron menos profundas,que en aquellas sin amplificación. Las funciones de sonoridad tendieron a estarsub-comprimidas en 500 Hz pero sobre-comprimidas en 2000Hz. Se administróel cuestionario del Perfil de Sonoridad con Amplificación (PAL) para determinarla satisfacción del oyente a este incremento subjetivo de la intensidad en
J Am Acad Audiol 18:206–219 (2007)
206
Aided Loudness Growth and Loudness Satisfaction/Shi et al
207
Listeners with hearing loss of cochlearorigin usually demonstrate somedegree of loudness recruitment (Fowler,
1936). “Loudness recruitment” refers toloudness perception that grows faster thannormal beyond a listener’s elevated hearingthreshold (e.g., Margolis, 1985; Allen et al,1990; Neely and Allen, 1997; Hellman, 1999;Oxenham and Bacon, 2003; Moore, 2004).One purpose of nonlinear amplification,including wide-dynamic-range compression(WDRC), is to compensate for loudnessrecruitment by providing less gain for high-level inputs and more gain for low-level inputs(e.g., Byrne, 1996; Dillon, 1996; Kuk, 1996).Consequently, hearing aid fitting algorithmshave been suggested based on averageloudness growth functions for low-, mid-, andhigh-input levels (e.g., Killion and Fikret-Pasa, 1993; Ricketts, 1996; Valente and VanVliet, 1997).
However, little evidence has been foundindicating that loudness normalizationincreases satisfaction in hearing aid users(e.g., Byrne, 1996; Dillon, 1996; Kuk, 1996).In cases of severe recruitment, highcompression ratios would be needed tonormalize loudness growth, but such ratioscould be detrimental to speech perception(e.g., Moore et al, 1992; Neuman et al, 1994;Plomp, 1994; Van Tasell and Trine, 1996;Verschuure et al, 1996). Therefore, thequestion is raised: Is loudness normalizationnecessary for listeners to be satisfied withaided loudness (Byrne, 1996)?
The purpose of the present study was toaddress this question by examining therelationship between listeners’ loudness
growth functions and their performance onthe Profile of Aided Loudness (PAL)questionnaire (Palmer et al, 1999). Oneunique aspect of this study was to testlisteners with their own hearing aids in the“as is” condition, because it is of interest forclinicians to understand how the averagelistener is perceiving loudness in everydaylistening when wearing hearing aids thatmay have been modified over time. Ifinadequately normalized loudness growthwas correlated with low satisfaction on thePAL questionnaire, we would conclude thataccurate loudness normalization is importantfor a listener wearing a compression hearingaid. In contrast, a low correlation wouldsuggest that loudness normalization doesnot play a crucial role in aided loudnesssatisfaction.
The primary methods used to obtainloudness growth functions include categoricalmeasures (e.g., Allen et al, 1990; Jenstad etal, 2000), absolute magnitude estimate (AME;e.g., Collins and Gescheider, 1989; Hellmanand Meiselman, 1990, 1993), and absolutemagnitude production (e.g., Hellman andMeiselman, 1990, 1993). Results fromcategorical scales can be confounded by therange and starting point of the test stimulus(Zwislocki and Goodman, 1980) and may notbe the optimal method for hearing aid fitting(Elberling, 1999). Absolute magnitudeproduction cannot be easily performed in atypical clinic setting because it requiresspecial test equipment. Thus, the presentstudy employed an absolute-magnitude-estimate (AME) method to measure loudnessgrowth.
situaciones auditivas cotidianas. La mayor parte de los sujetos estuvieronsatisfechos con su percepción de sonidos ambientales suaves, promedio yfuertes, independientemente de cuán bien sus auxiliares auditivos con WDRCnormalizaran este crecimiento en la sonoridad.
Palabras Clave: Compresión, auxiliares auditivos, crecimiento de la apreciaciónsubjetiva de la intensidad (sonoridad), satisfacción en cuanto a la sonoridad
Abreviaturas: AME = estimado absoluto de magnitud; ANSI = InstitutoAmericano Nacional de Estándares; APHAB = Perfil Abreviado de Beneficiode los Auxiliares Auditivos; LGOB = Crecimiento de la sonoridad en bandasde media octava; PAL = Perfil de Sonoridad con Amplificación; WDRC =compresión de rango dinámico amplio
Journal of the American Academy of Audiology/Volume 18, Number 3, 2007
208
The AME method has been widely usedin listeners with normal and impairedhearing (e.g., Hellman and Zwislocki, 1968;Hellman and Meiselman, 1990, 1993;Hellman, 1994, 1999). In an AME task, thelistener is asked to assign a number to theloudness of a stimulus. The results of AMEmay vary in listeners due to the complexityof the task and individual experience with thetask (Zwislocki and Goodman, 1980);therefore, to control for these listener-specificbiases, a line-length estimate task isrecommended prior to the AME task(Zwislocki, 1983; Collins and Gescheider,1989). The AME task corrected with line-length estimation has been shown to generatemore accurate loudness growth functionsthan without (Zwislocki, 1983; Collins andGescheider, 1989; Hellman and Meiselman,1990, 1993).
Despite the number of studies conductedon loudness growth, relatively few studieshave reported aided loudness growthfunctions. Jenstad et al (2000) measured agroup of WDRC users’ loudness growthfunctions using a categorical scalingtechnique. The hearing aids were fitted usingthe desired sensation level [input/output](DSL[i/o]) fitting rationale (Cornelisse et al,1995). The investigators found that listeners’aided loudness growth functions were moresimilar to those of normal-hearing listenersthan their unaided functions. This findingsuggests that WDRC can normalize loudnessgrowth in listeners with hearing loss whencompression is set using the DSL[i/o]algorithm.
Although loudness growth functionsprovide an estimate of a listener’s loudnessperception, they cannot directly reveallisteners’ satisfaction with amplified soundsin the “real world.” The PAL, a subjectiveoutcome measure of loudness, is the onlymeasurement currently available that isdesigned exclusively to assess aided loudnessperception in daily life. Some outcomemeasures, such as the Abbreviated Profile ofHearing Aid Benefit (APHAB; Cox andAlexander, 1995), include questions onloudness in subscales, but these questionstypically address a listener’s perception ofvery loud environmental sounds (e.g., firealarm) and do not evaluate loudness of soundsranging more widely in level. Therefore, thePAL was used in the present study.
The PAL questionnaire consists of 12
real-world listening scenarios, which aregrouped into three categories: soft, moderate,and loud. Two rating scales are used tomeasure the listener’s loudness perceptionand satisfaction with loudness, respectively,for each of these 12 scenarios. Thisquestionnaire is easy to administer and takesapproximately ten minutes for the averagelistener to complete.
The purpose of the present study was(1) to determine how normalized listeners’aided loudness growth functions are withtheir WDRC hearing aids, worn at the usersettings, and (2) to assess the relationshipbetween listeners’ aided loudness growthfunctions and the degrees of aided loudnesssatisfaction based on their PAL scores.
METHODS
Listeners
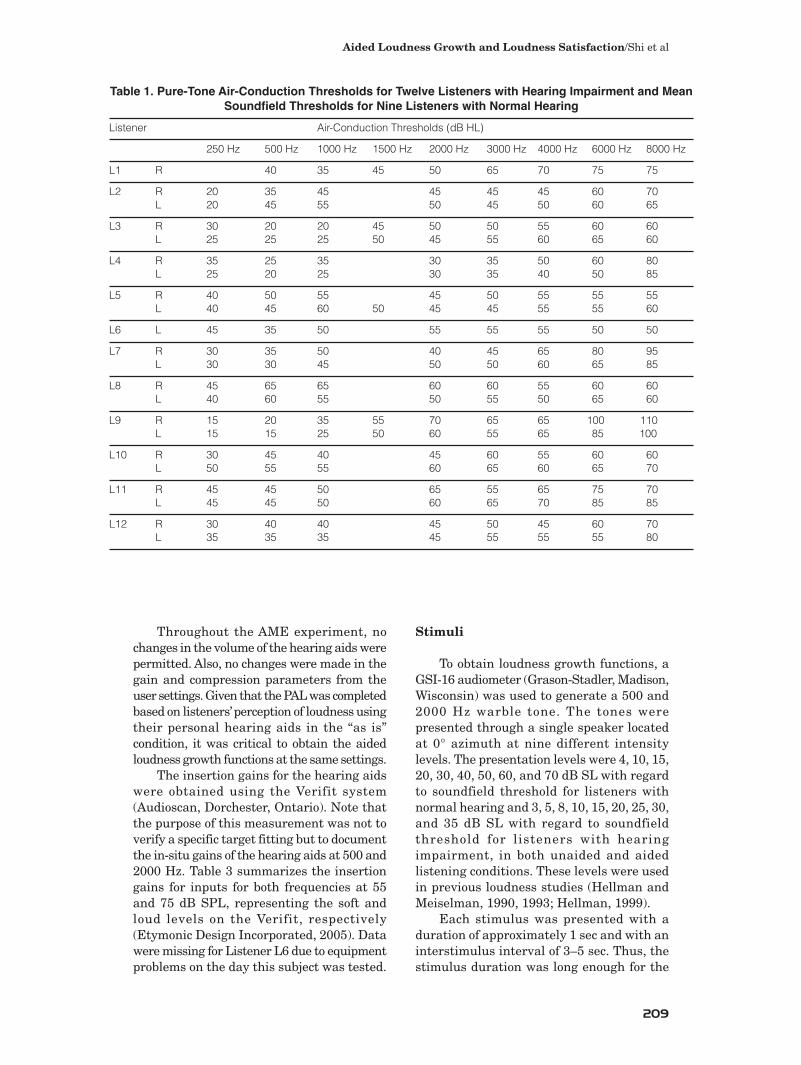
A total of 10 listeners with normalhearing and 12 listeners wearing WDRChearing aids participated in this study. Thenormal-hearing listeners were 19 to 25 yearsof age and had hearing thresholds less than20 dB HL at the octave frequencies between250 and 8000 Hz (American NationalStandards Institute [ANSI], 1989). Onelistener ’s data were excluded from theanalysis because this listener was unable toperform the AME task. The hearing aid userswere 66 to 84 years of age and had mild-to-severe sensorineural hearing loss. Casehistory, middle-ear immittance, and air- andbone-conduction measures were consistentwith hearing loss of cochlear origin. Table 1lists the pure-tone hearing thresholds of thelisteners with hearing loss.
Two listeners (L1 and L6) hadasymmetrical hearing loss and wore onehearing aid in the ear with the worst hearing.All other listeners had symmetrical hearingloss and were fitted binaurally. The listenersin this study all wore WDRC hearing aids forat least six months and were naïve toloudness experiments. Table 2 provides adescription of the specific characteristics ofeach listener’s personal hearing aids, whichwere used for testing in this study. Albeitsometimes minimal, all listeners had somecompression (≥1.3:1) in at least one of theirpersonal hearing aids.
Aided Loudness Growth and Loudness Satisfaction/Shi et al
209
Throughout the AME experiment, nochanges in the volume of the hearing aids werepermitted. Also, no changes were made in thegain and compression parameters from theuser settings. Given that the PALwas completedbased on listeners’perception of loudness usingtheir personal hearing aids in the “as is”condition, it was critical to obtain the aidedloudness growth functions at the same settings.
The insertion gains for the hearing aidswere obtained using the Verifit system(Audioscan, Dorchester, Ontario). Note thatthe purpose of this measurement was not toverify a specific target fitting but to documentthe in-situ gains of the hearing aids at 500 and2000 Hz. Table 3 summarizes the insertiongains for inputs for both frequencies at 55and 75 dB SPL, representing the soft andloud levels on the Verifit, respectively(Etymonic Design Incorporated, 2005). Datawere missing for Listener L6 due to equipmentproblems on the day this subject was tested.
Stimuli
To obtain loudness growth functions, aGSI-16 audiometer (Grason-Stadler, Madison,Wisconsin) was used to generate a 500 and2000 Hz warble tone. The tones werepresented through a single speaker locatedat 0° azimuth at nine different intensitylevels. The presentation levels were 4, 10, 15,20, 30, 40, 50, 60, and 70 dB SL with regardto soundfield threshold for listeners withnormal hearing and 3, 5, 8, 10, 15, 20, 25, 30,and 35 dB SL with regard to soundfieldthreshold for listeners with hearingimpairment, in both unaided and aidedlistening conditions. These levels were usedin previous loudness studies (Hellman andMeiselman, 1990, 1993; Hellman, 1999).
Each stimulus was presented with aduration of approximately 1 sec and with aninterstimulus interval of 3–5 sec. Thus, thestimulus duration was long enough for the
Table 1. Pure-Tone Air-Conduction Thresholds for Twelve Listeners with Hearing Impairment and MeanSoundfield Thresholds for Nine Listeners with Normal Hearing
Listener Air-Conduction Thresholds (dB HL)
250 Hz 500 Hz 1000 Hz 1500 Hz 2000 Hz 3000 Hz 4000 Hz 6000 Hz 8000 Hz
L1 R 40 35 45 50 65 70 75 75
L2 R 20 35 45 45 45 45 60 70L 20 45 55 50 45 50 60 65
L3 R 30 20 20 45 50 50 55 60 60L 25 25 25 50 45 55 60 65 60
L4 R 35 25 35 30 35 50 60 80L 25 20 25 30 35 40 50 85
L5 R 40 50 55 45 50 55 55 55L 40 45 60 50 45 45 55 55 60
L6 L 45 35 50 55 55 55 50 50
L7 R 30 35 50 40 45 65 80 95L 30 30 45 50 50 60 65 85
L8 R 45 65 65 60 60 55 60 60L 40 60 55 50 55 50 65 60
L9 R 15 20 35 55 70 65 65 100 110L 15 15 25 50 60 55 65 85 100
L10 R 30 45 40 45 60 55 60 60L 50 55 55 60 65 60 65 70
L11 R 45 45 50 65 55 65 75 70L 45 45 50 60 65 70 85 85
L12 R 30 40 40 45 50 45 60 70L 35 35 35 45 55 55 55 80
Journal of the American Academy of Audiology/Volume 18, Number 3, 2007
210
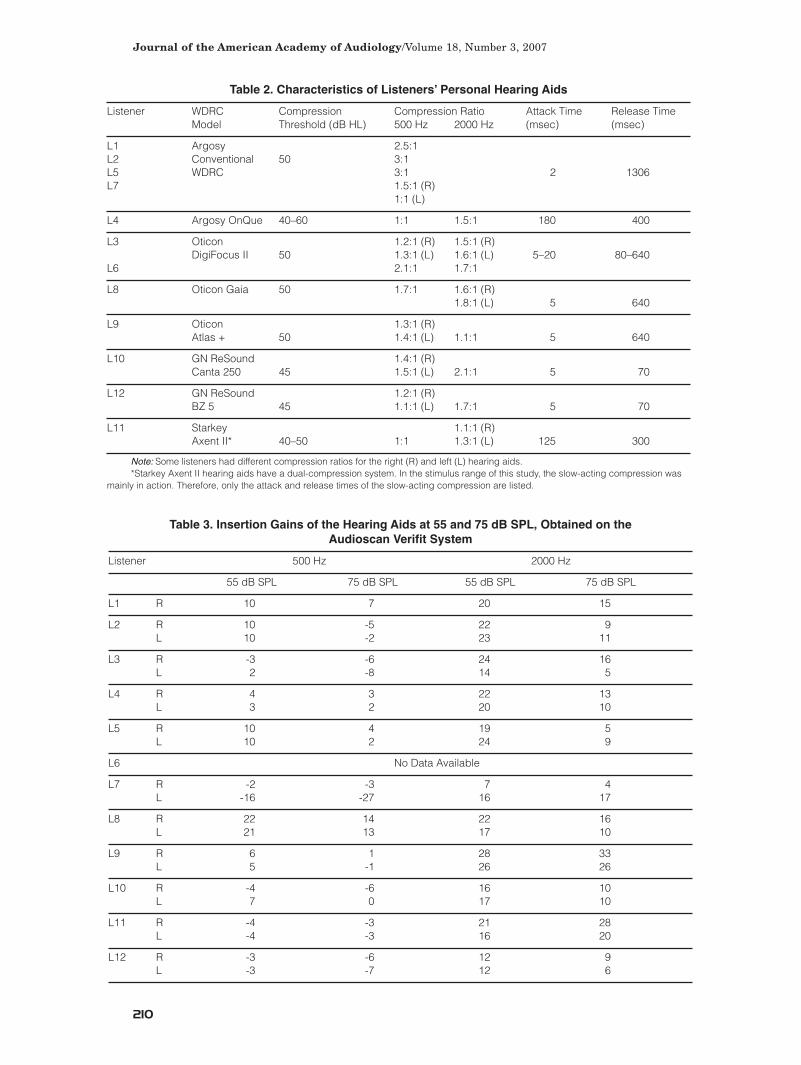
Table 3. Insertion Gains of the Hearing Aids at 55 and 75 dB SPL, Obtained on the Audioscan Verifit System
Listener 500 Hz 2000 Hz
55 dB SPL 75 dB SPL 55 dB SPL 75 dB SPL
L1 R 10 7 20 15
L2 R 10 -5 22 9L 10 -2 23 11
L3 R -3 -6 24 16L 2 -8 14 5
L4 R 4 3 22 13L 3 2 20 10
L5 R 10 4 19 5L 10 2 24 9
L6 No Data Available
L7 R -2 -3 7 4L -16 -27 16 17
L8 R 22 14 22 16L 21 13 17 10
L9 R 6 1 28 33L 5 -1 26 26
L10 R -4 -6 16 10L 7 0 17 10
L11 R -4 -3 21 28L -4 -3 16 20
L12 R -3 -6 12 9L -3 -7 12 6
Table 2. Characteristics of Listeners’ Personal Hearing Aids
Listener WDRC Compression Compression Ratio Attack Time Release Time Model Threshold (dB HL) 500 Hz 2000 Hz (msec) (msec)
L1 Argosy 2.5:1L2 Conventional 50 3:1L5 WDRC 3:1 2 1306L7 1.5:1 (R)
1:1 (L)
L4 Argosy OnQue 40–60 1:1 1.5:1 180 400
L3 Oticon 1.2:1 (R) 1.5:1 (R)DigiFocus II 50 1.3:1 (L) 1.6:1 (L) 5–20 80–640
L6 2.1:1 1.7:1
L8 Oticon Gaia 50 1.7:1 1.6:1 (R)1.8:1 (L) 5 640
L9 Oticon 1.3:1 (R)Atlas + 50 1.4:1 (L) 1.1:1 5 640
L10 GN ReSound 1.4:1 (R)Canta 250 45 1.5:1 (L) 2.1:1 5 70
L12 GN ReSound 1.2:1 (R)BZ 5 45 1.1:1 (L) 1.7:1 5 70
L11 Starkey 1.1:1 (R)Axent II* 40–50 1:1 1.3:1 (L) 125 300
Note: Some listeners had different compression ratios for the right (R) and left (L) hearing aids.*Starkey Axent II hearing aids have a dual-compression system. In the stimulus range of this study, the slow-acting compression was
mainly in action. Therefore, only the attack and release times of the slow-acting compression are listed.
Aided Loudness Growth and Loudness Satisfaction/Shi et al
211
listener’s perception of loudness to be stable(Scharf, 1978) but not too long to causeloudness adaptation (Hellman et al, 1997).This duration also allowed for the WDRC tofully respond and stabilize. The interval timebetween stimuli ensured that presentation ofa second stimulus would not interfere withthe release of compression. The compressiontime constants for listeners’ hearing aids areshown in Table 2.
Line-length estimates were based onseven line lengths projected onto a 1.7 m x1.7 m white screen by a projector (TelexCaramate, Burnsville, Minnesota). The screenwas set at 3.1 m from the listener and 1.83 m from the lens of the projector. A similarsetup was used in the Hellman andMeiselman (1990) study. The experimentercontrolled for the distance between the screenand the projector to maintain the samedistance for all listeners. All participantswere presented with line lengths equal to 1,2, 3, 10, 20, 40, and 100 cm.
Procedure
LLiinnee--LLeennggtthh MMaaggnniittuuddee EEssttiimmaatteess
The line-length task was alwaysperformed before the loudness task. In theline-length task, lines of different lengthswere randomly projected on the screen one ata time, and listeners were asked to assign anumber to the length of each line (e.g., Collinsand Gescheider, 1989). The longest and theshortest line lengths were never presentedfirst (Zwislocki and Goodman, 1980).Listeners could use any positive numbersincluding decimals and fractions. They werespecifically told not to estimate the physicallength of the line (e.g., in inches orcentimeters). Although there was noconstraint on the pacing of the test, theexperimenter encouraged the listeners torespond spontaneously to the stimuli.
AAbbssoolluuttee MMaaggnniittuuddee EEssttiimmaattee ooffLLoouuddnneessss
For the loudness task, listeners wereplaced in the sound field, and loudness growthfunctions were obtained at 500 and 2000 Hz.The order of presentation of the 500 and
2000 Hz conditions was randomized for alllisteners. Listeners were given the sameinstructions as in the line-length task, but thistime they were asked to assign a number tothe loudness of a sound they heard insteadof the length of a line. Each stimulus wasrandomly presented at nine differentsensation levels. Listeners were presentedthree runs of the nine presentation levels. Thefirst run was considered practice and notincluded in the final analysis. Loudnessmagnitude estimates were first obtainedunaided and then aided in listeners withhearing impairment. The unaided ear of thetwo monaurally aided listeners was occludedwith an earplug during all testing.
Loudness near threshold has been shownto grow faster than the rest of the dynamicrange (Zwislocki, 1965; Hellman andZwislocki, 1968; Collins and Gescheider, 1989;Moore and Glasberg, 1997; Moore, 2004).Thus, for the linear regression to best fit theloudness data, estimates of loudness at thethree lowest sensation levels were excluded.As a result, only loudness data for the highersix presentation levels were analyzed in thecurrent study. If the lower levels wereincluded, they would have skewed the slopeof the loudness growth function. Thisapproach is consistent with other AMEloudness studies that have excluded datafrom very low or high presentation levels(e.g., Hellman and Meiselman, 1990, 1993).
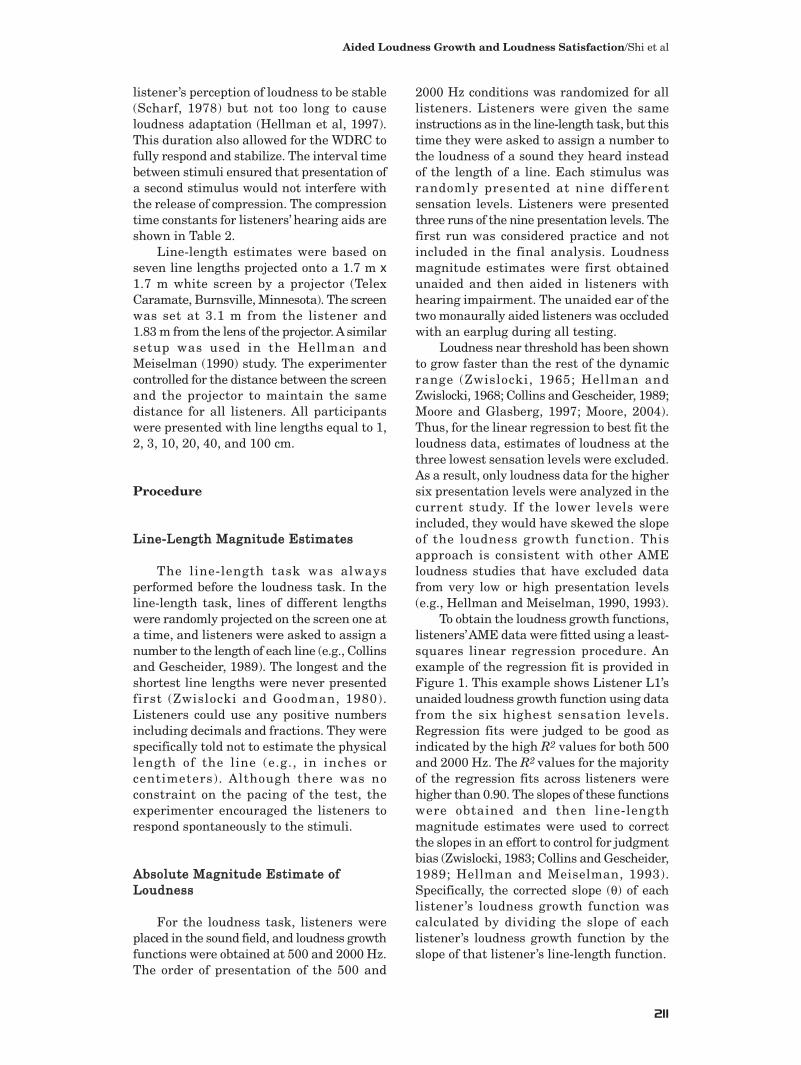
To obtain the loudness growth functions,listeners’AME data were fitted using a least-squares linear regression procedure. Anexample of the regression fit is provided inFigure 1. This example shows Listener L1’sunaided loudness growth function using datafrom the six highest sensation levels.Regression fits were judged to be good asindicated by the high R2 values for both 500and 2000 Hz. The R2 values for the majorityof the regression fits across listeners werehigher than 0.90. The slopes of these functionswere obtained and then line-lengthmagnitude estimates were used to correctthe slopes in an effort to control for judgmentbias (Zwislocki, 1983; Collins and Gescheider,1989; Hellman and Meiselman, 1993).Specifically, the corrected slope (θ) of eachlistener’s loudness growth function wascalculated by dividing the slope of eachlistener’s loudness growth function by theslope of that listener’s line-length function.
212
Journal of the American Academy of Audiology/Volume 18, Number 3, 2007
PPrrooffiillee ooff AAiiddeedd LLoouuddnneessss
The PAL is comprised of two rating scales(Table 4). The loudness scale has eight levels,ranging from 0 (“do not hear”) to 7(“uncomfortably loud”). On this scale, targetsfor soft, average, and loud sounds are definedas 2, 4, and 6, respectively. These targets arerecommended as a reference when thehearing aid needs to be clinically adjusted tooptimize loudness perception. The satisfactionscale of the PAL has five levels, ranging from5 (“just right”) to 1 (“not good at all”).
Both groups of listeners were given thePAL questionnaire. Listeners with normalhearing were asked to complete the loudnessrating scale only. Listeners with hearingimpairment were instructed to evaluate the
questions in the aided condition only, becausethey had been consistently usingamplification in everyday listening. Alllisteners were advised to skip any questionspecifying an unfamiliar environmentalsound. As a result, three listeners withhearing loss skipped one question in theirresponses. The PAL questionnaires werescored according to the questionnaire manual(Palmer et al, 1999).
RESULTS
Loudness Growth Functions
The slopes of listeners’ aided and unaidedcorrected loudness growth functions areshown in Table 5. For most listeners withhearing impairment, corrected unaidedloudness growth functions were steeper thanthe average functions observed for listenerswith normal hearing. Corrected aidedloudness growth functions were generallyshallower than unaided functions. In the 500Hz condition, the decrease in the mean slopefrom 1.081, unaided, to 0.773, aided, was notsignificant (t11 = 1.557, p = 0.148). In the2000 Hz condition, the decrease in the slopefrom 0.943, unaided, to 0.632, aided, wasalso not significant (t11 = 2.509, p = 0.064). Asexpected, WDRC tended to decrease the slopeof the aided loudness growth functions.
Interestingly, all but two listeners (L1and L9) had shallower aided loudness growthfunctions than the average normal-hearinglisteners’ function for 2000 Hz. Shallowerfunctions suggest that the hearing aids were“overcompressing” the listeners’ loudnessgrowth. The opposite was observed in the500 Hz condition, where half of the listeners’aided loudness growth functions were stillsteeper than the normal average. This findingimplies that the hearing aids were“undercompressing” for low frequencies.
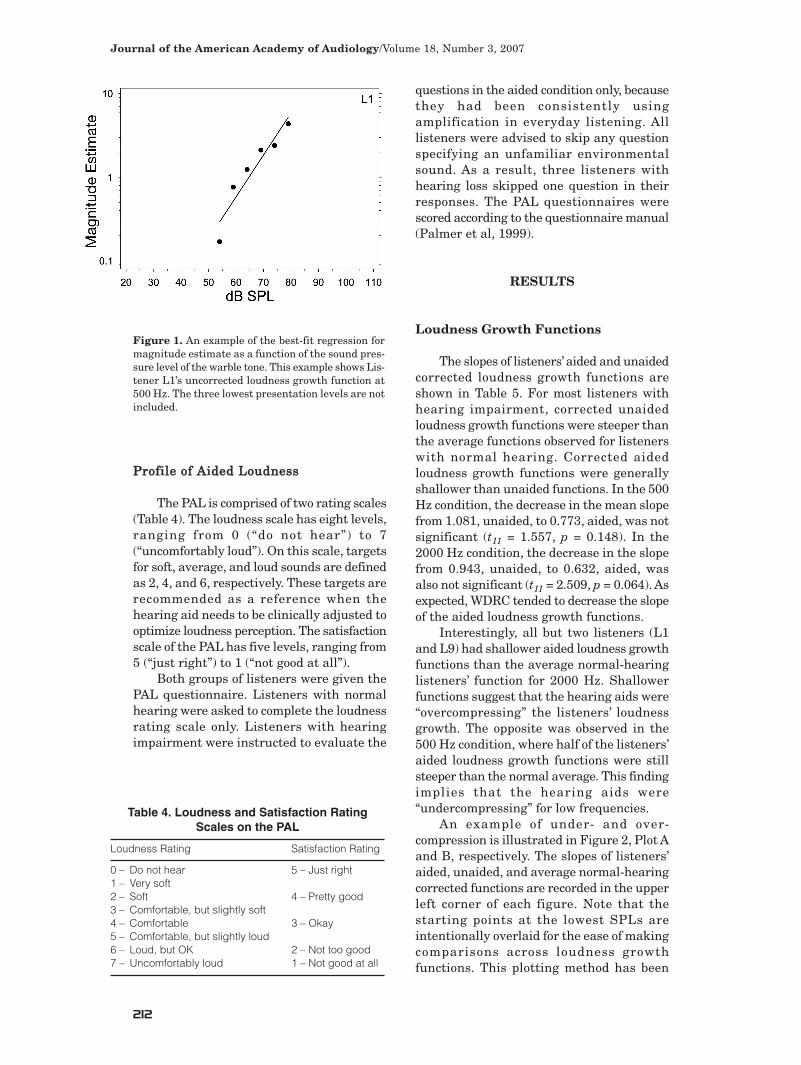
An example of under- and over-compression is illustrated in Figure 2, Plot Aand B, respectively. The slopes of listeners’aided, unaided, and average normal-hearingcorrected functions are recorded in the upperleft corner of each figure. Note that thestarting points at the lowest SPLs areintentionally overlaid for the ease of makingcomparisons across loudness growthfunctions. This plotting method has been
Figure 1. An example of the best-fit regression formagnitude estimate as a function of the sound pres-sure level of the warble tone. This example shows Lis-tener L1’s uncorrected loudness growth function at500 Hz. The three lowest presentation levels are notincluded.
Table 4. Loudness and Satisfaction RatingScales on the PAL
Loudness Rating Satisfaction Rating
0 – Do not hear 5 – Just right1 – Very soft2 – Soft 4 – Pretty good3 – Comfortable, but slightly soft4 – Comfortable 3 – Okay5 – Comfortable, but slightly loud6 – Loud, but OK 2 – Not too good7 – Uncomfortably loud 1 – Not good at all

Aided Loudness Growth and Loudness Satisfaction/Shi et al
213
used in other loudness studies and is thereason why no specific SPL is labeled on thex-axis (Collins and Gescheider, 1989; Hellmanand Meiselman, 1990; Hellman, 1999). InPlot A, the listener’s aided loudness growthfunction (θA = 1.466) was less steep than hisor her unaided function (θU = 2.176) but still steeper than the normal average function (θNH = 0.633), which illustratesundercompression. In Plot B, the listener’saided function (θA = 0.365) was less steepthan both his or her unaided function (θU = 0.856) and the normal average function (θNH = 0.720), which illustratesovercompression.
Profile of Aided Loudness
Results from the normal-hearinglisteners’ performance on the PAL loudness
rating scale were averaged for soft, average,and loud categories. These average ratingswere 2.139 (SD = 1.098), 3.861 (SD = 1.076),and 5.806 (SD = 0.597), accordingly. Thesevalues were very close to the targets (soft: 2;average: 4; loud: 6) recommended by Palmeret al (1999).
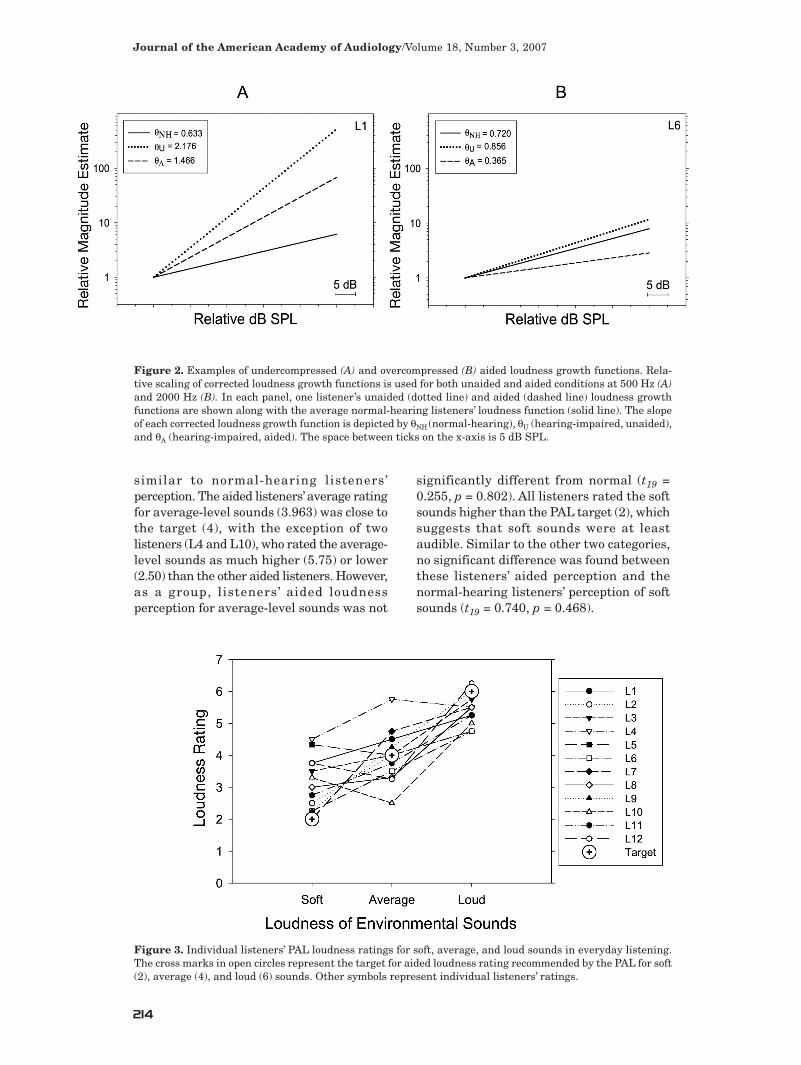
Subjective loudness ratings from the PALfor listeners wearing WDRC hearing aidsare shown in Figure 3. The recommendedPAL targets are shown as cross marks inopen circles. The four environmental soundsfor each category of loudness (soft, average,loud) were averaged for each listener.Listeners’ average ratings for loud soundsranged from 4.75 to 6.25, close to the PALtarget (6). The aided listeners’ average rating(5.345) was not significantly different from thenormal-hearing average (t19 = -0.109, p =0.914), indicating that these listeners’ aidedloudness perception of loud sounds was
Table 5. Uncorrected and Corrected Slopes for Unaided, Aided, and Average Normal-HearingListeners’ Loudness Growth Functions at 500 and 2000 Hz
Listener Frequency Uncorrected Slope of Line Length Corrected Slope of Loudness Function Slope Loudness Function
Unaided Aided Unaided Aided
L1 500 Hz 1.721 1.160 0.791 2.176 1.4662000 Hz 1.313 1.190 1.660 1.504
L2 500 Hz 1.048 0.954 0.933 1.123 1.0232000 Hz 0.990 0.461 1.061 0.494
L3 500 Hz 0.447 0.519 0.713 0.627 0.7282000 Hz 0.539 0.102 0.756 0.143
L4 500 Hz 0.675 0.656 0.940 0.718 0.6982000 Hz 1.116 0.538 1.187 0.572
L5 500 Hz 1.491 0.455 0.438 3.404 1.0392000 Hz 0.856 0.260 1.954 0.594
L6 500 Hz 0.740 0.535 0.840 0.881 0.6372000 Hz 0.719 0.307 0.856 0.365
L7 500 Hz 0.393 0.345 0.756 0.520 0.4562000 Hz 0.278 0.375 0.368 0.496
L8 500 Hz 0.754 0.463 1.051 0.717 0.4402000 Hz 0.854 0.672 0.813 0.639
L9 500 Hz 0.663 0.687 0.551 1.203 1.2472000 Hz 0.360 0.814 0.653 1.477
L10 500 Hz 0.433 0.386 0.853 0.508 0.4532000 Hz 0.399 0.256 0.468 0.300
L11 500 Hz 0.413 0.305 0.840 0.492 0.3632000 Hz 0.454 0.389 0.540 0.463
L12 500 Hz 0.516 0.622 0.850 0.607 0.7322000 Hz 0.850 0.458 1.000 0.539
Mean NH 500 Hz 0.447 0.706 0.6332000 Hz 0.508 0.720
Journal of the American Academy of Audiology/Volume 18, Number 3, 2007
214
similar to normal-hearing listeners’perception. The aided listeners’ average ratingfor average-level sounds (3.963) was close tothe target (4), with the exception of twolisteners (L4 and L10), who rated the average-level sounds as much higher (5.75) or lower(2.50) than the other aided listeners. However,as a group, listeners’ aided loudnessperception for average-level sounds was not
significantly different from normal (t19 =0.255, p = 0.802). All listeners rated the softsounds higher than the PAL target (2), whichsuggests that soft sounds were at leastaudible. Similar to the other two categories,no significant difference was found betweenthese listeners’ aided perception and thenormal-hearing listeners’ perception of softsounds (t19 = 0.740, p = 0.468).
Figure 2. Examples of undercompressed (A) and overcompressed (B) aided loudness growth functions. Rela-tive scaling of corrected loudness growth functions is used for both unaided and aided conditions at 500 Hz (A)and 2000 Hz (B). In each panel, one listener’s unaided (dotted line) and aided (dashed line) loudness growthfunctions are shown along with the average normal-hearing listeners’ loudness function (solid line). The slopeof each corrected loudness growth function is depicted by θNH (normal-hearing), θU (hearing-impaired, unaided),and θA (hearing-impaired, aided). The space between ticks on the x-axis is 5 dB SPL.
Figure 3. Individual listeners’ PAL loudness ratings for soft, average, and loud sounds in everyday listening.The cross marks in open circles represent the target for aided loudness rating recommended by the PAL for soft(2), average (4), and loud (6) sounds. Other symbols represent individual listeners’ ratings.
Aided Loudness Growth and Loudness Satisfaction/Shi et al
215
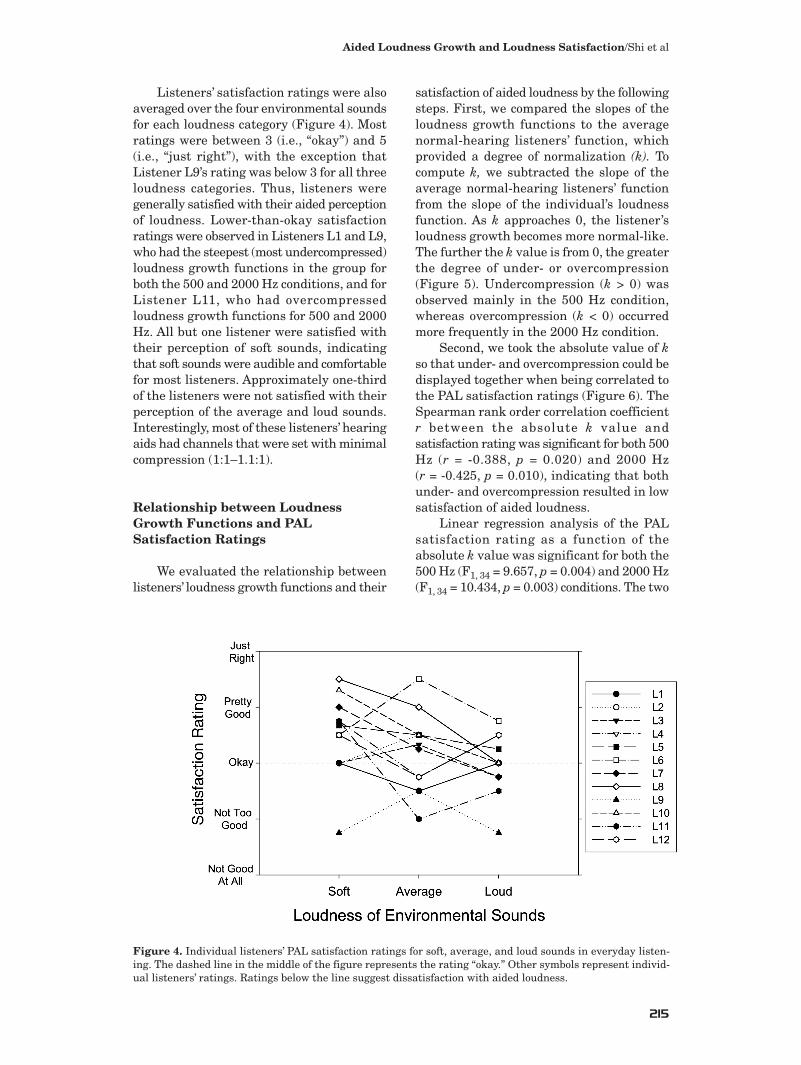
Listeners’ satisfaction ratings were alsoaveraged over the four environmental soundsfor each loudness category (Figure 4). Mostratings were between 3 (i.e., “okay”) and 5(i.e., “just right”), with the exception thatListener L9’s rating was below 3 for all threeloudness categories. Thus, listeners weregenerally satisfied with their aided perceptionof loudness. Lower-than-okay satisfactionratings were observed in Listeners L1 and L9,who had the steepest (most undercompressed)loudness growth functions in the group forboth the 500 and 2000 Hz conditions, and forListener L11, who had overcompressedloudness growth functions for 500 and 2000Hz. All but one listener were satisfied withtheir perception of soft sounds, indicatingthat soft sounds were audible and comfortablefor most listeners. Approximately one-thirdof the listeners were not satisfied with theirperception of the average and loud sounds.Interestingly, most of these listeners’ hearingaids had channels that were set with minimalcompression (1:1–1.1:1).
Relationship between LoudnessGrowth Functions and PALSatisfaction Ratings
We evaluated the relationship betweenlisteners’ loudness growth functions and their
satisfaction of aided loudness by the followingsteps. First, we compared the slopes of theloudness growth functions to the averagenormal-hearing listeners’ function, whichprovided a degree of normalization (k). Tocompute k, we subtracted the slope of theaverage normal-hearing listeners’ functionfrom the slope of the individual’s loudnessfunction. As k approaches 0, the listener’sloudness growth becomes more normal-like.The further the k value is from 0, the greaterthe degree of under- or overcompression(Figure 5). Undercompression (k > 0) wasobserved mainly in the 500 Hz condition,whereas overcompression (k < 0) occurredmore frequently in the 2000 Hz condition.
Second, we took the absolute value of kso that under- and overcompression could bedisplayed together when being correlated tothe PAL satisfaction ratings (Figure 6). TheSpearman rank order correlation coefficientr between the absolute k value andsatisfaction rating was significant for both 500Hz (r = -0.388, p = 0.020) and 2000 Hz (r = -0.425, p = 0.010), indicating that bothunder- and overcompression resulted in lowsatisfaction of aided loudness.
Linear regression analysis of the PALsatisfaction rating as a function of theabsolute k value was significant for both the500 Hz (F1, 34 = 9.657, p = 0.004) and 2000 Hz(F1, 34 = 10.434, p = 0.003) conditions. The two
Figure 4. Individual listeners’ PAL satisfaction ratings for soft, average, and loud sounds in everyday listen-ing. The dashed line in the middle of the figure represents the rating “okay.” Other symbols represent individ-ual listeners’ ratings. Ratings below the line suggest dissatisfaction with aided loudness.

regression lines had similar slopes, that is, -1.328 and -1.390 for the 500 and 2000 Hzconditions, respectively. These negative slopesindicate that, regardless of under- orovercompression, listeners’ aided loudnesssatisfaction decreased as their loudnessgrowth became less similar to the normalloudness growth (k = 0).
DISCUSSION
An AME task, corrected for judgment biasby magnitude estimates of line lengths,
was used to measure loudness growthfunctions for listeners with normal andimpaired hearing. For the latter group oflisteners, loudness growth was tested withand without WDRC hearing aids. Normal-hearing listeners’ corrected loudness growthfunctions were similar to those previouslypublished (Collins and Gescheider, 1989;Hellman and Meiselman, 1990, 1993;Hellman, 1999). Specifically, Hellman andMeiselman (1990) reported the slope fornormal-hearing listeners’ loudness growthfunctions in the range of 0.40–0.70 with amean of 0.60 for tone bursts between 500
and 4000 Hz. These values are comparableto the slopes reported for normal-hearinglisteners in the present study, which were0.633 and 0.720 for the 500 and 2000 Hzwarble tone, respectively. The consistencybetween the studies validates the methodthat was used in the present study to obtainloudness growth functions.
Loudness growth functions for ourlisteners with impaired hearing were alsoconsistent with those previously reported forlisteners with a similar degree of hearingloss (Hellman and Meiselman, 1990, 1993;Hellman, 1999). In addition, two listenerswith hearing impairment (L3 and L4) hadnormal hearing thresholds at 500 Hz, andtheir loudness growth functions for 500 Hzwere similar to the average normal-hearinglisteners’ function. A similar finding wasreported by Hellman and Meiselman (1993).However, Listener L9, who also had normallow-frequency hearing, had a steep loudnessgrowth for 500 Hz. It is not clear why thislistener had abnormal loudness growth withnormal hearing in this frequency region.
As predicted, the WDRC hearing aidsmade listeners’ aided loudness growthfunctions shallower than their unaided
Journal of the American Academy of Audiology/Volume 18, Number 3, 2007
216
Figure 5. Degree of normalization (k) for 500 (filledcircles) and 2000 Hz (open circles) in the AME task.The k value is derived from subtracting the normalaverage from the slope of each listener’s aided loud-ness growth function. The dashed line in the middleof the figure represents perfect normalization (k = 0).Circles higher and lower than the line suggest under-compression (k > 0) and overcompression (k < 0),respectively.
Figure 6. Correlation between the absolute valuesof degree of normalization (k) at 500 Hz (filled cir-cles) and 2000 Hz (open circles) obtained in the AMEtask and listeners’ satisfaction ratings on the PAL.The solid and dash lines represent the linear regres-sion obtained for 500 and 2000 Hz, respectively.

Aided Loudness Growth and Loudness Satisfaction/Shi et al
217
functions. However, the relationship amonghearing thresholds, compression settings,and changes in the slope of loudness growthfunctions between the aided and unaidedlistening conditions was not alwaysstraightforward. For example, one listener(L8) with the greatest degree of hearing lossat 500 Hz had an unaided loudness growthfunction close to normal (θU = 0.717). His orher hearing aids were set at a compressionratio of 1.7:1, which resulted in anovercompressed aided loudness growthfunction (θA = 0.440). Another listener (L5)with similar severity of hearing loss at 500Hz had a much steeper unaided loudnessgrowth function (θU = 3.404) than normal. Hisor her hearing aids were set at a compressionratio of 3:1 but still resulted in anundercompressed aided loudness growthfunction (θA = 1.039). Although in both cases,compression tended to normalize listeners’loudness growth, the amount of normalizationwas unpredictable. Future studies shouldinvestigate aided loudness growth bysystematically changing the hearing aidcompression parameters.
Another factor that may have influencedthe interpretation of the results is effectivecompression ratio, which is computed fromreal-ear gain measures and may not beequivalent to prescribed compression ratio.In this study, the effective compression ratioswere only slightly different from theprescribed compression ratios for most of thelisteners. Taking into account the listenerswho had greater differences between effectiveand prescribed compression ratios did notchange the weak relationship observedbetween the slope of the loudness growthfunctions and compression ratio settings.
An important issue to remember wheninterpreting the data from the present studyis that the listeners were tested with theirhearing aids at their user settings. It ispossible that some of the hearing aids testedin this study were not fitted and/or adjustedappropriately, especially in light of theloudness-normalization results. For example,a listener with a 55 dB HL hearing loss at2000 Hz (L3) had an unaided loudness growthfunction similar to that of a normal-hearinglistener, suggesting that this person mightneed little or minimal compression fromhearing aids to improve loudness perception.And in fact, this listener had an aided growthfunction much shallower than normal when
listening through his or her hearing aids setat a compression ratio of approximately 1.5:1.Thus, the compression for this aid was likelyprescribed based on “average data” for his orher degree of hearing loss but was not theoptimal fit for this individual listener.
Results from the PAL satisfaction ratingscale showed that only a few listeners weredissatisfied with their perception of aidedloudness. Listener L9 had the lowestsatisfaction rating on the PAL, and,interestingly, this listener had an aidedloudness growth that was very steepcompared to most listeners for both the 500Hz (θA = 1.247) and 2000 Hz (θA = 1.477)conditions. The low satisfaction rating maybe due to the fact that this listener had asevere hearing loss at 2000 Hz, but his or herhearing aid compression ratio for thisfrequency channel was minimal (1.1:1).Greater compression might have helpedimprove this listener ’s degree of aidedloudness satisfaction.
Nonetheless, most listeners were happywith their perception of aided loudness,despite their under- or overcompressedloudness growth functions. There are severalpossible reasons why abnormal loudnessgrowth functions were not strongly reflectedby the PAL scores. First, we obtained loudnessgrowth functions for only two frequencies,whereas the PAL includes environmentalsounds of a broad frequency spectrum. Thispoint is particularly relevant for users ofmultichannel compression aids, becauseloudness growth functions obtained for twofrequencies may not adequately characterizea listener’s overall loudness perception.Second, the AME task uses an absolutescaling technique, whereas the PAL is basedon two categorical scales. A large degree ofintersubject variability exists in categoricalscaling measures for listeners with normaland impaired hearing (Elberling, 1999), dueto the number of finite points between theendpoints (Allen et al, 1990; Hellman, 1999)and the intensity range of the signal (Wardet al, 1996). Although categorical scales havelimitations, there is currently no alternativeto use for an outcome measure. To develop anabsolute scaling outcome measure forloudness would be interesting but is beyondthe scope of the current paper. Last, thesignal was more controlled in the AME taskthan in the real world. For example, in theAME task, signals lasted long enough to fully
activate WDRC, whereas in the real world,signal length would be more variable. Thatis, some sounds (e.g., slamming the door)may not be long enough to fully activateand/or deactivate some compression systems.
Despite listeners’ generally “okay” overallsatisfaction, a relationship was observedbetween PAL satisfaction ratings and aidedloudness growth functions. Specifically,listeners were more satisfied when theirloudness growth functions were more normal-like than under- or overcompressed. Thecorrelation between the loudness growthfunctions and the PAL satisfaction ratingssuggests that a more normal-like loudnessgrowth may improve a listener’s satisfactionwith aided loudness. Also, on the satisfactionscale, the option “just right” (the highestrating) was selected only 15% of the timeacross listeners, suggesting that listeners’loudness perception was less than ideal inmost real-world listening situations. Thus, itmay be worthwhile for clinicians to considermaximizing loudness normalization for anindividual listener by using such proceduresas the Loudness Growth in 1/2-Octave Band(LGOB; Allen et al, 1990) and VisualInput/Output Locator Algorithm (VIOLA;Valente and Van Vliet, 1997), which areavailable for clinical use. These strategiesmay be most helpful for listeners who havelow aided loudness satisfaction, such asListener L9 in the present study. On theother hand, some of the listeners, whoseaided loudness growth functions were quitedifferent from normal, reported “okay” formost listening scenarios on the PALsatisfaction scale. Although it would be bestto obtain “just right” answers, “okay” at leastsuggests that the listeners are not dissatisfiedwith aided loudness.
In summary, a modified AME task andthe PAL questionnaire were used to assess therelationship between aided loudness growthfunctions and aided loudness satisfaction.The loudness growth functions obtained withAME for listeners with normal and impairedhearing were consistent with those previouslyreported for these two populations. Asexpected, the WDRC hearing aids reduced thesteepness of most listeners’ unaided loudnessgrowth functions. Results from the PALshowed that listeners’ aided loudnesssatisfaction decreased as their loudnessgrowth functions became less like those of theaverage normal-hearing listeners.
Nonetheless, listeners’ overall satisfactionwith their perception of aided loudness was“okay,” regardless of whether or not theirhearing aids caused under- orovercompression.
Acknowledgments. The authors would like to thankDr. Catherine Palmer for the normative data for theProfile of Aided Loudness; Dr. Kathy Vander Werffand Lauren Calandruccio for their comments on anearly version of this paper; and Nicole Sanpetrinoand Lorraine Pawson for providing the slides for theline-length measures.
REFERENCES
Allen JB, Hall JL, Jeng PS. (1990) Loudness growthin 1/2-octave bands (LGOB)—a procedure for theassessment of loudness. J Acoust Soc Am 88:745–753.
American National Standards Institute. (1989)American National Standards Specifications forAudiometers (ANSI-S3.6-1989). New York: AmericanNational Standards Institute.
Byrne D. (1996) Hearing aid selection for the 1990s:where to? J Am Acad Audiol 7:377–395.
Collins AA, Gescheider GA. (1989) The measurementof loudness in individual children and adults byabsolute magnitude estimation and cross-modalitymatching. J Acoust Soc Am 85:2012–2021.
Cornelisse LE, Seewald RC, Jamieson DG. (1995) Theinput/output formula: a theoretical approach to thefitting of personal amplification devices. J Acoust SocAm 97:1854–1864.
Cox RM, Alexander GC. (1995) The AbbreviatedProfile of Hearing Aid Benefit (APHAB). Ear Hear16:176–186.
Dillon H. (1996) Compression? yes, but for low or highfrequencies, for low or high intensities, and with whatresponse times? Ear Hear 17:287–307.
Elberling C. (1999) Loud scaling revisited. J Am AcadAudiol 10:248–260.
Etymonic Design Incorporated. (2005) AudioscanVerifit® VF-1 Real-Ear Hearing Aid Analyzer User’sGuide (Version 2.5). Dorchester, Ontario: EtymonicDesign Incorporated.
Fowler EP. (1936) A method for the early detection ofotosclerosis. Arch Otolaryngol 24:731–741.
Hellman RP. (1994) Relation between the growth ofloudness and high-frequency excitation. J Acoust SocAm 96:2655–2663.
Hellman RP. (1999) Cross-modality matching: a toolfor measuring loudness in sensorineural impairment.Ear Hear 20:193–213.
Hellman RP, Meiselman CH. (1990) Loudness rela-tions for individuals and groups in normal andimpaired hearing. J Acoust Soc Am 88:2596–2606.
Journal of the American Academy of Audiology/Volume 18, Number 3, 2007
218

Aided Loudness Growth and Loudness Satisfaction/Shi et al
219
Hellman RP, Meiselman CH. (1993) Rate of loudnessgrowth for pure tones in normal and impaired hear-ing. J Acoust Soc Am 93:966–975.
Hellman RP, Miskiewicz M, Scharf B. (1997) Loudnessadaptation and excitation patterns: effects of fre-quency and level. J Acoust Soc Am 101:2176–2185.
Hellman RP, Zwislocki JJ. (1968) Loudness determi-nation at low sound frequencies. J Acoust Soc Am43:60–64.
Jenstad LM, Pumford J, Seewald RC, Cornelisse LE.(2000) Comparison of linear gain and wide dynamicrange compression hearing aid circuits II: aided loud-ness measures. Ear Hear 21:32–44.
Killion MC, Fikret-Pasa S. (1993) The 3 types of sen-sorineural hearing loss. Loudness and intelligibilityconsideration. Hear J 46(11):31–36.
Kuk F. (1996) Theoretical and practical considera-tions in compression hearing aids. Trends Amplif1:5–38.
Margolis R. (1985) Magnitude estimation of loudnessIII: performance of selected hearing aid users. JSpeech Hear Res 28:411–420.
Moore BCJ. (2004) Testing the concept of softnessimperception: loudness near threshold for hearing-impaired ears. J Acoust Soc Am 115:3103–3111.
Moore BCJ, Glasberg BR. (1997) A model of loudnessperception applied to cochlear hearing loss. AudNeurosci 3:289–311.
Moore BCJ, Lynch C, Stone MA. (1992) Effects of thefitting parameters of a two-channel compressionsystem on the intelligibility of speech in quiet and innoise. Br J Audiol 26:369–379.
Neely ST, Allen JB. (1997) Relationship between therate of growth of loudness and the intensity DL. In:Jesteadt W, ed. Modeling Sensorineural Hearing Loss.Mahwah, NJ: Erlbaum.
Neuman AC, Bakke MH, Hellman S, Levitt H. (1994)The effect of compression ratio in a slow-acting com-pression hearing aid: paired comparison judgmentsof quality. J Acoust Soc Am 96:1471–1478.
Oxenham AJ, Bacon SP. (2003) Cochlear compres-sion: perceptual measures and implications for normaland impaired hearing. Ear Hear 24:352–366.
Palmer CV, Mueller HG, Moriarty M. (1999) Profileof Aided Loudness: a validation procedure. Hear J52(6):34, 36, 42.
Plomp R. (1994) Noise, amplification, and compres-sion: considerations of three main issues in hearingaid design. Ear Hear 15:2–12.
Ricketts TA. (1996) Fitting hearing aids to individ-ual loudness perception measures. Ear Hear17:124–132.
Scharf B. (1978) Loudness. In: Carterette EC,Friedman MP, eds. Handbook of Perception, Vol. IV.New York: Academic.
Valente M, Van Vliet D. (1997) The independent hear-ing aid fitting forum (IHAFF) protocol. Trends Amplif2:6–35.
Van Tasell DJ, Trine TD. (1996) Effects of single-bandsyllabic amplitude compression on temporal speechinformation in nonsense syllables and in sentences.J Speech Hear Res 39:912–922.
Verschuure J, Maas AJ, Stikvoort E, de Jong RM,Goedegebure A, Dreschler WA. (1996) Compressionand its effect on the speech signal. Ear Hear17:162–175.
Ward LM, Armstrong J, Golestani N. (1996) Intensityresolution and subjective magnitude in psychophys-ical scaling. Percept Psychophys 58:793–801.
Zwislocki JJ. (1965) Analysis of some auditory char-acteristics. In: Luce RD, Bush RR, Galanter E, eds.Handbook of Mathematical Psychology. New York:Wiley.
Zwislocki JJ. (1983) Group and individual relationsbetween sensation magnitudes and their numericalestimates. Percept Psychophys 33:460–468.
Zwislocki JJ, Goodman DA. (1980) Absolute scalingof sensory magnitudes: a validation. PerceptPsychophys 28:28–38.
´