sherri morrow- magyarits , act-540 technical note · secondary surveillance product team ... mpap...
TRANSCRIPT

tec
hnic
al n
ote
tech
n
Document is available to the publicthrough the National Technical InformationService, Springfield, Virginia 22161
U.S. Department of TransportationFederal Aviation Administration
William J. Hughes Technical CenterAtlantic City International Airport, NJ 08405
Sherri Morrow-Magyarits, ACT-540Richard Ozmore, ACT-540
December 1999
DOT/FAA/CT-TN99/24
Terminal Air Traffic Control Radarand Display System Recommendationsfor Monitoring SimultaneousInstrument Approaches

NOTICE
This document is disseminated under the sponsorshipof the U.S. Department of Transportation in the interest ofinformation exchange. The United States Governmentassumes no liability for the contents or use thereof.
The United States Government does not endorseproducts or manufacturers. Trade or manufacturers’names appear herein solely because they are consideredessential to the objective of this report.

Technical Report DocumentationPage
1. Report No.DOT/FAA/CT-TN99/24
2. Government Accession No. 3. Recipient’s Catalog No.
4. Title and Subtitle
Terminal Air Traffic Control Radar And Display System Recommendations ForMonitoring Simultaneous Instrument Approaches
5. Report DateDecember 1999
6. Performing Organization CodeACT-540
7. Author(s)
Sherri Morrow-Magyarits and Richard Ozmore, ACT-540
8. Performing Organization Report No.DOT/FAA/CT-TN99/24
9. Performing Organization Name and AddressDepartment of TransportationFederal Aviation AdministrationWilliam J. Hughes Technical CenterAtlantic City International Airport, NJ 08405
10. Work Unit No. (TRAIS)
11. Contract or Grant No.
12. Sponsoring Agency Name and AddressFederal Aviation AdministrationSecondary Surveillance Product Team800 Independence Ave., SWWashington, DC 20591
13. Type of Report and Period Covered
Technical Note
14. Sponsoring Agency CodeAND-450
15. Supplementary Notes
16. AbstractThe Multiple Parallel Approach Program (MPAP), under the auspices of the FAA Secondary Surveillance Integrated Product Team,AND-450, was developed to evaluate the feasibility of conducting simultaneous parallel approaches using both current and advancedradar and display system technology. The program focused primarily on the capacity-enhancing benefits of a Precision RunwayMonitor system with various airport configurations. MPAP conducted over 20 real-time, human-in-the-loop and fast-time modelingsimulations since 1988. The purpose of these simulations was to develop procedures for independent approaches to quadruple, triple,and closely spaced dual parallel runways in instrument meteorological conditions. This report provides a history of all MPAPsimulations conducted to date, including a description of the test criteria used to evaluate each test, the findings, and subsequentprocedural and equipment recommendations.
17. Key Words
parallel runways, independent approaches, Precision Runway Monitor,Final Monitor Aid
18. Distribution Statement
This document is available to the public throughthe National Technical Information Service,Springfield, Virginia, 22161
19. Security Classif. (of this report)Unclassified
20. Security Classif. (of this page)Unclassified
21. No. of Pages30
22. Price
Form DOT F 1700.7 (8-72) Reproduction of completed page authorized
iii
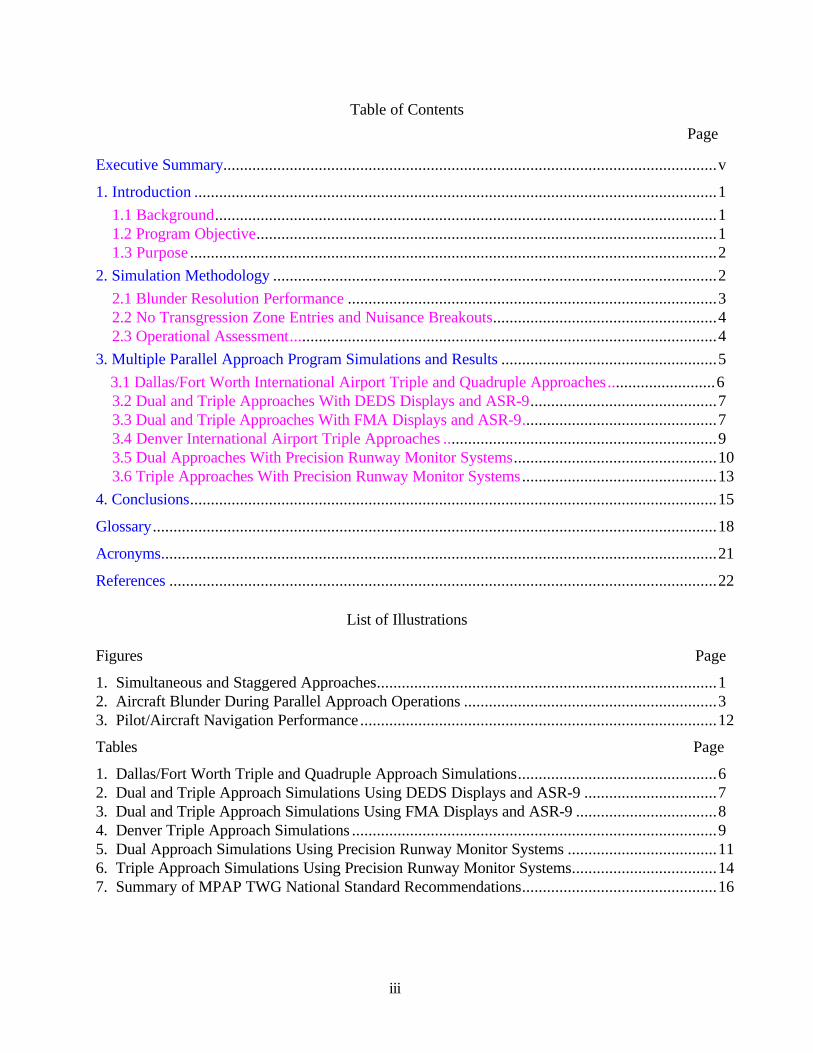
Table of Contents
Page
Executive Summary.......................................................................................................................v
1. Introduction ..............................................................................................................................1
1.1 Background.........................................................................................................................11.2 Program Objective...............................................................................................................11.3 Purpose ...............................................................................................................................2
2. Simulation Methodology ...........................................................................................................2
2.1 Blunder Resolution Performance .........................................................................................32.2 No Transgression Zone Entries and Nuisance Breakouts......................................................42.3 Operational Assessment.......................................................................................................4
3. Multiple Parallel Approach Program Simulations and Results ....................................................5
3.1 Dallas/Fort Worth International Airport Triple and Quadruple Approaches..........................63.2 Dual and Triple Approaches With DEDS Displays and ASR-9.............................................73.3 Dual and Triple Approaches With FMA Displays and ASR-9...............................................73.4 Denver International Airport Triple Approaches ..................................................................93.5 Dual Approaches With Precision Runway Monitor Systems.................................................103.6 Triple Approaches With Precision Runway Monitor Systems...............................................13
4. Conclusions...............................................................................................................................15
Glossary........................................................................................................................................18
Acronyms......................................................................................................................................21
References ....................................................................................................................................22
List of Illustrations
Figures Page
1. Simultaneous and Staggered Approaches..................................................................................12. Aircraft Blunder During Parallel Approach Operations .............................................................33. Pilot/Aircraft Navigation Performance ......................................................................................12
Tables Page
1. Dallas/Fort Worth Triple and Quadruple Approach Simulations................................................62. Dual and Triple Approach Simulations Using DEDS Displays and ASR-9 ................................73. Dual and Triple Approach Simulations Using FMA Displays and ASR-9 ..................................84. Denver Triple Approach Simulations ........................................................................................95. Dual Approach Simulations Using Precision Runway Monitor Systems ....................................116. Triple Approach Simulations Using Precision Runway Monitor Systems...................................147. Summary of MPAP TWG National Standard Recommendations...............................................16

iv
v
Executive Summary
The Multiple Parallel Approach Program (MPAP) conducted over 20 real-time, human-in-the-loop simulations since 1988 to evaluate proposed simultaneous operations to closely spacedparallel runways. The program established the MPAP Technical Working Group (TWG) toevaluate multiple parallel approaches in an effort to safely increase airport capacity. The MPAPTWG, with the support of Federal Aviation Administration William J. Hughes Technical Centerpersonnel and contractors, conducted simulations of dual, triple, and quadruple parallel runwayconfigurations. These simulations addressed issues at specific airports and established nationalstandards for simultaneous approach operations.
The MPAP Team simulated various approach configurations using both current and new radarand display system technology. These systems included the Airport Surveillance Radar (ASR)-9,back-to-back Mode S, and Electronic Scanning Radar (E-Scan) systems, with their respectiveupdate rate capabilities. Simulated display systems included Fully Digital Alphanumeric DisplaySystem (FDADS) displays, Digital Entry Display Subsystem (DEDS) displays, and Final MonitorAid (FMA) displays.
The team observed benefits and limitations of display and radar combinations with various parallelrunway spacings in the simulations. Objective analyses of controller and aircrew performancemeasures provided reliable information about system performance with each simulationconfiguration. Based upon safety and capacity-related test criteria, the MPAP TWGrecommended which proposed simultaneous approach procedures should be approved for theoperational environment.
This paper summarizes the results of MPAP real-time simulation evaluations concerningsimultaneous Instrument Landing System approaches to multiple parallel runways. It explains testcriteria used in the evaluation of the real-time simulations and provides brief synopses of eachMPAP simulation. In addition, it provides TWG recommendations for national standards andsite-specific procedures. A summary of MPAP TWG radar and display system national standardrecommendations for simultaneous approach operations is provided below.
a. For straight-in approaches to dual parallel runways spaced by
1. at least 5000 ft, FDADS and/or DEDS displays and ASR-9 radar with a 4.8-secondupdate rate are recommended,
2. less than 5000 ft and greater than or equal to 4300 ft, FMA displays and ASR-9 radarwith a 4.8-second update rate are recommended,
3. less than 4300 ft and greater than or equal to 3400 ft, FMA displays and a highupdate radar with faster than or equal to a 1.0-second update rate (i.e., PrecisionRunway Monitor (PRM) System) are recommended.
vi
b. For offset approaches to dual parallel runways spaced by
1. less than 3400 ft and greater than or equal to 3000 ft with no less than a 2.5-degreelocalizer offset and no greater than a 3-degree offset, FMA displays and a highupdate radar with faster than or equal to a 1.0-second update rate (i.e., PRM System)are recommended,
c. For straight-in approaches to triple parallel runways spaced by
1. at least 5000 ft with an airport field elevation of less than 1000 ft, FDADS and/orDEDS displays and ASR-9 radar with a 4.8-second update rate are recommended, and
2. less than 5000 ft and greater than or equal to 4300 ft with an airport field elevationof less than 1000 ft, FMA displays and ASR-9 radar with a 4.8-second update rate arerecommended.

1
1. Introduction
1.1 Background
In 1988, the Multiple Parallel Approach Program (MPAP) was initiated to investigate capacity-enhancing procedures for simultaneous Instrument Landing System (ILS) approaches to parallelrunways. The program established the MPAP Technical Work Group (TWG) to unite variousareas of expertise for the evaluation of multiple parallel approaches in an effort to increase airportcapacity in a safe and acceptable manner. Federal Aviation Administration (FAA) representativesfrom the Secondary Surveillance Product Team, Office of System Capacity, Flight StandardsService, Air Traffic Operations, Air Traffic Plans and Requirements, and various regional officescomposed the MPAP TWG.
The MPAP TWG, with the support of Federal Aviation Administration William J. HughesTechnical Center personnel and contractors, comprised a team who conducted a series of real-time simulations. These simulations evaluated air traffic control (ATC) system performance withproposed simultaneous parallel approach operations for specific airports and for the developmentof national standards. Airport runway configurations tested included dual, triple, and quadrupleparallel runways at various spacings.
1.2 Program Objective
The main objective of the MPAP was to achieve capacity enhancements through the conduct ofsimultaneous approaches and in the process of doing so, maintain a specified, conservative targetlevel of safety. Simultaneous approaches can yield up to 40% more arrivals than staggeredapproaches at high traffic-density airports. Figure 1 illustrates the difference betweensimultaneous and staggered approaches.
Figure 1. Simultaneous and staggered approaches.
Simultaneous/Independent Approaches
Staggered/Dependent Approaches
4 NM
3 NM
1.5 NM

2
One principal task of the MPAP was to determine the minimum acceptable spacings betweenparallel runways as a function of equipment/technology alternatives. When two airplanes areapproaching parallel runways during instrument meteorological conditions, the controller needs toinsure that each aircraft stays on its assigned approach course. In the event that an aircraft straysfrom course, the controller needs to be able to detect and redirect the deviating aircraft and alsoany adjacent aircraft on the approach. This was one of the major concerns in developingsimultaneous parallel approach standards.
Extensive testing and analysis showed that runway spacing, however, is just one of several factorsthat can affect the safe execution of simultaneous parallel approaches. Radar and display systemsincluding processors and sensors are also important for maintaining aircraft separation in the eventof an aircraft deviation off course. The major features of radar and display systems important tosimultaneous parallel ILS approaches are surveillance delay (including update interval),surveillance system accuracy (combined sensor accuracy and display resolution), automation aids(alarms and display enhancements), and system capacity (Crane & Massimini, 1995).
The MPAP Team tested various parallel runway configurations using both current and new radarand display system technology. Simulated radar systems included the Airport Surveillance RadarModel #9 (ASR-9), back-to back Mode S, and Electronic Scanning Radar (E-Scan) systems, withtheir respective update rate capabilities. Display systems tested included Fully DigitalAlphanumeric Display System (FDADS) displays, Digital Entry Display Subsystem (DEDS)displays, and Final Monitor Aid (FMA) displays. The benefits and limitations of display and radarcombinations with various parallel runway spacings were observed in the real-time simulations.Based on predetermined test criteria, the MPAP TWG evaluated the results of the real-timesimulations and made recommendations to the FAA as to whether or not proposed parallelapproach procedures were feasible, as tested.
1.3 Purpose
The purpose of this paper is to summarize the findings and recommendations for eachsimultaneous parallel approach real-time simulation conducted by the MPAP Team. By doing so,the paper will demonstrate which combinations of runway spacings, radar, and display systems areand are not feasible, based on simulation results, for conducting simultaneous approaches toclosely spaced dual, triple, and quadruple parallel runway configurations.
2. Simulation Methodology
The development of the real-time simulation environment at the Technical Center has made thesimulation method of analysis one of the most advanced for evaluating ATC proceduresdevelopment. In MPAP simulations, full performance level ATC Specialists used operationalATC displays or display prototypes and issued commands to both computer-generated and flightsimulator-controlled aircraft targets flying simultaneous approaches. Current and/or qualifiedairline flight crews participated as subjects, flying several different types of flight simulator aircraftat various locations around the country. By incorporating flight simulators into the simulations,the MPAP Team collected actual flight crew and aircraft performance data.
3
The test criteria used by the MPAP to evaluate parallel runway simulations evolved over the yearssince the program’s inception. The following sections briefly describe the test criteria as theyexisted at the end of the program. For a more detailed explanation of the derivation of eachcriterion, see Ozmore and Morrow (1996). For information on earlier simulation test criteria, seethe simulation final test report for the specific procedure in question.
2.1 Blunder Resolution Performance
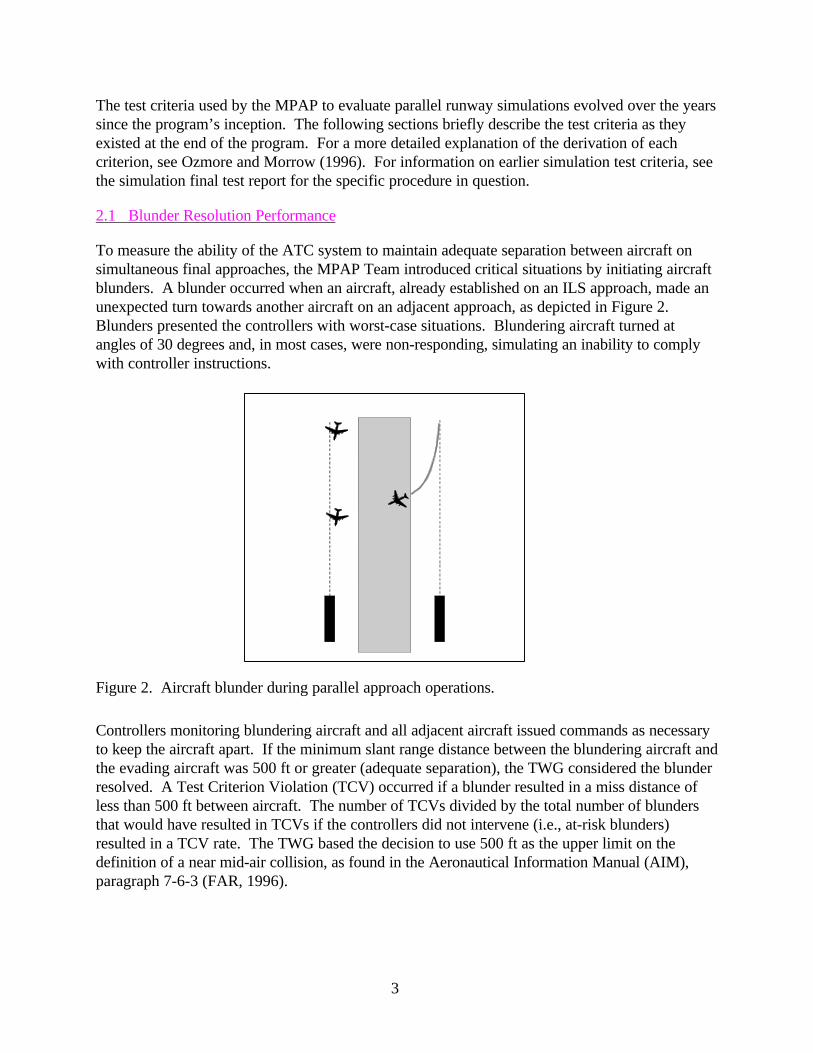
To measure the ability of the ATC system to maintain adequate separation between aircraft onsimultaneous final approaches, the MPAP Team introduced critical situations by initiating aircraftblunders. A blunder occurred when an aircraft, already established on an ILS approach, made anunexpected turn towards another aircraft on an adjacent approach, as depicted in Figure 2.Blunders presented the controllers with worst-case situations. Blundering aircraft turned atangles of 30 degrees and, in most cases, were non-responding, simulating an inability to complywith controller instructions.
Figure 2. Aircraft blunder during parallel approach operations.
Controllers monitoring blundering aircraft and all adjacent aircraft issued commands as necessaryto keep the aircraft apart. If the minimum slant range distance between the blundering aircraft andthe evading aircraft was 500 ft or greater (adequate separation), the TWG considered the blunderresolved. A Test Criterion Violation (TCV) occurred if a blunder resulted in a miss distance ofless than 500 ft between aircraft. The number of TCVs divided by the total number of blundersthat would have resulted in TCVs if the controllers did not intervene (i.e., at-risk blunders)resulted in a TCV rate. The TWG based the decision to use 500 ft as the upper limit on thedefinition of a near mid-air collision, as found in the Aeronautical Information Manual (AIM),paragraph 7-6-3 (FAR, 1996).

4
Members of the MPAP Team computed maximum acceptable TCV rates for each simulationbased on a target level of safety of no more than one fatal accident per 25 million approaches.The real-time TCV rate had to be equal to or below the maximum acceptable TCV rate to meetthe blunder resolution test criterion. To ensure a more accurate measurement of the operationalTCV rate, the team conducted a fast-time computer simulation or Monte Carlo simulation. TheMonte Carlo simulation used data collected in the real-time simulation to model over 100thousand at-risk blunders, thus reducing the range of the confidence interval to a very small size.The team compared the TCV rate estimate from the Monte Carlo simulation to the results of thereal-time simulation to ensure consistency. For a complete explanation of the risk analysis andmaximum acceptable TCV rate derivation, see the Precision Runway Monitor Demonstrationreport (Precision Runway Monitor Program Office, 1991), and for the latest revisions, seeMorrow and Ozmore (1996).
2.2 No Transgression Zone Entries and Nuisance Breakouts
The final approach airspace for independent approaches is divided into two areas betweenrunways, the Normal Operating Zone (NOZ) and the No Transgression Zone (NTZ). Aircraft arepermitted to fly in the NOZ. The NTZ is a 2000-ft wide area equidistant between final approachcourses where aircraft are not permitted to enter. If an aircraft enters the NTZ, regulationsrequire the monitor controller to break that aircraft and any adjacent aircraft out of the approach.Because the NTZ is fixed at 2000 ft, the NOZ varies with runway separation. As separationbetween runways decreases, the NOZ decreases, providing less airspace for aircraft to fly alongthe ILS and a greater opportunity for aircraft to enter the NTZ.
As runways become more closely spaced, Total Navigation System Error (TNSE) becomes aconcern. TNSE represents the difference between the actual flight path of an aircraft and itsintended flight path. TNSE can be caused by flight technical error, avionics error, ILS signalerror, and/or weather. TNSE may contribute to the occurrence of NTZ entries and nuisancebreakouts (NBOs). In the MPAP simulations, an NTZ entry occurred when an aircraft enteredthe NTZ for reasons other than a blunder or breakout. An NBO occurred when an aircraft wasbroken out of its final approach course for reasons other than a blunder, loss of longitudinalseparation, or lost beacon signal (i.e., aircraft target went into coast).
If an excessive number of NTZ entries and/or NBOs occurred in an MPAP simulation, a highcommunications workload on the controller resulted and capacity was reduced because of aircraftbeing broken out. The MPAP TWG evaluated the frequency of NTZ entry and NBO occurrencesand the resultant impact on controller communications workload for each simulation anddetermined whether or not the rates were acceptable.
2.3 Operational Assessment
The MPAP TWG also drew from its own collective knowledge and expertise in forming anoperational assessment for each proposed parallel approach procedure. The operationalassessment reflected the TWG’s overall evaluation of the simulated procedure andrecommendation regarding the feasibility of implementing the procedure in the operationalenvironment. They based the operational assessment on all test results, on MPAP TWG expertise

5
and judgment, and on evaluations from subject controllers, pilots, controller technical observers,and pilot technical observers.
To fully understand the intricacies of controller and pilot performance with proposed procedures,the TWG considered all test results to form an operational assessment. Analyses of controllerresponse times, pilot/aircraft response times, aircraft separation distributions, controller breakoutinstruction content, and controller and pilot questionnaire responses were reviewed andincorporated into the TWG's final recommendation.
3. Multiple Parallel Approach Program Simulations and Results
The MPAP Team conducted initial real-time simulations to evaluate proposed runway operationsat the Dallas/Fort Worth International Airport (DFW). Following the DFW studies, the focus ofthe program shifted to the development of national standards for various parallel runwayconfigurations, display systems, and radar systems. During the series of national standards tests,the program addressed a site-specific study of the Denver International Airport (DEN).Following the Denver study, the program resumed testing for national standards developmentand, at the same time, addressed site-specific issues for the following airports: PhiladelphiaInternational (PHL), John F. Kennedy International (JFK), Atlanta International (ATL), andPittsburgh International (PIT) Airports.
Some detailed sources of information on these simulations are included in the following list:
a. CTA Incorporated (1990). Dallas/Fort Worth simulation phase II - triple simultaneousparallel ILS approaches (DOT/FAA/CT-90/2). Atlantic City International Airport, NJ:FAA Technical Center.
b. Fischer, T., Yastrop, G., & Startzel-Dehel, B. (1990). Simulation of quadruplesimultaneous parallel ILS approaches at D/FW - phase III (DOT/FAA/CT-90/15).Atlantic City International Airport, NJ: FAA Technical Center.
c. Hitchcock, L., Fischer, T., Bensel, L. W., Yastrop, G., Jones, R., Luongo, R., Reardon,K., & Startzel-Dehel, B. (1991). Evaluation of triple simultaneous parallel ILSapproaches spaced 4300 feet apart-phase IV.a (DOT/FAA/CT-91/6). Atlantic CityInternational Airport, NJ: FAA Technical Center.
d. Hitchcock, L., Fischer, T., Bensel, L. W., Yastrop, G., Jones, R., Luongo, R., Reardon,K., & Startzel-Dehel, B. (1992). Evaluation of triple simultaneous parallel ILSapproaches spaced 5000 feet apart-phase IV.b (DOT/FAA/CT-91/31). Atlantic CityInternational Airport, NJ: FAA Technical Center.
e. Morrow, S. L. & Ozmore, R. E. (1999). Evaluation of triple simultaneous instrumentlanding system approaches to runways spaced 4000 and 5300 ft apart using a precisionrunway monitor system. Manuscript in preparation.
f. Ozmore, R. & DiMeo, K. (1994). Simulation of triple simultaneous parallel ILSapproaches at the new Denver International Airport using the final monitor aid displayand a 4.8 second radar update rate (DOT/FAA/CT-94/36). Atlantic City InternationalAirport, NJ: FAA Technical Center.

6
g. Ozmore, R. E. & Morrow, S. L. (1996). Evaluation of dual simultaneous instrumentlanding system approaches to runways spaced 3000 feet apart with one localizer offsetusing a precision runway monitor system (DOT/FAA/CT-96/2). Atlantic CityInternational Airport, NJ: DOT/FAA William J. Hughes Technical Center.
h. Paul, L., Shochet, E., & Algeo, R. (1989). Dallas/Forth Worth simulation(DOT/FAA/CT-TN89/28). Atlantic City International Airport, NJ: FAA Technical Center.
i. Precision Runway Monitor Program Office (1991). Precision runway monitordemonstration report (DOT/FAA/RD-91/5). Washington, DC: FAA Research andDevelopment Service.
j. Yastrop, G., Bensel, L. W., Fischer, T., Jones, R., Luongo, R., Neiderman, E., &Reardon, K. (1992). Evaluation of triple simultaneous ILS approaches spaced 4300 feetapart using the final monitor aid-phase V.a.1 (DOT/FAA/CT-92/16). Atlantic CityInternational Airport, NJ: FAA Technical Center.
3.1 Dallas/Fort Worth International Airport Triple and Quadruple Approaches
The MPAP was initiated in 1988 to examine proposed operations at DFW. The parallel approachoperations were tested using monochrome displays, which were configured to emulate DEDSdisplays. Three simulations were conducted to evaluate the proposed triple and quadrupleapproach operations. Table 1 shows the parameters tested in each DFW simulation.
Table 1. Dallas/Fort Worth Triple and Quadruple Approach Simulations
Purpose Dates ParallelRunways
RunwaySpacing
Display SimulatedRadar
Other Recommendation
5/16-6/10/88
Quadruple 5000 ft &
5800 ft &
8800 ft
DEDS ASR-9
4.8-secondupdate rate
AirspaceConfiguration
Approved
DFW9/25-
10/5/89Triple 5000 ft &
8800 ft
DEDS ASR-9
4.8-secondupdate rate
Approved
11/292/9/90
Quadruple 5000 ft &
5800 ft &
8800 ft
DEDS ASR-9
4.8-secondupdate rate
MissedApproachProcedures
Approved
The “Other” column of Table 1 shows the difference between the May 1988 and the November1990 DFW studies. In addition to evaluating simultaneous approaches, the May 1988 simulation

7
examined airspace-configuration issues, and the November 1990 simulation examined missedapproach procedures associated with the proposed quadruple parallel operation.
After consideration of the blunder resolution rates, NTZ entry rates, and the operationalassessment, the MPAP TWG found that all three DFW simulations met the test criteria andrecommended them for approval. The FAA subsequently granted authorization to conduct thesimulated procedures. DFW began triple simultaneous parallel approach operations on October10, 1996 using the FDADS, which provides better display quality than the tested monochromeDEDS displays and an ASR-9 system with a 4.8-second update rate. The FAA approved theDFW expansion to quadruple parallel approach operations pending runway construction.
3.2 Dual and Triple Approaches With DEDS Displays and ASR-9
The MPAP Team conducted the next set of real-time simulations to establish national standardsfor triple simultaneous approaches using monochrome DEDS displays and simulated ASR-9 witha 4.8-second update rate. Table 2 details the parameters tested in each real-time simulation.
Table 2. Dual and Triple Approach Simulations Using DEDS Displays and ASR-9
Purpose Dates ParallelRunways
RunwaySpacing
Display SimulatedRadar
Other Recommendation
NationalStandards
4/24-5/3/90
Dual andTriple
4300 ft DEDS ASR-9
4.8-secondupdate rate
Not Approved
NationalStandards
9/17-9/28/90
Triple 5000 ft DEDS ASR-9
4.8-secondupdate rate
Approved
After consideration of the blunder resolution rate and operational assessment, the MPAP TWGdetermined that both the results of the 4300-ft dual and triple approach simulations were notacceptable. The TWG cited the controllers’ inability to detect and redirect deviating aircraft in atimely manner as the major contributing factor to the unsatisfactory results.
However, the MPAP TWG recommended that the 5000-ft triple approach operation be approved.The additional spacing between approach courses, as compared to the 4300-ft spacing, providedcontrollers with the necessary time to react to and resolve aircraft deviations. Subsequently, theFAA authorized simultaneous approaches to three parallel runways separated by at least 5000 ft.
3.3 Dual and Triple Approaches With FMA Displays and ASR-9
Three simulations evaluated simultaneous approach operations using FMA displays and ASR-9.FMAs are high-resolution color displays that are equipped with controller alert systems and

8
expandable horizontal and vertical axes. FMAs provide controllers with tools for recognizing andresolving aircraft course deviations, a task that is critical when monitoring simultaneousapproaches.
The FMA alert system includes algorithms that estimate future aircraft positions with predictorlines that are affixed to aircraft data tags. When an aircraft is predicted to enter the NTZ, theaircraft tag and data block change from green to yellow. If an aircraft enters the NTZ, the tag anddata block turn red. In addition, a synthesized voice alert sounds when an aircraft is within a setparameter of entering the NTZ.
The FMA provides the capability to adjust the horizontal and vertical ratio of the display. Axescan be scaled independently to improve the controller’s ability to detect aircraft movement awayfrom the extended runway centerline during final approach. For all of the MPAP simulations, a4:1, horizontal to vertical, expansion ratio was applied. MPAP simulations that investigated dualand triple approaches with FMA displays are detailed in Table 3.
Table 3. Dual and Triple Approach Simulations Using FMA Displays and ASR-9
Purpose Dates ParallelRunways
RunwaySpacing
Display SimulatedRadar
Other Recommendation
NationalStandards
5/15-5/24/91
Dual andTriple
4300 ft FMA ASR-9
4.8-secondupdate rate
Approved
NationalStandards
9/24-10/4/91
Triple 4000 ft FMA ASR-9
4.8-secondupdate rate
Inconclusive
NationalStandards
7/27-8/14/92
Dual andTriple
4000 ft FMA ASR-9
4.8-secondupdate rate
Inconclusive
Based on the established test criteria, the MPAP TWG recommended the approval of both the4300-ft dual and triple operations, and the FAA subsequently authorized the approaches. TheFMA displays were effective in enabling successful operations. With expanded horizontal axesand color/voice alerts, controllers were able to detect aircraft blunders in sufficient time to resolvethe situations and thus maintain the specified target level of safety.
The September 1991 4000-ft triple approach simulation provided positive results in terms ofblunder resolution performance, however, the MPAP Team did not collect enough data over thecourse of the simulation to support a recommendation of the operation.

9
The team conducted the July 1992 4000-ft dual and triple approach simulations to supplement thedata from the September 1991 study. A combination of the results from the simulations provideda larger sample of data. Analysis of the combined results showed that blunder resolutionperformance was not significantly better than the target level of safety. The results from the July1992 simulations alone were unacceptable. The TWG attributed those results to changes incontroller phraseology, which included new breakout terms and standardized ‘climb only’breakout instructions. Because the validity of the combined data was questionable due todifferent ATC procedures that were employed between simulations, the TWG did not provide anyrecommendations on the procedures.
3.4 Denver International Airport Triple Approaches
The Denver simulation consisted of three parts. First, the MPAP TWG performed a generic studyto gain information about the effects of density-altitude on aircraft performance at high-altitudeairports, particularly as related to aircraft executing simultaneous approaches. They did not makea recommendation from the study. Second, they performed a real-time simulation to emulate thetriple runway configuration of DEN. Controllers monitored aircraft arrivals using FDADS and asimulated ASR-9 with a 4.8-second update rate. Third, they tested the DEN triple runwayconfiguration using FMA displays and an ASR-9 with a 4.8-second update rate. Table 4 detailsthe test parameters for all of the high-altitude simulations.
Table 4. Denver Triple Approach Simulations
Purpose Dates ParallelRunways
RunwaySpacing
Display SimulatedRadar
Other Recommendation
High-Altitude
9/8-9/25/92
Triple 7600 ft &5280 ft
DEDS ASR-9
4.8-secondupdate rate
FieldElevation
5431 ft
NoRecommendation
Made
DEN 11/16-11/20/92
Triple 7600 ft &5280 ft
FDADS ASR-9
4.8-secondupdate rate
FieldElevation
5431 ft
Not Approved
DEN 11/30-12/17/92
Triple 7600 ft &5280 ft
FMA ASR-9
4.8-secondupdate rate
FieldElevation
5431 ft
Approved
The high-altitude simulation provided valuable information about the effects of air density onaircraft performance at airports with high field elevations. Air density at high altitudes degradesperformance because it reduces engine power output and aerodynamic lift. Another effect of highaltitude is a higher true airspeed. Even though the indicated airspeed that the pilots see in thecockpit is unaffected by variations in air density, the true airspeed increases with increased
10
altitudes/decreased densities. Nevertheless, aircraft fly the same indicated airspeeds at both high-altitude airports and sea level airports.
At high-altitude airports where simultaneous approaches are being conducted, reduced aircraftperformance and higher true airspeeds could become critical factors in a pilot’s ability to avoid ablundering aircraft. First, with a greater true airspeed, a blundering aircraft has a higher cross-track velocity. Second, the higher true airspeed of an evading aircraft would result in a larger turnradius and, therefore, a decreased probability of avoiding a blundering aircraft. The controllerwould have to detect blunders and issue breakout instructions almost immediately to resolve ablunder.
DEN planned to operate triple simultaneous approaches when it opened in February 1993. Therunway spacings were above minimums, however, the field elevation classified the airport as ahigh-altitude airport. Therefore, the MPAP Team performed a simulation in November 1992 todetermine if the high altitude and low air density would effect the safety of a triple simultaneousapproach operation. For the test, controllers monitored aircraft using FDADS displays and anASR-9 with a 4.8-second update rate.
The MPAP TWG determined that the results of the DEN simulation using the FDADS displayswere unacceptable. Observations during the simulation by the TWG, Air Traffic representatives,and Northwest Mountain Region representatives were enough to conclude that the FDADS didnot provide the controllers with the necessary resolution and features to detect and respond todeviating aircraft in timely manners. The blunder resolution performance criterion was not met.The simulation thus concluded, and a decision was made to test the procedure with FMA displays.
The DEN simulation using FMA displays was a success. After analysis of the blunder resolutionrate, the NTZ entry and NBO rates, and the operational assessment, the MPAP Team found thatthe procedure had met all of the test criteria. The FMA displays were effective in alertingcontrollers to blundering aircraft in sufficient time for the controllers to react to and resolve thesituations. The MPAP TWG, therefore, recommended the procedure for approval. With thestipulation that FMA displays be installed at DEN, the FAA subsequently granted authorization toconduct the triple approach procedure. DEN conducted triple simultaneous approaches underinstrument weather conditions on their opening day in February 1995.
The knowledge gained from the high-altitude studies resulted in addenda to the approved 5000-ftand 4300-ft triple approach procedures. In addition to a minimum of 5000 ft between runways,airports executing these simultaneous triple approaches using FDADS or DEDS displays andASR-9 must also have a field elevation of less than 1000 ft Mean Sea Level (msl). In addition,airports conducting triple simultaneous approaches to runways spaced 4300 ft apart using FMAdisplays with ASR-9 must also have field elevations of less than 1000 ft msl.
3.5 Dual Approaches With Precision Runway Monitor Systems
The Precision Runway Monitor (PRM) system was developed specifically for the monitoring ofclosely spaced parallel approaches in the late 1980s. The PRM consists of a high-resolutiondisplay system, such as the FMA, and a monopulse antenna system that provides high azimuth and

11
range accuracy and higher update rates than the current terminal ASR systems. The electronicallyscanned antenna has an update interval that can be varied from 0.5 to 5 seconds, althoughcomputer-processing capacity generally limits the minimum update interval to 1.0 second (Crane& Massimini, 1995).
In 1990, the MPAP Team tested and recommended for approval a procedure for simultaneousparallel approaches to two runways spaced 3400 ft apart using FMA displays and a high-updateradar system. The radar consisted of a back-to-back Mode S radar sensor with a 2.4-secondupdate rate. The FAA, however, approved funding for PRM systems with E-Scan radar with a1.0-second update rate only. The back-to-back Mode S radar with the 2.4-second update ratewas not purchased to be part of the PRM system. Therefore, the TWG adopted therecommendation for 3400-ft duals to include the E-Scan 1.0-second update rate to coincide withthe fielded PRM system specifications.
As explained in the PRM Demonstration Report (PRM Program Office, 1991), the 3400-ft dualprocedure addressed operations at Raleigh-Durham International (RDU) and MemphisInternational (MEM) Airports, which were chosen as field sites for test and evaluation. Initialstudies, however, conducted as part of the PRM Demonstration Program, indicated that theminimum runway spacing enabled by a PRM system would be approximately 3000 ft. The MPAPTWG investigated this possibility.
They performed a series of simulations to develop national standards for two parallel runwaysusing the PRM. They designed the simulations to investigate the effects of the PRM on thecontroller’s ability to monitor closely spaced approaches. All of the 3000-ft dual runwaysimulations included FMA displays and simulated E-Scan radar systems with 1.0-second updaterates. As Table 5 depicts, two simulations tested the same parameters as two earlier simulations.The following paragraphs explain the impetus for each of those dual runway simulations.
The MPAP Team conducted the March 1991 simulation to test the feasibility of executingsimultaneous approaches to two runways spaced 3000 ft apart. The results of the study did notmeet the safety requirements defined by the TWG. They attributed the reason to a capacity issue,not to an aircraft separation issue. Controllers broke an excessive number of aircraft out of theapproach because of aircraft navigational error, and, consequently, the procedure offered little tono capacity increases. In other words, as aircraft captured the localizers, their typical fan-shapedapproaches caused predictor lines to enter the NTZ and alerts to sound (see Figure 3) due to theclosely spaced approach configuration. Controllers responded correctly by breaking the aircraftoff the approach. Consequently, the 3000-ft dual procedure was not recommended for approval.
Table 5. Dual Approach Simulations Using Precision Runway Monitor Systems
Purpose Dates ParallelRunways
RunwaySpacing
Display SimulatedRadar
Other Recommendation
National 1990 Dual 3400 ft FMA Mode S Approved *

12
Standards 2.4-secondupdate rate
NationalStandards
3/18-3/27/91
Dual 3000 ft FMA E-Scan
1.0-secondupdate rate
Not Approved
NationalStandards
9/16-9/23/91
Dual 3000 ft FMA E-Scan
1.0-secondupdate rate
1-DegreeLocalizer
Offset
No DecisionRendered
See June 1994
NationalStandards
6/6-6/17/94
Dual 3000 ft FMA E-Scan
1.0-secondupdate rate
1-DegreeLocalizer
Offset
Not Approved
NationalStandards
7/11-7/22/94
Dual 3000 ft FMA E-Scan
1.0-secondupdate rate
2.5-DegreeLocalizer
Offset
No DecisionRendered
See October 1995
NationalStandards
10/16-10/27/95
Dual 3000 ft FMA E-Scan
1.0-secondupdate rate
2.5-DegreeLocalizer
Offset
Approved
* A PRM Demonstration Program study, not an MPAP simulation
Figure 3. Pilot/aircraft navigation performance.
In an attempt to resolve the navigational precision issue, the MPAP Team conducted a 3000-ftsimulation in September 1991 with one of the parallel approach courses offset by one degree.They added the offset to increase the spacing between approach courses as a function of distancefrom the localizer antenna. The anticipated effect of the offset was fewer alerts as aircraftcaptured the localizers and, thus, fewer breakouts. The FAA did not make a recommendation on
NTZ

13
the tested procedure, however, because insufficient data were collected during the simulation tosupport a recommendation.
The MPAP Team reevaluated the 3000-ft, one-degree offset procedure in June 1994. The offsetlocalizer appeared to resolve the navigational error issue; however, the blunder resolutionperformance criterion was not met. The number of TCVs that occurred did not allow theprocedure to meet the target level of safety. The TWG did not recommend the procedure forapproval.
The team decided to investigate a procedure with a larger offset angle that would emulateproposed simultaneous approach operations at JFK and PHL. Both airports were interested in a3000-ft dual parallel runway operation with one localizer offset by 2.5 degrees.
The team tested the 3000-ft, 2.5-degree offset procedure in July 1994 using FMA displays and asimulated E-Scan radar with a 1.0-second update rate. The results of the simulation showed thatthe NTZ entry and NBO criteria were met; however, the resultant TCV rate was just over themaximum acceptable TCV rate. Therefore, the blunder resolution criterion was not met and theTWG operational assessment was not supportive of the operation.
Through extensive analysis of simulation data, the TWG determined that training for bothcontrollers and pilots was not adequate for the simulation. A large number of controllers wererotated through as subjects, and, as a result, individuals did not receive sufficient training on thePRM equipment prior to their participation. In addition, not enough emphasis was placed on theuse of standardized phraseology for blunders, and, consequently, breakout phraseologies varied incontent and duration during the test. Pilots, on the other hand, were not trained to performbreakout maneuvers and were unfamiliar with ATC-directed breakouts between glide slopeintercept and decision height. To summarize, the TWG identified training as the contributingfactor to the failure of the simulation, not the proposed procedure itself.
The MPAP Team took action to resolve the problem areas identified with the July 1994simulation. They developed improved training packages for both controllers and pilots with theintent to develop training recommendations that could be applied in actual field operations. The3000-ft, 2.5-degree offset procedure was re-tested in October 1995 and passed all of the testcriteria unquestionably. No TCVs occurred throughout the entire test. Controllers familiarizedthemselves with the PRM equipment and delivered phraseology as prescribed. The pilots on theMPAP Team administered awareness training to subject pilots for flying closely spacedapproaches. They instructed the pilots to execute only hand-flown breakouts, which weredetermined to be faster than autopilot breakouts in the July 1994 simulation. With the stipulationthat similar controller and pilot training be required, the TWG unanimously agreed to recommendthe 3000-ft, 2.5-degree offset procedure for approval.
3.6 Triple Approaches With Precision Runway Monitor Systems
The MPAP Team conducted a series of triple parallel runway simulations over the past severalyears using the PRM system. Table 6 details the test parameters for four triple approachsimulations and the final recommendations for each.

14
Table 6. Triple Approach Simulations Using Precision Runway Monitor Systems
Purpose Dates ParallelRunways
RunwaySpacing
Display SimulatedRadar
Other Recommendation
NationalStandards
3/28-4/5/91
Triple 3000 ft FMA E-Scan
1.0-secondupdate rate
Not Approved
NationalStandards
5/6-5/14/91
Triple 3400 ft FMA Mode S
2.4-secondupdate rate
Inconclusive
NationalStandards
8/14-8/25/95
Triple 4000 ft &5300 ft
FMA E-Scan
1.0-second
No DecisionRendered
NationalStandards
4/15-4/26/96
Triple 4000 ft &5300 ft
FMA E-Scan
1.0-secondupdate rate
Approved
The MPAP Team tested a 3000-ft triple approach procedure using FMA displays and an E-Scanradar directly following the 3000-ft dual approach simulation in March 1991. The MPAP TWGdid not recommend the triple procedure for approval. As with the duals, they attributed thereason for the failure of the procedure to a capacity issue. Navigational error caused controllersto break out an excessive number of aircraft, and consequently, the procedure did not offer anycapacity gains.
In May 1991, the team conducted a simulation to evaluate triple approaches to runways spaced3400 ft apart using FMA displays and a back-to-back Mode S radar with a 2.4-second updaterate. The TWG deemed the study inconclusive due to insufficient data collected during thesimulation. They therefore made no recommendation on the procedure.
In August 1995, the MPAP Team simulated a procedure for three parallel runways spaced 4000and 5300 ft apart using FMA displays and an E-Scan radar. The purpose of the simulation was toaddress proposed operations at Pittsburgh International (PIT) and Atlanta International (ATL)Airports. Results of the simulation showed that the NTZ entry and NBO rates were acceptablebut the blunder resolution rates were not.
Similar to the July 1994 3000-ft dual, 2.5-degree offset simulation, the TWG identified training asa problem area. Specifically, they identified controller training as the major contributing factor tothe outcome of the test. A large number of controllers rotated through as subjects. As a result,training with the PRM equipment on an individual level was not adequate prior to the test. TheMPAP Team briefed breakout phraseology to the controllers before the simulation. Because ofits length, however, controllers had problems issuing it during blunders.

15
The TWG believed that the 4000 and 5300-ft triple procedure would be operable if the teamapplied the improved controller training package that enabled a successful 3000-ft, 2.5-degreeoffset simulation. This package included a mandatory 8 hours of hands-on training with the PRMequipment, during which controllers could observe and respond to blunders and rehearse a newshortened standard breakout phraseology. Pilot training proved to be very effective in the August1995 simulation, as demonstrated by pilot performance and, therefore, did not require anymodifications. The MPAP administered the improved controller training packages and the samepilot training that was administered in the August 1995 simulation. The test passed all of thecriteria.
The MPAP Team tested the 4000- and 5300-ft triple procedure again in April 1996 and it passedall of the test criteria. The test results demonstrated that the modified controller training and theemployment of pilot training improved the procedure. Controllers delivered standard breakoutphraseology during almost every blunder event, and the resulting TCV rate was well below themaximum acceptable TCV rate. The TWG therefore recommended the 4000 and 5300-ft tripleprocedure for approval at airports with field elevations of less than 1000 ft msl with the conditionthat similar controller and pilot training be applied as in the simulation.
4. Conclusions
The MPAP TWG observed and evaluated numerous simultaneous parallel approach procedures inthe last decade, mostly with the use of advanced radar and display system technology. Theygained a phenomenal amount of information about system performance with various simultaneousapproach configurations, controller displays, and radar systems. MPAP research findings havebeen adopted by the United States and worldwide. Procedures have been incorporated into FAAOrder 7110.65- Air Traffic Control (FAA 1996), FAA Order 8260.39- Close Parallel ILS/MLSApproaches (FAA, 1994) and the Aeronautical Information Manual (AIM) (FAA, 1996).Instrument approach path obstacle clearance requirements for PRM have been incorporated intoFAA Order 8260.39. Many of these FAA standards have also been adopted by the InternationalCivil Aviation Organization.
The MPAP designed these simulations to test and define operational limits of current systems andexamine enhanced capabilities of new systems. The implementation of PRM systems to reduceminimum required runway spacings between parallel runways is one example of the milestonesachieved through these endeavors. The simulations were also instrumental in identifying andcorrecting potentially hazardous operations such as with the proposed operations at DEN usingFDADS. Through the MPAP TWG efforts, the FMA display system was proposed, tested, andinstalled prior to DEN going operational.
The MPAP TWG acquired a comprehensive understanding of the intricacies of simultaneousapproach operations. The impact of simultaneous operations on controllers, aircrews, and theentire National Airspace System (NAS) was studied extensively. Based upon the informationgained from the simulations and the collective knowledge of the MPAP, the TWG developed a setof recommendations, shown in Table 7.

16
Table 7. Summary of MPAP TWG National Standard Recommendations
Parallel Runways Spaced by Display Radar FAAApproved
Greater than or equal to 5000 ft FDADS&
DEDS
ASR-94.8
seconds
Yes
Less than 5000 ft and greater than orequal to 4300 ft
FMA ASR-94.8
seconds
YesDUAL
Straight-InApproaches
Less than 4300 ft and greater than orequal to 3400 ft
FMA E-Scan≤ 1.0
second
Yes
DUALOffset
Approaches
Less than 3400 ft and greater than orequal to 3000 ft with no less than a 2.5-
degree localizer offset
FMA E-Scan
≤ 1.0second
Yes
Greater than or equal to 5000 ft withairport field elevation less than 1000 ft
FDADS&
DEDS
ASR-94.8
seconds
Yes
TRIPLEStraight-InApproaches Less than 5000 ft and greater than or
equal to 4300 ft with airport fieldelevation less than 1000 ft
FMA ASR-94.8
seconds
Yes
For straight-in simultaneous ILS approaches to two parallel runways spaced apart by at least 5000ft, the TWG recommended the use of FDADS or DEDS and ASR-9 with a 4.8-second updaterate. The TWG recommended, however, that the installation of FMA displays be considered as asafety enhancement.

17
The TWG recommended that FMA displays be required with radar systems that have a 4.8-second update rate such as the ASR-9, for straight-in, simultaneous, ILS approaches to twoparallel runways spaced apart by less than 5000 ft and greater than or equal to 4300 ft, (runwayspacings below 4300 ft require FMAs and high update radar). This recommendation is significantin that a small number of airports currently conduct dual simultaneous approaches to two runwaysspaced 4300 ft apart using FDADS or DEDS displays, which are the current FAA standards.
The TWG recommended and the FAA approved a procedure requiring the use of a PRM systemfor straight-in, simultaneous, ILS approaches to two parallel runways spaced less than 4300 ftapart and greater than or equal to 3400 ft apart (FAA, 1996). FMA displays are required forthese closely spaced operations, and the radar sensor must provide an update rate not exceeding1.0 second.
The TWG recommended and the FAA approved a procedure requiring the use of a PRM systemfor offset, simultaneous, ILS approaches to two parallel runways spaced less than 3400 ft apartand greater than or equal to 3000 ft apart with one localizer offset by 2.5 degrees (FAA, 1997).FMA displays are required and the radar sensor must provide an update rate not exceeding 1.0second. In addition, simultaneous approach procedural training must be given to all final monitorcontrollers and aircrews who plan to fly the approaches.
For straight-in, simultaneous, ILS approaches to three parallel runways spaced apart by at least5000 ft at airports with field elevations of less than 1000 ft msl, the TWG recommended the useof FDADS or DEDS and ASR-9 with a 4.8-second update rate. The conduct of the DENsimulations highlighted the effects of high-altitude air density on aircraft performance. Thus,higher altitude airports need to be examined individually to determine the runway spacingrequirements.
The TWG recommended and the FAA approved a procedure requiring the use of FMA displaysand ASR-9 with a 4.8-second update rate for straight-in simultaneous ILS approaches to threeparallel runways spaced less than 5000 ft apart and greater than or equal to 4300 ft apart atairports with field elevations of less than 1000 ft msl (FAA, 1996).
The MPAP TWG demonstrated that the conduct of simultaneous approach operations to parallelrunways could increase the NAS capacity and reduce operational delays. Furthermore,simultaneous approach procedures can be incorporated into many airport operations with aminimal level of expenditure. In many cases, airports can be modified or use their existing runwaylayouts to allow simultaneous operations as opposed to having to build new runways or newairports. To enhance the safety of these simultaneous approach operations, the MPAP TWGadvised adherence to the recommendations cited in this document.

18
Glossary
At-Risk Blunder - (As defined for the simulations) A blunder in which the two aircraft would havecome within 500 ft of one another without controller intervention.
Blunder - (As defined for the simulations) An unexpected turn by an aircraft already establishedon the localizer toward another aircraft on an adjacent approach.
Breakout - A technique used to direct aircraft out of the approach stream. In the context of closeparallel operations, a breakout is used to direct an aircraft away from a deviating aircraft whilesimultaneous operations are being conducted.
Controller Technical Observer - An individual who observes a monitor controller position duringeach simulation run. Duties include documenting discrepancies between issued controlinstructions and actual aircraft responses; assisting in alerting responsible parties to correct anyproblems which may occur during the test (e.g., computer failure, stuck microphone); assistingcontrollers in preparation of reports; and documenting their evaluation of the data in a TechnicalObserver report at the end of the simulation.
Final Monitor Aid (FMA) - A high resolution color display that is equipped with the controlleralert system hardware and software used in the PRM system. The display includes alertalgorithms providing the target predictors, a color change alert when a target penetrates or ispredicted to penetrate the NTZ, a color change alert if the aircraft transponder becomesinoperative, synthesized voice alerts, digital mapping, and like features contained in the PRMsystem. (FAA, 1996; FAR, 1996)
Final Monitor Controller - Air Traffic Control Specialist assigned to radar monitor the flight pathsof aircraft during simultaneous parallel and simultaneous close parallel ILS approach operations.Each runway is assigned a final monitor controller during simultaneous parallel and simultaneousclose parallel ILS approaches. Final monitor controllers shall utilize the Precision RunwayMonitor system (PRM) during simultaneous close parallel ILS approaches. (FAA, 1996)
Flight Technical Error (FTE) - (As defined for the simulations) The accuracy with which the pilotcontrols the aircraft as measured by the actual aircraft position with respect to the desired aircraftposition. It does not include blunders.
Indicated Airspeed (IAS) - The speed shown on the aircraft airspeed indicator. This is the speedused in pilot/controller communications under the general term, airspeed. (FAA, 1996; FAR,1996)
Instrument Landing System (ILS) - A precision instrument approach system which normallyconsists of the following electronic components and visual aids: localizer, glide slope, outermarker, middle marker, and approach lights. (FAA, 1996; FAR, 1996)

19
Instrument Meteorological Conditions (IMC) - Meteorological conditions expressed in terms ofvisibility, distance from cloud, and ceiling less than the minima specified for visual meteorologicalconditions. (FAA, 1996; FAR, 1996)
Localizer Offset - An angular offset of the localizer from the extended runway centerline in adirection away from the No Transgression Zone (NTZ) that increases the Normal Operating Zone(NOZ) width. An offset requires a 50-foot increase in decision height (DH) and is not authorizedfor CAT II and CAT III approaches. (FAA, 1996)
Multiple Parallel Approach Program Technical Work Group (MPAP TWG) - A group of FAAemployees representing several different offices (e.g. Secondary Surveillance Product Lead, Officeof System Capacity and Requirements) that assembles to make recommendations on multipleparallel approach procedures.
National Airspace System (NAS) - The common network of U.S. airspace; air navigationfacilities, equipment and services, airports or landing areas; aeronautical charts, information andservices; rules, regulations and procedures, technical information and manpower and material.Included are system components shared jointly with the military. (FAA, 1996; FAR, 1996)
No Transgression Zone (NTZ) - A 2000 foot wide zone, located an equal distance betweenparallel runway final approach courses, in which flight is not allowed. (FAA, 1996)
Normal Operation Zone (NOZ) - The operating zone within which aircraft flight remains duringnormal independent simultaneous parallel ILS approaches. (FAA, 1996)
Nuisance Breakout (NBO) - (As defined for the simulations) An event in which an aircraft isbroken out of its final approach for reasons other than a blunder, loss of longitudinal separation,or lost beacon signal (i.e., aircraft goes into coast).
Pilot Technical Observer - A pilot who participates in the simulation as a flight simulator sitecoordinator. The pilot technical observer evaluates operational aspects of the simulation at thesites and is the conduit to the FAA Technical Center for that area/phase of the simulation.
Precision Runway Monitor (PRM) System - A system that provides air traffic controllers withhigh precision secondary surveillance data for aircraft on final approach to closely spaced parallelrunways. High-resolution color monitoring displays (FMAs) are required to present surveillancetrack data to controllers along with detailed maps depicting approaches and the no transgressionzone. (FAA, 1996; FAR, 1996)
Simultaneous ILS Approaches - An approach system permitting simultaneous ILS/MLSapproaches to airports having parallel runways separated by at least 4,300 ft between centerlines.Integral parts of the total system are ILS/MLS, radar, communications, ATC procedures, andappropriate airborne equipment. (FAA, 1996; FAR, 1996)
Test Criterion Violation (TCV) - (As defined for the simulations) An event that occurs when theCPA between two aircraft after the initiation of a blunder is less than 500 ft.

20
Total Navigation System Error (TNSE) - (As defined for the simulations) The difference betweenthe actual flight path of the aircraft and the path it is intending to fly. It is caused by FTE,avionics error, ILS signal error, and weather.

21
Acronyms
ASR-9 Airport Surveillance Radar Model #9ATC Air Traffic ControlATL Atlanta International AirportDEDS Digital Entry Display SubsystemDEN Denver International AirportDFW Dallas/Fort Worth International AirportE-SCAN Electronic Scanning RadarFAA Federal Aviation AdministrationFDADS Fully Digital Alphanumeric Display SystemFMA Final Monitor AidILS Instrument Landing SystemJFK John F. Kennedy International AirportMEM Memphis International AirportMPAP Multiple Parallel Approach ProgramMSL Mean Sea LevelNAS National Airspace SystemNBO Nuisance BreakoutNOZ Normal Operating ZoneNTZ No Transgression ZonePHL Philadelphia International AirportPIT Pittsburgh International AirportPRM Precision Runway MonitorRDU Raleigh/Durham International AirportTCV Test Criterion ViolationTNSE Total Navigation System ErrorTWG Technical Working Group

22
References
CTA Incorporated (1990). Dallas/Fort Worth simulation phase II - triple simultaneous parallelILS approaches (DOT/FAA/CT-90/2). Atlantic City International Airport, NJ: FAATechnical Center.
Crane, L. H. & Massimini, S. V. (1995). Simultaneous independent parallel approaches inCanada using modernized sensors and displays (MTR95W0000055). McLean, VA: TheMITRE Corporation.
Federal Aviation Administration (1996). Air traffic control (DOT/FAA/Order 7110.65J).Washington, DC: Federal Aviation Administration.
Federal Aviation Administration (1997). Air traffic control (DOT/FAA/Order 7210.3M).Washington, DC: Federal Aviation Administration.
Federal Aviation Administration (1994). Close parallel ILS/MLS approaches (DOT/FAA Order8260.39). Washington, DC: Federal Aviation Administration.
Federal Aviation Regulation (1996). Airman’s information manual (AIM): Official guide to basicflight information and ATC procedures. Renton, WA: Aviation Supplies and Academics, Inc.
Fischer, T., Yastrop, G., & Startzel-Dehel, B. (1990). Simulation of quadruple simultaneousparallel ILS approaches at D/FW - phase III (DOT/FAA/CT-90/15). Atlantic CityInternational Airport, NJ: FAA Technical Center.
Hitchcock, L., Fischer, T., Bensel, L. W., Yastrop, G., Jones, R., Luongo, R., Reardon, K., &Startzel-Dehel, B. (1991). Evaluation of triple simultaneous parallel ILS approaches spaced4300 feet apart-phase IV.a (DOT/FAA/CT-91/6). Atlantic City International Airport, NJ:FAA Technical Center.
Hitchcock, L., Fischer, T., Bensel, L. W., Yastrop, G., Jones, R., Luongo, R., Reardon, K., &Startzel-Dehel, B. (1992). Evaluation of triple simultaneous parallel ILS approaches spaced5000 feet apart-phase IV.b (DOT/FAA/CT-91/31). Atlantic City International Airport, NJ:FAA Technical Center.
Ozmore, R. & DiMeo, K. (1994). Simulation of triple simultaneous parallel ILS approaches atthe new Denver International Airport using the final monitor aid display and a 4.8 secondradar update rate (DOT/FAA/CT-94/36). Atlantic City International Airport, NJ: FAATechnical Center.
Ozmore, R. E. & Morrow, S. L. (1996). Evaluation of dual simultaneous instrument landingsystem approaches to runways spaced 3000 feet apart with one localizer offset using aprecision runway monitor system (DOT/FAA/CT-96/2). Atlantic City International Airport,NJ: DOT/FAA William J. Hughes Technical Center.

23
Paul, L., Shochet, E., & Algeo, R. (1989). Dallas/Forth Worth simulation (DOT/FAA/CT-TN89/28). Atlantic City International Airport, NJ: FAA Technical Center.
Precision Runway Monitor Program Office (1991). Precision runway monitor demonstrationreport (DOT/FAA/RD-91/5). Washington, DC: FAA Research and Development Service.
Yastrop, G., Bensel, L. W., Fischer, T., Jones, R., Luongo, R., Neiderman, E., & Reardon, K.(1992). Evaluation of triple simultaneous ILS approaches spaced 4300 feet apart using thefinal monitor aid-phase V.a.1 (DOT/FAA/CT-92/16). Atlantic City International Airport,NJ: FAA Technical Center.