sherlock homepage - a detective story about running large web services - ndc oslo
TRANSCRIPT

Sherlock HomepageA detective story about running large web services.Maarten Balliauw@maartenballiauw

Site unavailable!
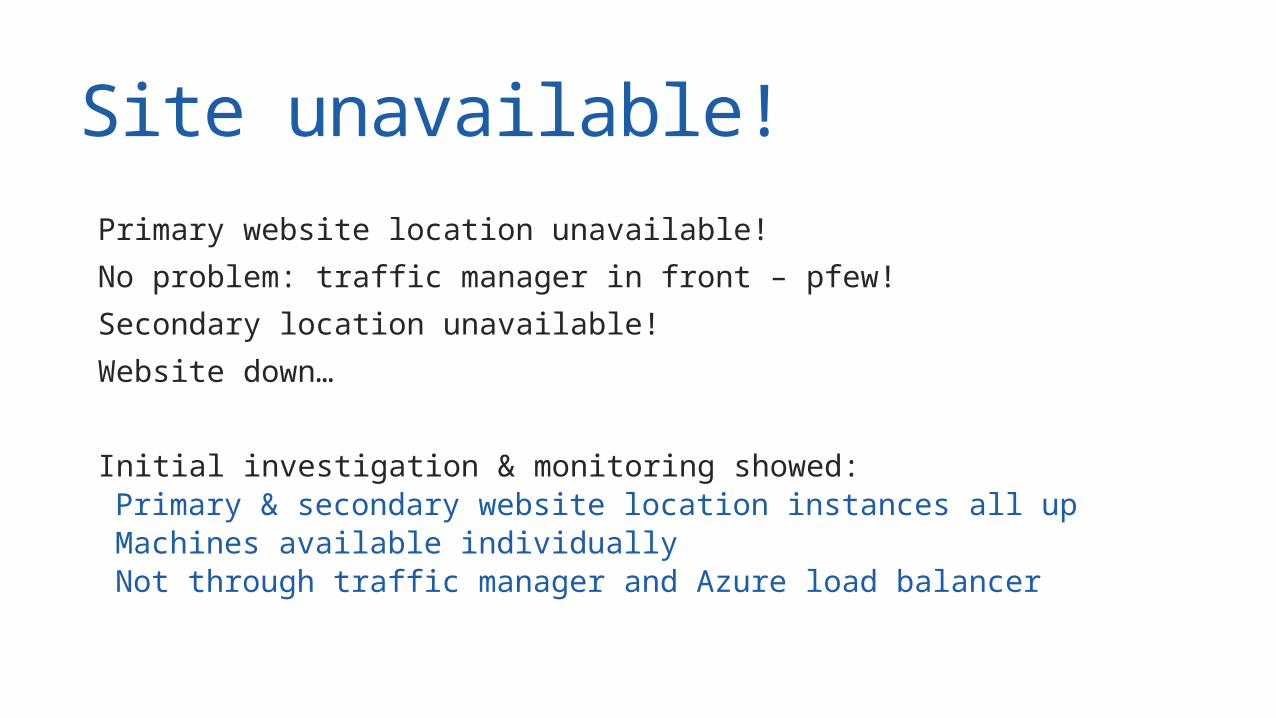
Site unavailable! Primary website location unavailable! No problem: traffic manager in front – pfew! Secondary location unavailable! Website down…
Initial investigation & monitoring showed: Primary & secondary website location instances all up Machines available individually Not through traffic manager and Azure load balancer
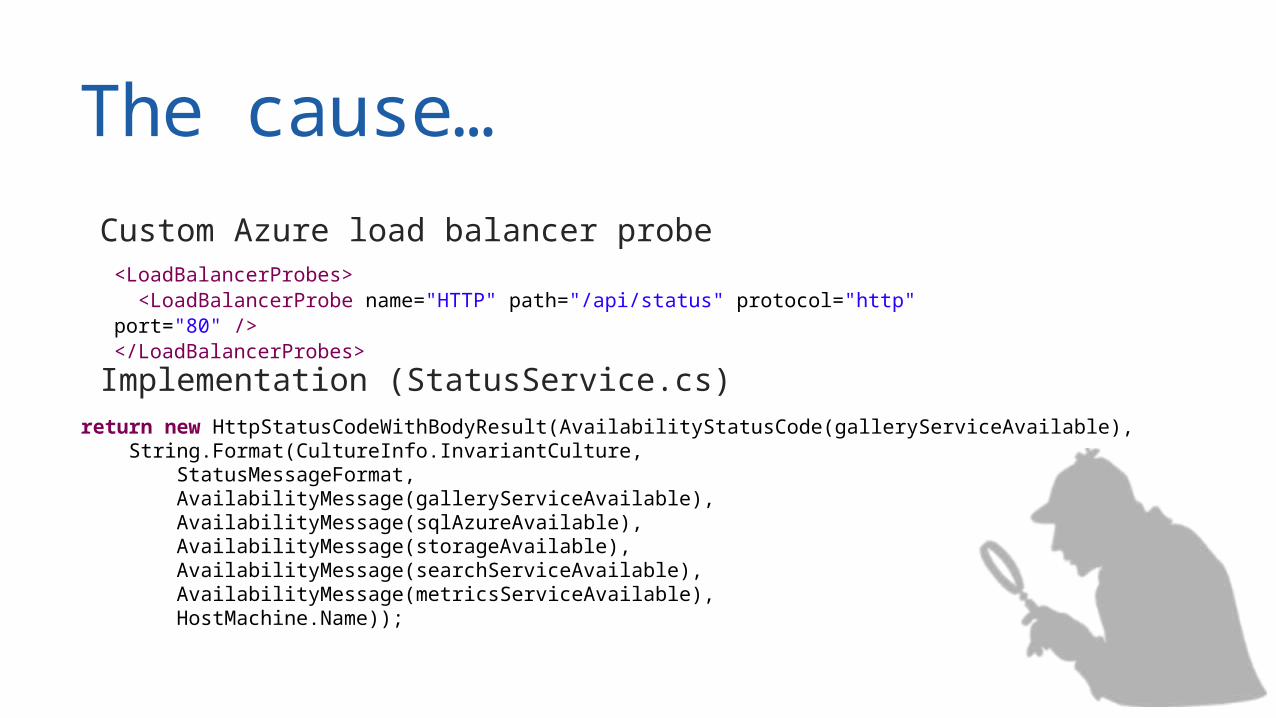
The cause… Custom Azure load balancer probe
Implementation (StatusService.cs)
<LoadBalancerProbes> <LoadBalancerProbe name="HTTP" path="/api/status" protocol="http" port="80" /></LoadBalancerProbes>
return new HttpStatusCodeWithBodyResult(AvailabilityStatusCode(galleryServiceAvailable), String.Format(CultureInfo.InvariantCulture, StatusMessageFormat, AvailabilityMessage(galleryServiceAvailable), AvailabilityMessage(sqlAzureAvailable), AvailabilityMessage(storageAvailable), AvailabilityMessage(searchServiceAvailable), AvailabilityMessage(metricsServiceAvailable), HostMachine.Name));

How did we find the issue? Quote from “Mind Hunter” (written by an FBI profiler): You have to be able to re-create the crime scene in your head. You need to know as much as you can about the victim so that you can imagine how she might have reacted. You have to be able to put yourself in her place as the attacker threatens her with a gun or a knife, a rock, his fists, or whatever. You have to be able to feel her fear as he approaches her. You have to be able to feel her pain. You have to try to imagine what she was going through when he tortured her. You have to understand what it’s like to scream in terror and agony, realizing that it won’t help, that it won’t get him to stop. You have to know what it was like.
http://highscalability.com/blog/2015/7/30/how-debugging-is-like-hunting-serial-killers.html
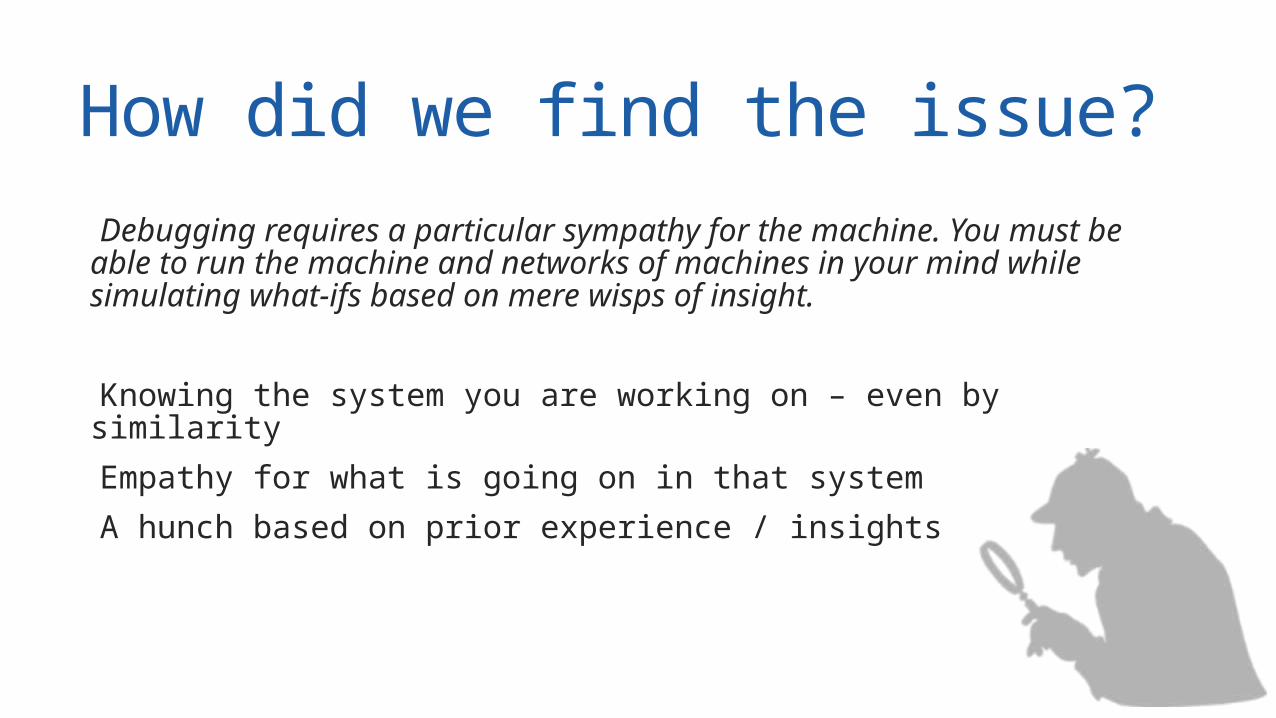
How did we find the issue? Debugging requires a particular sympathy for the machine. You must be able to run the machine and networks of machines in your mind while simulating what-ifs based on mere wisps of insight.
Knowing the system you are working on – even by similarity Empathy for what is going on in that system A hunch based on prior experience / insights

Sherlock HomepageA detective story about running large web services.Maarten Balliauw@maartenballiauw

Who am I? Maarten Balliauw Antwerp, Belgium Software Engineer, Microsoft Founder, MyGet AZUG Focus on web ASP.NET MVC, Azure, SignalR, ... Former MVP Azure & ASPInsider Big passion: Azure http://blog.maartenballiauw.be @maartenballiauw Shameless self promotion: Pro NuGet - http://amzn.to/pronuget2

History and Context
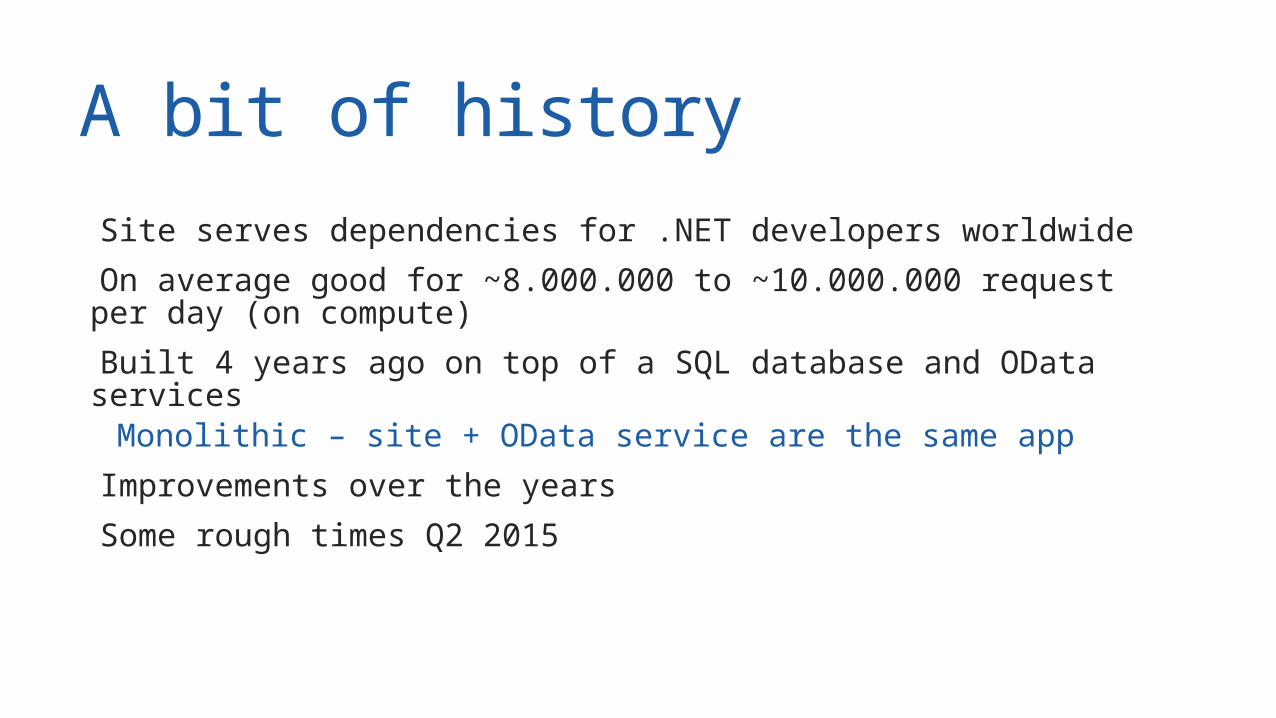
A bit of history Site serves dependencies for .NET developers worldwide On average good for ~8.000.000 to ~10.000.000 request per day (on compute)
Built 4 years ago on top of a SQL database and OData services Monolithic – site + OData service are the same app Improvements over the years Some rough times Q2 2015
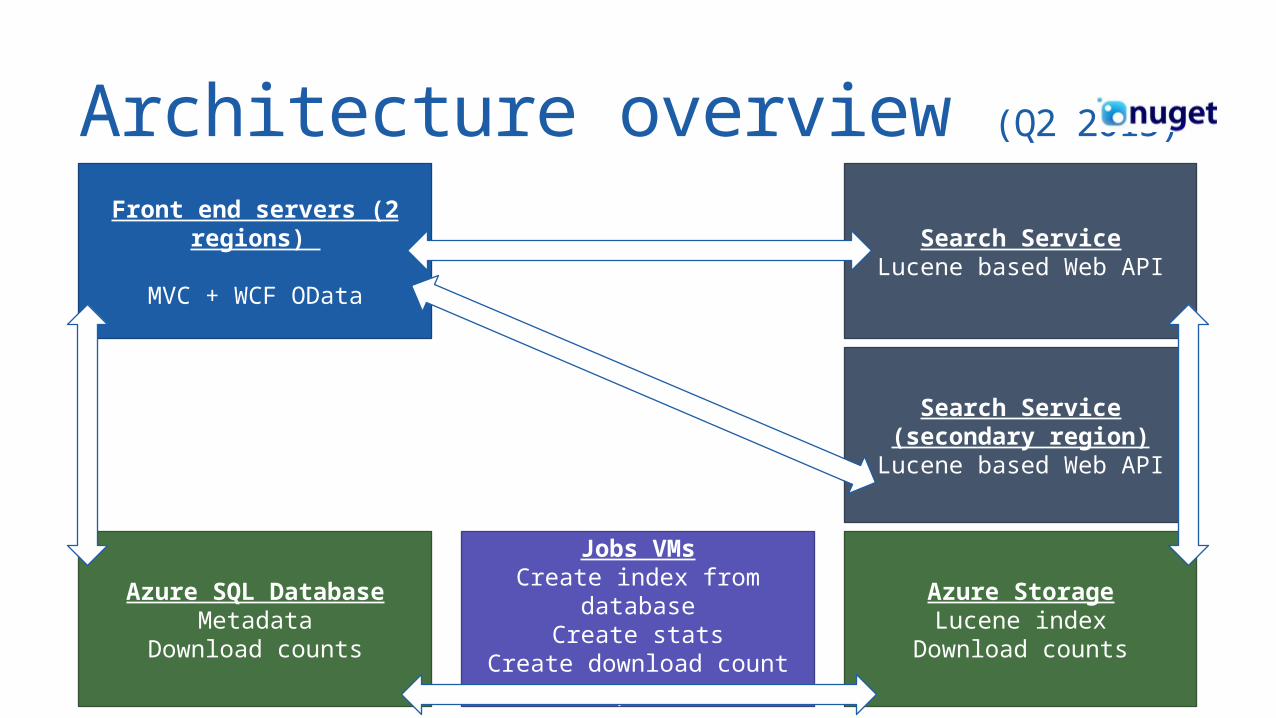
Architecture overview (Q2 2015)
Front end servers (2 regions)
MVC + WCF OData
Search ServiceLucene based Web API
Search Service(secondary region)Lucene based Web API
Azure StorageLucene index
Download counts
Azure SQL DatabaseMetadata
Download counts
Jobs VMsCreate index from
databaseCreate stats
Create download count reports

Did we solve the crime?
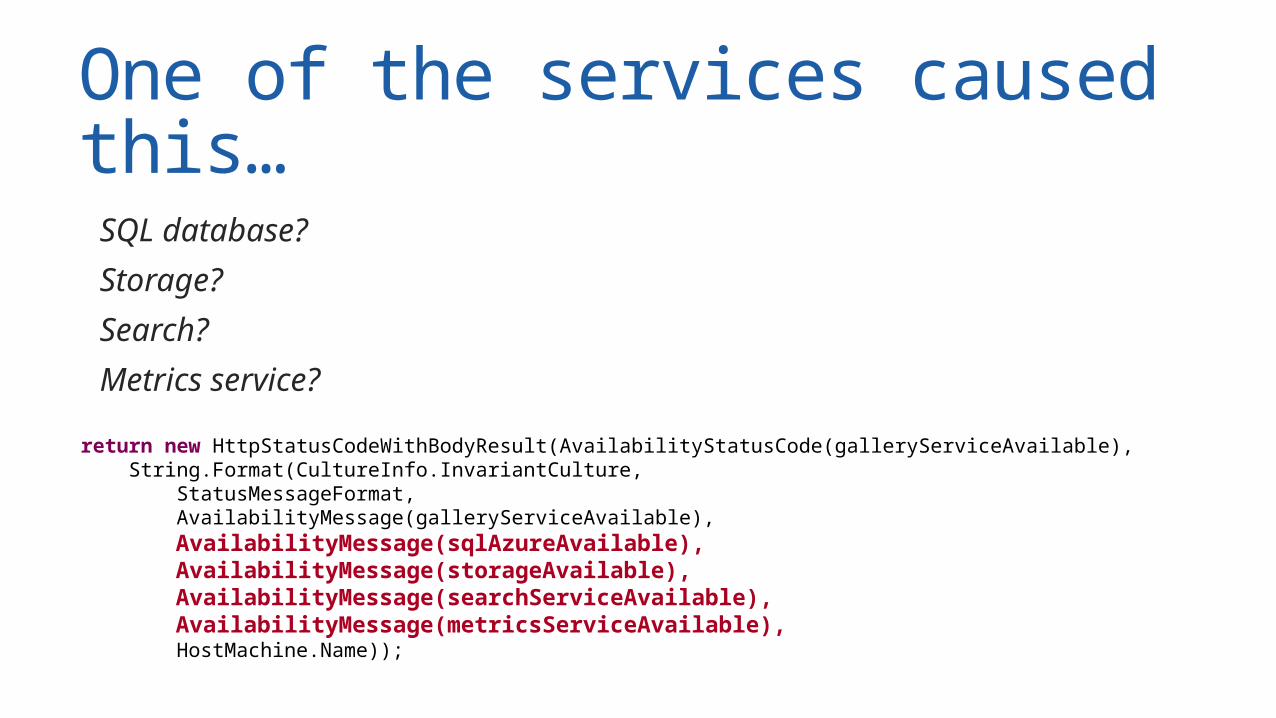
One of the services caused this… SQL database? Storage? Search? Metrics service?
return new HttpStatusCodeWithBodyResult(AvailabilityStatusCode(galleryServiceAvailable), String.Format(CultureInfo.InvariantCulture, StatusMessageFormat, AvailabilityMessage(galleryServiceAvailable), AvailabilityMessage(sqlAzureAvailable), AvailabilityMessage(storageAvailable), AvailabilityMessage(searchServiceAvailable), AvailabilityMessage(metricsServiceAvailable), HostMachine.Name));
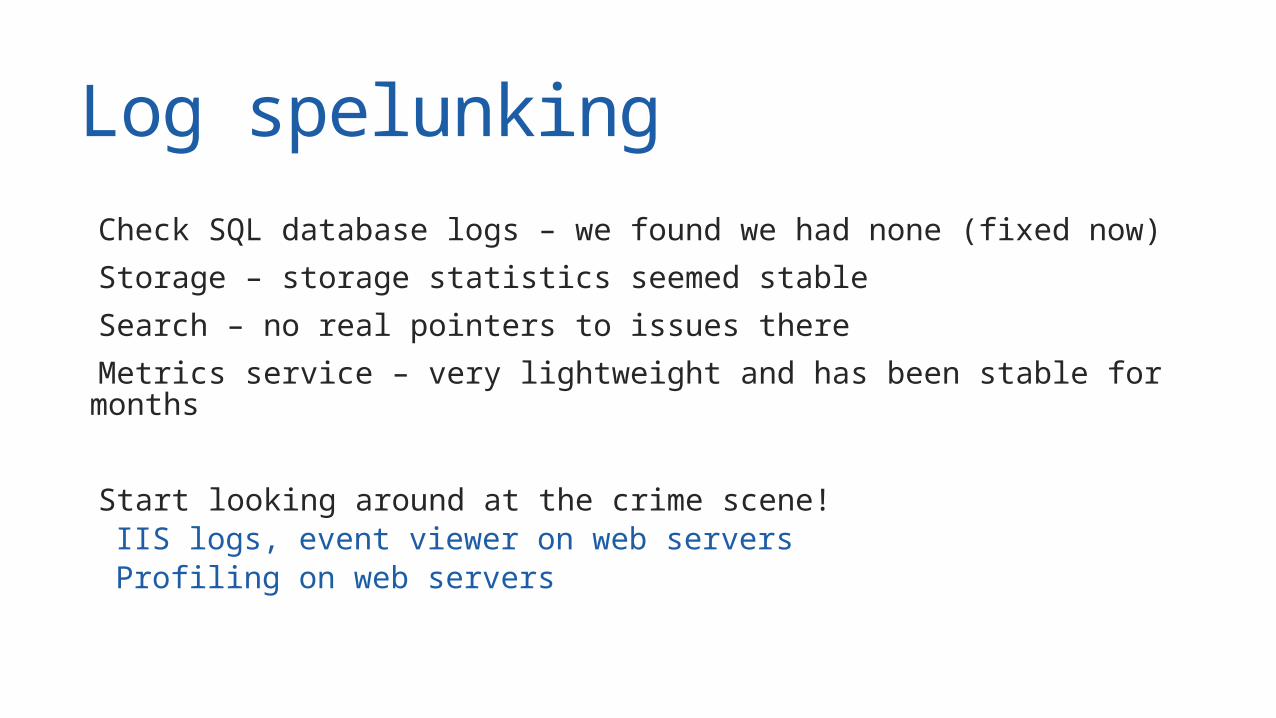
Log spelunking Check SQL database logs – we found we had none (fixed now) Storage – storage statistics seemed stable Search – no real pointers to issues there Metrics service – very lightweight and has been stable for months
Start looking around at the crime scene! IIS logs, event viewer on web servers Profiling on web servers

Profiling the websitedemo

It could have been search...No real evidence though.

Profiling the search servicedemo
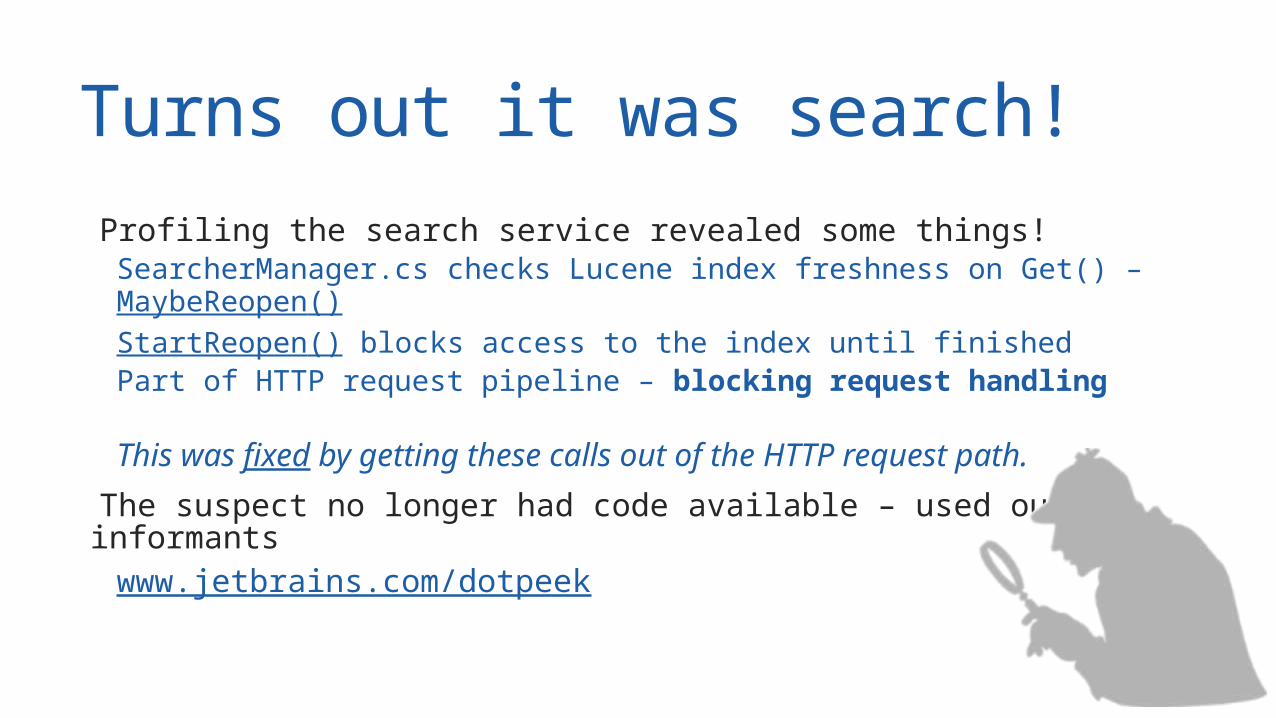
Turns out it was search! Profiling the search service revealed some things! SearcherManager.cs checks Lucene index freshness on Get() –
MaybeReopen() StartReopen() blocks access to the index until finished Part of HTTP request pipeline – blocking request handling
This was fixed by getting these calls out of the HTTP request path. The suspect no longer had code available – used our informants www.jetbrains.com/dotpeek
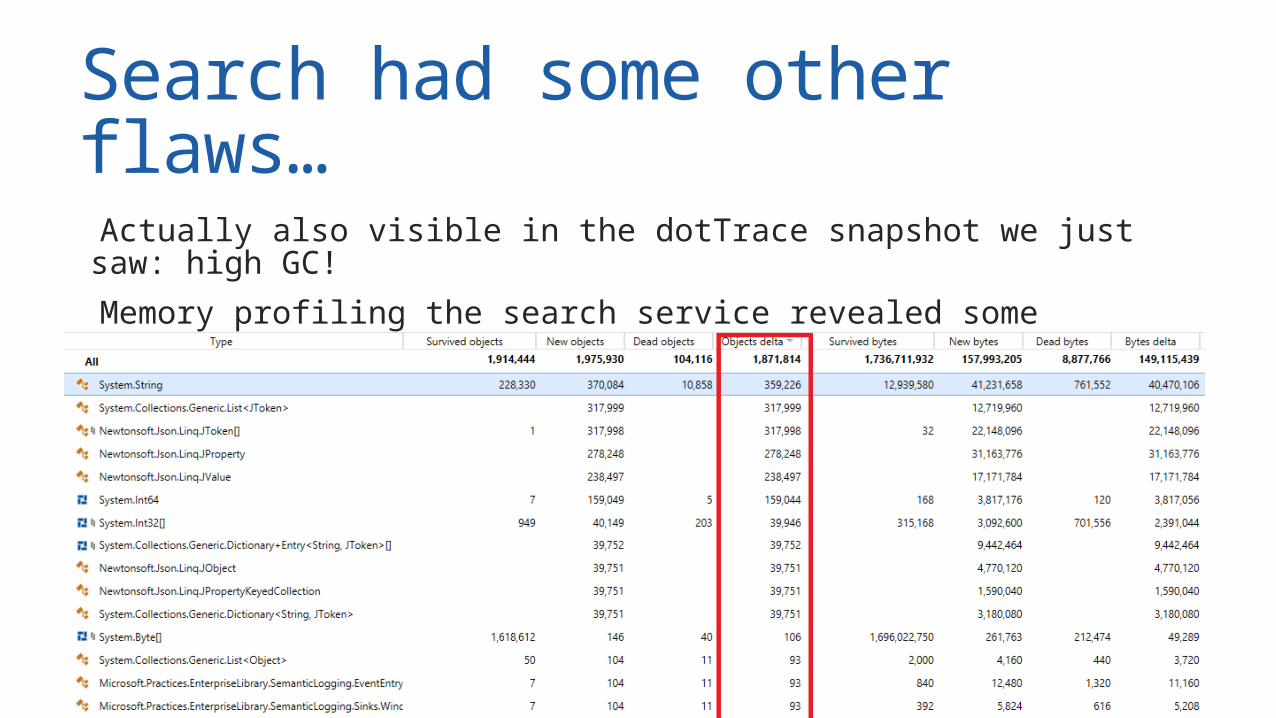
Search had some other flaws… Actually also visible in the dotTrace snapshot we just saw: high GC! Memory profiling the search service revealed some things! (I lost the actual traces )
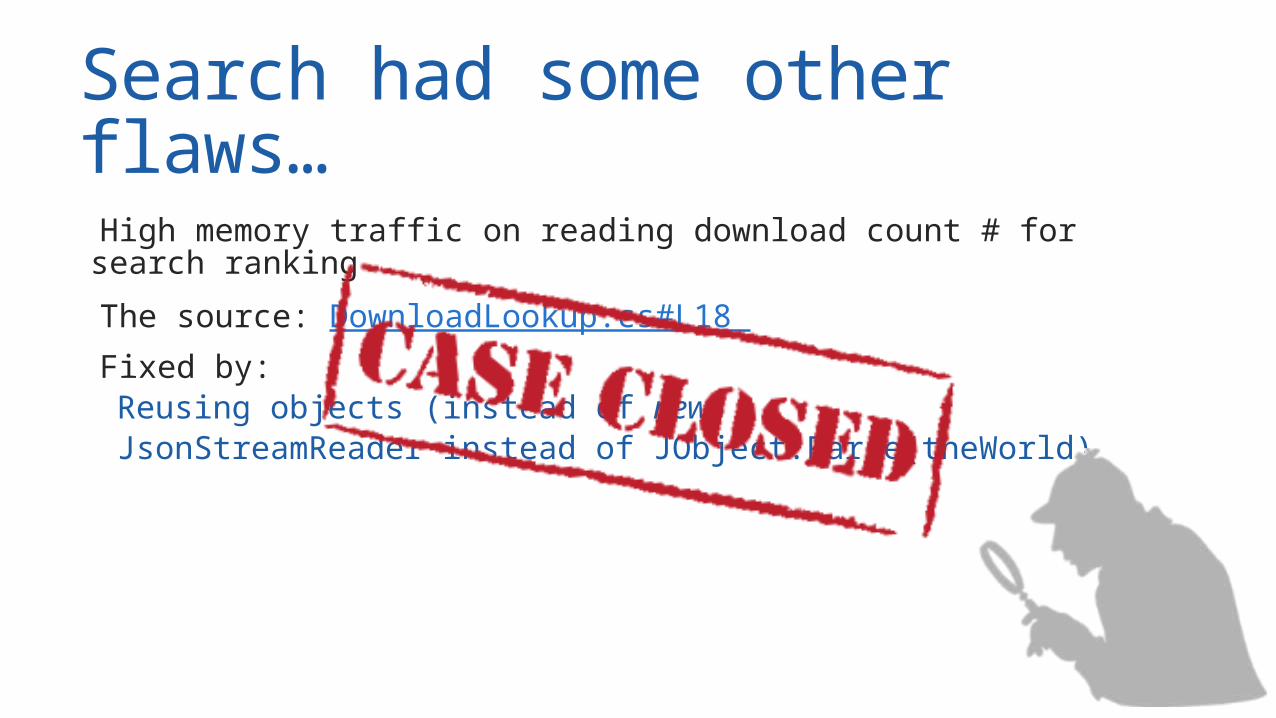
Search had some other flaws… High memory traffic on reading download count # for search ranking
The source: DownloadLookup.cs#L18 Fixed by: Reusing objects (instead of new) JsonStreamReader instead of JObject.Parse(theWorld)
In the meanwhile… Added additional monitoring Added additional tracing Started looking into using AppInsights for better insights into application behavior
Events happening on the website Requests Exceptions Execution and dependency times (basic but continuous profiling)

Internal Server (T)Errorduring package restore
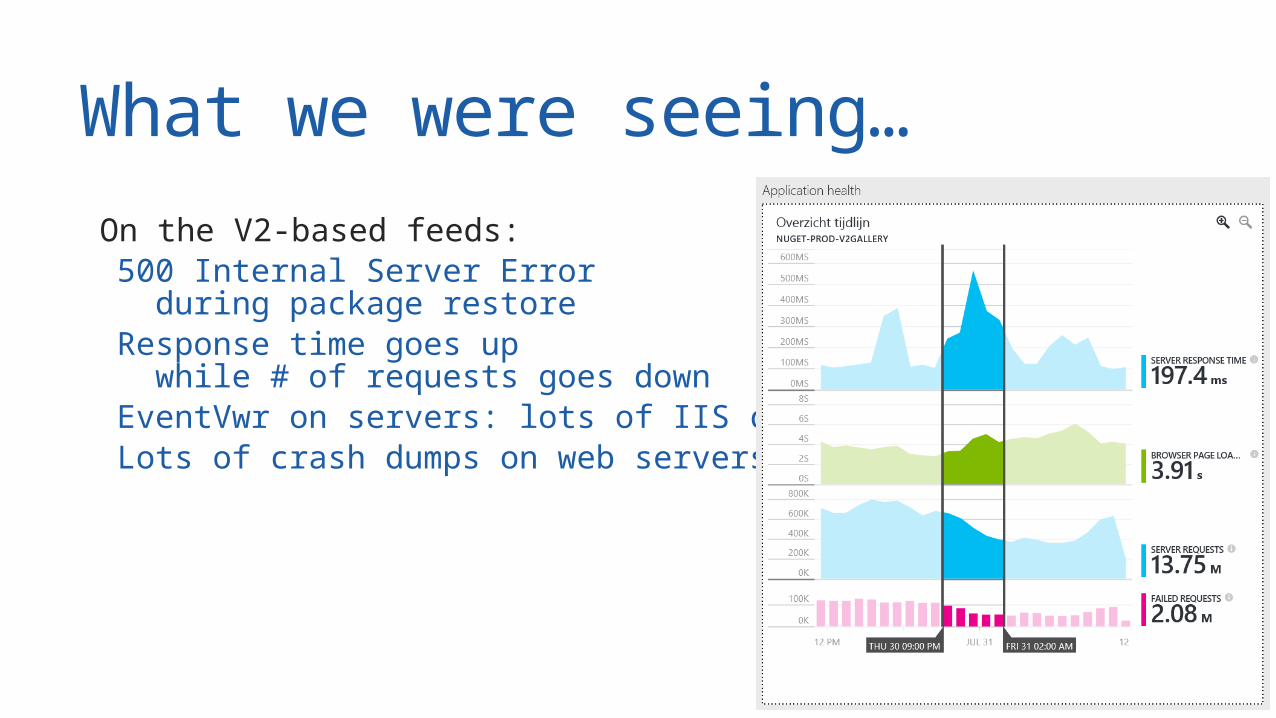
What we were seeing… On the V2-based feeds: 500 Internal Server Error
during package restore Response time goes up
while # of requests goes down EventVwr on servers: lots of IIS crashes Lots of crash dumps on web servers
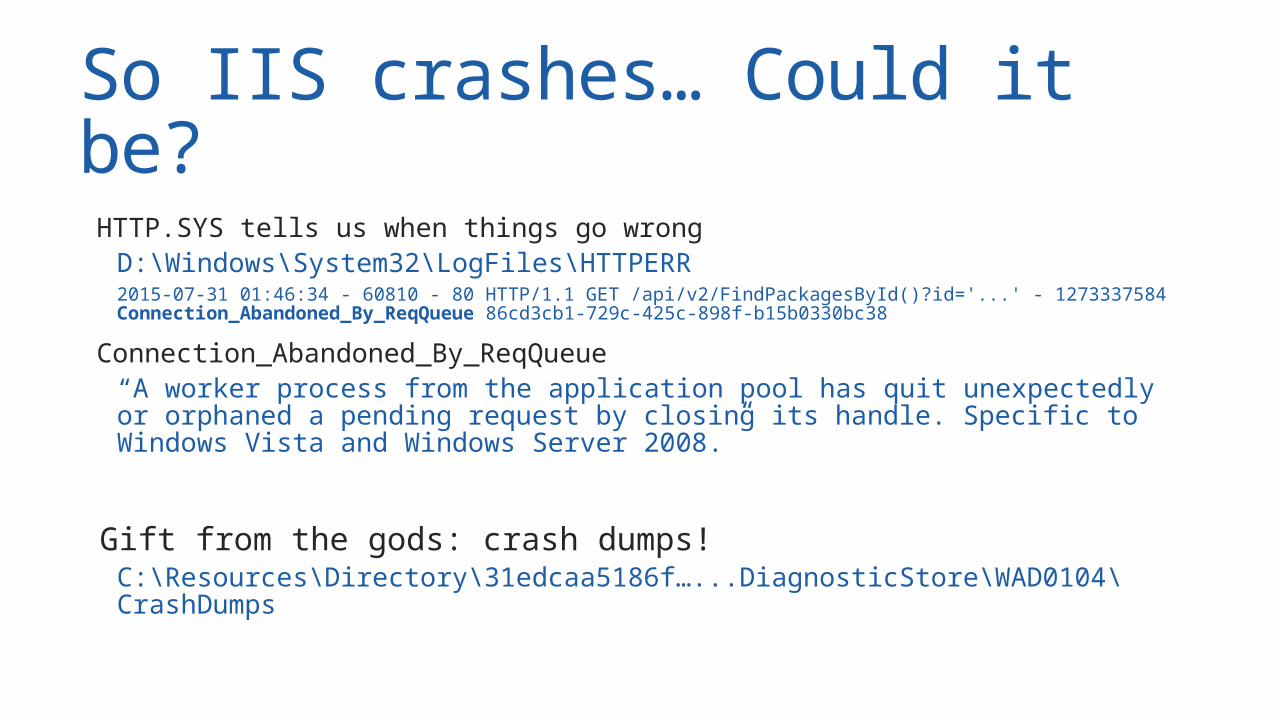
So IIS crashes… Could it be? HTTP.SYS tells us when things go wrong D:\Windows\System32\LogFiles\HTTPERR 2015-07-31 01:46:34 - 60810 - 80 HTTP/1.1 GET /api/v2/FindPackagesById()?id='...' - 1273337584
Connection_Abandoned_By_ReqQueue 86cd3cb1-729c-425c-898f-b15b0330bc38
Connection_Abandoned_By_ReqQueue “A worker process from the application pool has quit unexpectedly or orphaned
a pending request by closing its handle. Specific to Windows Vista and Windows Server 2008.”
Gift from the gods: crash dumps! C:\Resources\Directory\31edcaa5186f…...DiagnosticStore\WAD0104\
CrashDumps

Analyzing a crash dumpdemo
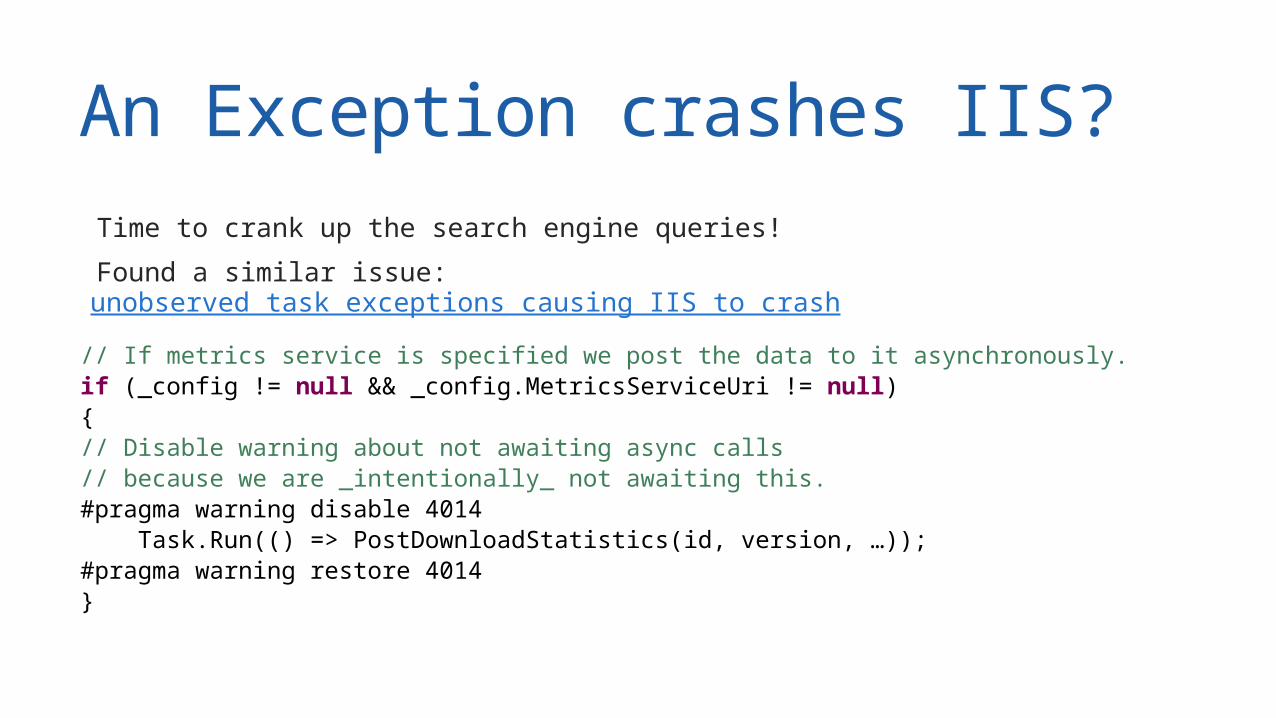
An Exception crashes IIS? Time to crank up the search engine queries! Found a similar issue: unobserved task exceptions causing IIS to crash
// If metrics service is specified we post the data to it asynchronously.if (_config != null && _config.MetricsServiceUri != null){// Disable warning about not awaiting async calls// because we are _intentionally_ not awaiting this.#pragma warning disable 4014 Task.Run(() => PostDownloadStatistics(id, version, …));#pragma warning restore 4014}
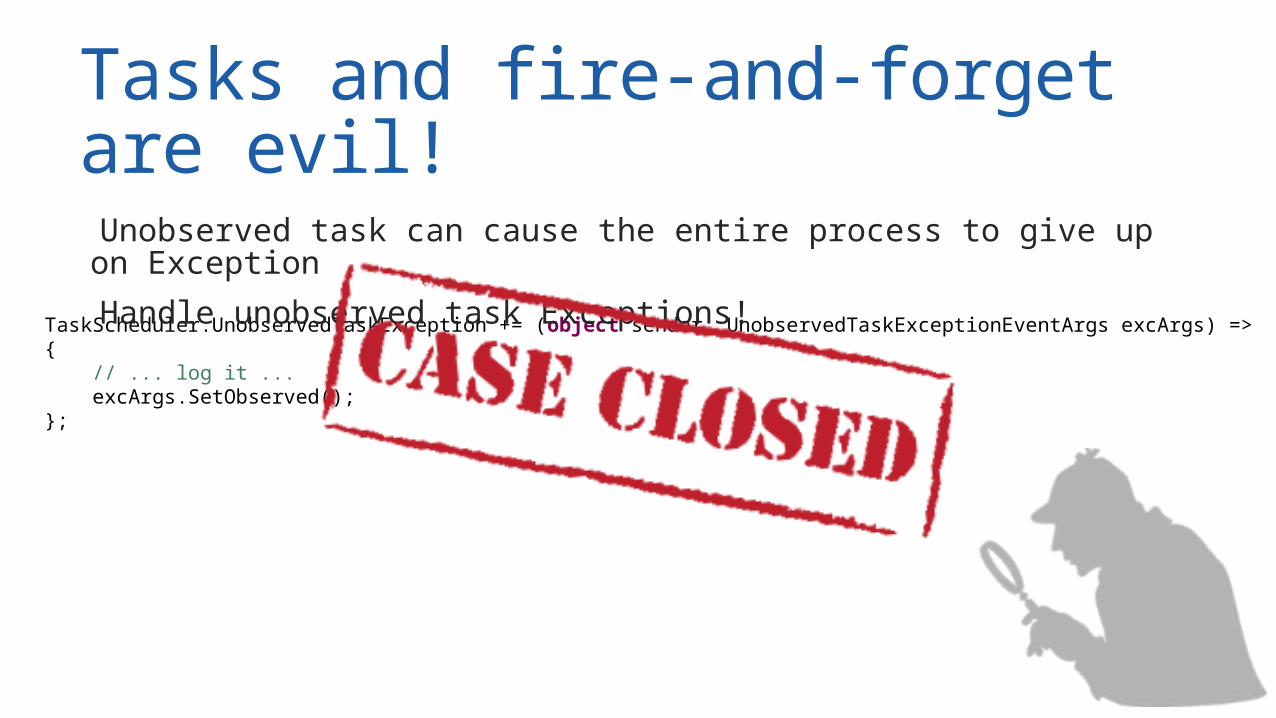
TaskScheduler.UnobservedTaskException += (object sender, UnobservedTaskExceptionEventArgs excArgs) =>{ // ... log it ... excArgs.SetObserved();};
Tasks and fire-and-forget are evil! Unobserved task can cause the entire process to give up on Exception
Handle unobserved task Exceptions!


High response times on the web server
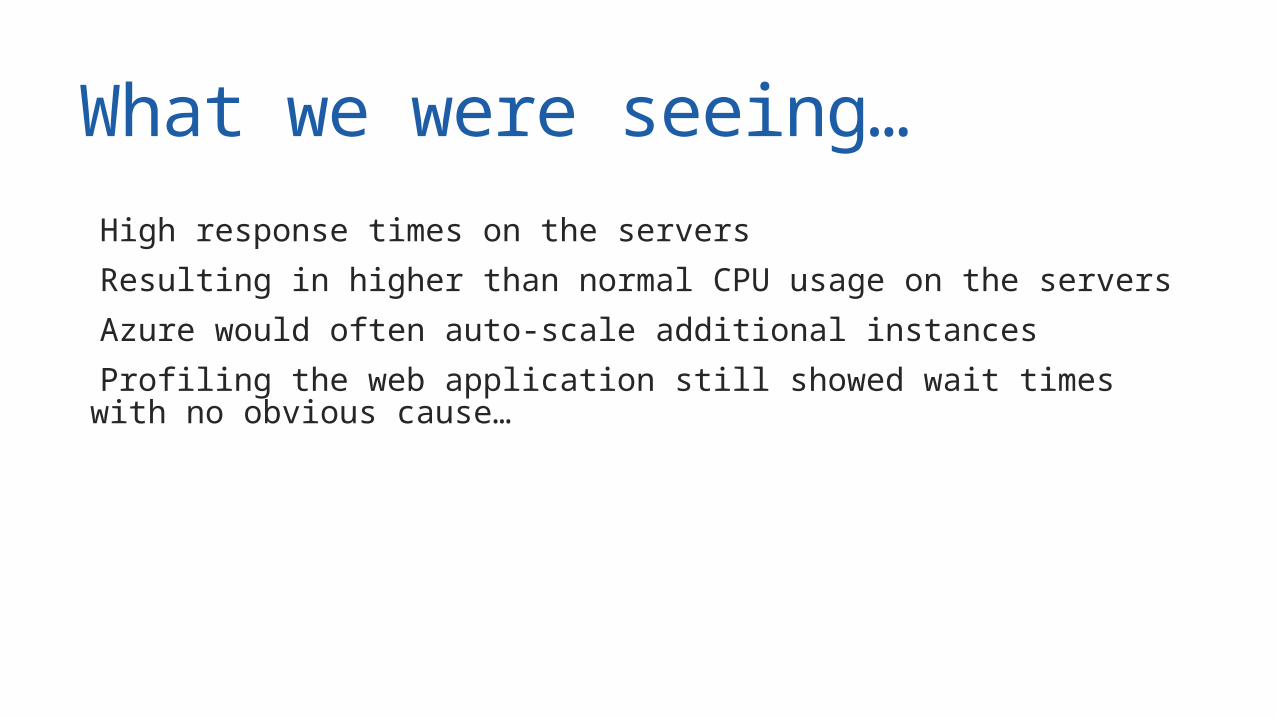
What we were seeing… High response times on the servers Resulting in higher than normal CPU usage on the servers Azure would often auto-scale additional instances Profiling the web application still showed wait times with no obvious cause…

Eating donuts
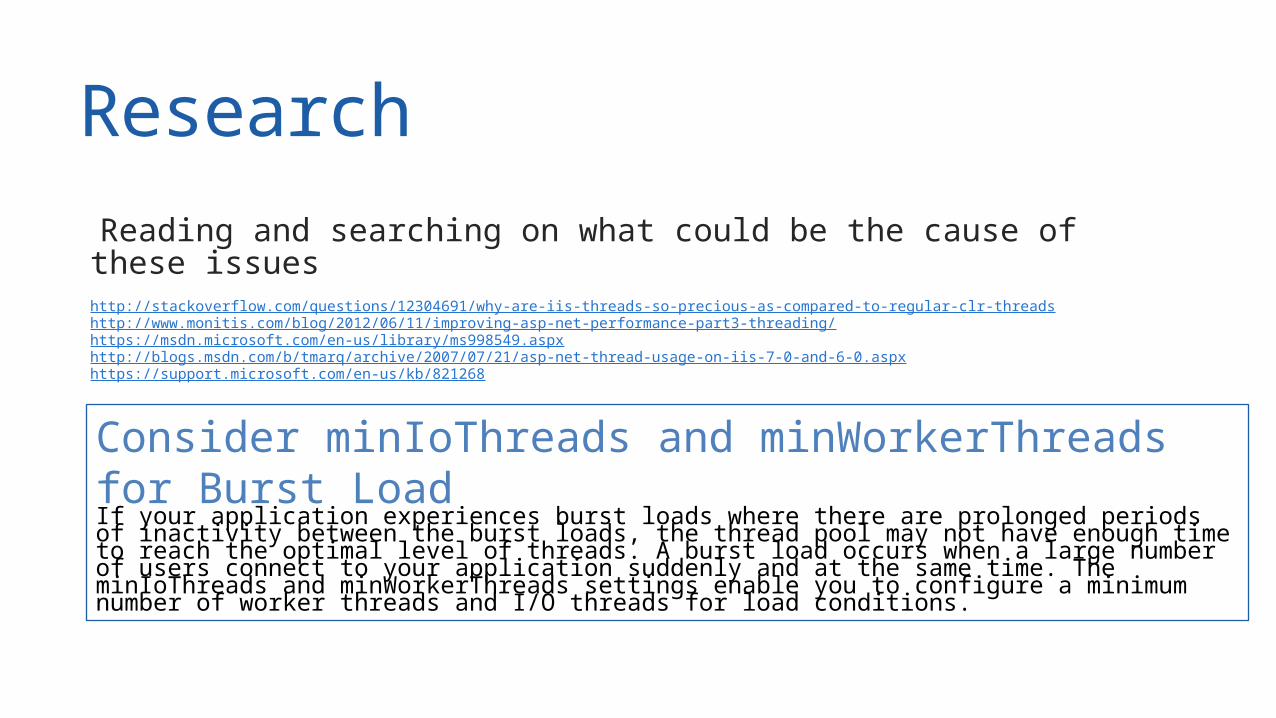
Research Reading and searching on what could be the cause of these issues http://stackoverflow.com/questions/12304691/why-are-iis-threads-so-precious-as-compared-to-regular-clr-threads
http://www.monitis.com/blog/2012/06/11/improving-asp-net-performance-part3-threading/ https://msdn.microsoft.com/en-us/library/ms998549.aspx http://blogs.msdn.com/b/tmarq/archive/2007/07/21/asp-net-thread-usage-on-iis-7-0-and-6-0.aspxhttps://support.microsoft.com/en-us/kb/821268
Consider minIoThreads and minWorkerThreads for Burst LoadIf your application experiences burst loads where there are prolonged periods of inactivity between the burst loads, the thread pool may not have enough time to reach the optimal level of threads. A burst load occurs when a large number of users connect to your application suddenly and at the same time. The minIoThreads and minWorkerThreads settings enable you to configure a minimum number of worker threads and I/O threads for load conditions.
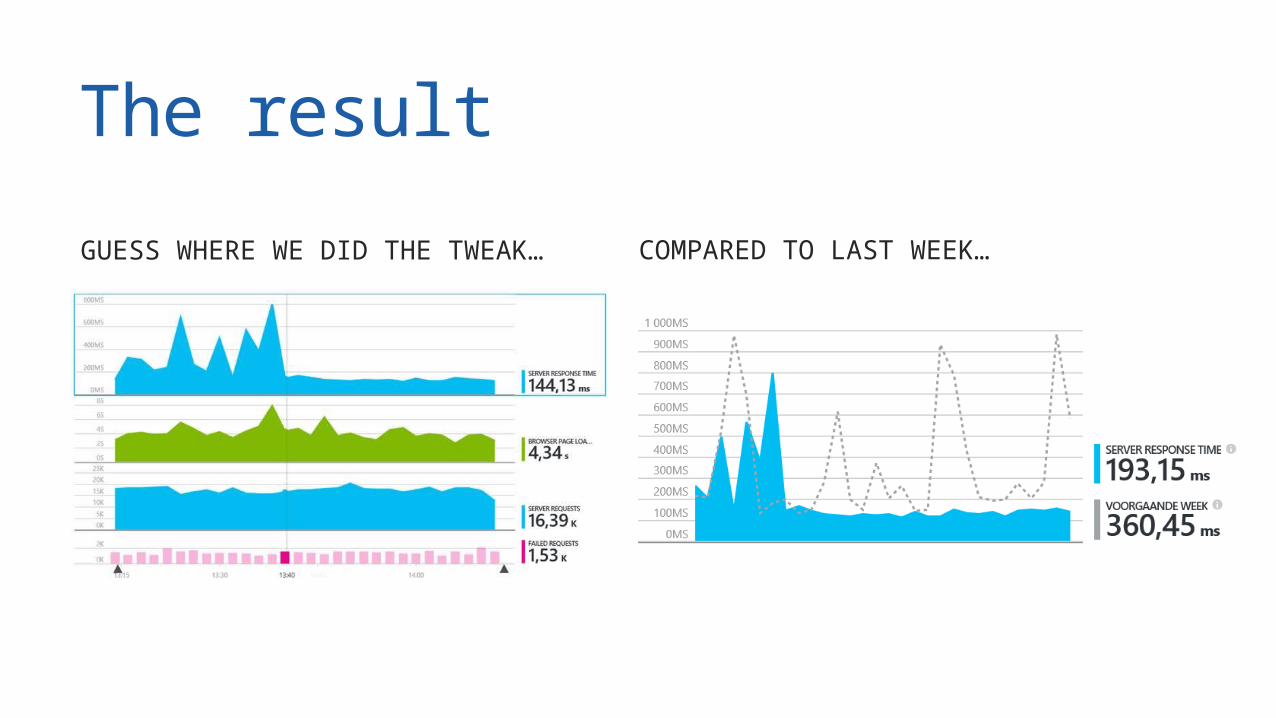
The resultGUESS WHERE WE DID THE TWEAK… COMPARED TO LAST WEEK…
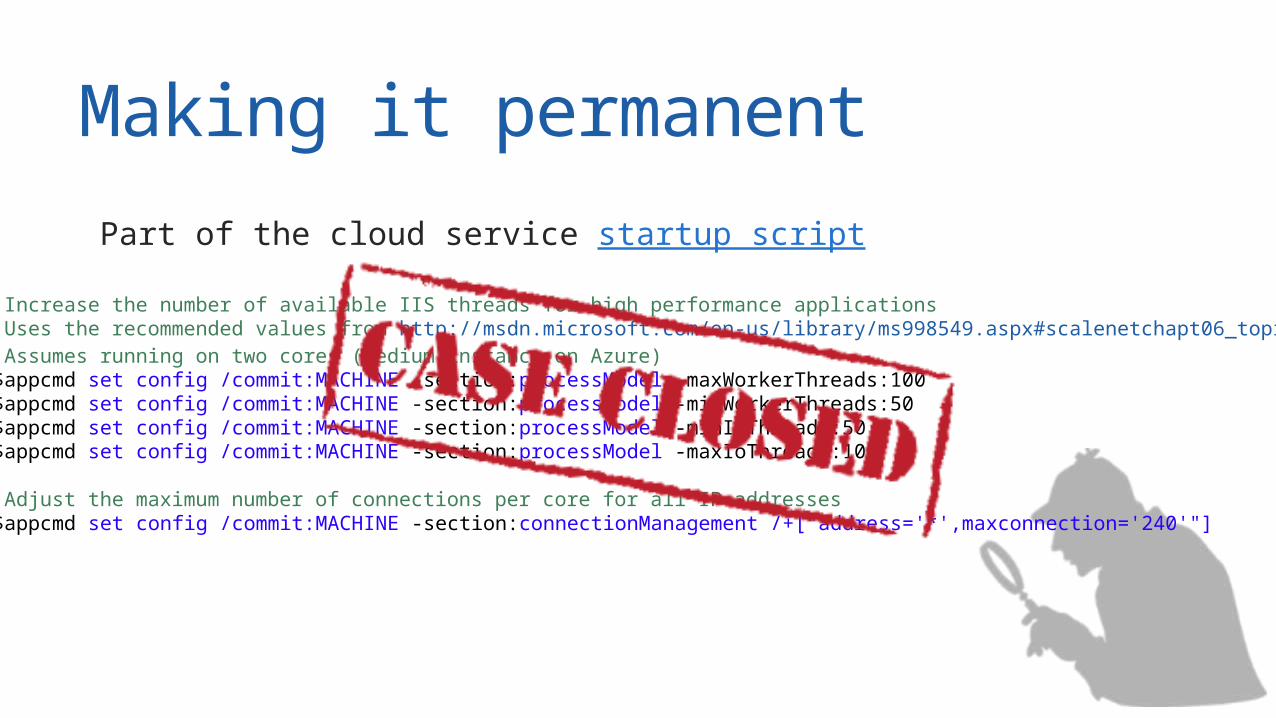
Making it permanent Part of the cloud service startup script
# Increase the number of available IIS threads for high performance applications# Uses the recommended values from http://msdn.microsoft.com/en-us/library/ms998549.aspx#scalenetchapt06_topic8# Assumes running on two cores (medium instance on Azure)&$appcmd set config /commit:MACHINE -section:processModel -maxWorkerThreads:100&$appcmd set config /commit:MACHINE -section:processModel -minWorkerThreads:50&$appcmd set config /commit:MACHINE -section:processModel -minIoThreads:50&$appcmd set config /commit:MACHINE -section:processModel -maxIoThreads:100
# Adjust the maximum number of connections per core for all IP addresses&$appcmd set config /commit:MACHINE -section:connectionManagement /+["address='*',maxconnection='240'"]

Package restore timeouts
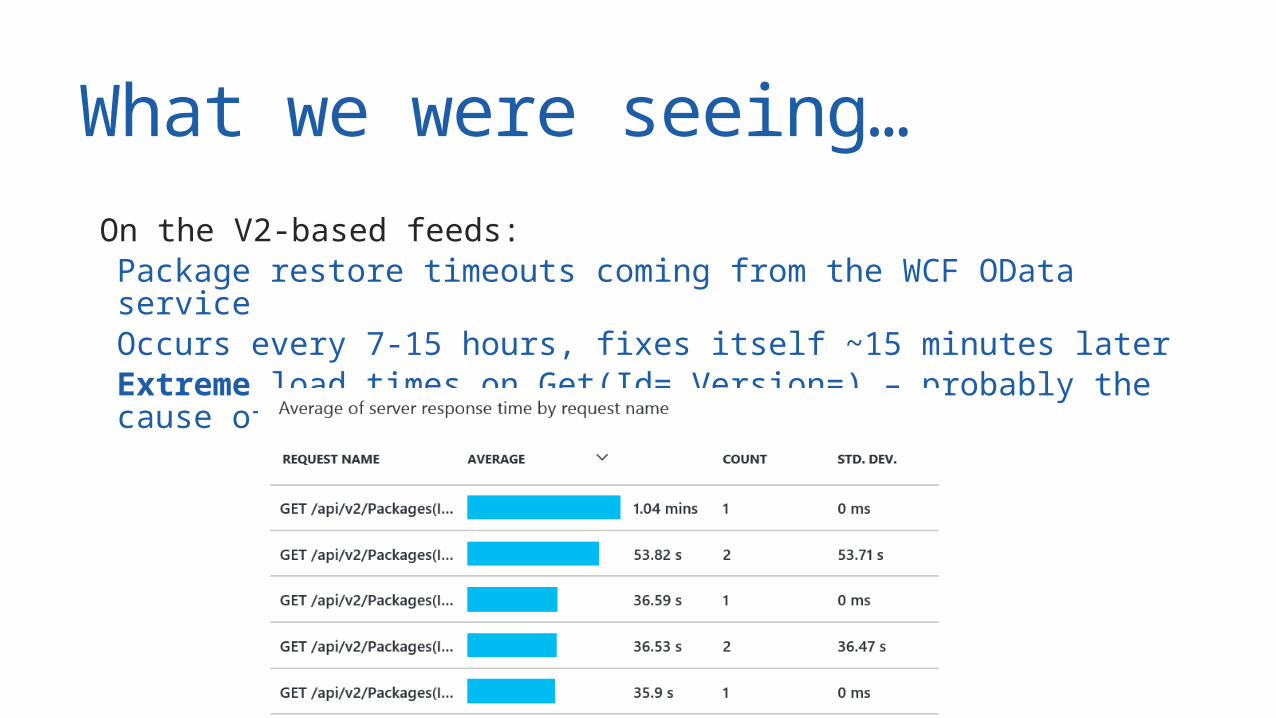
What we were seeing… On the V2-based feeds: Package restore timeouts coming from the WCF OData service Occurs every 7-15 hours, fixes itself ~15 minutes later Extreme load times on Get(Id=,Version=) – probably the cause of
these timeouts
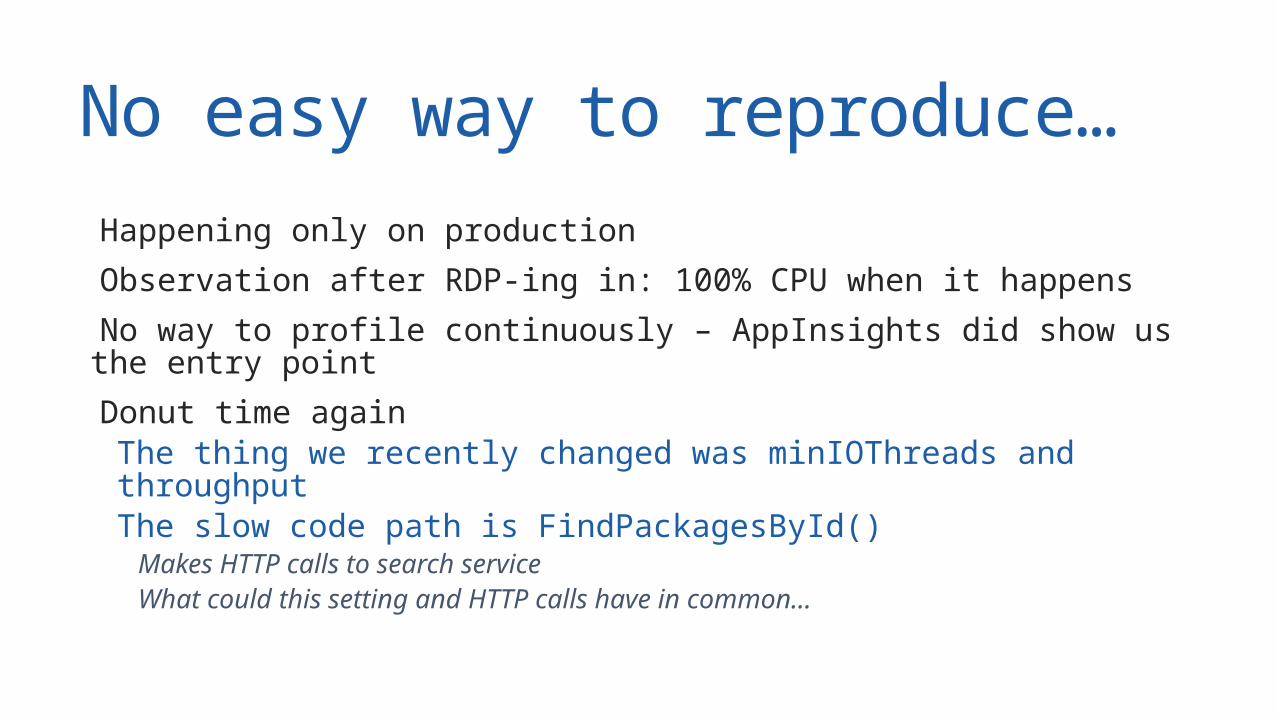
No easy way to reproduce… Happening only on production Observation after RDP-ing in: 100% CPU when it happens No way to profile continuously – AppInsights did show us the entry point
Donut time again The thing we recently changed was minIOThreads and throughput The slow code path is FindPackagesById() Makes HTTP calls to search service What could this setting and HTTP calls have in common…
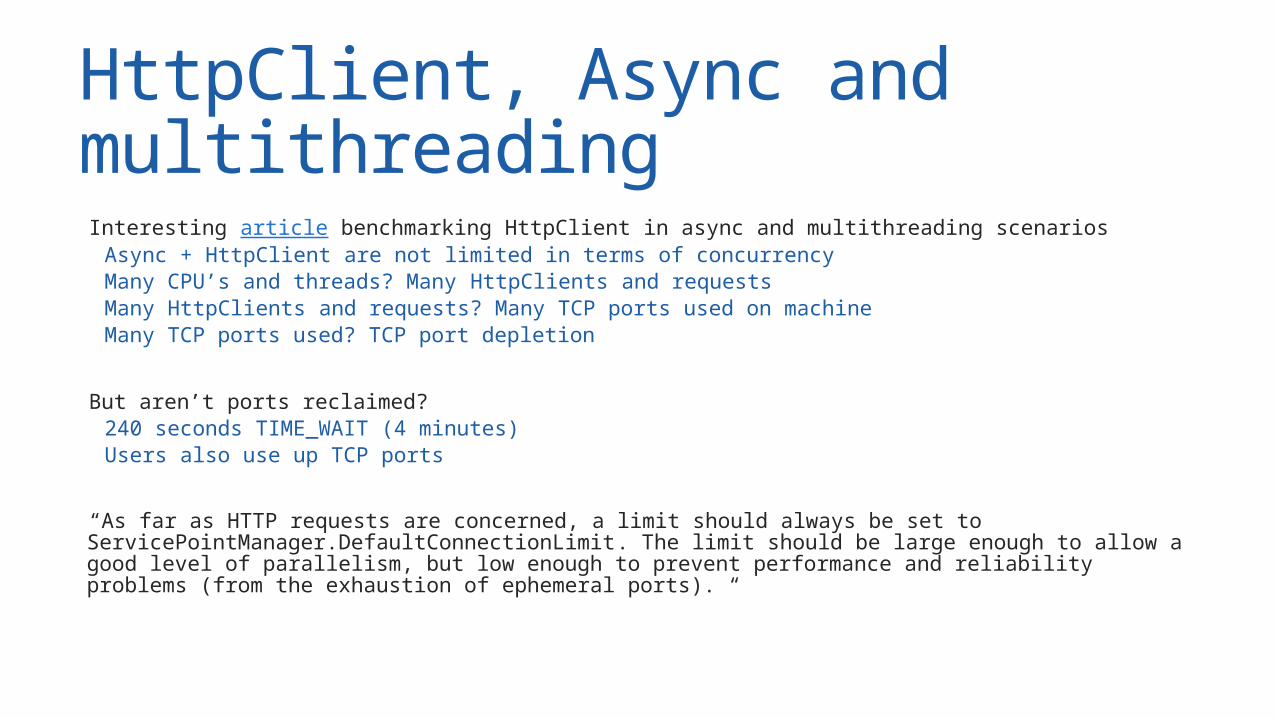
HttpClient, Async and multithreading Interesting article benchmarking HttpClient in async and multithreading scenarios Async + HttpClient are not limited in terms of concurrency Many CPU’s and threads? Many HttpClients and requests Many HttpClients and requests? Many TCP ports used on machine Many TCP ports used? TCP port depletion
But aren’t ports reclaimed? 240 seconds TIME_WAIT (4 minutes) Users also use up TCP ports
“As far as HTTP requests are concerned, a limit should always be set to ServicePointManager.DefaultConnectionLimit. The limit should be large enough to allow a good level of parallelism, but low enough to prevent performance and reliability problems (from the exhaustion of ephemeral ports). “
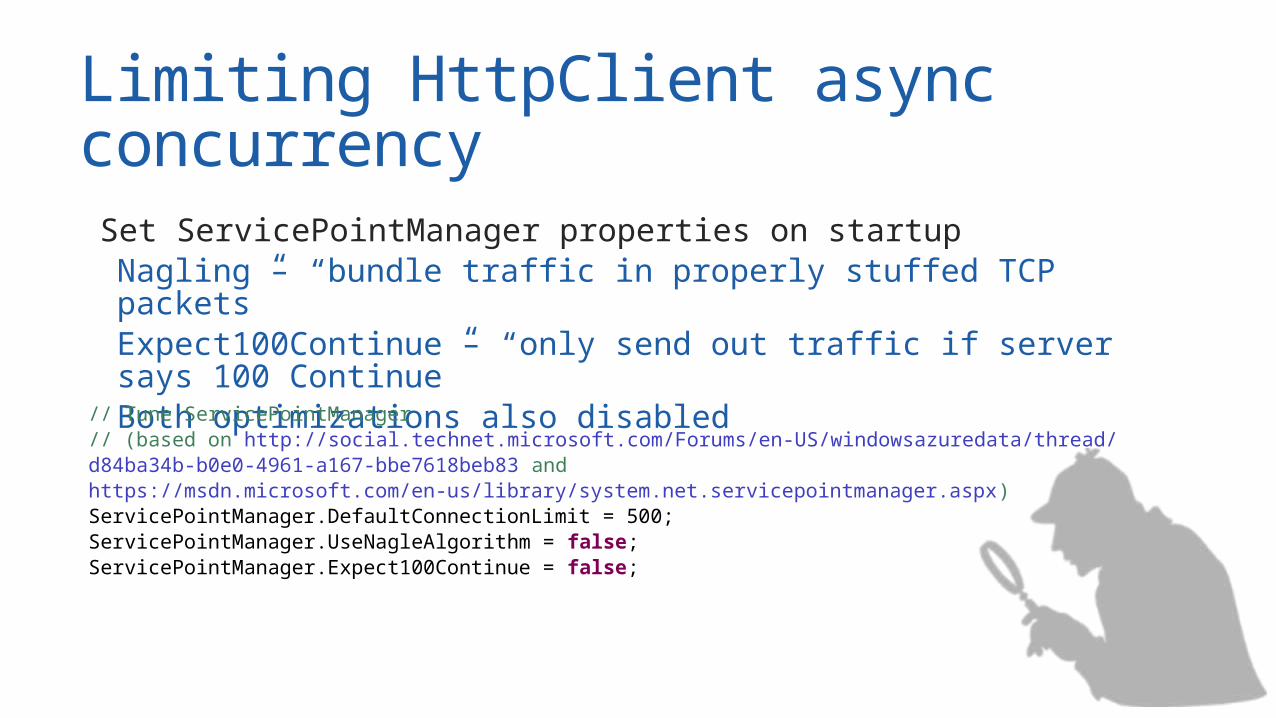
Limiting HttpClient async concurrency Set ServicePointManager properties on startup Nagling – “bundle traffic in properly stuffed TCP packets” Expect100Continue – “only send out traffic if server says 100
Continue” Both optimizations also disabled// Tune ServicePointManager// (based on http://social.technet.microsoft.com/Forums/en-US/windowsazuredata/thread/d84ba34b-b0e0-4961-a167-bbe7618beb83 and https://msdn.microsoft.com/en-us/library/system.net.servicepointmanager.aspx)ServicePointManager.DefaultConnectionLimit = 500;ServicePointManager.UseNagleAlgorithm = false;ServicePointManager.Expect100Continue = false;
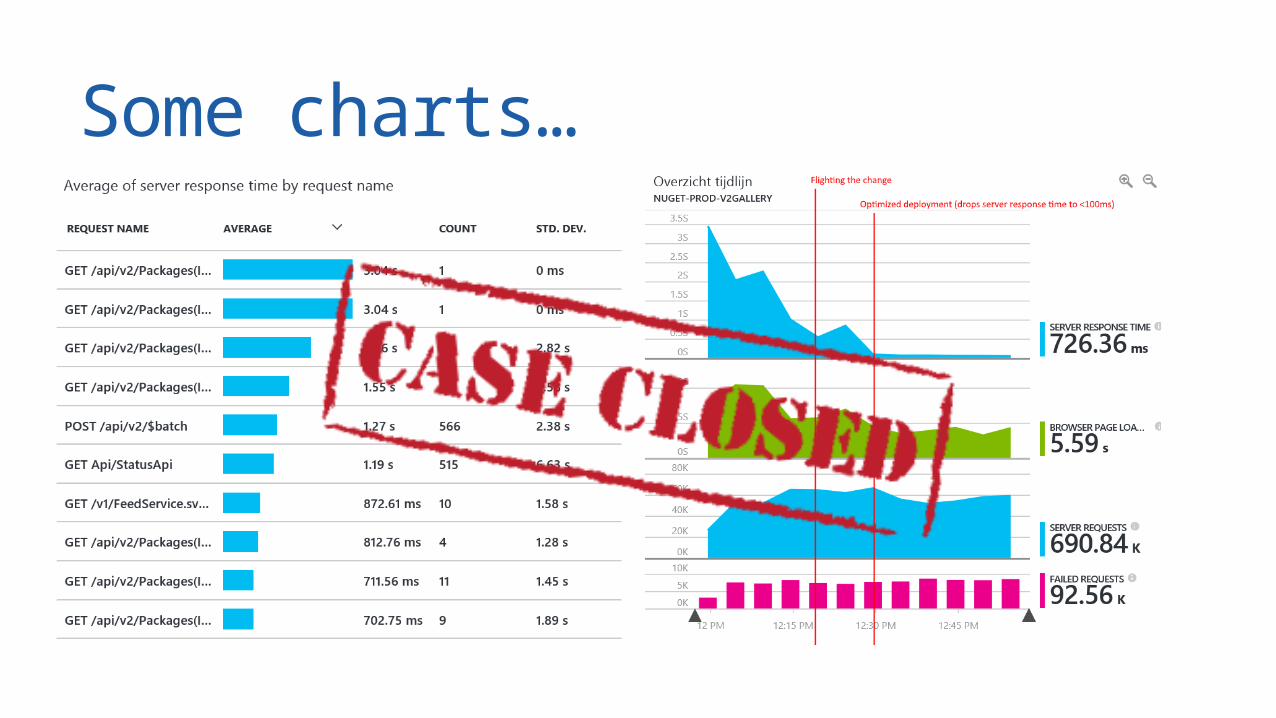
Some charts…

Memory pressure

What we were seeing… Massive memory usage! Even when changing VM sizes. 100% of memory on a Medium Azure instance 100% of memory on a Large Azure instance 100% of memory on a X-Large Azure instance
What is eating this memory? Memory profiling! On the server? Try to reproduce it? Decided on the latter

Reproducing production trafficdemo
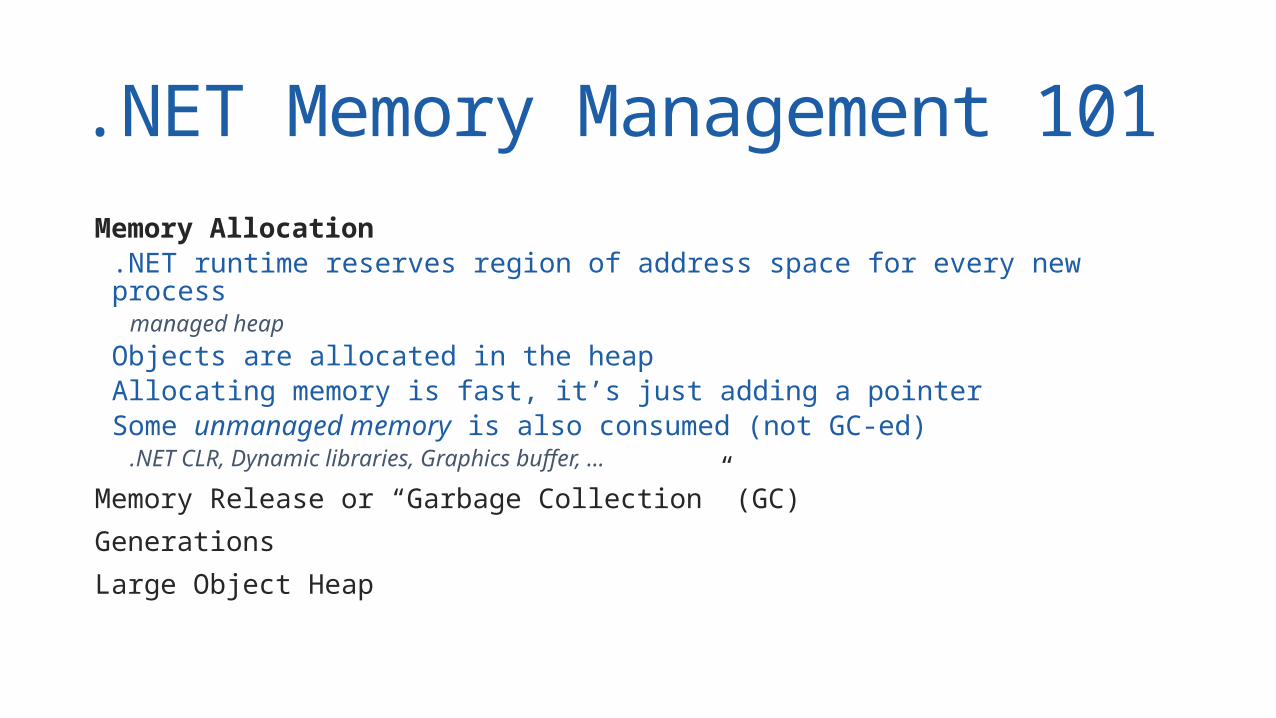
.NET Memory Management 101 Memory Allocation .NET runtime reserves region of address space for every new process managed heap Objects are allocated in the heap Allocating memory is fast, it’s just adding a pointer Some unmanaged memory is also consumed (not GC-ed) .NET CLR, Dynamic libraries, Graphics buffer, …
Memory Release or “Garbage Collection” (GC) Generations Large Object Heap

.NET Memory Management 101 Memory Allocation Memory Release or “Garbage Collection” (GC) GC releases objects no longer in use by examining application roots GC builds a graph that contains all the objects that are reachable from
these roots. Object unreachable? GC removes the object from the heap, releasing
memory After the object is removed, GC compacts reachable objects in memory. Generations Large Object Heap
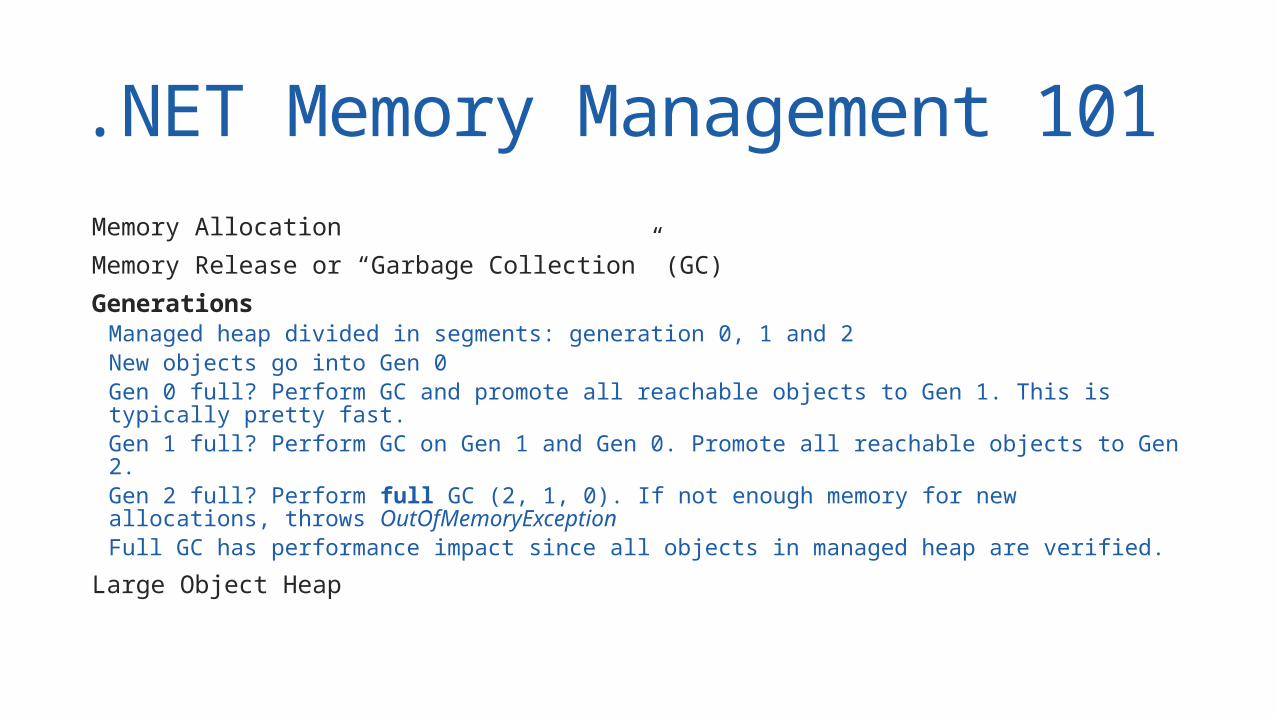
.NET Memory Management 101 Memory Allocation Memory Release or “Garbage Collection” (GC) Generations Managed heap divided in segments: generation 0, 1 and 2 New objects go into Gen 0 Gen 0 full? Perform GC and promote all reachable objects to Gen 1. This is typically
pretty fast. Gen 1 full? Perform GC on Gen 1 and Gen 0. Promote all reachable objects to Gen 2. Gen 2 full? Perform full GC (2, 1, 0). If not enough memory for new allocations, throws
OutOfMemoryException Full GC has performance impact since all objects in managed heap are verified. Large Object Heap
.NET Memory Management 101 Memory Allocation Memory Release or “Garbage Collection” (GC) Generations
Large Object Heap
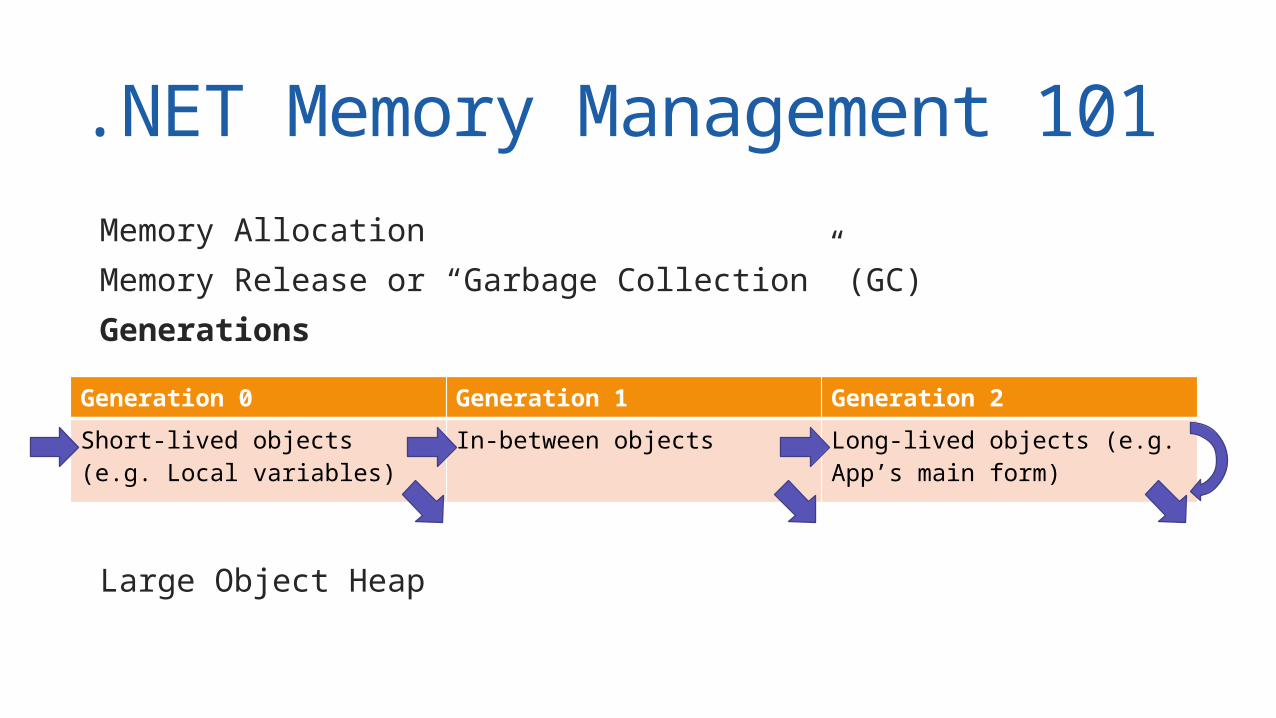
Generation 0 Generation 1 Generation 2Short-lived objects (e.g. Local variables)
In-between objects Long-lived objects (e.g. App’s main form)
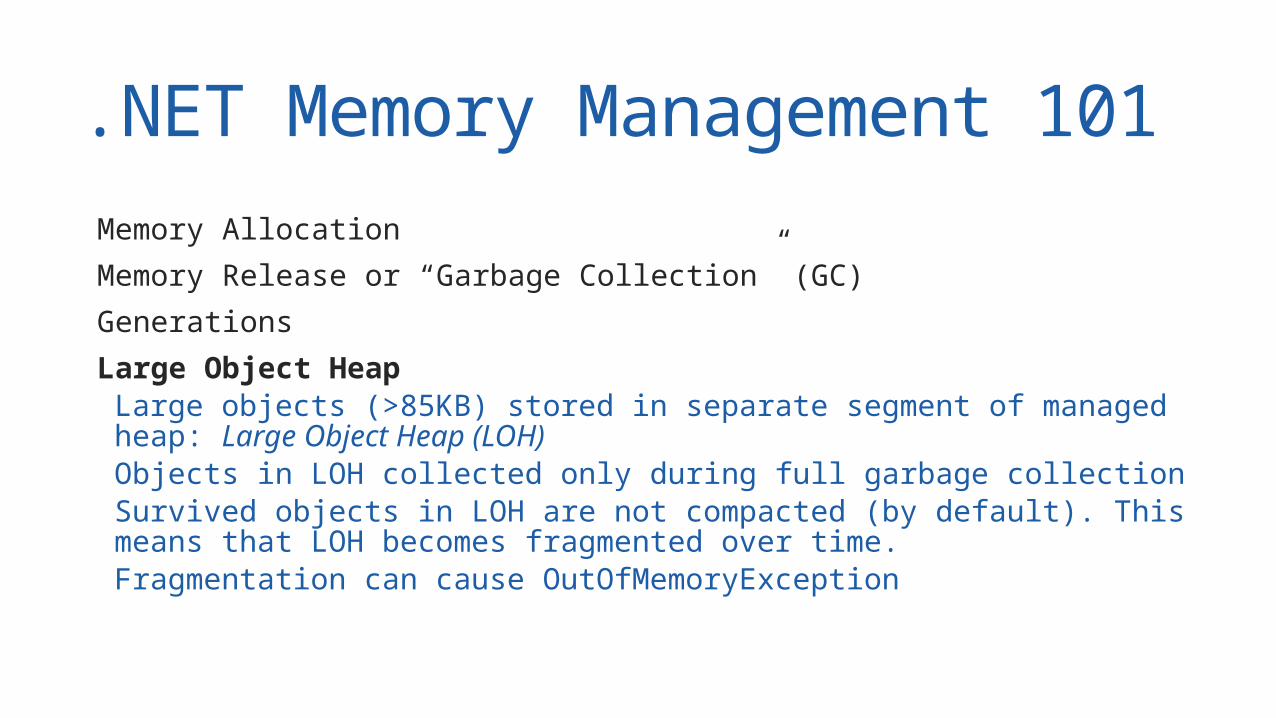
.NET Memory Management 101 Memory Allocation Memory Release or “Garbage Collection” (GC) Generations Large Object Heap Large objects (>85KB) stored in separate segment of managed
heap: Large Object Heap (LOH) Objects in LOH collected only during full garbage collection Survived objects in LOH are not compacted (by default). This means
that LOH becomes fragmented over time. Fragmentation can cause OutOfMemoryException
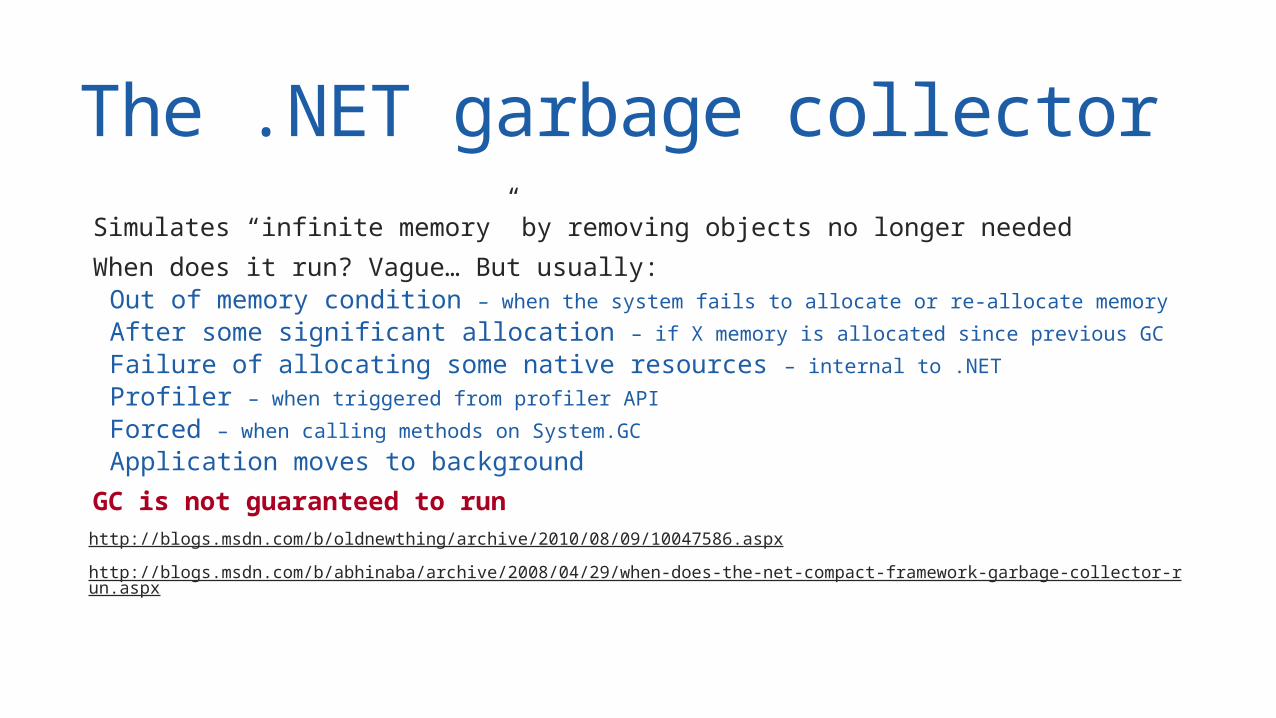
The .NET garbage collector Simulates “infinite memory” by removing objects no longer needed When does it run? Vague… But usually: Out of memory condition – when the system fails to allocate or re-allocate memory After some significant allocation – if X memory is allocated since previous GC Failure of allocating some native resources – internal to .NET Profiler – when triggered from profiler API Forced – when calling methods on System.GC Application moves to background GC is not guaranteed to run http://blogs.msdn.com/b/oldnewthing/archive/2010/08/09/10047586.aspx http://blogs.msdn.com/b/abhinaba/archive/2008/04/29/when-does-the-net-compact-framework-garbage-collector-run.aspx

Analyzing memory usagedemo
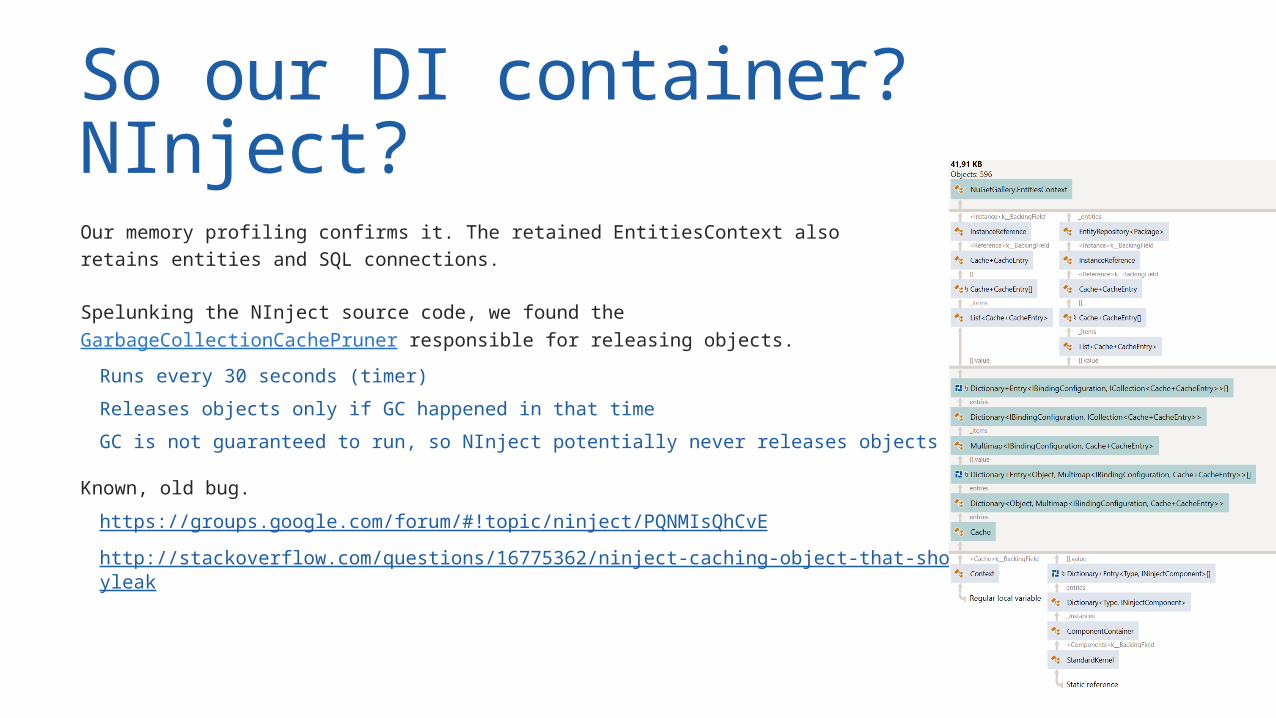
So our DI container? NInject?Our memory profiling confirms it. The retained EntitiesContext alsoretains entities and SQL connections.
Spelunking the NInject source code, we found theGarbageCollectionCachePruner responsible for releasing objects.
Runs every 30 seconds (timer)Releases objects only if GC happened in that timeGC is not guaranteed to run, so NInject potentially never releases objects
Known, old bug.https://groups.google.com/forum/#!topic/ninject/PQNMIsQhCvE http://stackoverflow.com/questions/16775362/ninject-caching-object-that-should-be-disposed-memoryleak
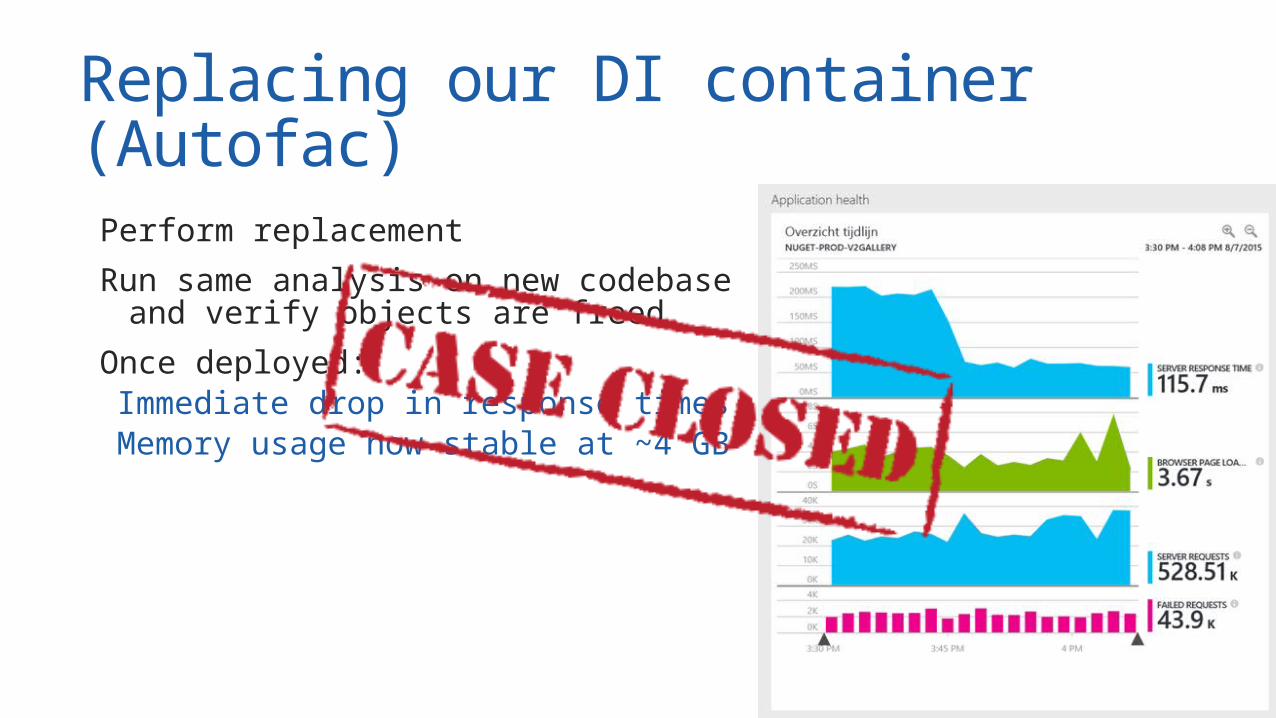
Replacing our DI container (Autofac) Perform replacement Run same analysis on new codebase and verify objects are freed
Once deployed: Immediate drop in response times Memory usage now stable at ~4 GB

Conclusion
Conclusion Debugging requires a particular sympathy for the machine. You must be able to run the machine and networks of machines in your mind while simulating what-ifs based on mere wisps of insight.
Bugs hide. They blend in. They can pass for "normal" which makes them tough to find. One bug off the streets doesn’t mean all of them are gone. Sometimes one gone exposes another.
Know your system, know your tools, know your options. Look for evidence. Profilers (performance and memory), dump files, AppInsights and others Dive in. It builds experience and makes solving the next crime scene easier. https://msdn.microsoft.com/en-us/library/ee817663.aspx

Thank you!http://blog.maartenballiauw.be@maartenballiauwhttp://amzn.to/pronuget2