sheredos and bechtel.imagining mechanisms.4.0 + …philsci-archive.pitt.edu/12213/1/sheredos and...
TRANSCRIPT

Imagining Mechanisms with Diagrams
Benjamin Sheredos and William Bechtel 1. Introduction Discovery of mechanisms has figured prominently in accounts of mechanistic explanation (Bechtel & Richardson, 1993/2010; Bechtel, 2006; Craver & Darden, 2013). Much of the discussion has focused on the experimental procedures researchers use to delineate the phenomenon to be explained and to characterize the parts and operations included in a mechanism. Craver and Darden (2013) emphasize a variety of evidential constraints (many generated through experiments of various types) concerning the location and structure of a mechanism's components, the abilities of the components and the activities in which they participate, temporal features of activities, and the need to maintain productive continuity between activities. They also identify a variety of inference strategies such as employing a schema type, invoking an analogy, or forward/backward chaining. But behind all this, there is a further critical aspect of the discovery process—the activities of the scientists in putting the pieces together into a mechanistic hypothesis. As important as the constraints and strategies are, they typically do not completely dictate the design of the mechanism. And crucially, it is the scientists who impose the constraints, and the constraints are imposed upon their own understanding of the mechanism, embodied in what Craver and Darden call mechanism schemas (2013, ch.7). A robust philosophy of mechanistic science should not only assume that scientists fill this lacuna between available constraints (often derived from experiments) and proposals of mechanisms, but should offer an account of the cognitive activity involved in constructing mechanistic proposals. This activity produces hypotheses of possible mechanisms. Craver and Darden make much of the distinction between how-‐possibly and how-‐actually accounts of mechanisms. In their treatment, how-‐possibly accounts are regarded as valuable to the extent that they serve as heuristics, and facilitate the design of experiments, which eventually enable the development of how-‐actually accounts. Our focus lies elsewhere: in understanding the success involved in attaining how-‐possibly accounts, without treating them simply as means to the ultimate end of how-‐actually accounts. Often, scientists advance how-‐possibly explanations before they are in any position to evaluate experimentally what is actual. Here we provide an account of this epistemic activity. Its central features are that it often involves visualization, it is creative in going beyond the given evidence and existing accounts, it is fictive in the sense of not entailing a commitment at the outset to the actuality of the results, and it allows for constrained flexibility in generating a design. In light of these features, we say that such reasoning processes are imaginative. Although researchers might aspire to an account of the actual mechanism responsible for a phenomenon, a fundamental part of their reasoning involves the imaginative generation of possible mechanisms. Imagining a possible mechanism that coheres with available evidence and is hypothetically capable of producing an explanandum phenomenon is a kind of success in scientific reasoning. We call this imaginative success. It is another step, subject to distinct norms of success, to evaluate whether the envisioned mechanism is “actually”
Sheredos and Bechtel: Imaging Mechanisms with Diagrams—June 2016 p. 2
the one responsible. A failure to find “the actual mechanism” is not a failure tout court. Here we are mainly interested in understanding imaginative success. If one views imagination as involving private “flights of fancy” operating exclusively in the heads of scientists and not directly accessible by others, then one might dismiss as impossible any investigation into scientific imagination. This is not our view. External representations (sometimes words, but typically diagrams) provide public expressions of imaginative reasoning. Even when all we have are published diagrams, we can view them as traces of the imaginative processes the researchers went through in developing hypothetical mechanistic explanations. But, more strongly, imaginative reasoning is often performed interactively with external representations (cf. Kirsh & Maglio, 1994). Rather than trying to keep an internal visualization “in the mind's eye,” scientists frequently report drawing diagrams of hypothetical mechanisms as they are reasoning, and not as a post-‐hoc expression. In many cases, the draft diagrams are lost from the record, but they are sometimes available, and provide evidence of intermediate steps in scientists' imaginative reasoning (cf. Burnston, Sheredos, Abrahamsen and Bechtel, 2014). Regarding the design of external representations as often integral to scientists' imaginative success in developing a mechanistic explanation, we treat diagrams as entrees into their imaginative reasoning. We begin in section 2 by articulating our working conception of imagination. A key aspect of the diagrams that provide our window into the activity of imagination is that they are visual representations that use space. Sometimes the space in the diagram represents physical space, but often it does not and we will discuss the different spaces used in imagining mechanisms. To make our discussion of the roles of imagination in the design of mechanisms more concrete, in the remainder of the paper we examine the role imagination has played in developing mechanistic accounts in the scientific field concerned with the generation of circadian rhythms in cyanobacteria. In section 3 we focus on imaginative mechanism design, involving prototypical diagrams in which the organization of the components is presented. In section 4 we focus on how researchers imagine these mechanisms operating to generate the phenomenon. In the simplest case this involves mental simulation, but often the designs biologists have constructed are too complex (involving non-‐sequential execution of non-‐linear operations) to be simulated mentally. In such circumstances, researchers turn to simulations using computational models to determine how the mechanism will behave and sometimes to understand why it produces the phenomenon (Bechtel & Abrahamsen, 2010). In constructing simulations, researchers often begin with a mechanism diagram, identifying the properties of parts as variables and of operations as parameters, and use this to guide the construction of mathematical equations (Jones & Wolkenhauer, 2012). We consider this one of the clearest cases in which imaginative success involves the use of external visualizations. 2. A Working Characterization of Scientific Imagination We characterize the scientific reasoning involved in positing hypothetical mechanisms (or, in creating “how-‐possibly” models) as imaginative. In saying this, we mean to communicate that such reasoning exhibits features that are paradigmatically associated with “imagination” as it is understood by the folk, by philosophers, and in science. A “definition”

Sheredos and Bechtel: Imaging Mechanisms with Diagrams—June 2016 p. 3
of imagination is unlikely to be forthcoming (cf. Thomas, 1999) and we do not propose that what we call “imaginative reasoning” has all the features one might attribute to some variety of imagination or other. But by most accounts, something will count as worthy of the title “imagination” if it has the following four features. First, as the name itself suggests, imagination has historically been regarded as imagistic in that it involves sensory representations of objects in some modality or other. In this it is like perception, and perhaps unlike abstract thought.1 Second, it is also paradigmatically fictive, in that imagined objects are not presumed to be actual. Although what one imagines may turn out to be the case, in the first instance an imaginative act is not itself an act that necessarily carries any ontic import. In this it is unlike belief about the way the world is. Third, imagination is paradigmatically creative. In memory, one simply “calls to mind” something one had experienced before. One may not even seek to do so; instead a memory may simply “pop up.” In contrast, in imagination one paradigmatically tries to envision something new. Fourth, it is paradigmatically freely variable within some range of freedom. One cannot help but remember (or fail to remember) what has occurred in the past as one (perhaps mistakenly) remembers it. In contrast, in imagination one can paradigmatically vary features of the envisioned scene at will. This does not mean that every feature is freely variable, however. Some basic constraints inform all imagining (one cannot imagine a visible surface which has no apparent color). And some forms of imagining, as we shall see, are even more determinately constrained. Below, we will demonstrate that what we call “imaginative reasoning” has all of these intuitive features, and this is what we have in mind by calling it “imaginative.” We presume that the foregoing features are components of the folk view2. We do not, however, intend to be offering a kind of “ordinary language argument” regarding scientific reasoning. The features reviewed above are also common in philosophical views of imagination, even if not all of them are always centrally present. Thus Aristotle's De Anima clearly upholds the imagistic and fictive character of imagination. Kant's first Critique contains a conception of (productive) imagination as having all four features. Husserl's phenomenology wields imagination as part of its methodology to study consciousness, emphasizing the last three features. Sartre's early work challenges Husserl on the imagistic character of imagination (though his view is not inconsistent with our gloss). He uses the term more widely than others, but clearly holds that it is in all cases fictive, and, in paradigmatic cases at least, creative and freely variable. Strawson (1970) identifies all four features, lumping creativity and free variability together. Similarly, all four features are countenanced in scientific research on imagination. In scientific research, folk categories are often split into distinct targets of investigation. This is especially so in the case of folk psychological categories such as “memory” (cf. Bechtel 2007) and the case is the same with “imagination.” Thus Boden’s (2004) analysis of 1 We are thus not pursuing a conception of “imagination” in terms of pretense, perspective-taking, or what is
sometimes called “recreative imagination” (Curie & Ravenscroft 2002; Liao & Szabó Gendler 2010). We fully acknowledge that this is one sense of “imagination” and a worthy topic of study; we only ask proponents of it to extend us the same semantic courtesy.
2 We grant, of course, that the folk conception may cover a surplus of components beyond this: see fn.1 above.

Sheredos and Bechtel: Imaging Mechanisms with Diagrams—June 2016 p. 4
creative reasoning treats imagination mainly with regard to our features of creativity and free variability, but is not centrally concerned with other features. Byrne (2005) distinguishes such “creative imagining” from “everyday imagining,” regarding the latter as centrally involving what we have called the fictive character of imagination; she refers to this as “counterfactual imagination.” Some researchers hold that any theory of mental imagery ought to provide a theory of imagination, upholding our claim that imagination is often regarded as imagistic (cf. Thomas, 1999). We are not denying that there is significant debate about the nature of imagination (in general or in any of its more specific varieties), or claiming that there is a universally-‐accepted taxonomy of forms of imagination, or claiming that it is widely held that all forms of imagination must involve all four of the features we have named. We acknowledge that other things one might wish to call “imagination” might involve features we have not listed here. For our purposes, what matters is only that if a reasoning process does involve all four of these features, it can aptly be called “imaginative.” This is what we seek to show regarding scientific reasoning involving diagrams as they posit hypothetical mechanisms. Insofar as we are appealing to diagrams in understanding scientific imagination, we are concerned specifically with visual representations. A diagram typically involves glyphs (shapes, arrows) situated in a space (Tversky, 2011). Neither the glyphs nor the space needs to resemble what is being represented – resemblance is not required by our construal of imagination as imagistic. Although sometimes an iconographic shape is used to represent a particular object, at least as often an arbitrary shape (e.g., an oval) is used. The lack of resemblance is even clearer in the case of space. Sometimes the two dimensions of a visual representation do correspond to physical space, as in maps that respect a “natural mapping” to worldly space. A visual representation of an ecosystem may show where different resources such as water are located and how different organisms are distributed through the space of the environment. But in reasoning about mechanisms, researchers often find it useful to employ abstract “spaces” whose dimensions are not anchored to the space of the physical world. A graph can be used, for example, to represent a range of values that can be assigned to mathematical variables in scientific accounts. A “location” in such an abstract space simply denotes that a represented object has certain quantitative properties within some range of possible quantities. Such an abstract form of space is employed in the state space plots we discuss in section 4. In other cases, especially the mechanism diagrams we discuss in the next section, the spatial dimensions of ink on a page are not to be interpreted as depicting any objective space, or even as depicting an abstract quantitative space. Rather, space on the page is used merely to situate glyphs representing distinct components of a mechanism, and arrows are used to indicate functional connections between them. 3. Imagining a Mechanism In this section we will examine how diagrams figure in the construction of mechanistic hypotheses. The dominant 20th century accounts of explanations treated explanation as involving subsumption of a phenomenon under laws, but laws don’t figure prominently in many domains of biology. Rather, biologists offer accounts of mechanisms when they
Sheredos and Bechtel: Imaging Mechanisms with Diagrams—June 2016 p. 5
attempt to explain phenomena. In recent decades, several philosophers of science (Bechtel & Richardson, 1993/2010; Bechtel & Abrahamsen, 2005; Machamer, Darden, & Craver, 2000) have characterized mechanisms as consisting of parts performing operations organized to generate the phenomenon under appropriate conditions, and have characterized many of the strategies through which biologists search for the parts and operations of a mechanism. Once researchers think they have characterized parts and operations, their challenge is to figure out how they are organized so as to generate the phenomenon. Here diagrams play a crucial role as external aids that enable researchers to imagine a mechanism by representing entities and relating these representations with arrows or other symbols whenever the operation of one is thought to produce or affect another. To illustrate the role of diagrams in reasoning about mechanisms we turn to research on the mechanism responsible for circadian rhythms in cyanobacteria. Circadian rhythms are endogenously generated oscillations which recur with a period of approximately 24 hours in the physiology or behavior of an organism, and which can be entrained to the light/dark cycle of the local environment. Often the basic circadian oscillations involve concentrations of molecules, but these then regulate a host of other biological functions by determining the time for the expression of relevant genes. The occurrence of such rhythms was only demonstrated in cyanobacteria in the early 1990s, opening the way for inquiry into the responsible mechanism. Through screens of mutant bacteria with altered rhythms, Ishiura, Kutsuna, Aoki, Iwasaki, Andersson, Tanabe, Golden, Johnson, and Kondo (1998) identified three genes that seemed to figure in the generation of these rhythms—kaiA, kaiB, and kaiC. By that time, researchers investigating circadian rhythms in eukaryotic cells (especially in fruit flies and mice) had proposed that the core mechanism involved a transcription-‐translation feedback loop (TTFL) in which the proteins produced from a gene feed back to inhibit their own expression. Oscillation would result from the fact that when the protein is in low concentration, its synthesis is enhanced, increasing its concentration, but with increased concentration, synthesis is inhibited, causing its concentration to drop. Ishiura et al. summarize the evidence that led them to propose a similar mechanism for the prokaryotic cyanobacteria Synechococcus elongatus:
We suggest a feedback-‐loop model for the circadian oscillator of Synechococcus. The following four sets of data—(i) mapping of various clock mutations to the kai cluster, (ii) rhythmicity in the expression of the kai genes, (iii) alteration of the rhythmicity of kai expression by the mutations mapped to the kai cluster, and (iv) elimination of rhythms caused by inactivation or overexpression of each kai gene—all support a model in which the kai genes are essential to the circadian clock, and the feedback regulation of the expression of the kai genes by their gene products generates the circadian oscillation in cyanobacteria (p. 1521).
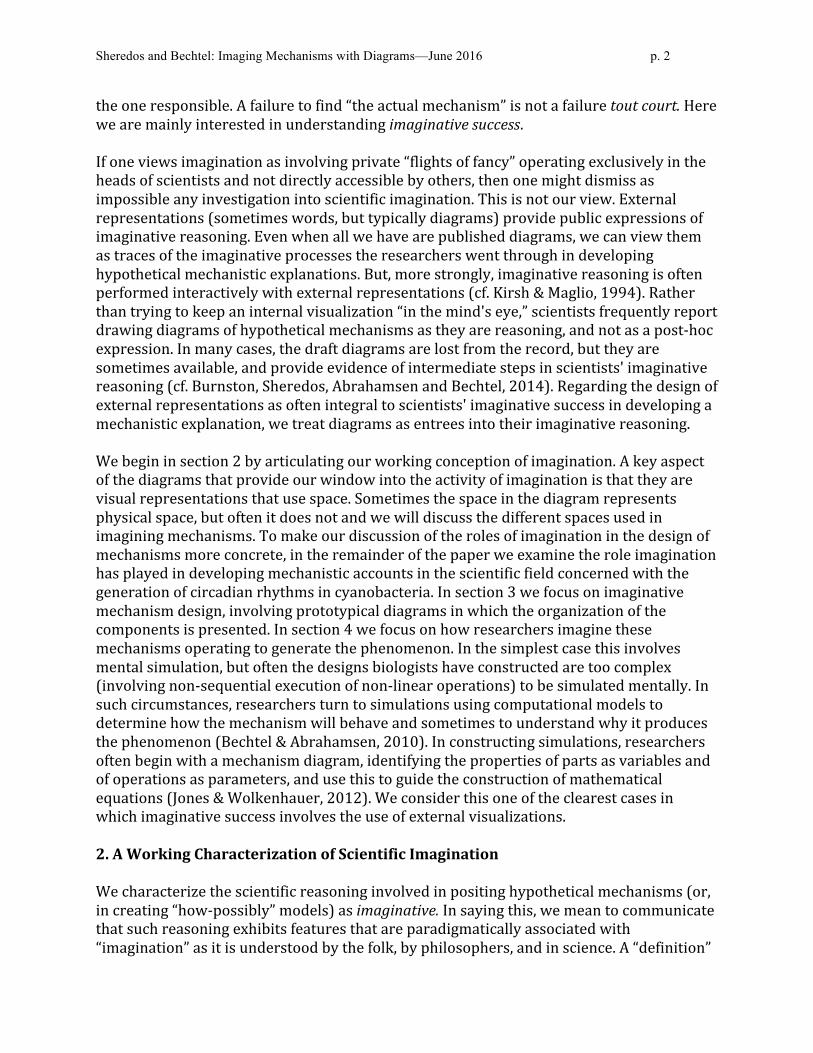
The passage references the diagram reproduced in Figure 1, which fleshes out how the researchers imagine the mechanism. We suspect that for many readers, it will be apparent how useful this diagram is for thinking about the hypothetical mechanism, and what aid it provides beyond the linguistic description given above. In this diagram the rectangle on the right represents the stretch of DNA where the kai genes reside while the proteins are shown in the box on the left. Arrows running right-‐to-‐left from the genes are labeled

Sheredos and Bechtel: Imaging Mechanisms with Diagrams—June 2016 p. 6
transcription and translation, and feedback loops, excitatory and inhibitory, are shown running left-‐to-‐right from the protein box to the DNA.
Figure 1. Ishiura et al.’s proposal of a TTFL mechanism for generating circadian rhythms in cyanobacteria based on analogy with the mechanisms that had been identified in eukaryotic cells. In their caption, the authors comment: “Hatched box at left represents an unknown part of the feedback loop. X and Y are unidentified clock components. α and β are unidentified DNA binding proteins.” Note also the use of question marks to underscore this point.
With this example, we can provide a preliminary illustration of how each of the four features of imagination are present, and why scientific reasoning involved in (a) crafting this diagram to convey, and (b) reading this diagram to understand, a hypothetical mechanism, is in our sense imaginative.
• The reasoning is imagistic insofar as it relies upon the drawn diagram. In this case, the diagram's own spatiality (space on the page) is not systematically utilized to convey claims about worldly spatiality. For example, the shaded box at the left is not meant to depict that the Kai proteins reside in some intracellular compartment (there are no discrete intracellular compartments in prokaryotes). Rather it is being used to make a categorical claim: everything represented within the shaded box, including by the text, is regarded as poorly understood, and is set as a target of future investigation. Here the caption helps to specify the represented content, telling the reader how the image is to be understood. But often, ambiguities are left in place. For example, the diagram is not representing that the kai gene cluster is located “to the right” of the proteins. Likewise, the glyphs used to represent entities are abstract, and their shapes do not represent the shapes of those entities. Novices often misunderstand this (incorrectly inferring the location of the gene cluster or the shapes of entities) because reading the diagram does involve imagistic

Sheredos and Bechtel: Imaging Mechanisms with Diagrams—June 2016 p. 7
reasoning. These errors arise when one misunderstands how imagistic reasoning is to be deployed. A caption can clarify how to reason imagistically using the diagram, but the use of the diagram demands that one do so to understand the proposal. Moreover, as we have already suggested, the creation of the diagram surpasses mere verbal presentation in framing the hypothesis.
• It is fictive in that the authors are imagining (and inviting readers to imagine) how a mechanism might work in cyanobacteria, not simply reporting on results that had been established: while some of the parts and their relations are known, putting them together to form a mechanism which is capable of producing the phenomenon required a fair bit of speculation. The researchers are not asserting that the mechanism does in fact work this way, but rather showing how it would be functionally organized if it did.
• A great deal of creativity is involved insofar as there was, at the time of publication, no solid evidence that any prokaryote has a TTFL mechanism of the sort that had been discovered in eukaryotic cells. The researchers employ this diagram to formulate a novel, testable hypothesis. Moreover, creativity is involved in choosing arbitrary shapes and locations to convey the proposal, selectively foregrounding certain information and backgrounding other information (e.g., location, shape). Finally, this diagram is inspired by similar box-‐and-‐arrow diagrams showing the organization of eukaryotic TTFLs, but the researchers must make creative alterations to fit the known data about cyanobacteria, reconceive the functional organization with new parts and players, and hypothesize unknown relations between them.
• To illustrate the constrained free variability involved here, we highlight the use of question marks in this figure. These indicate uncertainty about the details of the operations being proposed. Why then posit them at all? In most cases, they are posited because if the TTFL model is to be applied to cyanobacteria, then something must play the assigned roles: there must be some process of time-‐delay, some additional clock components, and some DNA binding elements. The authors are constrained to posit such entities and activities in order to illustrate their creative hypothesis at all. By marking these posits with question marks, the authors indicate precisely where free variability is permitted in imagining a mechanism that fits this model. Where free variability is permitted in thinking of a mechanism, the mechanism’s parts and operations remain unknown, and thus serve as targets for future investigation. Of special note is the question mark after the word Interactions, as the relationships between the Kai proteins became the focus of research in the subsequent 15 years.
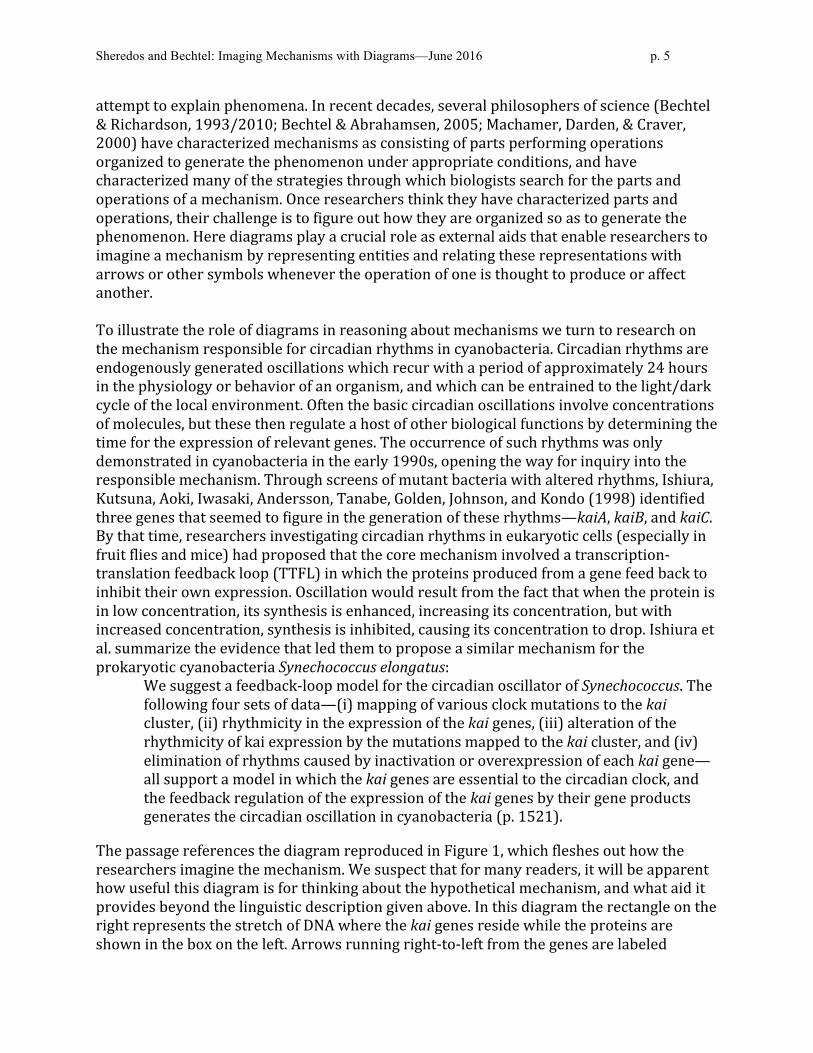
Figure 1 represents the original proposal to apply the TTFL model to cyanobacteria. But the imaginative character of scientists' reasoning is not limited to their initial formulations of the hypothesis. It is interesting to compare this figure with Figure 2, published just two years later by two of the same authors, Iwasaki and Kondo (2000). Many newly discovered parts (proteins) are shown in this diagram, such as CikA and SasA, which became focal objects of subsequent research. The question marks involving the interaction of the Kai proteins are gone. This reflects the growth of evidence during this period that KaiC binds

Sheredos and Bechtel: Imaging Mechanisms with Diagrams—June 2016 p. 8
ATP and autophosphorylates. KaiA was determined to increase the rate of KaiC autophosphorylation by binding to KaiC, whereas when KaiB binds KaiC, it was found to reduce the rate of phosphorylation and, if KaiC were already phosphorylated, to facilitate dephosphorylation. This cycle of phosphorylation and dephosphorylation of KaiC itself takes 24 hours, leading Ditty, Williams, and Golden (2003, p. 524) to conclude that these posttranslational activities “are central to the timekeeping ability of the Kai oscillator.” What is important for our purposes here is the manner in which this diagram rules out whole domains of free variability in thinking about how the hypothetical mechanism might operate.3 Figure 1 permits a viewer to wonder whether the Kai proteins interact; Figure 2 constrains a viewer to imagine that they do. Simultaneously, however, whole new domains of free variability are opened up in Figure 2: the viewer is permitted to imagine any number of mechanisms whereby clock output might provide feedback to input mechanisms. While imagining a mechanism of cyanobacterial rhythmicity had become more constrained, it remained imaginative.
Figure 2. Iwasaki and Kondo’s (2000) representation of the cyanobacterial clock mechanism. See text for details.
This is clear if we attend to an important reorientation of later research. The focus on the phosphorylation and dephosphorylation of KaiC and its interactions with KaiA and KaiB became even more central as a result of two papers from the Kondo group in 2005. In the first, Tomita, Nakajima, Kondo, and Iwasaki (2005) demonstrated sustained circadian rhythms when bacteria were maintained in darkness, or in the presence of transcription or translation inhibitors – that, is contexts in which no protein synthesis occurs. In the second, Nakajima, Imai, Ito, Nishiwaki, Murayama, Iwasaki, Oyama, and Kondo (2005) reported circadian rhythms in a preparation containing only the three Kai proteins and ATP. These 3 We cannot discuss it here, but the manner in which the “growth of evidence” enables researchers to import new
constraints into their understanding of the mechanism relies on further details of how scientists reason using diagrams. Prototypically, a variety of data-graphics in many formats must be simultaneously deployed to work out the constraints before these can be used to construct a new mechanism diagram. Compare the role of data-graphics in computational modeling, discussed in §4 below.
Sheredos and Bechtel: Imaging Mechanisms with Diagrams—June 2016 p. 9
studies compellingly demonstrated the sufficiency of operations involving the proteins to sustain circadian rhythms: the TTFL model, previously borrowed from eukaryotic systems and applied to cyanobacteria, appeared to be false. Neither transcription nor translation was necessary for circadian rhythms in cyanobacteria. Concerted focus was now directed at the post-‐translational processes by which the Kai proteins formed complexes and how KaiC was phosphorylated and dephosphorylated over a 24-‐hour period. In short, the hypothetical mechanisms posited in Figures 1 and 2 had been shown not to be the actual mechanisms centrally responsible for circadian rhythmicity in cyanobacteria. This underscores the fictive aspects of Figures 1 and 2. Despite the fact that these “how-‐possibly” models did not pan out, a great deal of scientific reasoning was involved not only in initially proposing the TTFL model for cyanobacteria, but also in incorporating parts and operations suggested by new evidence into it, and in repeatedly wielding the model to identify new targets of research. In our presentation, one can think of research as proceeding by relentlessly closing off domains of free variability and opening up others. We regard this as a notable form of ongoing success in scientific research: it is no simple feat to take a mechanistic model built for one class of organisms, apply it wholesale to another, and provide an articulate depiction of how the resulting hypothetical mechanism could actually be constituted so as to produce the target phenomenon. Likewise, it is no simple feat to adapt such a model in the face of new data. While the models discussed above proved to be factually inaccurate, we regard the researchers as having attained a kind of imaginative success simply by constructing the diagrams above. The success consists in integrating known data regarding cyanobacteria, fitting these into a generalized hypothesis regarding TTFLs as the mechanisms of circadian rhythms, generating a new, specific model of how such a mechanism could work in this case, and identifying the gaps in this new model as a way of driving research forward. This kind of success is common in scientific research, wherein piecemeal discoveries are synthesized into cohesive, mechanistic hypotheses which have only provisional standing as how-‐possibly models. The success we are highlighting does not consist in reaching an end-‐point of scientific explanation, at which scientific reasoning about this topic can cease and be diverted elsewhere. The success consists rather in advancing beyond limited data, instead of stagnating, by sketching out a model which (a) suggests unidentified parts and operations as targets of future research, and (b) suggests new ways of experimenting on known parts and operations, to determine whether the model fits. In attaining imaginative success, scientists are actively succeeding in their ongoing endeavors. Such imaginative success is presupposed in any case where a mechanistic hypothesis is put forth, and subsequently thought to be correct – any time a “how-‐possibly” model gets polemically upgraded to the status of a “how-‐actually” model, and scientific reasoning is retroactively reified as a finished “success.” Turning the focus to the Kai proteins generated a new set of challenges for research on the cyanobacterial clock: TTFL mechanisms had been sufficiently studied, including with computational models, that researchers felt they understood how they could generate sustained circadian oscillations. They lacked such understanding for how phosphorylation and dephosphorylation of KaiC could generate sustained oscillations. As a result, the

Sheredos and Bechtel: Imaging Mechanisms with Diagrams—June 2016 p. 10
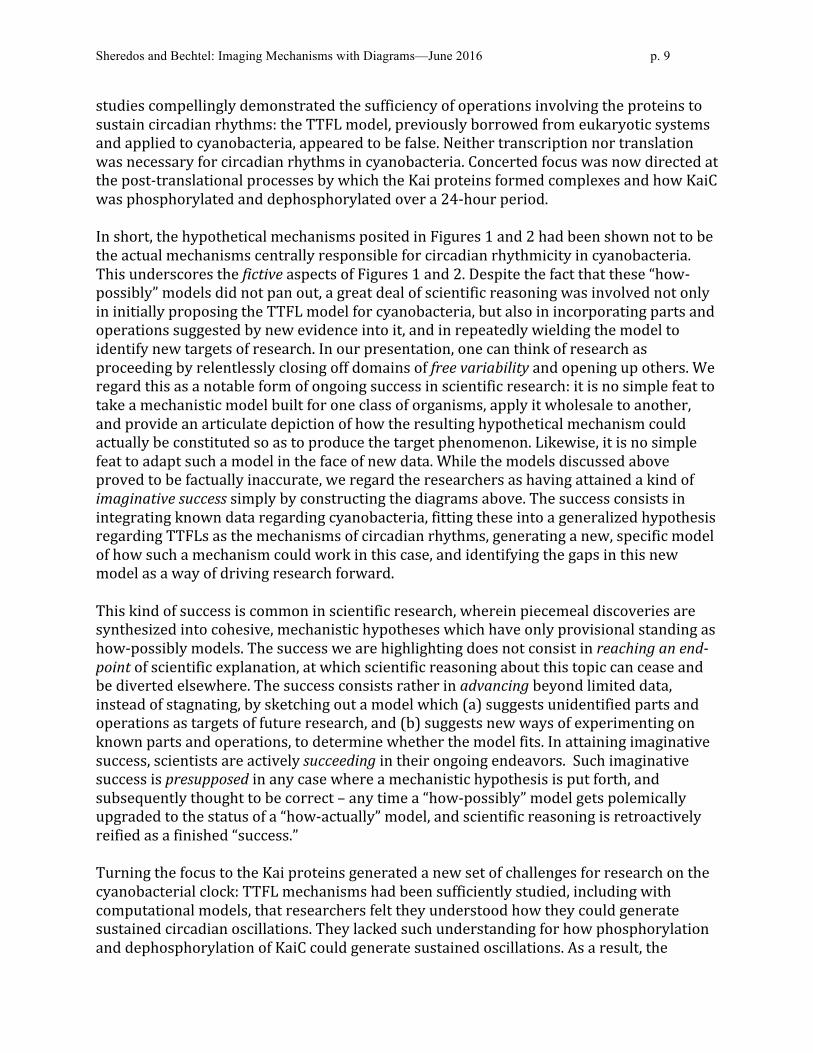
question of how the central clock in cyanobacteria could function was essentially a wide-‐open domain of relatively free variability. Two basic constraints that all researchers came to accept were that phosphorylation could occur at two loci on Kai C – serine residue 431 (S) and threonine 432 (T) – and it would take 24 hours to complete the cycle of phosphorylation and dephosphorylation. The problem, as illustrated in Figure 3B, is that, as typical of biochemical reactions, each of these steps is in principle reversible. This suggested an additional constraint: without something driving the mechanism to carry out only the clockwise sequence, the mechanism would not oscillate but settle into a steady state. The other diagrams in Figure 3 originated with two research groups that proposed different mechanisms that could meet these constraints. As a result of their electron micrograph studies showing the differential binding of KaiC with KaiA and KaiB at different times of day, Mori, Williams, Byrne, Qin, Egli, McHaourab, Stewart, and Johnson (2007) advanced the hypothesis represented in Figure 3A. Lavender arrows show the progression of KaiC through its phosphorylation cycle. A key aspect of their proposal, symbolized by the asterisk by KaiC and its dark blue coloration at the bottom and on the left of the figure, is that as a result of phosphorylation and binding with KaiB, KaiC changes its conformation to a form that inhibits phosphorylation and promotes dephosphorylation. This conformational change was hypothesized to help drive the phosphorylation cycle in its observed progression. There was little evidence for this imaginative proposal, but Mori et al. included a computational model to show that such a mechanism could generate sustained oscillations. (There was more evidence for the operations, shown in the center of the figure, of monomer exchange, in which monomers from different hexamers exchange, enabling different hexamers to synchronize with each other.)
Figure 3. Early proposals for a mechanism producing oscillations through phosphorylation and dephosphorylation of KaiC. A. Mori et al.’s (2007) proposal involving a conformation change from KaiC to KaiC*. B and C. Rust et al.’s (2007) proposal based on phosphorylation at different sites on KaiC.
Sheredos and Bechtel: Imaging Mechanisms with Diagrams—June 2016 p. 11
Figures 3B and 3C, from Rust, Markson, Lane, Fisher, and O'Shea (2007), reflect these authors’ discovery that there is a specific sequence of phosphorylation and dephosphorylation at the S and T loci—T is the first site phosphorylated, followed by S, and T is the first site dephosphorylated, followed by S. As a result, given the current phosphorylation state of KaiC, there is no ambiguity as to what stage of the phosphorylation rhythm KaiC is in. This allowed researchers to close off one domain of free variability, imposing a clear constraint on how to think of the cyclical progression of KaiC's phosphorylation rhythm. Into the representation in Figure 3B, in Figure 3C Rust et al. inserted representations of KaiA and KaiB, using arrows to represent their hypothesis: until KaiB is added to KaiC in the S-‐phosphoform, KaiA drives the system towards phosphorylation, but once enough of a concentration of the S-‐phosphoform emerges, KaiB interacts to repress KaiA, and these interactions between the Kai proteins drive the one-‐way progression of the phosphorylation rhythm. Like Mori et al., the authors devised a computational model, showing that their mechanism could not only produce sustained oscillations, but also replicated precise quantitative dynamics of the abundance of KaiC phosphoforms exhibited by an in vitro oscillator. Given that Rust et al. started with the data about the order of phosphorylation at the S and T sites, and with data about all the entities involved, one may question whether their hypothesis counts as imaginative. In particular, one may question whether it is fictive. What is fictive in this case is not the order of phosphorylation and dephosphorylation at the two loci, or the roles of KaiA and KaiC in affecting KaiC's phosphorylation. Rather, the hypothesis that these activities, working in concert, sufficed to generate circadian (~24-‐h) oscillations is fictive. Here the fictive character of scientists' reasoning concerns not the structure of the mechanism, but its precise dynamics. As we shall discuss further in section 4 below, the researchers relied heavily on imaginative reasoning to develop a computational model to show that the set of operations identified would suffice to account for the precise quantitative dynamics of circadian oscillations observed in vitro. The fact that the proposal was soon widely embraced does not detract from its creativity. Moreover, the proposal left many domains of free variability, especially concerning the exact time-‐course of each operation. These are still being pursued, in part by detailed sub-‐molecular inquiries. None of these issues is taken up by Mori at al., or by Rust et al. That research can proceed apace without settling such questions does not mean they have been adequately settled. Likewise, that a fictive inference strategy commands widespread consensus as a heuristic does not make it any less fictive. What Rust et al.'s case illustrates is that the norms of imaginative success may be so widely shared within a field that they go without much explicit mention at all. It goes without saying that more work must be done to determine whether the hypothetical mechanism is actually present within a cyanobacterium. So far we have focused on published diagrams that reflect how the authors of the papers imagined the interaction of operations constituting the mechanism when they published the paper. We conclude this section with an example in which we had access to drafts of diagrams the researchers generated in the course of formulating their proposed mechanism. With attention to this case, we show that the researchers imaginatively
Sheredos and Bechtel: Imaging Mechanisms with Diagrams—June 2016 p. 12
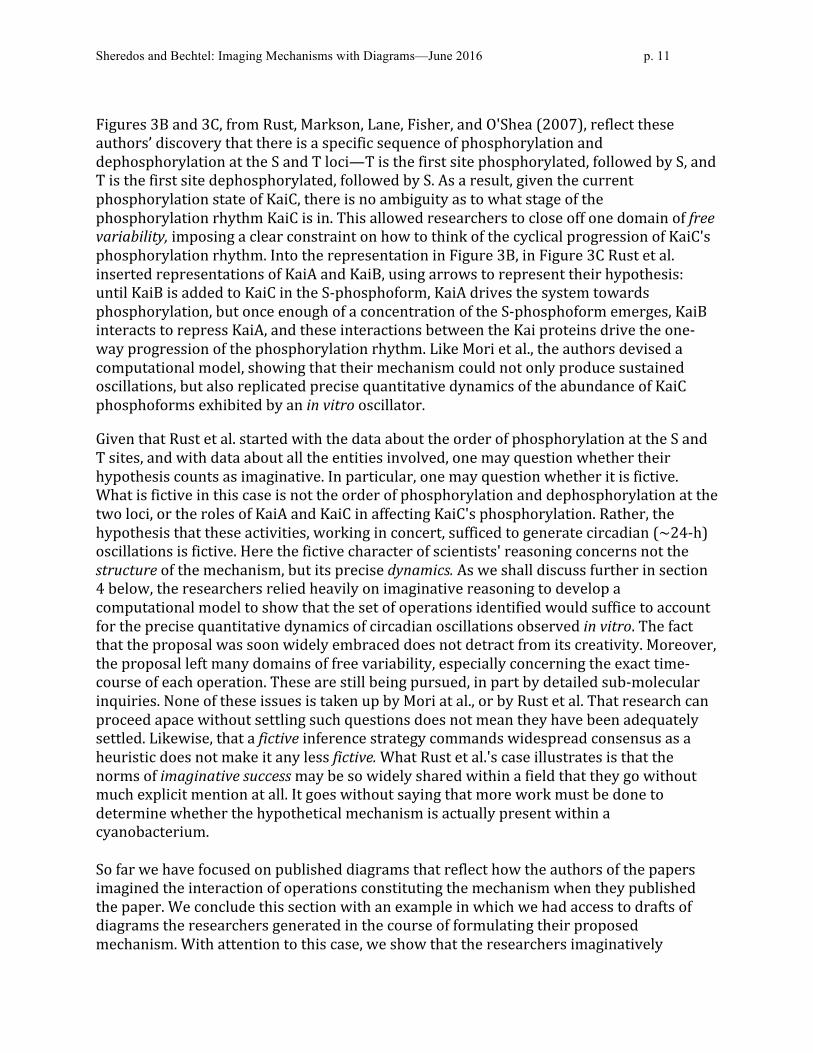
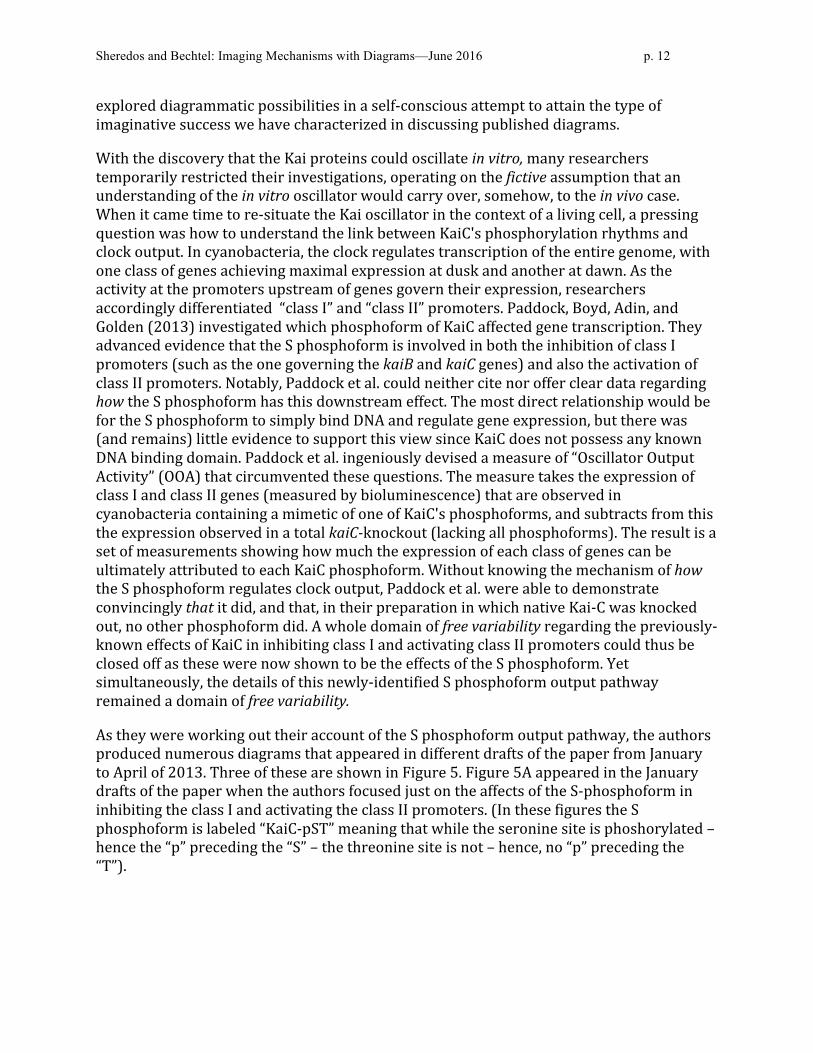
explored diagrammatic possibilities in a self-‐conscious attempt to attain the type of imaginative success we have characterized in discussing published diagrams. With the discovery that the Kai proteins could oscillate in vitro, many researchers temporarily restricted their investigations, operating on the fictive assumption that an understanding of the in vitro oscillator would carry over, somehow, to the in vivo case. When it came time to re-‐situate the Kai oscillator in the context of a living cell, a pressing question was how to understand the link between KaiC's phosphorylation rhythms and clock output. In cyanobacteria, the clock regulates transcription of the entire genome, with one class of genes achieving maximal expression at dusk and another at dawn. As the activity at the promoters upstream of genes govern their expression, researchers accordingly differentiated “class I” and “class II” promoters. Paddock, Boyd, Adin, and Golden (2013) investigated which phosphoform of KaiC affected gene transcription. They advanced evidence that the S phosphoform is involved in both the inhibition of class I promoters (such as the one governing the kaiB and kaiC genes) and also the activation of class II promoters. Notably, Paddock et al. could neither cite nor offer clear data regarding how the S phosphoform has this downstream effect. The most direct relationship would be for the S phosphoform to simply bind DNA and regulate gene expression, but there was (and remains) little evidence to support this view since KaiC does not possess any known DNA binding domain. Paddock et al. ingeniously devised a measure of “Oscillator Output Activity” (OOA) that circumvented these questions. The measure takes the expression of class I and class II genes (measured by bioluminescence) that are observed in cyanobacteria containing a mimetic of one of KaiC's phosphoforms, and subtracts from this the expression observed in a total kaiC-‐knockout (lacking all phosphoforms). The result is a set of measurements showing how much the expression of each class of genes can be ultimately attributed to each KaiC phosphoform. Without knowing the mechanism of how the S phosphoform regulates clock output, Paddock et al. were able to demonstrate convincingly that it did, and that, in their preparation in which native Kai-‐C was knocked out, no other phosphoform did. A whole domain of free variability regarding the previously-‐known effects of KaiC in inhibiting class I and activating class II promoters could thus be closed off as these were now shown to be the effects of the S phosphoform. Yet simultaneously, the details of this newly-‐identified S phosphoform output pathway remained a domain of free variability. As they were working out their account of the S phosphoform output pathway, the authors produced numerous diagrams that appeared in different drafts of the paper from January to April of 2013. Three of these are shown in Figure 5. Figure 5A appeared in the January drafts of the paper when the authors focused just on the affects of the S-‐phosphoform in inhibiting the class I and activating the class II promoters. (In these figures the S phosphoform is labeled “KaiC-‐pST” meaning that while the seronine site is phoshorylated – hence the “p” preceding the “S” – the threonine site is not – hence, no “p” preceding the “T”).

Sheredos and Bechtel: Imaging Mechanisms with Diagrams—June 2016 p. 13
Figure 5. Three figures developed by Paddock et al. in which they explore possible ways of relating the S-‐phosphoform and RpaA to the two classes of gene promoters in cyanobacteria. Only the last appeared in the published paper.
Subsequently, the authors expanded the focus of their paper to consider the relation between their newly-‐discovered output pathway from the S-‐phosphoform, and a previously identified output pathway involving SasA and RpaA (shown in Figure 2 above, where RpaA is simply designated response regulator). Panel B appeared in drafts in March and early April. Note the bifurcated use of space. On the left side, space on the page is not to be interpreted as systematically depicting any worldly space: the S phosphoform, shown at the bottom, is not to be regarded as “below” the T phosphoform, shown at the top. Despite that, the proximity of the glyphs for each of the Kai proteins is meant to convey spatial proximity and entanglement (binding) of the represented proteins: KaiA and KaiB are shown bound to the S phosphoform of KaiC. Meanwhile, on the right side of the panel, there is a mock-‐up (red line) of a quantitative graph showing observed oscillations. To a researcher of circadian rhythms, this simple waveform is iconic, and would be taken immediately to represent peaks and troughs of gene expression over several days. And yet, since no axes are specified, this “abstract” space cannot be systematically interpreted and assigned any clear quantitative values. Running from left to right across the panel are several lines. The solid arrows, running from the S phosphoform to peaks on the pseudo-‐graph, indicates that output from KaiC is at its peak when the abundance of the S phosphoform is at its peak. The dotted lines, running from the other phosphoforms to the trough on the pseudo-‐graph, indicate that output from kaiC when the S phosphoform is not abundant remains at the same low level as in the KaiC knockout.4 The challenge was to imagine how the newly-‐identified output pathway involving the S phosphoform interacts with the previously-‐known output pathway involving SasA and RpaA. Both SasA and RpaA exhibit circadian cycles in their own phosphorylation (they are considered active when phosphorylated); hence RpaA is shown with a circle. The relation between KaiC oscillation and RpaA oscillation is purposefully left vague since the relative timing of these oscillations is not known. In their experimental work, Paddock et al. had found that RpaA knockouts exhibited the opposite effect on OOA as KaiC knockouts. Hence, in these diagrams, they show RpaA has inhibiting the effect of the KaiC phosphoforms. Panel B only shows RpaA opposing the output from the S-‐phosphoform, not the specifics of what it does. The authors flesh out their idea in April when they produced a first draft of 4 The measure of Oscillator Output Activity does not distinguish between the S phosphoform's role in inhibiting
Class I genes and activating Class II genes: both of these are simply “output activity.”
Sheredos and Bechtel: Imaging Mechanisms with Diagrams—June 2016 p. 14
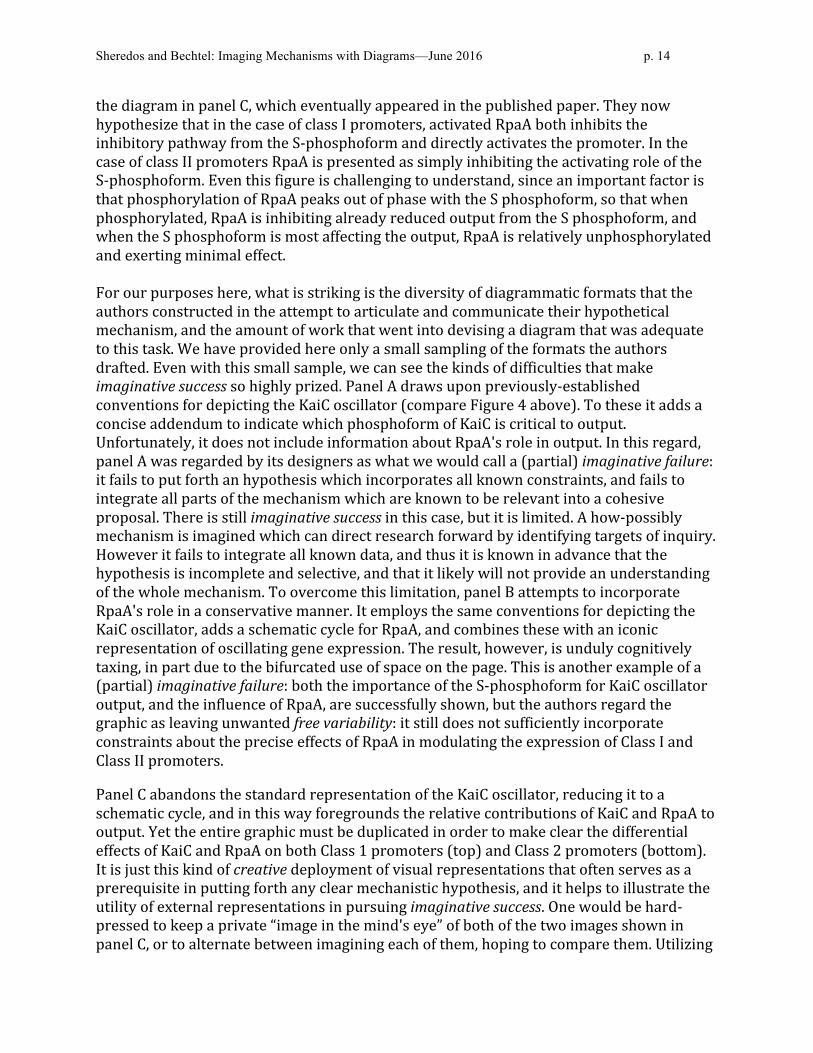
the diagram in panel C, which eventually appeared in the published paper. They now hypothesize that in the case of class I promoters, activated RpaA both inhibits the inhibitory pathway from the S-‐phosphoform and directly activates the promoter. In the case of class II promoters RpaA is presented as simply inhibiting the activating role of the S-‐phosphoform. Even this figure is challenging to understand, since an important factor is that phosphorylation of RpaA peaks out of phase with the S phosphoform, so that when phosphorylated, RpaA is inhibiting already reduced output from the S phosphoform, and when the S phosphoform is most affecting the output, RpaA is relatively unphosphorylated and exerting minimal effect. For our purposes here, what is striking is the diversity of diagrammatic formats that the authors constructed in the attempt to articulate and communicate their hypothetical mechanism, and the amount of work that went into devising a diagram that was adequate to this task. We have provided here only a small sampling of the formats the authors drafted. Even with this small sample, we can see the kinds of difficulties that make imaginative success so highly prized. Panel A draws upon previously-‐established conventions for depicting the KaiC oscillator (compare Figure 4 above). To these it adds a concise addendum to indicate which phosphoform of KaiC is critical to output. Unfortunately, it does not include information about RpaA's role in output. In this regard, panel A was regarded by its designers as what we would call a (partial) imaginative failure: it fails to put forth an hypothesis which incorporates all known constraints, and fails to integrate all parts of the mechanism which are known to be relevant into a cohesive proposal. There is still imaginative success in this case, but it is limited. A how-‐possibly mechanism is imagined which can direct research forward by identifying targets of inquiry. However it fails to integrate all known data, and thus it is known in advance that the hypothesis is incomplete and selective, and that it likely will not provide an understanding of the whole mechanism. To overcome this limitation, panel B attempts to incorporate RpaA's role in a conservative manner. It employs the same conventions for depicting the KaiC oscillator, adds a schematic cycle for RpaA, and combines these with an iconic representation of oscillating gene expression. The result, however, is unduly cognitively taxing, in part due to the bifurcated use of space on the page. This is another example of a (partial) imaginative failure: both the importance of the S-‐phosphoform for KaiC oscillator output, and the influence of RpaA, are successfully shown, but the authors regard the graphic as leaving unwanted free variability: it still does not sufficiently incorporate constraints about the precise effects of RpaA in modulating the expression of Class I and Class II promoters. Panel C abandons the standard representation of the KaiC oscillator, reducing it to a schematic cycle, and in this way foregrounds the relative contributions of KaiC and RpaA to output. Yet the entire graphic must be duplicated in order to make clear the differential effects of KaiC and RpaA on both Class 1 promoters (top) and Class 2 promoters (bottom). It is just this kind of creative deployment of visual representations that often serves as a prerequisite in putting forth any clear mechanistic hypothesis, and it helps to illustrate the utility of external representations in pursuing imaginative success. One would be hard-‐pressed to keep a private “image in the mind's eye” of both of the two images shown in panel C, or to alternate between imagining each of them, hoping to compare them. Utilizing

Sheredos and Bechtel: Imaging Mechanisms with Diagrams—June 2016 p. 15
space-‐on-‐the-‐page and outsourcing these representations, one attains a visualization that is sufficient to incorporate all relevant constraints and to advance a clear hypothesis. 4. Imagining Mechanisms in Operation Although the mechanisms represented in the figures in the previous section are dynamic, the diagrams are static. To understand how the operations portrayed can result in the generation of the phenomenon (in the case of circadian rhythms, sustained oscillation), the viewer must imagine the execution of the operations shown in the diagrams. Sometimes this can be done by mentally animating the diagram, visualizing each operation and taking into account the changes in which it results. Using a task in which participants were required to determine the effect of pulling a rope on parts of a pulley system (Figure 5) while reaction times and errors were measured and eye movements tracked, Hegarty (1992; see Schwartz & Black, 1999, for related results) demonstrated that people sequentially animate individual parts of the pulley system in causal order. Although the operations in the mechanism diagrams in the previous section (synthesizing proteins or binding phosphates) are less readily imagined visually, when the diagram is simple enough those expert in the types of operations proposed are often able to rehearse mentally the effects of these operations to determine how the mechanism generates the phenomenon. Still, it is rare for a diagram to explicitly encode all the background knowledge (e.g., regarding the relative phasing of different activities) that is required.
Figure 5. Pulley systems used in Hegarty’s (1992) experiments
Mental animation works reasonably well when the operations occur sequentially so that one does not have to try to keep track of the effects of multiple operations at the same time and when the operations can be described in linear equations. But when multiple operations are viewed as interacting with each other at the same time in a non-‐linear fashion, as in the diagrams in the previous section, mental animation ceases to provide a reliable indication of the mechanism’s behavior. Instead, researchers often appeal to computational models to determine how (and when) the mechanism's parts will behave.

Sheredos and Bechtel: Imaging Mechanisms with Diagrams—June 2016 p. 16
For example, the mechanism Rust et al. imagined in Figure 3C involves the continuous transformation between the four phosphoforms shown around the perimeter. These transformations are modulated by the effects of KaiA and KaiB, which are assumed to affect the rates in a non-‐linear fashion. This far exceeds the ability of humans to animate mentally. Accordingly Rust et al. developed a computational model in which three equations specified how concentrations of the T, S, and doubly-‐phosphorylated (“ST”) phosphoforms would change as a result of the operations represented by the arrows connecting them to other phosphoforms. Each term relating two phosphoforms includes a rate parameter kXY, which itself changes according to the following formula
where is the rate in the absence of KaiA, is the maximal influence of KaiA on the rate, and A is the concentration of active KaiA. The resulting equations were differentially integrated, resulting in a pattern of oscillation for each phosphoform. To understand these modeled data, the researchers visualized them in an abstract, quantitative space (Figure 6B) and compared them to a similar visualization of actual experimental data from a cyanobacterium (Figure 6A).
Figure 6. Comparison of empirical data and results of a simulation using the computational model Rust et al. developed based on the mechanism shown in Figure 3C.
In this instance, the computational simulation served as a means of extending the ability of humans to imagine the operation of a mechanism. As discussed in section 3 above, the basic structure and functional arrangement of the mechanism Rust et al. proposed was well-‐supported by experimental data. But they also needed to support the claim that the dynamics of such a system could produce the target phenomenon of circadian rhythmicity. It was to accomplish this that the authors turned to a computational simulation. But the raw output of the simulation is a set of numbers: the values assigned to variables at continuous time-‐points. To make sense of these numbers, the researchers graphed them over time just as they did the data from actual experiments. The fact that the graph closely resembles that of the actual data supports the contention that the imagined mechanism could account for the phenomenon—it provides the epistemic grip needed to convincingly put forth a how-‐possibly mechanism.

Sheredos and Bechtel: Imaging Mechanisms with Diagrams—June 2016 p. 17
In this case, there is a relatively close connection between the variables deployed in the model and biologically realistic parts and activities. It might seem that this suffices to explain how the mechanism works. But surprisingly, given the intuitive idea that completeness is a virtue in mechanistic explanations (Kaplan & Craver, 2011), researchers often take a different approach to understanding why the mechanism behaves as the simulation shows that it does. To this end, researchers find it useful to abstract from actual components and search for general design principles (Levy & Bechtel, 2013; Green, Levy, & Bechtel, 2014). Jolley, Ode, and Ueda (2012) illustrate such a strategy for imagining a mechanism of rhythmicity that aims not to track its actual parts and operations in full specificity, but rather to reveal the key design principles behind its operation. They began by imagining the skeleton mechanism shown in Figure 7A. The basic functional arrangement here ought to be familiar from our previous discussion of the KaiC oscillator. What is being modeled is a simple posttranslational oscillator that relies upon a single substrate (labeled “S”) that can be phosphorylated (“P”) at two different sites under the influence of one of two enzymes, a phosphatase (the blue oval in panels B and C) and a kinase (the green oval in panels B and C). While this closely resembles Figure 4B, they have annotated each arrow with two parameters (k1. . . k8 are rate parameters specifying the number of substrate molecules converted to product molecules in a given reaction per enzyme per minute and Km1. . . Km8 are binding parameters that determine the substrate concentrations at which each reaction reaches half its maximum rate). After generating the appropriate equations, Jolley et al. used numerical simulation to discover which sets of parameter values would sustain oscillations with the hope that they could identify a systematic pattern among the successful parameter values.
Figure 7. A. Simplified model of the oscillator used by Jolley et al. showing the 16 parameters whose values they investigated. B. A schematic representation of the two clusters of parameter values Jolley et al. identified that generated sustained oscillations. Thickness of the arrows around the perimeter indicates relative magnitude (speed) of the parameter-‐values that produced sustain oscillations. The flat-‐ended arrows in the center of these panels are explained in the text.
Even directing their search to those sets of parameter values they thought likely to produce oscillations, Jolley et al. found that only ~0.1% of the sets of parameter values they checked generated sustained oscillations. This low “hit rate” indicates that their model was not
Sheredos and Bechtel: Imaging Mechanisms with Diagrams—June 2016 p. 18
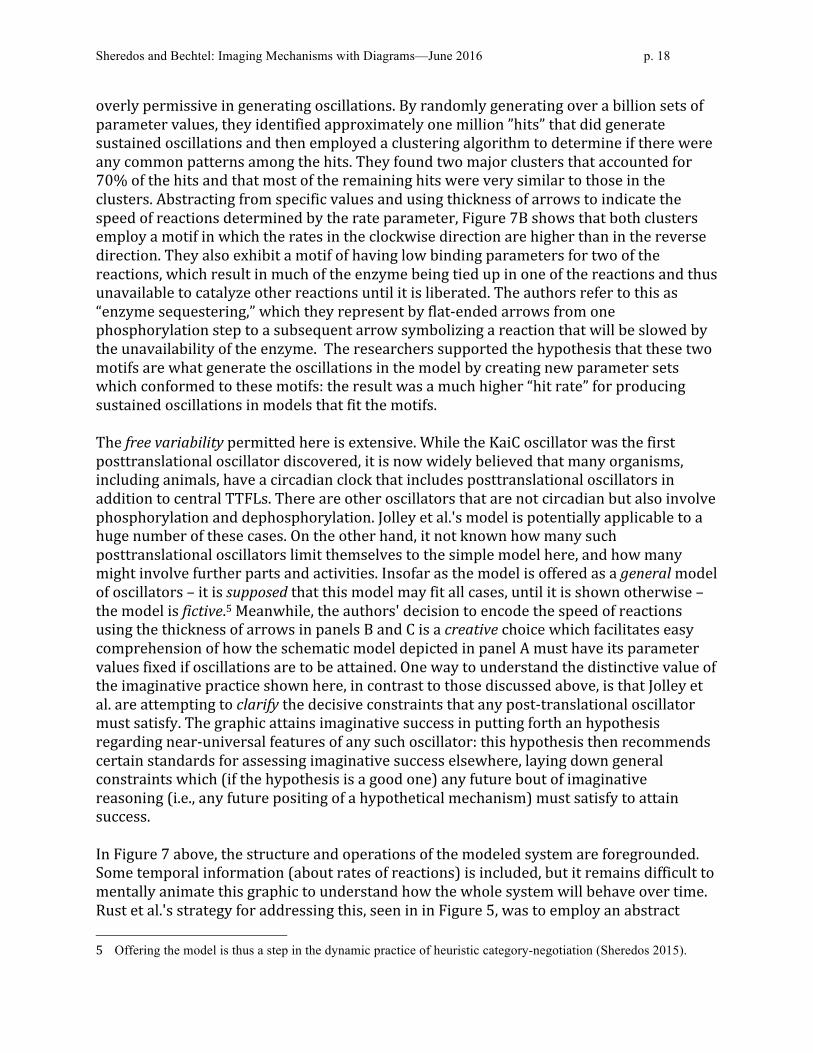
overly permissive in generating oscillations. By randomly generating over a billion sets of parameter values, they identified approximately one million ”hits” that did generate sustained oscillations and then employed a clustering algorithm to determine if there were any common patterns among the hits. They found two major clusters that accounted for 70% of the hits and that most of the remaining hits were very similar to those in the clusters. Abstracting from specific values and using thickness of arrows to indicate the speed of reactions determined by the rate parameter, Figure 7B shows that both clusters employ a motif in which the rates in the clockwise direction are higher than in the reverse direction. They also exhibit a motif of having low binding parameters for two of the reactions, which result in much of the enzyme being tied up in one of the reactions and thus unavailable to catalyze other reactions until it is liberated. The authors refer to this as “enzyme sequestering,” which they represent by flat-‐ended arrows from one phosphorylation step to a subsequent arrow symbolizing a reaction that will be slowed by the unavailability of the enzyme. The researchers supported the hypothesis that these two motifs are what generate the oscillations in the model by creating new parameter sets which conformed to these motifs: the result was a much higher “hit rate” for producing sustained oscillations in models that fit the motifs. The free variability permitted here is extensive. While the KaiC oscillator was the first posttranslational oscillator discovered, it is now widely believed that many organisms, including animals, have a circadian clock that includes posttranslational oscillators in addition to central TTFLs. There are other oscillators that are not circadian but also involve phosphorylation and dephosphorylation. Jolley et al.'s model is potentially applicable to a huge number of these cases. On the other hand, it not known how many such posttranslational oscillators limit themselves to the simple model here, and how many might involve further parts and activities. Insofar as the model is offered as a general model of oscillators – it is supposed that this model may fit all cases, until it is shown otherwise – the model is fictive.5 Meanwhile, the authors' decision to encode the speed of reactions using the thickness of arrows in panels B and C is a creative choice which facilitates easy comprehension of how the schematic model depicted in panel A must have its parameter values fixed if oscillations are to be attained. One way to understand the distinctive value of the imaginative practice shown here, in contrast to those discussed above, is that Jolley et al. are attempting to clarify the decisive constraints that any post-‐translational oscillator must satisfy. The graphic attains imaginative success in putting forth an hypothesis regarding near-‐universal features of any such oscillator: this hypothesis then recommends certain standards for assessing imaginative success elsewhere, laying down general constraints which (if the hypothesis is a good one) any future bout of imaginative reasoning (i.e., any future positing of a hypothetical mechanism) must satisfy to attain success. In Figure 7 above, the structure and operations of the modeled system are foregrounded. Some temporal information (about rates of reactions) is included, but it remains difficult to mentally animate this graphic to understand how the whole system will behave over time. Rust et al.'s strategy for addressing this, seen in in Figure 5, was to employ an abstract 5 Offering the model is thus a step in the dynamic practice of heuristic category-negotiation (Sheredos 2015).

Sheredos and Bechtel: Imaging Mechanisms with Diagrams—June 2016 p. 19
space in which one dimension of the page represents time, and the other represents a quantitative value (abundance of each KaiC phosphoform). An alternative strategy is to employ an abstract “state-‐space” in which every dimension defines the range of values on a variable, and then plot the state of the system at successive instants of time as a trajectory through that abstract space. Jolley et al. plotted successive states of their imagined system in a space defined by two variables, S00 and S10. Three trajectories of the mechanism are shown in the blue, green, and red lines, with arrowheads showing the direction of successive values. By following many such trajectories, researchers can identify abstract patterns of a complex system's dynamics, since they are imagined as visual patterns in that space. For example, all three trajectories shown in Figure 8 asymptote on the black closed form known as a limit cycle. The fact that the form is closed indicates that as the system approximates the represented values, it will continue to cycle through the sequence of values indefinitely—that is, it exhibits sustained oscillations. By constructing this abstract space, an exceedingly complex dynamic pattern in a system's operations can be creatively displayed using a simple loop. While this graphic does not provide precise temporal information (e.g., it does not make clear how much time it takes for the system to move from one point on the trajectory to another), it can be used to provide general information about the system's dynamics. Further information (which they present in other figures) is required to ensure that the oscillations are circadian in their time course, with one oscillation occurring roughly every 24 hours.
Figure 8. Jolley et al.’s phase space plot showing how the functioning of their imagined oscillator results in a limit cycle.
As before, this extremely abstract representation puts forth a hypothesis which can be taken to impose constraints upon any future imaginative success. The amount of background knowledge involved in understanding these constraints, and the difficulty of invoking them “in the mind's eye” illustrate again the utility of scientists' reliance on external visualizations in attaining imaginative success. 5. Conclusions: How-‐Possibly Mechanisms as Imaginative Successes

Sheredos and Bechtel: Imaging Mechanisms with Diagrams—June 2016 p. 20
We have examined the epistemic activities through which scientists construct how-‐possibly accounts of mechanisms, that is, accounts of possible mechanisms that could explain a phenomenon of interest. Although how-‐possibly accounts have often been valued only as means to attain how-‐actually accounts, they represent important successes in science. Even in cases in which the account turns out to correspond to what is actual, the how-‐possibly account plays a critical role in showing that that mechanism could produce the phenomenon. Our interest has been in understanding the epistemic success of providing a how-‐possibly account. The epistemic activities which go into providing how-‐possibly accounts can be regarded as involving imagination, characterized in terms of involving visualization, creatively going beyond the evidence, being fictive by not entailing a commitment to actuality, and allowing for constrained flexibility in generating a mechanism design. We have regarded diagrams as the external traces of scientists' imaginative reasoning, enabling us to examine how their imaginative reasoning proceeds. We have suggested that it is fruitful to regard the construction of an account of a how-‐possibly mechanism as an imaginative success, where the success consists in advancing a scientific field by integrating data to provide an intelligible explanation of the phenomenon. This is an achievement which must be understood independently of (and is in fact presupposed by) the kind of success which would be achieved by a how-‐actually account, and which would herald the completion of research regarding a phenomenon. To provide this account, we have relied on diagrams as the traces of imaginative reasoning. Diagrams figure prominently in scientists’ construction and presentation of how-‐possibly accounts of mechanisms. We examined a variety of published diagrams as well as drafts generated before publication from research on circadian rhythms in cyanobacteria. Diagrams clearly involve visualization, are fictive in that they do not themselves assert that the proposed mechanism is actual, involve creativity in putting together the components of a mechanism in a way that could produce the phenomenon, and exhibit constrained free variability, often signaled by the role of question marks in a diagram. Since they are supported by data, diagrams are not entirely fictive, but instead operate under constraints. By comparing successful diagrams we showed how further research both restricts the free variability and opens up new avenues for variation. The discovery that post-‐translational processes suffice for circadian rhythms revealed that the diagrams in Figures 1 and 2 were clearly fictive in that they did not correspond to the actual mechanism. The diagrams shown in Figure 3 are also fictive in that they present competing accounts of how the mechanism might work, going beyond the data. It is through this interplay of fact and imagination that all of these authors achieve imaginative success, by in offering accounts of mechanisms that could intelligibly generate circadian rhythms., thereby providing explicit targets for future research. Such success is not simple and automatic, as shown by a case in which we had access to drafts of the mechanism the researchers were proposing to explain how the circadian oscillator regulates gene expression. Here, not surprisingly, early drafts, while in part successful, also exhibited imaginative failure. The first draft exhibited the basic finding of the researchers that the S-‐phosphoform of KaiC drives gene expression, but did not show

Sheredos and Bechtel: Imaging Mechanisms with Diagrams—June 2016 p. 21
how it interacted with another, already established pathway. We presented one of many drafts that the researchers constructed in the process of exploring how the two pathways interacted. While these did include both pathways, and in that sense were more successful, the attempt to incorporate detail about the interaction led these to become increasingly complicated. Finally, the researchers chose to simplify the diagram by leaving out details not pertinent to the question of the interaction of the two pathways and constructed separate diagrams for the two classes of gene promoters involved. This proved far more successful and led to the diagram they published. The unpublished record gives an indication of the value that scientists assign to imaginative success, and the difficulties they often face – and work to overcome – in attaining it. Unique difficulties are involved in imagining a possible mechanism's operations over time. With relatively simple mechanisms that are organized sequentially and do not involve significant non-‐linearities, people can successfully imagine them in operation and draw conclusions about how the proposed mechanism would behave. But many of the mechanisms being proposed in contemporary biology, such as those involving the cyanobacterial circadian clock, are not sequentially organized (employing sometimes multiple feedback loops) and involve non-‐linear reactions. We showed that in the case of one of the accounts of a possible mechanisms considered earlier, the researchers turned to computational modeling to determine how their proposed mechanisms would behave, This activity itself was grounded in the diagram in which they had imagined the mechanism. We finished with a case in which, in the effort to understand the basic principles operative in a proposed mechanism, researchers abstracted from details of the mechanism and explored through a computational model what parameter values were required to yield the phenomenon. In both these cases, the researchers represented the results of their modeling in graph representations that enabled them to present the results of the simulation of the imagined mechanism. These cases illustrate again how diagrams are employed to facilitate imaginative success. We conclude that an important part of the epistemic project when scientists develop mechanistic explanations is imagining possible mechanisms by representing the parts, operations, and organization of the mechanism in diagrams and then putting those diagrams to work in further imagining (often using computational simulations) how those mechanisms will operate. Putting components together and showing that the possible mechanism could generate the phenomenon are important imaginative successes in the development of intelligible mechanistic explanations, and visualizing computational models is a crucial component of this success. Notably, imaginative success serves to generate norms—as researchers develop diagrams and computational models that they regard as establishing requirements on mechanisms that can account for a phenomenon, they lay down basic constraints which must be satisfied by any future imagining of this type of mechanism. In this respect, norms of imaginative success exhibit a kind of self-‐regulation, which we are unlikely to understand until we treat imaginative success on its own terms, disentangling it from the norms that govern successful attainment of a “how-‐actually” explanation. References

Sheredos and Bechtel: Imaging Mechanisms with Diagrams—June 2016 p. 22
Bechtel, W. (2006). Discovering cell mechanisms: The creation of modern cell biology. Cambridge: Cambridge University Press.
Bechtel, W., & Abrahamsen, A. (2005). Explanation: A mechanist alternative. Studies in History and Philosophy of Biological and Biomedical Sciences, 36, 421-‐441.
Bechtel, W., & Abrahamsen, A. (2010). Dynamic mechanistic explanation: Computational modeling of circadian rhythms as an exemplar for cognitive science. Studies in History and Philosophy of Science Part A, 41, 321-‐333.
Bechtel, W., & Richardson, R. C. (1993/2010). Discovering complexity: Decomposition and localization as strategies in scientific research. Cambridge, MA: MIT Press. 1993 edition published by Princeton University Press.
Boden, M. A. (2004). The creative mind: Myths and mechanisms (2nd ed.). London ; New York: Routledge.
Burnston, D. C., Sheredos, B., Abrahamsen, A., & Bechtel, W. (2014). Scientists' use of diagrams in developing mechanistic explanations: A case study from chronobiology. Pragmatics and Cognition, 22, 224-‐243.
Byrne, R. M. J. (2005). The rational imagination: How people create alternatives to reality. Cambridge, Mass.: MIT Press.
Craver, C. F., & Darden, L. (2013). In search of mechanisms: Discoveries across the life sciences. Chicago: University of Chicago Press.
Currie, G., & Ravenscroft, I. (2002). Recreative Minds: Imagination in Philosophy and Psychology. Oxford: Oxford University Press.
Ditty, J. L., Williams, S. B., & Golden, S. S. (2003). A cyanobacterial circadian timing mechanism. Annual Review of Genetics, 37, 513-‐543.
Green, S., Levy, A., & Bechtel, W. (2014). Design sans adaptation. European Journal for Philosophy of Science, 5, 15-‐29.
Hegarty, M. (1992). Mental animation: Inferring motion from static displays of mechanical systems. Journal of Experimental Psychology: Learning, Memory, and Cognition, 18, 1084-‐1102.
Ishiura, M., Kutsuna, S., Aoki, S., Iwasaki, H., Andersson, C. R., Tanabe, A., Golden, S. S., Johnson, C. H., & Kondo, T. (1998). Expression of a gene cluster kaiABC as a circadian feedback process in Cyanobacteria. Science, 281, 1519-‐1523.
Iwasaki, H., & Kondo, T. (2000). The current state and problems of circadian clock studies in cyanobacteria. Plant Cell Physiology, 41, 1013-‐1020.
Jolley, C. C., Ode, K. L., & Ueda, H. R. (2012). A design principle for a posttranslational biochemical oscillator. Cell Reports, 2, 938-‐950.
Jones, N., & Wolkenhauer, O. (2012). Diagrams as locality aids for explanation and model construction in cell biology. Biology and Philosophy, 27, 705-‐721.
Kaplan, D. M., & Craver, C. F. (2011). The Explanatory Force of Dynamical and Mathematical Models in Neuroscience: A Mechanistic Perspective. Philosophy of Science, 78, 601-‐627.
Kirsh, D., & Maglio, P. (1994). On Distinguishing Epistemic from Pragmatic Action. Cognitive Science, 18, 513-‐549.
Kosslyn, S. M. (1994). Image and brain: The resolution of the imagery debate. Cambridge, MA: MIT Press.
Machamer, P., Darden, L., & Craver, C. F. (2000). Thinking about mechanisms. Philosophy of Science, 67, 1-‐25.

Sheredos and Bechtel: Imaging Mechanisms with Diagrams—June 2016 p. 23
Liao, S.-‐Y. & Gendler, T. S. (2011). Pretense and imagination.Wiley Interdisciplinary Reviews—Cognitive Scieince, 2, 79-‐94.
Levy, A., & Bechtel, W. (2013). Abstraction and the organization of mechanisms. Philosophy of Science, 80, 241-‐261.
Mori, T., Williams, D. R., Byrne, M. O., Qin, X., Egli, M., McHaourab, H. S., Stewart, P. L., & Johnson, C. H. (2007). Elucidating the Ticking of an In Vitro Circadian Clockwork. PLoS Biology, 5, e93.
Nakajima, M., Imai, K., Ito, H., Nishiwaki, T., Murayama, Y., Iwasaki, H., Oyama, T., & Kondo, T. (2005). Reconstitution of circadian oscillation of cyanobacterial KaiC phosphorylation in vitro. Science, 308, 414-‐415.
Paddock, M. L., Boyd, J. S., Adin, D. M., & Golden, S. S. (2013). Active output state of the Synechococcus Kai circadian oscillator. Proceedings of the National Academy of Sciences, 110, E3849-‐E3857.
Rust, M. J., Markson, J. S., Lane, W. S., Fisher, D. S., & O'Shea, E. K. (2007). Ordered phosphorylation governs oscillation of a three-‐protein circadian clock. Science, 318, 809-‐812.
Schwartz, D. L., & Black, T. (1999). Inferences through imagined actions: Knowing by simulated doing. Journal of Experimental Psychology: Learning, Memory, and Cognition, 25, 116-‐136.
Sheredos, B., Burnston, D., Abrahamsen, A., & Bechtel, W. (2013). Why do biologists use so many diagrams? Philosophy of Science, 80, 931-‐944.
Sheredos, B. (2015) Re-‐reconciling the epistemic and ontic views of explanation (or, why the ontic view cannot support norms of generality). Ekenntnis 1-‐31. DOI: 10.1007/s10670-‐015-‐9775-‐5
Strawson, P. F. (1970). Imagination and perception. In L. Foster & J. W. Swanson (Eds.), Experience and theory (pp. 31-‐54). Amherst, MA: University of Massachusetts Press.
Thomas, N. J. T. (1999). Are theories of imagery theories of imagination? An active perception approach to conscious mental content. Cognitive Science, 23, 207-‐245.
Tomita, J., Nakajima, M., Kondo, T., & Iwasaki, H. (2005). No Transcription-‐Translation Feedback in Circadian Rhythm of KaiC Phosphorylation. Science, 307, 251-‐254.
Tversky, B. (2011). Visualizing thought. Topics in Cognitive Science, 3, 499-‐535. Walton, K. 1990, Mimesis as Make-‐Believe, Cambridge, MA: Harvard University Press.