shenzhenproj
TRANSCRIPT
Jason Nielsen
GIS 488F
12/4/2014
2014The Industrialization of SSEZ
The Industrialization of SSEZ 2014
Introduction
The interest in the subject of the industrialization of Shenzhen was spawned from a story
featured on the NPR program “This American Life.” It was a report by an independent
journalist/ stage performer, who later was asked to rescind the story due to some fictional details
surrounding the subject of Foxconn Industries, the company responsible for production of Apple
product, specifically the iPhone. However, in this story he mentioned the growth of the city and
area surrounding Shenzhen, and it was mind-blowing how fast the industrialization of this area
occurred.
For this project the hope is to document this growth through the use of satellite imagery,
using techniques to identify and classify the area, in terms of urban growth, vegetation loss, and
agricultural growth. The imagery should depict the timeframe between 1978 to the 2010s.
A Brief History
Before 1978 Shenzhen was a sleepy border town just north of the British Colony, Hong
Kong. Then due to near economic collapse in 1980 China introduced Special Economic Zones
to spur economic growth. Shenzhen was the first area to participate in this economic
experiment. The area was named Shenzhen Special Economic Zone (SSEZ) and was built
through the razing of native villages, agricultural areas were seized and demolished to give rise
to an industrial based zone, which have also been redesigned since its creation. According to the
article “Shenzhen” written by Mee Kam Ng, there were three main goals to creating the SSEZ:
1 | P a g e

The Industrialization of SSEZ 2014
To be a ‘window’ for observing global trends, economically, scientifically,
managerially, and to evaluate market developments
To be a ‘training ground’ for the talents in the mainland
To be an ‘experimenting ground’ for the reforms such as special economic
management systems, flexible economic measure for enhancing economic
cooperation, and technology interflow between China and foreign
countries
In 1979 the overall population of Shenzhen was 310,000 with a temporary population of
1500. As of 2001 that population grew to 4.69 million with a temporary population of 3.3
million. In 1983, 23 km2 of land were developed, by 1997 299.47 km2 had been developed.
From 1980 to 2001 the annual growth rate of GDP was 38.9%. Shenzhen was a planning
experiment for China and its people, as its design was to be for industrial uses to attract foreign
investment, an enormous undertaking for a country just peeking its head out from the veil of
communism.
As a timeline for development of the area:
1980- 1985: Construction Phase. Razing villages and agricultural area for new
industrial zoning and construction
1986- 1990s: Restructuring Phase. Five phases of administrative reform to
simplify government and decentralize power. Focus on export economy
Mid 1990s: Re-engineering Phase: Combining counties in the area and
redesigning Shenzhen to be a World Class City
2 | P a g e

The Industrialization of SSEZ 2014
It is hard to determine whether or not all the original goals were completed or not,
however, Shenzhen has become an enormous area of industrial growth and international
exportation of goods. For the rest of this project the focus will be on the data used for imagery,
the methods used, and the results.
Data
The data used for this project were all from Landsat mission sources, gathered from the
USGS website. There is one image per decade beginning in the year 1978. To see extreme
change between images, the images chosen were about a decade apart. See Table 1 for metadata.
Scene ID File Date Spacecraft ID PathLM21310441978306AAA04 2014-02-28T23:30:17EZ Landsat 2 131LT51220111988185BJC01 2014-04-26T09:33:46Z Landsat 5 122LT51220441994297BJC00 2014-04-25T01:43:58Z Landsat 5 122LT51220442005327BJ02 2014-05-31T20:35:44Z Landsat 5 122LC81220442013365LGN00 2014-02-11T11:55:23Z Landsat 8 122
Row Date Acquired Scene_Center_Time Image Quality44 11/2/1978 01:56:21.5580000Z 044 7/3/1988 02:22:46.9070940Z 944 10/24/1994 02:07:29.2360500Z 944 11/23/2005 02:40:42.6550560Z 744 12/31/2013 02:53:31.3206537Z 9
Some of the interesting things noticed from the metadata was the ‘file dates’ were all
from this year (2014), all filed within a five month span. Also the scene center time were all
between 01:56Z and 2:53Z, which is interesting due to the fact that these were some of the only
useable images. Obviously this is an orbit time issue, but most of the other images were
unusable due to cloud cover or system errors, such as line drops. It would be curious to see if
3 | P a g e
Table 1 : Metadata for USGS images

The Industrialization of SSEZ 2014
this is a common time for low occurrence cloud cover in the area. Also, other than the 1988
image the other four images were sensed in the fall. Lastly, notice the image quality of the 1978
image as being rated 0, this was the best image that could be found, and also this mission was
only sensed in bands 4, 5, and 6.
Methods
Different methods were used for certain landsat images. The Landsat 2 image from 1978
was challenging as it involved only Bands 4 through 6 and no visible spectrum to be used. The
1988, 1994, & 2005 were all Landsat 5 images and generally the same techniques were used for
those images, in the classification process. The Landsat 8 image from 2013 was not used for
classification, however, two different versions of the image were produced.
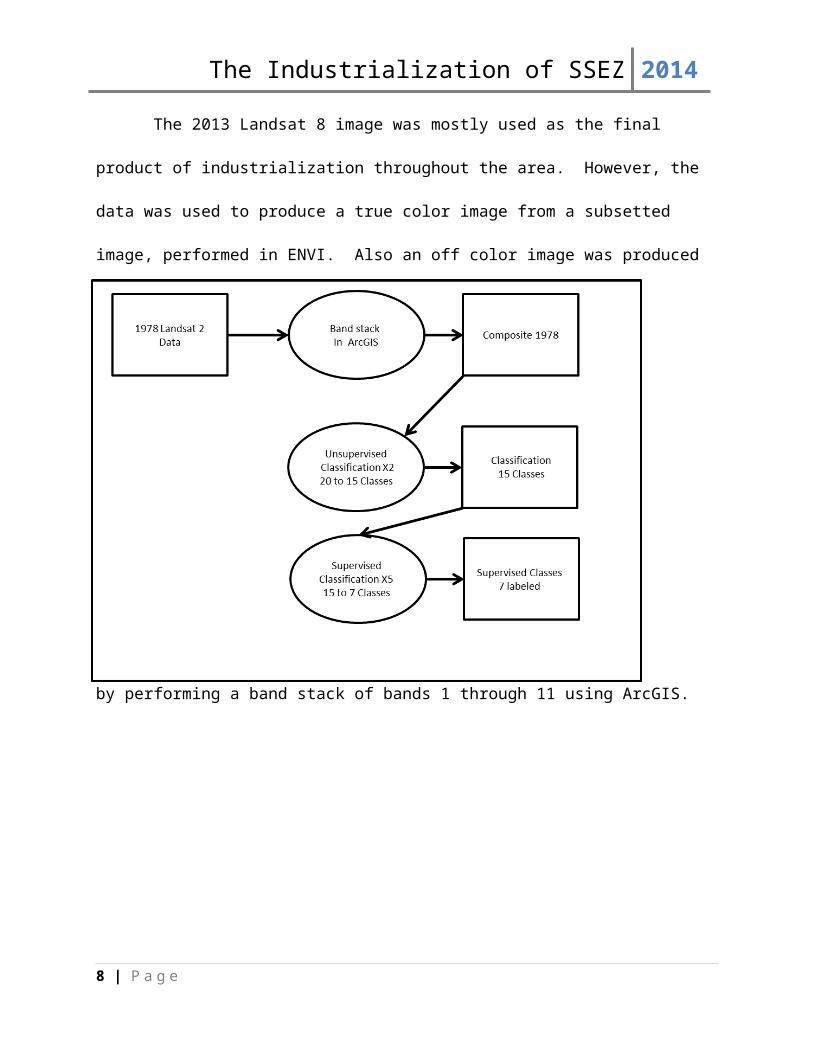
The Landsat 2 image was the only image that was not subsetted in ENVI, mostly because
it is only a 25 MB file and can be used without taking up much time to process. For the
classification of the image the only techniques used were a unsupervised classification, and then
comparing spectral qualities with the nearby urban area of Hong Kong to determine what the
urban spectral classes’ pixel values maybe. From these comparisons several supervised
classification could be ran. Starting with 20 classes through the process it was brought down to 7
classes.
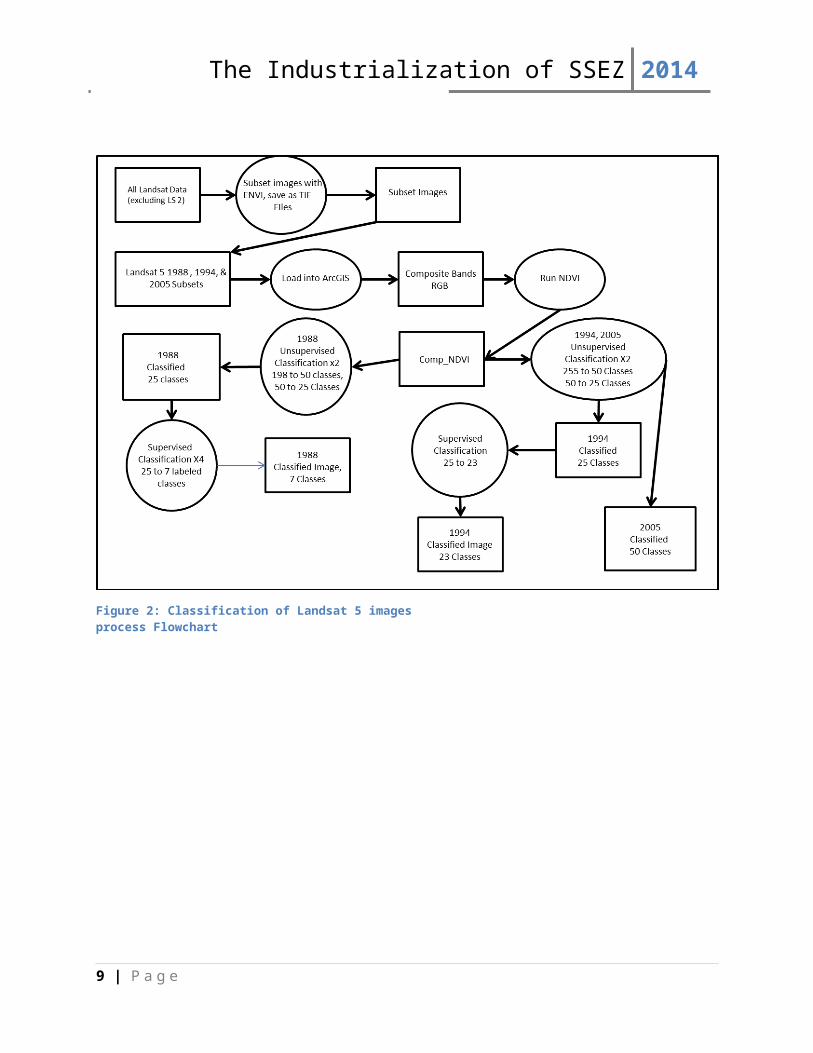
A similar process was done with the Landsat 5 images however, first these images were
subset in ENVI to make them more manageable. In each image an NDVI was performed as a
means of creating contrast between vegetation, water, urban, and barren features. The NDVI
was then run through an unsupervised classification. In the 1988 image the NDVI created 198
classes. Through the unsupervised classification that number was originally reduce to 50 and
4 | P a g e

The Industrialization of SSEZ 2014
then 25. The NDVI performed on the 1994 and 2005 images produced 255 classes, which were
also reduced to 50, and then 25 classes. In the 1994 image a supervised classification was
performed to combine some of the urban classes, which reduced the number from 25 to 23
classes. The 2005 image had no other classification performed. See Figure 1 & 2 for process
flowcharts.
The 2013 Landsat 8 image was mostly used as the final product of industrialization
throughout the area. However, the data was used to produce a true color image from a subsetted
image, performed in ENVI. Also an off color image was produced by performing a band stack
of bands 1 through 11 using ArcGIS.
5 | P a g e
Figure 1: Classification of 1978 Landsat 2 image process Flowchart
The Industrialization of SSEZ 2014
6 | P a g e
Figure 2: Classification of Landsat 5 images process Flowchart
The Industrialization of SSEZ 2014
Results
Each image in this project is intended to tell a different part of the story in the
industrialization of Shenzhen. As the time progresses through each image the need for
classification becomes less and less required. For that reason the last three images have had
some to no classification performed.
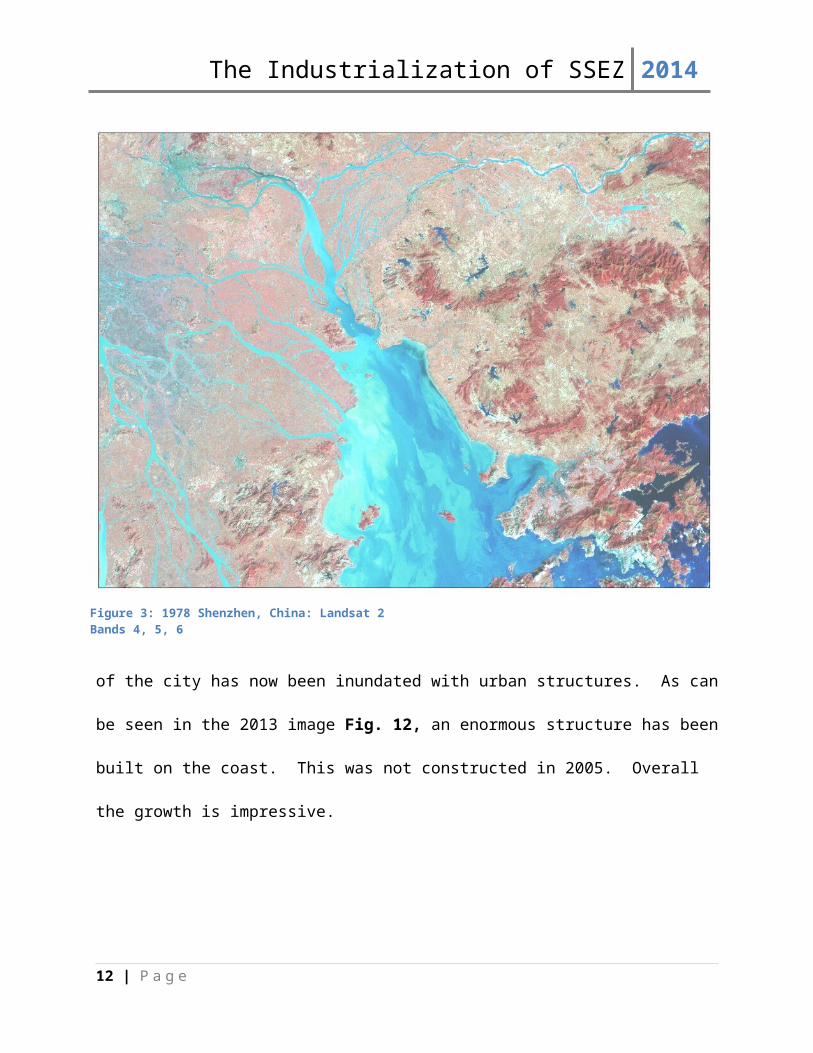
As is visible in the poor quality image form 1978 the ability to depict urbanization in the
area of Shenzhen is difficult. Without the use of Hong Kong’s spectral quality a classification
would probably be almost impossible to perform. See pages 8 and 9 for 1978 images (Figures 3
and 4). Also it there is some obvious overlap in the classes throughout the image. However, it
is fairly obvious this was not an area with much urbanization.
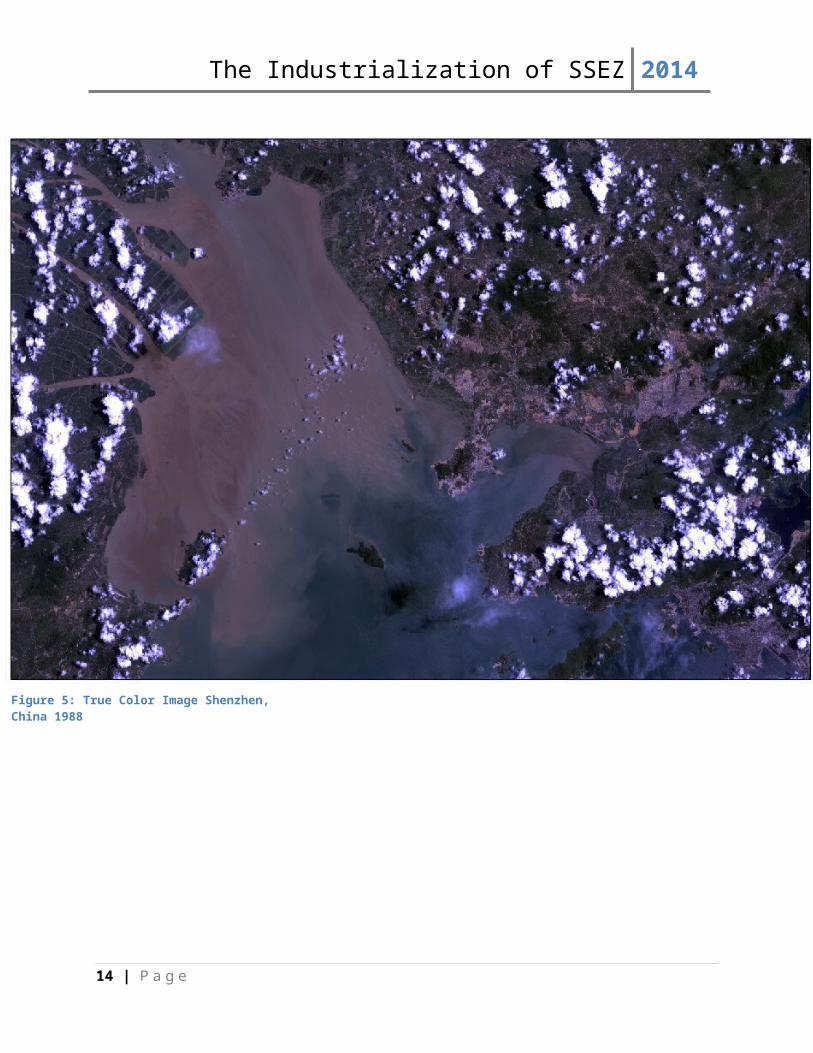
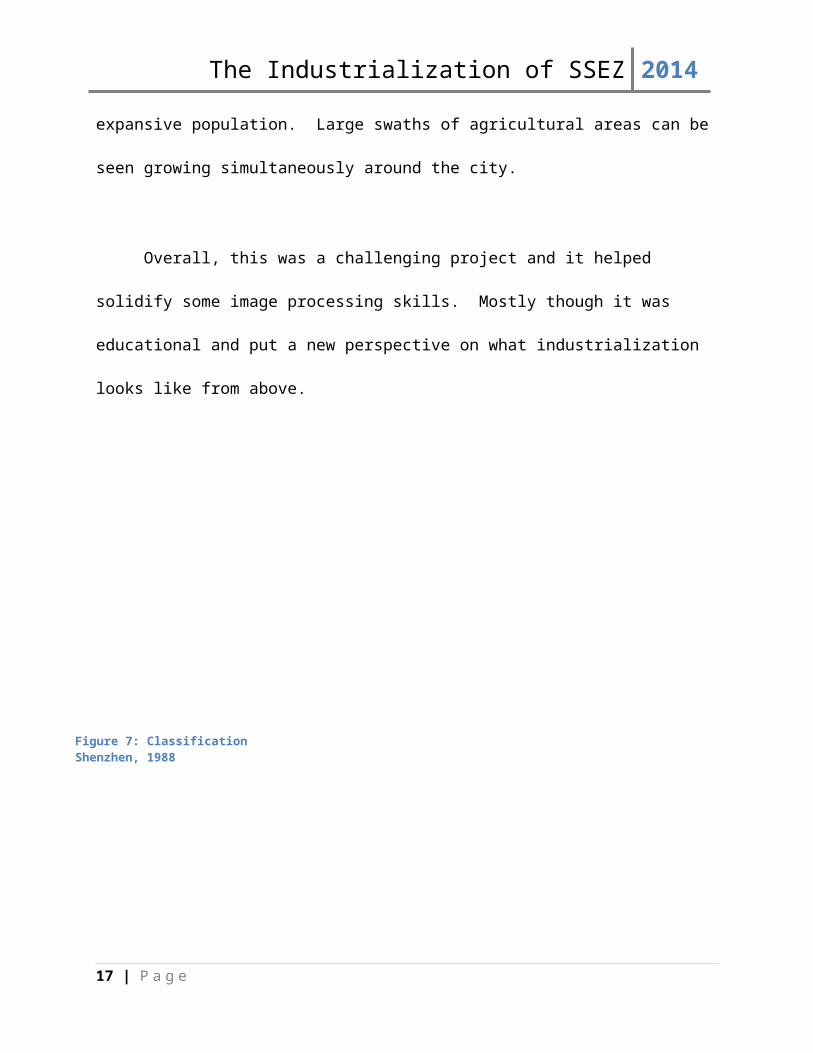
In the 1988 image the quality improves, there is cloud cover that make this classification
difficult. However, through the use of the NDVI classification it makes the contrast of the
features more evident; the use of the NDVI aided in the supervised classification process. Using
a subsetted image for the NDVI also helped because the amount of data that the full image had
was creating the water to be classified similarly to the urban areas. As can be seen in Figures 6
& 7 there is an classifiable urban area, the patterns of streets, agricultural areas, and a retreat of
the natural barren and vegetation is evident.
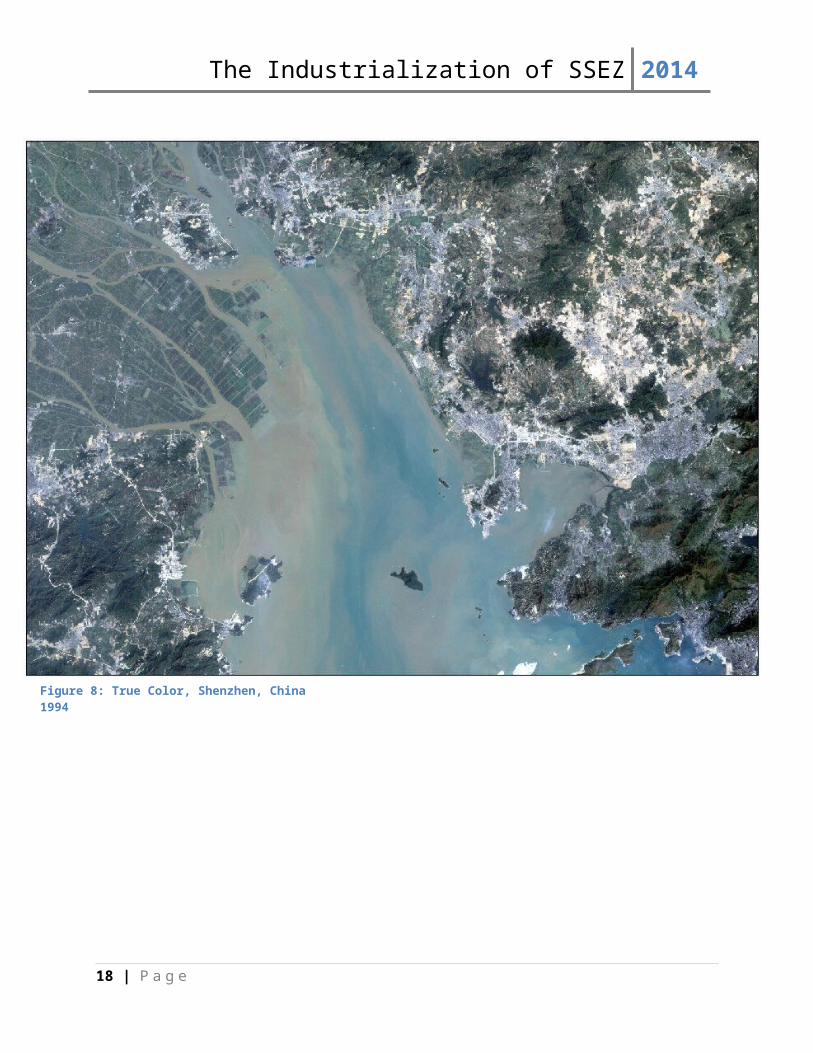
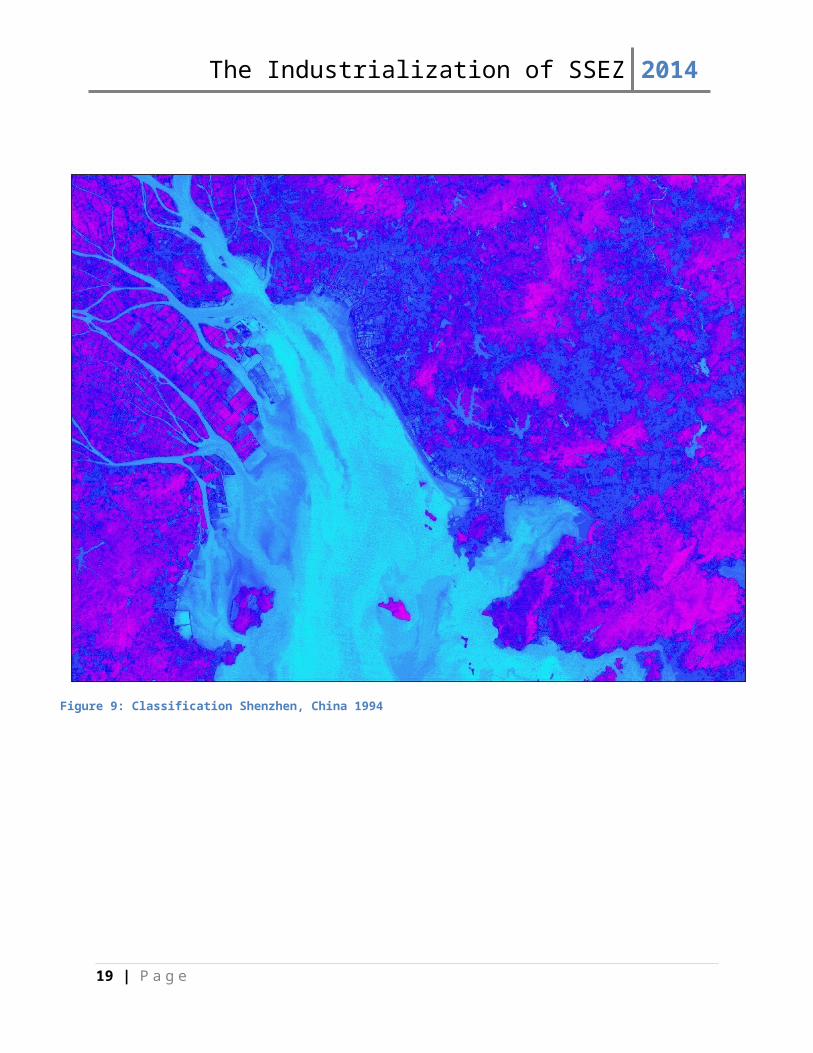
The 1994 through 2013 images truly required no classification. The NDVI and
classification were performed only as a means to create continuity throughout the project. See
all images from pages 8 through 17. In 1994, there is an obvious large city and the expanse to
other regions is visible from just the true color image. The peninsula off the Southwest side
7 | P a g e
The Industrialization of SSEZ 2014
of the city has now been inundated with urban structures. As can be seen in the 2013 image Fig.
12, an enormous structure has been built on the coast. This was not constructed in 2005. Overall
the growth is impressive.
8 | P a g e
Figure 3: 1978 Shenzhen, China: Landsat 2 Bands 4, 5, 6
The Industrialization of SSEZ 2014
9 | P a g e
Figure 4: Classification Shenzhen China, 1978
The Industrialization of SSEZ 2014
10 | P a g e
Figure 5: True Color Image Shenzhen, China 1988

The Industrialization of SSEZ 2014
Conclusion
The rapid industrialization of Shenzhen is an astonishing feat of our global economy.
However, it is truly one thing to hear in a NPR story about this place that has grown from
310,000 people to 5 million in less than 30 years and see it with one’s own eyes.
As a project, I think one image could be fully classified and it would be a more difficult
task than this. However, from the skills that the author possesses that may not have happened in
the timeframe given.
Some of the things that stood out while looking through the images is not only how fast
the industrialization occurred, but also what other land types were created to support this
11 | P a g e
Figure 6: NDVI Shenzhen 1988
The Industrialization of SSEZ 2014
enormous expansive population. Large swaths of agricultural areas can be seen growing
simultaneously around the city.
Overall, this was a challenging project and it helped solidify some image processing
skills. Mostly though it was educational and put a new perspective on what industrialization
looks like from above.
12 | P a g e
Figure 7: Classification Shenzhen, 1988

The Industrialization of SSEZ 2014
13 | P a g e
Figure 8: True Color, Shenzhen, China 1994
The Industrialization of SSEZ 2014
14 | P a g e
Figure 9: Classification Shenzhen, China 1994

The Industrialization of SSEZ 2014
15 | P a g e
Figure 10: True Color Shenzhen, China 2005

The Industrialization of SSEZ 2014
16 | P a g e
Figure 11: Classification Shenzhen, China 2005
The Industrialization of SSEZ 2014
17 | P a g e
Figure 12: True Color Shenzhen, China 2013
The Industrialization of SSEZ 2014
18 | P a g e
Figure 13: Off-Color Shenzhen, China 2005 (Landsat 8 Bands 1 - 11)
The Industrialization of SSEZ 2014
References
Ng, M. K. “Shenzhen.” Cities. 20:6. 429-441. 2003 Dec. Web. 2014 24 November
earthexplorer.usgs.gov
19 | P a g e