sheng siong group ltd - singapore exchange
TRANSCRIPT
SHENG SIONG GROUP LTD Full Year Financial Statement
1
PART 1- INFORMATION REQUIRED FOR ANNOUNCEMENTS OF QUARTERLY (Q1, Q2, Q3),
HALF-YEAR AND FULL YEAR ANNOUNCEMENTS
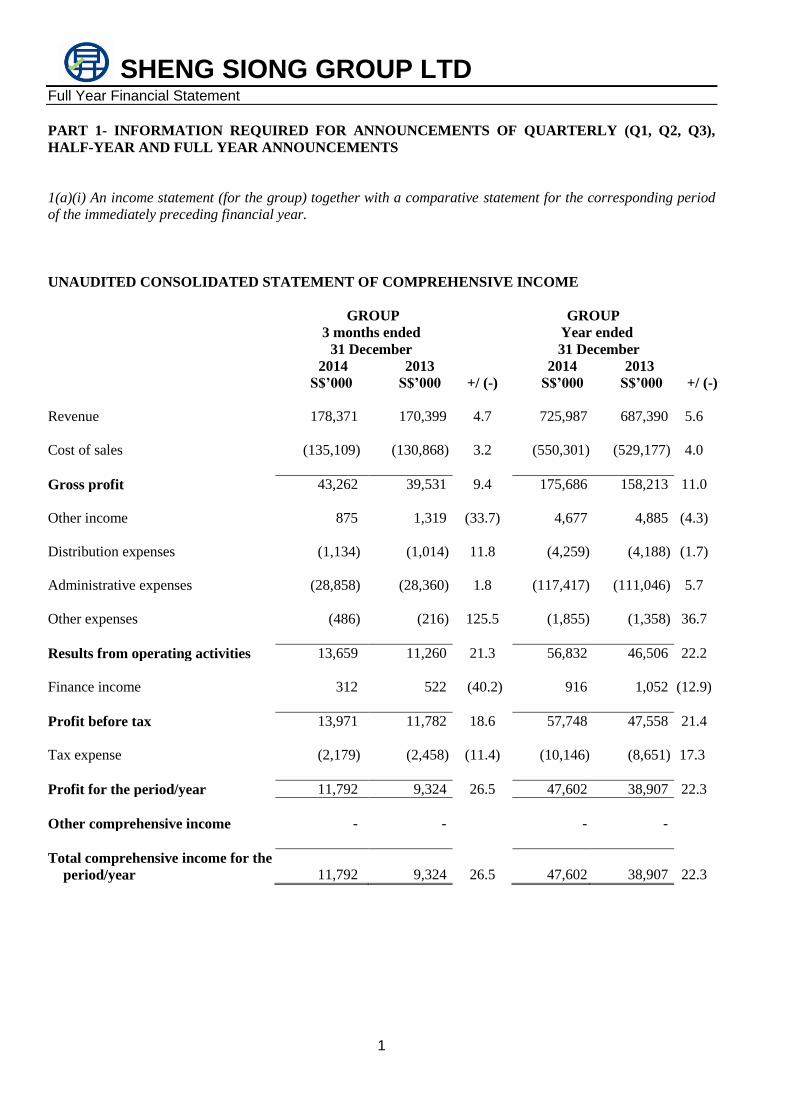
1(a)(i) An income statement (for the group) together with a comparative statement for the corresponding period
of the immediately preceding financial year.
UNAUDITED CONSOLIDATED STATEMENT OF COMPREHENSIVE INCOME
GROUP GROUP
3 months ended Year ended
31 December 31 December
2014 2013 2014 2013
S$’000 S$’000 +/ (-) S$’000 S$’000 +/ (-)
Revenue 178,371 170,399 4.7 725,987 687,390 5.6
Cost of sales (135,109) (130,868) 3.2 (550,301) (529,177) 4.0
Gross profit 43,262 39,531 9.4 175,686 158,213 11.0
Other income 875 1,319 (33.7) 4,677 4,885 (4.3)
Distribution expenses (1,134) (1,014) 11.8 (4,259) (4,188) (1.7)
Administrative expenses (28,858) (28,360) 1.8 (117,417) (111,046) 5.7
Other expenses (486) (216) 125.5 (1,855) (1,358) 36.7
Results from operating activities 13,659 11,260 21.3 56,832 46,506 22.2
Finance income 312 522 (40.2) 916 1,052 (12.9)
Profit before tax 13,971 11,782 18.6 57,748 47,558 21.4
Tax expense (2,179) (2,458) (11.4) (10,146) (8,651) 17.3
Profit for the period/year 11,792 9,324 26.5 47,602 38,907 22.3
Other comprehensive income - - - -
Total comprehensive income for the
period/year 11,792 9,324 26.5 47,602 38,907 22.3
SHENG SIONG GROUP LTD Full Year Financial Statement
2
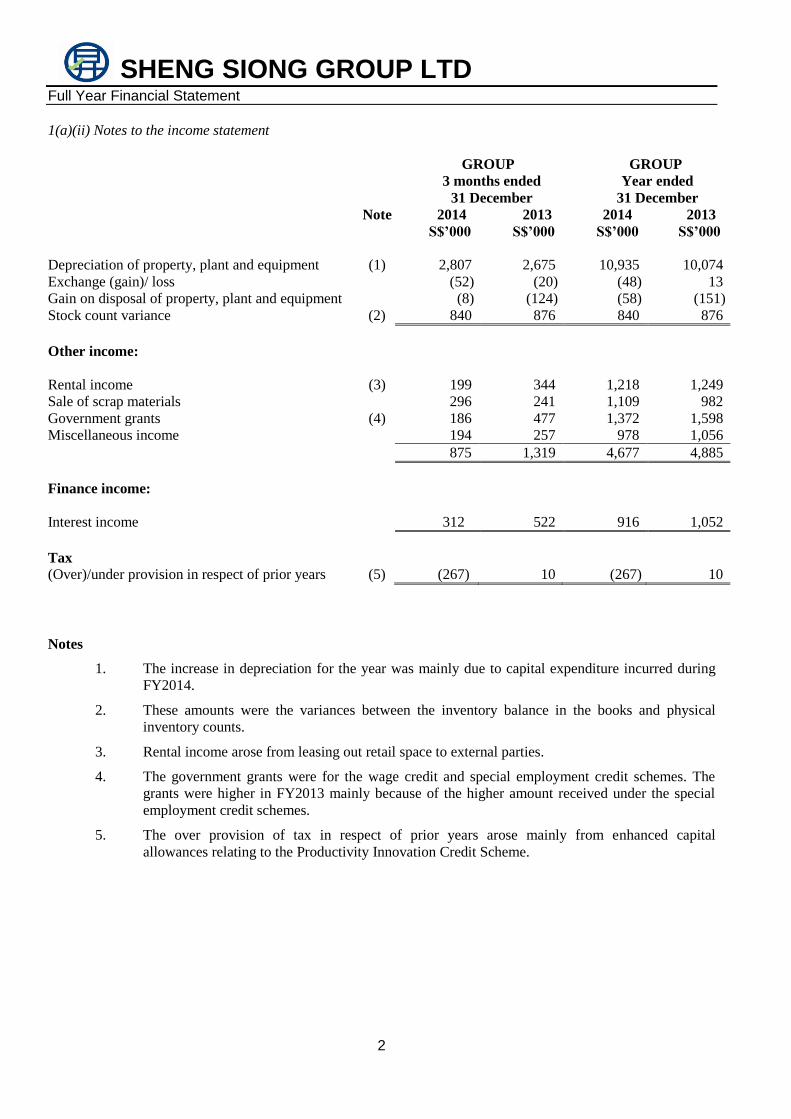
1(a)(ii) Notes to the income statement
GROUP GROUP
3 months ended
31 December
Year ended
31 December
Note 2014 2013 2014 2013
S$’000 S$’000 S$’000 S$’000
Depreciation of property, plant and equipment (1) 2,807 2,675 10,935 10,074
Exchange (gain)/ loss (52) (20) (48) 13
Gain on disposal of property, plant and equipment (8) (124) (58) (151)
Stock count variance (2) 840 876 840 876
Other income:
Rental income (3) 199 344 1,218 1,249
Sale of scrap materials 296 241 1,109 982
Government grants (4) 186 477 1,372 1,598
Miscellaneous income 194 257 978 1,056
875 1,319 4,677 4,885
Finance income:
Interest income 312 522 916 1,052
Tax
(Over)/under provision in respect of prior years (5) (267) 10 (267) 10
Notes
1. The increase in depreciation for the year was mainly due to capital expenditure incurred during
FY2014.
2. These amounts were the variances between the inventory balance in the books and physical
inventory counts.
3. Rental income arose from leasing out retail space to external parties.
4. The government grants were for the wage credit and special employment credit schemes. The
grants were higher in FY2013 mainly because of the higher amount received under the special
employment credit schemes.
5. The over provision of tax in respect of prior years arose mainly from enhanced capital
allowances relating to the Productivity Innovation Credit Scheme.

SHENG SIONG GROUP LTD Full Year Financial Statement
3
1(b)(i) CONSOLIDATED STATEMENT OF FINANCIAL POSITION
GROUP COMPANY
31 Dec 2014 31 Dec 2013 31 Dec 2014 31 Dec 2013
S$’000 S$’000 S$’000 S$’000
Non-current assets
Property, plant and equipment 160,662 90,756 - -
Investment in subsidiaries - - 78,234 78,234
160,662 90,756 78,234 78,234
Current assets
Inventories 43,142 45,566 - -
Trade and other receivables 10,748 12,247 182,900 67,888
Cash and cash equivalents 130,470 99,678 386 33,973
184,360 157,491 183,286 101,861
Total assets 345,022 248,247 261,520 180,095
Equity attributable to equity holders of
the Company
Share capital 235,373 156,349 235,373 156,349
Merger reserve (68,234) (68,234) - -
Accumulated profits 69,136 61,656 25,794 23,381
Total equity 236,275 149,771 261,167 179,730
Non-current liabilities
Deferred tax liabilities 2,204 2,292 - -
2,204 2,292 - -
Current liabilities
Trade and other payables 95,845 88,243 353 336
Current tax payable 10,698 7,941 - 29
106,543 96,184 353 365
Total liabilities 108,747 98,476 353 365
Total equity and liabilities 345,022 248,247 261,520 180,095
1(b)(ii) Aggregate amount of Group’s borrowings and debt securities
The Group had no borrowings as at the end of FY2013 and FY2014 respectively.
SHENG SIONG GROUP LTD Full Year Financial Statement
4
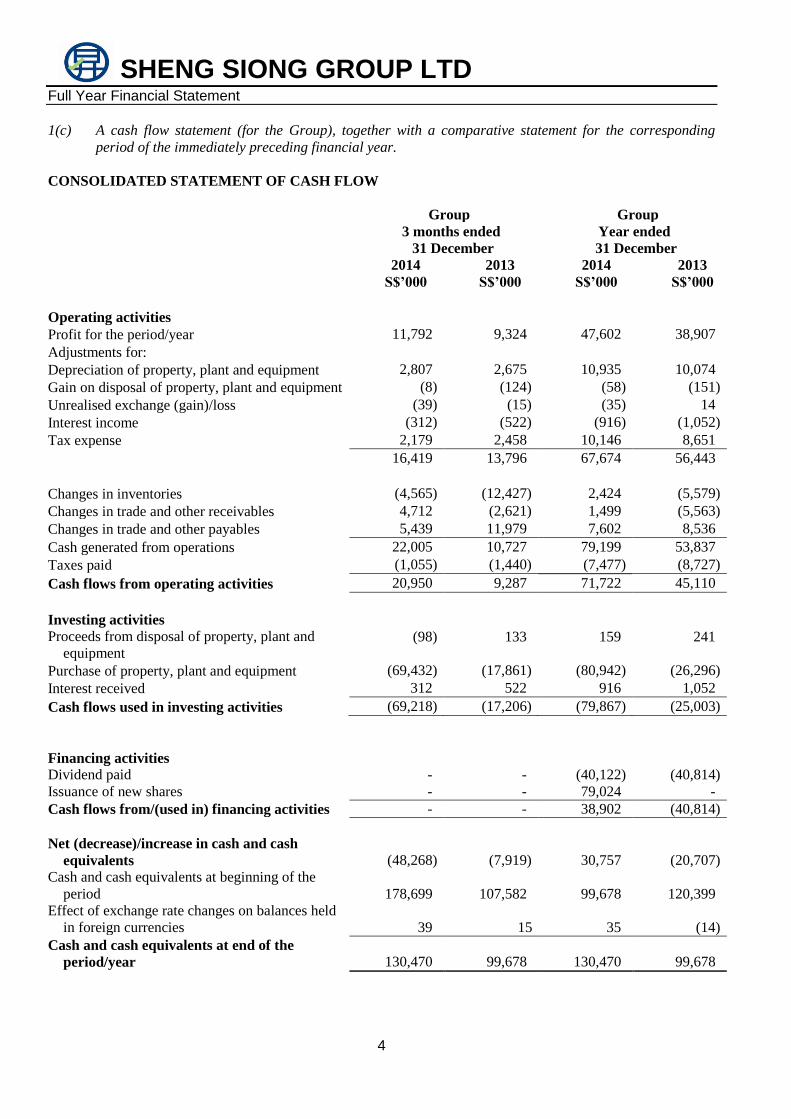
1(c) A cash flow statement (for the Group), together with a comparative statement for the corresponding
period of the immediately preceding financial year.
CONSOLIDATED STATEMENT OF CASH FLOW
Group Group
3 months ended Year ended
31 December 31 December
2014 2013 2014 2013
S$’000 S$’000 S$’000 S$’000
Operating activities
Profit for the period/year 11,792 9,324 47,602 38,907
Adjustments for:
Depreciation of property, plant and equipment 2,807 2,675 10,935 10,074
Gain on disposal of property, plant and equipment (8) (124) (58) (151)
Unrealised exchange (gain)/loss (39) (15) (35) 14
Interest income (312) (522) (916) (1,052)
Tax expense 2,179 2,458 10,146 8,651
16,419 13,796 67,674 56,443
Changes in inventories (4,565) (12,427) 2,424 (5,579)
Changes in trade and other receivables 4,712 (2,621) 1,499 (5,563)
Changes in trade and other payables 5,439 11,979 7,602 8,536
Cash generated from operations 22,005 10,727 79,199 53,837
Taxes paid (1,055) (1,440) (7,477) (8,727)
Cash flows from operating activities 20,950 9,287 71,722 45,110
Investing activities
Proceeds from disposal of property, plant and
equipment (98) 133 159 241
Purchase of property, plant and equipment (69,432) (17,861) (80,942) (26,296)
Interest received 312 522 916 1,052
Cash flows used in investing activities (69,218) (17,206) (79,867) (25,003)
Financing activities
Dividend paid - - (40,122) (40,814)
Issuance of new shares - - 79,024 -
Cash flows from/(used in) financing activities - - 38,902 (40,814)
Net (decrease)/increase in cash and cash
equivalents (48,268) (7,919) 30,757 (20,707)
Cash and cash equivalents at beginning of the
period 178,699 107,582 99,678 120,399
Effect of exchange rate changes on balances held
in foreign currencies 39 15 35 (14)
Cash and cash equivalents at end of the
period/year 130,470 99,678 130,470 99,678

SHENG SIONG GROUP LTD Full Year Financial Statement
5
1(d)(i) A statement (for the issuer and group) showing (i) all change in equity or (ii) change in equity other than
those arising from capitalization issues and distributions to shareholders, together with a comparative statement
for the corresponding period of the immediately preceding financial period.
Group
Share
capital
Merger
reserve
Accumulated
profits
Total
Equity
S$’000 S$’000 S$’000 S$’000
As at 1 January 2013 156,349 (68,234) 63,563 151,678
Total comprehensive income
for the year
Profit for the year - - 38,907 38,907
Transactions with owners, recorded directly in
equity:
Distributions to owners
Dividends declared - - (40,814) (40,814)
Total transactions with owners - - (40,814) (40,814)
At 31 December 2013 156,349 (68,234) 61,656 149,771
Group
Share
capital
Merger
reserve
Accumulated
profits
Total
Equity
S$’000 S$’000 S$’000 S$’000
As at 1 January 2014 156,349 (68,234) 61,656 149,771
Total comprehensive income
for the year
Profit for the year - - 47,602 47,602
Transactions with owners, recorded directly in
equity:
Contribution from/(distribution to) owners
Issuance of new shares 79,024 - - 79,024
Dividends declared - - (40,122) (40,122)
Total transactions with owners 79,024 - (40,122) 38,902
As at 31 December 2014 235,373 (68,234) 69,136 236,275
SHENG SIONG GROUP LTD Full Year Financial Statement
6
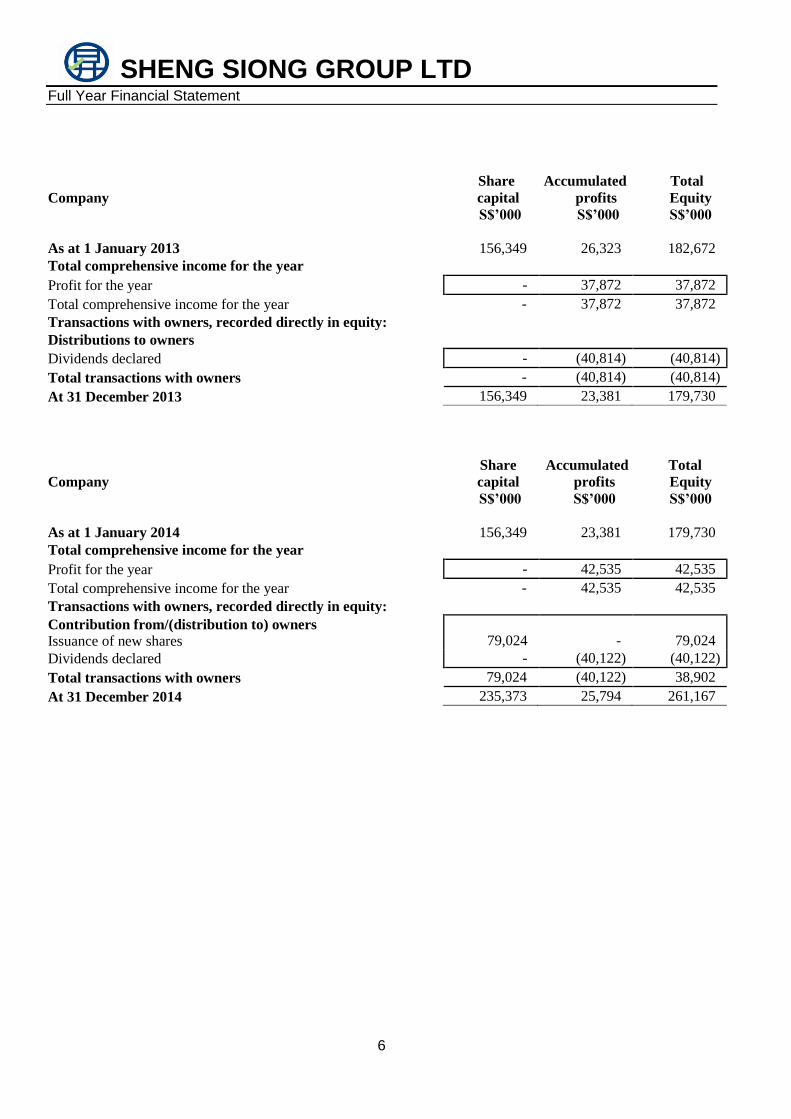
Company
Share
capital
Accumulated
profits
Total
Equity
S$’000 S$’000 S$’000
As at 1 January 2013 156,349 26,323 182,672
Total comprehensive income for the year
Profit for the year - 37,872 37,872
Total comprehensive income for the year - 37,872 37,872
Transactions with owners, recorded directly in equity:
Distributions to owners
Dividends declared - (40,814) (40,814)
Total transactions with owners - (40,814) (40,814)
At 31 December 2013 156,349 23,381 179,730
Company
Share
capital
Accumulated
profits
Total
Equity
S$’000 S$’000 S$’000
As at 1 January 2014 156,349 23,381 179,730
Total comprehensive income for the year
Profit for the year - 42,535 42,535
Total comprehensive income for the year - 42,535 42,535
Transactions with owners, recorded directly in equity:
Contribution from/(distribution to) owners
Issuance of new shares 79,024 - 79,024
Dividends declared - (40,122) (40,122)
Total transactions with owners 79,024 (40,122) 38,902
At 31 December 2014 235,373 25,794 261,167

SHENG SIONG GROUP LTD Full Year Financial Statement
7
1(d)(ii) Details of any changes in the company’s share capital arising from rights issue, bonus issue, share buy-
backs, exercise of share option or warrants, conversion of other issues of equity securities, issue of
shares for cash or as consideration for acquisition or for any other purpose since the end of the previous
period reported on. State also the number of shares that may be issued on conversion of all the
outstanding convertibles, as well as the number of shares held as treasury shares, if any, against the total
number of issued shares excluding treasury shares of the issuer, as at the end of the current financial
period reported on and as at the end of the corresponding period of the immediately preceding financial
year.
The changes to the Company’s capital were:-
Total number of shares as at 31 December 2013 1,383,537,000
Issue of new shares for cash on 9 September 2014 120,000,000
Total number of shares as at 31 December 2014 1,503,537,000
There are no shares that may be issued on conversion of outstanding convertibles and there are no treasury shares
held.
1(d)(iii) To show the total number of issued shares as at the end of the current financial period and as at the end
of the immediately preceding year.
As at
31 Dec 2014 31 Dec 2013
Company No of shares No of shares
Total number of issued shares (‘000) 1,503,537 1,383,537
1(d)(iv) A statement showing all sales, transfer, disposal, cancellation and/or use of treasury shares as at the end
of the current financial period reported on.
There were no treasury shares held at the end of the current financial period reported on.
2. Whether the figures have been audited, or reviewed and in accordance with which auditing standard or
practice.
The figures have not been audited or reviewed.
3. Where the figures have been audited or reviewed, the auditors’ report (including any qualifications or
emphasis of matter).
Not applicable.
4. Whether the same accounting policies and methods of computation as in the issuer’s most recently audited
annual financial statements have been applied.
The Group has applied the same accounting policies and computation methods used in the preparation of the
financial statements for the current financial year as compared with the audited financial statements as at 31
December 2013, except for the adoption of the new and revised Financial Reporting Standards (FRS) which
SHENG SIONG GROUP LTD Full Year Financial Statement
8
become effective for the financial year beginning on or after 1 January 2014. The adoption of these new and
revised accounting standards did not give rise to any material financial impact to the financial statements.
5. If there any changes in the accounting policies and methods of computation, including any required by an
accounting standard, what has changed, as well as the reasons for, and the effect of, the change.
Please refer to paragraph 4.
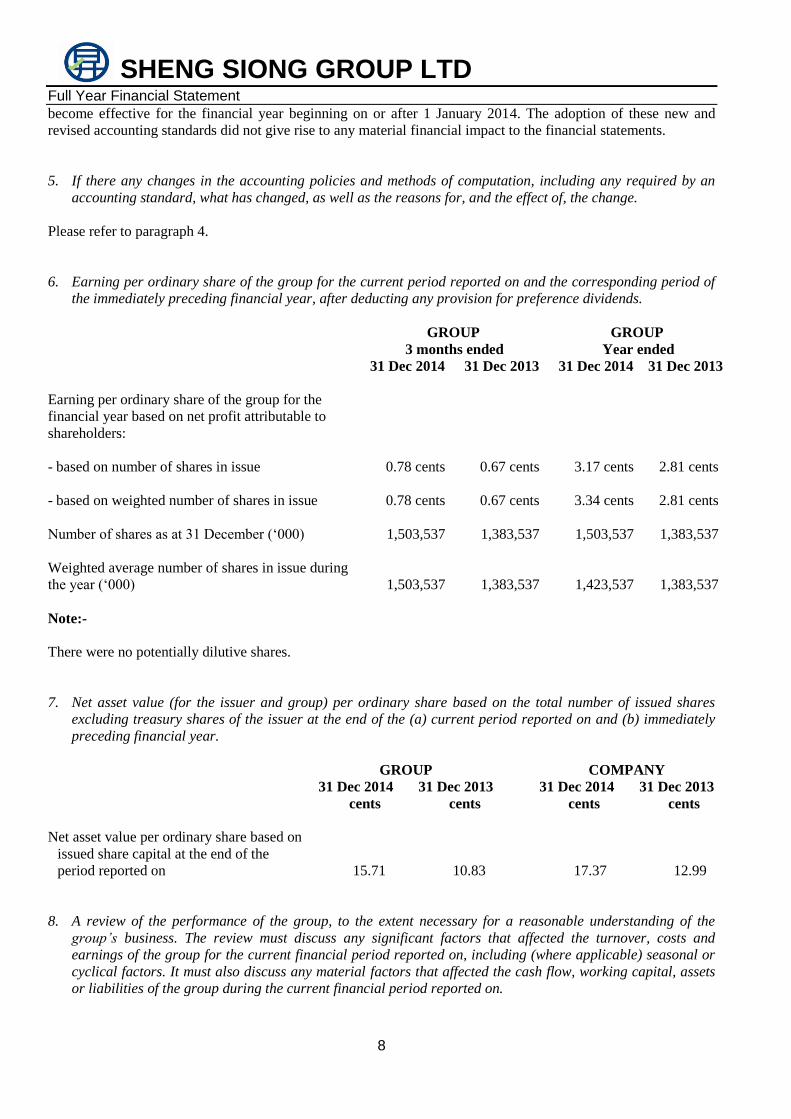
6. Earning per ordinary share of the group for the current period reported on and the corresponding period of
the immediately preceding financial year, after deducting any provision for preference dividends.
GROUP GROUP
3 months ended Year ended
31 Dec 2014 31 Dec 2013 31 Dec 2014 31 Dec 2013
Earning per ordinary share of the group for the
financial year based on net profit attributable to
shareholders:
- based on number of shares in issue 0.78 cents 0.67 cents 3.17 cents 2.81 cents
- based on weighted number of shares in issue 0.78 cents 0.67 cents 3.34 cents 2.81 cents
Number of shares as at 31 December (‘000) 1,503,537 1,383,537 1,503,537 1,383,537
Weighted average number of shares in issue during
the year (‘000) 1,503,537 1,383,537 1,423,537 1,383,537
Note:-
There were no potentially dilutive shares.
7. Net asset value (for the issuer and group) per ordinary share based on the total number of issued shares
excluding treasury shares of the issuer at the end of the (a) current period reported on and (b) immediately
preceding financial year.
GROUP COMPANY
31 Dec 2014 31 Dec 2013 31 Dec 2014 31 Dec 2013
cents cents cents cents
Net asset value per ordinary share based on
issued share capital at the end of the
period reported on 15.71 10.83 17.37 12.99
8. A review of the performance of the group, to the extent necessary for a reasonable understanding of the
group’s business. The review must discuss any significant factors that affected the turnover, costs and
earnings of the group for the current financial period reported on, including (where applicable) seasonal or
cyclical factors. It must also discuss any material factors that affected the cash flow, working capital, assets
or liabilities of the group during the current financial period reported on.
SHENG SIONG GROUP LTD Full Year Financial Statement
9
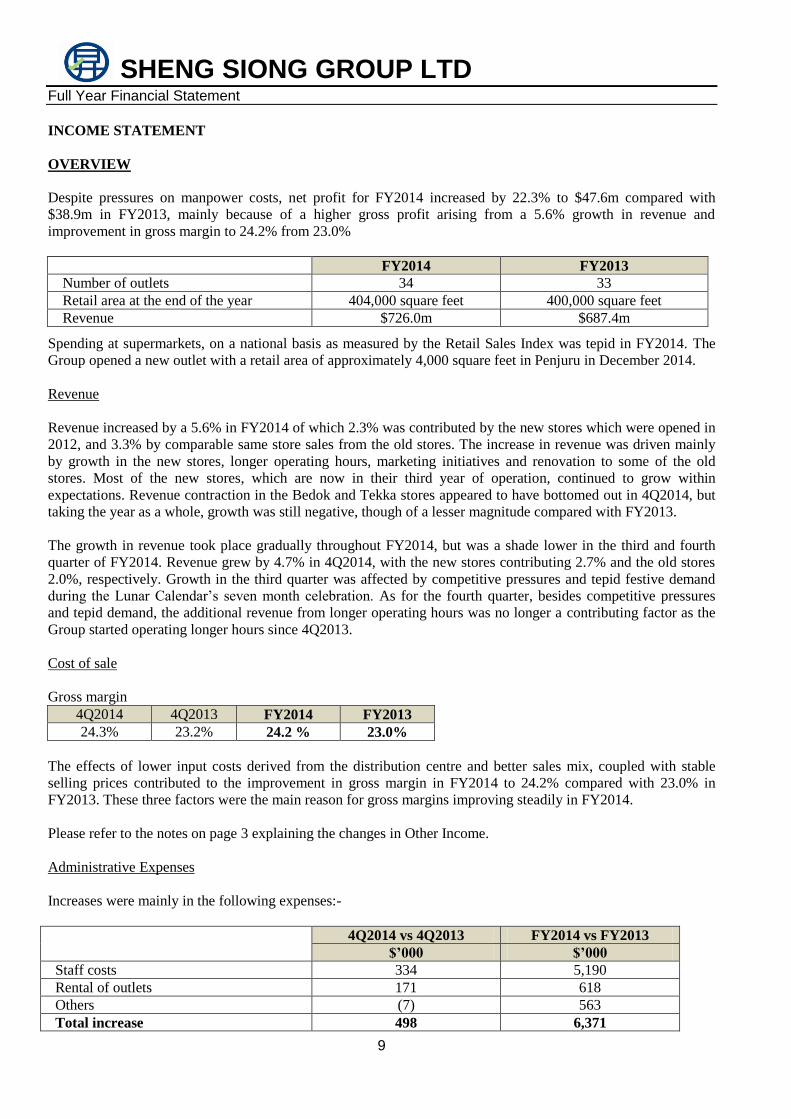
INCOME STATEMENT
OVERVIEW
Despite pressures on manpower costs, net profit for FY2014 increased by 22.3% to $47.6m compared with
$38.9m in FY2013, mainly because of a higher gross profit arising from a 5.6% growth in revenue and
improvement in gross margin to 24.2% from 23.0%
FY2014 FY2013
Number of outlets 34 33
Retail area at the end of the year 404,000 square feet 400,000 square feet
Revenue $726.0m $687.4m
Spending at supermarkets, on a national basis as measured by the Retail Sales Index was tepid in FY2014. The
Group opened a new outlet with a retail area of approximately 4,000 square feet in Penjuru in December 2014.
Revenue
Revenue increased by a 5.6% in FY2014 of which 2.3% was contributed by the new stores which were opened in
2012, and 3.3% by comparable same store sales from the old stores. The increase in revenue was driven mainly
by growth in the new stores, longer operating hours, marketing initiatives and renovation to some of the old
stores. Most of the new stores, which are now in their third year of operation, continued to grow within
expectations. Revenue contraction in the Bedok and Tekka stores appeared to have bottomed out in 4Q2014, but
taking the year as a whole, growth was still negative, though of a lesser magnitude compared with FY2013.
The growth in revenue took place gradually throughout FY2014, but was a shade lower in the third and fourth
quarter of FY2014. Revenue grew by 4.7% in 4Q2014, with the new stores contributing 2.7% and the old stores
2.0%, respectively. Growth in the third quarter was affected by competitive pressures and tepid festive demand
during the Lunar Calendar’s seven month celebration. As for the fourth quarter, besides competitive pressures
and tepid demand, the additional revenue from longer operating hours was no longer a contributing factor as the
Group started operating longer hours since 4Q2013.
Cost of sale
Gross margin
4Q2014 4Q2013 FY2014 FY2013
24.3% 23.2% 24.2 % 23.0%
The effects of lower input costs derived from the distribution centre and better sales mix, coupled with stable
selling prices contributed to the improvement in gross margin in FY2014 to 24.2% compared with 23.0% in
FY2013. These three factors were the main reason for gross margins improving steadily in FY2014.
Please refer to the notes on page 3 explaining the changes in Other Income.
Administrative Expenses
Increases were mainly in the following expenses:-
4Q2014 vs 4Q2013 FY2014 vs FY2013
$’000 $’000
Staff costs 334 5,190
Rental of outlets 171 618
Others (7) 563
Total increase 498 6,371

SHENG SIONG GROUP LTD Full Year Financial Statement
10
Administrative expenses increased by $6.4m in FY2014 compared with FY2013 mainly because of the increase
in staff costs. The increase in staff costs came from salary adjustments as well as a higher provision for bonus
arising from the better financial performance of the Group in FY2014. The increase in bonus was in line with the
increase in net profit. Rental expenses remained at about 2.7% of revenue, despite an overall increase of 3.2% in
rent compared with FY2013. Operating costs were tightly controlled and administrative expenses as a percentage
of revenue remained at 16.2%, similar to 16.2% in FY2013.
Other Expenses
Other expenses increased by $0.5m mainly because credit card charges increased by $0.3m, a consequence of
more customers using credit cards to pay.
Tax
The effective tax rate for FY2014 of 17.6% was close to the statutory tax rate of 17%. The effective tax rate for
4Q2014 was lower because of the write-back of tax over-provided in prior years.
CONSOLIDATED STATEMENT OF FINANCIAL POSITION
The net increase in property, plant and equipment of $69.9m consisted mainly of the purchase of Block 506
Tampines ($67.0m), progress payments for Yishun Junction 9 ($6.1m) and maintenance capex ($8.0m) offset by
depreciation charges for the year.
Inventories decreased by $2.4m as the Group started stocking up in December 2013 for 2014’s Chinese New
Year sales. Stocking up for 2015’s Chinese New Year sales will commence only in January 2015.
The collection of aged receivables relating to certain credit card transactions, coupled with GST paid for the
purchase of Block 506 Tampines were the main reasons for trade and other receivables decreasing by $1.5m
Trade and other payables increased by $7.6m because of an increase in other payables of $11.9m arising mainly
from a change in timing for the payment of bonuses which offset by a reduction of $4.3m in trade payables,
arising mainly from a lower level of purchases.
CASH FLOW
Sales are principally made on a cash basis and there were no significant changes to the payment cycle. However,
the acquisition of retail spaces had impacted cash flow in FY2014.
Cash flow generated from operating activities for 4Q2014 amounted to $21.0m, compared with $9.3m generated
in 4Q2013. The improvement came mainly from improvement in the operating profit as well as cash generated
from changes in working capital. The cash used in investing activities of $69.2m in 4Q2014 was mainly for the
payment for Block 506 Tampines in December 2014.
Similarly, cash flow from operating activities for FY2014 amounting to $71.7m was a higher than FY2013’s
generation of $45.1m mainly because of the higher level of operating profits and cash generated from working
capital changes. Total outflow in FY2014 for property, plant and equipment of $80.9m consisted of the purchase
of Block 506 Tampines, progress payments for Yishun Junction 9 which is still under construction and
maintenance capex. On 9 September 2014, the Company issued, by way of a private placement of 120m new
shares raising a net amount of $79.0m, which will be utilized to purchase retail space to expand the grocery
retailing business in Singapore.
As at the end of FY2014, the Group’s cash and cash equivalents was a healthy $130.5m, compared with $99.7m
at the end of FY2013.
SHENG SIONG GROUP LTD Full Year Financial Statement
11
9. Where a forecast, or a prospect statement, has been previously disclosed to shareholders, any variance
between it and the actual results.
Not applicable.
10. A commentary at the date of the announcement of the significant trends and competitive conditions of the
industry in which the group operates and any known factors or events that may affect the group in the next
reporting period and the next 12 months.
The Monetary Authority of Singapore mentioned in their policy statement dated 28 January 2015 that the mixed
outlook for the global economy will weigh on the external oriented sectors of Singapore’s economy. In contrast,
the domestic sectors should stay broadly resilient. They added that the outlook for inflation had shifted
significantly largely due to the decline in global oil prices, with imported inflationary pressures receding while
global oil prices are likely to remain subdued in FY2015.
Against this backdrop, the supermarket industry is expected to remain competitive. In December 2014, the Group
opened a new store in Penjuru and another in January 2015, following the completion of the purchase of Block
506 Tampines. Finding retail space to open outlets remains challenging and the plan to open new stores in areas
where the Group does not have a presence could be hampered if suitable retail space cannot be found.
All the eight new stores which were opened in different months in FY2012 would be entering into their third year
of operation, and growth is expected to normalize.
Besides competitive pressures, gross margin, which had remained stable throughout FY2014, could be affected if
input cost is increased because of food inflation, which could be caused by disruption to the supply chain or other
factors. The Government’s restriction on the supply of foreign labour would continue to put upward pressure on
manpower cost and increase operating expenses. However, the Group expects some savings in utility charges
arising from a lower oil price.
The Group will start to derive property income from the units in Block 506 Tampines which are rented out to
non-related parties. The net income arising from this activity is not expected to be significant in FY2015. The
Group will look into re-configuring the building to expand and/or re-position the store when most of these
tenancies expire in FY2016.
The Group has entered into a conditional Joint Venture Agreement with LuChen group Co. Ltd to set up a joint
venture to operate supermarkets in Kunming, People’s Republic of China. Applications for licenses and
registration of the joint venture with the relevant authorities in China are being made and it is envisaged that, in
view of the pending approvals and grant of the licenses, operation will not commence till the second half of
FY2015. The Group’s will hold a 60% stake, amounting to US$6m in the joint venture. The joint venture is not
expected to be profitable in FY2015, but the financial impact on the Group is not expected to be significant either.
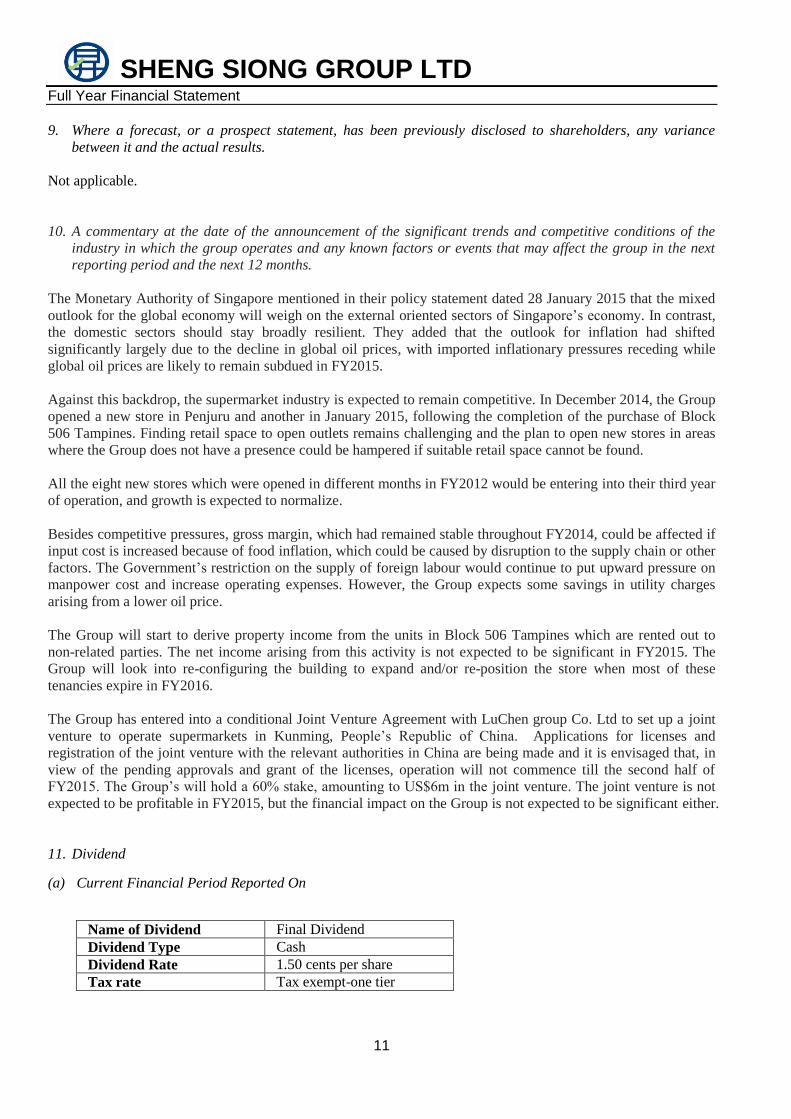
11. Dividend
(a) Current Financial Period Reported On
Name of Dividend Final Dividend
Dividend Type Cash
Dividend Rate 1.50 cents per share
Tax rate Tax exempt-one tier

SHENG SIONG GROUP LTD Full Year Financial Statement
12
The payment of this final dividend is subject to approval by the shareholders at the Annual General Meeting to be
convened on 23th April 2015.
(b) Corresponding Period of the immediately Preceding Financial Year
Name of Dividend Final Dividend
Dividend Type Cash
Dividend Rate 1.40 cents per share
Tax rate Tax exempt-one tier
(c) Whether the dividend is before tax, net of tax or tax exempt. If before tax or net of tax, state the tax rate and
the country where the dividend is derived. (If the dividend is not taxable in the hands of shareholders, this
must be stated).
This is a tax exempt (one tier) dividend.
(d) The date the dividend is payable.
The dividend will be paid on 22 May 2015, subject to approval by the shareholders at the Annual General
Meeting of the Company, to be convened on 23 April 2015.
(e) The date on which Registrable Transfers received by the company (up to 5.00 pm) will be registered before
entitlements to the dividend are determined.
The Directors propose, subject to shareholders’ approval at the Annual General Meeting to be convened, a
final dividend, tax exempt (one-tier), of 1.5 cents per share, to be paid on 22 May 2015.
Notice is hereby given that the Share Transfer Books and Register of Members of the Company will be
closed on 12 May 2015 for the preparation of dividend warrants. Duly completed transfers in respect of
ordinary shares in the capital of the Company (‘Shares”) received by the Company’s Registrar, Boardroom
Corporate & Advisory Services Pte Ltd at 50 Raffles Place, #32-00, Singapore 048623 up to 5.00 p.m. on
11 May 2015 will be registered to determine shareholders’ entitlement to the proposed final dividend.
Shareholders whose securities accounts with The Central Depository (Pte) Limited (CDP) are credited with
Shares at 5.00 pm on 11 May 2015 will be entitled to the proposed final dividend.
12. If no dividend has been declared (recommended), a statement to that effect.
Not applicable.
13. Breakdown of results in the first and second half year.
FY 2014 FY 2013 %
increase/(decrease) GROUP GROUP
S$’000 S$’000
Sales reported for the first half year 361,260 339,173 6.5
Operating profit after tax for the first half year 23,606 19,005 24.2
Sales reported for the second half year 364,727 348,217 4.7
Operating profit after tax for the second half year 23,996 19,902 20.6

SHENG SIONG GROUP LTD Full Year Financial Statement
13
14 Segment reporting
In FY2014, the Group operated in one segment only, which relates to the provision of supermarket supplies and
supermarket operations. The Group’s operations are located in Singapore only, and the Malaysian subsidiary
remained inactive in 2014.
15. If the Group has obtained a general mandate from shareholders for IPTs, the aggregate value of such
transactions as required under Rule 920(1)(a)(ii). If no IPT mandate has been obtained, a statement to that
effect.
The Group did not obtain a mandate under Rule 920(1). The interested party transactions during the year were:-
INTERESTED PERSON TRANSACTIONS
From 1 January 2014 to 31 December 2014
Name of Interested
Person(s)
Description of Interested Person
Transactions
Aggregate value of all
interested person
transactions during the
financial period under
review (excluding
transactions less than
S$100,000 and transactions
conducted under
shareholders’ mandate
pursuant to Rule 920)
($’000)
Aggregate value of
all interested person
transactions
conducted under
shareholders’
mandate pursuant to
Rule 920 (excluding
transactions less
than $100,000)
F M Food Court
Pte Ltd See Note (1)
/
Lim Hock Eng
Lim Hock Chee
Lim Hock Leng
Sale of goods by Sheng Siong
Group Ltd to F M Food Court Pte
LtdSee Note (1)
368 -
Purchase of goods by Sheng Siong
Group Ltd from F M Food Court
Pte LtdSee Note (1)
- -
Lease of operation space by F M
Food Court Pte LtdSee Note (1)
from
Sheng Siong Group Ltd
562 -
E Land Properties
Pte LtdSee Note (1)
/
Lim Hock Eng
Lim Hock Chee
Lim Hock Leng
Rent and utilities paid by Sheng
Siong Group Ltd to E Land
Properties Pte LtdSee Note (1)
for lease
and license of operations space
1,656
-
Lim Hock Chee
Temporary use of the services of a
staff 54 -
Note:
(1) These entities are associates of Messrs Lim Hock Eng, Lim Hock Chee and Lim Hock Leng, the executive
directors and controlling shareholders of Sheng Siong Group Ltd.

SHENG SIONG GROUP LTD Full Year Financial Statement
14
16. A breakdown of the total dividend (in dollar value) for the issuer’s latest full year and its previous full
year as follows:-
Type FY2014 ($’000) FY2013 ($’000)
Ordinary-Interim $20,753 $16,602
Ordinary-Final $22,553* $19,370
Total $43,306 $35,972
Total per share (cents) 3.0 2.6
* Estimated based on 1,503,537,000 shares at the end of the financial year.
17. An update on the use of net proceeds from the issue of new shares for the IPO.
USE OF PROCEEDS FROM IPO
Purpose
Estimated
amount
($m)
Estimated
percentage of
gross proceeds
raised from the
issue of New
Shares
Amount
utilised
($m)
Percentage of
gross proceeds
raised from the
issue of New
Shares
Repayment of the
Term Loan
30.0 39.3% 26.3 34.4%
Development and
expansion of
grocery retailing
business and
operations in
Singapore and
overseas
42.2(3)
55.2% 21.9 (1)
28.7%
Expenses incurred
in connection with
the issue of New
Shares
4.2 5.5% 4.0 5.2%
Total 76.4(2)
100.0% 52.2 68.3%
Notes:
(1) Relates to the opening of our new stores in Singapore and the purchase of retail space for our supermarket
operations.
(2) Includes net proceeds from the exercise of the Over-allotment Option of $13.5m.
(3) Includes an amount of $22.2m originally designated for working capital, now re-allocated. Please refer to
the Company’s announcement dated 28 October 2014.

SHENG SIONG GROUP LTD Full Year Financial Statement
15
USE OF PROCEEDS FROM PLACEMENT OF 120M NEW SHARES ON 9 SEP 2014
Purpose
Estimated
amount
(S$m)
Estimated
percentage of gross
proceeds raised
from the issue of
New Shares
Amount
utilised
(S$m)
Percentage of gross
proceeds raised
from the issue of
New Shares
To finance the future
expansion plans of the
Group in Singapore,
including the purchase
of retail space to
expand the Group’s
grocery retailing
business in Singapore
78.8 98% 66.95(1)
83.3%
To pay the fees and
expenses, including
professional fees and
expenses, incurred or
to be incurred by the
Group in connection
with the Placement
1.6 2% 1.38 1.7%
Total
80.4
100.0% 68.33 85.0%
Note:
(1) The aggregate amount paid for Block 506 Tampines, including stamp duty of $1.9m.
SHENG SIONG GROUP LTD Full Year Financial Statement
16
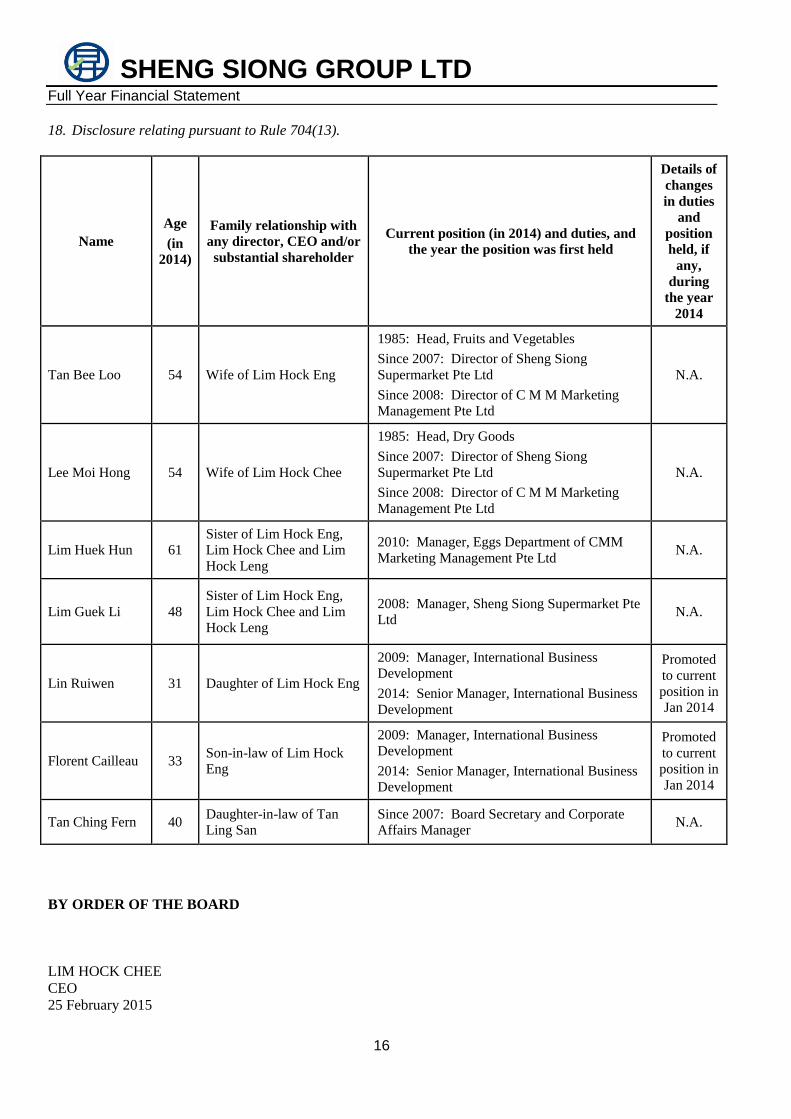
18. Disclosure relating pursuant to Rule 704(13).
Name
Age
(in
2014)
Family relationship with
any director, CEO and/or
substantial shareholder
Current position (in 2014) and duties, and
the year the position was first held
Details of
changes
in duties
and
position
held, if
any,
during
the year
2014
Tan Bee Loo 54 Wife of Lim Hock Eng
1985: Head, Fruits and Vegetables
Since 2007: Director of Sheng Siong
Supermarket Pte Ltd
Since 2008: Director of C M M Marketing
Management Pte Ltd
N.A.
Lee Moi Hong 54 Wife of Lim Hock Chee
1985: Head, Dry Goods
Since 2007: Director of Sheng Siong
Supermarket Pte Ltd
Since 2008: Director of C M M Marketing
Management Pte Ltd
N.A.
Lim Huek Hun 61
Sister of Lim Hock Eng,
Lim Hock Chee and Lim
Hock Leng
2010: Manager, Eggs Department of CMM
Marketing Management Pte Ltd N.A.
Lim Guek Li 48
Sister of Lim Hock Eng,
Lim Hock Chee and Lim
Hock Leng
2008: Manager, Sheng Siong Supermarket Pte
Ltd N.A.
Lin Ruiwen 31 Daughter of Lim Hock Eng
2009: Manager, International Business
Development
2014: Senior Manager, International Business
Development
Promoted
to current
position in
Jan 2014
Florent Cailleau 33 Son-in-law of Lim Hock
Eng
2009: Manager, International Business
Development
2014: Senior Manager, International Business
Development
Promoted
to current
position in
Jan 2014
Tan Ching Fern 40 Daughter-in-law of Tan
Ling San
Since 2007: Board Secretary and Corporate
Affairs Manager N.A.
BY ORDER OF THE BOARD
LIM HOCK CHEE
CEO
25 February 2015